miga strategic directions fy15-17 - home | · pdf fileexpand coverage to lenders such as banks...
TRANSCRIPT

MIGA STRATEGIC DIRECTIONS FY15-17

ABBREVIATIONS AND ACRONYMS
% Percent
$ US Dollars
AIP Access to Information Policy
CAFEF Conflict-Affected and Fragile Economies Facility or Facility
CCSA Cross-Cutting Solution Area
CSL Client Service Leader
CPF Country Partnership Framework
CPS Country Partnership Strategy
DEIS Development Effectiveness Indicator System
EC Economic Capital
FCS Fragile and Conflict-Affected States
FDI Foreign Direct Investment
FY Fiscal Year
GDP Gross Domestic Product
GP Global Practice
IBRD International Bank for Reconstruction and Development
IDA International Development Association
IEG Independent Evaluation Group
IFC International Finance Corporation
IT Information Technology
KPI Key Performance Indicator
LAC Latin America and the Caribbean
LTIP Long-term Investment Portfolio
MENA Middle East and North Africa
MIC Middle Income Country
MIGA Multilateral Investment Guarantee Agency, the “Agency”
NHSFO Non-Honoring of Sovereign Financial Obligation
NHFO-SOE Non-Honoring of Financial Obligations of State-Owned Enterprises
OC Operating Capital
ODA Official Development Assistance
OGM Oil, Gas and Mining
P&P Policy and Procedure
PPP Public Private Partnership
PRG Partial Risk Guarantees
PRI Political Risk Insurance
SIP Small Investment Program
USD US Dollars
WBG World Bank Group

TABLE OF CONTENTS
Introduction ............................................................................................................................ 1
Executive Summary................................................................................................................ 1
I. MIGA’s Value Proposition ................................................................................................... 3
II. MIGA’s FY12-14 Strategy .................................................................................................... 7
A. Delivery ............................................................................................................................. 7
B. Priority Areas .................................................................................................................... 7
C. Operational Improvements .......................................................................................... 10
D. Knowledge ...................................................................................................................... 12
E. Financial Results FY12-13 ............................................................................................ 13
III. MIGA’s FY15-17 Strategy .................................................................................................. 15
A. Operational Context to MIGA’s Development Priorities ....................................... 15
B. MIGA’s Market Positioning ......................................................................................... 17
C. MIGA’s Role in Supporting WBG Goals .................................................................. 19
D. Focus Areas .................................................................................................................... 22
E. Partnerships .................................................................................................................... 24
F. Business Volume Targets ............................................................................................. 25
G. Product Mix .................................................................................................................... 25
IV. Six Initiatives for Implementing the strategy ................................................................... 27
A. Business Development ................................................................................................. 27
B. Non-Honoring Product Management ........................................................................ 28
C. Reinsurance..................................................................................................................... 29
D. Investment Management .............................................................................................. 29
E. Pricing .............................................................................................................................. 30
F. Operational Effectiveness ............................................................................................ 30
V. MIGA’s Financial Sustainability ......................................................................................... 33
A. Capital Usage and Income Outlook FY15-17 ........................................................... 33
VI. Conclusion ............................................................................................................................. 37
VII. Next Steps ............................................................................................................................. 39

Figures
Figure 1. Using MIGA’s Capital for Maximum Development Impact ....................................... 5
Figure 2. ODA and Private Investment – All Developing Countries ($ billions) ................... 15
Figure 3. Net Private Capital Flows to Developing Economies ($ billions) ............................ 16
Figure 4. MIGA’s Market Position ................................................................................................. 18
Figure 5. MIGA’s Top Host Countries ($ millions) .................................................................... 18
Figure 6. MIGA’s Role in Supporting WBG Twin Goals .......................................................... 19
Figure 7. MIGA’s Strategic Choice by Product ............................................................................ 25
Figure 8. Summary of Business & Financial Drivers and Link to Strategic Initiatives ........... 31
Figure 9. Economic Capital to Operating Capital Ratio ............................................................. 35
Boxes
Box 1. MIGA’s Product Line Up ..................................................................................................... 3
Box 2. Political Risk Insurance Market .......................................................................................... 17
Box 3. Renewing Infrastructure and Basic Services in Côte d’Ivoire ........................................ 23
Tables
Table 1. Exposure in IDA Countries by Region ............................................................................ 8
Table 2. New Guarantee Business by Priority Area....................................................................... 8
Table 3. Regional Breakdown of New Guarantee Business ......................................................... 9
Table 4. Sector Breakdown of New Guarantee Business ........................................................... 10
Table 5. Financial Data and Key Ratios FY12-13 ($ millions) ................................................... 13
Table 6. IFC-MIGA Business Development Projects, Issued by FY ($ millions) .................. 21
Table 7. Investment Income by Asset Class ($millions) ............................................................. 29
Table 8. MIGA’s Draft Corporate Scorecard ............................................................................... 32
Table 9. Base Case Projected Financial Data and Key Ratios ($ millions) ............................... 33

Introduction
1. Purpose of the Paper. This paper presents MIGA’s FY15-17 strategy in the context of the World Bank Group’s (WBG’s) goals of ending extreme poverty and promoting shared prosperity. Section I discusses MIGA’s value added; Section II analyzes the results of MIGA’s FY12-14 Strategy; and Section III examines MIGA’s (i) operational context, (ii) market positioning, (iii) role in supporting the WBG twin goals, and (iv) FY15-17 Strategy. Section IV discusses initiatives to implement the new strategy; Section V examines MIGA’s financial sustainability; Section VI is the conclusion; and Section VII outlines next steps.
Executive Summary
2. MIGA’s Objective. MIGA aspires to contribute to the WBG’s twin goals of ending extreme poverty and promoting shared prosperity by facilitating private investments to developing countries to help these countries meet their development objectives. MIGA seeks to maximize development impact by collaborating with the WBG so as to extend its support to higher impact projects. MIGA will aim to contribute to the country priorities articulated in the Country Partnership Frameworks (CPFs). MIGA can also achieve higher impact by leveraging the synergies in knowledge and enabling services of the WBG. In order to accomplish its mission, MIGA needs to be financially stable and focus on additionality in the selection of its interventions.
3. MIGA’s Historical Evolution. MIGA’s original mandate was to extend political risk insurance (PRI) to investments with an equity participation. MIGA’s Operational Regulations and Convention changes since 2009 have paved the way for the Agency to expand coverage to lenders such as banks and some capital market investors. These changes have also allowed MIGA to introduce two new credit enhancement products: non-honoring of sovereign financial obligations (NHSFO) in 2010 and non-honoring of financial obligations of state-owned enterprises (NHFO-SOE) in 2013. Through these changes, MIGA has expanded its product line as well as its client base, a source of growth for the Agency.
4. MIGA’s Position in the PRI Market. The PRI market as a whole has grown at an average rate of 12% per year for the last 7 years. The bulk of activity in the private sector PRI market is in countries rated investment grade (BBB-) or better, while MIGA has been most active in the higher risk countries rated BB, B, CCC, and below CC. Despite its focus on riskier markets, MIGA’s portfolio of PRI business has maintained a low claims ratio. This is a reflection of MIGA’s underwriting standards, but also, and most importantly, MIGA's access to governments as a member of the WBG, which enhances its ability to mediate on investment disputes and help resolve issues that can occur during the course of the projects it covers. Beyond its own balance sheet, MIGA has mobilized substantial additional capacity for clients and governments by partnering with public and private reinsurers and reinsuring around 40% of its guarantees portfolio. On a gross exposure basis, MIGA currently mobilizes $9.33 of coverage for every $1.00 of available capital on its balance sheet. MIGA’s business has been growing at an average rate of 8% per year over the past 12 years, and that growth accelerated over the last few years, in part, as a result of the convention changes.
5. Non-Honoring of Financial Obligations. This coverage provides guarantees on sovereign financial obligations, as well as for sub-sovereigns and state-owned enterprises (SOEs), and MIGA has seen strong demand for these new products from global banks as

MIGA Strategic Directions FY15-17 2
well as host country governments. MIGA will continue to enhance its risk assessment and exposure management framework for non-honoring products, including for SOEs, while closely linking with the WBG in the choice of interventions. This will allow risk to be managed prudently.
6. MIGA’s Strategic Focus. In the FY15-17 period, MIGA aims to optimize the opportunities presented by its expanded product line (PRI and non-honoring products) and its broader client base (equity investors, lenders such as banks and capital market investors) by focusing on strengthening its business development, enhancing SOE credit analysis capability and implementing a series of initiatives that will strengthen its financial sustainability. MIGA plans to continue working on projects in infrastructure, power, transportation, finance, manufacturing, as well as agriculture. Priority areas of interventions will include IDA and fragile and conflict-affected states (FCS), transformational projects, energy efficiency and climate change, and transactions with strong development impact in MICs. Over the next few years, MIGA will continue to increase its activities in Sub Saharan Africa (e.g., in power generation) and Middle East and North Africa (e.g., job creating enterprises), while strengthening its business development efforts in South Asia (e.g., energy), East Asia (infrastructure), and Latin America and the Caribbean (e.g., urban mobility) and maintaining its already strong position in Europe and Central Asia (e.g., financial sector). While demand for PRI and non-honoring products can fluctuate from year to year, MIGA considers the target growth rate of around 10% per year over the FY15-17 period to be a realistic scenario, in line with medium term growth prospects for FDI.
I. MIGA’S VALUE PROPOSITION
7. MIGA plays a critical role in supporting private investment flows to developing countries. As the WBG’s provider of investment insurance, MIGA instills confidence among investors seeking to secure private investment flows against political and sovereign risks. The Agency does this by leveraging its strength as a member of the WBG with access to knowledge, experience, and key decision-makers that other providers cannot match. By supporting private investors in their goals of generating investment returns, and by mobilizing private lenders and the reinsurers, MIGA is uniquely positioned to bring together sound projects and financial markets. At the same time, MIGA’s collaboration with IFC, IBRD and IDA reinforces the WBG’s ability to design a full spectrum of solutions that can lead to transformational development anchored on channeling private sector investment where it is most needed. MIGA mobilizes private sector investment in challenging environments that are often beyond the risk tolerance of commercial sources of capital.
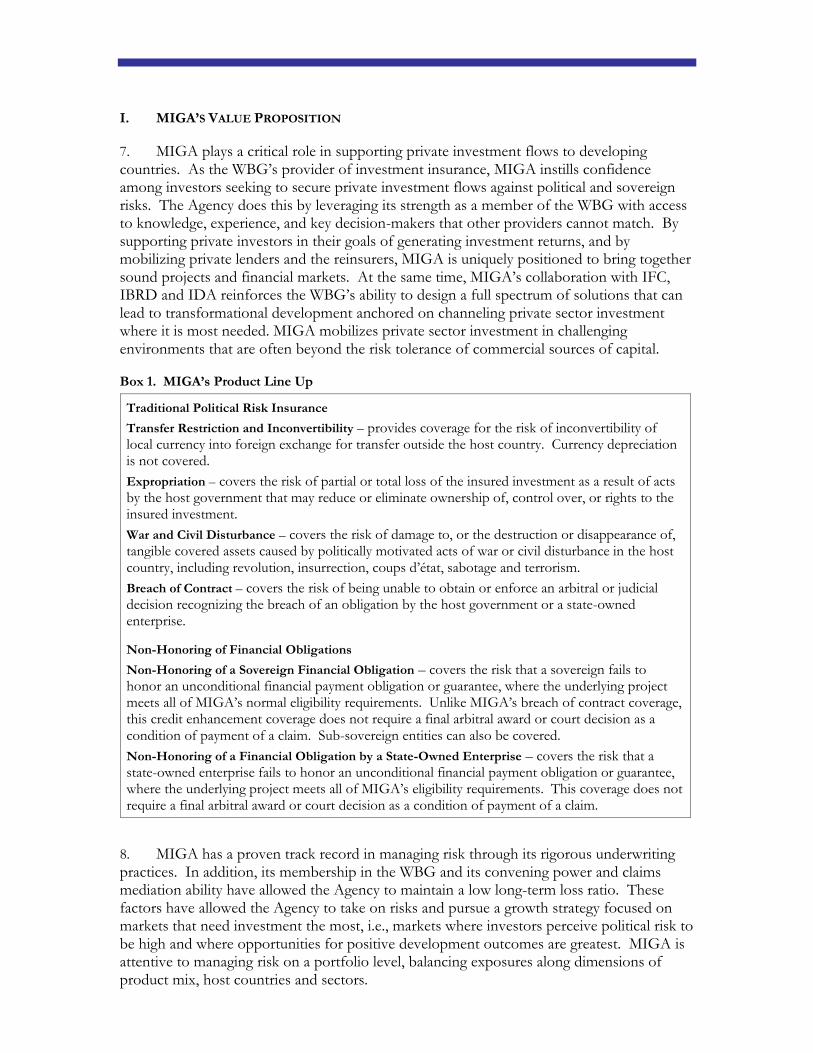
Box 1. MIGA’s Product Line Up
Traditional Political Risk Insurance
Transfer Restriction and Inconvertibility – provides coverage for the risk of inconvertibility of local currency into foreign exchange for transfer outside the host country. Currency depreciation is not covered.
Expropriation – covers the risk of partial or total loss of the insured investment as a result of acts by the host government that may reduce or eliminate ownership of, control over, or rights to the insured investment.
War and Civil Disturbance – covers the risk of damage to, or the destruction or disappearance of, tangible covered assets caused by politically motivated acts of war or civil disturbance in the host country, including revolution, insurrection, coups d’état, sabotage and terrorism.
Breach of Contract – covers the risk of being unable to obtain or enforce an arbitral or judicial decision recognizing the breach of an obligation by the host government or a state-owned enterprise.
Non-Honoring of Financial Obligations
Non-Honoring of a Sovereign Financial Obligation – covers the risk that a sovereign fails to honor an unconditional financial payment obligation or guarantee, where the underlying project meets all of MIGA’s normal eligibility requirements. Unlike MIGA’s breach of contract coverage, this credit enhancement coverage does not require a final arbitral award or court decision as a condition of payment of a claim. Sub-sovereign entities can also be covered.
Non-Honoring of a Financial Obligation by a State-Owned Enterprise – covers the risk that a state-owned enterprise fails to honor an unconditional financial payment obligation or guarantee, where the underlying project meets all of MIGA’s eligibility requirements. This coverage does not require a final arbitral award or court decision as a condition of payment of a claim.
8. MIGA has a proven track record in managing risk through its rigorous underwriting practices. In addition, its membership in the WBG and its convening power and claims mediation ability have allowed the Agency to maintain a low long-term loss ratio. These factors have allowed the Agency to take on risks and pursue a growth strategy focused on markets that need investment the most, i.e., markets where investors perceive political risk to be high and where opportunities for positive development outcomes are greatest. MIGA is attentive to managing risk on a portfolio level, balancing exposures along dimensions of product mix, host countries and sectors.

MIGA Strategic Directions FY15-17 4
9. Complementarity with other PRI providers. The PRI market has several participants, including public, private and multilateral and national investment and trade credit insurers.1 MIGA’s position as market leader in below investment grade countries complements activities of the overall market, where most coverage issued is for investment grade countries.2 By offering long-tenor coverage of up to 20 years and with its capacity to support large size transactions by partnering with both public and private reinsurers, MIGA is able to lead investors to higher risk countries and fulfill its development objectives.
10. Middle Income Countries. In addition to its key role in riskier markets, MIGA plays a relevant role in supporting investments into middle-income countries (MICs). Projects supporting the financial sector contribute significantly to these host countries. They help to deepen credit markets, extend terms associated with financing, and benefit both businesses and consumers. They also represent an efficient way for MIGA to provide support indirectly to mid-tier companies. The recent global financial crisis clearly demonstrated that MICs can be especially vulnerable to economic disruptions. MIGA’s credit enhancement products can be critical to MICs’ ability to access long term financing. Productive longer-term inward investment plays an important role in stabilizing their economies and building capacity that helps weather such circumstances. Similarly, at a time of regulatory constraints on banks, MIGA’s credit enhancement products can extend maturities on loans to serve the large infrastructure needs in MICs, including in transport, energy and urban mobility. As an insurer, it is also beneficial for MIGA to have a presence in a broader range of markets, to maintain a diversified portfolio and preserve its strength as a global institution.
11. Reinsurance. MIGA’s historical low loss experience and prudent risk management practices have meant that MIGA has been able to attract reinsurers for substantial capacity. Reinsurance has allowed MIGA to: (i) increase the amount of coverage beyond its own balance sheet; (ii) manage the risk profile of its own portfolio; and (iii) fulfill an important form of cooperation with other insurers as foreseen under the Agency’s Convention. The primary benefits of reinsurance accrue to MIGA’s clients, the investors and lenders who gain access to increased capacity to insure projects in developing countries, and the recipient countries that benefit from higher levels of investments.
12. Reinsurance arrangements increase MIGA’s capacity to support large, complex projects, an important added value for investors in industries such as power, telecom, infrastructure, extractive industries, and finance. Reinsurers examine the track record of their partners and are encouraged by MIGA’s participation in frontier markets projects where, without MIGA’s presence, they may be more hesitant to engage. It also enables other insurers to underwrite transactions with longer tenors than they would normally consider. Through reinsurance, MIGA mobilizes the private insurance market and leverages its own limited capital very effectively. As of December 31, 2013, MIGA’s $1.23 billion of capital supports gross exposure of $11.48 billion for an efficient gross leverage ratio of 9.3 (see Figure 1). Without reinsurance, MIGA would not have been able to support large projects of sizes of $200-700 million or more, within the limitation of its own capital base.
1 See Box 2, Section III.B 2 See Section III.B

MIGA Strategic Directions FY15-17 5
Figure 1. Using MIGA’s Capital for Maximum Development Impact
13. Environment and Social Standards. Private investors are increasingly realizing the value-added to be gained from pursuing best practices in environmental, social and integrity standards, both in terms of corporate governance, and because of the benefits for broader risk management. Thorough environmental, social and integrity due diligence is conducted by MIGA’s specialists to ensure that investments the Agency supports meet an established set of WBG performance standards. By requiring clients to meet these, MIGA helps elevate the standards of their clients’ operations, as well as maximize the broader contribution towards more sustainable development. Also, by supporting infrastructure projects that apply newer technologies, including renewable sources of energy, MIGA is supporting development that is environmentally sustainable.


II. MIGA’S FY12-14 STRATEGY
14. MIGA’s FY12-14 strategy was endorsed by the Board in April 20113. That strategy proposed four main areas of operational priority for guarantees support: (i) investments in IDA countries; (ii) investments in fragile and conflict-affected states (FCS); (iii) investment in complex projects mostly in infrastructure and the extractive industries; and (iv) South-South investments. These priority areas were shaped by the development needs of MIGA’s member countries, demands of the changing environment for foreign investment and PRI, and the need for the Agency to focus on its comparative advantage and to complement other institutions.
15. Over FY12-14, MIGA aimed to consolidate the opportunities for greater product flexibility allowed by the revised Convention and Operational Regulations. The strategy also proposed a number of operational improvements to scale up and improve delivery, including expansion of the regional hubs, improvement in monitoring of performance through use of indicators and project evaluation, increasing knowledge leadership, improving IT delivery, and continuing to build greater WBG cooperation. Over the FY12-14 period, MIGA targeted a minimum annual issuance of $2 billion with a base case scenario for new business of $2.2 billion in FY12, $2.4 billion in FY13 and $2.6 billion in FY14. A high case scenario contemplated new issuance of $3.0 billion by 2014.4
A. Delivery
16. During the first two years of the FY12-14 strategy period, MIGA issued new business of $2.7 billion in FY12 and $2.8 billion in FY13, a marked increase in issuance compared to $2.1 billion in FY11, and higher than the targets initially set. Much of this growth came from the NHSFO product line, which has generated significant interest from private lenders, governments and investors. In FY13, MIGA issued 47 new guarantee contracts in 24 countries, and in FY12 MIGA issued 66 new guarantee contracts in 33 countries. MIGA expects to have issued new business in the range of $3.0 - 3.2 billion for FY14, above the high case scenario contemplated in the strategy.
B. Priority Areas
17. Over the time period of the FY12-14 strategy, MIGA expanded its coverage across all of the four main areas of operational priority. In FY13, three-quarters of the projects supported by MIGA were in one or several of the priority areas.
18. IDA Countries. Promoting investments in IDA-eligible countries, a key operational objective and priority area in MIGA’s FY12-14 business strategy, is tracked as a key performance indicator (KPI). MIGA’s support of new projects in IDA countries increased significantly over the time period. As of end-FY13, MIGA’s exposure in IDA-eligible countries was 41% of total net exposure, 14% more than at end-FY11 (see Table 1). The share of Africa in total net IDA exposure in the portfolio was 60%, with the remainder shared between Asia (24%), ECA (10%), LAC (3%), and MENA (3%) by end-FY13.
3 “MIGA FY12-14 Strategy: Achieving Value-Driven Volume”, April 12, 2011 (MIGA/R2011-0027). 4 Ibid.

MIGA Strategic Directions FY15-17 8
Table 1. Exposure in IDA Countries by Region
Gross ($ millions) Net ($ millions) % of Total Net Exposure
Region FY11 FY12 FY13 FY11 FY12 FY13 FY11 FY12 FY13
Africa 1,086 1,534 2,738 870 1,218 1,589 17 19 25 Asia 409 595 1,046 222 374 629 4 6 10 ECA 195 331 316 161 290 276 3 5 4 LAC 107 35 79 63 33 76 1 1 1 MENA 225 203 177 73 78 70 1 1 1 Total 2,022 2,697 4,356 1,389 1,993 2,640 27 32 41
Note: Items may not add up due to rounding.
19. Fragile and Conflict-affected States. Over the FY12-14 strategy period, MIGA’s support of projects in FCS grew from $0.2 billion in FY11 to $1.2 billion by FY13, representing 41% of the $2.8 billion of guarantees issued that fiscal year (see Table 2). MIGA’s support to countries such as Cote d’Ivoire as they transition from a period of turmoil to one of stability has played a key role in their rebuilding efforts.
20. Since conflict-affected countries became a strategic priority, MIGA has also leveraged partnerships with external donors to fund specialized guarantee facilities for FCS. These guarantee trust funds have allowed MIGA to conduct business in areas where it could not do so previously, for example the West Bank and Gaza Trust Fund. In addition, trust funded guarantee facilities have proven effective in mobilizing resources towards FCS such as Bosnia and Herzegovina and Afghanistan.
21. In April 2013, MIGA launched its first multi-country FCS trust fund, the Conflict Affected and Fragile Economies Facility (CAFEF or Facility) supported by the Canadian International Development Agency, the Swedish International Development Cooperation Agency, and the UK’s Department for International Development. The Facility’s loss sharing structure provides an initial loss layer, which mitigates claims risk and allows MIGA to increase its exposure to FCS countries where risk is higher. The protection offered by the Facility results in lower capital utilization for projects in these riskier markets. The Facility is also critical to reinsurers who might otherwise be unwilling to take the risk. In November 2013, MIGA issued a guarantee where the Facility provided initial loss coverage for a project covering an investment of up to $100 million to support the construction, expansion and operation of a telecom tower network in the Democratic Republic of Congo.
Table 2. New Guarantee Business by Priority Area
Priority Area
FY13 Projects
FY13 New Business
($m)
% Share of FY13 Volume
FY12 Projects
FY12 New Business
($m)
% Share of FY12 Volume
IDA 21 2,047 74% 24 1,091 41% FCS 7 1,150 41% 9 341 13% Complex Projects 11 1,924 69% 12 1,582 60% South-South 7 357 12% 11 589 22%
22. Complex Projects. Over the FY12-14 strategy period, MIGA increased its involvement in complex projects – those that involve project finance, structured finance, other multi-sourced deals, as well as those dealing with challenging environmental and social considerations, including projects in the infrastructure sectors and in extractive industries. During FY13, about $1.3 billion (46%) of new coverage issued was for infrastructure
MIGA Strategic Directions FY15-17 9
projects, and $1.9 billion (69%) was for complex projects (see Table 2). Since FY12, MIGA has supported complex energy projects in countries such as Angola, Kenya, Côte d’Ivoire and Albania, large infrastructure projects in Panama, Vietnam and Turkey, as well as upstream oil and gas projects in Ghana and Egypt. All of these projects had multiple participants, and often required substantial environmental and social due diligence support, as well as partnership with the WBG and other developmental organizations.
23. South-South. South-South activities represent investments between developing countries, support the entry of new players, and can serve to support regional approaches to economic development. FDI outflows from developing economies have increased substantially in recent years, reaching both a new record level of $164 billion in 2012, and a new record share of 17% of global FDI flows. Brazil, China and India continue to make up the bulk of these outflows, with Africa in particular benefiting from this greater diversity of investment sources. Throughout the FY12-14 strategy period, MIGA supported these new sources of investments. In FY13, for example, MIGA covered $357 million of guarantees covering South-South investments, notably including a manufacturing plant in Libya supported from Mauritius, and a power project in Kenya supported by Chinese and South African investors.
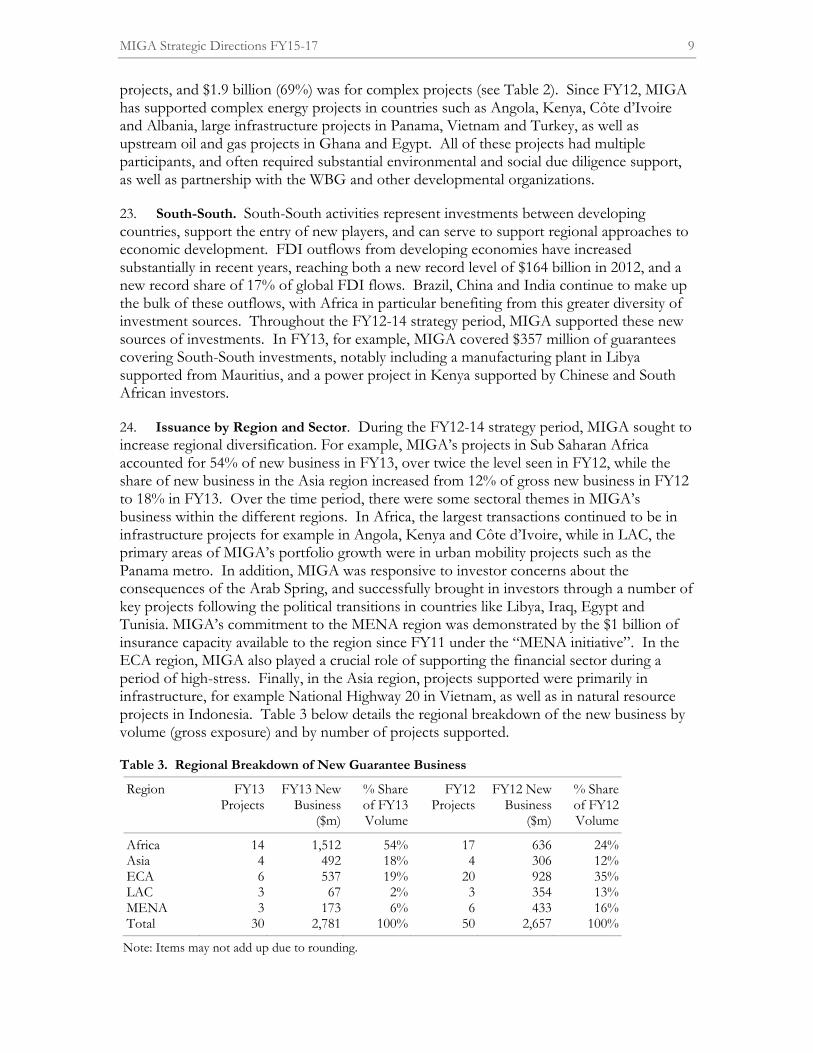
24. Issuance by Region and Sector. During the FY12-14 strategy period, MIGA sought to increase regional diversification. For example, MIGA’s projects in Sub Saharan Africa accounted for 54% of new business in FY13, over twice the level seen in FY12, while the share of new business in the Asia region increased from 12% of gross new business in FY12 to 18% in FY13. Over the time period, there were some sectoral themes in MIGA’s business within the different regions. In Africa, the largest transactions continued to be in infrastructure projects for example in Angola, Kenya and Côte d’Ivoire, while in LAC, the primary areas of MIGA’s portfolio growth were in urban mobility projects such as the Panama metro. In addition, MIGA was responsive to investor concerns about the consequences of the Arab Spring, and successfully brought in investors through a number of key projects following the political transitions in countries like Libya, Iraq, Egypt and Tunisia. MIGA’s commitment to the MENA region was demonstrated by the $1 billion of insurance capacity available to the region since FY11 under the “MENA initiative”. In the ECA region, MIGA also played a crucial role of supporting the financial sector during a period of high-stress. Finally, in the Asia region, projects supported were primarily in infrastructure, for example National Highway 20 in Vietnam, as well as in natural resource projects in Indonesia. Table 3 below details the regional breakdown of the new business by volume (gross exposure) and by number of projects supported.
Table 3. Regional Breakdown of New Guarantee Business
Region FY13 Projects
FY13 New Business
($m)
% Share of FY13 Volume
FY12 Projects
FY12 New Business
($m)
% Share of FY12 Volume
Africa 14 1,512 54% 17 636 24% Asia 4 492 18% 4 306 12% ECA 6 537 19% 20 928 35% LAC 3 67 2% 3 354 13% MENA 3 173 6% 6 433 16% Total 30 2,781 100% 50 2,657 100%
Note: Items may not add up due to rounding.

MIGA Strategic Directions FY15-17 10
25. The sector distribution over the FY12-14 period was significantly diversified as compared to earlier fiscal years when the finance sector heavily dominated new business issued. The infrastructure sector accounted for 46% of new business written in FY13, with large power projects in places such as Angola, Bangladesh, Côte d’Ivoire and Kenya. The oil, gas and mining sector showed a significant increase from 5% in FY12 to 23% in FY13 due to two projects in Côte d’Ivoire and Egypt. This was followed by the financial sector at 17% and agribusiness, manufacturing and services sector at 14%. Table 4 below shows the sector breakdown of the new business by volume and number of projects for FY12 and FY13.
Table 4. Sector Breakdown of New Guarantee Business
Sector FY13 Projects
FY13 New Business
($m)
% Share of FY13 Volume
FY12 Projects
FY12 New Business
($m)
% Share of FY12 Volume
Agribusiness, Manufacturing & Services
14 385 14% 25 506 19%
Financial 5 472 17% 11 482 18% Infrastructure 9 1,272 46% 13 1,549 58% Oil, Gas & Mining 2 652 23% 1 120 5% Total 30 2,781 100% 50 2,657 100%
Note: Items may not add up due to rounding.
C. Operational Improvements
26. Convention Change. The FY12-14 strategy considered the way in which changes to MIGA’s Operational Regulations and Convention since 2009 would create opportunities for greater product flexibility. These changes were part of an ongoing process of listening to both country needs and investor demands, making MIGA more responsive to the marketplace and improving its overall development effectiveness through widening the suite of available products. In FY13, gross volume of $1.77 billion (64% of total new business) was generated by products that were enabled as a result of changes made to MIGA’s Operational Regulations and Convention in FY09 and FY11, including (i) $829 million of NHSFO (30% of total); (ii) $179 million of stand-alone PRI coverage of debt (6%); (iii) $754 million for coverage of existing investments(27%); and (iv) $ 298 million of short-term business interruption (11%).
27. Regional Hubs. In FY11, MIGA established a hub in Singapore. The FY12-14 strategy proposed to scale up presence outside of Washington DC by placing staff in select locations across Asia for better client responsiveness and improvement in on-site business development capabilities. A second hub in Europe was staffed to enhance MIGA’s ability to service clients in the Africa, ECA and MENA regions. These hubs helped MIGA move closer to investor markets, and allowed underwriters to identify key investors more efficiently, as well as respond to underwriting questions on a timely basis. The creation and expansion of regional hubs for business generation has had a substantial impact upon business. MIGA's regional hubs generated business of about $1.18 billion in FY13 (42% of total new gross exposure), of which $608 million (22%) was sourced by the Asia hub and $568 million (20%) by the Europe hub.

MIGA Strategic Directions FY15-17 11
28. Reinsurance. In FY13, MIGA undertook a review of its reinsurance framework, which resulted in adjustments to MIGA’s Policies and Operational Regulations5 to allow use of reinsurance at shorter tenors as compared to those tenors in its contract of guarantee. This change allowed MIGA to expand the panel of facultative reinsurers it uses to optimize reinsurance capacity for larger, longer tenor projects. For coverage of amortizing debt, the exposure and need for reinsurance are higher in early years; reinsurers offering shorter tenors can thus be used in priority for these years. The expanded panel also helps diversify among counterparties.
29. Policy and Procedure Framework. In October 2013, MIGA’s Board of Directors approved a new policy and procedure framework (P&P Framework) applicable to the documents that govern MIGA’s activities. A key purpose of this governance initiative is to organize MIGA’s policies and procedures in a more efficient and user-friendly manner. Under this new framework, all documents governing MIGA’s activities (P&P Documents) must be classified as a policy, directive, procedure or guidance. This P&P Framework initiative is also being undertaken at the Bank and follows similar efforts by IFC.
30. Disclosure Policy. In FY14, MIGA received Board approval for its new Access to Information Policy (AIP) which updated its previous disclosure policy. The AIP defines MIGA’s obligations to disclose information about itself and its activities. The revisions to the policy aim to enhance transparency and promote good governance, with a view to increasing development effectiveness and strengthening public trust in the Agency. These revisions apply new standards that are harmonized with IFC’s disclosure policy.
31. Monitoring and Performance. In the FY12-14 strategy, MIGA stated its aim to further strengthen the monitoring and performance measures of its projects. To improve the Agency’s ability to collect, manage, and report development outcomes of projects supported in a consistent manner, MIGA implemented a Development Effectiveness Indicator System (DEIS). Information collected on development outcomes through the DEIS includes data on the project’s financial performance, economy-wide impact, environmental and social compliance, and contribution to broader private sector development. Outcomes measured include total investment supported, employment, taxes, and domestic purchases. Separate indicators are also used to track sector-specific development outcomes such as with power, transport, and telecom projects. MIGA plans to report the data in its FY14 annual report at an aggregated level. Initial results show that MIGA guarantees issued in FY13 of $2.8 billion supported $5.7 billion of total investments, adding approximately 20,000 jobs among other important developmental benefits.
32. Self-Evaluation. In FY10, MIGA introduced a self-evaluation pilot program whereby outcomes of MIGA-guaranteed projects are reviewed by MIGA staff. This program became mainstreamed in FY11 with MIGA taking responsibility for project evaluations, with the role of the Independent Evaluation Group (IEG) shifting from directly undertaking evaluations to validating the findings from MIGA-led evaluations. Findings of evaluations have been presented to sector teams and other MIGA staff through various learning and knowledge events. Evaluation results also inform internal deliberations on changes to Agency policies and procedures (e.g., integrity due diligence, environmental and social sustainability, operational processes, and underwriting guidelines). An IEG review6 of the
5 “Proposed Changes to MIGA’s Policies and Operational Regulations”, November 9, 2012 (MIGA AC2012-0044/1). 6 “Assessing the Monitoring and Evaluation Systems of IFC and MIGA: Biennial Report on Operations Evaluation” (IEG, 2013).

MIGA Strategic Directions FY15-17 12
pilot self-evaluation has shown that it provides useful lessons but is still somewhat burdensome and costly for the results achieved. MIGA is exploring with IEG ways to improve the cost-benefit of the self-evaluation program while maintaining quality.
33. Investments in Information Technology. As anticipated in the FY12-14 strategy, MIGA continued to align its Information Technology (IT) strategy more closely with that of the WBG as a whole, as well as taking into consideration the latest developments in IT. Recognizing the importance of rapid response and access, the strategy pursued has included development of both mobile applications and several other applications to form “interlocking building blocks”. MIGA recently launched a new online business reporting system with real-time guarantee business data and analytical capabilities that will help informed decision making in today’s high-paced environment and enable current snapshots of MIGA’s portfolio risk.
34. MIGA’s internet presence has already been integrated into the WBG, ensuring that its on-line presence reflects the One WBG. Linking to the WBG also provides MIGA’s clients more immediate access to information regarding the full suite of products and services available, as well as research and knowledge that only the WBG can provide. Finally, the internal WBG dashboard allows real-time information sharing of operational highlights among the WBG entities.
35. Internally, automation of business processes is being pursued where possible to reduce error, increase operational efficiency, and reduce costs. A client management system is being developed to integrate existing modules for invoicing, pipeline tracking, and various automated reporting functions with additional functionalities that are essential to strategic client relationship management. These include plans to obtain access to credit ratings databases, an important tool as MIGA grows its NHSFO business. With the expanded global presence of MIGA staff and increased volume of business, greater availability of these internet and intranet resources, as well as mobile applications, to provide real-time information at lower cost becomes increasingly important. Furthermore, increased use of technology allows for better coordination among functions as well as more consistent information and reporting. Additional modules and broader uses for mobile applications, including approvals, are gradually being developed and introduced, along with strengthened information security to protect MIGA’s data assets. MIGA’s IT investments are coordinated with the WBG’s IT Governance Committee to ensure integration with the WBG platforms.
D. Knowledge
36. Thought leadership in the PRI industry. MIGA has developed its role as leader in the political risk insurance industry over the past several years, notably with the publication of its report on political risk and FDI. The report, entitled “World Investment and Political Risk” offered an overview of the PRI and Investment markets, disseminating results from a survey commissioned by MIGA of foreign investors operating in developing countries. The survey assessed the investors’ perceptions of the political risk environment as well as their political risk mitigation strategies and tools, with special sections dealing with issues of particular concern to investors (such as the Arab Spring, or the sovereign debt crisis in the EU). MIGA is undertaking a review of its knowledge products to better align its approach with the ongoing work underway in the WBG.

MIGA Strategic Directions FY15-17 13
E. Financial Results FY12-13
37. MIGA’s annual new business issued between FY11 and FY13 grew significantly, with annual gross new issues increasing by almost $700 million in this short time period (see Table 5). As noted before, these volumes were higher than those anticipated under the business plan. The increase in volumes issued contributed to better net premium income than expected. Also, higher levels of average portfolio exposure resulting from lower than expected portfolio cancellations contributed to better than forecasted premium income for FY12 and FY13.7
38. The top line increases had positive impacts across other areas of MIGA’s performance. As a result of higher average guarantee portfolio exposure over FY12-13, net premium income increased to $66.2 million in FY13 compared to $50.8 million in FY11. This increase, along with contributions from investment income supported growth of MIGA’s retained earnings and capital base. The increase in net premium income resulted in lowering the KPI of administrative expense to net premium income, from 81% in FY11 to 71% in FY13 (See Table 5).
Table 5. Financial Data and Key Ratios FY12-13 ($ millions)
FY11 Actual
FY12 Actual
FY13 Actual
Portfolio & Premium Income Gross New Issues 2,099 2,657 2,781 Ending Gross Exposure 9,122 10,346 10,759 Ending Net Exposure 5,239 6,262 6,410 Gross Premium 75.2 89.2 97.2
Net Premium Income 50.8 61.7 66.2
Administrative Expense 41.1 42.4 47.1
Operating Income 9.8 19.3 19.1
Guarantee Portfolio EC 374 459 519 Total Economic Capital (EC) 414 508 572 Operating Capital (OC) 1,099 1,125 1,178 Investment Income 13.9 36.9 33.6
Key Ratios Guarantee Portfolio EC/OC 34% 41% 44% Total EC/OC 38% 45% 49% Admin Expense/Net Premium Income 81% 69% 71%
7 FY12-13 annual average cancellations forecasted at 8% of exposure; actual annual average cancellations were 7% of exposure over the same period.


III. MIGA’S FY15-17 STRATEGY
A. Operational Context to MIGA’s Development Priorities
39. External Context. The private sector has evolved as the main driver in generating employment and improving living standards in many countries. Whereas official development assistance (ODA) used to be a more critical source of funding among developing countries, in recent years private investment has significantly outpaced ODA (see Figure 2). Since MIGA’s role is to facilitate this continued expansion of private investment flows into emerging markets, the evolution of these flows provides the underpinning for MIGA’s role in the market for political risk insurance.
Figure 2. ODA and Private Investment – All Developing Countries ($ billions)8
40. In January 2014, the World Bank forecast global real GDP growth of 3.2% for 2014, 3.4% for 2015, and 3.5% for 2016. For developing countries, the GDP growth was forecast at 5.3%, 5.5% and 5.7%, for 2014, 2015 and 2016, respectively, with the highest growth expected in the East Asia and Pacific region9. The forecasts for developing countries reflect a firming situation from the estimate of 4.8% growth in 2013.
41. The increases in GDP growth notwithstanding, investors still express caution, which moderates the outlook for foreign investment into emerging markets. MIGA’s World Investment and Political Risk report for 201310 finds that investors classify macroeconomic instability as the key constraint for investing in developing economies, and political risk as the second most significant. Global foreign investment flows were estimated at $1.5 trillion in 2013, up only slightly from the level in 2012, which itself had seen a decline by 18% from 2011 (much of which was due to lower flows into high-income economies such as Europe).
8 “Global Economic Prospects”, World Bank, January 2014; ODA data from OECD, http://stats.oecd.org/quids. 9 “Global Economic Prospects”, World Bank, January 2014. 10 “2013 World Investment and Political Risk: World Investment Trend and Corporate Perspectives, The Political Risk Insurance Industry, Breach of Contract”, MIGA, 2014.
51 56 82 79 75 90 85 84 93
197
286
440
557
831 831
447
655
905
0
100
200
300
400
500
600
700
800
900
1,000
2003 2004 2005 2006 2007 2008 2009 2010 2011ODA FDI & Long Term Debt Flows

MIGA Strategic Directions FY15-17 16
42. Lower as well as middle income developing countries are sensitive to the level of interest rates, which will depend to a large extent on policy decisions in developed countries. The tapering of quantitative easing in developed countries may eventually result in increasing market interest rates, and should this increase be substantial, financially vulnerable developing countries could be negatively affected and private capital inflows to these countries could weaken. On the other hand, with the resumption of growth in developed countries and if exports from poorer countries to developed countries pick up, some projects and equity investments in the developing countries may likewise resume, resulting in positive outcomes under these conditions.
43. Net private capital flows to developing economies stood near $1 trillion in 2013. The level is expected to remain flat at this level in 2014 and increase slightly in 2015 (assuming that the winding down of monetary easing is orderly and not too rapid). Of the total private capital flows to developing economies, FDI is the most important; this stood at around $617 billion in 201311 (a slight increase of 2% from the level in 2012, see Figure 3). The growth has been dominated by Brazil, China, and India, accounting for around 50% of all FDI flows received by developing economies over the last ten years. However, another group of developing economies is emerging. These countries include Ghana, Indonesia, Kazakhstan, and Nigeria. According to the MIGA-EIU political risk survey for 2013, 47% of investor respondents stated that they plan to increase FDI over the next one year, and 70% stated that they plan to increase FDI over the next three years. A salient trend in the composition of foreign investment flows is that firms based in developing economies are expanding overseas in search of investment opportunities. While global FDI flows declined in 2012, those originating in developing economies increased to a new record level of $164 billion, corresponding to a record share of 17% of global FDI outflows.
Figure 3. Net Private Capital Flows to Developing Economies ($ billions)12
11 Ibid. 12 Ibid.
(200)
-
200
400
600
800
1,000
1,200
1,400
00 01 02 03 04 05 06 07 08 09 10 11 12 13 14 15
Total Net Capital Flows Net FDI Inflows
Net Portfolio Equity Inflows Net Debt Flows
MIGA Strategic Directions FY15-17 17
B. MIGA’s Market Positioning
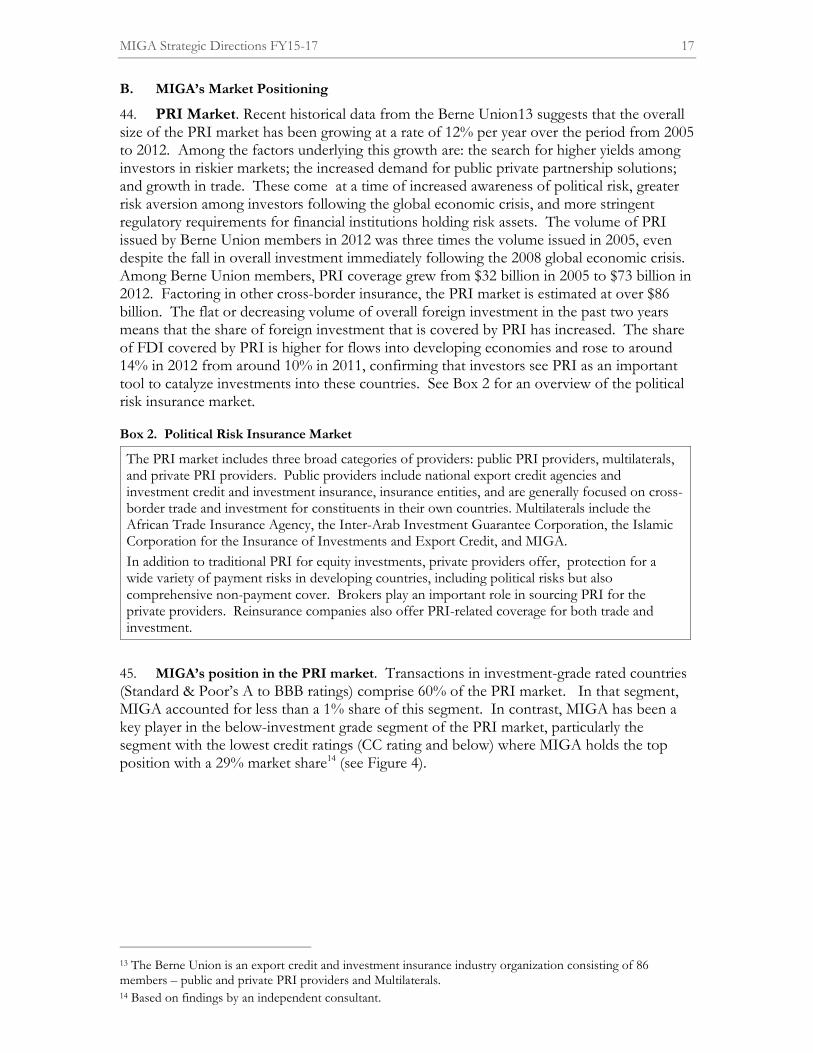
44. PRI Market. Recent historical data from the Berne Union13 suggests that the overall size of the PRI market has been growing at a rate of 12% per year over the period from 2005 to 2012. Among the factors underlying this growth are: the search for higher yields among investors in riskier markets; the increased demand for public private partnership solutions; and growth in trade. These come at a time of increased awareness of political risk, greater risk aversion among investors following the global economic crisis, and more stringent regulatory requirements for financial institutions holding risk assets. The volume of PRI issued by Berne Union members in 2012 was three times the volume issued in 2005, even despite the fall in overall investment immediately following the 2008 global economic crisis. Among Berne Union members, PRI coverage grew from $32 billion in 2005 to $73 billion in 2012. Factoring in other cross-border insurance, the PRI market is estimated at over $86 billion. The flat or decreasing volume of overall foreign investment in the past two years means that the share of foreign investment that is covered by PRI has increased. The share of FDI covered by PRI is higher for flows into developing economies and rose to around 14% in 2012 from around 10% in 2011, confirming that investors see PRI as an important tool to catalyze investments into these countries. See Box 2 for an overview of the political risk insurance market.
Box 2. Political Risk Insurance Market
The PRI market includes three broad categories of providers: public PRI providers, multilaterals, and private PRI providers. Public providers include national export credit agencies and investment credit and investment insurance, insurance entities, and are generally focused on cross-border trade and investment for constituents in their own countries. Multilaterals include the African Trade Insurance Agency, the Inter-Arab Investment Guarantee Corporation, the Islamic Corporation for the Insurance of Investments and Export Credit, and MIGA.
In addition to traditional PRI for equity investments, private providers offer, protection for a wide variety of payment risks in developing countries, including political risks but also comprehensive non-payment cover. Brokers play an important role in sourcing PRI for the private providers. Reinsurance companies also offer PRI-related coverage for both trade and investment.
45. MIGA’s position in the PRI market. Transactions in investment-grade rated countries (Standard & Poor’s A to BBB ratings) comprise 60% of the PRI market. In that segment, MIGA accounted for less than a 1% share of this segment. In contrast, MIGA has been a key player in the below-investment grade segment of the PRI market, particularly the segment with the lowest credit ratings (CC rating and below) where MIGA holds the top position with a 29% market share14 (see Figure 4).
13 The Berne Union is an export credit and investment insurance industry organization consisting of 86 members – public and private PRI providers and Multilaterals. 14 Based on findings by an independent consultant.

MIGA Strategic Directions FY15-17 18
Figure 4. MIGA’s Market Position
46. MIGA’s top guarantee destinations are therefore markedly different from those of other PRI providers. Comparing the Berne Union membership’s top ten investment destination countries in 2012 with MIGA’s top ten countries in terms of share of gross exposure, Indonesia was the only country in common. When the overall PRI market is reduced to those segments that MIGA can serve, referred to as its ‘addressable market’, the Agency’s dominance in the sub-investment grade projects grows more evident, as seen by the 29% market share in countries rated CC and below. Since most of the overall PRI market growth has been among investment grade rated countries, MIGA has effectively been building the B and below market.
47. In FY11-13, the top 15 host countries accounted for 75% of MIGA’s $7.6 billion of gross new issuance, as detailed below (see Figure 5).15
Figure 5. MIGA’s Top Host Countries ($ millions)
15The composition of countries evolves as market demand for investment insurance shifts.
MIGA Strategic Directions FY15-17 19
C. MIGA’s Role in Supporting WBG Goals
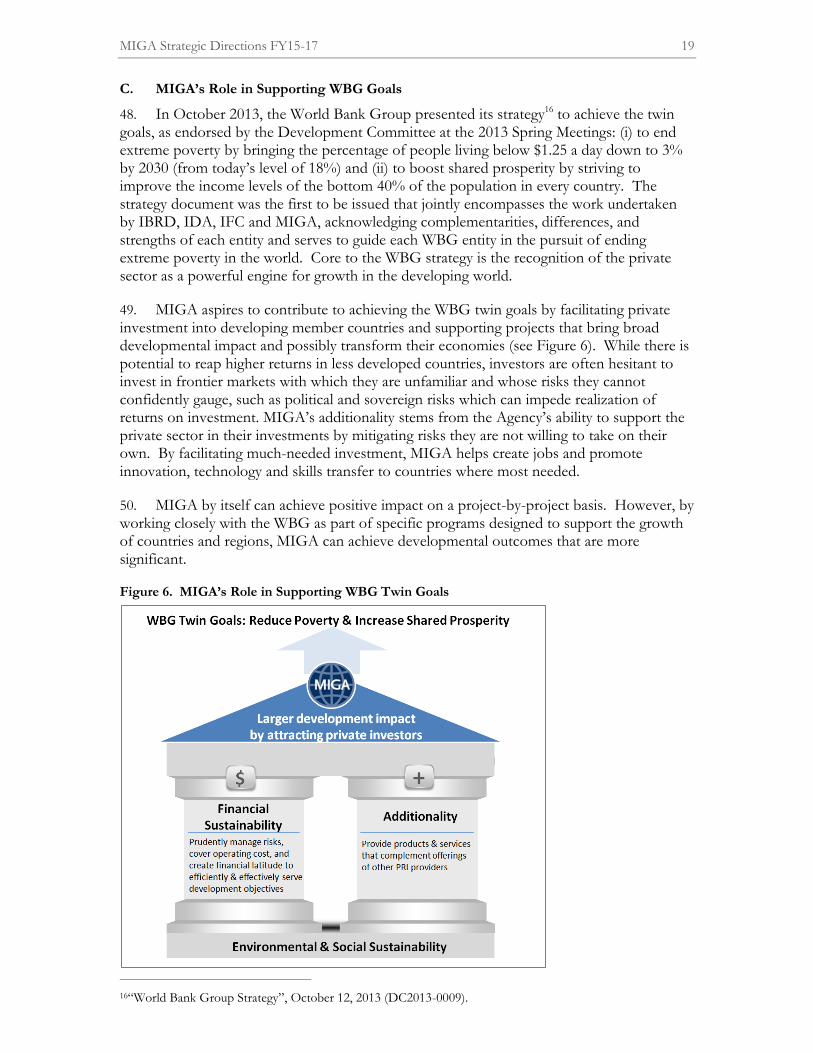
48. In October 2013, the World Bank Group presented its strategy16 to achieve the twin goals, as endorsed by the Development Committee at the 2013 Spring Meetings: (i) to end extreme poverty by bringing the percentage of people living below $1.25 a day down to 3% by 2030 (from today’s level of 18%) and (ii) to boost shared prosperity by striving to improve the income levels of the bottom 40% of the population in every country. The strategy document was the first to be issued that jointly encompasses the work undertaken by IBRD, IDA, IFC and MIGA, acknowledging complementarities, differences, and strengths of each entity and serves to guide each WBG entity in the pursuit of ending extreme poverty in the world. Core to the WBG strategy is the recognition of the private sector as a powerful engine for growth in the developing world.
49. MIGA aspires to contribute to achieving the WBG twin goals by facilitating private investment into developing member countries and supporting projects that bring broad developmental impact and possibly transform their economies (see Figure 6). While there is potential to reap higher returns in less developed countries, investors are often hesitant to invest in frontier markets with which they are unfamiliar and whose risks they cannot confidently gauge, such as political and sovereign risks which can impede realization of returns on investment. MIGA’s additionality stems from the Agency’s ability to support the private sector in their investments by mitigating risks they are not willing to take on their own. By facilitating much-needed investment, MIGA helps create jobs and promote innovation, technology and skills transfer to countries where most needed.
50. MIGA by itself can achieve positive impact on a project-by-project basis. However, by working closely with the WBG as part of specific programs designed to support the growth of countries and regions, MIGA can achieve developmental outcomes that are more significant.
Figure 6. MIGA’s Role in Supporting WBG Twin Goals
16“World Bank Group Strategy”, October 12, 2013 (DC2013-0009).

MIGA Strategic Directions FY15-17 20
51. Working with WBG. Over the past few years, MIGA has strengthened collaboration with IFC, IBRD and IDA and has progressively advanced its approach to a more strategic engagement. In turn, this has assisted the WBG in becoming more effective at designing optimal client solutions that bring to bear each organization’s strength.
52. A number of examples highlight how MIGA has worked more closely in collaboration across the WBG. The WBG program in Côte d’Ivoire17, as detailed in the FY10 Country Partnership Strategy (CPS), provides a clear illustration of how collaboration across the WBG entities can address the multiple needs of a country emerging from protracted conflict (see Box 3). MIGA’s activities on energy and infrastructure projects in the country are directly complemented by IDA supported sector reforms and Partial Risk Guarantees (PRG), and IFC financing. The transformational impact of the projects was made possible by an effective cooperation across the World Bank Group. This model of intra-Group cooperation has become more common in recent years, with, for example, MIGA guarantees in the power sector in Kenya supporting the Thika Power Generating Company, where MIGA was complemented by an IDA PRG and IFC involvement. Ongoing work, most notably in countries such as Nigeria, Vietnam, Brazil and Colombia offer further examples where the combination of MIGA with other WBG interventions has the potential to lead to higher overall impact for client countries.
53. MIGA’s participation in the preparation of Joint WBG Business Plans for Côte d’Ivoire, Myanmar, and Vietnam has already led to the identification of opportunities that have or will be pursued in close coordination with other parts of the Group. In Vietnam, for example, MIGA collaborated extensively with the World Bank Country Office on the National Highway 20 Project. The World Bank’s local presence, detailed sector knowledge and access to key government decision-makers were vital in MIGA's project preparation. The project will leverage existing and planned capacity building efforts of IBRD and IDA in the roads sector, including through enhanced supervision during the critical construction phase.
54. Looking ahead, MIGA will seek to optimize its country engagement approach in the CPFs by proactive outreach to identify critical high impact opportunities, as well as to communicate to client governments MIGA’s potential role in supporting their development priorities. Given its relatively small size, MIGA will concentrate on a number of countries where the potential for its contribution is highest. As such, MIGA’s senior management will consult relevant IBRD country directors and IFC country managers to identify in each case the best way for MIGA to participate in the CPF process. MIGA’s already deepening experience with the country teams, and its engagement in past Country Assistance Strategy formulations has offered insights as to where it will work more effectively in the future. The greater cooperation on specific transformational projects, from planning to execution, has also proved useful and will inform the new and deeper cross-Bank engagement in this process.
55. The IFC-MIGA Business Development Partnership will continue to be an important component of MIGA’s effort to link to the rest of the WBG. This Partnership has matured into a strong business model that has helped stimulate joint business development and knowledge-sharing with IFC while expanding MIGA’s reach. In FY13, 23% of MIGA’s new guarantee issuance was sourced through the IFC, amounting to $651 million that year. Since
17“IDA, IFC, MIGA, Country Partnership Strategy for the Republic of Côte d’Ivoire”, April 1, 2010 (Report Number 53666-CI).

MIGA Strategic Directions FY15-17 21
inception of the IFC-MIGA Partnership in FY09, about $1.26 billion18 of MIGA’s guarantee issuance has been sourced through this collaborative arrangement (see Table 6 for a list of IFC-MIGA projects). The program aims to further scale up the success of its partnership by: (i) undertaking projects with higher development impact in priority areas; (ii) innovating and diversifying product development including programmatic and regional approaches; and (iii) sharing knowledge and best practices.
Table 6. IFC-MIGA Business Development Projects, Issued by FY ($ millions)
Fiscal Year
Country Project Name Amount of Guarantee
FY13 Côte d’Ivoire Azito Energies S.A 116
Côte d’Ivoire Compagnie Hôtelière de la Lagune 7
Serbia Eurobank Ergasias - Cent S.A 248
Georgia GeoCapital 2
Turkey Izmir BuyuksehirBelediyesi 65
Zambia ChobeAgrivision Company Ltd 46
Vietnam Ma San Industrial One 168
FY12 Rwanda Bakhresa Grain Milling Limited 15
Multiple: Bolivia, El Salvador,Georgia, Serbia, Ukraine
ProCredit Group Central Bank 132
Zambia ChobeAgrivision Company Ltd 10
Russian Federation Volga Farming 50
Kenya Thika Power Ltd 62
Pakistan Star Hydro Power Ltd 149
FY11 Zambia ChobeAgrivision Company Ltd 5
Multiple: Albania, Armenia, Bosnia and Herzegovina, Colombia, Democratic Republic of Congo, Former Yugoslav Republic of Macedonia, Georgia, Honduras, Kosovo, Moldova, Mozambique, Nicaragua, Serbia Ukraine
ProCredit Group Central Bank 156
56. Global Practices. MIGA expects to benefit from the increased knowledge sharing, agility of staff deployment, and faster identification of possible joint projects resulting from the WBG’s establishment of Global Practices (GPs) and five Cross-Cutting Solutions Areas (CCSAs). The new structure should facilitate the development of innovative, programmatic WBG solutions for clients. MIGA is likely to be most involved with GPs which overlap its key project sector focus areas, such as energy, transport and ICT, water, and financial markets. In addition, MIGA will also contribute its perspective in CCSAs, such as public-private partnerships, jobs, FCS and climate change. As the CCSAs and GPs become operational, MIGA will work with the head of these practice groups in defining optimal engagement points while taking into account MIGA’s size and business model, as well as potential gains from its involvement.
18IFC's reported results vary slightly from MIGA's due to the intra-period timing difference of when guarantees are recognized.
MIGA Strategic Directions FY15-17 22
D. Focus Areas
57. As the WBG repositions its role in meeting today’s development challenges, MIGA has, in turn, refined its strategy to hone in on growth opportunities and exercise selectivity.
58. IDA Countries. The development impact of FDI into IDA countries is substantial. In resource-constrained environments, foreign investment brings support for private sector development, generates value added, creates jobs, introduces new technologies and knowledge, increases tax revenues, and provides linkages for domestic firms – all benefits that help close the gap between the poorest countries and the rest of the world. MIGA’s additionality in IDA countries is clear, as these countries are frequently considered to be the higher risk by the international investment community and therefore the need for non-commercial risk mitigation is greater than elsewhere. WBG presence in these countries mean that the Agency is especially well-positioned to understand the local investment environment and government priorities, carry out informed underwriting, and issue long-term coverage that other providers may be hesitant to offer. MIGA will have a key role to play in the development of infrastructure in these countries, including energy, ports, roads, airports, agribusinesses and other value adding and job creating enterprises.
59. Conflict-affected Situations. MIGA has a particularly relevant role to play in supporting investments into post-conflict and conflict-affected environments. To secure stability and growth, investor confidence must be restored to reverse the flight of private capital and encourage new investment, and MIGA can play an essential role in making this happen. In addition, if MIGA can help bring investors into projects that are high profile and have high national importance, this can have a powerful demonstration effect. As noted previously, MIGA’s support in this respect has recently been enhanced by the creation of a dedicated, donor-supported Conflict-Affected and Fragile Economies Facility (CAFEF), which will continue to facilitate MIGA’s expansion in its portfolio in these economies. MIGA will continue to pay special attention to countries emerging from instability and political transitions, for example in the MENA region, where MIGA will focus in particular on job creation.
60. Half of low-income countries classified as IDA-only are currently also considered fragile and conflict-affected. Thus, MIGA’s strategy will look to pursuing its growth trajectory in risky countries, specifically fragile and conflict-affected, countries in transition, and IDA countries, to increase private investment flows to these destinations.19 Feedback from client surveys, review of market data, and analysis of trends confirm MIGA’s value proposition in this market.
61. Transformational Projects. MIGA is well-placed, as part of the WBG, to support large scale and significant investments, with the potential for bringing about transformational change. By mitigating long term risk of debt or equity in those projects, MIGA’s involvement can provide a complement to IFC and Bank support. Such projects are usually highly capital intensive, often involve multiple participants and invariably have a high degree of direct government engagement, and while difficult to launch and challenging to execute, bring with them significant development impact when undertaken properly. Box 3 illustrates the potential role which MIGA can play alongside IFC and IBRD in such transactions. These projects not only create direct employment, but also have benefits across the economy by enhancing competitiveness.
19 30 of 64 IDA-eligible countries are on the "Harmonized List of Fragile Situations FY14", www.worldbank.org/fragilityandconflict, and www.worldbank.org/ida/borrowing-countries.html.

MIGA Strategic Directions FY15-17 23
Box 3. Renewing Infrastructure and Basic Services in Côte d’Ivoire
Henri Konan Bédié Bridge. On June 28, 2012, MIGA issued $145 million in guarantees covering equity investments and subordinated loans from Bouygues Travaux Publics of France and Pan African Infrastructure Development Fund of South Africa, subordinated and senior loans from Africa Finance Corporation of Nigeria, and senior loans from BMCE Bank International Plc of the United Kingdom and FMO of the Netherlands. MIGA’s coverage is for a period of 15 years against the risks of transfer restriction, expropriation, war and civil disturbance, and breach of contract.
One of the first toll-bridges in West Africa, this complex, infrastructure project is the first public-private partnership in war-ravaged Côte d’Ivoire, an IDA-eligible country. The bridge is expected to help address significant congestion and pollution in Abidjan. Its construction should result in a reduction of carbon dioxide emissions due to lower fuel consumption.
Over 800 direct jobs were created during the construction phase. With its completion, over a thousand jobs are expected to be created indirectly from this project. Furthermore, as it reduces travel times and operating costs to its users, increasing overall mobility should yield wider gains transforming the overall economy of Côte d’Ivoire that has been severely affected by prolonged civil strife.
Azito Thermal Power Plant. In Côte d’Ivoire, demand for electricity is growing at an estimated 8% annually as businesses seek to rebuild and urbanization takes hold. MIGA is helping to mobilize private finance for Côte d’Ivoire’s vast reconstruction needs with its support for the expansion of the Alito Thermal Power Plant, which will generate 50% more power.
The project involves converting the existing simple-cycle Alito Plant to combined-cycle, increasing total capacity from 290 to approximately 430 megawatts while avoiding 225,000 tons of CO2 emissions per year. Upon completion, the facility will become one of the largest independent power generators in Sub-Saharan Africa.
IFC also supported Azito’s expansion by arranging a $350 million debt package, providing $125 million for its own account and mobilizing the balance from five European Development Finance Institutions and the West African Development Bank. MIGA is providing breach of contract cover to the equity investor and lead Sponsor, Globeleq. This groundbreaking transaction in a post-conflict country was recognized as “African Power Deal of the Year 2012” by leading industry magazine Project Finance International.
Block CI-27 Expansion Program. MIGA’s support for the energy sector in Côte d’Ivoire is further highlighted by its support for SCDM Energie SAS, France’s investment in the construction and operation of oil and gas production on Block CI-27, including facilities situated 18 km offshore from Abidjan, in the Gulf of Guinea. The project scope includes: an existing operational production platform (Foxtrot Platform); the construction and operation of a green field production platform (Marlin Platform); drilling of 12 wells; existing and new installation of oil and gas pipelines and onshore facilities. The expansion of this field and the extension of exploration and production into the neighboring Marlin platform are essential to the sustainability of energy production in the country.
In addition to the $487 million in MIGA guarantees supporting this project, IDA is further supporting the project with a Partial Risk Guarantee (PRG) of $15 million covering a Gas Supply Agreement termination risk. Synergies between the PRG and MIGA guarantees are expected to leverage private investments by helping the country to offer a tested credit enhancement framework to attract investors.
Overall, MIGA’s involvement in the country, with an exposure of $754 million in gross guarantees, has mobilized over $2 billion worth of private investment.

MIGA Strategic Directions FY15-17 24
62. Energy Efficiency and Climate Change. MIGA’s unique profile allows it greater capacity to support complex energy and infrastructure projects which improve not only energy capacity within countries, but those such as improved transport networks which often require large investment and which when implemented successfully can directly and positively impact upon pollution control, including in MICs. In addition, MIGA’s strong track record shows the continued emphasis placed on supporting renewable energy projects, including wind and hydropower. One of the most valuable elements MIGA provides in these circumstances is access to the WBG’s environmental, social and governance standards—simultaneously supporting large investments but also helping sponsors manage different conditions along best practice lines and providing demonstration that they are operating to the world's highest standards.
63. Middle Income Countries (MICs). While MIGA will continue to pay special attention to riskier markets as mentioned above, the Agency will also stand ready to support investments into MICs if there is strong additionality. As noted previously, MIGA can play an important role in the financial sector, and in meeting the large infrastructure requirements, requiring long term financing in areas such as energy, roads and urban mobility and water. This will also allow MIGA to diversify its portfolio, which will add to its financial sustainability and contribute to its ability to take risk, thereby enhancing its ability to bring global best practices to the deals it supports.
64. In Hungary, for example, MIGA has used the NHSFO product to enhance the credit standing of a debt issue by the sub-sovereign entity, the Magyar Export-Import Bank (Exim) of Hungary. MIGA's guarantee enhanced the credit quality of the issue, lowering the longer-dated borrowing costs of Exim, thereby enabling these savings to be passed on to the Hungarian export sector.
E. Partnerships
65. MIGA will continue to work with the other participants in the PRI market place, including public, private and multilateral investment and trade credit insurers. MIGA’s participation in a transaction often allows private insurers to be “crowded in” increasing the overall capacity of insurance available to private investors. Private insurers agree to come into projects covered by MIGA, while they would not participate on their own. Use of this approach has proven highly valuable, not only for managing MIGA’s risk and concentration, but also in maximizing the impact of MIGA’s presence in the market.
66. MIGA can offer capacity to its partners as well. In FY13, MIGA provided $150 million in reinsurance to the Overseas Private Investment Corporation. Given the civil unrest in Egypt, MIGA was the only entity willing to provide reinsurance for an investment by the Apache Corporation, a US-based oil and gas exploration and development company. MIGA will continue to develop such partnerships that deepen its relationship with other actors in the market, and leverage additional finance for critical projects for countries.
67. MIGA has also extended cooperation with other regional banks, in recent years working alongside the Asian Development Bank in the oil sector in Uzbekistan and energy in Pakistan, with the Islamic Development Bank in support of the Djibouti port, and with the African Development Bank in Côte d’Ivoire on the third Bridge of Abidjan. Ongoing coordination with the European Bank for Reconstruction and Development on a significant extractive industries project in Mongolia is just one further example of this form of partnership. MIGA will seek to further develop these partnerships with regional banks during the FY15-17 period.

MIGA Strategic Directions FY15-17 25
F. Business Volume Targets
68. MIGA targets 10% annual growth rates for its issuance of new guarantees, in line with medium term growth of FDI. Total new issuances are projected to be $3.1 billion in FY14, $3.4 billion in FY15, $3.7 billion in FY16 and $4.1 billion in FY17. Growth in new business at 10% per annum represents a total increase of nearly 50% over the period FY13-17.
G. Product Mix
69. MIGA will target a product mix that is aligned with the strategic focus and with growth expectations of the respective market segments—traditional PRI and non-honoring products. The product mix has implications for the risk level and income generation capacity of MIGA’s portfolio and therefore needs to be carefully monitored and managed as part of implementing the strategy of providing additionality in a financially sustainable manner. This mix is also important in order for MIGA to have a balanced guarantee portfolio and ensure that it builds the skill and experience related to new products. Within the broad targets for PRI and non-honoring products, MIGA will seek to continue to diversify distribution of exposure across host countries of varying risk levels, geographic locations, and sectors. As mentioned in Section III, the Agency’s market positioning entails a focus on complex and higher risk markets, complemented with business in MICs and lower risk markets where the potential for development impact is strong (see Figure 7).
Figure 7. MIGA’s Strategic Choice by Product
70. Almost two-thirds of new business is expected to come from MIGA’s traditional PRI products and the remaining from its more recently introduced credit enhancement products. This growth will be achieved by capturing the opportunities presented by MIGA’s expanded line-up of PRI and non-honoring products, its stronger integration in country dialogue, as well as by reaching out more systematically to its wider client base consisting of equity investors, and lenders such as banks and capital market investors. A 10% annual level of growth in new business volume means that by FY17, MIGA's annual gross new issuance would be approximately $4.1 billion. This would represent nearly 10% of WBG overall new business volume, a contribution that would significantly exceed the share implied by MIGA's relative size and share of WBG resources.


IV. SIX INITIATIVES FOR IMPLEMENTING THE STRATEGY
71. The implementation plan for attaining these business objectives is laid out in six change initiatives that MIGA is undertaking in the areas of:
(a) Business Development;
(b) Non-honoring Product Management;
(c) Reinsurance;
(d) Investment Management;
(e) Pricing; and
(f) Operational Effectiveness
72. To attain its objective of achieving growth by developing new business and sustaining existing business in challenging markets, MIGA will focus change efforts on these six initiatives which have been identified as presenting significant potential for strengthening the Agency’s capability of delivering additionality in a financially sustainable manner.
A. Business Development
73. Country Focus. MIGA will cultivate closer relationships with country client governments in order to identify key development priorities that these governments would like to see MIGA involved in through PRI (e.g., PPPs) and credit enhancement products. By forging partnerships with governments early in the stage of project development, the Agency can increase the relevance and impact of its interventions, and ensure that maximum value is delivered from the deployment of the guarantees it provides. At the same time it can provide useful guidance to governments when in a position to do so on potential projects. By identifying early on what are the priorities for host governments, MIGA will be more effective in linking this information with potential investors thereby enhancing the impact of the new client serving model.
74. MIGA will engage with countries through targeted outreach and visits to identify opportunities and present the possibilities of MIGA’s support to Government, as complement to other WBG interventions. This approach has been applied recently in Brazil, Romania, Nigeria, Kenya, Indonesia, Myanmar, Morocco and Tunisia, for example. As noted above, MIGA will also engage in the preparation of CPFs. Rather than aim to work across all regions, in recognition of its size, MIGA will choose strategic engagement points, focusing on countries with the highest potential and the greatest need, where there is still high headroom in terms of country limits. To this end, as previously noted, MIGA’s senior management will be engaging with the relevant IBRD and IDA country directors and IFC country managers to optimize its engagement in the CPF process.
75. Client Teams. MIGA’s repeat business is concentrated within a manageable group of top clients, both banks and corporate sponsors, with 15 investors accounting for 70% of gross new guarantee issuance in FY11-13. From this core group, MIGA can cultivate strategic relationships that would identify additional areas for collaboration. By assigning small teams of staff responsible for important clients, MIGA’s role can advance into an advisory capacity, help investors prioritize objectives, and potentially guide the direction of the investments towards countries most closely aligned with MIGA’s and WBG’s strategic priorities.
MIGA Strategic Directions FY15-17 28
76. A Client Service Leader (CSL) has been designated for each of MIGA’s top clients to serve as the main point of contact and understand their business plans more strategically. This means that the CSL is not only tasked with responding to the client but must also work with the client and develop knowledge of the company’s growth strategy in order to potentially guide investment decision-making towards opportunities with higher development impact, including in riskier markets. The CSL coordinates all client interaction by MIGA staff, including Management, from both headquarters and the regional hubs, to ensure a consistent message and leverage the relationship to generate the type of business that is of greatest strategic value to the Agency. The CSL’s interface with clients is informed by the results of country outreach previously described that allows identification of the opportunities that MIGA should pursue in priority from the country perspective.
B. Non-Honoring Product Management
77. MIGA’s NHSFO product is attractive to both investors and country clients. Its success can be seen in recent transactions, which have been transformational in nature, as was the case in Turkey and Panama, where MIGA helped facilitate financing for important metro-rail projects. In Angola, MIGA supported a project which helped add 25% to the country’s installed electricity capacity, and in Vietnam, MIGA mobilized financing for the rehabilitation of critical road links to one of the country’s least developed regions. Whereas these transactions show strong development impact, from a risk-return assessment, there is an increase in capital utilization. This must be taken into account in managing MIGA’s financial sustainability in future years, as demand for MIGA’s non-honoring products has been increasing more rapidly than that for traditional PRI products.
78. MIGA has experienced very few claims on its traditional PRI products - six claim payouts since inception, totaling around $16 million, of which 4 were for war and civil disturbance (and thus beyond the scope MIGA’s mediation capacity). As MIGA increasingly moves into difficult markets for PRI, PPPs and transformational projects, the risk of claims may increase. In addition, MIGA does not yet have experience with claims for non-honoring products. While as part of the WBG, it is expected that MIGA will be in a considerably stronger recovery position compared to private creditors, MIGA will work on enhancing risk management and monitoring procedures for the new NHFSO products.
79. In particular, MIGA will deepen its framework to monitor non-honoring transactions throughout the product life cycle, during various stages of activity—normal, potential claims, actual claim, and recovery. This framework is relevant both to NHSFO and to the recently launched NHFO-SOE product. The NHFO-SOE cover requires a risk assessment framework that combines corporate credit analysis and sovereign support analysis. As the NHFO-SOE product is rolled out, MIGA will develop further the management framework for this type of product, recruit and strengthen skills among staff, heighten monitoring systems, and leverage WBG, IMF and external resources, such as rating agencies. In addition, efforts will be made to ensure that MIGA’s existing mechanisms for reinsurance and provisioning can accommodate the new NHFO-SOE product and that plans of action are developed for MIGA intervention to minimize the likelihood that a deteriorating situation leads to a claim.
80. Where possible, MIGA also sees the complementary application of this product with other WBG entities, as a risk mitigant as well as an opportunity for deepening transformational opportunity. For example, a currently planned intervention by MIGA in Brazil would add a $300 million private financed tranche covered by MIGA to an IBRD loan for urban transport, magnifying the WBG impact. As MIGA continues to grow, a stronger

MIGA Strategic Directions FY15-17 29
and larger capital base would allow handling shocks more readily both for the larger PRI interventions in higher risk markets and the credit enhancement products.
C. Reinsurance
81. In order to support the Agency’s growth, MIGA will continue to augment its reinsurance programs, by enhancing their capacity to absorb high insurance exposures for longer tenors through the following:
(a) Seeking new reinsurance partners both within and outside of the main insurance hubs in Europe and North America; MIGA is currently exploring opportunities with counterparts from Asia;
(b) Encouraging its reinsurance partners to accept longer tenor projects in challenging markets;
(c) Where necessary, adjusting reinsurance program structures and terms.
82. In addition to enhancing its reinsurance programs, MIGA is also exploring reinsurance alternatives. A current example is the proposed Exposure Exchange Agreement between IBRD and MIGA, which allow both institutions to manage their risk more efficiently and provide a framework that may be replicated by other institutions. Other alternatives, such as capital markets transactions, will be considered and tested as appropriate.
D. Investment Management
83. An important component of total net income, investment income has contributed to the growth of MIGA’s capital base. MIGA’s investment portfolio has produced an average total return of 2.6% over FY11-13 since the implementation of the Long-term Investment Portfolio (LTIP) in FY1120. LTIP consists of long-term U.S. Government bonds (5-10 year maturities) and U.S. and global equities. The LTIP performance during the three-year period, returned on average 3.3% on the long-term Government bonds and 7.8% on the equity portfolio (see Table 7), with total LTIP return averaging 6.1%.
84. In FY12, portfolio performance was primarily driven by the long-term fixed income holdings (subsequently sold in June 2013 as part of a tactical reallocation to reduce portfolio duration in light of increasing market interest rates at that time) and in FY13 the primary driver was the global equity holdings.
Table 7. Investment Income by Asset Class ($millions)
Asset Class FY11 FY12 FY13 FY14Q2 YTD
Money Market/Cash 2.7 1.5 1.8 0.8
US Short Term 0-3 Yr. 3.1 1.9 1.0 0.9
Mortgage Backed Securities 8.2 11.5 (1.6) 1.5
US Long Term 5-10 Yr. 0.1 17.7 (1.3) -
Global Equities (0.5) 4.3 33.5 28.6
Total Investment Income 13.9 36.9 33.6 31.8
Total Portfolio Return 1.4% 3.6% 3.1% 2.7%
LTIP Return Only 1.9% 7.5% 8.9% 15.3%
20“Review of MIGA’s Investment Policy”, May 27, 2010 (MIGA/R2010-0029).

MIGA Strategic Directions FY15-17 30
85. Given the emergent economic recovery in the developed world and changing US Fed Policy on quantitative easing, a review of the asset allocation is being undertaken to ensure risk/return objectives of the Agency are adapted to the changing environment. As markets normalize and returns revert to mean levels, the LTIP in its current form could provide a more moderate level of returns in future years compared to the FY11-13 period. Accordingly, alternative asset classes are being considered to enhance returns while keeping portfolio volatility at acceptable levels.
E. Pricing
86. Premium income is the main driver of MIGA’s revenues and retained earnings. A review of the pricing model framework and relevant parameters is undertaken on a regular basis to reflect MIGA's evolving claims and expense experience. A balance between premium income and portfolio risk is a central focus of Management’s efforts to manage the Agency toward its strategic objectives of additionality and financial sustainability.
87. MIGA employs risk-based pricing, based on country risk assessments for individual PRI covers (transfer restriction, expropriation, breach of contract, war and civil disturbance, respectively) and for NHSFO. Ratings for state-owned enterprises (SOEs) are prepared on a case-by-case basis, the approach for which is currently being refined (see Non-Honoring Product section above). MIGA’s ratings represent a forward-looking estimate of risk in the medium term. These ratings feed into MIGA’s economic capital and pricing models for the purpose of determining risk-based contract premium rates that are effective for the duration of the contract. The premium rates also include a component for recovery of MIGA’s administrative expenses.
88. The model-based premium rate is a key input to the pricing decision, and is supplemented with market data and other benchmarks where available. The final rates for guarantee contracts are approved by MIGA’s Project Review Committee, whereby consideration is given to the PRI market at large and MIGA’s strategic positioning in the PRI market, to ensure that pricing is consistent with the Agency’s strategic focus areas in terms of host country and product mix.
89. The economic capital and pricing models rely on a set of underlying risk parameters, which are reviewed at regular intervals. A major review of the parameters was undertaken in FY13, in conjunction with the development of a new EC model replacing MIGA’s existing model. While this will lead to some changes in the relative differentiation of claims risk levels and risk premiums among MIGA’s different cover types, NHSFO and NHFO-SOE will continue to command higher risk premiums than PRI for similar ratings. The new EC model has enhanced capability to capture contract structures such as first loss and portfolio coverage, and allows for better flexibility and transparency for stress scenarios. This is particularly helpful for the continued articulation of MIGA’s risk appetite, and determining implications of strategic decisions on target countries and product mix, whereby scenario analysis is a critical tool.
F. Operational Effectiveness
90. Skills and Organization. MIGA enjoys the benefits of agility and flexibility that comes with an organization of its relatively small size. Not only are budgetary resources significantly more modest,21 but communication can be shared rapidly across units and
21 MIGA’s Board-approved FY14 administrative budget is $53 million.

MIGA Strategic Directions FY15-17 31
change can be rolled out with greater ease than in other WBG entities. MIGA’s recently inaugurated open space environment highlights this and reflects the culture change the entire WBG is undergoing, where a stronger emphasis is being made on breaking down silos and increasing collaboration.
91. MIGA has been shifting more talent to client facing teams and increasing flexibility in deployment of staff to high demand areas. A pool of multi-sectorial underwriters is being constituted to respond more flexibly to demand. MIGA may also need to augment its staffing complement to support growth, notably to strengthen underwriting and to continue to ensure adequate attention to risk management and monitoring. MIGA will seek to use flexible rather than fixed resources when possible.
92. WBG Financial Stability Framework. MIGA has been participating in the ongoing WBG financial stability framework, including the expenditure review. The cost savings that are expected to result from various policy changes (such as those impacting benefits and travel) that have already been instituted by the Bank will likewise be reflected in MIGA’s own expenses. Additional changes recommended will be adopted by MIGA in FY15. Overall, the Agency will continue to manage its costs prudently, seek opportunities for savings, and explore revenue generating activities and external funding where possible.
93. Income drivers. The product mix and target host countries discussed previously are the key drivers for the income MIGA will generate and the amount of capital needed to be held against the underwriting risks for guarantees it will issue. The primary components that make up MIGA’s net income are premium income, investment income earned on the liquid asset portfolio, and administrative expenses. These components, and factors that influence them, are depicted in Figure 8. The relative breakdown of income and expenses, expressed as averages for the period FY09-FY13 is also shown in the Figure. Finally, the six strategic initiatives are listed alongside the areas targeted for enhancement by each initiative.
Figure 8. Summary of Business & Financial Drivers and Link to Strategic Initiatives
Ratios based on average FY09-13 financial data; Annual Net Premium includes ceding commission.
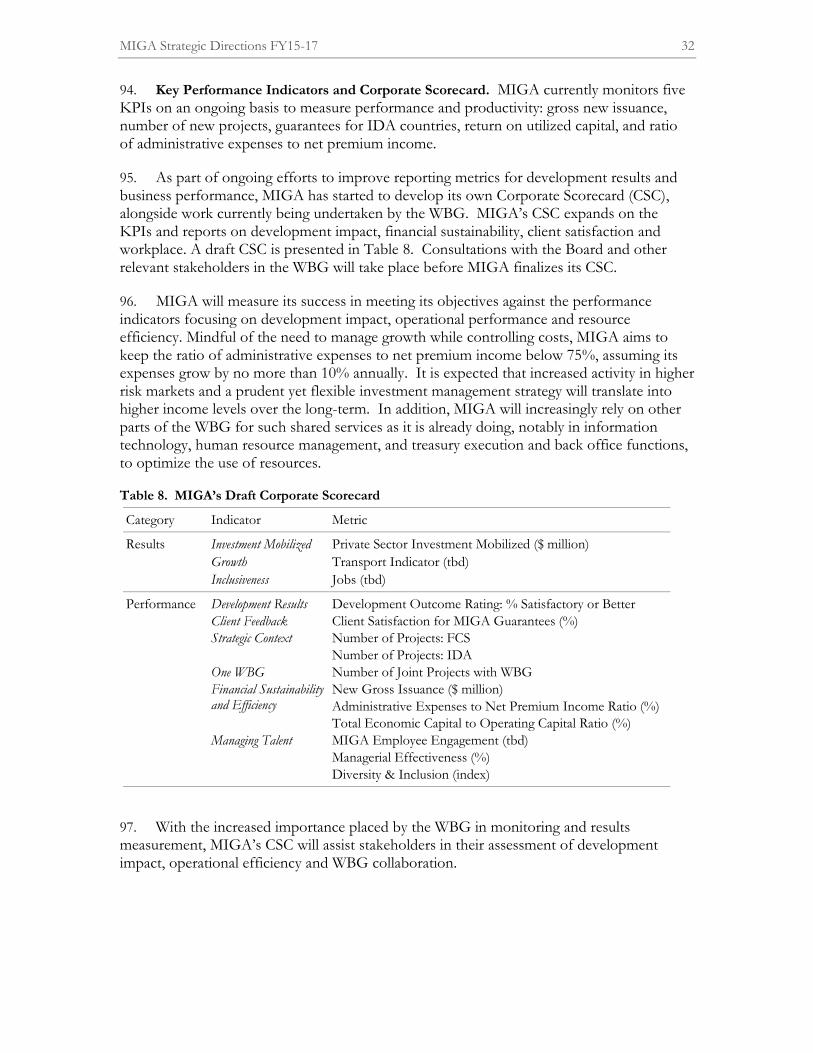
MIGA Strategic Directions FY15-17 32
94. Key Performance Indicators and Corporate Scorecard. MIGA currently monitors five KPIs on an ongoing basis to measure performance and productivity: gross new issuance, number of new projects, guarantees for IDA countries, return on utilized capital, and ratio of administrative expenses to net premium income.
95. As part of ongoing efforts to improve reporting metrics for development results and business performance, MIGA has started to develop its own Corporate Scorecard (CSC), alongside work currently being undertaken by the WBG. MIGA’s CSC expands on the KPIs and reports on development impact, financial sustainability, client satisfaction and workplace. A draft CSC is presented in Table 8. Consultations with the Board and other relevant stakeholders in the WBG will take place before MIGA finalizes its CSC.
96. MIGA will measure its success in meeting its objectives against the performance indicators focusing on development impact, operational performance and resource efficiency. Mindful of the need to manage growth while controlling costs, MIGA aims to keep the ratio of administrative expenses to net premium income below 75%, assuming its expenses grow by no more than 10% annually. It is expected that increased activity in higher risk markets and a prudent yet flexible investment management strategy will translate into higher income levels over the long-term. In addition, MIGA will increasingly rely on other parts of the WBG for such shared services as it is already doing, notably in information technology, human resource management, and treasury execution and back office functions, to optimize the use of resources.
Table 8. MIGA’s Draft Corporate Scorecard
Category Indicator Metric
Results Investment Mobilized Private Sector Investment Mobilized ($ million)
Growth Transport Indicator (tbd)
Inclusiveness Jobs (tbd)
Performance Development Results Development Outcome Rating: % Satisfactory or Better
Client Feedback Client Satisfaction for MIGA Guarantees (%)
Strategic Context Number of Projects: FCS
Number of Projects: IDA
One WBG Number of Joint Projects with WBG
Financial Sustainability and Efficiency
New Gross Issuance ($ million)
Administrative Expenses to Net Premium Income Ratio (%)
Total Economic Capital to Operating Capital Ratio (%)
Managing Talent MIGA Employee Engagement (tbd)
Managerial Effectiveness (%)
Diversity & Inclusion (index)
97. With the increased importance placed by the WBG in monitoring and results measurement, MIGA’s CSC will assist stakeholders in their assessment of development impact, operational efficiency and WBG collaboration.
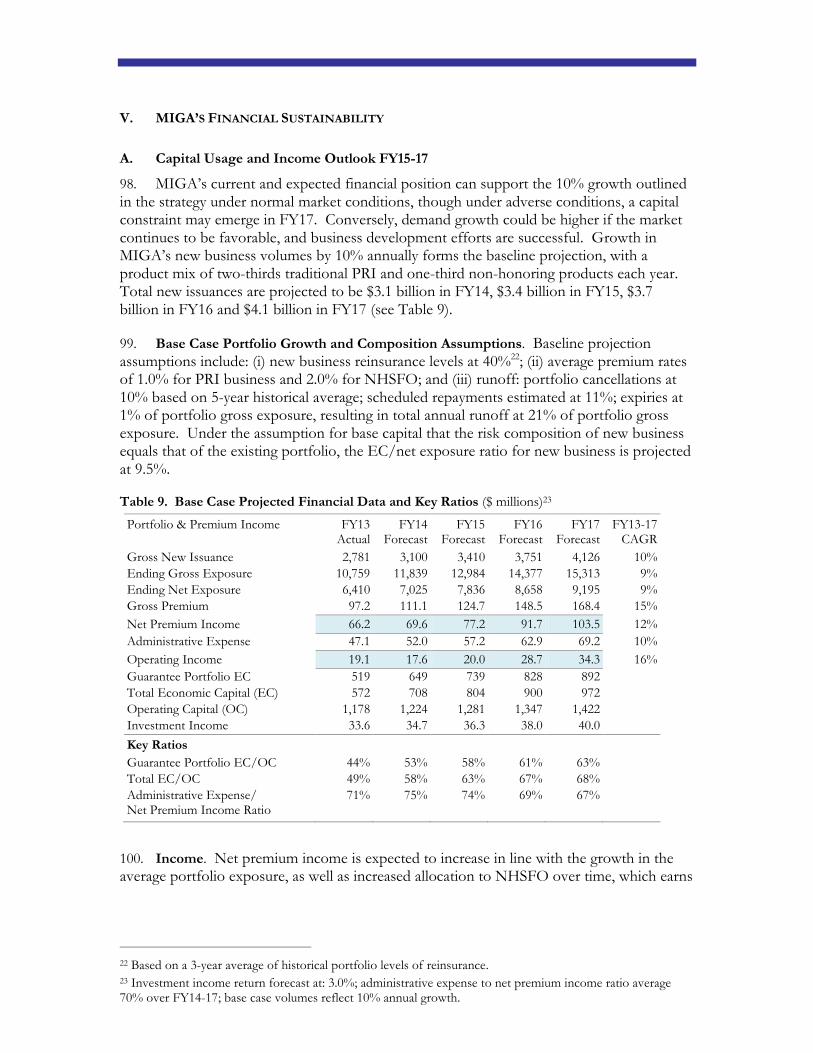
V. MIGA’S FINANCIAL SUSTAINABILITY
A. Capital Usage and Income Outlook FY15-17
98. MIGA’s current and expected financial position can support the 10% growth outlined in the strategy under normal market conditions, though under adverse conditions, a capital constraint may emerge in FY17. Conversely, demand growth could be higher if the market continues to be favorable, and business development efforts are successful. Growth in MIGA’s new business volumes by 10% annually forms the baseline projection, with a product mix of two-thirds traditional PRI and one-third non-honoring products each year. Total new issuances are projected to be $3.1 billion in FY14, $3.4 billion in FY15, $3.7 billion in FY16 and $4.1 billion in FY17 (see Table 9).
99. Base Case Portfolio Growth and Composition Assumptions. Baseline projection assumptions include: (i) new business reinsurance levels at 40%22; (ii) average premium rates of 1.0% for PRI business and 2.0% for NHSFO; and (iii) runoff: portfolio cancellations at 10% based on 5-year historical average; scheduled repayments estimated at 11%; expiries at 1% of portfolio gross exposure, resulting in total annual runoff at 21% of portfolio gross exposure. Under the assumption for base capital that the risk composition of new business equals that of the existing portfolio, the EC/net exposure ratio for new business is projected at 9.5%.
Table 9. Base Case Projected Financial Data and Key Ratios ($ millions)23
Portfolio & Premium Income FY13 Actual
FY14 Forecast
FY15 Forecast
FY16 Forecast
FY17 Forecast
FY13-17 CAGR
Gross New Issuance 2,781 3,100 3,410 3,751 4,126 10%
Ending Gross Exposure 10,759 11,839 12,984 14,377 15,313 9%
Ending Net Exposure 6,410 7,025 7,836 8,658 9,195 9%
Gross Premium 97.2 111.1 124.7 148.5 168.4 15%
Net Premium Income 66.2 69.6 77.2 91.7 103.5 12%
Administrative Expense 47.1 52.0 57.2 62.9 69.2 10%
Operating Income 19.1 17.6 20.0 28.7 34.3 16%
Guarantee Portfolio EC 519 649 739 828 892
Total Economic Capital (EC) 572 708 804 900 972
Operating Capital (OC) 1,178 1,224 1,281 1,347 1,422
Investment Income 33.6 34.7 36.3 38.0 40.0
Key Ratios
Guarantee Portfolio EC/OC 44% 53% 58% 61% 63%
Total EC/OC 49% 58% 63% 67% 68%
Administrative Expense/ Net Premium Income Ratio
71% 75% 74% 69% 67%
100. Income. Net premium income is expected to increase in line with the growth in the average portfolio exposure, as well as increased allocation to NHSFO over time, which earns
22 Based on a 3-year average of historical portfolio levels of reinsurance. 23 Investment income return forecast at: 3.0%; administrative expense to net premium income ratio average 70% over FY14-17; base case volumes reflect 10% annual growth.

MIGA Strategic Directions FY15-17 34
on average a higher premium rate than traditional PRI covers and leads to an increase in the overall portfolio effective premium rate.24
101. Capital Utilization. Under normal conditions for the baseline scenario with 10% annual volume growth, the capital utilization ratio defined as total economic capital over operating capital is projected to reach 68% in FY17, within the range of 70%-80% in total economic capital usage25 (Economic Capital/Available Operating Capital) that MIGA’s management team views as being acceptable. Figure 9 shows the EC/OC ratio under the base case and stress scenarios, which consider events that increase capital usage.
102. Scenarios. New business volume scenarios for a low case and a high case over FY15-17 and their resulting impact on the Agency’s financial sustainability were considered. A low case scenario representing new business issued at historical annual growth rate of 7% shows the Agency can sufficiently undertake business activities with its current capital base. Under this scenario, capital utilization would average 63% over FY15-17 period and grow to 66% by FY17. Annual new business volumes at FY17 would be $3.8 billion. A high case scenario with a 15% annual growth in new business volumes results in average capital utilization of 65% over FY14-17 and grows to 72% by FY17. New business volumes here would be $4.7 billion.
103. In addition, two scenarios around the composition of new business were considered to assess impact on MIGA’s capital utilization. A positioning in NHSFO new business to cover risk exposures that are rated on average BB on a S&P equivalent scale26, which are below investment grade and below the average rating of BB+ NHSFO business written to date, is projected to result in an EC/OC ratio of 76% in FY17 (see Figure 9). A second scenario of new business volumes with an annual volume growth of 15% and positioning in BB rated NHSFO transactions would increase the projected capital usage to 82% in FY17. The risk composition of new business issued plays an important role in utilization of MIGA’s capital.
104. A claim payout scenario is presented to assess the impact on capital utilization, where a hypothetical $250 million claim is made in FY14, representing a payout on two of MIGA’s contracts of guarantee covering equity investments. Under this scenario, MIGA is able to continue with the baseline business plan after the payout, but the EC/OC ratio rises from 73% in FY14 to 82% in FY16. If this case were to materialize, a reevaluation of the planned new business volumes would be warranted in consideration of any claims recovery MIGA expected over time. In addition, under higher growth or more severe downturn scenarios, capital could become a constraint.
24 Portfolio effective rate is annual gross premium divided by average gross exposure; average rate for PRI: 1.0% and NHSFO: 2.0%. 25 MIGA’s total economic capital usage includes the EC consumed by the guarantee portfolio, EC for operational risks, and EC for investment portfolio risks. 26 On the same scale, MIGA has thus far written NHSFO guarantees in countries rated from BBB to B. The same composition of ratings is maintained for new business in the baseline projections.
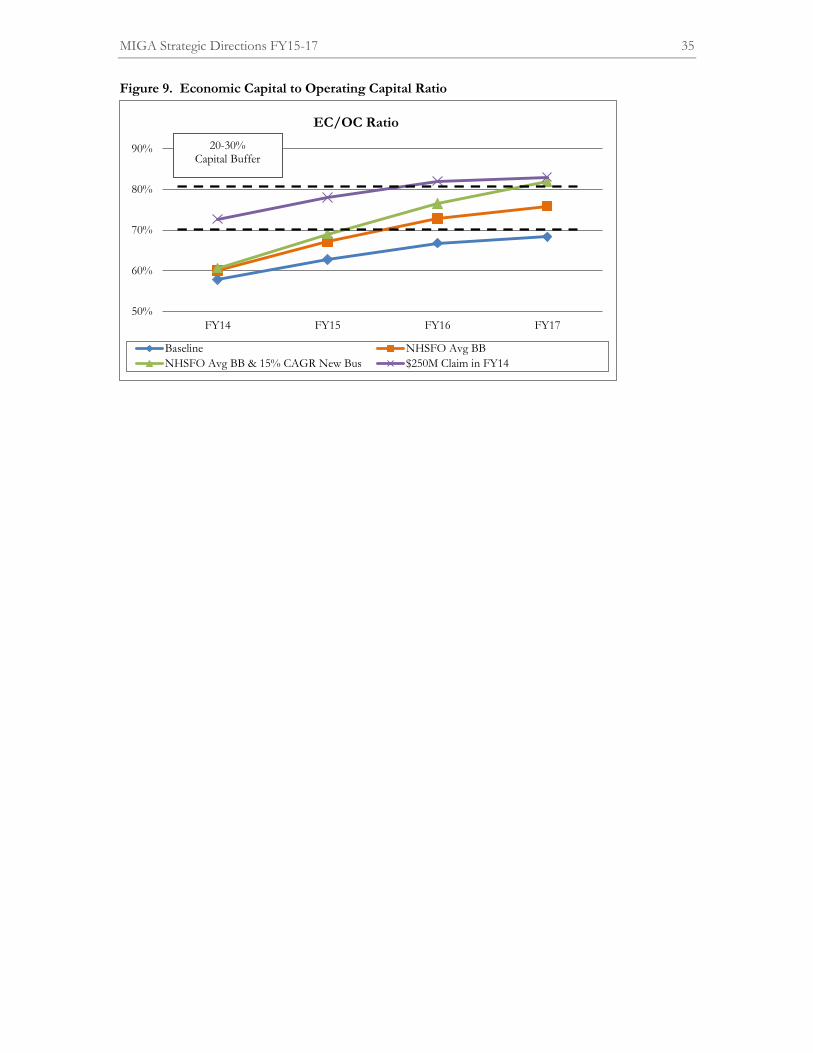
MIGA Strategic Directions FY15-17 35
Figure 9. Economic Capital to Operating Capital Ratio
50%
60%
70%
80%
90%
FY14 FY15 FY16 FY17
EC/OC Ratio
Baseline NHSFO Avg BB
NHSFO Avg BB & 15% CAGR New Bus $250M Claim in FY14
20-30% Capital Buffer


VI. CONCLUSION
105. In order to deliver on its objectives to provide additionality in the context of the WBG’s development goals, MIGA is positioning itself to fully leverage the resources of both the WBG and the private sector through effective partnerships. MIGA’s position will be further strengthened by a number of strategic initiatives, which are designed to improve its ability to serve countries, and key market segments and clients in a comprehensive and holistic manner, while maintaining a sound financial profile.
106. Given the assumptions for future business volume, product mix, and host country mix presented in this FY15-17 strategy, MIGA will continue to more effectively utilize its capital. While the risk level of the guarantee portfolio may increase, continued growth in the portfolio would result in higher income earned, which in turn adds to a growing capital base supporting the guarantee business (see Figure 8), absent any significant claim payouts. Overall, MIGA’s ability to deliver on its strategic objectives, and be a reliable partner for the private sector, remains strong. At the end of the three year period, the capital position may become tighter in the event of relatively small deviations from baseline assumptions. A reevaluation of the plan would be undertaken in such an instance.


VII. NEXT STEPS
107. MIGA will continue to update the Board on the implementation of the initiatives described in this document. During FY15, management plans to bring an update on MIGA’s investment policy to the Audit Committee. The administrative budget request, with details on implementation of the FY15-17 strategy, will be brought to the Budget Committee in FY14 Q4.