migrant population in italy and serbia differences and different impact on the age structure. the...
Post on 22-Dec-2015
215 views
TRANSCRIPT

Migrant population in Italy and Serbia Differences and different impact on the age structure.
The case of Rome and Belgrade
Lorenzo Cassata ([email protected])
Vladimir Nikitovic ([email protected])
Donatella Zindato ([email protected])

The Difference Between Foreign and Immigrant Population in Italy

Portion of Foreign Population (%) In:
Usually Resident Population(provinces)
Foreign Population(provinces)

Municipalities in Italy with the Biggest Portion of Total Foreign Population
7.37
6.56
2.60
1.40
1.17
1.07
1.00
0.82
0.72
0.69
0.69
0.66
0.63
0.60
0.46
0 1 2 3 4 5 6 7 8
Roma
Milano
Torino
Firenze
Genova
Bologna
Verona
Brescia
Palermo
Trieste
Modena
Napoli
Prato
Padova
Parma
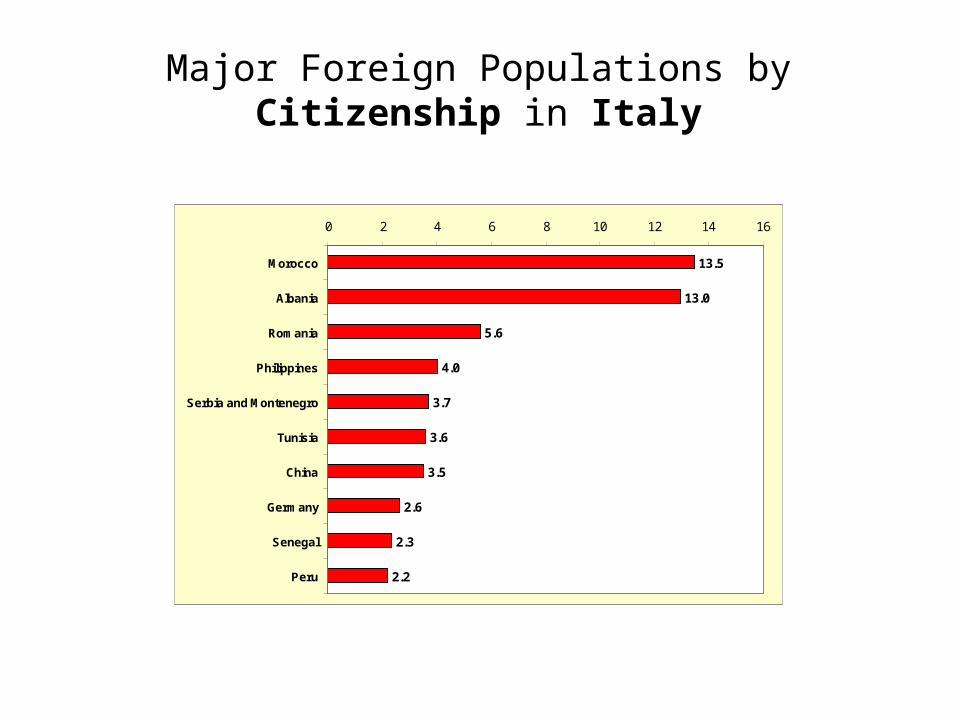
Major Foreign Populations by Citizenship in Italy
13.5
13.0
5.6
4.0
3.7
3.6
3.5
2.6
2.3
2.2
0 2 4 6 8 10 12 14 16
Morocco
Albania
Romania
Philippines
Serbia and Montenegro
Tunisia
China
Germany
Senegal
Peru

Portion of Refugee Population (%) In:
Refugees of total ref (%)
10.01 to 15.86
5.01 to 10.00
2.01 to 5.00
1.01 to 2.00
0.79 to 1.00
Refugees of total (%)
Usually Resident Population(districts)
Refugee Population(districts)
10.00 to 29.36
2.01 to 6.00
1.01 to 2.00
0.30 to 1.00
Refugees of total ref (%)

Municipalities in Serbia with the Biggest Portion of Total Refugee Population
9.92
5.76
4.23
3.69
3.32
3.14
2.98
2.75
2.60
2.51
2.41
2.29
2.19
2.05
1.94
0 2 4 6 8 10 12
Novi Sad
Zemun
Novi Beograd
Cukarica
Stara Pazova
Sombor
Palilula
Indjija
Ruma
Subotica
Sid
Vozdovac
Pancevo
Zvezdara
Sremska Mitrovica

Sex ratio (%) - Indigenous and Foreign Population
94.86
93.71
90.76
98.00
86.00
88.00
90.00
92.00
94.00
96.00
98.00
100.00
SERBIA ITALY
INDIGENOUS
FOREIGNERS/REFUGEES

Age pyramid of Italy’s population
0 to 4
5 to 9
10 to 14
15 to 19
20 to 24
25 to 29
30 to 34
35 to 39
40 to 44
45 to 49
50 to 54
55 to 59
60 to 64
65 to 69
70 to 74
75 + Italian males
Italian females
Foreign males
Foreign females

Age pyramid of Serbia’s population
0 to 4
5 to 9
10 to 14
15 to 19
20 to 24
25 to 29
30 to 34
35 to 39
40 to 44
45 to 49
50 to 54
55 to 59
60 to 64
65 to 69
70 to 74
75 + Indigenous males
Indigenous females
Male refugees
Female refugees

Age Structures of Two Different Non-indigenous Populations
0
2
4
6
8
10
12
14
16
18
0-4 5-9 10-14 15-19 20-24 25-29 30-34 35-39 40-44 45-49 50-54 55-59 60-64 65-69 70-74 75+
%
Foreigners in Italy
Refugees in Serbia

Sex ratio - Italian and Foreign Population (%)

Dependency Ratio (0-14&65+/15-64) - Italian and Foreign population (%)

Total Usually Resident Population(%)
Sex Ratio Dependency Ratio (0-14&65+/15-64)
59.8 to 69.5
57.2 to 59.8
55.2 to 57.2
53.2 to 55.2
50.6 to 53.2
DEPENDENCY RATIO
46.3 to 57.8
100.0 to 101.1
98.0 to 100.0
96.0 to 98.0
94.0 to 96.0
90.3 to 94.0
SEX RATIO
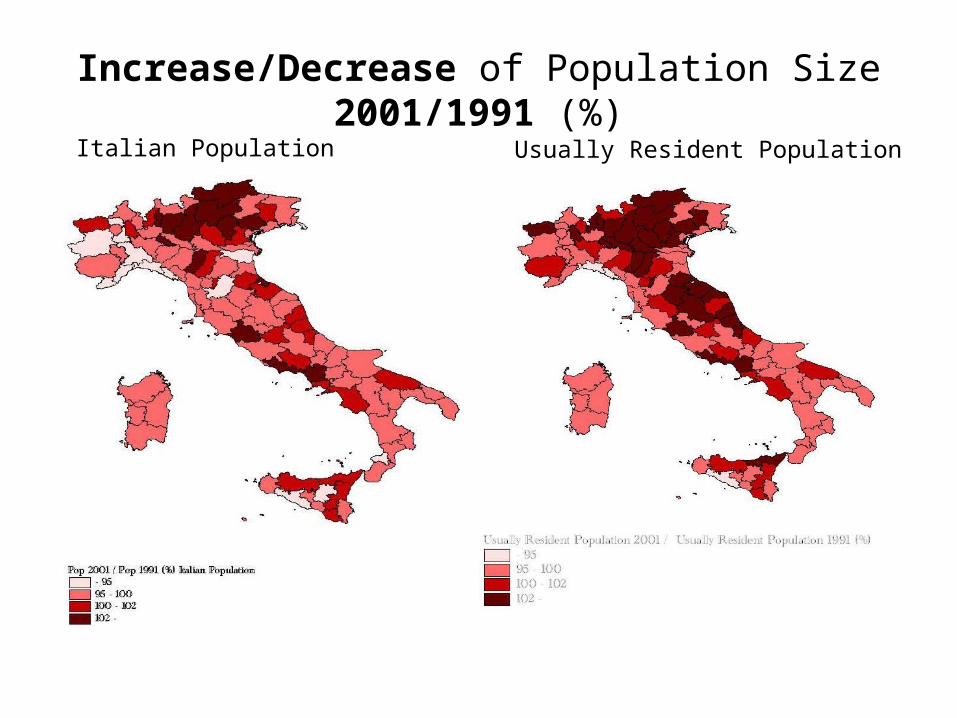
Increase/Decrease of Population Size 2001/1991 (%)
Italian Population Usually Resident Population

Education Level of Population in Italy
12.13
27.78
32.94
24.68
2.48
7.40
25.81
30.06
35.31
1.43
0 10 20 30 40 50 60
UNIVERSITY
HIGH SCHOOL
PRIMARY SCHOOL
LESS THAN PRIMARYSCHOOL
ILLITERATEITALIANS
FOREIGNERS

Education Level of Population in Serbia
13.87
50.20
21.49
11.20
3.23
11.12
41.52
24.58
18.98
3.80
0 10 20 30 40 50 60
UNIVERSITY
HIGH SCHOOL
PRIMARY SCHOOL
LESS THAN PRIMARYSCHOOL
ILLITERATE INDIGENOUSPOPULATION
REFUGEES

Activity Status of Population in Italy
58.6
8.1
29.8
3.6
42.6
5.6
30.8
21.0
0 10 20 30 40 50 60
EMPLOYED
UNEMPLOYED
SUPPORTED
RETIRED
ITALIANS
FOREIGNERS

Activity Status of Population in Serbia
30.30
16.91
38.02
14.78
35.33
10.10
34.36
20.21
0 5 10 15 20 25 30 35 40
EMPLOYED
UNEMPLOYED
SUPPORTED
RETIRED
INDIGENOUSPOPULATION
REFUGEES

The Case of Rome and Belgrade

Portion of Foreign/Refugee Population (%) In Usually Resident Population
10.01 to 11.39
7.01 to 10.00
5.01 to 7.00
3.17 to 5.00
Refugee of total (%)
Rome Belgrade

Major Foreign Populations by Citizenship in Rome
13.30
9.20
5.70
5.00
3.20
3.20
2.90
2.90
2.40
2.30
0 2 4 6 8 10 12 14
Philippines
Romania
Poland
Peru
Egypt
Bangladesh
China
France
Yugoslavia
Sri Lanka

Portion of Philippines/Romanian Population (%) In Usually Resident Population

Portion of Polish Population (%) In Usually Resident Population
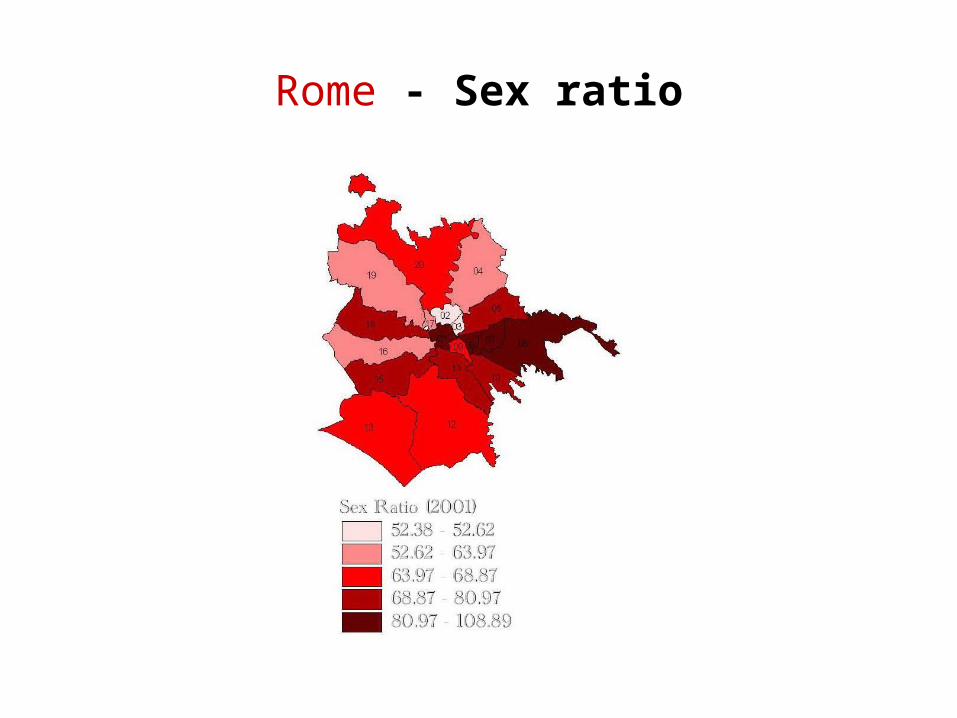
Rome - Sex ratio

Sex ratio - Major Foreign Populations by Citizenship in Rome
206
181.8
110.3
99.8
98
92.3
74.3
68.8
61.4
55.4
0 50 100 150 200 250
Bangladesh
Egypt
Sri Lanka
China
Romania
Yugoslavia
Totale complessivo
Other
Philippines
Peru

Dependency ratio Major Foreign Populations by Citizenship in Rome
55.3
42.8
31.9
31.3
31.2
25.1
23.5
21.1
19.8
18.1
47.87
0 10 20 30 40 50 60
Yugoslavia
Italians
Egypt
Bangladesh
France
China
Peru
Sri Lanka
Romania
Philippines
Poland

Belgrade City - Sex ratio (%)
95.00 to 101.86
90.00 to 94.99
85.00 to 89.99
80.00 to 84.99
78.85 to 79.99
SEX RATIO RESIDENTS
Usually Resident Population Refugee Population
90.00 to 97.12
85.00 to 90.00
80.00 to 85.00
75.00 to 80.00
73.90 to 75.00
SEX RATIO REFUGEES

Rome - Dependency Ratio (0-14&65+/15-64)

Belgrade City - Dependency Ratio (0-14&65+/15-64)
60.00 to 65.54
55.00 to 60.00
50.00 to 55.00
48.00 to 50.00
46.05 to 48.00
DEP. RATIO RESIDENTS
90.00 to 97.12
Usually Resident Population Refugee Population
50.00 to 53.47
45.00 to 50.00
40.00 to 45.00
35.00 to 40.00
32.40 to 35.00
DEP. RATIO REFUGEES
Lorenzo Cassata ([email protected])Donatella Zindato ([email protected])
Vladimir Nikitovic ([email protected])
Italian National Institute for Statistics, Rome
Demographic Research Centre of Institute of Social Sciences, Belgrade