migrating from systems monitor for aix to tme 10
TRANSCRIPT

SG24-4936-00
Migrating from Systems Monitor for AIX toTME 10 Distributed Monitoring
July 1997
This soft copy for use by IBM employees only.


International Technical Support Organization
Migrating from Systems Monitor for AIX toTME 10 Distributed Monitoring
July 1997
SG24-4936-00
IBML
This soft copy for use by IBM employees only.

This soft copy for use by IBM employees only.
Take Note!
Before using this information and the product it supports, be sure to read the general information inAppendix C, “Special Notices” on page 143.
First Edition (July 1997)
Take Note!
Before using this information and the product it supports, be sure to read the general information underAppendix C, “Special Notices” on page 143.
This edition applies to TME 10 Distributed Monitoring Version 3.0.2 and 3.5 and to Systems Monitor for AIXVersion 2.1.2.
Comments may be addressed to:IBM Corporation, International Technical Support OrganizationDept. HZ8 Building 678P.O.Box 12195Research Triangle Park, NC 27709-2195
When you send information to IBM, you grant IBM a non-exclusive right to use or distribute the information in anyway it believes appropriate without incurring any obligation to you.
Copyright International Business Machines Corporation 1997. All rights reserved.Note to U.S. Government Users — Documentation related to restricted rights — Use, duplication or disclosure issubject to restrictions set forth in GSA ADP Schedule Contract with IBM Corp.

This soft copy for use by IBM employees only.
Contents
Figures . . . . . . . . . . . . . . . . . . . . . . . . . . . . . . . . . . . . . . . . . . . vii
Preface . . . . . . . . . . . . . . . . . . . . . . . . . . . . . . . . . . . . . . . . . . xiThe Team That Wrote This Redbook . . . . . . . . . . . . . . . . . . . . . . . . . xiComments Welcome . . . . . . . . . . . . . . . . . . . . . . . . . . . . . . . . . . xii
Chapter 1. TME 10 Distributed Monitoring Overview . . . . . . . . . . . . . . . 11.1 Distributed Monitoring History . . . . . . . . . . . . . . . . . . . . . . . . . . 1
1.1.1 Distributed Monitoring Now . . . . . . . . . . . . . . . . . . . . . . . . . 21.1.2 Into the Future . . . . . . . . . . . . . . . . . . . . . . . . . . . . . . . . . 2
Chapter 2. Systems Monitor in Detail . . . . . . . . . . . . . . . . . . . . . . . . 52.1 SNMP . . . . . . . . . . . . . . . . . . . . . . . . . . . . . . . . . . . . . . . . . 52.2 Systems Management with NetView for AIX and Systems Monitor . . . . 6
2.2.1 TME 10 NetView . . . . . . . . . . . . . . . . . . . . . . . . . . . . . . . . 72.2.2 System Information Agent (SIA) . . . . . . . . . . . . . . . . . . . . . . 72.2.3 Mid Level Manager (MLM) . . . . . . . . . . . . . . . . . . . . . . . . . 92.2.4 System Level Monitor (SLM) . . . . . . . . . . . . . . . . . . . . . . . . 92.2.5 Systems Monitor’s Use of SNMP . . . . . . . . . . . . . . . . . . . . . . 9
2.3 Using TME 10 NetView and Systems Monitor Tools . . . . . . . . . . . . . 10
Chapter 3. TME 10 Distributed Monitoring in Detail . . . . . . . . . . . . . . . . 153.1 Introduction to the Tivoli Management Environment . . . . . . . . . . . . . 15
3.1.1 Tivoli Management Regions . . . . . . . . . . . . . . . . . . . . . . . . . 163.1.2 Administrators and Policy Regions . . . . . . . . . . . . . . . . . . . . . 173.1.3 Management by Subscription . . . . . . . . . . . . . . . . . . . . . . . . 18
3.2 Inside TME 10 Distributed Monitoring . . . . . . . . . . . . . . . . . . . . . . 193.3 Under the Covers of TME 10 Distributed Monitoring . . . . . . . . . . . . . 20
3.3.1 Creating a Monitor . . . . . . . . . . . . . . . . . . . . . . . . . . . . . . 203.3.2 Displaying Events . . . . . . . . . . . . . . . . . . . . . . . . . . . . . . . 22
Chapter 4. Migration Methodology and Tools . . . . . . . . . . . . . . . . . . . 254.1 Pre-Migration Planning . . . . . . . . . . . . . . . . . . . . . . . . . . . . . . 254.2 The Overall Migration Picture . . . . . . . . . . . . . . . . . . . . . . . . . . 264.3 Analyzing the Migration . . . . . . . . . . . . . . . . . . . . . . . . . . . . . . 274.4 Systems Monitor and Sentry Can Co-exist! . . . . . . . . . . . . . . . . . . 314.5 Practical Migration Techniques . . . . . . . . . . . . . . . . . . . . . . . . . 31
4.5.1 Migration of a Small Configuration . . . . . . . . . . . . . . . . . . . . . 314.5.2 Migration of a Larger Configuration . . . . . . . . . . . . . . . . . . . . 33
4.6 Semi-Automated Profile Migration . . . . . . . . . . . . . . . . . . . . . . . . 354.6.1 The Sample Migration Script . . . . . . . . . . . . . . . . . . . . . . . . 354.6.2 migrate_sysmon_config . . . . . . . . . . . . . . . . . . . . . . . . . . . 364.6.3 After Running the Migration Script . . . . . . . . . . . . . . . . . . . . . 41
Chapter 5. TME 10 Distributed Monitoring Examples . . . . . . . . . . . . . . . 435.1 File System Monitoring Example . . . . . . . . . . . . . . . . . . . . . . . . . 44
5.1.1 Migration from Systems Monitor . . . . . . . . . . . . . . . . . . . . . . 445.1.2 Different Ways to Display Monitor Events from TME 10 Distributed
Monitoring . . . . . . . . . . . . . . . . . . . . . . . . . . . . . . . . . . . . . . 495.1.3 Sending Events to TME 10 Enterprise Console . . . . . . . . . . . . . . 495.1.4 Sending Events to TME 10 NetView . . . . . . . . . . . . . . . . . . . . 61
Copyright IBM Corp. 1997 iii

This soft copy for use by IBM employees only.
5.2 Print Subsystem Monitoring . . . . . . . . . . . . . . . . . . . . . . . . . . . 665.2.1 Monitoring with and/or Migration to Sentry . . . . . . . . . . . . . . . . 665.2.2 Automating Daemon Recovery . . . . . . . . . . . . . . . . . . . . . . . 675.2.3 Using TME 10 Tasks with TME 10 Distributed Monitoring . . . . . . . 705.2.4 Comparing the Different Approaches . . . . . . . . . . . . . . . . . . . 75
5.3 Monitoring CPU Utilization . . . . . . . . . . . . . . . . . . . . . . . . . . . . 765.3.1 How the CPU Monitor Examples Work . . . . . . . . . . . . . . . . . . . 775.3.2 Monitoring CPU with TME 10 Distributed Monitoring Using Shell
Scripts . . . . . . . . . . . . . . . . . . . . . . . . . . . . . . . . . . . . . . . . 785.3.3 Monitoring UNIX CPU Utilization Using MCSL . . . . . . . . . . . . . . 815.3.4 The New Monitoring Collection in Action . . . . . . . . . . . . . . . . . 875.3.5 Installing the UnixCPU Collection on Another TMR Server . . . . . . 91
5.4 File Monitoring Examples . . . . . . . . . . . . . . . . . . . . . . . . . . . . . 935.4.1 Monitoring ADSM Log Files . . . . . . . . . . . . . . . . . . . . . . . . . 935.4.2 Dynamically Named Log Files . . . . . . . . . . . . . . . . . . . . . . . . 99
5.5 Migrating the Re-Arm Function . . . . . . . . . . . . . . . . . . . . . . . . 1025.5.1 An Approximate Equivalent of Re-Arm Using Sentry . . . . . . . . . 1035.5.2 A Closer Approximation to Re-Arm Using Sentry . . . . . . . . . . . 104
5.6 Advanced Process Monitoring . . . . . . . . . . . . . . . . . . . . . . . . . 1075.6.1 Monitoring Multiple Processes . . . . . . . . . . . . . . . . . . . . . . 1075.6.2 Monitoring Process Groups . . . . . . . . . . . . . . . . . . . . . . . . 109
5.7 Hardware Alerting from AIX Error Report . . . . . . . . . . . . . . . . . . 1125.7.1 Creating the Sentry Asynchronous Monitor Script . . . . . . . . . . . 1125.7.2 Installing the Error Notification Method . . . . . . . . . . . . . . . . . 113
5.8 Generic File System Monitoring . . . . . . . . . . . . . . . . . . . . . . . . 1155.8.1 Monitoring with Systems Monitor . . . . . . . . . . . . . . . . . . . . 1155.8.2 Monitoring with and/or Migration to Sentry . . . . . . . . . . . . . . . 115
5.9 SNMP Proxy Forwarding . . . . . . . . . . . . . . . . . . . . . . . . . . . . 1185.9.1 Monitoring with Systems Monitor . . . . . . . . . . . . . . . . . . . . 1195.9.2 SNMP Monitoring with and/or Migration to Sentry . . . . . . . . . . 119
5.10 Migrating Data Collection . . . . . . . . . . . . . . . . . . . . . . . . . . . 1245.10.1 Installing the Data Collection Function . . . . . . . . . . . . . . . . . 1255.10.2 Collecting Monitor Data . . . . . . . . . . . . . . . . . . . . . . . . . . 1255.10.3 Extracting Logged Data from the Command Line . . . . . . . . . . 127
Chapter 6. Installation Notes and Trouble Shooting . . . . . . . . . . . . . . . 1316.1 Installation Notes . . . . . . . . . . . . . . . . . . . . . . . . . . . . . . . . . 131
6.1.1 Installation of the TME 10 Framework . . . . . . . . . . . . . . . . . . 1316.1.2 Notes on Backup and Restore . . . . . . . . . . . . . . . . . . . . . . 1326.1.3 TME 10 NetView Installation . . . . . . . . . . . . . . . . . . . . . . . . 1326.1.4 Systems Monitor Setup . . . . . . . . . . . . . . . . . . . . . . . . . . . 132
6.2 Problems and Resolutions . . . . . . . . . . . . . . . . . . . . . . . . . . . 1326.2.1 TME Installation Revision Levels . . . . . . . . . . . . . . . . . . . . . 1326.2.2 Sentry Engine Not Running . . . . . . . . . . . . . . . . . . . . . . . . 1336.2.3 Sentry Monitors Not Working . . . . . . . . . . . . . . . . . . . . . . . 1336.2.4 Other Problems . . . . . . . . . . . . . . . . . . . . . . . . . . . . . . . 134
Appendix A. Mapping SIA MIB Objects to Sentry Monitoring Collections . . 137
Appendix B. How to Get the Samples in This Book . . . . . . . . . . . . . . . 141
Appendix C. Special Notices . . . . . . . . . . . . . . . . . . . . . . . . . . . . 143
Appendix D. Related Publications . . . . . . . . . . . . . . . . . . . . . . . . . 145D.1 International Technical Support Organization Publications . . . . . . . . 145
iv Migrating from Systems Monitor to TME 10 Distributed Monitoring

This soft copy for use by IBM employees only.
D.2 Redbooks on CD-ROMs . . . . . . . . . . . . . . . . . . . . . . . . . . . . . 145D.3 Other Publications . . . . . . . . . . . . . . . . . . . . . . . . . . . . . . . . 145
How To Get ITSO Redbooks . . . . . . . . . . . . . . . . . . . . . . . . . . . . . 147How IBM Employees Can Get ITSO Redbooks . . . . . . . . . . . . . . . . . . 147How Customers Can Get ITSO Redbooks . . . . . . . . . . . . . . . . . . . . . 148IBM Redbook Order Form . . . . . . . . . . . . . . . . . . . . . . . . . . . . . . 149
Index . . . . . . . . . . . . . . . . . . . . . . . . . . . . . . . . . . . . . . . . . . . 151
ITSO Redbook Evaluation . . . . . . . . . . . . . . . . . . . . . . . . . . . . . . . 153
Contents v

This soft copy for use by IBM employees only.
vi Migrating from Systems Monitor to TME 10 Distributed Monitoring

This soft copy for use by IBM employees only.
Figures
1. Systems Monitor and Sentry Components and Functions . . . . . . . . . 2 2. Connections between Systems Monitor Components . . . . . . . . . . . 6 3. The NetView MIB Browser . . . . . . . . . . . . . . . . . . . . . . . . . . . 10 4. The NetView Control Desk . . . . . . . . . . . . . . . . . . . . . . . . . . . . 11 5. A Typical TME 10 NetView Map . . . . . . . . . . . . . . . . . . . . . . . . 12 6. An APM File Monitor Definition . . . . . . . . . . . . . . . . . . . . . . . . . 13 7. TME 10 Systems Monitor Configuration Application . . . . . . . . . . . . 14 8. TME Architecture . . . . . . . . . . . . . . . . . . . . . . . . . . . . . . . . . 15 9. TMR Components . . . . . . . . . . . . . . . . . . . . . . . . . . . . . . . . . 1710. Hierarchy of Profile Managers . . . . . . . . . . . . . . . . . . . . . . . . . 1811. Creating a Monitor . . . . . . . . . . . . . . . . . . . . . . . . . . . . . . . . 2012. Executing a Monitor Action . . . . . . . . . . . . . . . . . . . . . . . . . . . 2113. An Event Pop-Up Message . . . . . . . . . . . . . . . . . . . . . . . . . . . 2214. Sentry Notices . . . . . . . . . . . . . . . . . . . . . . . . . . . . . . . . . . . 2315. Events Sent to the T/EC . . . . . . . . . . . . . . . . . . . . . . . . . . . . . 2316. Events Arriving at TME 10 NetView . . . . . . . . . . . . . . . . . . . . . . 2417. Pieces of the Migration Puzzle . . . . . . . . . . . . . . . . . . . . . . . . . 2618. An Example of the Systems Monitor Configuration Application Main
Panel . . . . . . . . . . . . . . . . . . . . . . . . . . . . . . . . . . . . . . . . 3219. Input for the Migration Script . . . . . . . . . . . . . . . . . . . . . . . . . . 3720. Log File from migrate_sysmon_config . . . . . . . . . . . . . . . . . . . . . 3821. Sentry Profile Generated by migrate_sysmon_config Script . . . . . . . . 3922. An Example of a Migrated File Monitor Table . . . . . . . . . . . . . . . . 3923. An Example of a Migrated Command Script . . . . . . . . . . . . . . . . . 4024. Using the MIB Browser to Check MIB Extension Descriptions . . . . . . 4125. Defining a File System Monitor Using MLM . . . . . . . . . . . . . . . . . 4526. Defining Threshold Actions for MLM . . . . . . . . . . . . . . . . . . . . . 4627. Steps to Create a Sentry Profile . . . . . . . . . . . . . . . . . . . . . . . . 4728. Migration of an MLM Configuration Entry with migrate_sysmon_config . 4829. Monitor Created by migrate_sysmon_config . . . . . . . . . . . . . . . . . 4830. Create Sentry_Administrator . . . . . . . . . . . . . . . . . . . . . . . . . . 5031. TME Desktop Window . . . . . . . . . . . . . . . . . . . . . . . . . . . . . . 5132. Create Rule Base . . . . . . . . . . . . . . . . . . . . . . . . . . . . . . . . . 5133. Copy Default Rule Base to NetView Rule Base . . . . . . . . . . . . . . . 5234. Copy Rule Base . . . . . . . . . . . . . . . . . . . . . . . . . . . . . . . . . . 5235. Importing the Sentry Event Classes . . . . . . . . . . . . . . . . . . . . . . 5336. Import the Sentry Class Definition Files . . . . . . . . . . . . . . . . . . . . 5437. Compile the Rule Base . . . . . . . . . . . . . . . . . . . . . . . . . . . . . 5438. Load the Rule Base . . . . . . . . . . . . . . . . . . . . . . . . . . . . . . . 5539. Loading the Rule Base . . . . . . . . . . . . . . . . . . . . . . . . . . . . . . 5540. Adding Source . . . . . . . . . . . . . . . . . . . . . . . . . . . . . . . . . . . 5641. Adding an Event Group . . . . . . . . . . . . . . . . . . . . . . . . . . . . . 5742. Add Sentry Event Group . . . . . . . . . . . . . . . . . . . . . . . . . . . . . 5743. Setting Event Group FIlters . . . . . . . . . . . . . . . . . . . . . . . . . . . 5844. Assigning Event Group to Console . . . . . . . . . . . . . . . . . . . . . . . 5945. Assigning Event Group to Sentry_Admin Console . . . . . . . . . . . . . . 5946. TME 10 Distributed Monitoring Events Reaching the T/EC . . . . . . . . . 6047. Event Slots of a Received Event . . . . . . . . . . . . . . . . . . . . . . . . 6148. An Example of Sending an Alert to NetView Using the event Command 6249. NetView_event_proxy Script . . . . . . . . . . . . . . . . . . . . . . . . . . . 6350. NetView Event Generated from a Sentry Monitor . . . . . . . . . . . . . . 64
Copyright IBM Corp. 1997 vii

This soft copy for use by IBM employees only.
51. SNMP_trap_proxy script . . . . . . . . . . . . . . . . . . . . . . . . . . . . . 6552. Example of Using an SNMP Proxy . . . . . . . . . . . . . . . . . . . . . . . 6653. Print Queue Monitoring and Restart Script . . . . . . . . . . . . . . . . . . 6754. Run Program startsrc . . . . . . . . . . . . . . . . . . . . . . . . . . . . . . 6855. Running a TME Task from a Sentry Monitor Using wruntask . . . . . . . 6956. Selecting a Task to Execute . . . . . . . . . . . . . . . . . . . . . . . . . . . 6957. Adding a Monitor to Watch the lpd Daemon . . . . . . . . . . . . . . . . . 7158. Defining User and Group ID for a Monitor . . . . . . . . . . . . . . . . . . 7159. Setting IDs . . . . . . . . . . . . . . . . . . . . . . . . . . . . . . . . . . . . . 7260. Creating a Task . . . . . . . . . . . . . . . . . . . . . . . . . . . . . . . . . . 7261. Editing a Task . . . . . . . . . . . . . . . . . . . . . . . . . . . . . . . . . . . 7362. tll File with Changes . . . . . . . . . . . . . . . . . . . . . . . . . . . . . . . 7463. Extract of wlsmon Output . . . . . . . . . . . . . . . . . . . . . . . . . . . . 7664. Operation of the CPU Monitors . . . . . . . . . . . . . . . . . . . . . . . . . 7765. Output from vmstat Command . . . . . . . . . . . . . . . . . . . . . . . . . 7866. cpuload.sh Script . . . . . . . . . . . . . . . . . . . . . . . . . . . . . . . . . 7967. Running cpuload.sh From a Numeric Script . . . . . . . . . . . . . . . . . 8068. cpustat.sh Script . . . . . . . . . . . . . . . . . . . . . . . . . . . . . . . . . 8169. cpu.msg File . . . . . . . . . . . . . . . . . . . . . . . . . . . . . . . . . . . . 8470. Monitor Definiton File, cpu.csl (Part 1 of 2) . . . . . . . . . . . . . . . . . . 8571. Monitor Definiton File, cpu.csl (Part 2 of 2)) . . . . . . . . . . . . . . . . . 8672. TME 10 Distributed Monitoring Profile . . . . . . . . . . . . . . . . . . . . . 8773. Adding a New Monitor . . . . . . . . . . . . . . . . . . . . . . . . . . . . . . 8874. About This Monitor . . . . . . . . . . . . . . . . . . . . . . . . . . . . . . . . 8875. Options for the Monitor . . . . . . . . . . . . . . . . . . . . . . . . . . . . . 8976. Trigger Options of the Monitor . . . . . . . . . . . . . . . . . . . . . . . . . 8977. Assign an Indicator Collection to the Profile . . . . . . . . . . . . . . . . . 9078. Operation of the Indicator Icon . . . . . . . . . . . . . . . . . . . . . . . . . 9079. Selecting the Graphical Monitoring Task . . . . . . . . . . . . . . . . . . . 9280. Graphical View of Historical UNIX CPU Data . . . . . . . . . . . . . . . . . 9381. adsm_script Monitoring Script for Systems Monitor . . . . . . . . . . . . 9582. Systems Monitor Configuration for ADSM File Monitoring . . . . . . . . . 9683. SNMP Trap Generated by ADSM File Monitoring . . . . . . . . . . . . . . 9784. Migrated File Monitor . . . . . . . . . . . . . . . . . . . . . . . . . . . . . . 9885. Pop-up Notification of ADSM Error Message . . . . . . . . . . . . . . . . . 9986. Monitoring Dynamically Named Log Files with Systems Monitor . . . . 10087. First Monitor Extracts Daily Log File . . . . . . . . . . . . . . . . . . . . . 10188. Second Monitor Analyzes Log File for Error Messages . . . . . . . . . 10189. Threshold and Re-Arm Function . . . . . . . . . . . . . . . . . . . . . . . 10290. Creating a Re-Arm-Like Capability with Response Levels . . . . . . . . 10491. An Example of Providing Re-Arm within a Sentry Monitor . . . . . . . . 10592. Defining Monitors to Use the sentry_rearm Script . . . . . . . . . . . . 10693. Shell Script to Check Multiple Processes . . . . . . . . . . . . . . . . . . 10894. Configuration File for check_processes . . . . . . . . . . . . . . . . . . . 10895. Example of Monitoring Process Groups, Database Processes . . . . . 11096. process.msg File . . . . . . . . . . . . . . . . . . . . . . . . . . . . . . . . 11097. process.csl File . . . . . . . . . . . . . . . . . . . . . . . . . . . . . . . . . 11198. Definition of the Asynchronous Monitor Using Channel errpt . . . . . . 11399. New Method for AIX Error Notification . . . . . . . . . . . . . . . . . . . 113100. Sentry Alert Caused by Alertable AIX Error Report Entry . . . . . . . . 114101. sentry_filecheck Script (Part 1 of 2) . . . . . . . . . . . . . . . . . . . . . 116102. sentry_filecheck Script (Part 2 of 2) . . . . . . . . . . . . . . . . . . . . . 117103. Using the All Filesystems Monitor . . . . . . . . . . . . . . . . . . . . . . 118104. Alert from All Filesystems Monitor . . . . . . . . . . . . . . . . . . . . . . 118105. SNMP Monitor Using Symbolic Names . . . . . . . . . . . . . . . . . . . 119
viii Migrating from Systems Monitor to TME 10 Distributed Monitoring

This soft copy for use by IBM employees only.
106. User-Specified SNMP Monitor . . . . . . . . . . . . . . . . . . . . . . . . 120107. Creating a Sentry Proxy Endpoint . . . . . . . . . . . . . . . . . . . . . . 121108. Setting the Environment for Sentry Proxy Endpoint . . . . . . . . . . . . 122109. Sentry Profile for Proxy Monitoring . . . . . . . . . . . . . . . . . . . . . 123110. Sentry Proxy Endpoint WIndow . . . . . . . . . . . . . . . . . . . . . . . . 124111. Indicator Collection Messages . . . . . . . . . . . . . . . . . . . . . . . . 124112. Defining an Always Response . . . . . . . . . . . . . . . . . . . . . . . . 125113. Defining the Logging Task . . . . . . . . . . . . . . . . . . . . . . . . . . . 126114. Examples of the wgdread Command . . . . . . . . . . . . . . . . . . . . 128115. convert_times Perl Script . . . . . . . . . . . . . . . . . . . . . . . . . . . 128116. Extracting Historical Data with Date and Time Conversion . . . . . . . 129117. sentry_cleanup Script . . . . . . . . . . . . . . . . . . . . . . . . . . . . . 135
Figures ix

This soft copy for use by IBM employees only.
x Migrating from Systems Monitor to TME 10 Distributed Monitoring

This soft copy for use by IBM employees only.
Preface
This redbook describes the evolution of TME 10 Distributed Monitoring(previously known as Tivoli/Sentry), the Tivoli Management Environmentapplication for monitoring the behavior of remote systems.
The redbook shows how to migrate from the previous SystemView monitoringapplication, Systems Monitor for AIX, and explains the different capabilities ofthe old and new approaches. It will help you position TME 10 DistributedMonitoring and TME 10 as a solution for enterprise systems management.
Numerous practical examples are used to illustrate the migration process and toshow the capabilities of the latest version of TME 10 Distributed Monitoring.
All scenarios in this redbook are documented in a way that service providerscan use the examples as a base for client implementations.
The Team That Wrote This RedbookThis redbook was produced by a team of specialists from around the worldworking at the Systems Management and Networking ITSO Center, Raleigh.
Rob Macgregor is a technical specialist at the Systems Management andNetworking ITSO Center, Raleigh. He writes extensively and teaches IBMclasses worldwide on systems management and network security. Beforejoining the ITSO three years ago, Rob worked in the UK technical support center,dealing with network and systems management products.
Stefan Uelpenich is an Advisory ITSO Representative, working as a projectleader at the Systems Management and Networking ITSO Center, Raleigh. Hewrites extensively and teaches IBM classes worldwide on all areas of systemsmanagement. Before joining the ITSO, he worked in IBM Germany′sProfessional Services organization as an Advisory I/T Architect for SystemsManagement, consulting major IBM customers.
Andreas Kuffer is a systems management specialist in IBM Germany. He hasthree years of industry experience in the area of UNIX and networking. Hisareas of expertise include UNIX system administration and open networkmanagement.
Peter Glasmacher is a Consultant in IBM Germany. He has about 15 years ofexperience in networking, focusing on systems management for the last sevenyears. He has worked at IBM for 24 years. His areas of expertise includenetwork design/implementation, security consulting and design/implementationin the Systems Management arena.
Graeme Naysmith is an Advisory I/T Specialist working in Warwick, England. Hejoined IBM in 1985 and has four years AIX/UNIX monitoring and automationexperience. His areas of expertise include network and systems management.Graeme is currently involved in the migration of SystemView applications to theTME 10 product set.
Thanks to the following people for their invaluable contributions to this project:
Copyright IBM Corp. 1997 xi

This soft copy for use by IBM employees only.
David Boone, Linda Robinson, Shawn Walsh, Gail Wojton and Paul BraunSystems Management and Networking ITSO Center, Raleigh
Greg Kattawar, Astrid Burnette, Sean Starke and Carol CorleyTivoli Systems, Austin
Comments WelcomeYour comments are important to us!
We want our redbooks to be as helpful as possible. Please send us yourcomments about this or other redbooks in one of the following ways:
• Fax the evaluation form found in “ITSO Redbook Evaluation” on page 153 tothe fax number shown on the form.
• Use the electronic evaluation form found on the Redbooks Web sites:
For Internet users http://www.redbooks.ibm.comFor IBM Intranet users http://w3.itso.ibm.com
• Send us a note at the following address:
xii Migrating from Systems Monitor to TME 10 Distributed Monitoring

This soft copy for use by IBM employees only.
Chapter 1. TME 10 Distributed Monitoring Overview
In this chapter we discuss the products that make up TME 10 DistributedMonitoring as they appeared before the Tivoli merger, now (July 1997), andforward into the future. We will limit the discussion to distributed managementin open, heterogenous environments. The Netview/390 product is not discussedin this redbook.
1.1 Distributed Monitoring HistoryBefore the Tivoli merger, IBM provided distributed monitoring capabilities withits SystemView product. For heterogenous environments, NetView for AIX andIBM Systems Monitor provided the tools and applications for distributedmanagement based on the Simple Network Management Protocol (SNMP).SNMP is an IP based protocol and, although some SystemView applicationsimplemented SNMP on other transports, Systems Monitor was limited to TCP/IPnetworks only. Systems Monitor was in three parts:
1. The System Information Agent (SIA), which provided system instrumentationand file monitoring functions.
2. The Mid-Level Manager (MLM), which provided SNMP polling, thresholding,automation and event filtering.
3. The System-Level Manager (SLM), which provided the MLM function locallyon a system with the SIA also installed.
Meanwhile, Tivoli systems had developed the Tivoli Management Environment(TME), an implementation of the Common Object Request Broker Architecture(CORBA) optimized for systems management tasks. Built on the TME baseplatform are a number of applications for distributed system deployment,administration and monitoring. The primary monitoring application was calledTivoli/Sentry. Sentry used the framework to distribute system thresholddefinitions to monitoring code located on the target systems. The frameworkalso provides facilities for alerting administrators about the status of monitorsand executing automation tasks.
Apart from the different mechanisms used by the two products for control andalerting, there are also significant philosophical differences. Systems MonitorSIA is embedded into the system, directly accessing performance and statusinformation and exposing it in the form of an SNMP MIB. Sentry, on the otherhand, is designed to tread softly on its host system. It gets the information for itsmonitors from commands and interfaces provided by the system andapplications, instead of going under the covers to get the data. This approachmay be less efficient than the embedded method, but it is much less prone tofailure due to system changes.
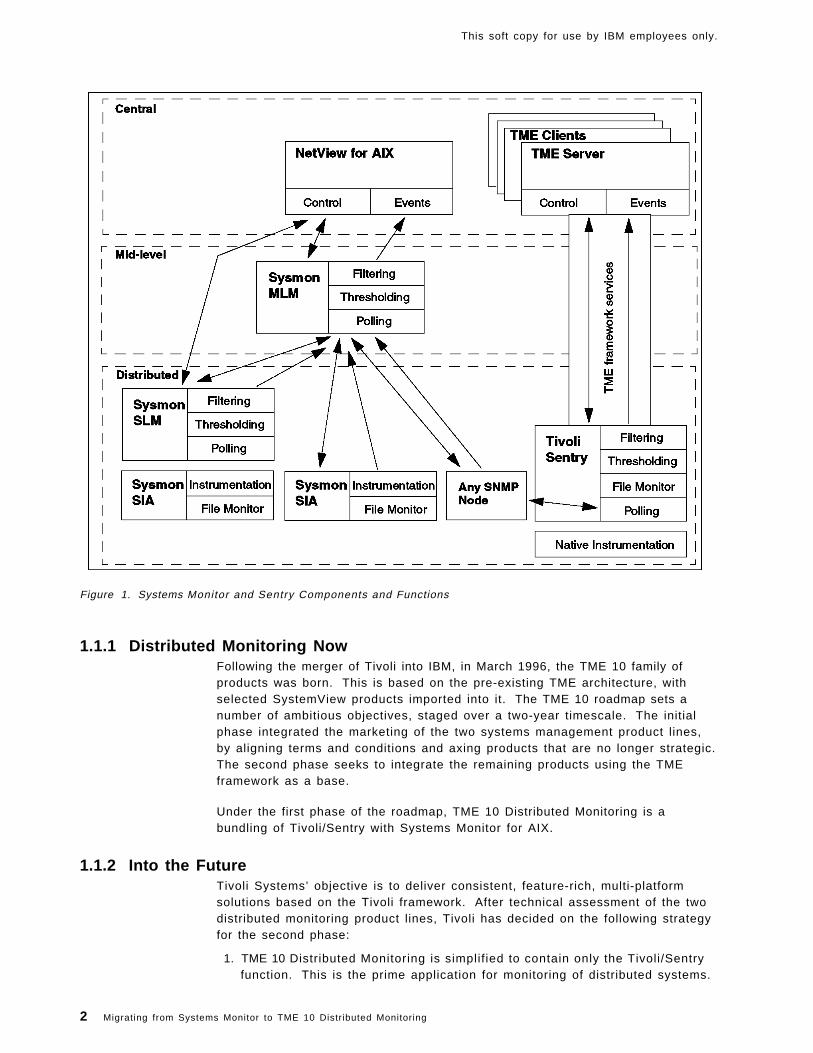
Figure 1 on page 2 shows the relationships between the different components ofSystems Monitor and Sentry and the functions that each performs.
Copyright IBM Corp. 1997 1
This soft copy for use by IBM employees only.
Figure 1. Systems Monitor and Sentry Components and Functions
1.1.1 Distributed Monitoring NowFollowing the merger of Tivoli into IBM, in March 1996, the TME 10 family ofproducts was born. This is based on the pre-existing TME architecture, withselected SystemView products imported into it. The TME 10 roadmap sets anumber of ambitious objectives, staged over a two-year timescale. The initialphase integrated the marketing of the two systems management product lines,by aligning terms and conditions and axing products that are no longer strategic.The second phase seeks to integrate the remaining products using the TMEframework as a base.
Under the first phase of the roadmap, TME 10 Distributed Monitoring is abundling of Tivoli/Sentry with Systems Monitor for AIX.
1.1.2 Into the FutureTivoli Systems’ objective is to deliver consistent, feature-rich, multi-platformsolutions based on the Tivoli framework. After technical assessment of the twodistributed monitoring product lines, Tivoli has decided on the following strategyfor the second phase:
1. TME 10 Distributed Monitoring is simplif ied to contain only the Tivoli/Sentryfunction. This is the prime application for monitoring of distributed systems.
2 Migrating from Systems Monitor to TME 10 Distributed Monitoring
This soft copy for use by IBM employees only.
2. Systems Monitor Mid-Level Manager (MLM) is retained and becomes acomponent of TME 10 NetView for AIX. MLM is designed to perform pollingand network discovery on behalf of NetView. This decision affirms its role asthe key to improving the scalability of NetView.
3. Systems Monitor System Level Manager (SLM) and System InformationAgent (SIA) are withdrawn. SIA will be available for download from theWorld Wide Web for several months to assist migration.
The objective of this book is to describe how to migrate from Systems Monitor toTME 10 Distributed Monitoring. We describe a methodology for planning andimplementing the migration process and show examples of using TME 10Distributed Monitoring in various configurations. But first we describe how thetwo products work.
Chapter 1. TME 10 Distributed Monitoring Overview 3

This soft copy for use by IBM employees only.
4 Migrating from Systems Monitor to TME 10 Distributed Monitoring

This soft copy for use by IBM employees only.
Chapter 2. Systems Monitor in Detail
In this chapter we describe the detailed operations of Systems Monitor. If youare familiar with the product you may wish to skip this section. If, however, youdo not understand the detailed operation of it we recommend studying thissection, because otherwise the migration details in Chapter 4, “MigrationMethodology and Tools” on page 25 will not make sense.
2.1 SNMPWe already mentioned in 1.1, “Distributed Monitoring History” on page 1, thatSystems Monitor uses SNMP as its management protocol. The SNMP protocoldefines a manager/agent relationship and a group of commands to retrieveinformation from agents running on managed nodes.
SNMP-based systems management uses a client/server approach.
• The manager (client)
A manager acts as a client application that controls its management domain,usually nodes within a TCP/IP-based network, and performs monitoringtasks.Typical SNMP managers are TME 10 NetView and TME 10 NetView MidLevel Manager (formerly IBM Systems Monitor MLM). Managers control thenetwork by polling remote nodes for system information and status. Inaddition a manager is capable of receiving asynchronous events calledtraps. Based on the polled or received information, the manager applicationexecutes defined actions such as operator notification or restart actions.
• The agent (server)
An agent provides information to the Manager. It is responsible forrecording and maintaining system data that can be retrieved by the managerusing the polling mechanism described above. In addition, the agent maywarn of critical conditions by sending traps to the manager application.
Although it is common to refer to the whole management process as SNMP, infact SNMP refers only to the protocol used to communicate between agent andmanager. SNMP stands for Simple Network Management Protocol. SNMPdefines the relation between agent and manager and provides the commands toget information from the agent and set certain data.
SNMP polling requests reference an abstract database, called the ManagementInformation Base, or MIB. The MIB defines a hierarchy of managed objects.When the SNMP manager polls for (using an SNMP GET request) the value of aMIB object, the SNMP agent is responsible for returning the value of it as aresponse. In fact, the value that is returned is of an instance of the object. Anobject can have multiple instances, thereby allowing tabular information to bemaintained. Updates are handled in the same fashion; the manager specifiesthe new value of a MIB instance in an SNMP SET request and the agent isresponsible for updating the managed system.
Originally, SNMP was introduced to perform network management. Thus, thebasic MIB provided with most SNMP agents concentrates on network-relatedinformation and the data that is useful for systems management purposes is verylimited. Fortunately, the MIB structure permits you to extend its scope without
Copyright IBM Corp. 1997 5

This soft copy for use by IBM employees only.
limit, so it is possible to create an SNMP agent that will handle any type ofinformation you choose. Sometimes this is achieved by rewriting the agentcode, but normally an SNMP agent implements a subagent interface. This is anAPI that allows extension code to be plugged into the base agent to provideextended MIB support. There are several different subagent interface flavors.The most common are the Distributed Programming Interface (DPI) and theSNMP Multiplexor (SMUX).
2.2 Systems Management with NetView for AIX and Systems MonitorTo allow systems management based on SNMP, various elements are involved.Figure 2 shows the flow between the different parts of a distributed managementenvironment using IBM Systems Monitor MLM and SIA and TME 10 NetView.
Figure 2. Connections between Systems Monitor Components
The elements of a Systems Monitor distributed monitoring environment are:
• NetView for AIX
• Systems Monitor MLM
• Systems Monitor SIA
• Systems Monitor SLM
• Systems Monitor Configuration Application (smconfig)
6 Migrating from Systems Monitor to TME 10 Distributed Monitoring

This soft copy for use by IBM employees only.
2.2.1 TME 10 NetViewNetView for AIX (now called TME 10 NetView) is the SNMP Manager and focalpoint for distributed networks. It provides a graphical end user interface.NetView is capable of discovering new nodes in a network and producesgraphical representations of the network, called maps. You can perform limitedsystems management tasks with NetView for AIX. NetView for AIX also providesthe base function for the Systems Monitor graphical user interface, smconfig,which allows you to configure MLM, SLM and SIA agents from a central point.
2.2.2 System Information Agent (SIA)The System Information Agent (SIA) is an SNMP SMUX Subagent. The SIAextends the standard MIB database by adding large numbers of system-relatedvariables. These variables are dependent on the system where the SIAexecutes. System Information Agents are available for the following platforms:
• AIX• OS/2• SunOS• SUN-Solaris• HP-UX• NCR UNIX
The SIA MIB differs in the quantity of information it can provide depending on theplatform it is running on. In addition, SIA can send traps to any SNMP manageror to the Systems Monitor SLM or MLM. Note that the SIA does not, itself, haveany management capability, in the sense of querying the MIB for thresholdingand data collection. Systems Monitor provides the SLM and MLM to performthese functions in a distributed way.
2.2.2.1 SIA MIB Field MeaningsThe SIA has a large extended MIB. For effective system management, we haveto select the most useful objects from it. The following table describes thedifferent groups within the SIA MIB and summarizes their functions. Thecommand column shows the command that could be issued locally to find theinformation provided by the MIB variable.
Chapter 2. Systems Monitor in Detail 7

This soft copy for use by IBM employees only.
Table 1. SIA MIB Tables
8 Migrating from Systems Monitor to TME 10 Distributed Monitoring

This soft copy for use by IBM employees only.
2.2.2.2 SIA File Monitor and Command TablesTwo other important functions of SIA are the File Monitor table and theCommand table. The File Monitor table allows you to monitor the characteristicsof a file for changes and also to monitor the data in a file searching for specificstrings. The Command table allows you to extend the data provided by the SIAby executing any line command. The output from the command is returned asthe response to an SNMP get request.
2.2.3 Mid Level Manager (MLM)The TME 10 NetView Mid Level Manager (formerly IBM System Monitor MidLevel Manager) is a distributed Network Manager. It collects information andreceives traps from any other SNMP agent (not only SIAs). It providesthresholding and filtering functions so that you can use MLM to poll for problemsand then send them as SNMP traps to a central SNMP manager, or takeautomated action. Other significant capabilities of the MLM are its polling anddiscovery features. The MLM can poll a group of nodes for status purposes anddiscover new nodes in its subnet. This reduces the load on TME 10 NetView andallows a true distributed management of SNMP nodes.
Although Figure 2 on page 6 shows the monitored node as a Systems MonitorSIA agent, in fact any node with a standard or extended SNMP agent can bemonitored using MLM.
2.2.4 System Level Monitor (SLM)The System Level Monitor (SLM) runs on a node where the SIA is installed andoffers thresholding, analysis and filtering of information for that local node.Functionally, the SLM is identical to the MLM, except for the followingrestrictions:
1. Node discovery is not supported.
2. Status monitoring of remote nodes is not supported.
3. Thresholding is only performed on the local node.
4. Trap reception from another node is not possible.
2.2.5 Systems Monitor’s Use of SNMPAs you can see, all components of Systems Monitor use SNMP to exchangeinformation:
• Both NetView and MLM use SNMP get requests to poll MIB variables fromtheir managed agents.
• NetView and the GUI component of Systems Monitor, smconfig, use SNMPset requests to configure and control the MLM and SLM. SNMP set requestsare also used to configure the Command table and File Monitor table of theSIA.
SNMP agents, which are required on both manager and agent nodes, use trapsto send unsolicited information to their assigned manager. In case of an MLMbeing the manager, these traps can be forwarded to an upper-level managersuch as NetView or used to trigger systems management actions on behalf ofthe MLM. This allows, in addition to the MLMs polling capabilities, some offloadof management tasks to a local network segment, reducing the requiredbandwidth.
Chapter 2. Systems Monitor in Detail 9

This soft copy for use by IBM employees only.
Systems Monitor applications offer various ways to access, display and processthe collected data. We will discuss the different ways to work in an SNMP-baseddistributed environment.
2.3 Using TME 10 NetView and Systems Monitor ToolsThere are a number of tools for monitoring and controlling a Systems Monitorconfiguration:
MIB Browser A MIB Browser lets you browse and set MIB variables ona target node. You can enter the address of a node youwant to examine directly into the browser dialog or youmay select a node in one of NetView’s graphical networkrepresentations (maps). TME 10 NetView comes with anintegrated MIB Browser, giving you a dialog like the one inFigure 3, which can be used in conjunction with severalother features of TME 10 NetView.
Figure 3. The NetView MIB Browser
Control Desktop The control desktop is the final sink for traps forwarded toTME 10 NetView. By default, all traps received by TME 10NetView that are not directly intercepted by other TME 10NetView applications will be directed to the controldesktop. The control desktop offers various filtercapabilities. In addition you may launch more than one
10 Migrating from Systems Monitor to TME 10 Distributed Monitoring

This soft copy for use by IBM employees only.
desktop and direct filtered trap information to thosedesktops.
Figure 4. The NetView Control Desk
NetView Maps The main TME 10 NetView tool you will use is its variousgraphical representations of the network. NetViewdisplays the entire network it discovers in a group ofmaps. These maps show the status of the nodes in yournetwork and are updated dynamically. TME 10 NetViewinserts newly discovered nodes into the correct maps.TME 10 NetView then display the node symbol in differentcolors according to the actual status of the node, asdetermined by regular polling.
Chapter 2. Systems Monitor in Detail 11

This soft copy for use by IBM employees only.
Figure 5. A Typical TME 10 NetView Map
APM APM, short for Agent Policy Manager, is another usefulapplication of TME 10 NetView. You can customize TME 10NetView to automatically detect MLMs in your network anddistribute managment duties automatically to those MLMs.If you decide to do so, NetView will offload discovery andstatus polling to discovered MLM nodes. You can offloadstatus polling, discovery or both. TME 10 NetView thenreceives every change in the subnet controlled by an MLMvia traps. In a distributed environment, where MLMscontrol subnets, APM helps you to distribute monitorsacross the network. APM provides you with dialogs todefine SIA file monitors and MLM/SLM thresholddefinitions for groups of nodes. These groups are actuallydynamic node collections. You define the collections byspecifying the characteristics that nodes in the groupshare. APM will apply the monitors you define to thecurrent group of nodes in the collection and will update allof them whenever you change the monitor definitions. Itwill also apply the current monitor set to any nodes thatare dynamically added to the node collection. Figure 6 onpage 13 shows a typical APM configuration screen,defining a file monitor on a collection of SIA nodes.
12 Migrating from Systems Monitor to TME 10 Distributed Monitoring

This soft copy for use by IBM employees only.
Figure 6. An APM File Monitor Definit ion
smconfig The configuration details as well as the thresholds andmonitors you define are held in a configuration file on thetarget node where Systems Monitor components reside.APM provides one way to update the configuration from acentral point. Systems Monitor also provides a graphicaluser interface, the Systems Monitor ConfigurationApplication (see Figure 7 on page 14).
.
Chapter 2. Systems Monitor in Detail 13

This soft copy for use by IBM employees only.
Figure 7. TME 10 Systems Monitor Configuration Application
This GUI is the easiest way to update the configuration of individual SystemsMonitor agent nodes. The configuration information itself is organized into MIBtables and the GUI provides separate dialogs for each of the tables.
This has been a very brief introduction to the functions and components ofSystems Monitor. For more details about the product and examples of its use,refer to IBM Systems Monitor Anatomy of a Smart Agent, SG24-4398.
14 Migrating from Systems Monitor to TME 10 Distributed Monitoring

This soft copy for use by IBM employees only.
Chapter 3. TME 10 Distributed Monitoring in Detail
In this chapter we describe the detailed operations of TME 10 DistributedMonitoring (previously called Tivoli/Sentry). If you are familiar with the productyou may wish to skip this section. If, however, you do not understand thedetailed operation of it we recommend studying this section, because otherwisethe migration details in Chapter 4, “Migration Methodology and Tools” onpage 25 will not make sense.
TME 10 Distributed Monitoring provides monitoring functions for a range of UNIXplatforms plus Windows NT. In the latest release (TME 10 Distributed Monitoring3.5) it also supports Novell NetWare R3 and R4 servers. Sentry is based on theTivoli Management Environment and it uses TME functions for many operations,such as deploying monitors to distributed systems, defining monitoring policiesand sending events.
To have a good understanding of any TME application, you need to understandthe function provided by the TME platform. We briefly introduce the platformhere, but for a fuller treatment you may want to refer to TME 10 Cookbook forAIX, SG24-4867 or Understanding Tivoli′s TME 3.0 and TME 10, SG24-4948.
3.1 Introduction to the Tivoli Management EnvironmentThe Tivoli Management Environment (TME) contains a distributed object-orientedinfrastructure, a set of tightly integrated systems management applications, anda set of interfaces. The interfaces include a GUI for simple control, an extensivecommand line interface that makes it easy to perform batch operations andautomation, and a set of APIs to allow other applications to be integrated intothe framework.
Figure 8 shows a schematic view of TME.
Figure 8. TME Architecture
The Tivoli Management Framework, also referred to as the platform isfundamental to everything that a TME application does. It is a distributed object
Copyright IBM Corp. 1997 15

This soft copy for use by IBM employees only.
request broker (ORB) implementation, based on the Common Object RequestBroker (CORBA) standard. An object request broker is a function that allowsobject-oriented programming techniques to be applied in a distributedenvironment. The benefit of an object-oriented approach for heterogeneoussystems management is that the real world configuration can be masked. Anapplication just needs to know the interface definition of an object (the data itexposes and the methods it provides). The problems of implementing themethod on NT or Solaris or AIX or whatever are encapsulated within the objectitself.
In addition to the base ORB functions, the TME framework provides a number ofother services, for example:
• Administration functions
• Security (authentication and access control)
• Transaction control
• Packaging and distribution functions
It is these capabilities that make TME a specialized systems managementenvironment. As we go on to describe the operation of Sentry you will see howthe platform functions simplify the creation of an application.
3.1.1 Tivoli Management RegionsWe have said that TME provides a distributed framework for systemsmanagement applications, but how does that look in practice? Systems withinthe framework are placed within Tivoli Management Regions (TMRs). A TMR iscomprised of one server system and a number of clients, or managed nodes.Each system runs an object request broker (the oserv daemon), and anapplication on one system within the TMR can invoke a function on any othersystem by using the ORB services.
For many operations, all the systems in the TMR are peers. Why, then, is onedesignated as the TMR server? The answer is that certain key functions requirea single point of reference, which the server provides. The main functionsprovided by the server are object location services and security controls. Someapplications also use the server as a default location if they have data or codethat does not need to be present in all managed nodes.
Practical considerations limit the number of managed nodes within a TMR toabout 200. To manage a larger population of nodes, TMRs have to beinterconnected. The TMR server is responsible for communicating with theserver in an adjacent TMR.
The TME platform is a sizeable piece of code, which may not be desirable orpossible to run on every system you want to manage. To deal with this case,you can use PC managed nodes. A PC managed node is a small piece of codethat runs on NetWare, OS/2, and all types of Windows systems. It implements asimple endpoint function for the most commonly required TME applications,software distribution and in certain cases user administration.
Although the PC managed node meets the basic requirements for desktopsystems, it is not very flexible and it introduces some problems of security andmaintainability. The answer, which will appear throughout the Tivoli productrange during 1997, is the Lightweight Client Framework (LCF). This provides
16 Migrating from Systems Monitor to TME 10 Distributed Monitoring

This soft copy for use by IBM employees only.
support for many of the Tivoli APIs, but does so with a minimal disk footprint andwithout any installation or pre-definition required. Figure 9 on page 17 showshow TMRs are put together.
Figure 9. TMR Components
3.1.2 Administrators and Policy RegionsIf you want to use any of the Tivoli applications you need an administrator ID.This ID is not a regular system ID, although TME uses a standard system user IDand password to provide authentication. In other words, you prove yourcredentials by providing your system ID and password. TME then maps that IDonto an administrator ID. What this means is that you may have root access toone of the systems in the TMR, but that does not necessarily give you any TMEauthorization. Conversely, you can perform tasks that would normally need rootaccess using a regular personal user ID, if your TME access permits it.
Access controls in TME are very granular. Every object (whether a realresource, such as a managed node, or a logical entity, such as a file package ora system monitor) is created within a Policy Region. Each administrator holdsspecific authorization roles within the policy region. So, for example, anadministrator may have authority to update Sentry monitors on one group ofsystems, but not on another.
Chapter 3. TME 10 Distributed Monitoring in Detail 17

This soft copy for use by IBM employees only.
Authorization roles are also applied at the TMR level. If you have a particularrole in the TMR, it overrides your authorization at the policy region level.
3.1.3 Management by SubscriptionWith Systems Monitor it is possible to modify the monitors for an individualsystem, so that all systems can be different. It is also possible to use APM toset a monitoring policy and apply it to a group of nodes (see 2.3, “Using TME 10NetView and Systems Monitor Tools” on page 10). By contrast, in TME, allapplications are configured based on policy.
The way this works is a concept called management by subscription. Allapplication functions are configured using profiles in the oserv database. Thecontents of a profile depend on the application that created it. For example, aTME 10 Distributed Monitoring profile would contain system monitoring details,whereas a TME 10 Software Distribution profile would contain file packagedescriptions. Profiles are contained in objects called profile managers. Nodescan be subscribed to these profile managers and, when a profile is distributed, itis applied to all of the subscribed nodes.
You can also create hierarchies of profile managers, by subscribing one profilemanager to another. This provides a very flexible way to have centralizedmanagement for some elements of a system and distributed management forothers. Figure 10 shows an example of an organization that has a number ofworkstations. There are some Sentry monitors that are applied to all of theworkstations. However, some parts of the organization have specific monitoringrequirements. The Finance department, for example, uses an RDBMS, so theywant monitors to check that it is running correctly. Over in the Researchdepartment they run memory intensive analyses, so they need to keep an eye onswapping activity. The hierarchy in the diagram allows this environment to becreated with minimum effort, each monitor and each node subscription beingdefined only once.
Figure 10. Hierarchy of Profi le Managers
18 Migrating from Systems Monitor to TME 10 Distributed Monitoring

This soft copy for use by IBM employees only.
3.2 Inside TME 10 Distributed MonitoringTME 10 Distributed Monitoring gives you the capability to create monitors formany different aspects of a TME managed node. It is installed like any otherTME application, by selecting Desktop , Install and then Product from the TMEdesktop or using the winstall command. This installs a number of components.The main ones are:
• The Sentry engine. This is the process that actually performs the monitoring.All monitors are executed locally on the managed node (except for thespecial case of proxy monitors). The Sentry engine is a timer-drivenprogram that runs as a background task (as a daemon in the case of UNIX,as a service on NT). Every minute it wakes up and processes any monitorsthat are queued for execution at that time.
• Endpoint classes. These are object classes and methods that are installedand run on the managed node and are responsible for updating the Sentryengine whenever monitor changes are distributed.
• Kennel classes. These are object classes and methods that are installed onthe server. They perform the defined actions when a Sentry monitor hits athreshold.
Each monitor is in the form of a command or program that returns a result. Themonitor result is tested against a number of threshold levels, any of which canhave actions associated with it. There are three error threshold levels, namedwarning, severe, and critical in order of increasing scariness. There is one otherlevel defined: normal triggers an action when the result does not indicate aproblem. Finally, there is a threshold level named always that is triggeredregardless of the test result. It would be possible for a single monitor to includedefinitions for all of these threshold levels, but normally only one or two of themare appropriate. In these cases the other levels can be left undefined.
When a monitor triggers a threshold there are a number of actions available:
• An administrator can be notified, via a TME notice or pop-up message.
• An indicator can be set on the TME desktop.
• An event can be sent to the TME 10 Enterprise Console.
• Automated action can be taken, such as a program or a TME task.
3.2.1.1 Monitoring CollectionsSentry can monitor UNIX, NT and NetWare systems. Although the TivoliManagement Environment provides a consistent way to invoke monitoring,regardless of the system platform, the monitors themselves differ from oneplatform to another. Sentry reflects these variations by placing monitors intogroups called Monitoring Collections. Each collection contains a group of relatedmonitor definitions. You have to install the collections you need, dependent onthe types of systems you want to manage and the applications they are running.
The monitoring collections are defined in the oserv database on the server only.When a monitor is distributed the code appropriate to the particular platform issent to the managed node for processing.
Chapter 3. TME 10 Distributed Monitoring in Detail 19

This soft copy for use by IBM employees only.
3.3 Under the Covers of TME 10 Distributed MonitoringLet us now look in some more detail at the way that Sentry operates. We willdivide the operation into two steps:
1. Creating a monitor
2. Executing a monitor
3.3.1 Creating a MonitorFigure 11 shows how a monitor is instantiated on a managed node.
Figure 11. Creating a Monitor
1. The administrator creates a monitor profile using the GUI or the waddmonCLI command. The profile can contain multiple monitor definitions. Eachmonitor is actually an instance of an object class, stored in the server oservdatabase.
2. The administrator distributes the profile, either directly or by scheduling it asa background task. The TME platform provides facilities for creating anddistributing Change Control Management System (CCMS) profiles, which areeffectively a package of code and data containing the instructions for the newmonitor. Because this process is using a standard platform function, it canbenefit from features such as mdist (multiplexed distribution), which willreduce network load and minimize repeated transmissions.
20 Migrating from Systems Monitor to TME 10 Distributed Monitoring

This soft copy for use by IBM employees only.
3. The distribution process kicks off the monitor installation by invoking aSentry endpoint method on the target managed node.
4. The endpoint method updates the Sentry engine with the new monitor profile.
3.3.1.1 Executing a MonitorSentry monitors start to operate as soon as they are installed in the Sentryengine. The minimum polling interval is one minute, so the Sentry engine wakesup at one minute intervals and looks to see what monitors are waiting in thatparticular time slot. It is possible to overload the Sentry engine, by giving itmore monitors than can be executed within a one-minute window. If thishappens, it is possible that it will never catch up. The moral of this is: makesure that the monitors will run in a reasonable timescale, and do not setunrealistically short polling intervals.
We discuss how to detect and deal with this problem in Chapter 6, “InstallationNotes and Trouble Shooting” on page 131.
When the monitor detects a result that triggers one of the defined responselevels, it will cause an action to be taken. Some of these actions, such as locallogging or local command execution, can be executed directly on the managednode. However, most actions involve invoking a method on another node in theTMR. This is where the kennel classes come into play.
Figure 12 shows what happens.
Figure 12. Executing a Monitor Action
Chapter 3. TME 10 Distributed Monitoring in Detail 21

This soft copy for use by IBM employees only.
1. The Sentry engine invokes a method call on the TMR server. Calls to aremote ORB contain an object reference and a method invocation. In thiscase the object is the monitor instance and the method is whatever action isdefined in the monitor. The monitors are instantiated on the TMR server, sothat is where the invocation is made.
2. The action method invokes the desired action(s), such as updating anindicator icon, running a task, sending e-mail, etc. These actions are,themselves, method invocations that can be invoked on whichever TME nodeis appropriate.
3.3.2 Displaying EventsThere are several ways of displaying events using TME 10 DistributedMonitoring. Within each monitor you can define that events are sent to anycombination of the following:
• The TME desktop
• A TME Notice group
• The Tivoli Enterprise Console (T/EC)
• A logfile
• Via a mail message
Events may be sent to any predefined adminstrator.
Because you can also execute TME tasks or programs as a result of a monitorbeing triggered, you can also send events to other event handlers. In this bookwe will show how to do this to send events to TME 10 NetView, for example.
3.3.2.1 Generating Pop-Up MessagesA pop-up message can be defined to appear on any TME administrator’sdesktop, as shown in Figure 13.
Figure 13. An Event Pop-Up Message
3.3.2.2 Notice GroupsNotice groups are a TME facility for storing, organizing and presenting eventinformation. Sentry has the capability to send alerts to specific notice groups:These are:
• Sentry
• Sentry-log
• Sentry-urgent
22 Migrating from Systems Monitor to TME 10 Distributed Monitoring

This soft copy for use by IBM employees only.
• SentryStatus
When you define a TME administrator, you can specify which notice groups theywill be subscribed to. An event sent to a notice group can be read whenconvenient and will not produce a pop-up, although the Notices icon changes toshow that unread notices have arrived (see Figure 14).
Figure 14. Sentry Notices
3.3.2.3 The TME 10 Enterprise Console (T/EC)The pop-up and notices facilities are a standard part of the TME platform. T/EC,on the other hand, is an additional TME application specifically designed forhandling event data. T/EC uses an RDBMS to organize events and it is builtaround a powerful rules engine that allows events to be correlated regardless ofgeneration time and source. These rules provide filtering of potentially highnumbers of events (see Figure 15).
Figure 15. Events Sent to the T/EC
Chapter 3. TME 10 Distributed Monitoring in Detail 23

This soft copy for use by IBM employees only.
3.3.2.4 TME 10 NetViewTME 10 NetView provides an event handling process, which displays SNMP trapsreceived from the network and internally generated NetView events. If you aremigrating from a Systems Monitor environment, you already use TME 10 NetViewfor centralized event display. If you want to keep using NetView in this way,Sentry provides two techniques for passing events into NetView:
1. You can use a TME task to run the NetView event command directly on thesystem where NetView is running.
2. You can use an automatic command to send an SNMP trap to NetView.
We will show examples of how to do both of these in Chapter 5, “TME 10Distributed Monitoring Examples” on page 43.
NetView runs on AIX, Sun Solaris and NT platforms. With all versions you canview events as they arrive in a window on the NetView system. With the UNIXversion you can also use a Java-enabled Web browser to access NetView (V5only). See Figure 16.
Figure 16. Events Arr iv ing at TME 10 NetView
24 Migrating from Systems Monitor to TME 10 Distributed Monitoring

This soft copy for use by IBM employees only.
Chapter 4. Migration Methodology and Tools
Now that we have an understanding of the differences between the old and newdistributed monitoring environments, we are ready to think about a migrationproject. In this chapter we work through the steps involved in the migration andintroduce some tools to help.
4.1 Pre-Migration PlanningBefore you can go into the details of migrating your Systems Monitorenvironment, you need to plan the installation of the infrastructure needed byTME 10 Distributed Monitoring. Essentially, this means that the TME platformneeds to be installed and configured. This involves planning the layout of yourTMRs and positioning the TMR server(s). This need not be complex, but it isworth doing carefully, because any poor decision taken at this stage can causeextra work later.
The following list contains a number of points that you should consider:
• Number and placement of TMRs
The general rule is that the fewer TMRs you have, the better. There is alimit of about 200 to the number of managed nodes that can be placed in anyTMR. If all of the nodes are equally well connected to each other, youshould aim to make the TMRs maximum sized - 200 nodes per server. Ifthere are some slow speed links in the network, you should arrangeconnected TMRs on each end of the link. This is because the TMR serversimplement the mdist (multiplexed distribution) repeater function overTMR-TMR links. In other words, any monitor profile that you are distributingto systems on the far side of the link will only be sent once to the TMRserver and will then fan out.
The introduction of LCF changes the arithmetic. You can have many more(thousands) of LCF endpoints connected to one TMR. Furthermore, eachendpoint gateway acts as an mdist repeater, so slow speed links are moreeasily catered for. LCF support will be available in TME 10 DistributedMonitoring for most operating systems by the end of 1997.
• Selection of TMR servers
Each TMR needs a single TMR server. In normal operation, the TMR serverfunction is not a major consumer of system resource, but it must beavailable 100% of the time. You can certainly share the server platform withsome other application if the opportunity is there. Once again, LCF changesthe equation. More systems within a TMR translates to more work for theserver to do, such as processing monitor actions and automation.
• Configuring Administrators
Systems Monitor does not have a well-defined administrative structure. AnyNetView user who has the ability to execute SNMP get and set requests canbe an administrator. When you migrate to TME 10 Distributed Monitoringyou could retain this simple structure, by defining a single administrator IDand giving the password to anyone that needs administrative access.However, a better approach is to exploit the administrative control that TMEoffers by defining different user IDs for everyone who needs one. You can
Copyright IBM Corp. 1997 25

This soft copy for use by IBM employees only.
then use different policy regions to control who can do what to which part ofthe distributed system population.
• Event Handling
You need to decide what your policy is for presenting event information toadministrators. You may decide not to use a single mechanism. Forexample, it may make sense for some administrators to receive events fromspecific types of monitors via e-mail or pager, in addition to sending them toa consolidated event display.
4.2 The Overall Migration PictureOne thing that quickly emerges from a study of the migration options is that it isnot a simple environment. The existing Systems Monitor environment willconsist of a number of target nodes, on which the monitored resources reside.These systems could be a number of different types of operating systems, orthey could be network devices such as routers and hubs. Monitoring of theresources may be done locally (using Systems Monitor SLM), or at a mid-levelmanager (Systems Monitor MLM) or centrally (NetView for AIX).
The target environment will include TME 10 Distributed Monitoring installed onsome of the monitored nodes. However, it will also include resources thatcannot be migrated directly (SNMP nodes, for example) and resources monitoredby proxy. The mid-level component could therefore consist of TME 10 DistributedMonitoring, or Systems Monitor MLM, or both. Finally there are a number ofdifferent options for displaying and handling event information, as we discussedin 3.3.2, “Displaying Events” on page 22.
Figure 17 shows the post-migration possibilities and breaks down the manageddomain into five different categories.
Figure 17. Pieces of the Migration Puzzle
26 Migrating from Systems Monitor to TME 10 Distributed Monitoring

This soft copy for use by IBM employees only.
The managed resource categories are as follows:
1. Resources that map directly. This means cases where there is a TME 10Distributed Monitoring monitor that performs exactly the same function asthe Systems Monitor monitor that it replaces. Migration of this category canbe a semi-automatic function. We provide examples of migration scripts todo this.
2. Resources that do not map directly. This means that, although it issupported on the managed node, there is no TME 10 Distributed Monitoringmonitor that does exactly what the old monitor did. In other words, a newmonitor type has to be created, using shell scripts or programs, oralternatively a decision has to be made whether to continue monitoring inthe same way.
3. TME resources not directly manageable. These are the cases where eitherthe TME platform or Sentry has not been ported to the particular systemtype. It is possible to use proxy techniques to monitor these resources usingTME 10 Distributed Monitoring.
4. Resources that are only manageable using SNMP. Obvious examples hereare networking hardware, which support SNMP but do not have an operatingsystem on which TME could be implemented. Another possible example isOS/2, which has an SIA available, but does not (at the time of writing) haveSentry support.
5. New types of resources. TME 10 Distributed Monitoring supports someoperating systems that could previously only be effectively monitored byincorporating third-party products or SNMP MIBs, such as Windows NT andNovell NetWare.
Understanding how your current monitoring environment is divided among thesecategories is the key to the migration decisions you have to make, so we nowdescribe a series of steps that will help you categorize your migration problem.
4.3 Analyzing the MigrationBefore you start, we recommend that you collect together the configuration filesof all of the Systems Monitor agents in your environment (or gatherrepresentative samples, if many of them are similar). Systems Monitor keeps itsconfiguration files under directory /var/adm/smv2. Alternatively, you can displaythe configuration through the Systems Monitor configuration interface (smconfig),but that may not be very efficient if you have a large number of systems with alot of variation between them.
This checklist will help you to gain an understanding of what your migrationproject will involve. After you have worked through the list, you can concentrateon the details of the more difficult migration challenges.
1. Analyze your existing Systems Monitor profiles
The first step is to analyze the current Systems Monitor configurations oneach machine with the SIA, SLM or MLM installed. If you have been verywell organized in the past, it is possible that many of the configurationsshare common monitors. If so, your migration task is much easier and theSentry monitors can perhaps be placed in a single profile.
If the monitors vary due to platform or application release, they will need tobe placed in separate profiles and profile managers.
Chapter 4. Migration Methodology and Tools 27

This soft copy for use by IBM employees only.
We recommend mapping out where each set of monitors fits into yourframework.
2. Do you have any SIA file monitors?
The file monitoring capabilities of SIA map to equivalent Sentry functions asshown in the following table; in other words they mostly fall into migrationcategory 1 as shown in Figure 17 on page 26. Check the configurations ofall of your SIA nodes for this type of file monitor. In general, you canmigrate them using the techniques described in 4.5, “Practical MigrationTechniques” on page 31.
The table shows the SIA file monitor option and the equivalent TME 10Distributed Monitoring monitor. Generally speaking, the SIA version hasfewer trigger options, and the comments describe which Sentry options touse to most closely replicate the SIA function.
28 Migrating from Systems Monitor to TME 10 Distributed Monitoring

This soft copy for use by IBM employees only.
Table 2. SIA File Monitor Mapping
Chapter 4. Migration Methodology and Tools 29

This soft copy for use by IBM employees only.
3. Do you have special case SIA file monitors?
There are some SIA file monitoring options that are not available in TME 10Distributed Monitoring. In particular:
• Execution of a command before the test is performed. We show anexample in 5.4.2, “Dynamically Named Log Files” on page 99 of a way tohandle this limitation.
• Monitoring for file ownership changes. The SIA statusChange monitorchecks for file ownership as well as permissions, but the matchingSentry monitor only checks for file permissions. We provide a samplemonitor that provides the file ownership test capability. The fileownership sample is part of the package of sample code from theproject; see Appendix B, “How to Get the Samples in This Book” onpage 141. We describe how to create a monitoring collection in“Monitoring CPU Utilization” on page 105.
• SIA provides some combination monitors that check for specific stringsand changes to data or status. You are unlikely to meet one of these ina real configuration, but if you do you may have to replace it withmultiple Sentry monitors.
4. Do you have monitors of non-migrateable SIA resources?
Check the configurations of any MLMs and SLMs and also check the NetViewfor AIX data collection and thresholding facility for any references to SIA MIBvariables. Check them against the list of SIA MIB variables shown inAppendix A, “Mapping SIA MIB Objects to Sentry Monitoring Collections” onpage 137 . Build two lists:
a. A list of monitors that do not map to a Sentry monitor. These arecategory 2 monitors, according to our designation.
b. A list of the remaining category 1 monitors that can be migrated.
We provide a shell script, chk_mig_cat, to help you do this. It will processMLM and SLM configuration files and report the migration category of anySIA monitors it finds. See Appendix B, “How to Get the Samples in ThisBook” on page 141 for details of how to get the shell script.
The monitors in the latter list can be migrated using the techniquesdescribed in 4.5, “Practical Migration Techniques” on page 31.
5. If you have category 2 monitors, decide what you wil l do with them.
Your only options for monitors that are not migrateable are:
a. Re-create them using Sentry String script or Numeric script monitors.
b. Remove them.
c. Retain SIA on the particular systems where they are required until abetter solution is available.
We show a number of examples of script monitors in this book, which mayhelp you estimate how much work is involved in the first option.
6. Decide whether to monitor SNMP resources using MLM or Sentry.
If you ran the chk_mig_cat script it will have reported any non-SIA MLMmonitors that you may be using. According to our designation, these arecategory 4 monitors. You can either choose to continue to monitor them withMLM, or to monitor them using the UserSNMP or rfc1213 monitoringcollections of TME 10 Distributed Monitoring.
30 Migrating from Systems Monitor to TME 10 Distributed Monitoring

This soft copy for use by IBM employees only.
The main advantage of staying with MLM is that it is less work for you. MLMalso has the capability to monitor all instances of a given MIB object using awildcard definition. This can sometimes be a useful feature. On the otherhand, using TME 10 Distributed Monitoring has the advantage of consistencywith the rest of your monitoring process.
4.4 Systems Monitor and Sentry Can Co-exist!Don’t forget that, during the migration, Systems Monitor and Sentry can co-existon the same machine. You may wish to have both types of monitoring runningin parallel in order to ensure that no functionality is lost.
4.5 Practical Migration TechniquesFor monitors that fall into the first category, that is, where there is a mappingbetween the old and new product function, there are two approaches you cantake:
• GUI-to-GUI migration. This means opening the user interfaces of SystemsMonitor and TME 10 Distributed Monitoring and creating migrated profilesmanually. This is effective for a small configuration, but it would belaborious for anything bigger.
• Semi-automatic migration script. Sentry monitors can be created using thewaddmon command, so it is possible to build a monitoring profile from ashell script. We provide a sample script, described in 4.6, “Semi-AutomatedProfile Migration” on page 35 which will input SIA or MLM configuration filesand generate a stream of waddmon commands.
Whichever approach you take, there is no simple one-to-one mapping betweenfunctions. You will have to adjust your Sentry profiles and monitoring scripts totake account of the variations. The comments in Table 6 on page 137 will helpyou decide what adjustments are needed.
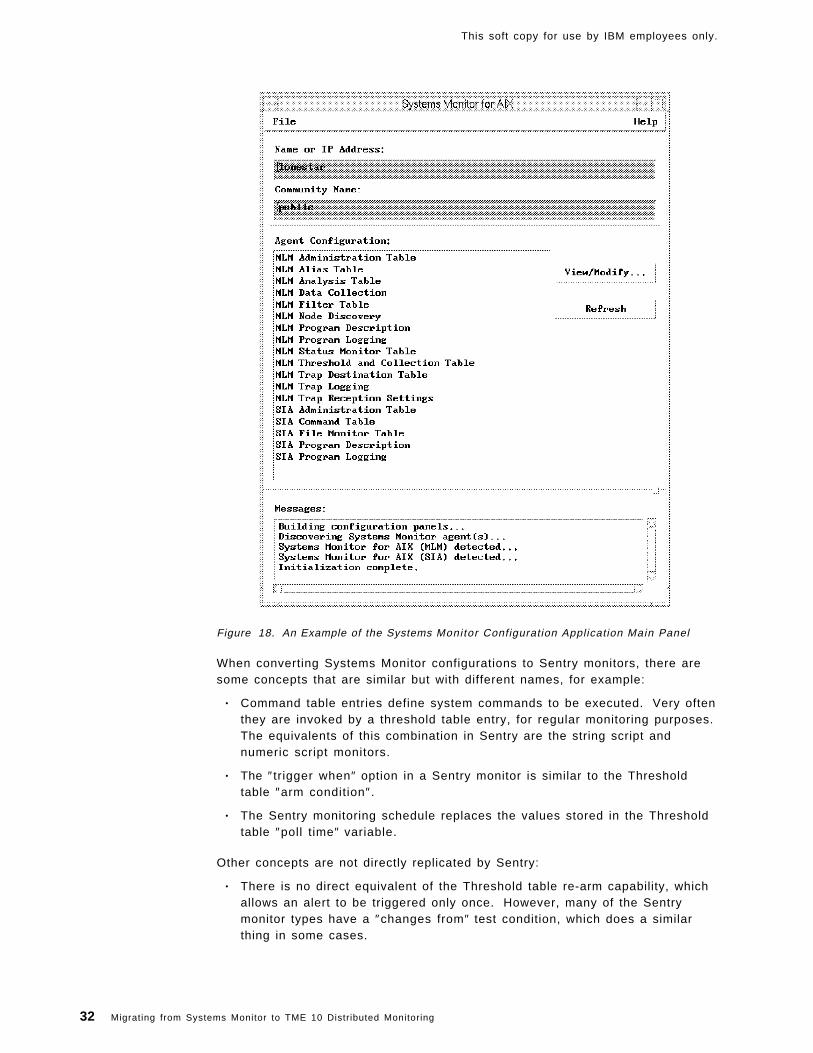
4.5.1 Migration of a Small ConfigurationIf you have a small number of SIA, SLM and MLM agents, then a GUI-to-GUImigration is the simplest solution. Figure 18 on page 32 shows the SystemsMonitor configuration application main menu. This lists the MIB tables that canbe configured on the System Monitor agents.
For migration purposes, the three tables you are interested in are:
1. Command table (SIA only). This allows arbitrary commands and shell scriptsto be executed as a result of querying MIB objects.
2. File Monitor table (SIA only). This allows file status and contents to bemonitored.
3. Threshold table (MLM and SLM). This polls MIB values, checks theresponse against a threshold and invokes an action if one is specified.
Chapter 4. Migration Methodology and Tools 31
This soft copy for use by IBM employees only.
Figure 18. An Example of the Systems Monitor Configuration Application Main Panel
When converting Systems Monitor configurations to Sentry monitors, there aresome concepts that are similar but with different names, for example:
• Command table entries define system commands to be executed. Very oftenthey are invoked by a threshold table entry, for regular monitoring purposes.The equivalents of this combination in Sentry are the string script andnumeric script monitors.
• The ″trigger when″ option in a Sentry monitor is similar to the Thresholdtable ″arm condition″.
• The Sentry monitoring schedule replaces the values stored in the Thresholdtable ″poll time″ variable.
Other concepts are not directly replicated by Sentry:
• There is no direct equivalent of the Threshold table re-arm capability, whichallows an alert to be triggered only once. However, many of the Sentrymonitor types have a ″changes from″ test condition, which does a similarthing in some cases.
32 Migrating from Systems Monitor to TME 10 Distributed Monitoring

This soft copy for use by IBM employees only.
• The Systems Monitor Command table can be used for one-time queries aswell as for regular monitoring (when combined with Threshold table entries).The TME equivalent to this is provided by Task Libraries.
• There is no equivalent of the Command table shared memory monitoringfunction. The easiest way to replace this function may be to use anasynchronous string monitor.
• The Threshold table allows you to collect data in a log file for statisticalanalysis. The same thing is possible with TME 10 Distributed Monitoring, butit is not a standard feature of the product until Version 3.5 (available later in1997).
With these variations in mind you should be able to display the configuration ofyour Systems Monitor tables and re-create the equivalent function using the TMEGUI. In all except the smallest configurations, you will find it useful to analyzeyour Systems Monitor configuration using the guidelines in 4.3, “Analyzing theMigration” on page 27 before actually entering anything new.
4.5.2 Migration of a Larger ConfigurationIf you have numerous SIA, SLM and MLM agents in your current environment,then the most productive migration method may be to use the command lineinterface (CLI) commands. For example:
waddmon Unix_Sentry zombies -t ″60 minutes″ -c critical -R ″>″ 30 -p Root_ssd-region Sentry
This waddmon command will add a Unix_sentry monitor called zombies. Thezombies monitor checks for lingering terminated processes. The -t flag is theequivalent of the Systems Monitor poll time. The -c flag defines the alert level.The defined levels are:
• Critical• Severe• Warning
The -R flag in this example will trigger if more than 30 terminated processesexist. The -p flag defines pop-ups to the Administrator. Sentry in this example isthe profile name.
4.5.2.1 Migration Based on Systems Monitor Configuration FilesYou could view the Systems Monitor GUI screens and then create waddmoncommands that replace them. However, we would prefer to work directly fromthe Systems Monitor configuration files and automate the conversion wherepossible.
Systems Monitor stores its configurations in flat files. Each entry in the file isidentified by a tag, for example, smSiaFIleMonitorstate. It is possible to extractcertain fields from the entries and plug them directly into the waddmoncommand. So for example:
smSiaFIleMonitorstate = disabled
translates to:
waddmon +d
Table 3 on page 34 and Table 4 on page 34 show the equivalent waddmonparameters for SIA File Monitor table and MLM Threshold table entries.
Chapter 4. Migration Methodology and Tools 33

This soft copy for use by IBM employees only.
The following example shows the configuration file for a threshold monitor tableentry that checks whether a daemon, trapgend, is alive. The daemon will berestarted if found to be down.
smMlmThresholdName[Monitor_trapgend] = ″Monitor_trapgend″smMlmThresholdState = disabledsmMlmThresholdDescription = ″Monitor the trapgend daemon and restart if it dies.″smMlmThresholdLocalRemoteMIBVariable = ″ .1 .3 .6 .1 .4 .1 .2 .6 .12.2 .7 .2 .1 .2 .trapgend.*″smMlmThresholdCondition = ″doesNotExist″smMlmThresholdPollTime = ″5m″smMlmThresholdTrapDescription = ″trapgend died - auto restarting″smMlmThresholdArmEnterprise = ″ .1 .3 .6 .1 .4 .1 .2 .3 .1 .2 .1 .1 .2 .1″smMlmThresholdSpecificTrap = 14smMlmThresholdCommandToExecute = ″ /usr/OV/bin/trapgend″smMlmThresholdReArmCondition = ″exists″smMlmThresholdReArmTrapDescription = ″trapgend was restarted″smMlmThresholdReArmEnterprise = ″.1.3.6.1.4.1.2.3.1.2.1.1.2.1″ \smMlmThresholdReArmSpecificTrap = 14smMlmThresholdLastResponseTime = ″Thu Jan 01 00:00:00 GMT 1970″
A waddmon command to perform the same monitoring and restart functionwould be as follows:
waddmon Unix_sentry daemon -a trapgend -t ″5 Minutes″ -c critical -R ″->″ ″down″ \-c normal -R ″->″ ″up″ \-p Root_ssd-region \-e /usr/OV/bin/trapgend \Sentry
There are a number of things to notice about this mapping:
Table 3. SIA Command Table to waddmon Mapping
Table 4. MLM Threshold Table to waddmon Migrat ion
34 Migrating from Systems Monitor to TME 10 Distributed Monitoring

This soft copy for use by IBM employees only.
1. The poll ing time in this case was already in minutes, which TME 10Distributed Monitoring can use. If it had been expressed in seconds wewould have had to round it to the nearest minute in the waddmon command.
2. The re-arm condition in the Systems Monitor example means that thethreshold will be triggered the first time that the probe detects that trapgendis down, but not if it is still down on subsequent polls. We achieve the samething with Sentry by using the ″Changes To″ comparator (″- > ″).
3. The Systems Monitor version wil l send a second, re-arm, event when thedaemon has been restarted. In this case we do the same thing withwaddmon by adding a normal response level definition that is triggeredwhen the status changes to ″up″, but as we discuss in 5.5, “Migrating theRe-Arm Function” on page 102, this is not an ideal approach.
For the full definition of waddmon see the Tivoli/Sentry User’s Guide.
4.6 Semi-Automated Profile MigrationAs a logical extension of the command line migration examples above, wecreated a script that takes existing Systems Monitor configuration files as inputand generates waddmon commands from them.
4.6.1 The Sample Migration ScriptWe provide a script that reads Systems Monitor configurations and executeswaddmon commands to create equivalent Sentry profiles. The script is calledmigrate_sysmon_config.
To obtain the script, see Appendix B, “How to Get the Samples in This Book” onpage 141.
Disclaimer
The script is intended only as a starting point. It will take an existing set ofSystems Monitor configurations and generate a set of TME 10 DistributedMonitoring profiles from them. This is a useful shortcut, but the profiles wil lneed further modification to make them do the job you want them to do.
4.6.1.1 Preparing to Run the Migration ScriptsThe first step is to collect all the variations of the SIA and MLM configurationsfrom your various managed nodes and copy them into a single directory. It isnot a good idea to work with the files in the normal Systems Monitorconfiguration directories (/var/adm/smv2/xxx/config) since this can affect theoperation of a running agent.
When you have the files in one place you can create consolidated configurationfiles. For example, to create a configuration containing all of the SIA entries,enter:
grep -h smSia * > migrate.config
Chapter 4. Migration Methodology and Tools 35

This soft copy for use by IBM employees only.
4.6.2 migrate_sysmon_configThe migrate_sysmon_config script performs three actions:
1. It takes the SIA command table entries and creates individual custom scripts.These are direct translations from the SIA configuration file using thesmSIACommandDescription and smSIACommandGetStringAndParametersdefinitions.
In some cases the scripts may invoke other scripts. Keep in mind thatCommand table entries run executables that are installed on the agent node.Sentry provides the string and numeric script monitors, which do the samething, but specifically for shell scripts. The equivalent of the SIA Commandtable entry created by migrate_sysmon_config is therefore a wrapper scriptthat Sentry can deploy to invoke the real executable on the target system.This is not the way that you would design a monitor from scratch.
The scripts will all be named Migrated_{smSiaCommandName}. Forexample:
smSiaCommandName[COMMAND]
will be migrated to:
/usr/local/bin/Migrated_COMMAND
2. The script also processes the SIA File Monitor table and attempts to createequivalent monitors, based on the mappings shown in Table 2 on page 29.In particular it maps the following File Monitor table keywords:
• exist/doesNotExist
• dataChange
• statusChange (but it uses an arbitrary permissions string)
• string
It creates equivalent Sentry monitors for these conditions (see Table 2 onpage 29 for a detailed description of the file monitor options).
3. The script processes the MLM/SLM Threshold table. The Threshold tablemonitors MIB objects, so the script looks for monitors of SIA MIB variablesand creates an equivalent Sentry monitor where one exists. The SIA tablesthat are handled by the script are the following:
• Network errors
• File systems
• Logged-in users
• Paging Space
• CPU (using the sample monitor described in 5.3, “Monitoring CPUUtilization” on page 76)
• Command table entries (by invoking the shell scripts generated from theSIA configurations)
The script has a routine to handle MIB extensions in either dotted decimalformat or combined dotted and character text, for example:
.1.3.6.1.4.1.2.6.12.2.5.2.1.4./var
or the equivalent dotted decimal version:
.1.3.6.1.4.1.2.6.12.2.5.2.1.4.47.118.97.114
36 Migrating from Systems Monitor to TME 10 Distributed Monitoring

This soft copy for use by IBM employees only.
are both acceptable entries for monitoring the /var filesystem.
migrate_sysmon_config Operations: This script assumes that the TivoliManagement Environment is running on the machine, and that the user ID it isrunning under has enough authority to run waddmon in the selected policyregion. The script also assumes that a Sentry profile already exists.
The script will request the following information:
• The Systems Monitor configuration file to migrate.
• The Sentry profile to which the monitors should be added.
• The directory in which custom monitoring scripts will be placed on themonitored system.
All the new monitor definitions are added in a disabled state. Poll times, whichSystems Monitor allows to be specified in seconds, are rounded to the nearestminute. This script will not make any changes to the original configuration files.
Figure 19 shows a typical invocation of migrate_sysmon_config, and Figure 20on page 38 shows the log file output from it.
rs600026:/tmp/migtest > migrate_sysmon_configYou are Tivoli administrator Root_ssd-regiontotal 176drwxr-xr-x 2 rob assignee 2048 Jun 05 08:34 .drwxrwxrwt 12 root system 3584 Jun 05 08:34 ..-rwx------ 1 root system 25735 Jun 01 14:20 itso.config.test-rw-r--r-- 1 root system 19384 Jun 01 07:09 kuffi-rwxr-xr-x 1 root system 21434 Jun 01 08:20 m_s_c-rw-r--r-- 1 rob assignee 4449 Jun 05 08:30 mlm_plus_sia
Please input the Sysmon config name from the list above ==>mlm_plus_siaPlease input Sentry profile name in which to place migrated monitorsNote: this profile must already exist ==>migrate_testPath to monitoring scripts on monitored system [/usr/local/bin] ==>/tmp/migtest/mlm_plus_siaCreating shell script for IOSTAT command table entryCreating shell script for KERN1 command table entryCreating countstr monitor for ′ ERROR′ /var/adm/smv2/log/midmand.logCreating file checksum monitor for /etc/passwdMonitor_Process --- Process table monitor. Creating a daemon status Sentry monitorMonitor_var --- Creating a disk percent used monitorlonestar_disk_space_monitor --- Creating a disk percent used monitorbaspac1_cpu_busy_monitor --- CPU utilization monitor. Using redbook monitoring collection
Migration Completed - see /tmp/migtest/migrate_sysmon.log for details
Figure 19. Input for the Migration Script
Chapter 4. Migration Methodology and Tools 37
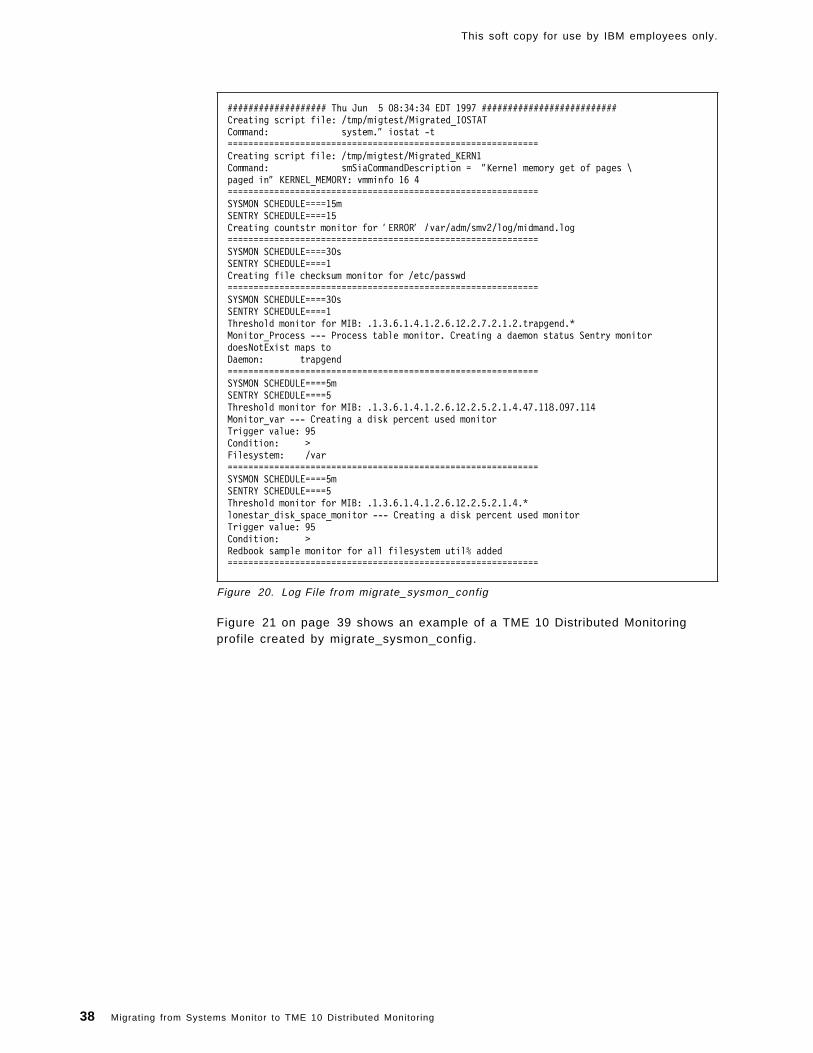
This soft copy for use by IBM employees only.
################### Thu Jun 5 08:34:34 EDT 1997 ##########################Creating script file: /tmp/migtest/Migrated_IOSTATCommand: system.″ iostat -t============================================================Creating script file: /tmp/migtest/Migrated_KERN1Command: smSiaCommandDescription = ″Kernel memory get of pages \paged in″ KERNEL_MEMORY: vmminfo 16 4============================================================SYSMON SCHEDULE====15mSENTRY SCHEDULE====15Creating countstr monitor for ′ ERROR′ /var/adm/smv2/log/midmand.log============================================================SYSMON SCHEDULE====30sSENTRY SCHEDULE====1Creating file checksum monitor for /etc/passwd============================================================SYSMON SCHEDULE====30sSENTRY SCHEDULE====1Threshold monitor for MIB: .1.3.6.1.4.1.2.6.12.2.7.2.1.2.trapgend.*Monitor_Process --- Process table monitor. Creating a daemon status Sentry monitordoesNotExist maps toDaemon: trapgend============================================================SYSMON SCHEDULE====5mSENTRY SCHEDULE====5Threshold monitor for MIB: .1.3.6.1.4.1.2.6.12.2.5.2.1.4.47.118.097.114Monitor_var --- Creating a disk percent used monitorTrigger value: 95Condition: >Filesystem: /var============================================================SYSMON SCHEDULE====5mSENTRY SCHEDULE====5Threshold monitor for MIB: .1.3.6.1.4.1.2.6.12.2.5.2.1.4.*lonestar_disk_space_monitor --- Creating a disk percent used monitorTrigger value: 95Condition: >Redbook sample monitor for all filesystem util% added============================================================
Figure 20. Log File from migrate_sysmon_config
Figure 21 on page 39 shows an example of a TME 10 Distributed Monitoringprofile created by migrate_sysmon_config.
38 Migrating from Systems Monitor to TME 10 Distributed Monitoring

This soft copy for use by IBM employees only.
Figure 21. Sentry Profile Generated by migrate_sysmon_config Script
Figure 22 shows a migrated file monitor configuration and Figure 23 on page 40shows a monitor that invokes a migrated Command table entry.
Figure 22. An Example of a Migrated File Monitor Table
Chapter 4. Migration Methodology and Tools 39
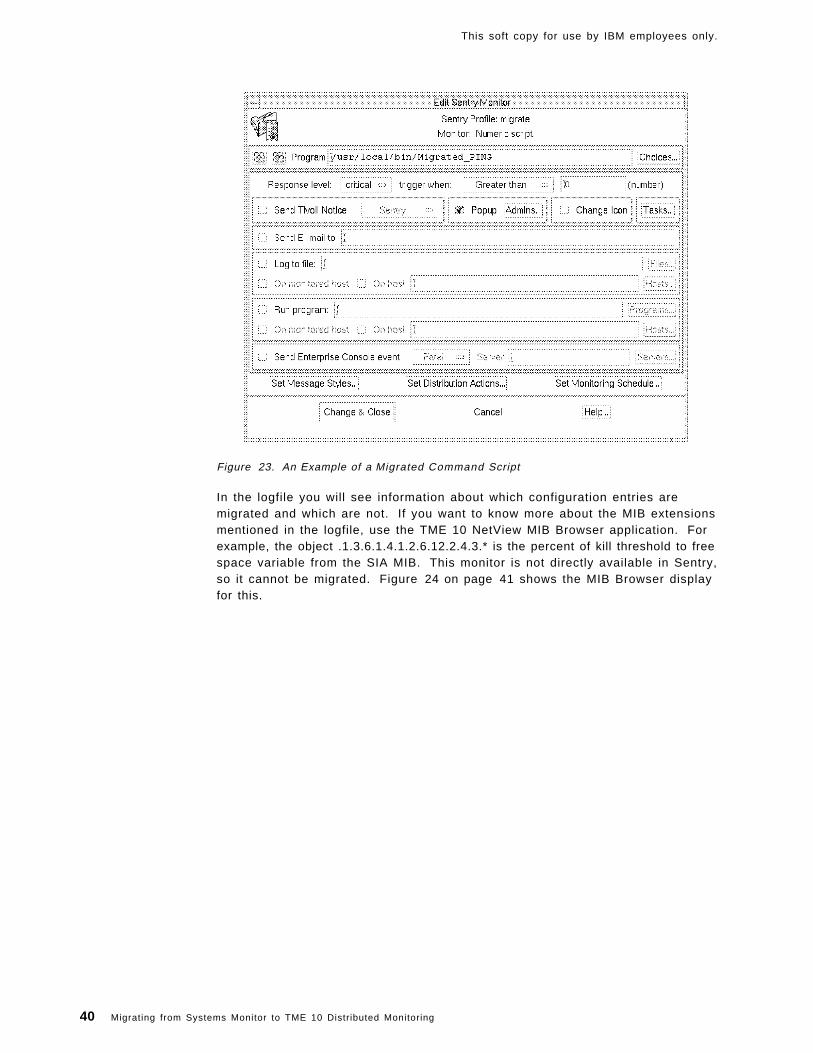
This soft copy for use by IBM employees only.
Figure 23. An Example of a Migrated Command Script
In the logfile you will see information about which configuration entries aremigrated and which are not. If you want to know more about the MIB extensionsmentioned in the logfile, use the TME 10 NetView MIB Browser application. Forexample, the object .1.3.6.1.4.1.2.6.12.2.4.3.* is the percent of kill threshold to freespace variable from the SIA MIB. This monitor is not directly available in Sentry,so it cannot be migrated. Figure 24 on page 41 shows the MIB Browser displayfor this.
40 Migrating from Systems Monitor to TME 10 Distributed Monitoring

This soft copy for use by IBM employees only.
Figure 24. Using the MIB Browser to Check MIB Extension Descriptions
4.6.3 After Running the Migration ScriptOnce you have run the script against your SIA, MLM and SLM configuration filesyou need to check all of the monitors in the profile. Make sure that everythingyou expected has been migrated. Some monitors may need to be addedmanually.
There may also be monitors that you did not want to generate. Delete anythingthat should not be there. A certain amount of tidying is required. For instance,you may wish to rename the migrated scripts to more meaningful names. Don’tforget to change the monitor entry to correspond with each script name.
Chapter 4. Migration Methodology and Tools 41

This soft copy for use by IBM employees only.
42 Migrating from Systems Monitor to TME 10 Distributed Monitoring

This soft copy for use by IBM employees only.
Chapter 5. TME 10 Distributed Monitoring Examples
In this chapter we show a number of examples of different techniques using TME10 Distributed Monitoring. Most of these examples are directly related to thequestion of migration from Systems Monitor, but some of them simply showsolutions to monitoring problems that the authors have encountered in theirpractical experience.
The examples in this chapter are as follows:
• 5.1, “File System Monitoring Example” on page 44 is a simple example toshow a migrateable monitor (category 1). We then go on to show thedifferent ways that the events generated by the monitor can be displayed,using the TME desktop, T/EC and TME 10 NetView.
• 5.2, “Print Subsystem Monitoring” on page 66 shows some examples oftechniques to monitor the print subsystem (lpd daemon) including automaticrestart actions. In this part we also use TME 10 tasks and the TME 10 TaskLibrary Language.
• 5.3, “Monitoring CPU Utilization” on page 76 shows an example of a locallywritten monitoring collection for checking CPU utilization. This is anexample of a category 2 monitor, or one that does not migrate directly fromSystems Monitor to TME 10 Distributed Monitoring. In this part we also usethe MCSL language to create a monitoring collection and a monitor.
• 5.4, “File Monitoring Examples” on page 93 shows examples of some morecomplex file monitoring requirements, including handling files with variablefilenames.
• 5.5, “Migrating the Re-Arm Function” on page 102 shows a possibleapproach to re-creating the re-arm capability of Systems Monitor MLM,which is not normally supported by TME 10 Distributed Monitoring.
• 5.6, “Advanced Process Monitoring” on page 107 shows a locally createdmonitoring collection that allows you to keep track of multiple, relatedprocesses on a system. In this part we use the MCSL language again tocreate a monitor.
• 5.8, “Generic File System Monitoring” on page 115 shows how to monitormultiple file systems on an AIX system.
• 5.9, “SNMP Proxy Forwarding” on page 118 describes the proxy monitoringcapability of TME 10 Distributed Monitoring and shows how to apply it to anSNMP-managed system.
• 5.7, “Hardware Alerting from AIX Error Report” on page 112 shows how touse a TME 10 Distributed Monitoring asynchronous monitor to handle eventswritten to the AIX error logging facility.
• 5.10, “Migrating Data Collection” on page 124 discusses how to use TME 10Distributed Monitoring 3.5 to collect historical data and shows ways toextract the data for processing.
Copyright IBM Corp. 1997 43

This soft copy for use by IBM employees only.
5.1 File System Monitoring ExampleBoth, Systems Monitor and TME 10 Distributed Monitoring provide monitors forchecking the free space within a UNIX file system. If you refer to the table in
Appendix A, “Mapping SIA MIB Objects to Sentry Monitoring Collections” onpage 137 you will see that these monitors fall into category 1. That is, there is adirect mapping between the Systems Monitor and Sentry functions.
We use this monitor as a simple example of how to create a TME 10 DistributedMonitoring definition with equivalent function. Then we will explore the differentfacilities for reporting events that the TME 10 environment offers, namely:
• TME desktop displays
• Routing events to the TME 10 Enterprise Console
• Routing events to TME 10 NetView
5.1.1 Migration from Systems MonitorAs we described in 4.5, “Practical Migration Techniques” on page 31, we coulduse a semi-automated approach to migrate this monitor. Themigrate_mlm_config shell script will create an equivalent Sentry definition givenan MLM configuration file. Alternatively, you can perform a manual migration bylooking at the Systems Monitor GUI and creating an equivalent using the SentryGUI. We will show the former approach.
5.1.1.1 Defining the Monitor in Systems Monitor MLMThe monitor we define will check the size of the /var file system. If it exceeds90% utilized we will generate a threshold event. We define the MLM monitorusing the Systems Monitor graphical configuration interface (smconfig) to definethe entry. Note that in this case the MLM threshold table is monitoring a MIBvalue provided by the SIA.
To start the Systems Monitor configuration interface enter smconfig on an AIXcommand line or select it from the TME 10 NetView tools menu. When it hasinitialized, select MLM Threshold and Collection Table , then click on Add/Copy inthe resulting panel. Figure 35 on page 75 shows how to fill in the monitor detailsfor our file system monitoring example. You can see that we have defined that athreshold should be triggered (or, in Systems Monitor terms, armed) wheneverthe /var filesystem is more than 90% utilized. We have asked for the utilizationto be checked every five minutes (defined in the Poll Time field).
44 Migrating from Systems Monitor to TME 10 Distributed Monitoring

This soft copy for use by IBM employees only.
Figure 25. Defining a File System Monitor Using MLM
Having set up the threshold definition itself, the next step is to define whatshould happen when it is exceeded. We do this by clicking on Arm Actions .Systems Monitor provides two possibilities: you can cause an SNMP trap to besent to the managing system and/or you can cause a command to be executed.Note that any automated command will be executed on the MLM system, not onthe system that is being monitored. Figure 26 on page 46 shows the actiondefinition screen.
Chapter 5. TME 10 Distributed Monitoring Examples 45

This soft copy for use by IBM employees only.
Figure 26. Defining Threshold Actions for MLM
In this case we have specified that a trap should be sent, under the SystemsMonitor enterprise ID (the default) and with specific trap ID 99. Notice that wehave used an MLM-provided environment variable,$SM6K_THRESHOLD_VAR_VALUE, in the trap description. This will be replacedby the value that caused the threshold to be triggered, that is to say the actualutilization of the file system. We have not asked for a command to be executedin this case.
5.1.1.2 Defining the Monitor in TME 10 Distributed MonitoringSentry monitors are defined as profiles within a profile manager, which iscreated in the context of a policy region. We assume that you are familiar withcreating policy regions, profile managers and profiles. Refer to Chapter 3, “TME10 Distributed Monitoring in Detail” on page 15 for an explanation of theseterms. To create the monitor itself, double click the profile manager icon andselect Create , followed by Profile from the menu bar. Select SentryProfile fromthe list and give the profile a suitable name. Figure 27 on page 47 shows thesteps involved in creating a new profile, starting at the TME desktop. Once youhave created a profile it can contain any number of monitors. You should groupmonitors together in a logical way, for example, by collecting all monitorsrelating to a specific type of resource or application.
46 Migrating from Systems Monitor to TME 10 Distributed Monitoring
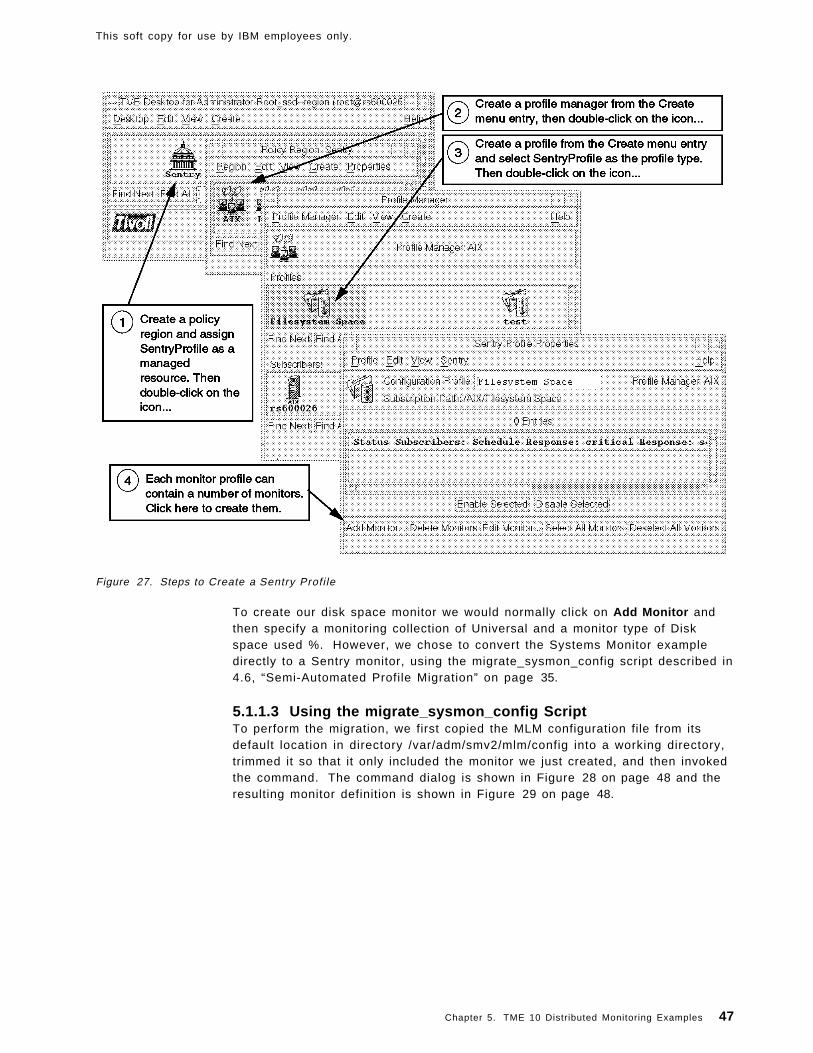
This soft copy for use by IBM employees only.
Figure 27. Steps to Create a Sentry Profi le
To create our disk space monitor we would normally click on Add Monitor andthen specify a monitoring collection of Universal and a monitor type of Diskspace used %. However, we chose to convert the Systems Monitor exampledirectly to a Sentry monitor, using the migrate_sysmon_config script described in4.6, “Semi-Automated Profile Migration” on page 35.
5.1.1.3 Using the migrate_sysmon_config ScriptTo perform the migration, we first copied the MLM configuration file from itsdefault location in directory /var/adm/smv2/mlm/config into a working directory,trimmed it so that it only included the monitor we just created, and then invokedthe command. The command dialog is shown in Figure 28 on page 48 and theresulting monitor definition is shown in Figure 29 on page 48.
Chapter 5. TME 10 Distributed Monitoring Examples 47

This soft copy for use by IBM employees only.
rs600026:/tmp/migtest > /:/project/sentry/samples/migration_scripts/migrate_sysmon_configYou are Tivoli administrator Root_ssd-regiontotal 128drwxr-xr-x 2 rob assignee 2048 Jun 05 09:33 .drwxrwxrwt 12 root system 3584 Jun 05 09:33 ..-rwx------ 1 root system 862 Jun 05 09:31 itso.config.test-rw-r--r-- 1 root system 19384 Jun 01 07:09 kuffi-rwxr-xr-x 1 root system 21434 Jun 01 08:20 m_s_c-rw-r--r-- 1 rob assignee 4449 Jun 05 08:30 mlm_plus_sia
Please input the Sysmon config name from the list above ==>itso.config.testPlease input Sentry profile name in which to place migrated monitorsNote: this profile must already exist ==>migrate_testPath to monitoring scripts on monitored system [/usr/local/bin] ==>/tmp/migtest/itso.config.testMonitor_var --- Creating a disk percent used monitor
Migration Completed - see /tmp/migtest/migrate_sysmon.log for detailsrs600026:/tmp/migtest > cat migrate_sysmon.log################### Thu Jun 5 09:33:25 EDT 1997 ############################SYSMON SCHEDULE====5mSENTRY SCHEDULE====5Threshold monitor for MIB: .1.3.6.1.4.1.2.6.12.2.5.2.1.4./varMonitor_var --- Creating a disk percent used monitorTrigger value: 90Condition: >Filesystem: /var============================================================
Figure 28. Migration of an MLM Configuration Entry with migrate_sysmon_config
Figure 29. Monitor Created by migrate_sysmon_config
Note that there are a larger number of actions available for the Sentry monitorcompared to the MLM example. The migration script simply defines a pop-upaction, so you may need to modify this monitor before enabling it anddistributing it to the monitored nodes.
48 Migrating from Systems Monitor to TME 10 Distributed Monitoring

This soft copy for use by IBM employees only.
5.1.1.4 Distributing the Two MonitorsWe have now created two monitors, one using MLM, the other using Sentry.They perform an identical function, that is to say, they both monitor file systemsutilization at five-minute intervals and raise an alarm if it exceeds 90%.Although they do the same thing, there are a number of important differencesbetween them:
1. The MLM monitor executes on a separate system from the machine beingmonitored, using SNMP to poll across the network. Sentry monitoring takesplace locally on the target machine.
2. The MLM monitor can act on either a single system or on a group of systems(by replacing the system name with an alias). When the monitor definition issaved, it will take effect immediately. With Sentry, by contrast, the targetsystems must first be subscribed to the monitoring profile and the profilemust be distributed before it becomes active.
3. The alarms from MLM appear as events on the SNMP manager display (forexample, the TME 10 NetView control desk). Sentry has a number ofdifferent ways to generate event messages, in addition to the pop-up optionthat we have shown.
We will now explore some of the other options for displaying events generatedby a Sentry monitor.
5.1.2 Different Ways to Display Monitor Events from TME 10 DistributedMonitoring
In addition to creating a pop-up message, you can highlight a Sentry thresholdevent on the TME desktop by generating a notice or updating an indicator icon.We do not go into the details of these methods here; refer to the TME 10Distributed Monitoring documentation for details about them. In this section weshow two more complex examples of event message generation:
• Sending Sentry events to TME 10 Enterprise Console
• Using automation to send Sentry events to TME 10 NetView
5.1.3 Sending Events to TME 10 Enterprise ConsoleIn many cases where you have established TME 10 as the solution for enterprisesystems management, you will have a T/EC server installed. The T/EC serveracts as the central point where events are correlated and automated actions areinitiated, so you will want to send at least some of the TME 10 DistributedMonitoring threshold events to T/EC.
However, before you can use T/EC in combination with TME 10 DistributedMonitoring, there are certain tasks you have to perform to configure T/EC for thatpurpose. These tasks may vary, depending on your specific environment, butthe following list is a summary of the complete procedure:
1. Define a TME administrator that uses a T/EC event console
2. Create or modify a T/EC rule base
3. Import the TME 10 Distributed Monitoring event definitions into the rule base
4. Add a new event source for TME 10 Distributed Monitoring
5. Add a new event group
6. Create an event console
Chapter 5. TME 10 Distributed Monitoring Examples 49

This soft copy for use by IBM employees only.
7. Assign event groups to an event console
We will go through each of these steps in turn.
5.1.3.1 Adding a TME AdministratorYou can either use an existing TME administrator that uses the new T/EC eventconsole or create a new one. In our example we create a new TMEadministrator called Sentry_Administrator.
Open the TME 10 desktop and double-click on the Administrators icon. Thescreen shown in Figure 30 will appear.
Figure 30. Create Sentry_Administrator
Select Create from the menu bar and then Administrator... from the pull-downmenu. In the window that will appear, enter Sentry_Administrator as the Iconlabel.
Select appropriate Logins and Notice Group Subscriptions for the newadministrator. The TMR Roles and Resource Roles can be used to control thenew administrator’s access to T/EC. When finished, select the Create & Closebutton.
5.1.3.2 Creating a T/EC Rule BaseA T/EC rule base holds two types of information:
• Event classes describe the format of events that are sent to T/EC. Eachevent adapter provides class definitions describing the events it wants tosend to T/EC. These definitions are usually supplied in a .baroc file with theevent adapter.
• Event rules describe how to handle certain events or combinations of events.Usually, these rules are associated with automated actions to be performedwhen events arrive. While each event adapter has to supply an event classdefinition for the events it wants to send it does not necessarily have to alsosupply standard event rules.
After the installation of T/EC there is a standard rule base called Default. Youcan extend this rule base with new events and rules. However, it is always wiseto create a new rule base.
Since there can be only one active rule base per event server, you usuallycreate a new rule base, copy an existing one over it and then add the event
50 Migrating from Systems Monitor to TME 10 Distributed Monitoring

This soft copy for use by IBM employees only.
classes and rules to the new rule base. Using that procedure, you can combineevent classes and rules from different sources.
To create a new rule base double-click on the EventServer icon on the TMEdesktop or use the right mouse button and select Rule Bases... from the pop-upmenu as shown in Figure 31.
Figure 31. TME Desktop Window
The Event Server Rule Bases window will appear. Select Create from the menubar and then Rule Base... from the pull-down menu. The following window willappear:
Figure 32. Create Rule Base
Chapter 5. TME 10 Distributed Monitoring Examples 51
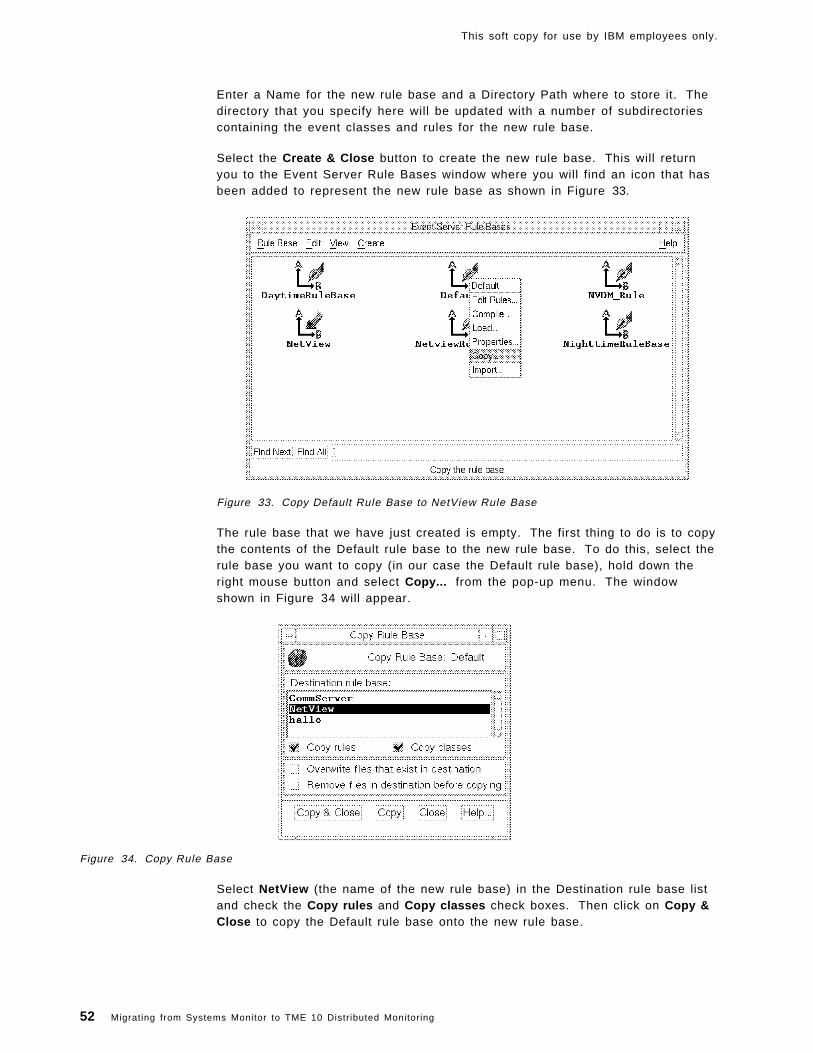
This soft copy for use by IBM employees only.
Enter a Name for the new rule base and a Directory Path where to store it. Thedirectory that you specify here will be updated with a number of subdirectoriescontaining the event classes and rules for the new rule base.
Select the Create & Close button to create the new rule base. This will returnyou to the Event Server Rule Bases window where you will find an icon that hasbeen added to represent the new rule base as shown in Figure 33.
Figure 33. Copy Default Rule Base to NetView Rule Base
The rule base that we have just created is empty. The first thing to do is to copythe contents of the Default rule base to the new rule base. To do this, select therule base you want to copy (in our case the Default rule base), hold down theright mouse button and select Copy... from the pop-up menu. The windowshown in Figure 34 will appear.
Figure 34. Copy Rule Base
Select NetView (the name of the new rule base) in the Destination rule base listand check the Copy rules and Copy classes check boxes. Then click on Copy &Close to copy the Default rule base onto the new rule base.
52 Migrating from Systems Monitor to TME 10 Distributed Monitoring
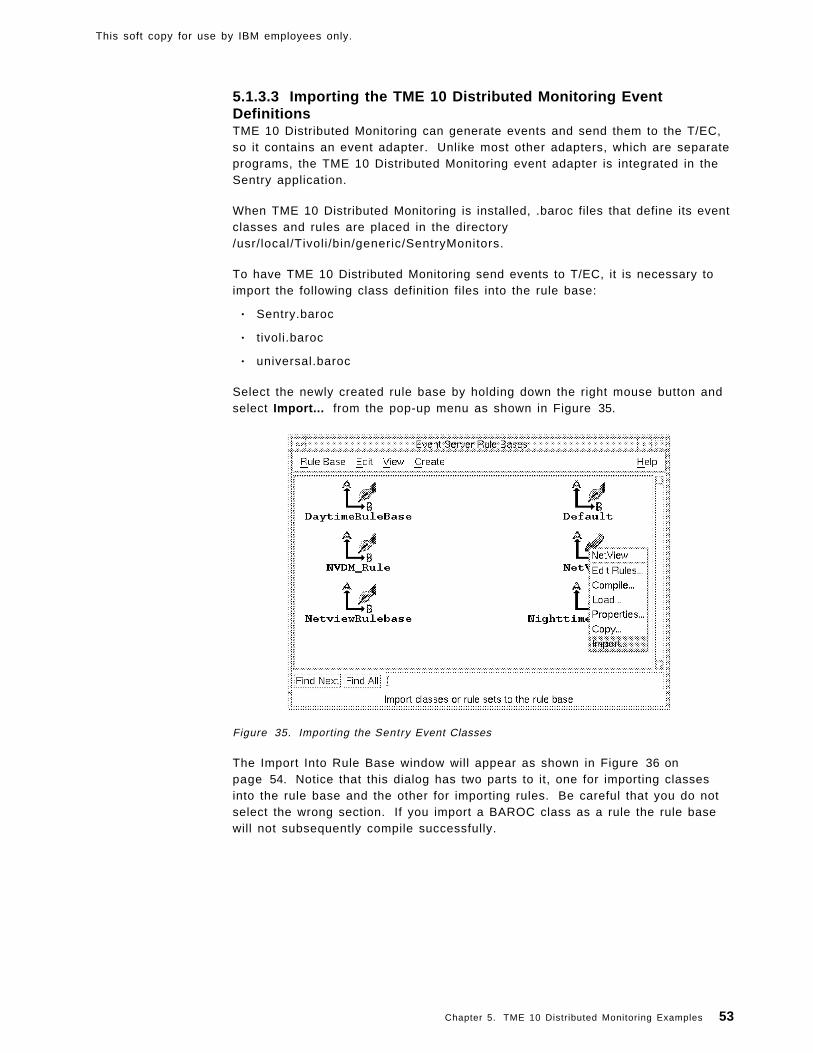
This soft copy for use by IBM employees only.
5.1.3.3 Importing the TME 10 Distributed Monitoring EventDefinitionsTME 10 Distributed Monitoring can generate events and send them to the T/EC,so it contains an event adapter. Unlike most other adapters, which are separateprograms, the TME 10 Distributed Monitoring event adapter is integrated in theSentry application.
When TME 10 Distributed Monitoring is installed, .baroc files that define its eventclasses and rules are placed in the directory/usr/local/Tivoli/bin/generic/SentryMonitors.
To have TME 10 Distributed Monitoring send events to T/EC, it is necessary toimport the following class definition files into the rule base:
• Sentry.baroc
• tivoli.baroc
• universal.baroc
Select the newly created rule base by holding down the right mouse button andselect Import... from the pop-up menu as shown in Figure 35.
Figure 35. Importing the Sentry Event Classes
The Import Into Rule Base window will appear as shown in Figure 36 onpage 54. Notice that this dialog has two parts to it, one for importing classesinto the rule base and the other for importing rules. Be careful that you do notselect the wrong section. If you import a BAROC class as a rule the rule basewill not subsequently compile successfully.
Chapter 5. TME 10 Distributed Monitoring Examples 53
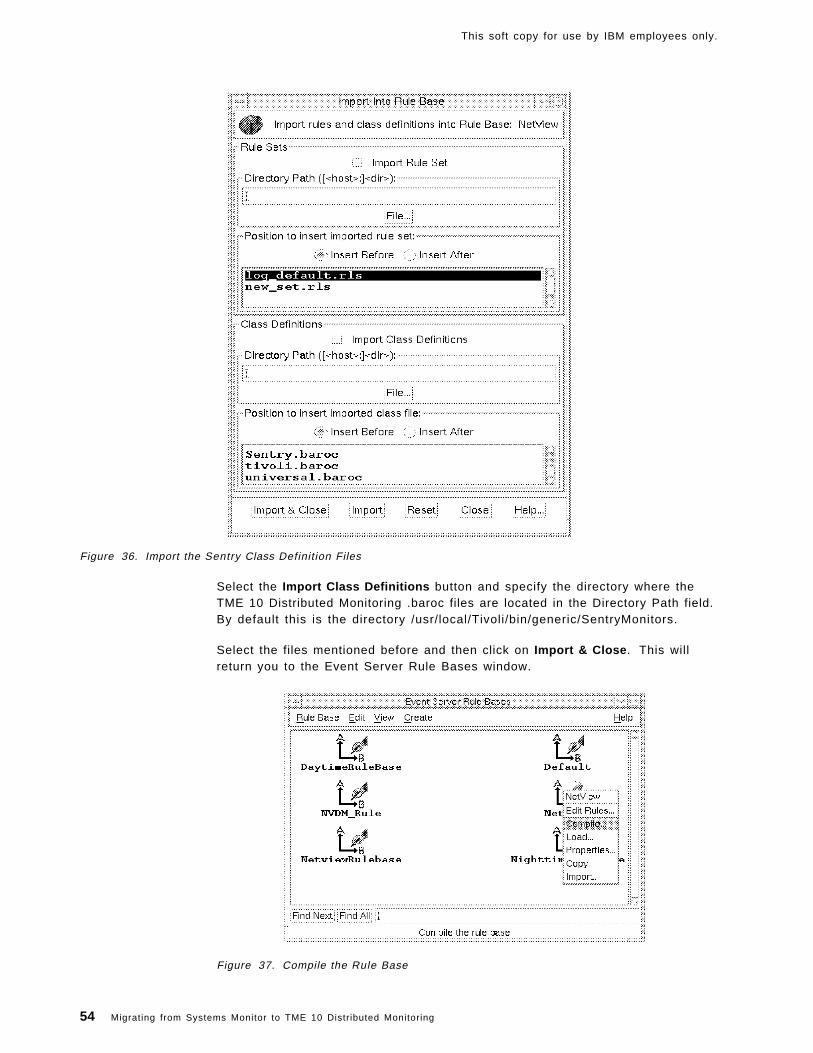
This soft copy for use by IBM employees only.
Figure 36. Import the Sentry Class Definit ion Files
Select the Import Class Definitions button and specify the directory where theTME 10 Distributed Monitoring .baroc files are located in the Directory Path field.By default this is the directory /usr/local/Tivoli/bin/generic/SentryMonitors.
Select the files mentioned before and then click on Import & Close . This willreturn you to the Event Server Rule Bases window.
Figure 37. Compile the Rule Base
54 Migrating from Systems Monitor to TME 10 Distributed Monitoring

This soft copy for use by IBM employees only.
When you add definitions to a rule base, you should always compile the rulebase. You do this by selecting the rule base icon with the right mouse buttonpressed and then selecting Compile... from the pop-up menu.
We now have created a new rule base, extended it with the definitions for TME10 Distributed Monitoring and compiled it. However, normally the rule base isnot active yet. There can only be one rule base active at one time. To activatethe new rule base, select it with the right mouse button and then select Load...from the pop-up menu as shown in Figure 38.
Figure 38. Load the Rule Base
When you load the rule base you will be prompted whether to load itimmediately or to wait until the event server is restarted:
Figure 39. Loading the Rule Base
In this case we click on Load and activate the rule base and then select Load &Close . However, when you add new classes, the new rule base will not beactive until the T/EC event server is restarted (unlike new rules, which take effectimmediately). Do this using the wstopesvr and wstartesvr commands or thecontext menu on the Event Server icon.
5.1.3.4 Adding a New Event Source for TME 10 DistributedMonitoringWe have now customized the input to the T/EC server so that it will recognizeSentry events correctly. Next we have to configure the output from the server,so that the events will appear on event consoles. We do this by adding a newevent source for TME 10 Distributed Monitoring that we can then assign to eventconsoles.
Chapter 5. TME 10 Distributed Monitoring Examples 55
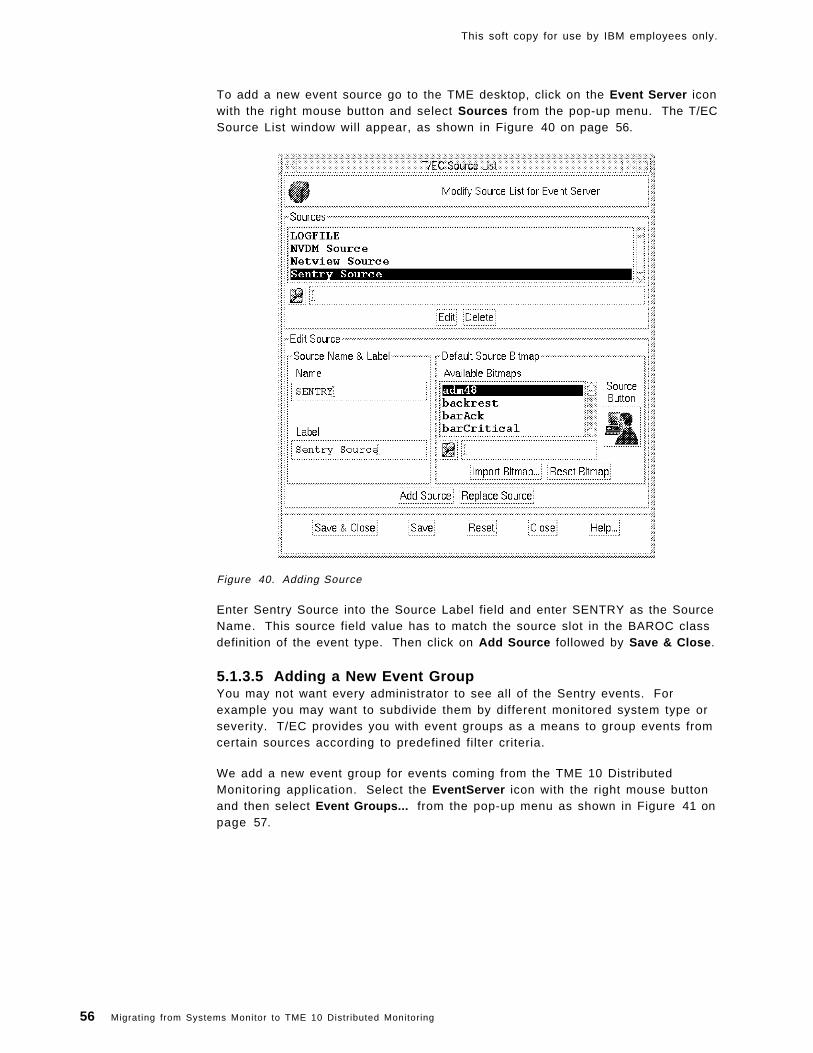
This soft copy for use by IBM employees only.
To add a new event source go to the TME desktop, click on the Event Server iconwith the right mouse button and select Sources from the pop-up menu. The T/ECSource List window will appear, as shown in Figure 40 on page 56.
Figure 40. Adding Source
Enter Sentry Source into the Source Label field and enter SENTRY as the SourceName. This source field value has to match the source slot in the BAROC classdefinition of the event type. Then click on Add Source followed by Save & Close .
5.1.3.5 Adding a New Event GroupYou may not want every administrator to see all of the Sentry events. Forexample you may want to subdivide them by different monitored system type orseverity. T/EC provides you with event groups as a means to group events fromcertain sources according to predefined filter criteria.
We add a new event group for events coming from the TME 10 DistributedMonitoring application. Select the EventServer icon with the right mouse buttonand then select Event Groups... from the pop-up menu as shown in Figure 41 onpage 57.
56 Migrating from Systems Monitor to TME 10 Distributed Monitoring

This soft copy for use by IBM employees only.
Figure 41. Adding an Event Group
The Event Group Management window will appear. This allows you to define anumber of different groups. Select Event Group from the menu bar and thenNew... from the pull-down menu.
The New Event Group window will appear, as shown in Figure 42.
Figure 42. Add Sentry Event Group
Enter a name for the new event group in the Enter New Event Group Name fieldand then click on Create . The screen shown in Figure 43 on page 58 willappear.
Chapter 5. TME 10 Distributed Monitoring Examples 57

This soft copy for use by IBM employees only.
Figure 43. Setting Event Group FIlters
Enter SENTRY in the entry field next to the Source button and leave all otherfields blank. Then click on Add Filter . This simple filter definition will accept allevents that come from the SENTRY source. Click on Set & Close .
5.1.3.6 Creating an Event ConsoleIf you already have an event console for the administrator that is to monitor TME10 Distributed Monitoring events, then you can skip this step.
We create an event console for monitoring TME 10 Distributed Monitoring events.To do so, open the TME desktop of the administrator for whom the new eventconsole shall be created. In our case this is Sentry_Administrator. If you havesufficient authority, you can get to the desktop for a specific administrator bydouble-clicking the Administrators icon in the TME desktop and thendouble-clicking the icon for the administrator.
In the desktop window for the administrator, select Create from the menu barand then Event Console... from the pull-down menu. Select a host where theevent console shall be executed, and then click on Create (the event console willnormally run on the T/EC server machine, but if you install the T/EC code onanother managed node it can run there instead).
This will create a new event console, represented by an event console icon onthe administrator’s desktop.
5.1.3.7 Assigning Event Groups to the Event ConsoleIn order to have events from Sentry arrive at our event console, we need toassign the event group that we have created in 5.1.3.5, “Adding a New EventGroup” on page 56. Select the event console icon with the right mouse buttonand then select Assign Event Groups from the pop-up menu (see Figure 44 onpage 59).
58 Migrating from Systems Monitor to TME 10 Distributed Monitoring

This soft copy for use by IBM employees only.
Figure 44. Assigning Event Group to Console
The Assign Event Groups window will appear, as shown in Figure 45.
Figure 45. Assigning Event Group to Sentry_Admin Console
Select the Sentry_Events group that we previously created and then click on theright arrow button to move it to the Assigned Event Groups window. Then selectit again and select the roles that the administrator has for event display andmanipulation. If you want the administrator to be able to close events you mustassign the senior role. When finished, click on Set & Close .
Chapter 5. TME 10 Distributed Monitoring Examples 59

This soft copy for use by IBM employees only.
5.1.3.8 Receiving T/EC Events from SentryFinally, your event console is ready to receive events from Sentry. Start the TMEdesktop using the TME administrator created in 5.1.3.1, “Adding a TMEAdministrator” on page 50 and then double-click on the event console icon.
Make sure that the file system monitors are active. When the file systemmonitors are triggered, you will see events from Sentry arriving at your eventconsole as shown in Figure 46.
Figure 46. TME 10 Distributed Monitor ing Events Reaching the T/EC
To see the details (slots) for a specific event, select the event with the left mousebutton and then press the View Message... button. This will display the eventslots for the event, as shown in Figure 47 on page 61.
What you will normally want to do now is, for example, add an automated actionfor specific events or correlate events from TME 10 Distributed Monitoring withevents from other sources.
We will not show how to do this here. However, you can refer to the redbooksTME 10 Cookbook for AIX, SG24-4867 or The TME 10 Deployment Cookbook:Courier and Friends, SG24-4976 to get examples of how to do that.
60 Migrating from Systems Monitor to TME 10 Distributed Monitoring

This soft copy for use by IBM employees only.
Figure 47. Event Slots of a Received Event
5.1.4 Sending Events to TME 10 NetViewIf you are migrating from a Systems Monitor environment you will most likelyhave TME 10 NetView as your SNMP management system. One of the keyfeatures of NetView is its event display and automation facilities. In manyenvironments TME 10 NetView is used as the focal point for receiving events.
In TME 10 NetView, all events are stored as SNMP traps. Some of the eventsare generated internally by NetView and some are real SNMP traps, created byan SNMP agent somewhere in the network and directed to NetView. When theyarrive, the (NetView) event console displays the messages. Systems MonitorMLM, SLM and SIA all use traps to indicate problem or resolution events.
You may want to retain NetView as the focal point for your event management,even after replacing SIA and SLM with TME 10 Distributed Monitoring. Even ifyou intend to ultimately use the TME 10 Enterprise Console (T/EC) for this role,there may be a transition period in which you want to display Sentry events on aNetView console.
In this section we will show two techniques that allow you to do this.
Chapter 5. TME 10 Distributed Monitoring Examples 61

This soft copy for use by IBM employees only.
5.1.4.1 Sending Alerts Using the NetView Event CommandThe easiest way to simulate an event in TME 10 NetView (either the arrival of atrap or an internal event) is to use the event command. If NetView is on amachine that has the TME framework installed (either the TMR server or amanaged node), events can be sent from TME 10 Distributed Monitoring toNetView using the Run Program option as a monitor response to execute the/usr/OV/bin/event command on the NetView system.
Figure 48 shows an example of a monitor definition that invokes a shell script onthe system where NetView is running. The script, in turn, executes the eventcommand.
Figure 48. An Example of Sending an Alert to NetView Using the event Command
This example uses two Sentry Environment variables:
• $HOSTNAME - Contains the name of the local managed node
• $EFFECTIVE_VALUE - Contains the output from the monitor. In this case it isthe percentage utilization of the file system.
Note also that the percent sign (%) is a special shell character, so it has to beescaped to cause it to be passed in the argument to the shell script correctly.
The script that we invoke here, NetView_event_proxy, is part of the package ofsamples for this book. Appendix B, “How to Get the Samples in This Book” onpage 141 tells you how you can obtain it. The script is listed in Figure 49 onpage 63. Note that even though the /usr/OV/bin/event command is run on theNetView host, the script substitutes the real monitored host name, extracted fromthe $HOSTNAME environment variable.
62 Migrating from Systems Monitor to TME 10 Distributed Monitoring
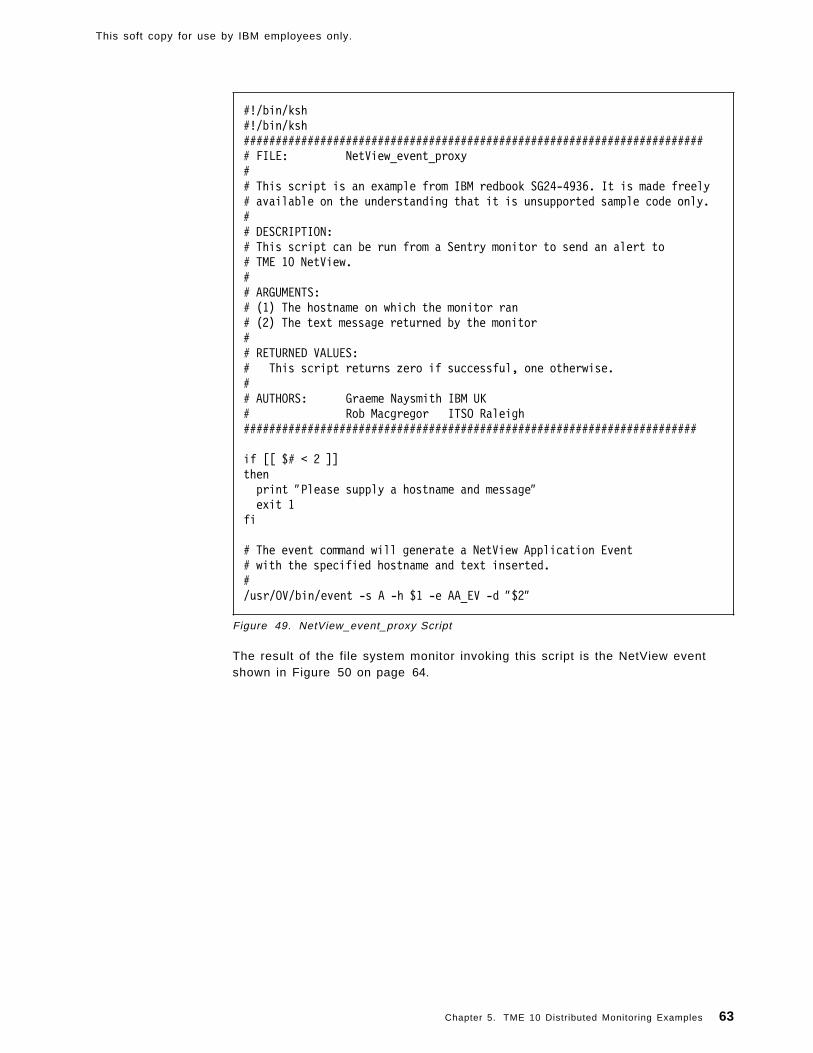
This soft copy for use by IBM employees only.
#!/bin/ksh#!/bin/ksh######################################################################### FILE: NetView_event_proxy## This script is an example from IBM redbook SG24-4936. It is made freely# available on the understanding that it is unsupported sample code only.## DESCRIPTION:# This script can be run from a Sentry monitor to send an alert to# TME 10 NetView.## ARGUMENTS:# (1) The hostname on which the monitor ran# (2) The text message returned by the monitor## RETURNED VALUES:# This script returns zero if successful, one otherwise.## AUTHORS: Graeme Naysmith IBM UK# Rob Macgregor ITSO Raleigh#######################################################################
if [[ $# < 2 ]]thenprint ″Please supply a hostname and message″exit 1
fi
# The event command will generate a NetView Application Event# with the specified hostname and text inserted.#/usr/OV/bin/event -s A -h $1 -e AA_EV -d ″$2″
Figure 49. NetView_event_proxy Script
The result of the file system monitor invoking this script is the NetView eventshown in Figure 50 on page 64.
Chapter 5. TME 10 Distributed Monitoring Examples 63

This soft copy for use by IBM employees only.
Figure 50. NetView Event Generated from a Sentry Monitor
5.1.4.2 Sending Alerts to NetView Using SNMP TrapsThe example we have just described takes advantage of the TME platformcapabilities for reliable, secure remote command execution. However, if theNetView machine is not on a TME node we have to use some other technique toget the alert to it. The easiest way is to send them in the format that NetViewunderstands: SNMP traps.
NetView provides a command, snmptrap, which will generate and send a trap.However, it needs to be executed on the system where the Sentry monitor isrunning, not the NetView machine. It is not straightforward to copy the snmptrapexecutable to another system. Fortunately, Systems Monitor SIA gives us analternative version of snmptrap, so if you are migrating from Systems Monitoryou have the function you need available. It is located in/usr/ lpp/smsia/original/snmptrap.
To invoke the command we need to create a TME 10 Distributed Monitoringmonitor that invokes it. The command is rather complex, so the easiest thing isto place it in a shell script, such as the one shown in Figure 51 on page 65.
64 Migrating from Systems Monitor to TME 10 Distributed Monitoring
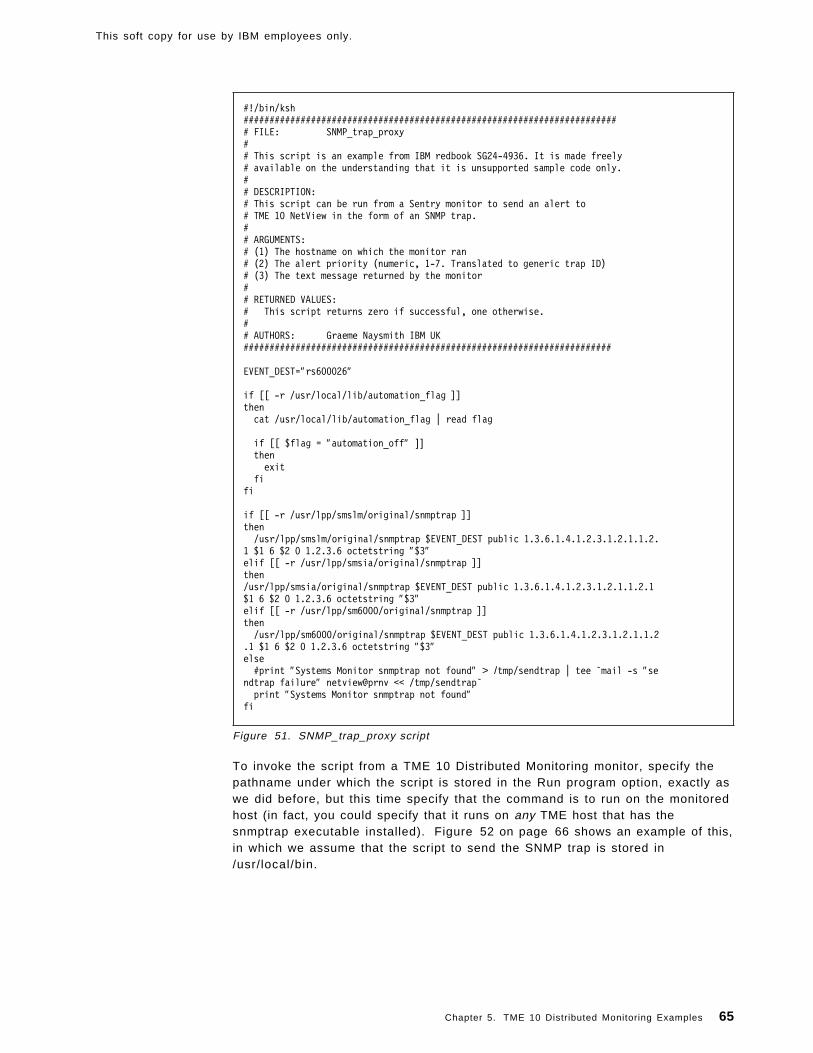
This soft copy for use by IBM employees only.
#!/bin/ksh######################################################################### FILE: SNMP_trap_proxy## This script is an example from IBM redbook SG24-4936. It is made freely# available on the understanding that it is unsupported sample code only.## DESCRIPTION:# This script can be run from a Sentry monitor to send an alert to# TME 10 NetView in the form of an SNMP trap.## ARGUMENTS:# (1) The hostname on which the monitor ran# (2) The alert priority (numeric, 1-7. Translated to generic trap ID)# (3) The text message returned by the monitor## RETURNED VALUES:# This script returns zero if successful, one otherwise.## AUTHORS: Graeme Naysmith IBM UK#######################################################################
EVENT_DEST=″rs600026″
if [[ -r /usr/local/lib/automation_flag ]]thencat /usr/local/lib/automation_flag | read flag
if [[ $flag = ″automation_off″ ]]thenexit
fifi
if [[ -r /usr/lpp/smslm/original/snmptrap ]]then/usr/lpp/smslm/original/snmptrap $EVENT_DEST public 1.3.6.1.4.1.2.3.1.2.1.1.2.
1 $1 6 $2 0 1.2.3.6 octetstring ″$3″elif [[ -r /usr/lpp/smsia/original/snmptrap ]]then/usr/lpp/smsia/original/snmptrap $EVENT_DEST public 1.3.6.1.4.1.2.3.1.2.1.1.2.1$1 6 $2 0 1.2.3.6 octetstring ″$3″elif [[ -r /usr/lpp/sm6000/original/snmptrap ]]then/usr/lpp/sm6000/original/snmptrap $EVENT_DEST public 1.3.6.1.4.1.2.3.1.2.1.1.2
.1 $1 6 $2 0 1.2.3.6 octetstring ″$3″else#print ″Systems Monitor snmptrap not found″ > /tmp/sendtrap | tee `mail -s ″se
ndtrap failure″ netview@prnv << /tmp/sendtrap`print ″Systems Monitor snmptrap not found″
fi
Figure 51. SNMP_trap_proxy script
To invoke the script from a TME 10 Distributed Monitoring monitor, specify thepathname under which the script is stored in the Run program option, exactly aswe did before, but this time specify that the command is to run on the monitoredhost (in fact, you could specify that it runs on any TME host that has thesnmptrap executable installed). Figure 52 on page 66 shows an example of this,in which we assume that the script to send the SNMP trap is stored in/usr/local/bin.
Chapter 5. TME 10 Distributed Monitoring Examples 65

This soft copy for use by IBM employees only.
Figure 52. Example of Using an SNMP Proxy
After activating the monitor, SNMP events will be sent to TME 10 NetView. Theywill appear exactly the same as the traps generated locally on the NetViewmachine, as shown in Figure 50 on page 64.
5.2 Print Subsystem MonitoringThe redbook IBM Systems Monitor for AIX, Anatomy of a Smart Agent,SG24-4398, shows a series of examples using Systems Monitor for printsubsystem (lpd) management. We do not re-create the entire example hereusing TME 10 Distributed Monitoring, but we do show some useful techniques.
There are two main areas to be addressed in print management:
• Checking that the queues are available and not too large
• Checking that the lpd daemon is running
5.2.1 Monitoring with and/or Migration to SentryWhen monitoring print queues from Systems Monitor, it was necessary to add acommand to perform the checking process. TME 10 Distributed Monitoringmakes life much easier by providing a number of monitors (in the Unix_Sentrymonitoring collection), as follows:
printstat Status of print queue (up or down)
printjobs Number of jobs in print queue
printjobsize Total size of all queued print jobs
All of these monitors require a single argument, namely, the name of the printqueue to be checked. This means that a separate monitor needs to be added foreach queue via the GUI or CLI. As an alternative to this we created a custommonitor, which checks all the queues, and restarts any which are found to bedown.
66 Migrating from Systems Monitor to TME 10 Distributed Monitoring

This soft copy for use by IBM employees only.
Figure 53 on page 67 shows this generic queue monitor script. It produces asimple response of 0 or 1, depending on whether all print queues are functioningor not.
#!/bin/ksh######################################################################### FILE: Print_queue_restart## This script is an example from IBM redbook SG24-4936. It is made freely# available on the understanding that it is unsupported sample code only.## DESCRIPTION:# This script was designed to be run by Tivoli Sentry Version 3.0# to provide generic print queue monitoring.# run from a universal numeric monitor with trigger set ″Greater than 0″## Only tested on AIX 4.2## ARGUMENTS:# none## RETURNED VALUES:# Returns 0 if all print queues are operational, 1 otherwise## AUTHOR: Graeme Naysmith IBM UK#######################################################################
system=`uname`
case $system in
AIX)
lpstat -a | awk ′ BEGIN{getline}{ if($3==″DOWN″ ){system(″qadm -U″ $1)}}′
lpstat -a | grep DOWN > /dev/null
if [[ $? -ne 0 ]]thenprint ″0″
elseprint ″1″
fi
;;
*)print ″# $0 Operating system not recognised″
;;
esac
Figure 53. Print Queue Monitor ing and Restart Script
5.2.2 Automating Daemon RecoveryWhen you are thinking of monitoring a machine, often one of the firstrequirements is to monitor the status of processes. Both Systems Monitor andSentry provide facilities for monitoring the state of a daemon. Although thisseems like a simple thing to do, it can become complex, for example, if you needto monitor multiple related daemons, or perform some kind of automated restart.Usually there are several ways to do this.
Chapter 5. TME 10 Distributed Monitoring Examples 67
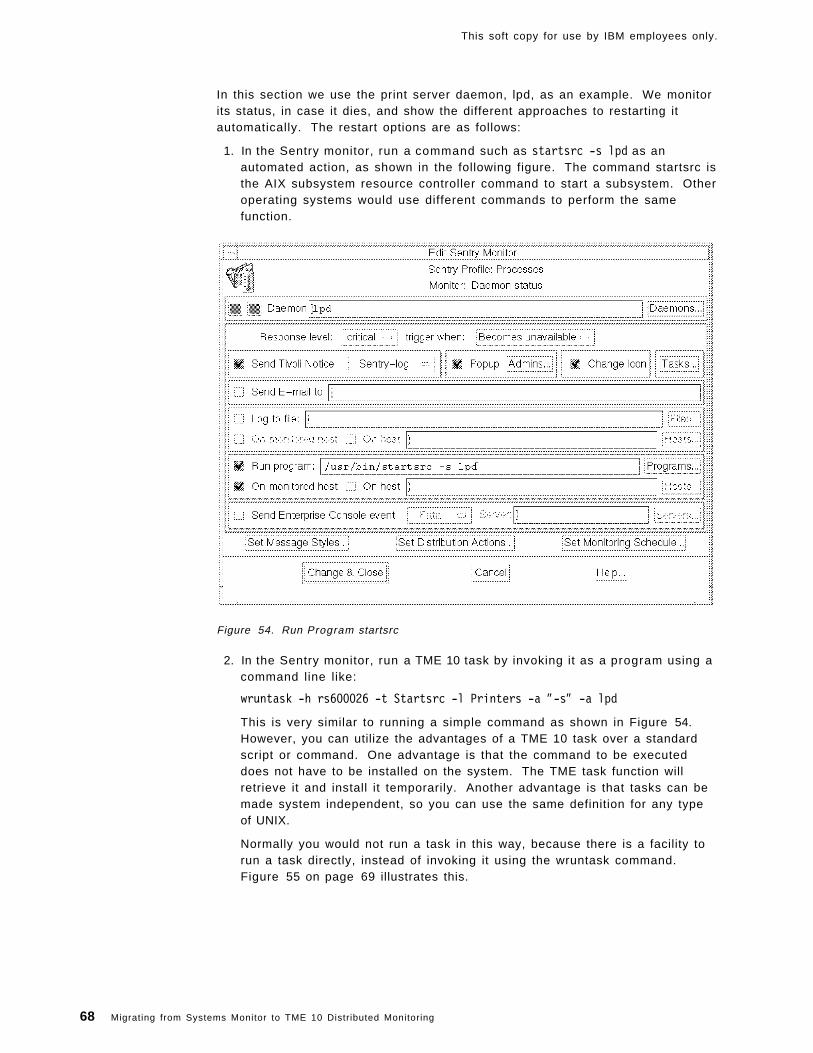
This soft copy for use by IBM employees only.
In this section we use the print server daemon, lpd, as an example. We monitorits status, in case it dies, and show the different approaches to restarting itautomatically. The restart options are as follows:
1. In the Sentry monitor, run a command such as startsrc -s lpd as anautomated action, as shown in the following figure. The command startsrc isthe AIX subsystem resource controller command to start a subsystem. Otheroperating systems would use different commands to perform the samefunction.
Figure 54. Run Program startsrc
2. In the Sentry monitor, run a TME 10 task by invoking it as a program using acommand line like:
wruntask -h rs600026 -t Startsrc -l Printers -a ″-s″ -a lpd
This is very similar to running a simple command as shown in Figure 54.However, you can utilize the advantages of a TME 10 task over a standardscript or command. One advantage is that the command to be executeddoes not have to be installed on the system. The TME task function willretrieve it and install it temporarily. Another advantage is that tasks can bemade system independent, so you can use the same definition for any typeof UNIX.
Normally you would not run a task in this way, because there is a facility torun a task directly, instead of invoking it using the wruntask command.Figure 55 on page 69 illustrates this.
68 Migrating from Systems Monitor to TME 10 Distributed Monitoring

This soft copy for use by IBM employees only.
Figure 55. Running a TME Task from a Sentry Monitor Using wruntask
3. In the Sentry monitor, run a task with the necessary flags instead of runninga program. To do this you click on Tasks (see Figure 55) and enter the taskdetails, as shown in Figure 56.
Figure 56. Selecting a Task to Execute
Chapter 5. TME 10 Distributed Monitoring Examples 69

This soft copy for use by IBM employees only.
Both examples 1 and 2 invoke the same task, Startsrc, from the Printers tasklibrary. Where did this task come from? In fact, we created it ourselves usingthe GUI to create the initial definition and then modified it using the Task LibraryLanguage (TLL). We show you how we created the task library and task andhow we extended its functionality in the next section.
More information about tasks and task libraries can be found in:
• TME 10 Task Library Language Developer’s Guide, SC31-8436
• TME 10 Framework User’s Guide, GC31-8433
You can also find another example of using TLL in TME 10 Cookbook for AIX,SG24-4867.
5.2.3 Using TME 10 Tasks with TME 10 Distributed MonitoringBefore creating it, let us review exactly what a task library is.
5.2.3.1 What Is a Task Library?In TME 10, a task library is a collection of tasks. Each task represents a programthat can be executed on a TME Managed Node. A task has several advantagescompared to a normal program execution:
• A task must be associated with a TME Resource Role; therefore you havecontrol over security.
• A task can be run under an arbitrary user ID on the system on which it isexecuted by temporarily assigning special privileges just for that task (forexample, the help desk should be able to run a system backup and needssystem privileges just for that task).
• The organization into task libraries and tasks establishes a common way tostore automated routines. So, you don’t have to worry about updating anddistributing your automated action programs.
• The Task Library Language can be used to furnish a task with a simple userinterface which the administrator can use to supply input parameters to thetask without having to remember a complex syntax.
5.2.3.2 PrerequisitesWe add a TME 10 Distributed Monitoring monitor that checks for daemon status,as shown in Figure 57 on page 71. Click on Add Empty when you have enteredthe details.
70 Migrating from Systems Monitor to TME 10 Distributed Monitoring
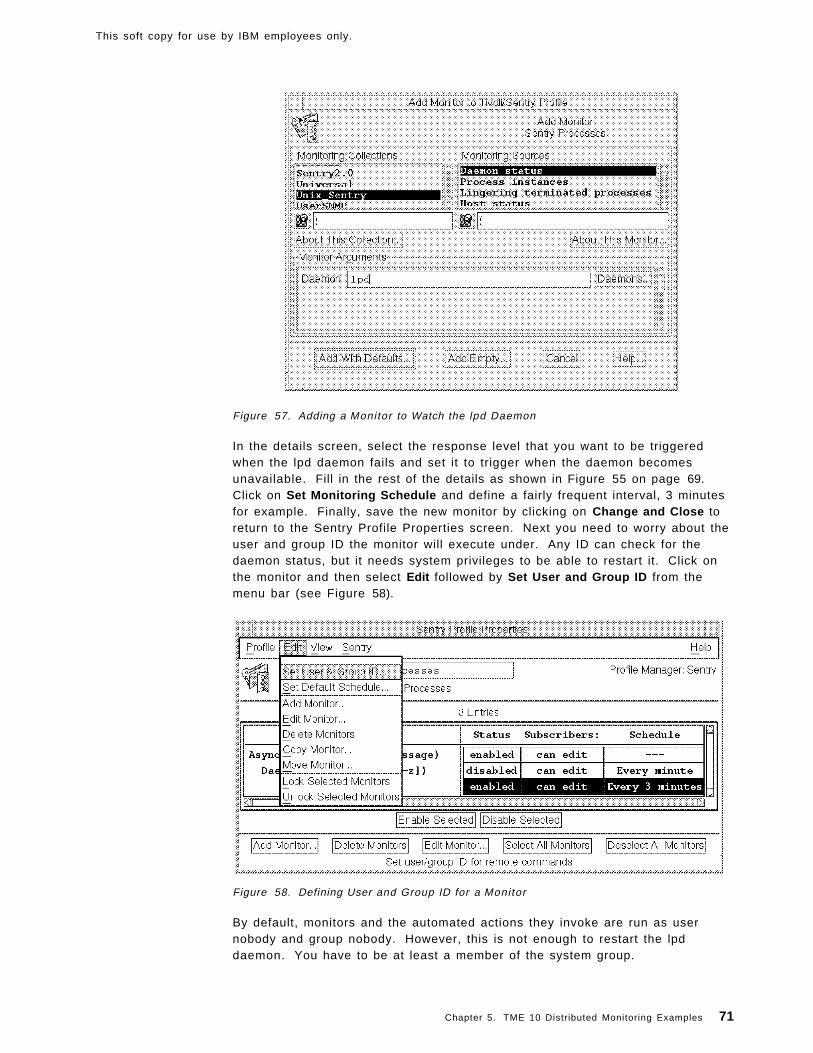
This soft copy for use by IBM employees only.
Figure 57. Adding a Monitor to Watch the lpd Daemon
In the details screen, select the response level that you want to be triggeredwhen the lpd daemon fails and set it to trigger when the daemon becomesunavailable. Fill in the rest of the details as shown in Figure 55 on page 69.Click on Set Monitoring Schedule and define a fairly frequent interval, 3 minutesfor example. Finally, save the new monitor by clicking on Change and Close toreturn to the Sentry Profile Properties screen. Next you need to worry about theuser and group ID the monitor will execute under. Any ID can check for thedaemon status, but it needs system privileges to be able to restart it. Click onthe monitor and then select Edit followed by Set User and Group ID from themenu bar (see Figure 58).
Figure 58. Defining User and Group ID for a Monitor
By default, monitors and the automated actions they invoke are run as usernobody and group nobody. However, this is not enough to restart the lpddaemon. You have to be at least a member of the system group.
Chapter 5. TME 10 Distributed Monitoring Examples 71

This soft copy for use by IBM employees only.
We created an AIX user ID called xxx, which has the system group in its groupset. We can then set the user ID and group ID for the TME 10 DistributedMonitoring monitor as shown in Figure 59 on page 72.
Figure 59. Setting IDs
5.2.3.3 Setting Up a Basic TaskTo deal with tasks, you first have to create a task library. You can do this byselecting Create from the menu bar in the Policy Region window and thenselecting TaskLibrary... from the pull-down menu. Make sure that TaskLibrary isa managed resource of the policy region where you want to create the new tasklibrary.
In our example, we have created a task library called Printers. Within the tasklibrary you can then create a task, by selecting the task library icon with theright mouse button as shown in Figure 60.
Figure 60. Creating a Task
The screen shown in Figure 61 on page 73 will appear. Enter the task details asindicated.
72 Migrating from Systems Monitor to TME 10 Distributed Monitoring

This soft copy for use by IBM employees only.
Figure 61. Editing a Task
Note
Notice that you cannot specify any arguments to pass to the command in thisdialog.
Click on Set & Close and then Create & Close to finish creating the new task.This will add a new icon for the task in your task library.
Once you have finished these steps, you can test your task by double clicking itand selecting a host (Available Task Endpoint ) to run it on. During testing youmay want to select Display on Desktop and Save to File to watch the task output.Since our example deals with the startsrc command, execution of the task willnot be successful. The startsrc command requires some flags, which our simpletask definition does not allow us to provide. We will add these flags in the nextsection.
5.2.3.4 Extending the Basic TaskOnce you have created the Printers task library and the Startsrc task you areready to extend its functionality by passing it the two arguments it needs.
From a command line, enter:
wtll -F /tmp/Printers.tar -l Printers
This will extract the task library definition into a tar archive in a file called/tmp/Printers.tar. Enter the following commands to unpack the archive:
Chapter 5. TME 10 Distributed Monitoring Examples 73

This soft copy for use by IBM employees only.
cd /tmptar -xvf /tmp/Printers.tar
You will get two files, named 0.aix4-r1 and tll. We are interested in the tll file.Figure 62 shows the file, with our additions highlighted.
Figure 62. tll File with Changes
While looking at this Task Library Language definition, we recommend that yourefer back to Figure 56 on page 69 to see the effect of the definitions we haveadded.
Note
We also could have written the source code shown above entirely fromscratch. However, creating it using the graphical user interface and thenexporting it to the Task Library Language definition saves some work.
After making the changes to the tll file, we can compile it by typing:
wtll -r -P /usr/ccs/lib/cpp -p ssd-region /tmp/tll
74 Migrating from Systems Monitor to TME 10 Distributed Monitoring

This soft copy for use by IBM employees only.
Note
This command uses the C preprocessor, cpp. Problems will arise if you donot have a working version of this. You may need to have a license keyinstalled. In fact, we found some problems using the version of cpp that isshipped with C Set++ and we used a copy from an AIX V3R2 systeminstead.
Once the task library has compiled successfully, you can use the new task.Define a monitor as usual and click on Tasks . You will see a screen like the oneshown in Figure 56 on page 69. In the left field the available task libraries aredisplayed, if you double click on Printers the available tasks appear in the rightfield. Make sure that you have selected the field Show by Identifier to see thenames of the tasks. Otherwise you will only see the name ″Upgraded Task″. Ifyou double click on the task that you want to run, a new window pops up and inour example asks you for the arguments minus_s and process that we havedefined in the tll file.
5.2.4 Comparing the Different ApproachesAll of our monitors look for the status of the lpd daemon and try to restart it if itis down. Look at Figure 63 on page 76 which is an extract of a wlsmoncommand. The important differing lines are highlighted:
monitor 0 run program(/usr/sbin/startsrc -s lpd)
monitor 1 run program(wruntask -h $HOSTNAME -t Startsrc -l Printers -a ″-s″-a lpd)
monitor 2 tasks:Printers:Startsrc(-s, lpd)
The first example (monitor 0) implements a very simple solution for restartingthe lpd daemon. It just runs the program /usr/sbin/startsrc with some flags. Thedisadvantage here is that there is no easy way to run different programs ondifferent platforms. The advantage is that you don’t have to deal with the tasklibrary and task definition.
The implementation in monitor 1 is a mixture between running a program andworking with tasks. It is easy to run different programs on different platforms. Adisadvantage is the rather cryptic command line. A person who is new to UNIXcould get confused with, for example, the -a syntax for the parameters.
The last implementation, monitor 2, is the ″cleanest″ way to restart lpd. The taskcorresponding to the type of system where the monitor is run is selectedautomatically and you get a window prompting you to enter the necessaryparameters. On the other hand, you have to learn how to create and changetasks using the Task Library Language.
Chapter 5. TME 10 Distributed Monitoring Examples 75

This soft copy for use by IBM employees only.
0 Monitor: Daemon status(lpd)Timing:Every 5 minutesdisabledResponses:[critical]when probe result == downpopup(Root_ssd-region),notify(Sentry),run program(/usr/sbin/startsrc -s lpd)
[severe][warning][normal][always]
1 Monitor: Daemon status(lpd)Timing:Every minuteResponses:[critical]when probe result -> downpopup(Root_ssd-region),notify(Sentry-log), \run program(wruntask -h $HOSTNAME -t Startsrc -l Printers -a ″-s″ -a lpd)
[severe][warning][normal][always]
2 Monitor: Daemon status(lpd)Timing:Every 30 minutesResponses:[critical]when probe result -> downtasks:
Printers:Startsrc(-s, lpd)
[severe][warning][normal][always]
Figure 63. Extract of wlsmon Output
5.3 Monitoring CPU UtilizationOne of the monitoring tools delivered by Systems Monitor SIA is a MIB table ofCPU utilization. You can, for example, retrieve the MIB variable.1.3.6.1.4.1.2.6.12.2.9.1.3.1.6 and get the average percentage of time that the CPUwas in idle mode over the interval. CPU utilization is a notoriously difficult thingto measure in a meaningful way. For example, it is normal for the CPU to hit100% utilization for short periods of time, so you want to be able to monitor overa long enough period to be sure that the utilization is really consistently high.
There is also some debate about how useful it is to set thresholds on CPUusage. Most operating systems are designed to balance load so that a processthat is using a lot of system resource does not impact the performance of otherprocesses. This means that it is quite possible for a system to always be 100%utilized, yet the users will not feel any ill effects. On the other hand, if theutilization suddenly leaps to a high value it may be an indication of a loopingapplication, or some other bug that needs investigation.
Unfortunately, there are no standard CPU monitors delivered in TME 10Distributed Monitoring for the UNIX platforms. We will show a technique forimplementing such a monitor. We apply this in two ways:
1. Using two shell scripts invoked by the Numeric Script monitor (from theUniversal monitoring collection)
76 Migrating from Systems Monitor to TME 10 Distributed Monitoring
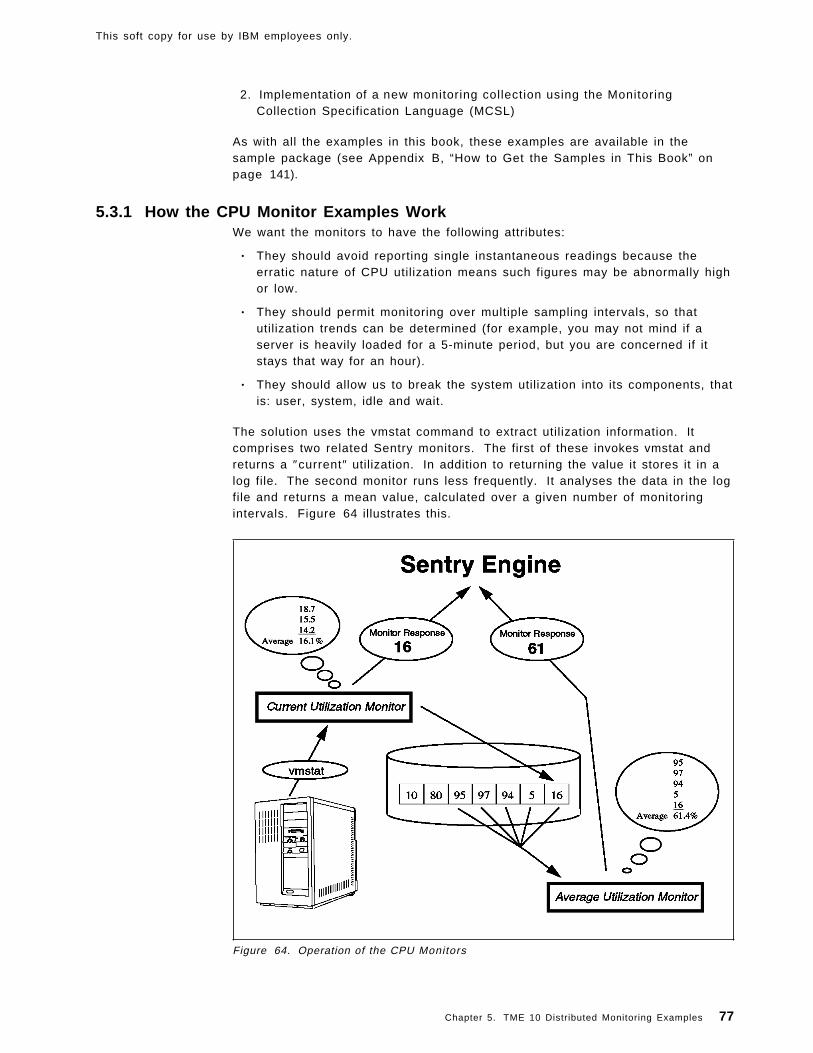
This soft copy for use by IBM employees only.
2. Implementation of a new monitoring collection using the MonitoringCollection Specification Language (MCSL)
As with all the examples in this book, these examples are available in thesample package (see Appendix B, “How to Get the Samples in This Book” onpage 141).
5.3.1 How the CPU Monitor Examples WorkWe want the monitors to have the following attributes:
• They should avoid reporting single instantaneous readings because theerratic nature of CPU utilization means such figures may be abnormally highor low.
• They should permit monitoring over multiple sampling intervals, so thatutilization trends can be determined (for example, you may not mind if aserver is heavily loaded for a 5-minute period, but you are concerned if itstays that way for an hour).
• They should allow us to break the system utilization into its components, thatis: user, system, idle and wait.
The solution uses the vmstat command to extract utilization information. Itcomprises two related Sentry monitors. The first of these invokes vmstat andreturns a ″current″ utilization. In addition to returning the value it stores it in alog file. The second monitor runs less frequently. It analyses the data in the logfile and returns a mean value, calculated over a given number of monitoringintervals. Figure 64 illustrates this.
Figure 64. Operation of the CPU Monitors
Chapter 5. TME 10 Distributed Monitoring Examples 77

This soft copy for use by IBM employees only.
To understand what the current utilization monitor is doing, let’s have a look atthe output of vmstat. The command takes two arguments, which specify theinterval between probes in seconds and the number of times to repeat theprobe. So if you enter vmstat 2 4 you will get four sets of utilization figures withtwo seconds between each. The output of the command is shown in Figure 65.
rs600026:/ > vmstat 2 4kthr memory page faults cpu----- ----------- ------------------------ ------------ -----------r b avm fre re pi po fr sr cy in sy cs us sy id wa0 0 22984 9690 0 0 0 0 1 0 131 621 69 2 3 93 20 0 22984 9689 0 0 0 0 0 0 165 173 89 0 2 98 00 0 22984 9688 0 0 0 0 0 0 171 343 98 2 2 94 10 0 22984 9688 0 0 0 0 0 0 120 84 46 0 0 99 0
Figure 65. Output from vmstat Command
In simple terms the work the CPU is doing can be divided into three parts: Donothing (id), work for the system (sy) or work for the user (us). If you add thesethree values, the sum is always about 100% (sometimes not exactly 100%because of rounding). The vmstat command returns the percentage value of thethree components and is a good indicator of how busy the CPU is at a giventime.
The first output line after the header of the vmstat command is always theaverage value since the last system boot. Since we are interested in the currentload of the CPU, we can simply ignore the first output line.
In the example shown, the CPU is not at all busy. At the first time stamp, itdoesn’t do anything for the user, works 2% for the system and is 98% idle. Atthe second time stamp it does 2% user, 2% system and is 94% idle. At the lasttime stamp it is idle at 99%. So we can say, over the last three time stamps theCPU was working (0+2+0) / 3 = 0.66% for the user, (2+2+0) / 3 = 1.33% forthe system and was idle (98+94+99) / 3 = 97% of the time.
This is the mathematical operation that will be done by our new currentutilizaion monitor. The basic idea is to have a short look (a few seconds) at theCPU, compute its average load, report it and also write the result to a file.
For the longer-term figures we will run a second monitor at a less frequentinterval. So, for example, if we repeat the current utilization monitor every twominutes, the average utilization monitor may run every fifteen minutes. Itperforms much the same function as the other monitor, except that it works withfigures from the log file instead of vmstat.
5.3.2 Monitoring CPU with TME 10 Distributed Monitoring Using Shell ScriptsWe wrote two little shell scripts to implement the current and average CPUmonitoring functions discussed above. The scripts are called cpuload.sh andcpustat.sh, respectively. They are listed in Figure 66 on page 79 and Figure 68on page 81.
78 Migrating from Systems Monitor to TME 10 Distributed Monitoring

This soft copy for use by IBM employees only.
Figure 66. cpuload.sh Script
The cpuload.sh script expects one parameter that determines which CPU load tomonitor: user mode, system mode, idle time or a combination of system anduser mode (which is the total percentage of time the CPU is busy).
Chapter 5. TME 10 Distributed Monitoring Examples 79

This soft copy for use by IBM employees only.
To launch the script from within a Sentry monitor, we use the Numeric scriptmonitor from the Universal Monitoring Collection as shown in Figure 67 onpage 80.
Figure 67. Running cpuload.sh From a Numeric Script
If you want to monitor current utilization using this script you can set up theresponse levels and actions as for any Sentry monitor. Alternatively if you justwant to set up cpuload.sh to feed the longer-term monitoring offered bycpustat.sh you only need to set the monitoring interval and allow the responselevels to all default to ″never″.
The cpustat.sh script uses the file created by cpuload.sh. It reads the CPU loaddata collected by cpuload.sh and builds the average over a certain number ofprobe intervals. The number of probes is determined by the second argumentpassed to the script. The cpustat.sh script is listed in Figure 68 on page 81.
80 Migrating from Systems Monitor to TME 10 Distributed Monitoring

This soft copy for use by IBM employees only.
#!/bin/ksh######################################################################### FILE: cpustat.sh## This script is an example from IBM redbook SG24-4936. It is made freely# available on the understanding that it is unsupported sample code only.## DESCRIPTION:# This script can be run using the numeric script monitor to read# CPU load information from a file, previously written by cpuload.sh.# It returns the mean load value over the most recent N samples## ARGUMENTS:# (1) The element of CPU load to measure# -user Percent CPU utilization for user processing# -system Percent CPU utilization for system processing# -idle Percent CPU idle# -system_user Percent CPU utilization for system and user (%busy)# (2) The number of intervals to calculate the average over## RETURNED VALUES:# This script returns the average utilization as an integer percentage## AUTHORS: Andreas Kuffer IBM Germany# Rob Macgregor ITSO-Raleigh########################################################################utiltype=$1count=$2infile=″ /tmp/bc.wrap$utiltype″
# Calculate the average of the last $count entriesbc << EOFibase = 10obase = 10scale = 0n=$counts = 0`tail -$count $infile | awk ′{ printf ″ + %s″ , $1 }′ `s / nquitEOF
Figure 68. cpustat.sh Script
The cpustat.sh script is invoked in a monitor in exactly the same way ascpuload.sh (see Figure 67 on page 80) except that it has a second argument, thenumber of intervals over which to summarize the results.
The relationship between the two scripts means that you can have multiplecpustat.sh monitors running at once, working with data collected by onecpuload.sh monitor. For example:
• Run cpuload.sh -system_user at 2-minute intervals to record CPU busy data.
• Run cpustat.sh -system_user 5 at 15-minute intervals to report the 10-minuteaverage CPU utilization.
• Run cpustat.sh -system_user 30 at one hour intervals to report hourlyaverages.
5.3.3 Monitoring UNIX CPU Utilization Using MCSLThe two scripts described above meet our requirements for UNIX CPUmonitoring, but it would be better if they were implemented as part of a normalmonitoring collection, rather than having to distribute scripts and employ thenumeric script monitor to drive them. In this section we show how to turn thescripts into a new monitoring collection, using the Monitoring Capability
Chapter 5. TME 10 Distributed Monitoring Examples 81
This soft copy for use by IBM employees only.
Specification Language (MCSL) to create the definition. MCSL is comparable tothe TME 10 Task Library Language described in 5.2.3.1, “What Is a TaskLibrary?” on page 70.
While this approach requires more effort, it has many advantages over usinggeneric script monitors. For example:
• The scripts do not have to be distributed separately from the monitordefinition.
• An administrator does not need to know the arcane command line syntax.
• A single monitor can be made to support multiple system types.
• The monitor is portable and can easily be installed on another TME system.
5.3.3.1 Before You StartTo create and compile the MCSL definitions you need the following environmentin place:
• Tivoli Management Platform, Version 2.0.2 or later
• Tivoli/Sentry 2.0.2 or later
• A C-language preprocessor
On AIX, make sure you have a valid license key or copy the cpp commandfrom an AIX 3.2.5 system, which will work without a license key.
• Access to at least the following files:
Sentry2_0.dsloperators.cslchoicelists.cslformats.csl
These are include files that define messages and data structures. They areincluded with the TME 10 Integration Toolkit, which is available to Tivolipartner vendors. We only had the Integration Toolkit on the NT platform, sowe copied the files from C:plusplusincludegenerictivoli to our workingdirectory on AIX. We had to remove the first three or four comment lines ofthe include files because the AIX C pre-processor did not know how to dealwith them.
5.3.3.2 Overview of Creating a Monitoring CollectionThere are four steps to creating a monitoring collection with MCSL.
1. Create the message catalog.
MCSL refers to messages using a label, instead of having them codeddirectly into the monitor definition. This allows you to translate anapplication into different languages and locales without changing the basefunction.
2. Create the monitor definition file.
This is the heart of the process. This file defines the name of the monitoringcollection and the monitors in it. It specifies the arguments that have to bepassed to the monitor scripts, including the syntax of each argument. GUIelements, such as selection lists and data entry fields, are also defined.Finally, the file defines the monitor scripts themselves, either directly withinthe file or by reference to a separate shell script.
3. Compile the monitor definition file.
82 Migrating from Systems Monitor to TME 10 Distributed Monitoring

This soft copy for use by IBM employees only.
This step uses the mcsl command, which invokes the C pre-processor toparse the monitor definition and message catalog and then generates acollection definition file from them.
4. Install the new monitoring collection.
This step again uses the mcsl command to install the collection into therunning TME nodes.
We will now show how we performed each of these steps to create the UNIXCPU monitoring collection example.
5.3.3.3 Creating the Message CatalogThe message catalog is defined in a .msg file (cpu.msg, in our example). Eachentry in the file contains two lines:
$ key=keynamen message_body
The keyname field is a unique key that is used to access the message from themonitor definition. The n field is a unique message number and themessage_body field contains the text that is to be displayed. You need to havean entry for each text item that will appear on the user interface, such ascollection and monitor descriptions, field descriptions for command arguments,selection list entries and help text.
Figure 69 on page 84 shows the cpu.msg file that we created for our example:
Chapter 5. TME 10 Distributed Monitoring Examples 83

This soft copy for use by IBM employees only.
$ key=Busy_Descr1 Percent used$ key=Busy_Help2 This Monitor returns the current CPU resource utilization as a percentage. Ithas three options which divide utilization into user, system or idle components,plus a fourth option which combines system and user components (effectively - CPU busy).$ key=Busy_val_Descr3 Percent$ key=Resources4 Resource$ key=cpuload_val_Descr5 CPU Status$ key=cpuload_Descr6 Current CPU utilization$ key=cpu_choice_idle7 CPU Idle$ key=cpu_choice_user8 CPU User$ key=cpu_choice_system9 CPU System$ key=cpu_choice_system_user10 CPU System plus User$ key=ButtonLabelChoice11 Choices$ key=cpu_list12 Options$ key=generic_help13 The CPU collection shows statistics for the CPU usr-, system- or idle-percentage$ key=cpustat_Descr14 CPU utilization over time$ key=cpustat_val_Descr15 Percent$ key=cpustat_Busy_Help16 This Monitor uses the output of the Current CPU utilization \monitor and builds the average over an adjustable number of timeframes$ key=cpustat_argument17 Number of Timeframes$ key=cpustat_list18 Options
Figure 69. cpu.msg File
After you have created the cpu.msg file, you have to translate the file into aformat that can be included in the monitor definition. You use the gencmsgcommand to do that:
gencmsg cpu.msg
Three files will be created: cpu.c, cpu.h and cpu.dsl. The cpu.dsl file will beincluded in the cpu.csl file as shown in the next step.
5.3.3.4 Creating the Monitor Definition FileThe monitor definition is in a file of type .csl (we called ours cpu.csl). Figure 70on page 85 and Figure 71 on page 86 show the contents of cpu.csl, with notesabout each section.
84 Migrating from Systems Monitor to TME 10 Distributed Monitoring

This soft copy for use by IBM employees only.
Figure 70. Monitor Definiton File, cpu.csl (Part 1 of 2)
Note that every time we refer to a message created in the cpu.msg messagecatalog file, we use the keyname preceded by the filename of the catalog and anunderscore, that is, ″cpu_″ (for example, cpu_ButtonLabel_Choice in theselection list definition).
The keyword Numeric on the monitor definition specifies that this monitor isgoing to have a numeric return value. Alternatively we could have specifiedString or Async. The text Group on the same entry is a keyword and finallynumeric is a reference to a definition in the operators.csl include file. Thiscontrols which trigger options you have for the monitor (see Figure 76 onpage 89). There are two alternatives to numeric, either string or available.Specify string for triggers such as ″Equal to″, ″Matches″ and ″Changes to″.Specify available for triggers such as ″Is up/available″ and ″Becomes available″.
The cpuload monitor has three different implementations defined, for AIX, HPUXand for Sun. Each of them invokes a slightly different version of the cpuload.shshell script that we described above (see 5.3.2, “Monitoring CPU with TME 10Distributed Monitoring Using Shell Scripts” on page 78). The differences are
Chapter 5. TME 10 Distributed Monitoring Examples 85

This soft copy for use by IBM employees only.
caused because the three different flavors of UNIX display the vmstat results inslightly different ways. If you want to put the complete definition into one file, itis possible to imbed the script lines in the .csl file, instead of using the Importkeyword. If you do this, each line of the script must be prefixed with a period(″.″).
Now we can complete the monitoring collection definition by adding the secondmonitor, called cpustat, which takes the output file produced by the first monitorand builds an average over a variable number of time frames (see Figure 71).
Figure 71. Monitor Definiton File, cpu.csl (Part 2 of 2))
5.3.3.5 Compiling the Monitoring CollectionNow we are ready to compile our cpu.csl file. Use the following command to dothis:
mcsl -P /usr/lib/ccs/cpp -x cpu.col cpu.csl -lang-c++ -nostdinc -undef
Where:
-P specifies the path to the C pre-processor to be used
-x specifies the output file and the source .csl file
The result of this is a binary file, cpu.col, which contains the complete monitordefinition, including the implementation scripts for the supported platforms.
5.3.3.6 Loading the Monitoring CollectionOnce you have your cpu.col file, you are ready to load the collection. Use thefollowing command to load it into TME 10 Distributed Monitoring:
mcsl -i -R cpu.col
You may get some error messages, similar to the following when you executethis command:
WTR05128:A communications failure occurred: destination dispatcher unavailablePlease refer to the TME 10 Framework Planning and Installation Guide, \″TME Maintenance and Troubleshooting″ for details on diagnosing \communication errors or contact your Tivoli support provider.
This is not necessarily a serious problem. The command attempts to update allof the managed nodes in the TMR. If there are nodes that are currently down
86 Migrating from Systems Monitor to TME 10 Distributed Monitoring

This soft copy for use by IBM employees only.
you will see the above message. However, the monitoring collection will havebeen installed on all of the active systems.
To see the new collection and its monitors in the graphical user interface, youhave to recycle the object dispatchers using the following command:
odadmin reexec all
5.3.4 The New Monitoring Collection in ActionNow we can invoke our new monitors. We open a TME 10 Distributed Monitoringprofile, as shown in Figure 72.
Figure 72. TME 10 Distributed Monitor ing Profi le
Next click on Add Monitor . You will be presented with the monitoring collectionselection screen (see Figure 73 on page 88). In the left table the new UnixCPUcollection will appear. When you select it our two monitors, Current CPUutilization and CPU utilization over time will be listed in the right-hand table.
Chapter 5. TME 10 Distributed Monitoring Examples 87

This soft copy for use by IBM employees only.
Figure 73. Adding a New Monitor
If you now select Current CPU Utilization from the Monitoring Sources windowand then click on About This Monitor... the display shown in Figure 74 willappear. Notice that this is the content of the Busy_Help message catalog entrythat we defined in the cpu.msg file (see Figure 69 on page 84). It appears herebecause we specified:
HelpMessage = (cpu_Busy_Help)
in the definition of the monitor (Figure 70 on page 85).
Figure 74. About This Monitor
Click on Dismiss to close the window and return to the monitoring collectionwindow. Now click on Choices beside the Options field to get the list of CPUutilization elements that you can monitor (see Figure 75 on page 89).
88 Migrating from Systems Monitor to TME 10 Distributed Monitoring
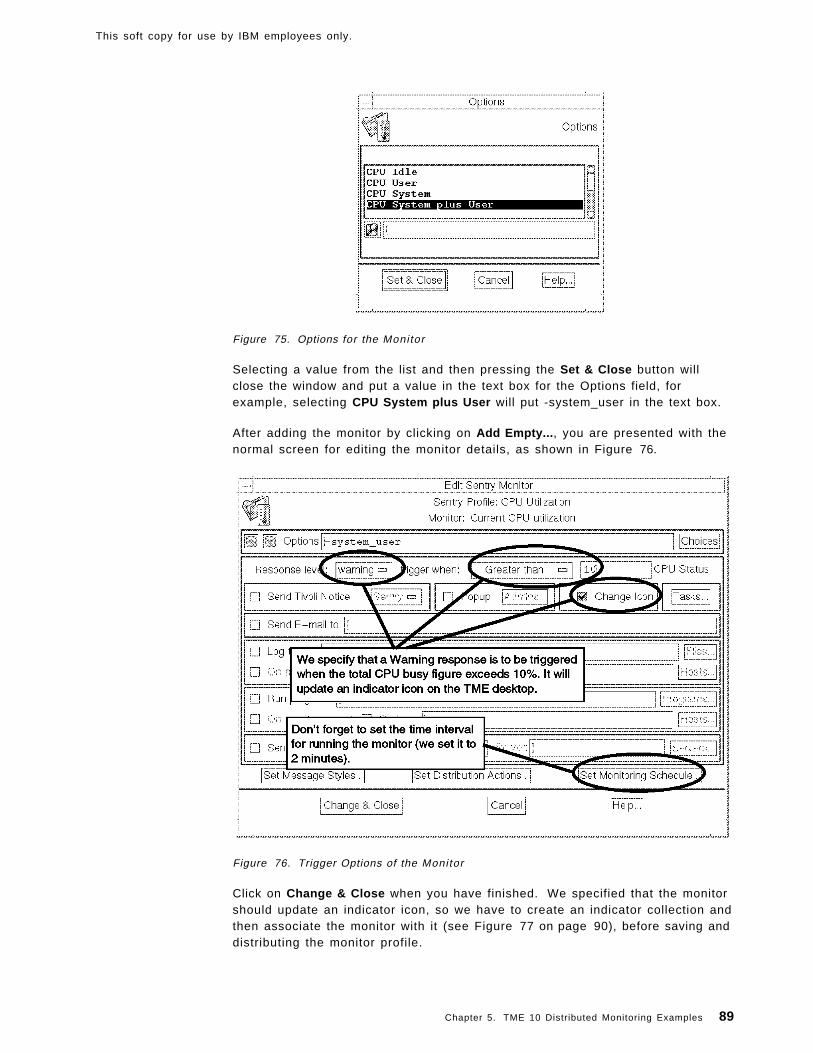
This soft copy for use by IBM employees only.
Figure 75. Options for the Monitor
Selecting a value from the list and then pressing the Set & Close button willclose the window and put a value in the text box for the Options field, forexample, selecting CPU System plus User will put -system_user in the text box.
After adding the monitor by clicking on Add Empty... , you are presented with thenormal screen for editing the monitor details, as shown in Figure 76.
Figure 76. Trigger Options of the Monitor
Click on Change & Close when you have finished. We specified that the monitorshould update an indicator icon, so we have to create an indicator collection andthen associate the monitor with it (see Figure 77 on page 90), before saving anddistributing the monitor profile.
Chapter 5. TME 10 Distributed Monitoring Examples 89

This soft copy for use by IBM employees only.
Figure 77. Assign an Indicator Collection to the Profi le
The result of all of this is that when the combined user and system utilization ofone of the monitored nodes exceeds 10%, an icon in the indicator collection willshow a warning, as shown in Figure 78.
Figure 78. Operation of the Indicator Icon
Remember
All of the examples in this book are available as a package. SeeAppendix B, “How to Get the Samples in This Book” on page 141 for details.The CPU utilization monitoring collection described here is merged into acombined collection, called Redbook_samples in the code package.
90 Migrating from Systems Monitor to TME 10 Distributed Monitoring
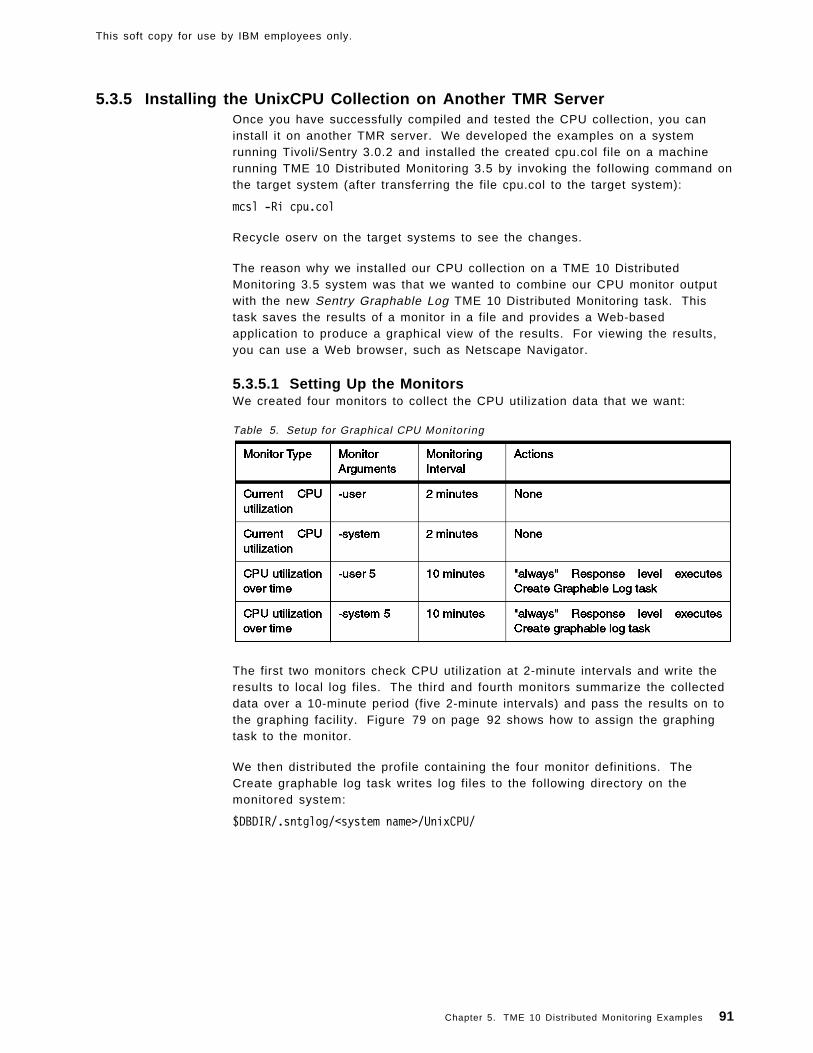
This soft copy for use by IBM employees only.
5.3.5 Installing the UnixCPU Collection on Another TMR ServerOnce you have successfully compiled and tested the CPU collection, you caninstall it on another TMR server. We developed the examples on a systemrunning Tivoli/Sentry 3.0.2 and installed the created cpu.col file on a machinerunning TME 10 Distributed Monitoring 3.5 by invoking the following command onthe target system (after transferring the file cpu.col to the target system):
mcsl -Ri cpu.col
Recycle oserv on the target systems to see the changes.
The reason why we installed our CPU collection on a TME 10 DistributedMonitoring 3.5 system was that we wanted to combine our CPU monitor outputwith the new Sentry Graphable Log TME 10 Distributed Monitoring task. Thistask saves the results of a monitor in a file and provides a Web-basedapplication to produce a graphical view of the results. For viewing the results,you can use a Web browser, such as Netscape Navigator.
5.3.5.1 Setting Up the MonitorsWe created four monitors to collect the CPU utilization data that we want:
The first two monitors check CPU utilization at 2-minute intervals and write theresults to local log files. The third and fourth monitors summarize the collecteddata over a 10-minute period (five 2-minute intervals) and pass the results on tothe graphing facility. Figure 79 on page 92 shows how to assign the graphingtask to the monitor.
We then distributed the profile containing the four monitor definitions. TheCreate graphable log task writes log files to the following directory on themonitored system:
$DBDIR/.sntglog/<system name>/UnixCPU/
Table 5. Setup for Graphical CPU Monitor ing
Chapter 5. TME 10 Distributed Monitoring Examples 91

This soft copy for use by IBM employees only.
Figure 79. Selecting the Graphical Monitor ing Task
5.3.5.2 Displaying the Logged Data GraphicallyThe graphical monitoring facility provides a Web-based application for displayingcollected results. It includes a specialized Web server, some CGI programs anda set of Java applets. The applets allow you to select the source data anddisplay it on a dynamically updated graph in any Java-enabled browser. If youwant to know more about the way that this application works, refer to A FirstLook at TME 10 Distributed Monitoring 3.5, SG24-2112.
For our example we selected to display the system and user components of CPUutilization on one target node as a surface chart. The result is shown inFigure 80 on page 93. Note that this display also shows one of the features ofthe graphical display; when you stop the mouse pointer over a data point, thevalue of it pops up in a little box.
92 Migrating from Systems Monitor to TME 10 Distributed Monitoring

This soft copy for use by IBM employees only.
Figure 80. Graphical View of Historical UNIX CPU Data
5.4 File Monitoring ExamplesUnder Systems Monitor, file monitoring was rather unusual. For mostpolling-based functions, the work was performed by the MLM or SLMcomponents, with the SIA as a passive SNMP data source. For file monitoring,however, the SIA performs the polling for status and contents locally. As weshowed in 4.3, “Analyzing the Migration” on page 27, the file monitors can bedirectly migrated, with some caveats. TME also provides us with an alternativemethod for monitoring file data, using the T/EC log file adapter. We will notconsider that option in this book, although in some cases it may be a goodalternative to using Sentry monitors.
In this section we will show two examples of file monitoring:
• Monitoring ADSM log files
• Dynamically named log files
5.4.1 Monitoring ADSM Log FilesMany customers use ADSTAR Distributed Storage Manager (ADSM) on variousplatforms to fit their backup and restore needs. Tivoli offers a TME 10/PlusModule for controlling and monitoring ADSM using TME. In this example,however, we will use TME 10 Distributed Monitoring to directly monitor theADSM log files.
On AIX machines, there are three log files that we are interested in:
• dsmsched.log (sched.log)
• dsmerror.log
• the console error log
Looking at the output of the log files, they all have a similar structure.
Chapter 5. TME 10 Distributed Monitoring Examples 93

This soft copy for use by IBM employees only.
The following is an example of the dsmerror.log file:
11/06/1996 13:50:18 sessOpen: Error 137 from signon authentication.11/06/1996 13:50:18 ANS4028E Session rejected: Authentication failure
Typical entries from the dsmsched.log look like the following:
11/06/1996 07:50:16 Querying server for next scheduled event.11/06/1996 07:50:16 Next operation scheduled:11/06/1996 07:50:16 ----------------------------------------------------11/06/1996 07:50:16 Schedule Name: DAILYINCRNT11/06/1996 07:50:16 Action: Incremental11/06/1996 07:50:16 Objects:11/06/1996 07:50:16 Options:11/06/1996 07:50:16 Server Window Start: 19:00:00 on 11/06/199611/06/1996 07:50:16 ----------------------------------------------------11/06/1996 07:50:16 Schedule will be refreshed in 6 hours.11/06/1996 13:50:18 ANS4028E Session rejected: Authentication failure11/06/1996 13:50:18 Scheduler has been stopped.
Finally, the console error log file contains entries like the following:
11/06/1996 13:55:40 ANR0400I Session 2270 started for node SORL0008 (WinNT ) ref11/06/1996 13:55:40 ANR0424W Session 2270 for node SORL0008 (WinNT) ref \invalid password submitted.11/06/1996 13:55:40 ANR0403I Session 2270 ended for node SORL0008 (WinNT) ref
ADSM operates on many different operating systems. The messages that itplaces in the log files are generally the same, regardless of the platform.However, there are some system-specific messages; for example, the followinglog file excerpt is from ADSM for MVS, showing system messages interpolatedwith related ADSM messages:
ANR0352I Transaction recovery complete.ANR2100I Activity log process has started.IEF237I 0728 ALLOCATED TO SYS00009ANR2102I Activity log pruning started: removing entries prior to 02/23/199700:00:00.IEF237I 0728 ALLOCATED TO SYS00010ANR2103I Activity log pruning completed: 8 records removed.IEF237I 0728 ALLOCATED TO SYS00011ANR1305I Disk volume ADSM.STORAGE.POOL001 varied online.ANR5030E Dynamic allocation of data set ADSM.STORAGE.POOL007 failed, \return code 4, error code 1156, info code 0.ANR1305I Disk volume ADSM.STORAGE.POOL003 varied online.ANR1311E Vary-on failed for disk volume ADSM.STORAGE.POOL007 - unable \to accessdisk device.IEF237I 0728 ALLOCATED TO SYS00016ANR1305I Disk volume ADSM.STORAGE.POOL004 varied online.ANR0811I Inventory client file expiration started as process 1.ANR2803I License manager started.
By looking at these examples, it should be clear that there is always at least oneline (sometimes two or more) with an error code (for example, ANR5030E,ANR1311E) and a brief description message.
Messages in ADSM always start with ANR, followed by a message number andthe message class. The message number has four digits, and the messageclass can be, for example, ″I″ for information messages or ″E″ for errors.
94 Migrating from Systems Monitor to TME 10 Distributed Monitoring

This soft copy for use by IBM employees only.
5.4.1.1 Monitoring with Systems MonitorIt is quite easy to tell Systems Monitor to look at the output file for all errors. Wecan create a file monitor and look for the following regular expression to find allerror messages in the log file:
ANR[0-9] [0-9] [0-9] [0-9]E
If a relevant error message is found, we can use the snmptrap command to sendan SNMP trap to NetView passing the complete error message line. This can beachieved by using the $SM6K_FILE_MONITOR_COMPLETE_LINE_STRING_FOUNDvariable in Systems Monitor when calling the snmptrap command.
However, since there are some errors that occur very often and are notinteresting at all, we decided to add some more functionality to the basicmonitor. We created an exception list that contains only the error messages thatare relevant to us. The monitor can then use this exception list and only send atrap if the error that was found in the message log is in the exception list.Figure 81 shows the monitoring script.
#!/bin/ksh## If we get here, Filemonitoring has found a ′ ANR????E′ -string in the# logfile.# go through the exception list, whether this string should be sent or not.
complete=$*exceptions=′ . / exceptions′netviewmachine=′ rs600026.itso.ral.ibm.com′
for exception in `cat $exceptions`doresult=`echo $complete |grep $exception`[ ″$result″ ]if [ $? -eq 0 ]then# no need to go on furtherexit 0;
fidone/usr/lpp/smsia/original/snmptrap $netviewmachine public \″.1.3.6.1.4.1.2.6.12″ `hostname` 6 41 0 ″.1.3.6.1.4.1.2.6.12″ \OctetStringASCII ″$complete″ ;/usr/local/Tivoli/bin/aix4-r1/bin/wsndnotif ″TME Diagnostics″ Error <<EOFADSM-script found Error Entry on host `hostname`$completeEOFexit 1;
Figure 81. adsm_script Monitor ing Script for Systems Monitor
The exception list is a plain text file and contains entries like the following:
ANR1234EANR8888EANR5435E
Chapter 5. TME 10 Distributed Monitoring Examples 95

This soft copy for use by IBM employees only.
The following figure shows how we set up the monitoring for the dsmcon.log filein Systems Monitor.
Figure 82. Systems Monitor Configuration for ADSM File Monitor ing
In our example we defined an enterprise-specific trap ID 41 for our monitor tocreate. The event that is displayed in the TME 10 NetView Control Desk windowwhen the monitor triggers is shown in Figure 83 on page 97.
96 Migrating from Systems Monitor to TME 10 Distributed Monitoring

This soft copy for use by IBM employees only.
Figure 83. SNMP Trap Generated by ADSM File Monitor ing
5.4.1.2 Migrating the ADSM Monitor to SentryWe chose to use the migrate_sysmon_config shell script from the samplepackage for this book to convert the SIA file monitor into a Sentry profile (see“Semi-Automated Profile Migration” on page 46 for a discussion about this). Todo this, we copied the SIA configuration file from its default location in directory/var/adm/smv2/sia/config into a working directory and then invoked thecommand. The command dialog follows:
rs600026:/tmp/migtest > migrate_sysmon_configYou are Tivoli administrator Root_ssd-regiontotal 136drwxr-xr-x 2 rob assignee 2048 Jun 05 10:51 .drwxrwxrwt 12 root system 3584 Jun 05 10:52 ..-rwx------ 1 root system 862 Jun 05 09:31 itso.config.test-rw-r--r-- 1 root system 19384 Jun 01 07:09 kuffi-rwxr-xr-x 1 root system 21434 Jun 01 08:20 m_s_c-rw-r--r-- 1 rob assignee 4449 Jun 05 08:30 mlm_plus_sia-rw-r--r-- 1 root system 586 Jun 05 10:51 sia_filemon
Please input the Sysmon config name from the list above ==>sia_filemonPlease input Sentry profile name in which to place migrated monitorsNote: this profile must already exist ==>adsmtestPath to monitoring scripts on monitored system [/usr/local/bin] ==>/tmp/migtest/sia_filemonCreating countstr monitor for ′ ANR[0-9][0-9][0-9][0-9]E′ /usr/local/log/dsmcon.log
Migration Completed - see /tmp/migtest/migrate_sysmon.log for detailsrs600026:/tmp/migtest > cat migrate_sysmon.log################### Thu Jun 5 10:53:03 EDT 1997 ############################SYSMON SCHEDULE====30mSENTRY SCHEDULE====30Creating countstr monitor for ′ ANR[0-9][0-9][0-9][0-9]E′ /usr/local/log/dsmcon.log============================================================
The TME 10 Distributed Monitoring definition created by this command is shownin Figure 84 on page 98. Note that the equivalent test to the SIA string monitoris an Occurrences in file monitor, with a criterion of ″Changes by 1″. There are anumber of other points to note here:
• The new monitor is created in a disabled state. You should check that it hasbeen migrated successfully before enabling it.
Chapter 5. TME 10 Distributed Monitoring Examples 97

This soft copy for use by IBM employees only.
• The migration script, by default, defines a pop-up message as the monitoraction. You will probably want to change this, depending on your localpolicy.
• The command to execute from SIA has been migrated as a Run programaction. This will often be acceptable, but this case is an example where theprogram uses Systems Monitor environment variables. The command linewould therefore need to be modified to work correctly with Sentry. In thiscase the variable contains the line from the log file that caused the monitorto be triggered. Unfortunately there is no exactly equivalent Sentryenvironment variable.
The lesson from this is that the sample migration scripts are a useful way tocreate a set of Sentry monitors that reflect your Systems Monitor environment.However, the monitors it creates are only a foundation, which you will have tobuild upon to create the final solution.
Figure 84. Migrated File Monitor
The pop-up generated by the migrated monitor is shown in Figure 85 onpage 99.
98 Migrating from Systems Monitor to TME 10 Distributed Monitoring

This soft copy for use by IBM employees only.
Figure 85. Pop-up Notification of ADSM Error Message
5.4.2 Dynamically Named Log FilesSome applications create log files with the date added at the end of the log filename, for example, by appending the output of the AIX date command to the endof the filename. One example of this is SysBack/6000. We show how monitoringof these log files can be handled.
SysBack/6000 is a backup and restore application that can be configured tocreate a log file containing details of all the files that were backed up and theerrors encountered, if any. For example, a customer runs a daily backup ofcritical file systems and on Saturday does a full backup of the entire volumegroup. The log f i les are written to /usr/local/ log/sysback.log.‘date +%d%m%y‘.
After a few days there would be a number of files, with names likesysback.log.010397, sysback.log.020397, sysback.log.030397 and so on.
Every day, after the backup has completed we want to monitor the actual log fileto determine if anything unusual has happened.
5.4.2.1 Monitoring with Systems MonitorThe problem is that the Systems Monitor file monitor table needs a fixed filename to look for. In order to face this problem we can look for the newest filethat matches the naming conventions for the log file. If this file is newer than thefile with the fixed name (sysback.log in our case) that we want to monitor, it iscopied to sysback.log and Systems Monitor will then look at this file.
The following code fragment can be used to achieve this:
dest=’/usr/local/log/sysback.log’file=`ls -tr /usr/local/log/sysback.log.* | tail -1`if [ $file -nt $dest ]; then cp $file $dest; fi
What we want, therefore, is a way to be sure that the above script has beenexecuted before testing the log file contents. SIA provides us with the commandto execute before monitor option which does exactly what we want. Figure 86 onpage 100 shows an example of this, in which we are looking for the wordsERROR or WARNING in the latest log file. Notice that we have specified that themonitor is only activated once per day, so that we do not process any log eventsa second time.
Chapter 5. TME 10 Distributed Monitoring Examples 99

This soft copy for use by IBM employees only.
Figure 86. Monitoring Dynamically Named Log Files with Systems Monitor
5.4.2.2 Monitoring with and/or Migration to SentryTME 10 Distributed Monitoring (Sentry) does not have a standard option thatallows a command to be run before the monitor. This is why we cannot employan automatic migration of the above example.
A solution to the problem is to use two monitors:
• A numeric script monitor from the universal collection, which does thesorting and copying to a file with fixed filename
• An occurrences in file monitor from the Unix_Sentry collection, which checksfor the file pattern matches
The script for the first monitor is exactly like the three lines of code shown in theprevious section. The second monitor would normally be a simple one, but inthis case the pattern that we want to watch for ( ERROR | WARNING) is anextended regular expression. The Sentry monitors use grep-style limited regularexpressions, so the SIA monitor cannot be directly migrated. To resolve this
100 Migrating from Systems Monitor to TME 10 Distributed Monitoring

This soft copy for use by IBM employees only.
problem, we created a new monitoring collection, containing a file monitor thatuses egrep for pattern matching. The collection is available in the code packagefor this redbook. Figure 87 on page 101 and Figure 88 on page 101 show thetwo monitor definitions. You can see that we have set them to trigger at aspecific time each day, one 5 minutes after the other.
Figure 87. First Monitor Extracts Daily Log File
Figure 88. Second Monitor Analyzes Log File for Error Messages
Chapter 5. TME 10 Distributed Monitoring Examples 101

This soft copy for use by IBM employees only.
5.5 Migrating the Re-Arm FunctionOne of the features of Systems Monitor that TME 10 Distributed Monitoring doesnot provide is the use of threshold and re-arm values to control automatedactions and alerts. Figure 89 illustrates this principle.
Figure 89. Threshold and Re-Arm Function
With a simple threshold mechanism, the monitor will be triggered at everypolling interval for which the value exceeds the threshold. With a re-armmechanism you can set a re-arm line, below the threshold level. Once thethreshold value is exceeded by the value of x, an event is sent. In followingprobes no further events are sent even if the threshold is still exceeded until thevalue of x drops below the re-arm line. Then the monitor is ″re-armed″ and thenext time x exceeds the threshold another alert is sent. This has the dualbenefit of reducing the number of alerts and also providing a resolution event, toindicate that the problem episode has come to an end.
If the threshold and re-arm levels are the same, one event is sent when xexceeds the threshold and then monitoring is disabled. Once x drops below thethreshold again, the monitor is ″re-armed″. The re-arm capability can also beapplied to non-numerical monitors. For example, if you are monitoring thestatus of daemon processes, you can set a threshold to generate an alert whena process fails and set it to re-arm when the process has restarted.
102 Migrating from Systems Monitor to TME 10 Distributed Monitoring

This soft copy for use by IBM employees only.
5.5.1 An Approximate Equivalent of Re-Arm Using SentryAs we have shown, the re-arm capability can be a very useful feature of SystemsMonitor. How should we provide an equivalent function in TME 10 DistributedMonitoring? The obvious answer is that the ″normal″ response is similar to theresolved response that re-arm gives you. The problem with this is that it isalways triggered whenever any of the exception responses (critical, severe,warning) are not triggered. This means that you will be sending monitor eventsat every polling interval, which is a good way to use a lot of system resourceand bandwidth.
The best solution is to exploit the flexibility of Sentry monitors by, for example:
1. Using the additional relative test conditions that they offer (such as increasesbeyond, decreases below, becomes active etc.)
2. Using their capability to add response levels with the waddlevel command
As an example of this, we will create a monitor that generates an alarm whenthe utilization of a given file system exceeds 90% and then generates aresolution event when it falls below 80%.
5.5.1.1 Adding the Resolved Response LevelSentry monitors normally have three exception levels, critical, severe andwarning. Any monitor that does not trigger any of these is considered to be atthe normal response level. We want to add a further level, resolved, which willbe logically below the warning level but above the normal level.
The waddlevel command allows us to do this. To add our resolved level to amonitoring profile called rearm_test, we entered the following command:
waddlevel resolved 10 rearm_test
The numerical value, 10, in this command is the precedence of the new level.This is an arbitrary value that falls between warning, with a precedence of 100,and normal (0). What this means is that if both the warning and the resolvedthresholds are triggered, it is the warning action that will be invoked.
5.5.1.2 Defining the MonitorNow we can use the new response level to implement our file system monitor.Figure 90 on page 104 shows how to do this. Notice that we have used theincreases beyond and decreases below comparators to trigger the two responselevels. Both response levels are defined to update a monitoring collection icon,but only the Warning event will actually change the icon. This is because theicon needs to have all of its possible states predefined, with a bitmap and dialogassociated with each state. The wputicon command can be used to add a newstate, but we did not try it for this project.
Chapter 5. TME 10 Distributed Monitoring Examples 103

This soft copy for use by IBM employees only.
Figure 90. Creating a Re-Arm-Like Capability with Response Levels
5.5.2 A Closer Approximation to Re-Arm Using SentryAdding a resolved response level, as described above, gives very similar resultsto the Systems Monitor re-arm function. It differs in one way: if the monitorvalue exceeds the alarm level and then drops, but not below the resolved level, itwill generate another alarm event when it next exceeds the level. By contrast,re-arm causes a new alarm to be triggered only when the monitor has firstdropped below the resolved level.
In most cases, this slightly different behavior is not a problem and werecommend using this approach. However, if you want to replicate the re-armfunction more precisely, the script shown in Figure 91 on page 105 will allowyou to do so.
104 Migrating from Systems Monitor to TME 10 Distributed Monitoring

This soft copy for use by IBM employees only.
#!/bin/ksh######################################################################### FILE: sentry_rearm## This script is an example from IBM redbook SG24-4936. It is made freely# available on the understanding that it is unsupported sample code only.## DESCRIPTION:# This script replicates the re-arm capability of Sysmon threshold table and# file monitor table entries in Sentry.# The script should be run as an action from a sentry monitor. It alters the# response level of critical, severe or warning temporarily, until a ″resolved″# response resets it to the normal value.## ARGUMENTS:# When invoked from critical, severe or warning, 2 arguments required.# When invoked from resolved, 3 arguments required# (1) The new comparator for the response level (ie: ″->>″ for increases beyond)# (2) The new threshold level to be compared against# (3) The response level to set (only needed for ″resolved″ action)## For example:## On the critical response level, execute:# /usr/local/bin/sentry_rearm ″->>″ 80 to set the new ″increases beyond″# value to 80# On the resolved response level, execute:# /usr/local/bin/sentry_rearm ″->>″ 90 critical to reset the threshold to 90## RESTRICTIONS:# This script uses the ″execute program″ option for the monitor response levels,# so you cannot have another program executed.# It also needs appropriate TME administrator authority to run.## AUTHORS: Graeme Naysmith IBM UK# Rob Macgregor ITSO-Raleigh#######################################################################
# Note: uses environment vars supplied by Sentry: $NAME, $HOSTNAME and# $MONITOR and $RESPONSELEVEL. Would use $INTERNAL_ID, but could not make# it work in this version of Sentry, so extract it using wlsmon instead.
# Get the internal monitor IDwlsmon $NAME″@″$HOSTNAME | grep ″$MONITOR($PROBE_ARG″ | awk ′ {print $1 }′ | read INTERNAL_ID
# Check if a rearm or an armif [[ $RESPONSE_LEVEL != ″resolved″ ]]thenwsetmon -c $RESPONSE_LEVEL -R ″$1″ ″$2″ $INTERNAL_ID $NAME″@″$HOSTNAME >&1
elsewsetmon -c $3 -R ″$1″ ″$2″ $INTERNAL_ID $NAME″@″$HOSTNAME
fi
wdistrib -l over_all @SentryProfile:$NAME″@″$HOSTNAME @ManagedNode:$HOSTNAME
exit
Figure 91. An Example of Providing Re-Arm within a Sentry Monitor
The first thing the script does is to determine the internal ID of the monitor andstore it in the $INTERNAL_ID variable since this is needed with the wsetmoncommand. The wsetmon command is then used to update the monitor, but notethat it only updates the copy on the monitored system. This means that thethreshold value will be reset only on the system that has the problem, not on thebase Sentry profile. Finally the script updates the sentry_engine on themonitored system using the wdistrib command.
To use the script, you must run it as an action from the monitor response level.Figure 92 on page 106 shows how to invoke sentry_rearm for the same test that
Chapter 5. TME 10 Distributed Monitoring Examples 105

This soft copy for use by IBM employees only.
we used before (a file system percentage full monitor for /var). In addition toadding the command invocation to the response levels, you must also check thatthe monitor is running with a user ID that has the necessary access to themonitor profiles. See 5.2.2, “Automating Daemon Recovery” on page 67 for adescription of how to do this.
Figure 92. Defining Monitors to Use the sentry_rearm Script
The monitor behavior that results from this definition is as follows:
1. The utilization goes above 90% for the first time. This causes an alert to popup and invokes sentry_rearm with arguments ″- > > ″ 80 (increases beyond80).
2. The util ization drops below 90%, but not below the re-arm level of 80%.
3. The util ization increases again above 90%. Nothing happens, because thethreshold condition (increases beyond 80) has not been met.
4. The utilization falls below 80%. The resolved response condition isdecreases below 80, so a resolved message pops up and sentry_rearm isinvoked with arguments ″- > > ″ 90 warning. This sets the warning responselevel back to increases beyond 90 again, thereby restarting the cycle.
106 Migrating from Systems Monitor to TME 10 Distributed Monitoring

This soft copy for use by IBM employees only.
5.6 Advanced Process MonitoringIn this section we show some examples for advanced process monitoring,namely:
• Monitoring multiple processes
• Monitoring process groups
The first example is a script that can be used with both Systems Monitor andTME 10 Distributed Monitoring, the second example will be implemented in amonitoring collection using TME 10 Distributed Monitoring’s MCSL language.
5.6.1 Monitoring Multiple ProcessesThe applications running on a UNIX server can be very complex, involving anumber of related processes. Often we would like to monitor a number ofprocesses as a group, as opposed to monitoring single processes.
We created a shell script that will look for a list of processes being up or down.The first time a process is found to be down, an event is sent to a managementplatform (this is TME 10 NetView in our example but could be T/EC also). We donot alert multiple times but send a message if the process is up again.
The script is shown in the following figure:
Chapter 5. TME 10 Distributed Monitoring Examples 107

This soft copy for use by IBM employees only.
#!/bin/kshexport TRAP=/usr/local/bin/sendtraphost_name=`hostname`pscheckdata=/usr/local/log/pscheck.datlogstart=/usr/local/log/process_check.log# Check that the processes listed in pscheck.dat are running.# make a list of all processespstext=$(ps -e | awk ′{ print $4}′ | sort | uniq )# check all lines in pscheck.dat exlcuding lines starting with a hashcat $pscheckdata | while read idoecho $i | grep -v ″¬#″ > /dev/null 2>$1if [[ $? -eq 0 ]]then
echo $i | cut -d: -f1 | read processecho $i | cut -d: -f2 | read alertecho $i | cut -d: -f3 | read alert_text
echo $pstext | grep $process > /dev/null 2>&1if [[ $? -eq 0 ]]
thenif test -f ″ /usr/local/log/pscheck.$process″
thenprint `date` ″$process is now running″ >> $logstart
$TRAP 7 ″$process is now running″rm -f /usr/local/log/pscheck.$process
fielse
# make a note that this process is dead so we remember not to# alert multiple timesif test -f ″ /usr/local/log/pscheck.$process″
thenprint `date` ″$process is still not running, no alert sent″ >> $logstartcontinue
elseprint `date` ″$process is not running - alert sent″ >> $logstart$TRAP $alert ″$alert_text″touch /usr/local/log/pscheck.$process
fifi
fidone
Figure 93. Shell Script to Check Mult iple Processes
In order to keep the script flexible the processes that are to be monitored arespecified in a configuration file called /usr/local/log/pscheck.dat. An example ofsuch a configuration file is shown below.
# Check for inactive processes# Format is# process name:Alert Number:Alert Text## Process checking for#syslogd:2:syslogd is downsendmail:2:sendmail is down
Figure 94. Configuration File for check_processes
The script reads the configuration file and then checks for the existence of eachof the processes specified in the configuration file. The first time the script findsthat the process is either running or not, it sends an SNMP trap to TME 10NetView. For this the script assumes that the appropriate form of the snmptrap
108 Migrating from Systems Monitor to TME 10 Distributed Monitoring

This soft copy for use by IBM employees only.
command is stored in the /usr/local/bin/sendtrap shell script. This script willsend the trap to the appropriate NetView machine, community, etc.
Once a trap has been sent, a lock file is created. The next time the same stateis found again and the lock file exists, no further trap is sent until the statechanges again and the lock file is erased.
5.6.2 Monitoring Process GroupsA system administrator often has requirements for process monitoring that arenot covered by standard monitors. We show you a new monitor that is able todo some advanced process monitoring and two examples of how parameterscan be set.
Think of an Oracle RDBM system. Usually, there must be at least five databaseprocesses running, ora_reco_, ora_smon_, ora_lgwr_ and ora_dbwr_. For thisexample it is sufficient to know that these processes must be running and if atleast one is missing, a note to the database administrator will be sent.
The following command will check the number of Oracle processes:
ps -ef | grep -y ″ora_[reco|dbwr|lgwr|smon|pmon]_″ | wc -l
If the result of the above command is 5, everything seems to be OK. Since thestandard Universal monitor for Application Status delivered with TME 10Distributed Monitoring does not deal with wildcards, pipes or other specialcharacters we have to write a new monitor with such capabilities.
The second example deals with looking for processes with flags. Sometimes itis not enough to know that a process with a given name is running. There maybe multiple copies of that executable running, with different flags or commandline arguments. ADSM is an example of this. You want to make sure that yourscheduled ADSM process is up and running. The process line we are looking foris:
dsmc sched -pass=
Once again the standard monitors provided by Systems Monitor and Sentry donot handle this.
Our idea is therefore to create a monitor with two parameters. The monitor willexecute a command of the form:
ps $Argument1 | grep $Argument2 | grep -v grep | wc -l
The variable Argument1 holds the parameters passed to the ps command itself,while the variable Argument2 contains the search string for the ps output.
In the example where we want to monitor Oracle, Argument1 is -ef andArgument2 is:
-y ″ora_[reco|dbwr|lgwr|smon|pmon]_″
Look at Figure 95 on page 110 to see how this is specified in the monitor we willcreate in this example.
Chapter 5. TME 10 Distributed Monitoring Examples 109

This soft copy for use by IBM employees only.
Figure 95. Example of Monitor ing Process Groups, Database Processes
In the example, monitoring ADSM, Argument1 is again -ef. Argument2 is:
″dsmc sched -pass=″″
We will create the new monitor using MCSL as we did before for the CPUmonitoring example (see 5.3.3, “Monitoring UNIX CPU Utilization Using MCSL”on page 81). We will not explain the MCSL syntax in detail here.
$ key=generic_help1 This collection deals with extended process monitoring$ key=Descr_imbedded2 Advanced monitoring$ key=val_Descr3 Process Status$ key=Help4 This Monitor checks the availability of a process, optionally \with additional flags. It returns the number of running processes which fit the arguments$ key=ps_flags5 Flags for ps$ key=grep_list6 Flags + Arguments for grep
The message file for the new monitor is shown below:
Figure 96. process.msg File
To compile the message file, type:
gencmsg process.msg
110 Migrating from Systems Monitor to TME 10 Distributed Monitoring

This soft copy for use by IBM employees only.
+1+2 #include ″Sentry2_0.dsl″+3 #include ″process.dsl″+4 +5 Collection ″Process″ { +6 CodeID = ″$Id:process.csl,v 1.0$″ ; +7 Version = ″1.0″; +8 Require = ″>2.0.2″; +9 HelpMessage = (process_generic_help);+10 EventBaseClass = ″Sample_Sentry_Monitors″ ;+11 NoticeGroup = ″Sentry″ ;+12 NoticeGroup = ″Sentry-log″ ;+13 NoticeGroup = ″Sentry-urgent″ ;+14+15 #include ″operators.csl″+16 #include ″choicelists.csl″+17 #include ″formats.csl″+18+19 Monitor imbedded Numeric Group numeric {+20 Description = (process_Descr_imbedded);+21+22 ValueDescription = (process_val_Descr);+23 HelpMessage = (process_Help);+24 Argument (process_ps_flags)+25 DefaultValue ″-ef″ ;+26 Argument (process_grep_list);+27+28 Implementation (aix3-r2, aix4-r1)+29 Shell(″ /bin/sh″, ″-c″ , Command, ″process″ )+30 .a=$1+31 .b=$2+32 .echo ps $a \| grep $b \| grep -v grep \| wc -l > /usr/local/log/grep.in+33 . (. /usr/local/log/grep.in)+34 ;+35 };+36 }+37
The source code file for the monitor looks as follows:
Figure 97. process.csl File
The monitor uses two arguments, ps_flags which specifies the flags to be usedwith the ps command and grep_list that specifies what to search for in the psoutput. The implementation of the monitor returns an integer value that containsthe number of processes found matching the criteria.
To compile the monitor on AIX, use the following command:
mcsl -P /usr/ccs/lib/cpp -x process.col process.csl -lang-c++ -nostdinc -undef
After stopping and starting oserv, the new monitor will be available.
Remember
This monitor example is also in the sample code package for this book. Youwill find it as one of the options in the Redbook_samples monitoringcollection.
See Appendix B, “How to Get the Samples in This Book” on page 141.
Chapter 5. TME 10 Distributed Monitoring Examples 111

This soft copy for use by IBM employees only.
5.7 Hardware Alerting from AIX Error ReportThe AIX operating system has a mighty error logging facility. As a systemadministrator you should periodically look at the error report to find out if yoursystem has any problems. Ideally you want to be informed automatically andimmediately if some really serious conditions, such as hardware problems,occur.
The error reporting mechanism allows for asynchronous alerting. Instead ofhaving a monitor that checks your error report automatically at a scheduled timeyou can add a new error notification method to the AIX Object DatabaseManager (ODM) which will be invoked by the error daemon in the event ofserious errors and send a notification to a management platform. The followingimplementation is valid for both Systems Monitor and TME 10 DistributedMonitoring but goes into more detail for TME 10 Distributed Monitoring to showthe capabilities of an asynchronous monitor.
In our example we will look for all errors that have the alertable flag set to true.If you are not familiar with the error reporting and/or ODM manipulations youshould be especially careful when making modifications and always refer toInfoExplorer, the manual, or the man pages first.
First, you may want to have a look at your existing error log notificationmethods. Type the following commands:
odmget errnotify > /tmp/errnotify_originalvi /tmp/errnotify_original
Look at the /tmp/errnotify_original file. Every method filters for one or more ofthe fields in the error templates, such as en_symptom, en_alertflg or en_label. Ifthe error event fits the requirements, the program specified under an en_methodwill be run. We will create our own method, triggered by any events having theen_alertflg flag set.
5.7.1 Creating the Sentry Asynchronous Monitor ScriptOur error notification method will in fact be a simple shell script,/usr/local/bin/errpt/errpt_notif ication. The error notification interface passes theID of the actual error report entry to the method.
The /usr/local/bin/errpt/errpt_notification script contains only a few lines:
. /etc/Tivoli/setup_env.sh/usr/local/Tivoli/bin/aix4-r1/bin/wasync -c errpt -s 0 -i ″`/usr/bin/errpt -al $1`″
The script sets up the Tivoli environment in the first line and then calls anasynchronous monitor, by means of the wasync command. The arguments forthe wasync command are:
-c errpt Name of the Sentry channel
-s 0 No trigger data for the monitor
-i ‘/usr/bin/errpt -al $1‘ The details of the error report entry are passedto the monitor
Next we need to create a Sentry asynchronous string monitor to catch thiswasync request. Figure 98 on page 113 shows how to do this from the GUI.
112 Migrating from Systems Monitor to TME 10 Distributed Monitoring

This soft copy for use by IBM employees only.
Inside the monitor we define that at the always response level a pop-up windowwill open.
Figure 98. Definition of the Asynchronous Monitor Using Channel errpt
5.7.2 Installing the Error Notification MethodThe notification method is defined as a sequence of attributes listed in an inputfile, as shown in Figure 99
errnotify:en_pid = 0en_name = ″all_alertable″en_persistenceflg = 1en_label = ″″en_crcid = 0en_class = ″″en_type = ″″en_alertflg = ″TRUE″en_resource = ″″en_rtype = ″″en_rclass = ″″en_symptom = ″″en_method = ″ /usr/local/errpt/errpt_notification $1″
Figure 99. New Method for AIX Error Notification
To add this error notification method to the ODM, enter:
odmadd <method_definition_file>
Chapter 5. TME 10 Distributed Monitoring Examples 113
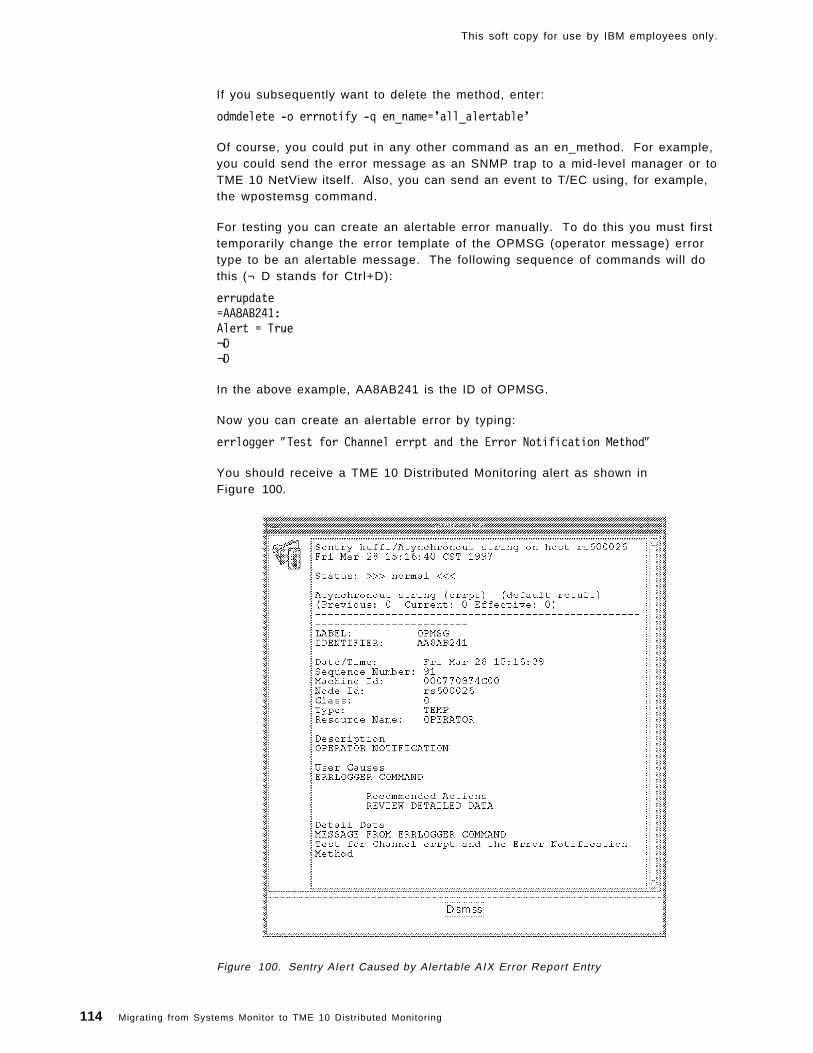
This soft copy for use by IBM employees only.
If you subsequently want to delete the method, enter:
odmdelete -o errnotify -q en_name=’all_alertable’
Of course, you could put in any other command as an en_method. For example,you could send the error message as an SNMP trap to a mid-level manager or toTME 10 NetView itself. Also, you can send an event to T/EC using, for example,the wpostemsg command.
For testing you can create an alertable error manually. To do this you must firsttemporarily change the error template of the OPMSG (operator message) errortype to be an alertable message. The following sequence of commands will dothis (¬ D stands for Ctrl+D):
errupdate=AA8AB241:Alert = True¬D¬D
In the above example, AA8AB241 is the ID of OPMSG.
Now you can create an alertable error by typing:
errlogger ″Test for Channel errpt and the Error Notification Method″
You should receive a TME 10 Distributed Monitoring alert as shown inFigure 100.
Figure 100. Sentry Alert Caused by Alertable AIX Error Report Entry
114 Migrating from Systems Monitor to TME 10 Distributed Monitoring
This soft copy for use by IBM employees only.
After you have verified that the error notification works you should reset thetemplate of the operator message back to non-alertable:
errupdate=AA8AB241:Alert = False¬D¬D
5.8 Generic File System MonitoringGeneric file system monitoring, as opposed to hard-coding each file system canreduce the maintenance overhead in a large environment. If a new critical filesystem is added by a user, the administrator normally has to add a monitor andre-distribute the profile every time.
A more efficient method is to monitor all file systems and use an exception listfor file systems such as /cdrom or /usr/sys/inst.images that do not need to bemonitored.
5.8.1 Monitoring with Systems MonitorSystems Monitor MLM lends itself to this kind of monitoring by allowing for awildcard definition in the MIB extension. For example, you can create an MLMthreshold monitor to poll for the utilization of all file systems by specifying theMIB object for utilization in the SIA file system table and appending an asterisk(*) to signify ″all instances″. The MIB definition is therefore:
.1.3.6.1.4.1.2.6.12.2.5.2.1.4.*.
To perform the exception list processing you need to execute a shell script asthe action for this threshold. This script needs to convert the file system namefrom a dotted-decimal form into plain text. There is an example showing how todo this in IBM Systems Monitor Anatomy of a Smart Agent, SG24-4398.
An alert can then be sent to NetView containing the file system name and thepercentage full value.
5.8.2 Monitoring with and/or Migration to SentryTo achieve the same effect using TME 10 Distributed Monitoring, a custommonitor is necessary. The custom monitor calls a shell script that executesplatform specific probes to check the status of file systems. The sample scriptpresented here has been tested on AIX, DGUX and HP-UX and SunOS.
Figure 101 on page 116 shows the source code of the script. It responds with amessage, containing the names and details of all file systems that exceed theutilization threshold value. If all of the file systems are within specification, itsimply responds with the text ″OK″. You therefore should use this script with aString script monitor and a response threshold of ″not equal to OK″.
Chapter 5. TME 10 Distributed Monitoring Examples 115

This soft copy for use by IBM employees only.
#!/bin/ksh######################################################################### FILE: sentry_filecheck## This script is an example from IBM redbook SG24-4936. It is made freely# available on the understanding that it is unsupported sample code only## DESCRIPTION:# This script can be run using the string script monitor. It checks# the utilization of all filesystems on the monitored system against# a predefined percentage value and reports any that have exceeded# it. It can optionally use a control file to exclude specific filesystems# from being monitored.## ARGUMENTS:# (1) The utilization threshold limit# (2) (optional) the name of the exclude file# (3) (optional) an additilnal list of filesystems to exclude## RETURNED VALUES:# A string containing the names and utilization of any file systems# that exceed the limit. If there are no exceptions, the script returns a# null string## AUTHORS: Graeme Naysmith IBM UK# Rob Macgregor ITSO Raleigh######################################################################### set filesystem threshold and exception file#fileused=$1exception_file=″ /usr/local/lib/sentry.exception.config″# Exception file contains a list of blank-separated filesystem names:# for example: /usr /usr/local/Tivoli
if (( $# > 1 ))then exception_file=$2fi
if [[ -r $exception_file ]]thencat $exception_file | read except_list
fi
if (( $# > 2 ))then except_list=″$except_list $3″fi
except=″egrep -v ″for fs in $except_listdoexcept=″$except$fs\$|″
doneexcept=″$except″″nothing″
curdate=`date`system=`uname`case $system in
AIX)
df | $except | awk -v maxsize=$fileused \′ BEGIN{header=″OK″; report=″″}{if (substr($4,1,length($4)-1)>maxsize || substr($6,1,length($6)-1)>maxsize){
Figure 101. sentry_filecheck Script (Part 1 of 2)
116 Migrating from Systems Monitor to TME 10 Distributed Monitoring
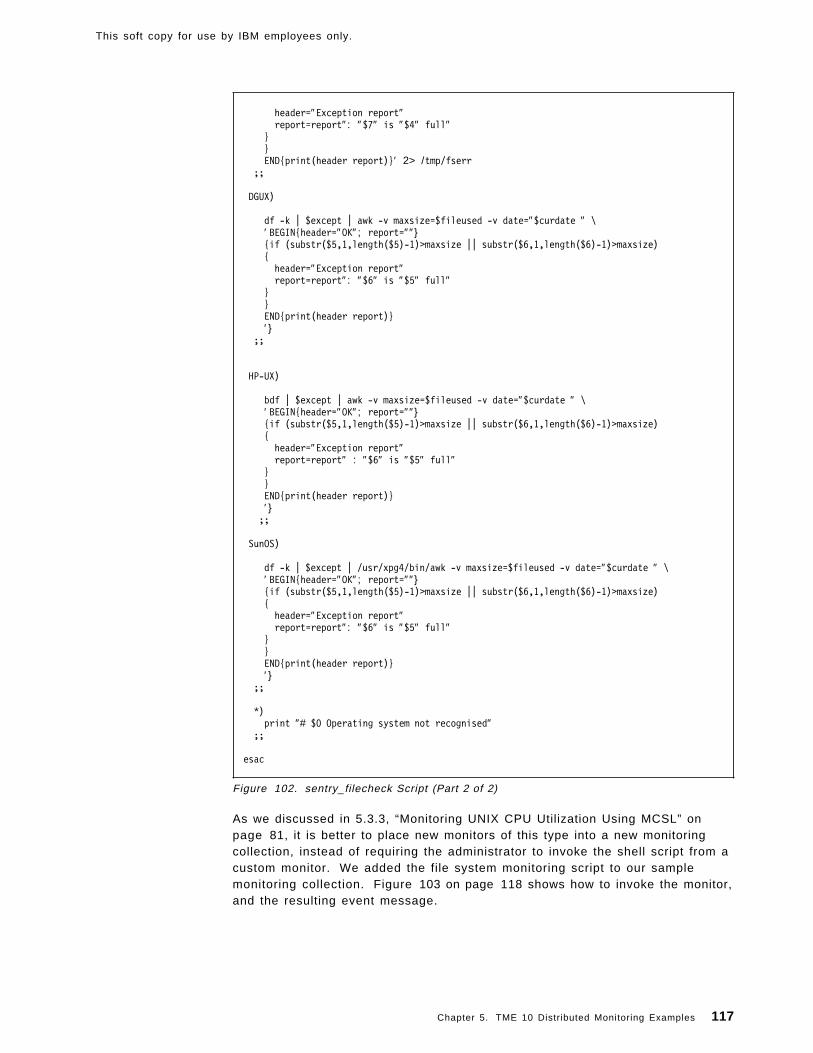
This soft copy for use by IBM employees only.
header=″Exception report″report=report″: ″$7″ is ″$4″ full″
}}END{print(header report)}′ 2> /tmp/fserr
;;
DGUX)
df -k | $except | awk -v maxsize=$fileused -v date=″$curdate ″ \′ BEGIN{header=″OK″; report=″″}{if (substr($5,1,length($5)-1)>maxsize || substr($6,1,length($6)-1)>maxsize){header=″Exception report″report=report″: ″$6″ is ″$5″ full″
}}END{print(header report)}′ }
;;
HP-UX)
bdf | $except | awk -v maxsize=$fileused -v date=″$curdate ″ \′ BEGIN{header=″OK″; report=″″}{if (substr($5,1,length($5)-1)>maxsize || substr($6,1,length($6)-1)>maxsize){header=″Exception report″report=report″ : ″$6″ is ″$5″ full″
}}END{print(header report)}′ };;
SunOS)
df -k | $except | /usr/xpg4/bin/awk -v maxsize=$fileused -v date=″$curdate ″ \′ BEGIN{header=″OK″; report=″″}{if (substr($5,1,length($5)-1)>maxsize || substr($6,1,length($6)-1)>maxsize){header=″Exception report″report=report″: ″$6″ is ″$5″ full″
}}END{print(header report)}′ }
;;
*)print ″# $0 Operating system not recognised″
;;
esac
Figure 102. sentry_filecheck Script (Part 2 of 2)
As we discussed in 5.3.3, “Monitoring UNIX CPU Utilization Using MCSL” onpage 81, it is better to place new monitors of this type into a new monitoringcollection, instead of requiring the administrator to invoke the shell script from acustom monitor. We added the file system monitoring script to our samplemonitoring collection. Figure 103 on page 118 shows how to invoke the monitor,and the resulting event message.
Chapter 5. TME 10 Distributed Monitoring Examples 117

This soft copy for use by IBM employees only.
Figure 103. Using the Al l Filesystems Monitor
Figure 104. Alert f rom Al l Filesystems Monitor
5.9 SNMP Proxy ForwardingThe TME 10 Distributed Monitoring proxy function allows monitoring of entitiesthat are not directly supported by TME 10 Distributed Monitoring, such asdevices or network components not capable of running the TME 10 DistributedMonitoring engine.
The proxy feature is accomplished by running a monitor on a managed node thatanalyzes the availability of a host, checks log files for messages, checks SNMPvalues or runs scripts with values set by the proxy’s environment variables. Themessage returned by the managed node running the monitor will be sent onbehalf of the endpoint defined in the TME 10 Distributed Monitoring proxy.
118 Migrating from Systems Monitor to TME 10 Distributed Monitoring

This soft copy for use by IBM employees only.
5.9.1 Monitoring with Systems MonitorDescribing all the SNMP monitoring features of Systems Monitor is beyond thescope of this book. Please refer to IBM Systems Monitor Anatomy of a SmartAgent, SG24-4398 for a detailed description of these features.
5.9.2 SNMP Monitoring with and/or Migration to SentryTME 10 Distributed Monitoring allows you to use SNMP monitoring collections.The following types of MIBs can be monitored:
• Compaq Insight Manager
• MIB-II (RFC 1213)
• User-specified
User-specified means that you can get and compute any simple variable youragent supports. Sentry uses its own SNMP commands, such as wsnmpget tocontact the agent. Since right now there is no command like wsnmpnext orwsnmpwalk available, you cannot get SNMP variables of the type table.
Compaq Insight Manager and MIB-II means nothing more than that the twocollections have monitors that use a symbolic name for specific MIB variablesfrom particular SNMP MIBs. Figure 105 shows how an rfc1213 monitor looksusing the symbolic name and Figure 106 on page 120 shows how the same canbe done with a user-specified monitor.
Figure 105. SNMP Monitor Using Symbolic Names
Chapter 5. TME 10 Distributed Monitoring Examples 119

This soft copy for use by IBM employees only.
Figure 106. User-Specified SNMP Monitor
5.9.2.1 SNMP Monitor Example with Proxies and IndicatorCollectionsTME 10 Distributed Monitoring does not have as many features for monitoringSNMP devices or variables as Systems Monitor, but you still can use it foreffective SNMP management. We will use the example of monitoring auser-specified MIB variable, 1.3.6.1.2.1.5.3 (icmp.icmpInDestUnreachs = thenumber of ICMP Destination Unreachable messages received) at an OS/2machine.
The MIB variable we are looking at is a good point to look at, for example, if amachine has a corrupted routing table or an application tries to reach a hostoutside the network. In either case you want to be warned about that fact.Perhaps you would log on to that machine, have a look at the netstat -rn outputand then figure out a possible reason for the problem.
Every time the client cannot reach a destination for any reason the counter of theMIB variable 1.3.6.1.2.1.5.3 will be increased by one. You can enforce an entryby pinging the non-existing host 1.1.1.1 and since this host is not reachablewithin your network, an icmp.icmpInDestUnreachs message will be sentincreasing the counter by one.
To see this you can type on the system where the proxy resides:
wsnmpget -h domingo -t 5 -c public 1.3.6.1.2.1.5.3.0
In the above line domingo is the hostname of the SNMP client, 5 is the time-outvalue, public is the SNMP community and 1.3.6.1.2.1.5.3.0 is the SNMP object.
120 Migrating from Systems Monitor to TME 10 Distributed Monitoring

This soft copy for use by IBM employees only.
Now try to ping the bogus machine:
ping 1.1.1.1
Wait a few seconds and then query the variable again by repeating thewsnmpget command.
5.9.2.2 Setting Up a Sentry Proxy EndpointEvery client you want to run your monitors on has to be defined in the Tivolidatabase. To achieve this we have to create a proxy endpoint. We can do thisby selecting Create from the menu bar in the Policy Region window and thenselecting Sentry Proxy... from the pull-down menu. The window shown inFigure 107 will appear.
Figure 107. Creating a Sentry Proxy Endpoint
We enter a name for the new Sentry proxy endpoint and then select the Create &Close button.
This creates an icon in the policy region representing the new proxy endpoint.Double-clicking on that icon will open the Proxy Endpoint window. In thiswindow we select Configure from the menu bar and then Set Environment...from the pull-down menu. The display shown in Figure 108 on page 122 willappear:
Chapter 5. TME 10 Distributed Monitoring Examples 121

This soft copy for use by IBM employees only.
Figure 108. Setting the Environment for Sentry Proxy Endpoint
We enter ENDPOINT in the Name field and domingo in the Value field and thenpress the Add/Set button to set the ENDPOINT variable. After that we enterENDPOINT_CLASS in the Name field and SentryProxy in the Value field andpress the Add/Set button again.
ENDPOINT contains the hostname of the system to be monitored andENDPOINT_CLASS is the Tivoli class name of the endpoint object.
We would need to repeat this step for each client we want to include. Of course,in a larger environment you would use the command line interface.
To create the proxy endpoint you can type:
wcrtprx region proxy endpoint_name
In our example:
wcrtprx ssd-region WTR05128 domingo_proxied
To set the environment variables you can type:
wcrtprxenv domingo_proxied ’ENDPOINT_CLASS=SentryProxy’ ’ENDPOINT=domingo’
5.9.2.3 Creating an Indicator CollectionCreating an indicator collection is a very easy step. In the Policy Region windowselect Create from the menu bar and then IndicatorCollection... from thepull-down menu. Give the indicator collection a name (we useSNMP_proxied_Dest_unreachable) and select Create & Close . This will createan icon in your policy region representing the new indicator collection.
5.9.2.4 Creating a User-Specified SNMP MonitorWe already showed in 5.9.2, “SNMP Monitoring with and/or Migration to Sentry”on page 119 how to set up a user-specific SNMP monitor. Just update the MIBvariable to 1.3.6.1.2.1.5.3.0.
Do not forget to tell the profile manager, in which the profile resides, that it hassome new subscribers. In fact, all the proxy endpoints created before shouldsubscribe to the same profile manager. Look at Figure 109 on page 123 to seehow we set up the triggering. Every time the value of the SNMP variable
122 Migrating from Systems Monitor to TME 10 Distributed Monitoring

This soft copy for use by IBM employees only.
increases by 3 or more, the indicator collection will be notified. This is specifiedby checking Change Icon .
Figure 109. Sentry Profi le for Proxy Monitor ing
Finally, we have to tell the monitor with which indicator collection it is connected.In the Profile Properties window of the Sentry profile select Monitoring from themenu bar and then Select Indicator Collection... from the pull-down menu. Thenselect the indicator collection you have created before from the list and pressthe Select & Close button.
Now distribute the profile again and double-click at the proxy endpoint. Youshould get a window as shown below:
Chapter 5. TME 10 Distributed Monitoring Examples 123
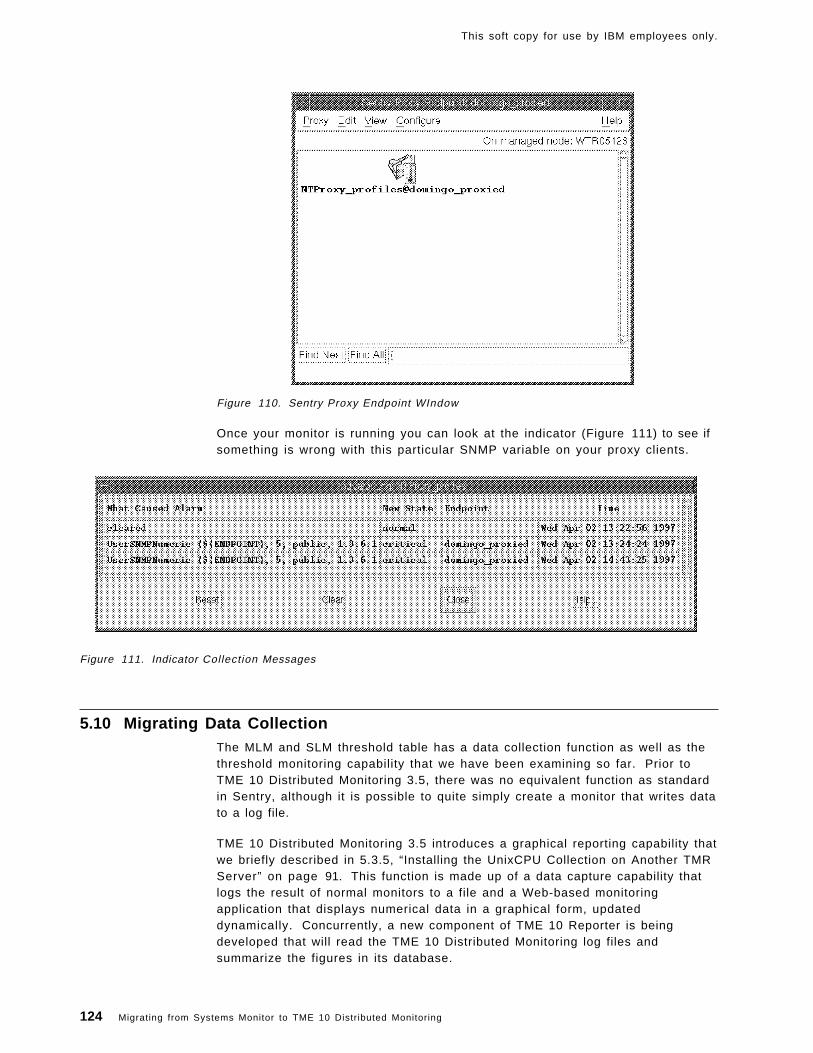
This soft copy for use by IBM employees only.
Figure 110. Sentry Proxy Endpoint WIndow
Once your monitor is running you can look at the indicator (Figure 111) to see ifsomething is wrong with this particular SNMP variable on your proxy clients.
Figure 111. Indicator Collection Messages
5.10 Migrating Data CollectionThe MLM and SLM threshold table has a data collection function as well as thethreshold monitoring capability that we have been examining so far. Prior toTME 10 Distributed Monitoring 3.5, there was no equivalent function as standardin Sentry, although it is possible to quite simply create a monitor that writes datato a log file.
TME 10 Distributed Monitoring 3.5 introduces a graphical reporting capability thatwe briefly described in 5.3.5, “Installing the UnixCPU Collection on Another TMRServer” on page 91. This function is made up of a data capture capability thatlogs the result of normal monitors to a file and a Web-based monitoringapplication that displays numerical data in a graphical form, updateddynamically. Concurrently, a new component of TME 10 Reporter is beingdeveloped that will read the TME 10 Distributed Monitoring log files andsummarize the figures in its database.
124 Migrating from Systems Monitor to TME 10 Distributed Monitoring

This soft copy for use by IBM employees only.
The graphical data collection facility is more fullly described in A First Look atTME 10 Distributed Monitoring 3.5, SG24-2112.
5.10.1 Installing the Data Collection FunctionThe data collection and graphing function is delivered as an additional TMEcomponent on the TME 10 Distributed Monitoring CD. The product title isTivoli/Spider HTTP Daemon/1.0. Install it as you would any other TMEapplication. It has to be installed on all managed nodes for which you want tocollect graphical data.
When you have installed the feature, a new process will be automatically startedon each system. This is called Spider and it is a special-purpose Web server.Do not be concerned if you already have a Web server running on a managednode. Spider does not listen on the default HTTP port (tcp/80), but on adynamically assigned TCP port instead, so it will not conflict with existingapplications.
Once you have installed the graphical monitoring component, the next step is todefine some Sentry monitors to collect data, so that you can display it ingraphical form.
5.10.2 Collecting Monitor DataStarting the data collection facility is a very simple process. You create a newSentry monitor within a profile in the normal way. In the monitor definitionpanel, select a response level of always and click on Tasks in the action section.Figure 112 shows an example of doing this for a monitor that records the freespace in a UNIX file system.
Figure 112. Defining an Always Response
In the Tasks dialog, select Sentry Graphable Logs as the task library and selecttask Create Graphable Log (see Figure 113 on page 126).
Chapter 5. TME 10 Distributed Monitoring Examples 125

This soft copy for use by IBM employees only.
Figure 113. Defining the Logging Task
When you define the Create graphable log task you will be prompted to specifyhow many lines of data it should keep. The default is 1000. In most cases thiswill be plenty big enough. For example, if you are collecting at 10-minuteintervals, and intend to archive the logged data daily, you only need 144 datavalues.
The data files are stored in a directory on the managed node where the Sentryengine is running, under the Tivoli database directory:
$DBDIR/.sntglog/<Systemname>/<Profilename>/<Monitor_type><ObjID>
Where:
• $DBDIR is the Tivoli database directory on the managed node.
• <Systemname> is the name of the system where the data was collected(usually the system where sentry_engine is running, but it could be anothersystem in the case of a proxy monitor, for example).
• <Profilename> is the name of the TME 10 Distributed Monitoring profilecontaining the monitor, Unix_Disk in our example above.
126 Migrating from Systems Monitor to TME 10 Distributed Monitoring
This soft copy for use by IBM employees only.
• <Monitor_type> is a string identifying the type of monitor. It contains thename of the monitoring collection concatenated with the internal name of themonitor itself. In the example above it is Unix_Sentry-diskavail.
• <ObjID> is an identif ier containing an oserv object ID number.
Within the directory are two files, info which contains details of the monitor, andlog that contains the data itself.
5.10.3 Extracting Logged Data from the Command LineWe described how the data collection task writes its log files in 5.10.2,“Collecting Monitor Data” on page 125. If you only want to show this data in agraphical form, the Web-based mechanism is very effective. However, you maywant to extract the collected data and use it as input for some other processing,or load it into a database or a spreadsheet.
Data is logged as a single stream of bytes, containing the timestamp, value, andmonitor status concatenated together. This is not particularly easy to parse intouseful records. Fortunately there is a program, wgdread, which will format therecords for you. It is not documented, but you can get a good understanding ofhow it works by looking at CGI scripts in the graphical monitoring applicationsthat use it.
The syntax is as follows:
wgdread [-r]|[-y]|[-u]|[-s [-b <min>] [-e <max>] [-c <count>] logdir
-r returns the range of x-values (times) of the records in the log file
-y returns the range of y-values of the records in the log file
-u returns the units in which the y-values are measured
-s prints out the logged values for the range of times bounded by<min> and <max> to a max imum o f <coun t> l i nes
logdir This is the directory containing the info and log files for the monitor
As an example, Figure 114 on page 128 shows the use of wgdread to displaypart of a log file containing the status of a daemon. Note that this is created bya string monitor, so it would not be accessible using the graphing facility.
Chapter 5. TME 10 Distributed Monitoring Examples 127

This soft copy for use by IBM employees only.
>pwd/var/spool/Tivoli/venus.db/.sntglog/venus/Unix_Disk>>lsUnix_Sentry-daemon_7e1080755863.2.7 Unix_Sentry-diskavail_6e1080755863.2.7>>wgdread -r Unix_Sentry-daemon_7e1080755863.2.7″Unix_Sentry-daemon_7e1080755863.2.7″ 861252060 861311220 normal \warning severe critical>>wgdread -s -b 861296700 -c 10 Unix_Sentry-daemon_7e1080755863.2.7861296701 down normal861296820 down normal861296940 down normal861297060 down normal861297180 down normal861297301 up normal861297420 up normal861297540 up normal861297660 up normal861297780 up normal>
Figure 114. Examples of the wgdread Command
The timestamps in these records are not very recognizable. This is becausethey are in fact specified as epoch times, that is, they are a hexadecimalrepresentation of the number of seconds since the beginning of 1970. Theeasiest way to convert these into something more meaningful is to use a perlprogram. Perl provides a number of built-in functions for manipulating timefields. Figure 115 shows a simple perl program that can be used as a filter forthe output of wgdread and Figure 116 on page 129 shows an example of using iton the same data as in the previous example.
#!/usr/local/bin/perl
$line = <STDIN> ;
while ($line != ″″) {@inparts = split(/ /, $line) ;@tlist = localtime($inparts[0]) ;print ( $tlist[5],″ / ″ ,$tlist[4],″ / ″ ,$tlist[3],″ ″ ,$tlist[2],
″ : ″ ,$tlist[1],″ : ″ ,$tlist[0],″ ″ ,$inparts[1],″ ″ ,$inparts[2],″\n″) ;$line = <STDIN>}
Figure 115. convert_times Perl Script
128 Migrating from Systems Monitor to TME 10 Distributed Monitoring

This soft copy for use by IBM employees only.
>wgdread -s -b 861296700 -c 10 Unix_Sentry-daemon_7e1080755863.2.7 | convert_times97/3/17 13:5:1 down normal97/3/17 13:7:0 down normal97/3/17 13:9:0 down normal97/3/17 13:11:0 down normal97/3/17 13:13:0 down normal97/3/17 13:15:1 up normal97/3/17 13:17:0 up normal97/3/17 13:19:0 up normal97/3/17 13:21:0 up normal97/3/17 13:23:0 up normal
Figure 116. Extracting Historical Data with Date and Time Conversion
Chapter 5. TME 10 Distributed Monitoring Examples 129

This soft copy for use by IBM employees only.
130 Migrating from Systems Monitor to TME 10 Distributed Monitoring
This soft copy for use by IBM employees only.
Chapter 6. Installation Notes and Trouble Shooting
During the project we set up a number of different TME configurations spanningseveral different operating systems and network environments. We will notdescribe the installation and customization process in any detail here, but wewill briefly discuss some of the problems we encountered, and their resolutions.
6.1 Installation NotesWe used the following monitoring products for our testing:
• Systems Monitor SIA 2.3.1.0
• Systems Monitor MLM 2.3.1.0
• Systems Monitor CFG 2.3.1.0
• Tivoli/Sentry 3.0.2
• Tivoli/Sentry 3.5
Also, since TME 10 Distributed Monitoring is a TME 10 Framework application wehad to install the TME 10 Framework and organize the machines in our setupinto Tivoli Management Regions (TMRs). We used the following levels ofFramework and support code:
• TME 10 Framework 3.1 Revision C with patch 0002 installed
• TME 10 ADE 3
Because Systems Monitor is primarily an AIX application, most of our testmachines were RS/6000s, running AIX 4.1.4, 4.1.5 and 4.2. We also had anHP9000 running HP-UX 9.0.5 and a Sun Sparc 20 running Solaris 2.5, plus anumber of Windows NT and OS/2 systems.
6.1.1 Installation of the TME 10 FrameworkFor a detailed description of how to install and configure the TME 10 Frameworkrefer to the redbook TME 10 Cookbook for AIX, SG24-4867. On each system weperformed a number of additional setup steps:
• Added .profile for the root user ID, invoking the Tivoli environment setupscript, as follows:
. /etc/Tivoli/setup_env.sh
• Added /usr/local/bin to the default path in /etc/environment.
• Created file system /var/spool/Tivoli with 80 MB on the TMR server, 20 MBon other managed nodes.
• Created file system /usr/local/Tivoli with approximately 100 MB (250 MB onthe T/EC server).
Copyright IBM Corp. 1997 131
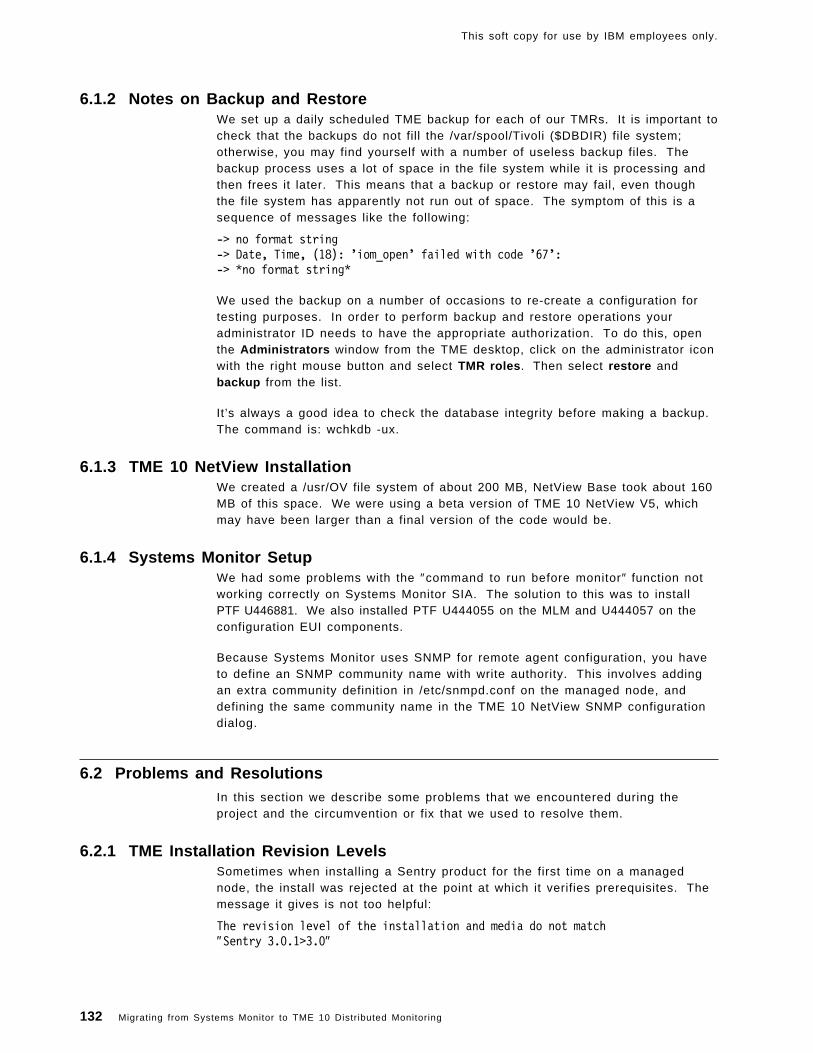
This soft copy for use by IBM employees only.
6.1.2 Notes on Backup and RestoreWe set up a daily scheduled TME backup for each of our TMRs. It is important tocheck that the backups do not fill the /var/spool/Tivoli ($DBDIR) file system;otherwise, you may find yourself with a number of useless backup files. Thebackup process uses a lot of space in the file system while it is processing andthen frees it later. This means that a backup or restore may fail, even thoughthe file system has apparently not run out of space. The symptom of this is asequence of messages like the following:
-> no format string-> Date, Time, (18): ’iom_open’ failed with code ’67’:-> *no format string*
We used the backup on a number of occasions to re-create a configuration fortesting purposes. In order to perform backup and restore operations youradministrator ID needs to have the appropriate authorization. To do this, openthe Administrators window from the TME desktop, click on the administrator iconwith the right mouse button and select TMR roles . Then select restore andbackup from the list.
It’s always a good idea to check the database integrity before making a backup.The command is: wchkdb -ux.
6.1.3 TME 10 NetView InstallationWe created a /usr/OV file system of about 200 MB, NetView Base took about 160MB of this space. We were using a beta version of TME 10 NetView V5, whichmay have been larger than a final version of the code would be.
6.1.4 Systems Monitor SetupWe had some problems with the ″command to run before monitor″ function notworking correctly on Systems Monitor SIA. The solution to this was to installPTF U446881. We also installed PTF U444055 on the MLM and U444057 on theconfiguration EUI components.
Because Systems Monitor uses SNMP for remote agent configuration, you haveto define an SNMP community name with write authority. This involves addingan extra community definition in /etc/snmpd.conf on the managed node, anddefining the same community name in the TME 10 NetView SNMP configurationdialog.
6.2 Problems and ResolutionsIn this section we describe some problems that we encountered during theproject and the circumvention or fix that we used to resolve them.
6.2.1 TME Installation Revision LevelsSometimes when installing a Sentry product for the first time on a managednode, the install was rejected at the point at which it verifies prerequisites. Themessage it gives is not too helpful:
The revision level of the installation and media do not match″Sentry 3.0.1>3.0″
132 Migrating from Systems Monitor to TME 10 Distributed Monitoring

This soft copy for use by IBM employees only.
What this means is that you have installed a product on the TMR server and thenapplied patches to bring it to a higher level (in this case, 3.0.1). Now you areinstalling the base on a managed node in the TMR, but Sentry requires that theserver’s and client’s code levels match and therefore kills the request. Thisproblem is not limited to Sentry, and there are a number of different ways to geta similar problem, depending on the order in which you install the distributedsystems.
The fix is to fool the install process into thinking that the levels match. Firstenter the following on the server:
idlcall `wlookup -r ProductInfo Sentry2.0.2` _get_revision
In the case of the error message shown above, the response from this should be″3.0″. Next update the apparent revision level:
idlcall `wlookup -r ProductInfo Sentry2.0.2` _set_revision ’″3.0″’
You should check that this worked using the same display command as before:
idlcall `wlookup -r ProductInfo Sentry2.0.2` _get_revision
Now you should be able to continue with the installation.
6.2.2 Sentry Engine Not RunningOnce or twice we found that monitors were not working because the Sentryengine had stopped running on the system (either due to a failure or because wehad manually stopped it). This presents a dilemma, because although there is acommand to stop the engine, the wstopeng command, there is no equivalentwstarteng command. Normally the engine is started automatically when theobject dispatcher, oserv, starts.
The solution to this is simply to query the engine status:
wlseng <hostname>
The engine should now restart.
6.2.3 Sentry Monitors Not WorkingThere are many reasons why Sentry monitors may not work as you expect themto, but the following sequence of checks should help you track down theproblem.
6.2.3.1 Check Monitor InstallationFirst, make sure that the monitor has been installed properly on the managednode and is scheduled to run. The command to do this is:
wlseng -l <hostname>
This shows you the monitors that the engine knows about, when they are nextexpected to run, and what the last response was. If you do not see your monitorhere, check that it is not disabled (the command does not list disabled monitors,unless you add the -d flag).
Chapter 6. Installation Notes and Trouble Shooting 133

This soft copy for use by IBM employees only.
6.2.3.2 Check Response Is What You ExpectIf the monitor is listed, the next thing to do is to set it to log to a file, so that youcan check the response. It may be that the monitor is working but the situationin which it would trigger a response is not occurring. The way to do this is to setthe ″Always″ response level on the monitor to log to a file.
6.2.3.3 Check PermissionsOn a number of occasions we experienced problems with monitors because theyneeded authorization to resources. This could be either a UNIX permissionsproblem or a problem of not having the necessary TME administrator authority.It can arise both in the monitor itself and also in automated actions on aresponse level.
The Sentry engine runs monitors under user ID nobody in group nobody bydefault. You can check whether your monitor will operate in this regime byswitching to user ID nobody and manually running it (use the command su -nobody to switch IDs). You can set the ID under which the monitor runs byopening the user profile window and selecting Edit followed by Set User & GroupID from the menu bar (see Figure 58 on page 71). You can check this settingwith the command:
wdumpstr <SentryProfile>
If your monitor needs to issue Tivoli commands (such as the example in 5.5.2, “ACloser Approximation to Re-Arm Using Sentry” on page 104) it will require aTME administrator ID. This means that the user ID under which the monitor runsmust map to an administrator ID with sufficient authority to do the job.
6.2.3.4 Custom Script Monitors Not WorkingThe following checklist may help if you have created a custom script that doesnot seem to work properly:
• Does the script print its result to stdout?
• Does it exit with return code zero (″exit 0″ in Korn shell script)?
• Does it set the execution environment? A monitor script must set the shell toexecute under in its first line (that is, ″#!/bin/sh″, or equivalent).
• Is the shell script executable by the user ID that the monitor is running under(default: nobody)?
One debug technique that we used was to modify the script to execute the envcommand to a log file, to see if it had the environment it needed.
6.2.4 Other ProblemsProblems beyond the errors described above are usually either related to load(trying to make the Sentry engine do too much) or are caused by code bugs. Inthe latter case, you should report them to Tivoli, but the techniques describedbelow may get you working again while waiting for a permanent fix.
On the question of load, you should keep in mind two things:
1. TME 10 Distributed Monitoring performs most of its work on the monitoredsystem. Be careful not to introduce monitors or actions that invoke TMEservices on every monitor cycle; otherwise, you will add a lot of traffic to thenetwork and the server. Any Tivoli CLI command requires at least two callsto the server to authenticate and check authorization.
134 Migrating from Systems Monitor to TME 10 Distributed Monitoring

This soft copy for use by IBM employees only.
2. Sentry engine works on one-minute boundaries for its monitoring processes.Within each one-minute slot, it checks for monitors that are scheduled to runand then runs them sequentially. This means that if you have a monitor thattakes an exceptionally long time to complete, or too many monitorsscheduled in the same time slot, you can overload the engine. Try to avoidsetting monitor intervals too short and beware of commands that can take along time to run.
We will now look at two specific problem symptoms and how to circumvent them.
6.2.4.1 Sentry Engine Internally BlockedIf you suspect that Sentry is not working and run the wlsmon command, you maysee a message that the engine is internally blocked. This usually means that ithas become overloaded and cannot process monitors or commands within thecurrent time slot. You should wait a short time and retry the command, but if theproblem that caused it to get blocked persists, the message will recur. Thelong-term solution is to reduce the load on the engine by cutting back thenumber and frequency of monitors and by identifying and fixing any monitorsthat may be taking a long time to run. However, to get the Sentry enginerunning again in the short term, you need to clear its queue of monitors to runand re-initialize it. The script shown in Figure 117 will clean up the engine.Redistribute monitors after running it.
#!/bin/sh########################################################## script to clear ″sentry engine internally blocked″ problem### using commands supplied by Sean Starke at Tivoli########################################################
if [ $# -ne 1 ]thenprint ″Please input hostname″exit
fi
. /etc/Tivoli/setup_env.sh
wlsengprint ″Clearing Sentry engine″
oid=`wlookup -r ManagedNode -n $1 SentryEngine`print $oid
idlattr -t -s ″$oid″ sentry_engine_state imp_SentryEngine::EngineState ′{0 0 0 ″″}′
#$BINDIR/TME/SENTRY/wclreng $1/usr/local/Tivoli/bin/aix4-r1/bin/wclreng $1
wlseng
exit 0
Figure 117. sentry_cleanup Script
Chapter 6. Installation Notes and Trouble Shooting 135

This soft copy for use by IBM employees only.
6.2.4.2 General Failure MessageSome Sentry problems are related to more serious oserv failures. In thesecases, the wclreng command may help to reset the monitoring processes. Afterrunning it, resynchronize with the server by redistributing the Sentry profiles withthe exact copy option.
136 Migrating from Systems Monitor to TME 10 Distributed Monitoring

This soft copy for use by IBM employees only.
Appendix A. Mapping SIA MIB Objects to Sentry MonitoringCollections
Systems Monitor SIA provides a great deal of information about the system it isrunning on. By comparison, TME 10 Distributed Monitoring has a much smallernumber of available monitors. Fortunately, a simple comparison of the numberof monitors is not the whole story. Many of the SIA system metrics are of limitedvalue, so you are unlikely to find them used in your configuration. On the otherhand, although there are far fewer Sentry monitors, they tend to be of morepractical use.
The SIA monitors are divided into a series of MIB tables. The tables and theobjects in them are identified by a name and by a MIB object ID (OID). Theequivalent Sentry monitor is listed beside it, plus some comments if there aredetail differences between the way the two values are calculated. If a SystemsMonitor MIB variable is not listed, there is no equivalent Sentry Monitor.
All of the monitors listed are from the Unix_Sentry monitoring collection,although several of them are also found in the Universal monitoring collection.
Table 6 (Page 1 of 3). List of Unix_Sentry Monitors
SIA MIB Identifier SentryMonitor
Comments
smSiaSystemDeviceEthernetMaxColl ision.1.3.6.1.4.1.2.6.12.2.3.3.2.1.36
Networkcollisions
Not an exact match, because the SIA MIBobject is part of of a table, with one row perEthernet interface, whereas the the Sentrymonitor is a sum taken over all interfaces.For a system with one Ethernet interfacethey should be equivalent.
smSiaSystemDeviceTokenRingRxErrCnt.1.3.6.1.4.1.2.6.12.2.3.2.2.1.15ORsmSiaSystemDeviceEthernetRxErrCnt.1.3.6.1.4.1.2.6.12.2.3.3.2.1.15
Input packeterrors
The SIA MIB objects are part of a table, withone row per network interface. The Sentrymonitor is a sum taken over all interfaces(of any type). On a system with one activenetwork interface they should be equivalent.
smSiaSystemDeviceTokenRingTxErrCnt.1.3.6.1.4.1.2.6.12.2.3.2.2.1.14ORsmSiaSystemDeviceEthernetTxErrCnt.1.3.6.1.4.2.6.12.2.3.3.2.1.14
Outputpacketerrors
As above
smSiaSystemDeviceTokenRingPktTxCnt.1.3.6.1.4.1.2.6.12.2.3.2.2.31
Outputpackets
The SIA MIB object is part of a table, so thesame comments as above apply.
smSiaSystemFreePagingSpace.1.3.6.1.4.1.2.6.12.2.4.1
Avai lableswap space
Identical
smSiaSystemPagingSpaceUsed Availableswap space
In fact this is not an equivalent monitor, butit is often used to track paging spaceutil ization. It is part of a table, with oneentry per paging space, so it may not be agood value to threshold on (one pagingspace could be much fuller then another).Consider using the available swap spacemonitor as a replacement.
Copyright IBM Corp. 1997 137

This soft copy for use by IBM employees only.
Table 6 (Page 2 of 3). List of Unix_Sentry Monitors
SIA MIB Identifier SentryMonitor
Comments
smSiaSystemPagingStatisticsPagesPagedOut.1.3.6.1.4.1.2.6.12.2.4.5.1.7
Page-outs The SIA MIB object is part of a table. It hasa sampling interval controlled by the settingof another MIB object,smSiaSystemPagingStatisticsPollingInterval.By contrast, the Sentry monitor has a fixedsampling interval of 5 seconds.If you set the SIA sampling interval to 5seconds, the two monitors should returnequivalent results, except that the SIAversion is in number of pages and theSentry version is in kilobytes.
smSiaSystemFilesystemFree.1.3.6.1.4.1.2.6.12.2.5.2.1.3
Space free SIA table has one row per file system, usingthe file system name as an index. Sentrymonitor requires the file system name as anargument.
smSiaSystemFileSystemPercentUsed.1.3.6.1.4.1.2.6.12.2.5.2.1.4
Percentspace used
As above
smSiaSystemFileSystemInodesUsed.1.3.6.1.4.1.2.6.12.2.5.2.1.5
Inodes used As above
smSiaSystemFileSystemInodesPercentUsed.1.3.6.1.4.1.2.6.12.2.5.2.1.6
Percentinodes used
As above
smSiaSystemProcessorPID.1.3.6.1.4.1.2.6.12.2.7.2.1.2
Daemonstatus
This is not really a direct match, but it canbe used for similar purposes.smSiaSystemProcess is a multi-line tablewith one row per active process. It containsinformation about the process, includingdetails like the process ID (PID) as in thiscase. This is often used with an exists testto see if a given daemon is running. TheSentry daemon status monitor does asimilar job.
smSiaSystemProcessState.1.3.6.1.4.1.2.6.12.2.7.2.1.11
Lingeringterminatedprocesses
The process state field is part of a table withone row per process. It returns anenumerated value that indicates the state ofthe process. A value of 5 indicates azombie process, that is, one that hasterminated but has not yet beenacknowledged by its parent. The Sentrymonitor returns a count of all suchprocesses on the system.
smSiaSystemUsersLoggedin.1.3.6.1.4.1.2.6.12.2.8.1
Userslogged in
Identical
smSiaCommandDisplayStringResult.1.3.6.1.4.1.2.6.12.4.1.1.13
String script The SIA command table can execute anycommand, whereas the Sentry monitoralways requires a script to execute.However, the same function is obtainable bywrapping the command within a script.You will also have to check the SIAcommand for use of Systems Monitorprovided environment variables.
138 Migrating from Systems Monitor to TME 10 Distributed Monitoring

This soft copy for use by IBM employees only.
Table 6 (Page 3 of 3). List of Unix_Sentry Monitors
SIA MIB Identifier SentryMonitor
Comments
smSiaCommandIntegerResult.1.3.6.1.4.1.2.6.12.4.1.1.14ORsmSiaCommandCounterResult.1.3.6.1.4.1.2.6.12.4.1.1.15ORsmSiaCommandGaugeResult.1.3.6.1.4.1.2.6.12.4.1.1.16
Numericscript
As above
Appendix A. Mapping SIA MIB Objects to Sentry Monitoring Collections 139

This soft copy for use by IBM employees only.
140 Migrating from Systems Monitor to TME 10 Distributed Monitoring

This soft copy for use by IBM employees only.
Appendix B. How to Get the Samples in This Book
You can download the code for all of the examples in this book from the Web.Go to http://www.redbooks.ibm.com and click on the Downloads link. You willfind the code package identified by the publication number, SG24-4936.
The package is a tar archive. Download it into a temporary directory on AIX andunpack it with the following command:
tar -xvf ./sg244936.tar
This will create three subdirectories:
• migration_scripts contains the chk_mig_cat and migrate_sysmon_config toolsto help you migrate Systems Monitor configurations to TME10 DistributedMonitoring.
• monitor_collection contains the redbook samples monitoring collection,which incorporates all of the custom monitors that we used in our examples,such as the UNIX CPU monitor, all file system monitors and several others.
• miscellany contains all of the other scripts that do not fall into the othercategories.
Copyright IBM Corp. 1997 141

This soft copy for use by IBM employees only.
142 Migrating from Systems Monitor to TME 10 Distributed Monitoring

This soft copy for use by IBM employees only.
Appendix C. Special Notices
This publication is intended to help systems specialists, planners andadministrators to migrate from Systems Monitor for AIX to TME 10 DistributedMonitoring. The information in this publication is not intended as thespecification of any programming interfaces that are provided by any Tivoliproducts. See the Programming Announcement for TME 10 DistributedMonitoring for more information about what publications are considered to beproduct documentation.
References in this publication to IBM products, programs or services do notimply that IBM intends to make these available in all countries in which IBMoperates. Any reference to an IBM product, program, or service is not intendedto state or imply that only IBM′s product, program, or service may be used. Anyfunctionally equivalent program that does not infringe any of IBM′s intellectualproperty rights may be used instead of the IBM product, program or service.
Information in this book was developed in conjunction with use of the equipmentspecified, and is limited in application to those specific hardware and softwareproducts and levels.
IBM may have patents or pending patent applications covering subject matter inthis document. The furnishing of this document does not give you any license tothese patents. You can send license inquiries, in writing, to the IBM Director ofLicensing, IBM Corporation, 500 Columbus Avenue, Thornwood, NY 10594 USA.
Licensees of this program who wish to have information about it for the purposeof enabling: (i) the exchange of information between independently createdprograms and other programs (including this one) and (ii) the mutual use of theinformation which has been exchanged, should contact IBM Corporation, Dept.600A, Mail Drop 1329, Somers, NY 10589 USA.
Such information may be available, subject to appropriate terms and conditions,including in some cases, payment of a fee.
The information contained in this document has not been submitted to anyformal IBM test and is distributed AS IS. The information about non-IBM(″vendor″) products in this manual has been supplied by the vendor and IBMassumes no responsibility for its accuracy or completeness. The use of thisinformation or the implementation of any of these techniques is a customerresponsibility and depends on the customer′s ability to evaluate and integratethem into the customer′s operational environment. While each item may havebeen reviewed by IBM for accuracy in a specific situation, there is no guaranteethat the same or similar results will be obtained elsewhere. Customersattempting to adapt these techniques to their own environments do so at theirown risk.
Reference to PTF numbers that have not been released through the normaldistribution process does not imply general availability. The purpose ofincluding these reference numbers is to alert IBM customers to specificinformation relative to the implementation of the PTF when it becomes availableto each customer according to the normal IBM PTF distribution process.
Copyright IBM Corp. 1997 143

This soft copy for use by IBM employees only.
The following terms are trademarks of the International Business MachinesCorporation in the United States and/or other countries:
The following terms are trademarks of other companies:
C-bus is a trademark of Corollary, Inc.
PC Direct is a trademark of Ziff Communications Company and isused by IBM Corporation under license.
UNIX is a registered trademark in the United States and othercountries licensed exclusively through X/Open Company Limited.
Microsoft, Windows, Windows NT and the Windows 95 logoare trademarks or registered trademarks of Microsoft Corporation.
Pentium, MMX, ProShare, LANDesk, and ActionMedia are trademarks orregistered trademarks of Intel Corporation in the U.S. andother countries.
Java and HotJava are trademarks of Sun Microsystems, Inc.
Other company, product, and service names may be trademarks orservice marks of others.
ADSTAR AIXIBM InfoExplorerNetView OS/2RS/6000 SystemView
DCE The Open Software FoundationDomino, Lotus Notes, Lotus, LotusScript,Notes, Replication, NotesView
Lotus Development Corporation
Netscape, Netscape Navigator Netscape Communications CorporationOpenView Hewlett-Packard CompanyTivoli, Tivoli Management Environment,TME 10
Tivoli Systems Inc., an IBM Company
IPX Novell, IncorporatedIntel Intel Corporation
144 Migrating from Systems Monitor to TME 10 Distributed Monitoring

This soft copy for use by IBM employees only.
Appendix D. Related Publications
The publications listed in this section are considered particularly suitable for amore detailed discussion of the topics covered in this redbook.
D.1 International Technical Support Organization PublicationsFor information on ordering these ITSO publications see “How To Get ITSORedbooks” on page 147.
• Systems Monitor for AIX: Anatomy of a Smart Agent, SG24-4398
• TME 10 Cookbook for AIX, SG24-4867
• The TME 10 Deployment Cookbook: Courier and Friends, SG24-4976
• A First Look at TME 10 Distributed Monitoring 3.5, SG24-2112
D.2 Redbooks on CD-ROMsRedbooks are also available on CD-ROMs. Order a subscription and receiveupdates 2-4 times a year at significant savings.
D.3 Other PublicationsThese publications are also relevant as further information sources:
• Tivoli/Sentry Documentation Kit, SK2T-6052
Copyright IBM Corp. 1997 145

This soft copy for use by IBM employees only.
146 Migrating from Systems Monitor to TME 10 Distributed Monitoring

This soft copy for use by IBM employees only.
How To Get ITSO Redbooks
This section explains how both customers and IBM employees can find out about ITSO redbooks, CD-ROMs,workshops, and residencies. A form for ordering books and CD-ROMs is also provided.
This information was current at the time of publication, but is continually subject to change. The latestinformation may be found at URL http://www.redbooks.ibm.com.
How IBM Employees Can Get ITSO Redbooks
Employees may request ITSO deliverables (redbooks, BookManager BOOKs, and CD-ROMs) and information aboutredbooks, workshops, and residencies in the following ways:
• PUBORDER — to order hardcopies in United States
• GOPHER link to the Internet — type GOPHER.WTSCPOK.ITSO.IBM.COM
• Tools disks
To get LIST3820s of redbooks, type one of the following commands:
TOOLS SENDTO EHONE4 TOOLS2 REDPRINT GET SG24xxxx PACKAGETOOLS SENDTO CANVM2 TOOLS REDPRINT GET SG24xxxx PACKAGE (Canadian users only)
To get lists of redbooks:
TOOLS SENDTO USDIST MKTTOOLS MKTTOOLS GET ITSOCAT TXTTOOLS SENDTO USDIST MKTTOOLS MKTTOOLS GET LISTSERV PACKAGE
To register for information on workshops, residencies, and redbooks:
TOOLS SENDTO WTSCPOK TOOLS ZDISK GET ITSOREGI 1996
For a list of product area specialists in the ITSO:
TOOLS SENDTO WTSCPOK TOOLS ZDISK GET ORGCARD PACKAGE
• Redbooks Home Page on the World Wide Web
http://w3.itso.ibm.com/redbooks
• IBM Direct Publications Catalog on the World Wide Web
http://www.elink.ibmlink.ibm.com/pbl/pbl
IBM employees may obtain LIST3820s of redbooks from this page.
• REDBOOKS category on INEWS
• Online — send orders to: USIB6FPL at IBMMAIL or DKIBMBSH at IBMMAIL
• Internet Listserver
With an Internet E-mail address, anyone can subscribe to an IBM Announcement Listserver. To initiate theservice, send an E-mail note to [email protected] with the keyword subscribe in the body ofthe note (leave the subject line blank). A category form and detailed instructions will be sent to you.
Copyright IBM Corp. 1997 147

This soft copy for use by IBM employees only.
How Customers Can Get ITSO Redbooks
Customers may request ITSO deliverables (redbooks, BookManager BOOKs, and CD-ROMs) and information aboutredbooks, workshops, and residencies in the following ways:
• Online Orders (Do not send credit card information over the Internet) — send orders to:
• Telephone orders
• Mail Orders — send orders to:
• Fax — send orders to:
• 1-800-IBM-4FAX (United States) or (+1) 408 256 5422 (Outside USA) — ask for:
Index # 4421 Abstracts of new redbooksIndex # 4422 IBM redbooksIndex # 4420 Redbooks for last six months
• Direct Services — send note to [email protected]
• On the World Wide Web
• Internet Listserver
With an Internet E-mail address, anyone can subscribe to an IBM Announcement Listserver. To initiate theservice, send an E-mail note to [email protected] with the keyword subscribe in the body ofthe note (leave the subject line blank).
148 Migrating from Systems Monitor to TME 10 Distributed Monitoring

This soft copy for use by IBM employees only.
IBM Redbook Order Form
Please send me the following:
We accept American Express, Diners, Eurocard, Master Card, and Visa. Payment by credit card notavailable in all countries. Signature mandatory for credit card payment.
DO NOT SEND CREDIT CARD INFORMATION OVER THE INTERNET.
How To Get ITSO Redbooks 149

This soft copy for use by IBM employees only.
150 Migrating from Systems Monitor to TME 10 Distributed Monitoring

This soft copy for use by IBM employees only.
Index
Special Characters/cdrom 115/etc/Tivoli/setup_env.sh 131/usr/ local/Tivoli /bin/generic/SentryMonitors 53/usr/ lpp/smsia/original/snmptrap 64/usr/OV file system 132/usr/OV/bin/event command 62/usr/sys/inst. images 115/var f i lesystem 37, 44/var/adm/smv2 27/var/adm/smv2/mlm/conf ig 47/var/adm/smv2/sia/config 97/var/adm/smv2/xxx/config 35.baroc file 50″Changes To″ comparator 35″tr igger when″ option 32$EFFECTIVE_VALUE 62$HOSTNAME 62$INTERNAL_ID 105
Numerics0.aix4-r1 74
Aaccess control 16action 21, 22actions 80actual status 11administrative control 25administrator 20administrator ID 17, 25ADSM 93, 109ADSM for MVS 94ADSTAR Distributed Storage Manager (ADSM) 93advanced process monitoring 107agent 5, 119agent node 36Agent Policy Manager 12AIX 7, 24, 85, 115, 131AIX commands
err logger 114errpt 112odmadd 114odmdelete 114odmget 112
AIX error logging facility 43AIX Object Database Manager (ODM) 112AIX subsystem resource controller 68alarm 49alert level 33
crit ical 33severe 33
alert level (continued)warning 33
alertable error 114alertable flag 112alerts 102alias 49all instances 115analysis 9ANR1311E 94ANR5030E 94API 6, 15APM 12application 124arguments 78, 82arm condition 32asynchronous alerting 112asynchronous events 5asynchronous monitor 43, 112asynchronous string monitor 33, 112authentication 16authorization roles 17automated actions 49, 71, 102automated command 45automatic restart actions 43average 80average value 78
Bbackground task 19batch operation 15bibliography 145
CC-language preprocessor 82central SNMP manager 9centralized management 18CGI programs 92Change Control Management System (CCMS) 20checklist 27choicelists.csl 82client application 5Cluslusincludexe3 enerictivoli 82collecting monitor data 125collection function 124combined dotted and character text 36command execution 30command line interface 15Command table 9, 31Command table entries 36Common Object Request Broker (CORBA) 16Compaq Insight Manager 119compile the message file 110
Copyright IBM Corp. 1997 151

This soft copy for use by IBM employees only.
compile the monitor 111complex fi le monitoring 43configuration fi les 27, 33console error log 93Control Desktop 10CORBA 1CPU 36CPU usage 76CPU utilization 43, 76CPU utilization data 91cpu.c 84cpu.col 86cpu.dsl 84cpu.h 84cpuload.sh 78cpustat.sh 78creating a monitor 20credentials 17criteria 111critical conditions 5current uti l izaion monitor 78custom scripts 36
Ddaemon 19, 34daemon status 70data collection 30data entry fields 82data structure 82database 127database processes 109dataChange 36date command 99default HTTP port 125DGUX 115disabled state 37, 97discovered nodes 11discovery 9, 12disk footprint 17distr ibuted management 18Distributed Programming Interface (DPI) 6distribution functions 16dotted decimal format 36download 3dsmsched.log 93dynamically assigned TCP port 125dynamically named log fi les 99
Eegrep 101en_method 114ENDPOINT 122Endpoint Classes 19endpoint function 16endpoint gateway 25ENDPOINT_CLASS 122
enterprise-specific trap ID 96environment variables 46, 62epoch 128error code 94error daemon 112error logging facil ity 112error notif ication method 112error reporting mechanism 112event
adapter 50classes 50command 62console 58group 56handlers 22handling 26rules 50server 50source 55
exception levels 103exception list 95exception responses 103
crit ical 103severe 103warning 103
executing a monitor 21exist/doesNotExist 36extended MIB 7extended MIB support 6extended regular expression 100
FFile Monitor table 9, 31fi le monitoring 28, 93fi le monitors 12file ownership 30file ownership changes 30file permissions 30file system monitor 63, 103file system monitoring 44file system util ization 49file systems 36filter capabilit ies 10fi l ter criteria 56fi l tering 9flags 73, 109flat files 33formats.csl 82
Ggeneric fi le system monitoring 115granular 17graphical monitoring component 125graphical reporting capabil ity 124graphical view 91group 49
152 Migrating from Systems Monitor to TME 10 Distributed Monitoring

This soft copy for use by IBM employees only.
group ID 71GUI-to-GUI migrat ion 31
HHelpMessage 88heterogeneous systems management 16hexadecimal 128hierarchies 18historical data 43HP-UX 7, 85, 115HP-UX 9.0.5 131HP9000 131hubs 26
IIBM Systems Monitor 1id 78idle time 79importing classes 53importing rules 53indicator 19indicator collection 89, 122indicator icon 49, 89InfoExplorer 112infrastructure 25input parameters 70instance 5, 20instances 31internal ID 105interval 78
JJava applets 92Java-enabled browser 24, 92
Kkennel classes 19, 21keyname 85
Llayout (of TMRs) 25LCF 25Lightweight Client Framework (LCF) 16load of the CPU 78local command execution 21local logging 21local network segment 9lock file 109logfile 22, 40Logged-in users 36Logins 50lpd 66lpd daemon 43, 66
Mmail message 22managed node 16, 21, 27, 62, 86, 118managed resource 72management by subscription 18management domain 5Management Information Base 5management protocol 5manager 5manager/agent relationship 5maps 7, 11mathematical operation 78MCSL 110mcsl command 83MCSL language 43mdist (multiplexed distribution) 20, 25message catalog 82message file 110messages 82method invocation 22methods 16, 19MIB 5
browser 10, 40definit ion 115extensions 36, 40, 115object ID 137objects 31, 36, 115tables 14, 31, 76, 137value 44variables 9, 10, 36, 76, 120
MIB-II 119Mid-Level Manager (MLM) 1, 3migrate_mlm_config shell script 44migrate_sysmon_config 35, 97migrate_sysmon_config script 47migrateable monitor 43migration categories 27migration options 26migration project 25migration scripts 27monitor action 98monitor definition fi le 82monitor definit ions 19monitor details 44monitor profi le 20monitor result 19monitored resources 26monitoring collection 19, 43, 81, 117monitoring collection icon 103Monitoring Collection Specification Language
(MCSL) 77monitoring policies 15MTE 10 Distributed Monitoring commands
wgdread 127
Index 153

This soft copy for use by IBM employees only.
NNCR UNIX 7Netscape Navigator 91netstat 120NetView 95NetView event command 24NetView for AIX 1, 7NetView Maps 11NetView user 25Netview/390 1NetWare 15, 16, 19, 27network devices 26Network errors 36network management 5new response level 103nobody (user) 71node characteristics 12nodes 12non-migrateable SIA resources 30non-numerical monitors 102normal response level 35notice 49Notice Group Subscription 50Notice groups 22
Sentry 22Sentry-log 22Sentry-urgent 22SentryStatus 23
notif ication 112numeric return value 85numeric script 30, 32Numeric Script monitor 76, 80, 100
Oobject 5, 16, 17object classes 19, 20object location services 16object reference 22object request broker (ORB) 15object-oriented 15occurrences in fi le monitor 100offload 12operators.csl 82Oracle 109ORB services 16OS/2 7, 16, 27, 131oserv 91, 111oserv daemon 16oserv database 18, 19, 20overload the Sentry engine 21
PPaging Space 36parameter 79parameters 109
passive SNMP data source 93password 17, 25PC managed nodes 16peers 16percent sign 62perl 128permissions 30, 134ping 121pipes 109plan the installation 25platform 15platform functions 16policy 18policy region 17, 26, 46, 72poll 49poll t ime 32, 37poll ing 5, 9, 11poll ing interval 102poll ing time 35polling-based functions 93pop-up action 48pop-up message 19, 22, 98portable 82post-migration possibil it ies 26print queues 66print subsystem 43, 66printjobs 66printjobsize 66printstat 66probe intervals 80probes 78, 102profi le 27, 122profi le manager 18, 27, 46, 122profi les 18, 46programs 27proxy 26proxy monitoring 43proxy monitors 19
Qqueues 66
RRDBM system 109RDBMS 18, 23re-arm 102re-arm capabil i ty 32, 43re-arm condition 35re-arm function 102re-arm line 102reduce network load 20regular expression 95related daemons 67related processes 107relative test conditions 103
becomes active 103decreases below 103
154 Migrating from Systems Monitor to TME 10 Distributed Monitoring

This soft copy for use by IBM employees only.
relative test conditions (continued)increases beyond 103
remote command execution 64repeater function 25required bandwidth 9resource roles 50response levels 21, 80, 134result 19RFC 1213 30, 119routers 26routing events 44RS/6000 131rule base 50rules engine 23
Ssampling intervals 77sched.log 93scheduling 20script monitors 30searching for specific strings 9security 16security controls 16selection lists 82semi-automatic migration 27, 31senior role 59Sentry
.baroc 53endpoint method 21engine 19, 21environment variable 98Graphable Log 91monitors 18profi le 37proxy endpoint 121
Sentry profi le 37Sentry_Administrator 50sentry_engine 105sentry_rearm 105Sentry2_0.dsl 82service 19shared memory monitoring 33shell scripts 27, 62SIA file monitors 28SIA MIB variables 30Simple Network Management Protocol (SNMP) 1, 5single point of reference 16slots 60slow speed links 25smconfig 9, 13, 27SMUX Subagent 7SNMP 5, 9, 27, 49
agent 9client 120community 120devices 120GET request 5management 61, 120
SNMP (continued)Manager 5, 7MIB 1, 27Mult iplexor (SMUX) 6object 120SET request 5trap 24, 45, 64, 95, 108, 114values 118
SNMP get request 9snmptrap 64, 95, 108Solaris 2.5 131special-purpose Web server 125specific trap ID 46Spider 125spreadsheet 127startsrc 68statistical analysis 33status polling 12statusChange 36String script 30, 32String script monitor 115subagent interface 6subnets 12subscribers 122Sun 85Sun Solaris 24Sun Sparc 20 131SUN-Solaris 7SunOS 7, 115swapping activity 18sy 78symbolic name 119SysBack/6000 99system data 5system group 71system ID 17system independent 68System Information Agent (SIA) 1System Level Monitor (SLM) 9system mode 79system privi leges 70System-Level Manager (SLM) 1systems management 5Systems Monitor 5Systems Monitor CFG 2.3.1.0 131Systems Monitor Configuration Application
(smconfig) 6Systems Monitor configuration fi le 37Systems Monitor enterprise ID 46Systems Monitor environment variables 98Systems Monitor MLM 2.3.1.0 131Systems Monitor SIA 2.3.1.0 131SystemView 1
TT/EC 107T/EC commands
wstartesv 55
Index 155

This soft copy for use by IBM employees only.
T/EC commands (continued)wstopesvr 55
T/EC events 60T/EC log file adapter 93T/EC server 49tabular information 5tag 33tar archive 73target nodes 26task l ibrary 33, 70Task Library Language (TLL) 70TCP/IP networks 1TCP/IP-based network 5threshold 12, 19, 102, 115threshold event 44threshold levels 19, 102
always 19crit ical 19normal 19severe 19warning 19
threshold monitor 115threshold monitor table 34threshold table 31, 36, 44, 124thresholding 9, 30thresholds 76time slot 21Tivoli Enterprise Console (T/EC) 22Tivoli Management Environment 15Tivoli Management Environment (TME) 1Tivoli Management Platform 82Tivoli Management Regions (TMRs) 16Tivoli/Sentry 15Tivoli/Sentry 3.0.2 91, 131Tivoli/Sentry 3.5 131Tivoli/Spider HTTP Daemon/1.0 125tivoli.baroc 53tll file 74TME 10 ADE 3 131TME 10 commands
idlcall 133odadmin 87waddmon 20, 31, 33wdistr ib 105winstall 19wlsmon 75wputicon 103wruntask 68wtl l 73
TME 10 Distributed Monitoring 2, 15, 91TME 10 Distributed Monitoring commands
waddlevel 103wasyn 112wcrtprx 122wdumpstr 134wlseng 133wlseng -l 133wsetmon 105
TME 10 Distributed Monitoring commands (continued)wsnmpget 119, 120
TME 10 Distributed Monitoring proxy function 118TME 10 Enterprise Console (T/EC) 23, 49TME 10 Framework 3.1 131TME 10 Integration Toolkit 82TME 10 NetView 7, 107TME 10 NetView Control Desk 96TME 10 NetView for AIX 3TME 10 Reporter 124TME 10 roadmap 2TME 10 Task Library Language 43TME 10 tasks 43, 68TME Administrator 50TME desktop 22, 46TME framework 62TME notice 19TME Notice group 22TME platform 16TME Resource Role 70TME task 19, 24TME10 Enterprise Console 19TME10 NetView 5, 24, 61, 132TME10 NetView Mid Level Manager 5, 9TMR 86TMR Roles 50TMR server 16, 25, 62TMR-TMR links 25transaction control 16transition period 61Trap reception 9trapgend 34traps 7, 10, 12, 61trigger options 28
Uunique key 83unique message number 83universal collection 100Universal monitoring collection 76universal.baroc 53UNIX 15, 19, 86UNIX file system 44Unix_Sentry collection 100unsolicited information 9us 78user ID 70, 106user mode 79user nobody 71User-specified 119user-specified MIB variable 120UserSNMP 30util ization trends 77
Vvariable f i lenames 43
156 Migrating from Systems Monitor to TME 10 Distributed Monitoring

This soft copy for use by IBM employees only.
vmstat 77, 86
Wwarning 90Web server 92Web-based application 91Web-based monitor ing 124wildcard definit ion 31, 115wildcards 109Windows 16Windows NT 15, 19, 24, 27, 131World Wide Web 3wrapper script 36
Index 157

This soft copy for use by IBM employees only.
158 Migrating from Systems Monitor to TME 10 Distributed Monitoring

This soft copy for use by IBM employees only.
ITSO Redbook Evaluation
Migrating from Systems Monitor for AIX to TME 10 Distributed MonitoringSG24-4936-00
Your feedback is very important to help us maintain the quality of ITSO redbooks. Please complete thisquestionnaire and return it using one of the following methods:
• Use the online evaluation form found at http://www.redbooks.com• Fax this form to: USA International Access Code + 1 914 432 8264• Send your comments in an Internet note to [email protected]
Please rate your overall satisfaction with this book using the scale:(1 = very good, 2 = good, 3 = average, 4 = poor, 5 = very poor)
Overall Satisfaction ____________
Please answer the following questions:
Was this redbook published in time for your needs? Yes____ No____
If no, please explain:_____________________________________________________________________________________________________
_____________________________________________________________________________________________________
_____________________________________________________________________________________________________
_____________________________________________________________________________________________________
What other redbooks would you like to see published?_____________________________________________________________________________________________________
_____________________________________________________________________________________________________
_____________________________________________________________________________________________________
Comments/Suggestions: ( THANK YOU FOR YOUR FEEDBACK! )_____________________________________________________________________________________________________
_____________________________________________________________________________________________________
_____________________________________________________________________________________________________
_____________________________________________________________________________________________________
_____________________________________________________________________________________________________
Copyright IBM Corp. 1997 159

IBML
This soft copy for use by IBM employees only.
Printed in U.S.A.
SG24-4936-00