migration and multidimensional wellbeing in ethiopia: the...
TRANSCRIPT

1
Migration and Multidimensional Wellbeing in Ethiopia:
The Role of Migrants Destinations
Paper prepared for:
Human Development and Capabilities Association Annual Conference
Washington, DC September 2015
Lisa Andersson, Organization for Economic Cooperation and Development
Katie Kuschminder, Maastricht University
Melissa Siegel, Maastricht University

2
1. Introduction
It is increasingly recognized that little is known about south-south migration trends and more
specifically, how they compare and contrast to south-north migration trends (Bakewell, 2009; Ratha and
Shaw, 2007). The 2013 International Organization for Migration World Migration Report highlights the
changing nature of migrant destinations from previous flows of primarily south-north migration to
increasing flows of south-south and north-south migration (IOM, 2013). Forty percent of migrants were
cited as migrating from the south to the north, one-third from the south to the south, 22 percent from
the north to the north and 5 percent from the north to the south (IOM, 2013). One key challenge noted
in this report is the accuracy of statistics on south-south migration, which are arguably the most difficult
to capture.
Further to lacking comparative research on south-south and south-north migration, few studies have
investigated the role of migration destination when it comes to migration and wellbeing of the
households left behind. A key theory in migration studies is that through migration households left
behind increase wellbeing through monetary and social remittances (knowledge and values). In this
paper we aim to contribute to this research gap through a comparative analysis of migration from
Ethiopia to different migrant destinations and the resulting wellbeing of households left behind. Based
on original data collection of 1,284 household surveys in Ethiopia, we examine the well-being of
households left behind from migrants to the three different locations of Africa, the Middle East and the
North. We conceptualize the flows in this these three categories of south-south, south-north, and south-
Middle East due to the fact that some Middle East countries can be classified as south or north
depending on the indicators that are used. For example, the World Bank would classify Saudi Arabia as
‘north’ based on income, whereas when using the Human Development Index, the UNDP classify Saudi
Arabia as ‘south’ (Bakewell, 2009). Further to this, the Middle East has unique migration and human
rights challenges that arguably legitimize looking at this flow uniquely from south-south and south-north
migration. We examine how having a migrant in each of these different destinations correlates with the
well-being of the household left behind in Ethiopia.
The second core contribution of this paper is the use of a multidimensional well-being index to examine
the relationship between migration and the households left behind. Multidimensional well-being indices
provide a more holistic approach to understanding poverty by going beyond monetary income to
include factors such as education, health, and social inclusion. In this paper we have developed and
utilized a multidimensional well-being index that is relevant for the Ethiopian context.
The results show that there is a positive association between migration and household well-being, but
that the effect partly is dependent on the household receiving remittances and that migration
destination region matters. The link between migration to any destination region and overall household
wellbeing is only significant through the effect of remittances. However, when disaggregating the effect
according to migrant destination region, the results show that having a migrant in the North is positively
associated with overall household wellbeing, and in particular with wellbeing related to the dimensions
of education, health and inclusion. Return migration is also shown to be positively linked to household
wellbeing.

3
This paper has five key sections. The first provides an overview on the multidimensional well-being
approach to migration. The second section gives a short background on migration from Ethiopia. The
third section details the data and empirical strategy of the paper. The forth presents the results and the
final section provides a discussion and conclusion.
2. Multidimensional Well-being Approach to Migration
The multi-dimensional approach to poverty and well-being comes from the pioneering work of Amartya
Sen and has been expanded upon by many scholars (Sen 1976, 1982, 1985, 1993; Nussbaum 1992, 2000,
Ravallion 1994; Laderchi, Saith and Stewart 2003; Thorbecke 2008). The concept of multi-dimensional
poverty has been further operationalized by academics (Klasen 2000, Perry 2002, Bourguignon and
Chakravarty 2003, Baulch and Masset 2003, Bradshaw and Finch 2003, Bastos, Fernandes and Passos
2004, Wagle 2009). The underlying idea is that poverty is more than just monetary poverty, but that
there can be deprivation in many other areas. Studies suggest that the use of monetary and
multidimensional poverty measures results in different depictions of poverty, with limited and modest
overlap in results (Klasen 2000; Perry 2002; Baulch and Masset 2003; Bastos, Fernandes and Passos
2004; Whelan, Layte and Maitre 2004; Wagle 2009). Assessing poverty or wellbeing from a multi-
dimensional perspective allows for addressing other key areas such as health, education, living
standards, physical safety as well as income. By using such a measure, the complexity of well-being can
be investigated.
Using a multi-dimensional approach is key to understanding overall well-being as only looking at the
traditional indicator of income can be misleading and not give the full picture. For instance, in India,
income growth has been increasing but child malnutrition has stayed the same (Citizens’ Initiative for
the Rights of Children Under Six, 2006). At the same time, according to the Oxford Poverty and Human
Development Initiative (OPHI), people themselves often describe their situations as being multi-
dimensional. OPHI found that poor people depict poverty as relating to poor health, nutrition, lack of
adequate sanitation and clean water, social exclusion, low education, bad housing, violence, shame,
disempowerment and more. Understanding the different areas or dimensions of well-being also allows
for more targeted policy approaches. Indicators, however, should always be chosen based on the
specific country context.
This approach has newly been applied to the field of migration (Gassmann, Siegel, Vanore & Waidler,
2012; 2013; Loschmann & Siegel, 2013; Vanore & Siegel, 2013; Siegel & Waidler, 2012). Most of the
previous work examing how migration affects well-being outcomes has been focused on Mexico and
concentrated on income poverty, education, and health (Kanaiaupuni and Donato , 1999; Kandel, 2003;
McKenzie & Rapoport, 2007; 2011; McKenzie & Hildebrandt, 2005; McKenzie, 2005). Until recently, the
effect of migration or the association of migration with different development outcomes such as
income, expenditure, education and health have all been looked at separately and rarely a more holistic
approach has been taken (Adams, 2010; 2013; Adams & Page, 2005; Lipton, 1980). This paper is a step
towards better understanding the relationship between migration and well-being utilizing a holistic
approach to well-being.

4
3. Migration from Ethiopia: An Overview of Current Trends
Migration from Ethiopia has been increasing since the end of the conflict period in 1991 and particularly
over the past decade. The recent migration streams from Ethiopia are primarily for the purpose of
labour migration as opposed to the previous flows that were primarily characterized by refugee
migration (Kuschminder and Siegel, 2014). Despite experiencing high levels of growth in the past
decade, Ethiopia is one of the poorest countries in the world; ranking 173 out of 187 countries
measured by the UNDP Human Development Index (2014). Ethiopia has high levels of unemployment,
particularly among urban youth. Urban unemployment also has a strong gendered dimension with 13.7
per cent of urban males unemployed compared to 27.2 per cent of urban females (Kirbu, 2012).
Following from this, emigration from Ethiopia is highly gendered with 60 percent of current migrants
being female (Kuschminder, Andersson, and Siegel, 2012).
At present, there are three central migration destination regions from Ethiopia. The first and most
prominent is to the Middle East. There is an increasing body of research on female emigration from
Ethiopia primarily to the Middle East (de Regt, 2010; Fernandez, 2010, 2014; Kuschminder, 2014; ILO,
2011, RMMS, 2014). This research includes drivers for migration, conditions abroad, experiences of
return and reintegration, and concerns regarding the human rights and wellbeing of the migrants. The
majority of these migration flows are for domestic work. The primary destination country for men to the
Middle-East is Saudi Arabia, where male migrants mainly work in the construction sector. Yemen is a key
transit country en route to Saudi Arabia and there is also a growing body of research highlighting the
concerns of Ethiopian migants wellbeing in Yemen (see RMMS).
The second key destination is migration within Africa, wherein the primary destination of Ethiopian
migrants is South Africa. Primarily young men migrate to South Africa for economic purposes (Horwood,
2009). To some migrants South Africa is the final destination country, but the country is also used as a
transit country for migration further afield, such as to the US, Europe or Canada. According to IOM,
approximately 4,000 Ethiopian migrants are apprehended in Tanzania each year in route to South Africa
(2014). The number of apprehensions in other countries along this route such as Kenya, Uganda and
Mozambique is not known.
The third key destination of migrants from Ethiopia is to North America and Europe. There are several
important differences with this destination as compared to Africa and the Middle East. Migrants going
to the North are more likely to be educated, migrate legally with documents, and have mixed reasons
for migration such as study purposes or family reunification (Kuschminder, Andersson and Siegel, 2012).
Irregular migration from Ethiopia to the North does also occur, although precise figures on this are
unknown.
The majority of Ethiopian migration is currently for labour purposes; however, over 30,000 Ethiopians
lodged asylum claims in 2013. The majority of these claims (24, 500) were lodged in non-industrialised
countries, predominantly South Africa, Kenya and Yemen (UNHCR population statistics, 2014). Within
industrialized states, the US received the highest number of Ethiopian asylum claims, followed by
Norway.

5
Finally, return migration has also become an increasing salient issue in Ethiopia. In October 2013, Saudi
Arabia removed over 130,000 Ethiopians back to Addis Ababa, which has become known as the
‘Ethiopian return crises’. This created a humanitarian emergency as shelter and basic needs were
required for many of these returnees. Return to Ethiopia, however, construes many different types of
migrants. This includes: professional and transnational returnees, labour returnees, student returnees,
domestic worker returnees from the Middle East, Assisted Voluntary Returnees from Europe, Egypt or
Yemen, and forced returnees.
At this time, there is little evidence as to the impact of migration on household wellbeing in Ethiopia. In
a recent study based on the same data used in this paper, Andersson (2014) finds that rural remittance
receiving households are more likely to have positive perceptions of their subjective well-being and the
position of their household compared to others in the community. Rural remittance receiving
households were also found to be able to accumulate more consumer assets that non remittance
receiving households. This paper continues to build on these findings by examining multidimensional
wellbeing from migration in general, not just remittance receiving households.
4. Empirical strategy
The study employs a multidimensional poverty approach to analyse the link between migration and
well-being. The methodology builds on the multidimensional poverty methodology developed by Alkire
and Foster (2011) that extends traditional poverty measures to include several dimensions. The
identification involves two forms of cut-off. The first cut-off concerns deprivation within a specific
dimension, by considering several indicators related to the dimension. The second cut-off relates to an
aggregated measure of the overall deprivation of the household, taking all the different dimensions
included in the analysis into account.
In a first step, each dimension is analysed separately, using a number of different indicators related to
the specific dimension. A household is considered to be well-off in a given indicator if the threshold set
for given indicator is met. For example, the indicator for electricity within the housing dimension will
take on value 1 if the household meets the corresponding threshold of having access to electricity, and
value 0 if the household does not have access. All indicators within each dimension is evaluated against
their thresholds, and used in order to establish well-being rates for each dimension. A household is
considered not to be deprived in a given dimension if it meets the corresponding threshold with respect
to each indicator. The choice of cut-off levels is normative, and depends on the set of indicators and
dimensions included (Alkire and Foster, 2011). In this study we use a cut-off level of 0.7 and assign equal
weights to all indicators in each dimension. This means that in a case where a dimension has two
indicators, the household needs to be well-off in both dimensions to meet the requirement. In the case
of four indicators in one dimension, the household needs to be well-off in three out of four indicators to
be considered not deprived in that particular dimension.
After establishing the thresholds for each dimension, an overall wellbeing index is created by
aggregating the different dimensions. Again, the cut-off is set to 0.7, and all dimensions are given equal
weight. This means that a household needs to be well-off in 70 percent of the dimensions in order to be

6
considered well-off in the overall multidimensional poverty measure. A variable taking on value 1 if the
household meets this requirement and the overall well-being is above 70 percent when all dimensions
have been aggregated, and value 0 if the wellbeing is below 70 percent, is created.
In this study, five different dimensions of well-being are used to measure multidimensional poverty. The
dimensions are: education; housing; health; income, employment and assets; and social inclusion. Each
dimension includes between two and four indicators. The education dimension includes two indicators:
household head is literate; children of school age (7-15) in the household go to school. Since the school
attendance indicator only applies to households with children in school age, households without
children in school age is only evaluated based on the literacy of the household head. The housing
dimension includes the following four indicators: access to electricity; access to toilet; the house has
more than one room; the house has appropriate flooring (not dirt, sand or dung). The health dimension
includes four dimensions: access to health clinic; household is able to meet its food needs; household
does not have any disabled or seriously ill household head; household has not lost a child. The indicator
regarding the ability of meeting the food needs is based on a subjective question where the household is
asked to assess its ability to meet its food needs. The income, employment and asset dimension is also
based on four indicators: household is earning the threshold of 2 dollars a day per adult equivalent;
none of the children in the household are working; the household has more than one income source;
the household owns at least two consumption goods. Income per adult equivalent calculated following
the OECD adult equivalence factor. The first adult in the household is given a weight of 1, and each
additional adult member is assigned a weight of 0.7. Children, defined as members in the age of 0-13,
are assigned value 0.5. The income measure of 2 dollars is calculated according to the World Bank
conversion factor for private consumption. The fifth dimension, inclusion, includes two indicators:
household owns a mobile phone; the household is member of at least one organization.
Finally, probit regressions are used to estimate the probability that a household is well-off, both when it
comes to the aggregated overall wellbeing measure, and in each of the included dimensions. The
dependent variable is in the former case a binary variable taking on value 1 if the household is well-off in
the aggregate multidimensional indicator, and value 0 otherwise. In the latter case, each dimension is
tested separately using a binary variable that takes on value 1 if the household is considered well-off in a
given dimension. The variable of interest is a set of migration variables. In a first step, migration is
measured though an aggregate measure taking on value 1 if the household has a member that migrated
abroad. In a second step, the migration variable is disaggregated into three binary variables to take into
account if the migrant member is located in a destination country in the North, the Middle East or
within the African continent. A number of control variables on individual and household level are also
included in the specification.
5. Data and descriptive statistics
This paper is based on the IS Academy: A World in Motion Ethiopia project data collection. An in-depth
household survey was conducted of 1,284 households across five different regions in Ethiopia from
March to May 2011. Surveys were made with three types of households: households that currently had
a member living abroad; households that had a member who had lived abroad and returned;

7
households that had no experience of international migration. It is important to stress that the migrants
themselves were not interviewed and all data used in this paper is from interviewing the household in
Ethiopia. The surveys were conducted in the following five regions of Ethiopia: Amhara, Oromia,
Southern Nations Nationalities and People’s Region (SNNPR), Tigray, and Addis Ababa, which together
account for 96 percent of the population. In each region, three different woredas (districts) were
selected for sampling, totalling 15 data collection sites. The sampling strategy was based on a two-stage
approach. First a listing was made at each site to identify households as migrant, return migrant or non-
migrant households. Based on this identification, households were randomly selected for enumeration
in each site with an equal proportion of migrant or return migrant households to non-migrant
households. The data is not nationally representative and cannot be generalized to represent all
Ethiopian migration.
A migrant was defined in this study as any member of the household who had been living in another
country for a minimum of three consecutive months. Similarly, a return migrant is defined as any
household member that lived abroad for a minimum of three months and had since returned for a
minimum of three months. These definitions were chosen so as to include seasonal migration, which
occurs annually for a shorter period, usually three to eight months.
It is possible that a household contains more than one migrant. These multiple migrants may in turn
reside in different destination regions. In the sample of 426 migrant households, 15 households had
multiple migrants who reside in different geographic areas. Since a goal with the current study is to
compare migration across different regions, these 15 households were dropped from the data. The final
dataset contains 411 migrant households and 127 return migrant households, which corresponds to 32
percent and 10 percent of the household sample. The data also contains information on remittances
received by the households. Remittances were defined as international monetary transfers that were
received by a household from a migrant within the past 12 months since the time of interview. There
are 278 households (22%) in the sample who receive remittances. A majority of these households, 234
households (84%), receive remittances from members of the household who emigrated abroad. There
are however 44 households that receive remittances without having a migrant member.
Migrants were also examined further by migrant destination region. Three regions are examined of:
North, Middle East and Africa. All migrant destinations except for Russia and Israel and classified into
these three destination groups, which represents 97 percent of all migrants in the sample. Table 1
shows the percentage of migrants per destination country.
Table 1: Migrant household by destination region of migrants
DESTINATION PERCENTAGE
North 30 Middle East 20 Africa 47 Other 3 Total 100
Note: North includes USA, Canada, Australia, and all European countries except Russia

8
A majority of migrant households have migrants residing in the Middle East (47%), while about 30
percent of the households have migrants in the North and 20 percent in other African countries outside
Ethiopia. The most common destination countries are Saudi Arabia, United States, United Arab Emirates
and Sudan. Overall, 57 percent of migrant households receive remittances. Among households with
migrants in the North, 63 percent receive remittances. The corresponding number of households with
migrants in the Middle East and Africa that receive remittances is 58 percent and 45 percent
respectively.
Table 2 displays the five different dimensions included in the sample. The table shows that a majority of
the households (90%) are scoring above the threshold and are classified as not being deprived in the
health dimension, while only 26 percent of the households are considered to be above the threshold of
deprivation for the income dimension. Half of the households are not deprived in the education
dimension, 39 percent are not deprived in the housing dimension, and 42 percent are not considered
deprived when it comes to the inclusion dimension. Hence, a large majority of the households are
deprived when focusing solely on the income dimension, but the picture looks different when other
dimensions of poverty are taken into account. Overall, 26 percent of the households in the sample are
classified as not being deprived when all dimensions are taken into account and a cutoff of 0.7 is used.
Table 2: Dimensions and variables
Dimensions
Mean (overall sample)
Head of the household is literate 0.54
All children 7-15 goes to school 0.83
Education dimension 0.50
Household has access to electricity 0.58
Household has access to toilet 0.72
house has more than one room 0.64
Household has appropriate flooring (not dirt/sand/dung) 0.36
Housing dimension 0.39
Household has access to health clinic 0.96
Household able to meet its food needs (1=yes) 0.75 Household does not have disabled or seriously ill household head 0.97
Household has not lost a child 0.70
Health dimension 0.90
Household earn more than $2/day per adult equivalent 0.31
Children in the household not considered working 0.55
Household has more than one income source 0.60
Household owns at least two consumption assets 0.36
Income dimension 0.26
Household owns telephone/mobile phone 0.59
Household is member of at least one organization 0.67

9
The analysis also include a number of additional control variables on both household and individual
(household head) level. The individual level control variables include gender, age, age squared and
occupation of the head of household. Household level control variables include whether the household
is located in a rural or urban area, the number of elderly, above 65 years old, members of the
household, the number of children below 15 years old, the highest education level in the household
(excluding migrants, no formal education is the reference category), and the region where the
household is located (Addis Ababa being the reference category).
6. Results
Table 3 shows descriptive statistics for the five dimensions of the multidimensional well-being index as
well as the aggregated multidimensional indicator and its association with migration.
Table 3: Multidimensional poverty indicators, summary table by migration status and migration destination region
Dimension
Overall Migrant household
Return migrant household
Non-migrant household
North Africa Middle East
Education 0.5 0.49 0.54 0.5 0.67 0.45 0.41
Health 0.9 0.9 0.9 0.89 0.99 0.8 0.9
Housing 0.39 0.46 0.47 0.35 0.88 0.21 0.33
Income/assets 0.25 0.29 0.39 0.21 0.51 0.18 0.24
Inclusion 0.42 0.5 0.47 0.36 0.68 0.46 0.43
OVERALL MPI
Overall MPI cutoff 0.7 0.26 0.31 0.34 0.21 0.61 0.17 0.23
Overall MPI cutoff 0.5 and 0.7
0.45 0.51 0.57 0.39 0.88 0.33 0.39
N 1261 407 127 727 104 87 222
The overall multidimensional wellbeing index shows that among migrant households 31 percent are well
off (i.e. not deprived), compared to 34 percent of return migrant households and 21 percent of non-
migrant households when a cut-off of 0.7 is used. The overall MPI is consistent with the overall
differences in dimensions between the different household groups. Return migrants are the most likely
to be well-off in each of the five dimensions except the inclusion dimension. It is noteworthy that return
migrants are pointedly better off than not only non-migrant households, but also migrant households.
In each of the dimensions, except for education, migrant households are more likely to be better off
than non-migrant households. In the education dimension, 49 percent of migrant households are well
off as opposed to 54 percent of return migrant households and 50 percent of non-migrant households.
Inclusion dimension 0.42
Overall MPI cut-off 0.7 for each dimension, cut off 0.7 overall 0.26

10
Comparing migrant households across migrant destination regions shows that households with migrants
in the North are considerably more likely to be well-off, both for the overall multidimensional measure
and when analysing each dimension separately. The largest differences across migrant households with
migrants in the North compared to migrants in the Africa or the Middle East are found in the housing
and income dimensions. Close to 90 percent of households with migrants in the North are well-off in the
housing dimension, compared to 21 percent among households with migrants in Africa and 33 percent
for among households with migrants in the Middle East. Table A1 in the appendix gives a more detailed
picture of the percentage of households that are well-off for each indicator, in each dimension, by
household type. The table reveals that when it comes to differences in the income dimension between
households with migrants in the North and migrants in other destination regions, the largest differences
are found in income threshold ($2 per day) and the consumption asset indicators. Eighty-three per cent
of households with a migrant in the north achieve wellbeing in asset ownership, compared to 17 percent
of households with a migrant in Africa and 31 percent of households with a migrant in the Middle East.
Another indicator that has a prominent gap between households based on migrant destination is child
mortality in the health dimension. In terms of child mortality, 83 percent of households with a migrant
in the North achieve wellbeing, compared to 47 percent of households with a migrant in Africa and 63
percent of households with a migrant in the Middle East. The only indicator upon which household with
a migrant in Africa are more likely to be well-off compared to the other two groups is membership in an
organization in the inclusion dimension. This is likely due to the fact that micro-credit and savings
organizations are common amongst poor households in Ethiopia.
Next a probit regression is carried out to investigate the linkages between migration and
multidimensional well-being. A number of control variables on both individual and household level are
included. In the first step, the link between wellbeing and migration to any destination region is
investigated. In a second step we investigate the link between migration and wellbeing across migrant
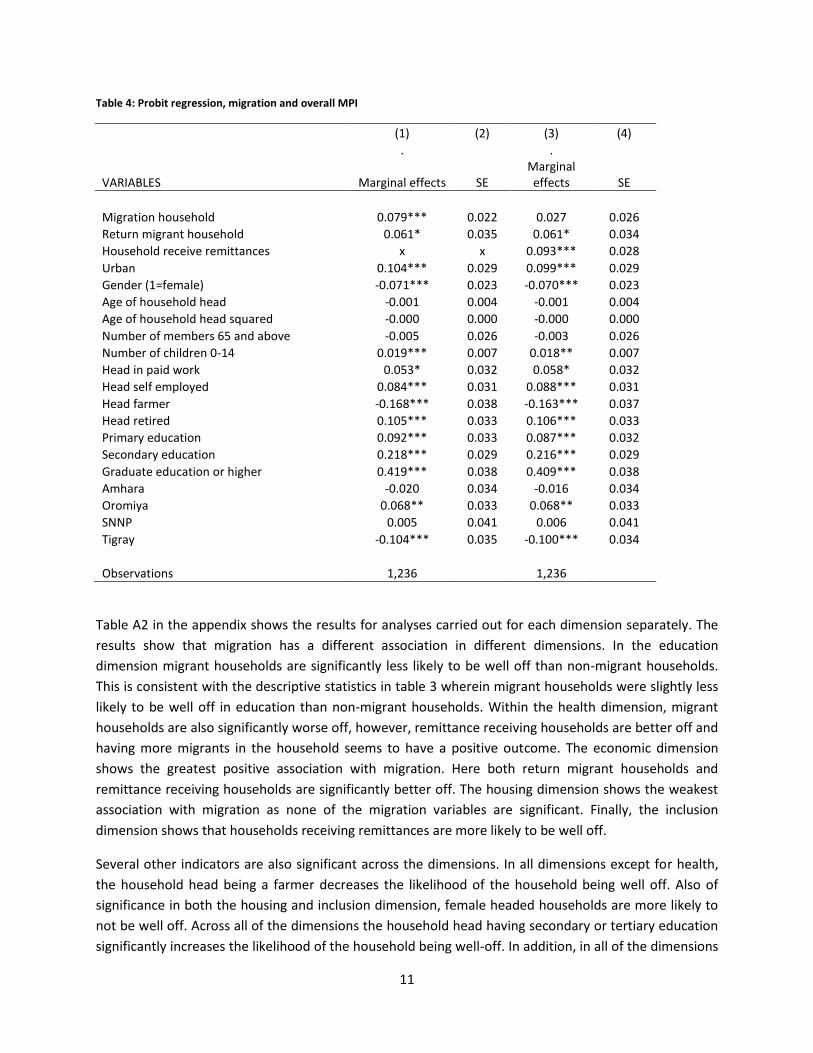
destination regions. Table 4 presents the results of the first step.
The results show a positive association between migration and overall multidimensional well-being.
Having a migrant increases the likelihood that a household is better off (column 1). However, this effect
is only statistically significant when not controlling for remittances. When a control for remittances is
introduced (column 3), there is no longer a statistically significant relationship between migration and
multidimensional wellbeing. The link between migration and well-being therefore appears to be through
monetary remittances that the migrants send.
Return migration is positively associated with household wellbeing, and this effect is robust to the
inclusion of a control for remittances in column 3. This confirms the patterns in Table 3 where return
migrants were systematically better off compared to migrant and non-migrant households. This may
indicate that returnees bring resources with them in the return, such as financial, human, or social
capital, that contribute to their household wellbeing post-return.
11
Table 4: Probit regression, migration and overall MPI
(1) (2) (3) (4)
.
.
VARIABLES Marginal effects SE
Marginal effects SE
Migration household 0.079*** 0.022 0.027 0.026
Return migrant household 0.061* 0.035 0.061* 0.034
Household receive remittances x x 0.093*** 0.028
Urban 0.104*** 0.029 0.099*** 0.029
Gender (1=female) -0.071*** 0.023 -0.070*** 0.023
Age of household head -0.001 0.004 -0.001 0.004
Age of household head squared -0.000 0.000 -0.000 0.000
Number of members 65 and above -0.005 0.026 -0.003 0.026
Number of children 0-14 0.019*** 0.007 0.018** 0.007
Head in paid work 0.053* 0.032 0.058* 0.032
Head self employed 0.084*** 0.031 0.088*** 0.031
Head farmer -0.168*** 0.038 -0.163*** 0.037
Head retired 0.105*** 0.033 0.106*** 0.033
Primary education 0.092*** 0.033 0.087*** 0.032
Secondary education 0.218*** 0.029 0.216*** 0.029
Graduate education or higher 0.419*** 0.038 0.409*** 0.038
Amhara -0.020 0.034 -0.016 0.034
Oromiya 0.068** 0.033 0.068** 0.033
SNNP 0.005 0.041 0.006 0.041
Tigray -0.104*** 0.035 -0.100*** 0.034
Observations 1,236 1,236
Table A2 in the appendix shows the results for analyses carried out for each dimension separately. The
results show that migration has a different association in different dimensions. In the education
dimension migrant households are significantly less likely to be well off than non-migrant households.
This is consistent with the descriptive statistics in table 3 wherein migrant households were slightly less
likely to be well off in education than non-migrant households. Within the health dimension, migrant
households are also significantly worse off, however, remittance receiving households are better off and
having more migrants in the household seems to have a positive outcome. The economic dimension
shows the greatest positive association with migration. Here both return migrant households and
remittance receiving households are significantly better off. The housing dimension shows the weakest
association with migration as none of the migration variables are significant. Finally, the inclusion
dimension shows that households receiving remittances are more likely to be well off.
Several other indicators are also significant across the dimensions. In all dimensions except for health,
the household head being a farmer decreases the likelihood of the household being well off. Also of
significance in both the housing and inclusion dimension, female headed households are more likely to
not be well off. Across all of the dimensions the household head having secondary or tertiary education
significantly increases the likelihood of the household being well-off. In addition, in all of the dimensions
12
except for health, urban households are more likely to be well off. The household head being self-
employed had a positive association in the education, health and inclusion dimension.
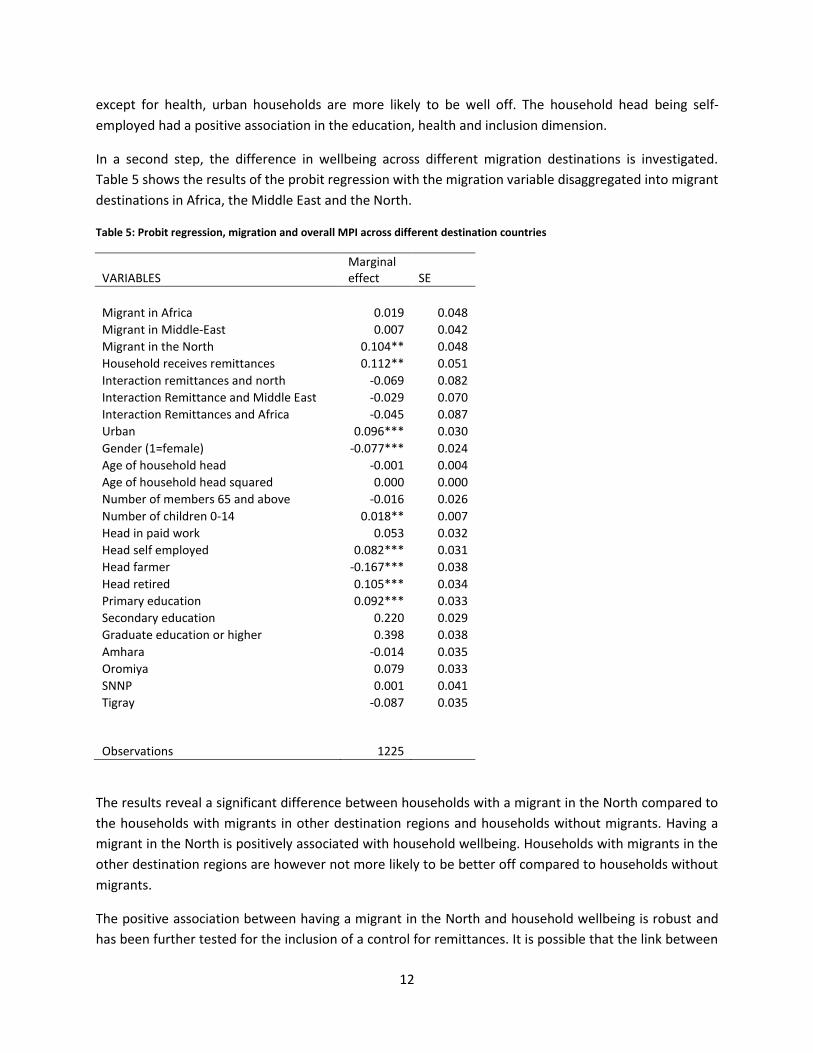
In a second step, the difference in wellbeing across different migration destinations is investigated.
Table 5 shows the results of the probit regression with the migration variable disaggregated into migrant
destinations in Africa, the Middle East and the North.
Table 5: Probit regression, migration and overall MPI across different destination countries
VARIABLES Marginal effect SE
Migrant in Africa 0.019 0.048
Migrant in Middle-East 0.007 0.042
Migrant in the North 0.104** 0.048
Household receives remittances 0.112** 0.051
Interaction remittances and north -0.069 0.082
Interaction Remittance and Middle East -0.029 0.070
Interaction Remittances and Africa -0.045 0.087
Urban 0.096*** 0.030
Gender (1=female) -0.077*** 0.024
Age of household head -0.001 0.004
Age of household head squared 0.000 0.000
Number of members 65 and above -0.016 0.026
Number of children 0-14 0.018** 0.007
Head in paid work 0.053 0.032
Head self employed 0.082*** 0.031
Head farmer -0.167*** 0.038
Head retired 0.105*** 0.034
Primary education 0.092*** 0.033
Secondary education 0.220 0.029
Graduate education or higher 0.398 0.038
Amhara -0.014 0.035
Oromiya 0.079 0.033
SNNP 0.001 0.041
Tigray -0.087 0.035
Observations 1225
The results reveal a significant difference between households with a migrant in the North compared to
the households with migrants in other destination regions and households without migrants. Having a
migrant in the North is positively associated with household wellbeing. Households with migrants in the
other destination regions are however not more likely to be better off compared to households without
migrants.
The positive association between having a migrant in the North and household wellbeing is robust and
has been further tested for the inclusion of a control for remittances. It is possible that the link between

13
remittances and wellbeing differ across migrant destination regions. In order to test this, interaction
effects between remittances and the three respective destination regions are also included. None of the
interaction effects are however statistically significant.
Table A3 in the appendix displays the analyses for the various dimensions separately. Having a migrant
in the North is positively associated with a higher wellbeing in the education, health and inclusion
dimensions. There is no statistically significant association between household wellbeing and having a
migrant in neither Africa nor the Middle East in any of the five dimensions. Receiving remittances is
positively associated with higher wellbeing in the health, income and inclusion dimension.
7. Conclusion
The study reveals that there is a positive association between migration and multidimensional wellbeing
in Ethiopia, but only when taking the migration destination region into account. An overall measure of
migration reveals that migration is positively linked to wellbeing only when not simultaneously
controlling for remittances. If remittances are taken into account, there is no longer any statistically
significant association between migration and the multidimensional wellbeing measure. The link
between migration and wellbeing is thus dependent on the household receiving remittances.
However, when disaggregating the effect of migration according to migration destination region, the
results reveal differences depending on if the household has a migrant in the North or in another
destination region. Households with migrants in the North are more likely to be well-off compared to
households without any migrants. The same does not hold for households with households in the
Middle East or in other African countries. The results do not show that households with these regions
are better off compared to households without migrants.
The results highlight the importance of taking the migrant destination region into account in the analysis
of linkages between migration and household wellbeing. The results also reveal that there are
differences across different dimensions of wellbeing. Migration to the north is positively associated with
wellbeing related to education, health and inclusion, but not with measures of wellbeing in income or
housing. The reason for these nuances in not known.
Looking at the overall multidimensional wellbeing indices effect, however, it is not surprising that
migration to the North is more likely to have positive associations with household well-being. This
finding stresses the importance of not over-generalizing the positive impacts of migration to any
destination. The descriptive statistics from this study illustrate that migrants to the north were more
likely to be regularized, migrate for a diversity of reasons, and come from urban households where the
household head had higher levels of education. Regrettably, the data in this case does not allow us to
compare household well-being before and after migration, but it is possible that migrants to the north
originate from better off households to begin with.
In terms of migration to the Middle East and Africa it is important to stress that these migration patterns
do not increase household wellbeing. As stated in the migration overview of this paper, the most
prevalent migration stream from Ethiopia at this time is to the Middle East. There is no evidence that

14
households are better-off from having a migrant in the Middle East, however at the same time, there is
also no evidence that these households are worse off. Qualitative research suggests that female
migration from Ethiopia to the Middle East tends to result more commonly in household survival back
home than in increasing household well-being (Kuschminder, 2014). It is slightly concerning that within
the descriptive statistics, households with a migrant in Africa have the lowest multidimensional well-
being at 0.17, compared to all other groups, including non-migrant households at 0.21. This is not
significant in the regression analysis, but still raises questions as to the drivers of migration from
Ethiopia within Africa and if this migration flow is motivated for survival reasons.
This paper has presented a unique comparison of the relationship between migration and household
wellbeing with migrants in a destination in the north, Middle East, and the south. It is clear that further
research needs to disaggregate the effects of migration by migrant destination. The findings in this study
show that in the Ethiopian context migration to the north is very different than migration to the south
and results in different levels of household wellbeing. Further comparative analysis is needed of south-
north and north-north migration effects on the household left behind.

15
References
Adams, R. and Page, ‘Do international migration and remittances reduce poverty in developing
countries?’, 33 World Development 10 (2005), 1645-1669.
Adams, R. (2010) ‘Remittances, Household Expenditure and Investment in Guatemala’
World Development, 38, (11), 1626-1641
Adams, R. (2013) ‘The Impact of Remittances on Investment and Poverty in Ghana’
World Development, 50, (C), 24-40
Alkire, S and Foster, J. (2011). ‘Counting and Multidimensional Poverty Measurement’, Journal of Public
Economics 95: 476–497.
Andersson, L., 2014, Migration, remittances and household welfare in Ethiopia, UNU-MERIT Working
Paper 2014-004
Bakewell, O. (2009) South-South migration and Human Development: Reflections on African
Experiences. Geneva: UNDP.
Bastos, A., Fernandes, G., & Passos, J. (2004). Child income poverty and child deprivation: an essay on
measurement. International Journal of Social Economics, 31(11/12), 1050-1060.
Baulch, B., & Masset, E. (2003). Do Monetary and Nonmonetary Indicators Tell the Same Story About
Chronic Poverty? A Study of Vietnam in the 1990s. World Development, 31(3), 441-453.
Bradshaw, J., & Finch, N. (2003). Overlaps in Dimensions of Poverty. Journal of Social Policy, 32, 513-525
Bourguignon, F., & Chakravarty, S. (2003). The measurement of multidimensional poverty. Journal of
Economic Inequality, 1(1), 25-49.
Citizens’ Initiative for the Rights of Children Under Six. 2006. Focus on Children Under Five (FOCUS).New
Delhi: Secretariat of the Right to Food Campaign
de Regt, M. (2010). “Ways to Come, Ways to Leave: Gender, Mobility, and Il/legality among Ethiopian
Domestic Workers in Yemen.” Gender & Society 24(2): 237-260.
Fernandez, B. (2010). “Cheap and disposable? The impact of the global economic crisis on the migration
of Ethiopian women domestic workers to the Gulf.” Gender and Development 18(2): 249-262.
Fernandez, B. (2013). “Traffickers, Brokers, Employment Agents, and Social Networks: The Regulation of
Intermediaries in the Migration of Ethiopian
Gassmann,F; Siegel, M.; Vanore, M. & Waidler, J., 2013, The impact of migration on children left behind
in Moldova, UNU-MERIT Working Paper 2013-043

16
Gassmann,F; Siegel, M.; Vanore, M. & Waidler, J., 2012, The impact of migration on elderly left behind
in Moldova, UNU-MERIT Working Paper 2012-082
Hildebrandt and McKenzie, ‘The Effects of Migration on Child Health in Mexico’, World Bank Policy
Research Working Paper 3573 (2005).
Horwood C. 2009. In Pursuit of the Southern Dream: Victims of Necessity. IOM: Nairobi
ILO, 2011. “Trafficking in Persons Overseas for Labour Purposes: The Case of Ethiopian Domestic
Workers.” Addis Ababa.
IOM, 2013. World Migration Report. IOM: Geneva
Kanaiaupuni and Donato, ‘Migradollars and mortality: The effects of male migration on infant mortality
in Mexico’, 36 Demography 3 (1999), 339-53.
Kandel, ‘The impact of U.S. migration on Mexican children’s educational attainment’, in M. Cosio, R.
Marcouz, M. Pilon, and A. Quesnel (eds), Education, Family, and Population Dynamics, (CICRED,
2003), 305-328.
Klasen, S. (2000). Measuring Poverty and Deprivation in South Africa. Review of Income and Wealth,
46(1), 33-58.
Kuschminder, K., (2014). Female Return Migration and Reintegration in Ethiopia, PhD dissertation,
Maastricht University.
Kuschminder, K., Andersson, L. & Siegel, M. (2012). Profiling Ethiopian migration: A comparison of
characteristics of Ethiopian migrants to Africa, the Middle East and the North, in: Cristina
Udelsmann Rodrigues (Ed.), Crossing African borders: Migration and mobility, Center of African
Studies (CEA), ISCTE-IUL, University Institute of Lisbon, Lisbon.
Kuschminder, K. and Siegel, M. (2014). Migration & development: A world in motion - Ethiopia country
report. Maastricht University, Maastricht.
Laderchi, C. R., Saith, R., & Steward, F. (2003). Does it Matter that we do not Agree on the Definition of
Poverty? A Comparison of Four Approaches. Oxford Development Studies, 31(3), 243-274.
Lipton, ‘Migration from the Rural Areas of Poor Countries: The Impact on Rural Productivity and
Income Distribution’, 8 World Development (1980), 1-24.
Loschmann, C. & Siegel, M., 2013, The influence of vulnerability on migration intentions in Afghanistan,
UNU-MERIT Working Paper 2013-038
McKenzie, D. & H. Rapoport (2011) Can Migration Reduce Educational Attainment? Evidence from Mexico , Journal of Population Economics, 24(4): 1331-1358, 2011.

17
McKenzie, D. & H. Papoport (2007) Network Effects and the dynamics of Migration and Inequality: Theory and Evidence from Mexico , Journal of Development Economics, 84(1): 1-24.
McKenzie, D. (2005)Beyond Remittances: The effects of Migration on Mexican Households , in International Migration, Remittances and the Brain Drain, C. Ozden and M. Schiff (eds.) The World Bank: Washington D.C.
McKenzie, D. & N. Hildebrandt (2005) The effects of migration on child health in Mexico , with N. Hildebrandt, Economia, 6(1): 257-89.
Nussbaum, M. (1992). Human Functioning and Social Justice. Politicial Theory, 20(2), 202-246.
Nussbaum, M. (2000). Women and Human Development: The capabilities approach. New York:
Cambridge University Press.,
Perry, B. (2002). The Mismatch between Income Measures and Direct Outcome Measures of Poverty.
Social Policy Journal of New Zealand, 19, 101-127
Ratha ,D. and W. Shaw (2007) South South Migration and Remittances. Washington, DC: World Bank.
Ravallion, M. (1994). Poverty Comparisons: Harwood Academic Publishers.
RMMS. (2014). Going West: contemporary mixed migration trends from the Horn of Africa to Libya &
Europe. Nairobi: RMMS.
Sen, A. (1976). Poverty: an ordinal approach to measurement. Econometrica, 44(2), 219-231.
Sen, A. (1982). Poverty and Famines: An Essay on Entitlement and Deprivation. Oxford, UK: Oxford
University Press.
Sen, A. (1985). Commodities and Capabilities. Oxford, UK: Oxford University Press.
Sen, A. (1993). Capability and Well-Being. In M. Nussbaum & A. Sen (Eds.), The Quality of Life. Oxford:
Oxford University Press.
Siegel, Melissa & Jennifer Waidler, 2012, Migration and multi-dimensional poverty in Moldovan
communities, Eastern Journal of European Studies, 3:2, 105-119
Thorbecke, E. (2008). Multidimensional Poverty: Conceptual and Measurement Issues. In N. Kakwani & J.
Silber (Eds.), The Many Dimensions of Poverty. New York: Palgrave MacmillanWagle 2009
United Nations Development Program, Human Development Report 2009: Overcoming Barriers - Human
Mobility and Development, (United Nations Press, 2009).
United Nations Development Program, 2015. Human Development Index. Available at:
http://hdr.undp.org/en/content/human-development-index-hdi Access on: 1 July 2015
United Nations High Commissioner on Refugees. (2015). Asylum statistics.

18
Vanore, M. & Siegel, M. 2013, Migration and its impact on those staying behind: New evidence from
Georgia and the Republic of Moldova, Migration Policy Practice, Vol. III, Number 5
Whelan, C., Layte, R., & Maitre, B. (2004). Understanding the Mismatch Between Income Poverty and
Deprivation: A Dynamic Comparative Analysis. European Sociological Review, 20(4), 287-302.

19
Table A1: Descriptive table, Multidimensional Wellbeing Index
DIMENSIONS AND INDICATORS North Africa
Middle East
Migrant household
Return migrant
household
Household without
migration experience
EDUCATION
Head of the household is literate 0.68 0.54 0.47 0.54 0.58 0.54
All children 7-15 goes to school 0.98 0.76 0.82 0.85 0.85 0.82
Education dimension (0.7 cutoff) 0.67 0.45 0.41 0.49 0.54 0.50
HOUSING Household has access to electricity 0.95 0.75 0.44 0.56 0.65 0.59
Household has access to toilet 0.84 0.17 0.77 0.81 0.70 0.67
Household has more than one room 0.97 0.75 0.61 0.74 0.69 0.57
Floor not dirt, sand, dung 0.80 0.17 0.33 0.42 0.41 0.31
Housing dimension (0.7 cutoff) 0.88 0.21 0.33 0.46 0.47 0.35
HEALTH Household has access to health clinic 0.96 0.97 0.99 0.97 0.98 0.96
Household able to meet its food needs (1=yes) 0.88 0.68 0.79 0.80 0.78 0.71
Household does not have disabled or seriously ill household head 1.00 0.99 0.97 0.98 0.98 0.96
Household has not lost a child 0.84 0.47 0.63 0.64 0.74 0.73
Health dimension (0.7 cutoff) 0.99 0.80 0.90 0.90 0.90 0.89
INCOME/EMPLOYMENT/ASSETS Household earns more than $2/day per adult equivalent 0.56 0.20 0.23 0.30 0.44 0.29
None of the children in the household are working 0.38 0.53 0.56 0.50 0.59 0.57
Household has more than one income source 0.67 0.67 0.67 0.68 0.59 0.57
Household owns at least two consumption assets 0.83 0.17 0.31 0.41 0.47 0.31
Income dimension 0.7 cutoff 0.51 0.18 0.24 0.29 0.39 0.21
INCLUSION Household owns mobile phone 0.96 0.56 0.63 0.71 0.68 0.52

20
Household member of at least one organization 0.69 0.84 0.65 0.70 0.69 0.65
Inclusion dimension 0.7 0.68 0.46 0.43 0.50 0.47 0.36
OVERALL MPI Overall mpi cutoff 0.7 0.61 0.17 0.23 0.31 0.34 0.21
Overall mpi cutoff 0.7 and 0.5 0.88 0.33 0.39 0.51 0.57 0.39
N 104 87 222 407 127 727

21
Table A2: Probit Results by Dimension
1 2 3 4 5 6 7 8 9 10
VARIABLES Education dimension se
Health dimension se
Income dimension se
Inclusion dimension se
Housing dimension se
Migration household -0.104* 0.055 -0.082* 0.044 -0.032 0.051 -0.018 0.069 -0.043 0.045 Return migrant household (without current migrant) -0.023 0.040 -0.012 0.028 0.137*** 0.035 0.070 0.043 0.043 0.037
household receive remittances 0.030 0.034 0.054** 0.025 0.122*** 0.031 0.108*** 0.036 0.035 0.028
number of migrants in household 0.096** 0.038 0.072** 0.035 0.027 0.036 0.063 0.053 0.052 0.035
Urban 0.166*** 0.038 -0.030 0.029 0.106*** 0.035 0.087** 0.040 0.220*** 0.028
Gender (1=female) -0.282*** 0.026 -0.029 0.023 -0.029 0.027 -0.063** 0.030 -0.008 0.023
Age of household head -0.017*** 0.005 -0.010** 0.004 0.004 0.005 0.007 0.005 0.002 0.004
Age of household head squared 0.000 0.000 0.000* 0.000 -0.000 0.000 -0.000 0.000 -0.000 0.000 Number of members 65 and above 0.032 0.031 -0.010 0.025 -0.011 0.031 -0.015 0.034 -0.003 0.029
Number of children 0-14 -0.000 0.008 0.007 0.006 0.030*** 0.008 0.013 0.009 0.010 0.007
Head in paid work 0.128*** 0.042 -0.012 0.033 -0.012 0.038 0.031 0.044 0.006 0.032
Head self employed 0.082** 0.040 0.058* 0.033 0.058 0.037 0.104** 0.043 0.018 0.031
Head farmer -0.097** 0.040 0.017 0.029 -0.132*** 0.039 -0.078* 0.044 -0.252*** 0.034
Head retired 0.144*** 0.043 0.043 0.034 0.043 0.040 0.190*** 0.046 0.028 0.035
Primary education 0.081** 0.033 0.028 0.022 0.067** 0.034 0.102*** 0.035 0.095*** 0.030
Secondary education 0.199*** 0.033 0.086*** 0.024 0.140*** 0.032 0.235*** 0.033 0.244*** 0.025
Graduate education or higher 0.389*** 0.052 0.199*** 0.047 0.291*** 0.043 0.300*** 0.052 0.404*** 0.042
Amhara -0.032 0.045 -0.021 0.035 -0.049 0.039 -0.061 0.046 0.115*** 0.037
Oromiya 0.049 0.045 -0.041 0.033 -0.016 0.040 0.109** 0.047 0.153*** 0.034
SNNP 0.090* 0.051 -0.150*** 0.037 0.035 0.046 0.098* 0.052 0.071* 0.040
Tigray -0.021 0.045 -0.012 0.035 -0.121*** 0.040 -0.175*** 0.046 0.093*** 0.035
Observations 1.258
1.249
1.249
1.254
1.253

22
Table A3: Probit results with migrant destinations, by dimension
VARIABLE Education
Health
Income
Inclusion
Housing
Africa 0.033 0.049 -0.042 0.032 -0.043 0.049 0.056 0.052 -0.040 0.043
Middle-East -0.047 0.039 -0.002 0.026 -0.030 0.037 0.045 0.041 -0.024 0.028
North 0.096** 0.051 0.179** 0.069 0.029 0.045 0.067 0.055 0.162*** 0.041
remittancehh 0.049 0.035 0.045* 0.025 0.115*** 0.032 0.104*** 0.037 0.026 0.028
Urban 0.157*** 0.038 -0.028 0.028 0.113*** 0.035 0.108*** 0.040 0.218*** 0.028
Gender (1=female) -0.277*** 0.026 -0.034 0.022 -0.038 0.027 -0.068** 0.030 -0.010 0.023
Age of household head -0.017*** 0.005 -0.009** 0.004 0.005 0.005 0.007 0.005 0.001 0.004
Age of household head squared 0.000 0.000 0.000* 0.000 0.000 0.000 0.000 0.000 0.000 0.000
Number of members 65 and above 0.029 0.030 -0.019 0.025 -0.009 0.032 -0.013 0.035 -0.011 0.028
Number of children 0-14 0.000 0.009 0.006 0.006 0.030 0.008 0.013 0.009 0.011 0.007
Head in paid work 0.135*** 0.042 -0.013 0.032 -0.022 0.039 0.027 0.044 0.012 0.032
Head self employed 0.089** 0.040 0.057* 0.032 0.059 0.037 0.105** 0.043 0.026 0.030
Head farmer -0.095** 0.041 0.022 0.029 -0.127*** 0.040 -0.073* 0.044 -0.227*** 0.034
Head retired 0.137*** 0.044 0.035 0.034 0.040 0.041 0.189*** 0.047 0.021 0.034
Primary education 0.079** 0.033 0.031 0.022 0.067* 0.034 0.100*** 0.035 0.092 0.030
Secondary education 0.197*** 0.033 0.081*** 0.024 0.144*** 0.032 0.231*** 0.034 0.238*** 0.025
Graduate education or higher 0.372*** 0.053 0.177*** 0.048 0.292*** 0.044 0.298*** 0.053 0.370*** 0.042
Amhara -0.039 0.046 -0.020 0.036 -0.055 0.041 -0.044 0.047 0.105*** 0.038
Oromiya 0.045 0.045 -0.034 0.033 -0.006 0.040 0.119** 0.047 0.158*** 0.033
SNNP 0.086* 0.051 -0.145*** 0.037 0.026 0.047 0.109** 0.053 0.064 0.040
Tigray -0.017 0.045 -0.006 0.035 -0.112*** 0.040 -0.166*** 0.046 0.100*** 0.034
1244
1235
1235
1240
1239

23

Migration and Multidimensional Child Well-Being in Moldova and Georgia
Jennifer Waidler1, Michaella Vanore
2, Franziska Gassmann
3 and Melissa Siegel
4
Maastricht Graduate School of Governance| UNU-MERIT
Abstract
Using household survey data collected between September 2011 and December 2012 on
migrant- and non-migrant households in Moldova and Georgia, this paper measures and
compares the multidimensional well-being of children with and without migrant household
members. While a growing body of literature has addressed the effects of migration for
children ‘left behind’, relatively few studies have empirically analysed if and to what extent
migration implies different well-being outcomes for children, and fewer still have conducted
comparisons across countries. To compare the outcomes of children in current- and non-
migrant households, this paper defines a multidimensional well-being index comprised of six
dimensions of wellness: education, housing conditions, protection, physical health, emotional
health, and communication access. The results of both bivariate and multivariate analyses
suggest that migration has limited consequences for different domains of well-being. While in
Moldova migration does not appear to correspond to any positive or negative well-being
outcomes, in Georgia migration was linked to higher probabilities of children attaining well-
being in physical health, communication access, housing, and on the total index level. The
different relationship between migration and child well-being in Moldova and Georgia likely
reflects different migration trajectories, mobility patterns, and levels of maturity of each
migration stream.
JEL codes: F22, I32, J14, J61
Key words: migration, children, multi-dimensional poverty, Moldova, Georgia
1Corresponding author: [email protected]
I. Introduction
In many societies experiencing large-scale mobility transitions, migration has become a
powerful phenomenon that incites dialogue and discourse on both public and policy level.
This is true of both Moldova and Georgia, two post-Soviet countries that have both
experienced the emigration of more than one-fifth of their total populations (World Bank,
2010). Such large-scale emigration has inspired growing concern about the potential costs and
benefits of migration, particularly for those children who are ‘left behind’ by their migrant
parents.
Migration and its consequences are notoriously difficult to quantify. Remittances are one of
the best-explored outcomes of migration given the substantial financial flows they can
represent: in Moldova, remittances accounted for over 23 percent of GDP in 2009 and in
Georgia, 6.4 percent (World Bank, 2010). Such remittance flows can play a key role in
protecting recipient households from economic shocks and income vulnerability, yet it is
unclear to what extent such transfers can replace the contributions that a migrant would make
to the household if s/he were present. The impact of a migrant’s absence is particularly
pertinent to explore within the context of child well-being, but relatively few empirical studies
have attempted to define and measure child well-being and its association with migration.
Relatively little research has been conducted on the trade-offs between increased material
resources and the less-easily quantified consequences of parental absence such as the
availability of child supervision (Kandel & Kao, 2001); this is especially true of Moldova and
Georgia, where limited research has explored the specific channels through which migration
can affect the well-being of children. As with other Eastern European and former Soviet
states, Moldova and Georgia have experienced a rapid rise in emigration that has inspired
policy makers and civil society organisations to raise concerns about the potential impacts
these growing migration flows have on society. While public discourse generally recognises
the inflow of remittances as a positive outcome of migration, the perceived social impacts of
migration are less well perceived.
This paper bridges this gap by elaborating a multidimensional well-being index for children in
Moldova and Georgia, which enables the well-being outcomes of children with and without
migrant household members to be compared. The well-being index is constructed around six
domains of wellness representing different facets of a child’s life: physical health, emotional
health, protection, educational outcomes, housing conditions, and communication access. The
choice to construct a multidimensional index allows a more holistic conceptualisation of child
well-being to be operationalised and measured, which enables exploration of how migration
can possibly influence child well-being beyond traditional income or material well-being
measures. The index has also been constructed to enable cross-country comparison of
outcomes, which provides important analytical power to the method, particularly as it allows
for discussion of how deviations in country context correspond to different well-being
outcomes. The next section of this paper explores the theoretical relationship between
migration and well-being and provides a brief overview of previous studies on the potential
effects of migration on child well-being. The third section then reviews how child well-being

should be defined and operationalised. Brief backgrounds of both Moldova and Georgia are
provided before the data used in the following analysis are described. The indicators and
methodology for constructing and using the specified child well-being index are then
explained, followed by a summary of results. This paper concludes with a discussion of the
results.
II. Migration & Well-Being
By assessing the impacts of migration on child well-being, an implicit assumption is made
that migration bears consequences for the individuals and households it affects. Migration and
the well-being of children ‘left behind’ can be expected to be linked through several avenues,
the most obvious of which is that migration may involve the withdrawal or addition of
household-level resources that may be used to support child well-being.
Neo-classical theories of migration, such as the new economics of [labour] migration
(NELM) theory (Startk & Bloom, 1985), for instance, suggested that the migration decision is
made on a household level in response to anticipated costs and benefits of migration. Within
the NELM theory, migration is expected to be mutually beneficial for both the migrant and
the sending household; the household will accept some of the costs associated with migration
in return for remittances, which are a means of not only expanding household income but of
diversifying its sources. Migration and remittances are therefore a household strategy for
protecting the household against risk and of smoothing consumption over time,
supplementing lost income during unemployment spells and providing additional capital for
use in small-scale enterprise (Massey et al, 1993; Taylor, 1999; Stark & Bloom, 1985). As
household members, children would be expected to benefit from the resources provided by
migrants, particularly given use of those resources for expenditures such as healthcare and
education.
The resources a migrant can potentially share with the household in the country of origin can
include not only financial capital , through monetary remittances, but can also include human
capital, through the transmission of knowledge, values, and ideas in the form of “social
remittances” (Levitt, 1998; Acosta, Fajnzylber, & Lopez, 2007). Several studies have
explored the potential uses of both financial and social remittances for children ‘left behind’.
Yang (2008) in the Philippines and Mansuri (2006) in Pakistan, for instance, both suggested
that the receipt of remittances can loosen household economic constraints, enabling children
to pursue education and reducing child labour rates. Other studies have found a positive
relationship between migration and child health outcomes, as remittances can be spent on
higher quality foods, vitamins, and medicines (Salah, 2008) as well as in preventative and
curative healthcare (Cortés, 2007). Other studies in countries such as Guatemala (Moran-
Taylor, 2008), El Salvador (de la Garza, 2010), the Philippines (Edillon, 2008; Yang, 2008),
and Pakistan (Mansuri, 2006) have found strong associations between the receipt of
remittances and higher rates of educational attainment, greater rates of participation in extra-
curricular activities, and better grades.

Such studies have cautioned that the potential positive relationship between migration and
child well-being is conditional on characteristics of the migrant and of the household in which
a child resides. Many studies have noted that remittances are a main means through which
migration can affect child well-being, but the act of migration is no guarantee that a migrant
can and will send remittances. Particularly when migration is undertaken as a survival
strategy and is funded through loans, children in migrant households may be placed in an
even more tenuous economic situation than prior to migration, particularly if they shoulder
the migration debt burden (van de Glind, 2010). In some situations, as a study of Kandel
(2003) in Mexico found, migration may increase child labour rates, particularly among male
children who must work to support the household. While remittances may enable greater
expenditure on healthcare inputs, positive outcomes may develop only over time: in Mexico
McKenzie (2007) observed that migration was initially correlated to lower use of preventative
healthcare, incomplete adherence to vaccination regimes, and lower rates of breastfeeding.
While infant mortality was observed to decrease over time (Hildebrandt et al, 2005;
McKenzie, 2007), parental migration during a child’s infancy can lead to less-than-optimal
health behaviours. Migration can also bear negative potential consequences for child
educational outcomes, with studies in Albania (Giannelli & Mangiavacchi, 2010), Ecuador
(Carillo & Herrera, 2004, in Cortés, 2007), and Moldova (Salah, 2008) finding a relationship
between parental absence and higher rates of school absenteeism, declining school
performance, and declining graduation rates.
Despite the categorization of potential effects into “positive” or “negative” outcomes, most
studies caution that the relationship between migration and child well-being outcomes is
dynamic and changes according to factors such as a child’s age, post-migration caregiving
arrangements, a household’s socio-economic status, and the retained ties between a migrant
and the household members remaining in the origin country. The generalizability of insights
provided from past studies is also low, as few studies have used data on children specifically
and have instead used data on the whole household, with children assumed to share the
experiences as all other household members. Little data has also been collected through
survey instruments that focus on migration, which limits the amount of information collected
on the household’s migration experiences. Among those studies that have explicitly focused
on children in migrant households, few have explored the situation of children remaining in
the country of origin, and fewer still have engaged an appropriate control group against which
the outcomes of children in migrant households can be compared (Graham & Jordon, 2011).
Past studies have also largely focused on singular aspects of well-being such as physical
health or educational outcomes, but given the complex interplay between migration and the
conditions that affect household members, a more encompassing assessment of migration’s
impact on well-being is needed. The present study is well-oriented to fill the identified gaps in
past research, particularly as it defines and operationalizes well-being in a more holistic
framework and in two countries that have been markedly understudied.
III. Defining Well-Being

One of the first challenges faced in the assessment of child well-being is in defining the
concept. The components of child well-being, while shared to a certain extent with that of
adults, differs according to the different needs and vulnerabilities children face (White, Leavy,
& Masters, 2003; Brooks-Gunn & Duncan, 1997; Waddington, 2004). In acknowledging that
children are a unique population group with differentiated needs, one makes the commitment
to emphasise the child as the unit of observation—to measure the phenomenon and
characteristics of a child’s life on his or her own level and not exclusively on the household
level (Ben-Arieh, 2000). While in much research on child poverty, “children are routinely
considered as a property of their households and are assumed to share equally in its fortunes
(or misfortunes)” (Gordon et al, 2003; pg. 3), there are many inherent flaws to assessing child
poverty in this way. The first is that children may not share equally in the resources available
to a household, and even if equal access is guaranteed, the actual consumption behaviour of
children is uncertain5 (Gordon et al, 2003). Issues of access and consumption also make
measurement of child well-being (or its inverse, poverty) incompatible with the monetary
approach of poverty measurement in which deprivation is assessed exclusively on the basis of
material means such as income or expenditure (Minujin, Delamonica, Davidziuk, &
Gonzalez, 2006; Gordon et al, 2003; Roelen, Gassmann, & de Neubourg, 2009). This hints at
a key hurdle to assessing child poverty: identifying and defining dimensions or domains of
child well-being.
As for any population group, decomposing the components of child well-being or poverty
requires a conceptual basis. Deprivation—and its end result, poverty—can be defined
according to many different sources such as national norms and legislation, internationally-
agreed definitions and conventions, scholarly theories, public consensus, and empirical
evidence (de Neubourg et al, 2012). Given increased recognition that childhood is not only a
means to an end (adulthood) but rather an end to itself6,one of the most important sources for
defining deprivation is international instruments such as the Convention on the Rights of the
Child (CRC), which provides a rights-based framework for approaching well-being. The
CRC, which was adopted by the UN General Assembly in 1989, is a legal instrument for
promotion and protection of children’s rights that outlines minimum standards for “the
treatment, care, survival, development, protection and participation that are due to every
individual under age 18.” (UNICEF, 2009; pg. 2). Within the CRC children are envisioned as
rights holders, yet this entitlement to rights is both challenged and complemented by
dependence on families, communities, and societies to attain minimum standards of wellness.
Within this rights-based framework, child well-being can be understood as the realization of
children’s rights and the fulfilment of opportunities for a child to reach his/her potential, both
5 While the use of adult equivalence scales attempts to “approportion” household resources to account for
economies of scales within households that reflect consumption behaviours of certain members, it is unclear how
universal or appropriate widely-used scales, like the OECD 1982 scale, are for different country contexts. 6 This is related to the discussion of well-being versus well-becoming. While much discussion of childhood
poverty relates to the potential effects of deprivation for future growth, development, and eventual functionality
as adults (that is, a child’s well becoming), a child’s wellness can also be assessed as it exists at the present
moment, in terms of access to equivalent rights and privileges as other members of a society (Ben-Arieh, 2000;
Roelen, 2010).

at the present moment (well-being) but also in the future (well-becoming) (Bradshaw,
Hoelscher, & Richardson, 2007). Interpreted this way, well-being in the context of child’s
rights has strong parallels with the human development and capabilities approach championed
by Amartya Sen. The capabilities approach envisions well-being as the product of an
individual’s effective opportunities or capabilities to attain a desired outcome; lack of
capabilities, or the freedom to choose among them, limits the range of realizable functionings,
leading to deprivation or poverty (Sen, 1993; Robeyns, 2005). Both the child’s rights-based
framework and capability approach envision well-being as inherently multidimensional,
comprised of opportunities and entitlements in multiple facets of life; deprivation in single
dimensions can thus lead to failure to attain well-being in total (Alkire, 2002; Sen, 1993;
Robeyns, 2005; Alkire & Foster, 2011).
To translate concepts of well-being into functional measurement instruments, a list of
dimensions of well-being—and the indicators by which they can be measured—must be
elaborated. A significant body of literature has addressed the multidimensional nature of child
poverty (see Roelen & Gassmann, 2008, for a review), much of which has adopted a rights-
based perspective to define well-being domains (Alkire & Roche, 2011). The first
internationally-comparable estimates of child poverty in the developing world produced by
the research team at Bristol University’s Townsend Centre for International Poverty
Research7
relied on indicators of poverty that aligned with the internationally-agreed
definition of poverty proposed during the World Summit for Social Development in
Copenhagen in 1995. The resulting instrument was comprised of eight dimensions across
which children could experience deprivation: food, safe drinking water, sanitation facilities,
health, shelter, education, information, and basic social services (Gordon et al, 2003). A 2007
study by Bradshaw and colleagues on child well-being in the European Union drew from the
CRC to construct an index that similarly defined well-being in terms of eight “clusters” of
indicators: material situation, housing, health, subjective well-being, education, children’s
relationships, civic participation, and risk and safety. Drawing from a different source of
inspiration—a review of 27 subjective well-being studies conducted by Cummins and
colleagues—Land, Lamb, and Mustillo (2001) developed a child well-being index for the
United States that bore strong resemblance to the previous studies. Their index was comprised
of seven domains: material well-being, health, safety/behavioural concerns, educational
attainment, place in the community, emotional/spiritual well-being, and social relationships
(Land et al, 2001).
While consensus on defining and measuring child poverty has certainly not been reached, the
overlap in dimensions among these studies suggests some convergence toward similar
operationalisations of more abstract frameworks such as the CRC. Such instruments provide
initial guidance on key components of child well-being, particularly in a cross-country
comparative context. Based on reviewed literature, functionality in a cross-cultural context,
and availability of data, the following definition of child well-being is operationalized in this
study:
7The basis for the “Bristol approach” of child poverty measurement adopted by UNICEF’s Global Study is
derived from this report.

Well-being is a multidimensional state of personal being comprised of both self-
assessed (subjective) and externally-assessed (objective) positive outcomes across six
realms of rights and opportunity: education, physical health, emotional health, housing
and living standards, protection, and communication.
This definition recognises the inherent complexity and multidimensionality of well-being.
Individual components of well-being and their expression are the products of on-going and
dynamic processes that change the risk factors and resources within a child’s immediate and
more distant development environment (Bradshaw et al, 2007). Migration is one such process
that alters the context in which individuals develop and function, but its effects are not
universal and homogenous.
IV. Country Backgrounds
Before child well-being can be compared across the two study countries, the rationale in
choosing Moldova and Georgia must be made clear. Both countries have experienced rapid
mobility transitions that have corresponded to increasing concerns over the potentially-
disruptive effects of migration for the ‘left behind’. Despite some commonalities in terms of
the origin of large-scale emigration flows, Moldova and Georgia differ in important ways in
terms of contemporary migration flows and the implications of those flows for the well-being
of children who remain.
Following the dissolution of the Soviet Union and subsequent independence in 1991, the
Moldovan economy sharply declined, which prompted large waves of emigration. The loss of
the separatist territory Transnistria and the downturn of the Russian economy at the end of the
1990s contributed to the dire economic situation Moldova found itself in 1999: gross
domestic product was just 34 percent of the level experienced a decade earlier (Pantiru, Black,
& Sabates-Wheeler, 2007; CIVIS/IASCI, 2010), and 71 percent of the population lived below
the poverty line (IMF, 2006). The extreme level of economic vulnerability provided the first
initial “push” for large-scale emigration, which has continued relatively unabated since
(CIVIS/IASCI, 2010). As of 2010 it was estimated that over 770,000 people—equivalent to
21.5 percent of the total population—was living abroad, the majority of whom were in the
Russian Federation, Ukraine, Italy, and Romania (World Bank, 2010). In 2010 most migrants
were thought to be of prime working age, with approximately 80 percent between the ages of
18 and 44 (CIVIS/IASCI, 2010). As of 2008 the majority of migrants (58 percent) were male
(Salah, 2008), but a greater proportion of women have entered international migration,
particularly to destination countries in the European Union for work in the home-care sector
(CIVIS/IASCI, 2010).
Mobility trends in Georgia bear some similarity to those of Moldova, but the origin of large-
scale migration following the Soviet collapse is somewhat different. In the first years
following independence, migration flows were strongly characterised by the ethnic return of
non-Georgians to countries such as Russia, Greece, and Israel as well as by conflict-induced
displacement that promoted both internal and international migration (CRRC, 2007). Internal

conflict and ethnic strife during the early 1990s resulted in a several waves of migration from
the de facto independent regions of Abkhazia and South Ossetia, and the 2008 Russian-
Georgian war over the territory of South Ossetia prompted some additional migration both
within and beyond Georgia. As in Moldova, the post-Soviet period in Georgia has been
characterized by the deterioration of the economic system and state infrastructure, and despite
reforms and political transitions in the early 2000s, wide-scale poverty and economic
insecurity have remained a concern, with over half of the population living under the national
poverty line in 2007 (Hofmann & Buckley, 2011). The ongoing economic insecurity has
contributed to continuing emigration, which in recent years has been characterised by the
movement of prime working-age individuals to foreign labour markets. As of 2010 it was
estimated that the emigrant stock represented 25.1 percent of the total population (World
Bank, 2010), and a significant volume of individuals are thought to leave Georgia every year8.
While the Russian Federation and other Commonwealth of Independent States countries
represented the most important destinations of migrants during the early years of free
mobility, the migration stream has diversified, with the Russian Federation, Armenia,
Ukraine, Greece, and Israel representing the most important destination countries for migrants
in 2010 (World Bank, 2010). Turkey has also emerged as a prime destination for both men
and women in recent years, but other countries of destination are distinctly gendered:
migration to the Russian Federation was dominated by men until the 2008 Russian-Georgian
war, and female migration has been increasingly directed to Greece and other European
Union countries with growing elder/home care markets (IOM, 2009).
The different origins of migration flows from Moldova and Georgia correspond to different
migration experiences for individuals from each country. While the migration stream from
Moldova can be considered relatively “immature”, with low rates of settlement and family
reunification in destination countries (CIVIS/IASCI, 2010), emigration from Georgia has
included more significant levels of settlement in host countries and lower rates of return,
particularly among those individuals and households that left during the conflict period
(CRRC, 2007). Moldovan emigration is now characterized by high levels of circularity,
facilitated by favourable visa regimes with the Russian Federation and by access to the
European Union among dual Moldovan-Romanian passport holders. Many Georgian
emigrants are in a more disadvantaged position, particularly those residing in the EU without
legal right to residency or work. These factors influence the capacity migrants have to
maintain contact with their families and communities, thus Moldova and Georgia—and the
differential patterns of emigration they experience—provide interesting case studies for
exploration of how migration can affect the lives of those ‘left behind’.
V. Data & Methodology
8 While emigration flows are seldom provided, the IOM estimated the net emigration rate at -10.8 migrants/1000
population in 2008, which suggests a significant flow of outward migration (IOM, 2008).

Nationally-representative household data collected in the course of the project “the Effects of
Migration on Children and the Elderly Left Behind in Moldova and Georgia9” are used in this
paper to explore how different aspects of child well-being are linked to household-member
migration. In Moldova the household survey was implemented between September 2011 and
March 2012; data was collected on 3,571 households, of which 1,983 contained one or more
children under the age of 18. In Georgia the household survey was conducted between March
and December of 2012 and captured information on 4,010 households, of which 2,394
contained one or more children. The survey was conducted in all regions of both countries
except for the breakaway territory of Transnistria in Moldova and the de facto independent
regions of Abkhazia and South Ossetia in Georgia.
Within this survey, information was collected on specific aspects of children’s lives.
Caregivers of children in the household were requested to provide information about each
child’s physical and emotional health, educational behaviours, and time allocation. To retain
the child as the unit of analysis, information was generally collected on each child
individually. Household-level features such as the quality of housing (including the material
of the floors and walls and access to electricity) were assumed to apply to all household
members equally, however, and this information was thus not collected for each child
separately. Information was collected on all children in the household aged 18 or below, but
the following analysis focuses on school-aged children, those aged five to 17.
The survey also collected data on the migration histories of all household members, including
the years of first and last migration. More detailed information was also collected on all
migration episodes that occurred between 1999 and 2011/2, including duration of time abroad
and the reason for migration. In keeping with United Nations conventions, a migrant was
defined as a person who had lived abroad for three or more months consecutively at one time
(UN, 1998). A household was then classified as a current migrant household if it contained
one or more members who had been absent for three or more months at the time of the survey
but who were still considered to be a member of the household by, for instance, sharing in
household resources or contributing to household-level decisions. Households with a returned
migrant (someone who had lived abroad for three or months but who had since returned for
residence) were dropped from the sample to enable clearer comparison between current- and
non-migrant households. Table 1 below provides an overview of characteristics of households
used in the analysis, split by household migration status to indicate initial descriptive
differences.
Table 1: Characteristics of Household Containing One or More Children Aged 5-17
Moldova Georgia
Migrant HH Non-migrant
HH
Migrant HH Non-migrant
HH
9 More information on the project and its outputs is available at the University of Maastricht Graduate School of
Governance website at: http://mgsog.merit.unu.edu/research/moldova_georgia.php.
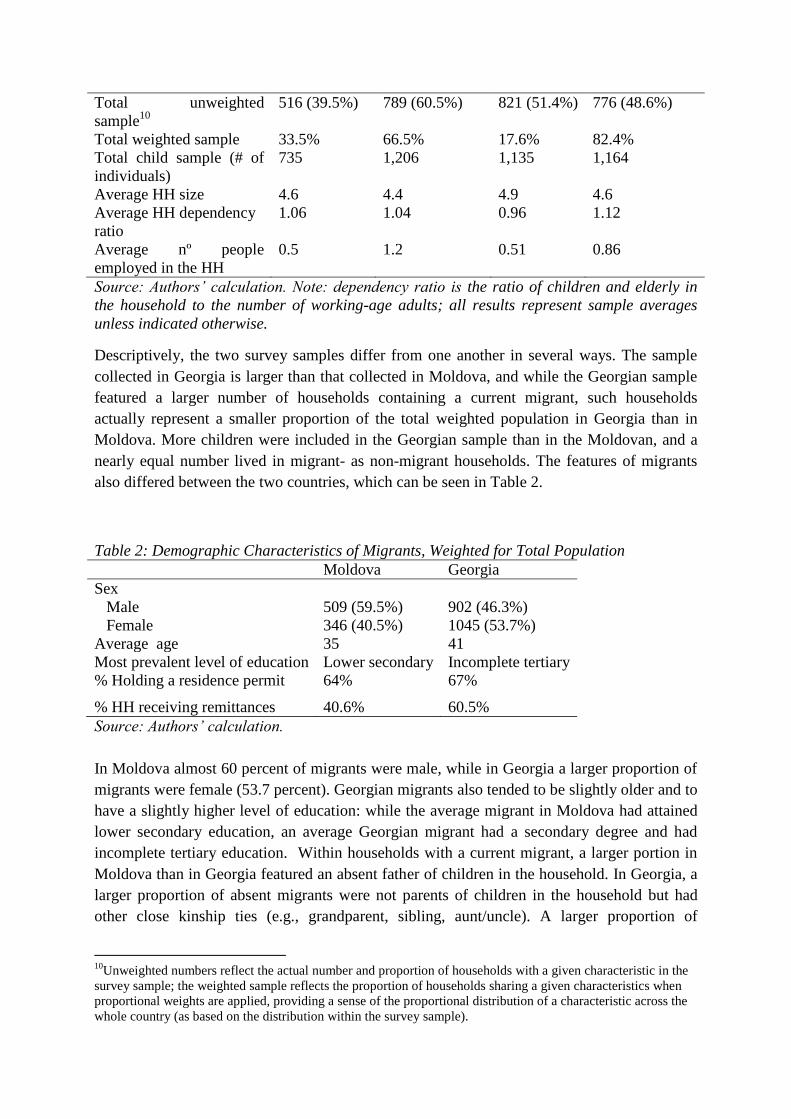
Total unweighted
sample10
516 (39.5%) 789 (60.5%) 821 (51.4%) 776 (48.6%)
Total weighted sample 33.5% 66.5% 17.6% 82.4%
Total child sample (# of
individuals)
735 1,206 1,135 1,164
Average HH size 4.6 4.4 4.9 4.6
Average HH dependency
ratio
1.06 1.04 0.96 1.12
Average nº people
employed in the HH
0.5 1.2 0.51 0.86
Source: Authors’ calculation. Note: dependency ratio is the ratio of children and elderly in
the household to the number of working-age adults; all results represent sample averages
unless indicated otherwise.
Descriptively, the two survey samples differ from one another in several ways. The sample
collected in Georgia is larger than that collected in Moldova, and while the Georgian sample
featured a larger number of households containing a current migrant, such households
actually represent a smaller proportion of the total weighted population in Georgia than in
Moldova. More children were included in the Georgian sample than in the Moldovan, and a
nearly equal number lived in migrant- as non-migrant households. The features of migrants
also differed between the two countries, which can be seen in Table 2.
Table 2: Demographic Characteristics of Migrants, Weighted for Total Population
Moldova Georgia
Sex
Male 509 (59.5%) 902 (46.3%)
Female 346 (40.5%) 1045 (53.7%)
Average age 35 41
Most prevalent level of education Lower secondary Incomplete tertiary
% Holding a residence permit 64% 67%
% HH receiving remittances 40.6% 60.5%
Source: Authors’ calculation.
In Moldova almost 60 percent of migrants were male, while in Georgia a larger proportion of
migrants were female (53.7 percent). Georgian migrants also tended to be slightly older and to
have a slightly higher level of education: while the average migrant in Moldova had attained
lower secondary education, an average Georgian migrant had a secondary degree and had
incomplete tertiary education. Within households with a current migrant, a larger portion in
Moldova than in Georgia featured an absent father of children in the household. In Georgia, a
larger proportion of absent migrants were not parents of children in the household but had
other close kinship ties (e.g., grandparent, sibling, aunt/uncle). A larger proportion of
10
Unweighted numbers reflect the actual number and proportion of households with a given characteristic in the
survey sample; the weighted sample reflects the proportion of households sharing a given characteristics when
proportional weights are applied, providing a sense of the proportional distribution of a characteristic across the
whole country (as based on the distribution within the survey sample).

households in Georgia than in Moldova received remittances from an absent migrant, which
likely reflects differences in migration patterns such as degree of circularity and duration of
migration.
These initial descriptive differences may suggest that the experiences of children with migrant
family members differ between the two countries. The different migration histories,
trajectories, and selectivity are just a few of the factors that would likely influence how
children in post-migration households are affected by the migration experience.
A. Indicators
To analyse and compare the rates of multidimensional well-being between children with and
without migrant family members, a child-specific well-being index was constructed. Based on
the definition provided above, six dimensions of child well-being were included: education,
physical health, housing, protection, communication, and emotional well-being. The current
analysis has the advantage of being able to draw from measurement tools expressly designed
for the particular population of interest (children). Table 3 contains the list of dimensions and
indicators chosen for measurement of children well-being.
Table 3: Well-being indicators per dimension
EDUCATION
Child attends school at an appropriate grade
HEALTH
Child has received all vaccinations
HOUSING WELL-BEING
Child is living in a household with appropriate flooring, water, and electricity
COMMUNICATION
Child lives in a household with a mobile phone
PROTECTION
Child is not abused
EMOTIONAL WELL-BEING
Child attains a normal score on the Strengths & Difficulties Questionnaire
The educational well-being dimension is measured by school enrolment; for children aged
five and six, school enrolment is measured by pre-school attendance, and for children aged
seven and older, this indicator measures enrolment in the appropriate grade for a child’s age.
Physical health is measured by a child’s receipt of the full regime of required vaccinations,
which includes BCG, DPT, measles, and hepatitis B. Housing conditions are measured by
household access to electricity, proper flooring, and a safe source of drinking water. The
dimension of protection is measured by whether a caregiver reports repeatedly beating a child
as punishment. Communication well-being is measured by access to a modern source of
communication, in this case a mobile phone. While this indicator is measured on the
household level, it can be expected that children living in households with technologies that

facilitate communication will benefit individually from the greater level of connectedness.
Finally, emotional well-being is measured for children aged five to 17 by the total difficulties
score of the Strength and Difficulties Questionnaire (SDQ), a behavioural screening
instrument that uses 25 questions on psychological attributes to identify potential cases of
mental health disorder (Goodman, 1997). In contrast to other child well-being indices that
include indicators of material well-being such as household income or expenditure, the index
proposed here consciously omitted such indicators because they are likely to influence the
attainment of well-being across all dimensions. Household poverty status is therefore included
as a control variable in all analyses. The indicators included in this index were chosen because
they were both relevant and available in both countries, which enables comparison of like
concepts across differing contexts. They were also chosen for their ease of interpretation, as
each indicator has a clear threshold for when a child does and does not meet acceptable levels
of well-being.
B. Methodology
Child well-being was calculated in two steps. First, well-being with respect to each indicator
was analysed separately. A child is considered not deprived if s/he meets the established well-
being threshold set for a given indicator. Indicator well-being rates (IWB) are calculated by
counting the number of children who meet the requirement, expressed as a share of all
children (Roelen et al., 2011; Roelen & Gassmann, 2012):
𝐼𝑊𝐵𝑥 = 1
𝑛∑ 𝐼𝑖𝑥
𝑛
𝑖=1
where n is the number of children for which the indicator is observable and Iix is a binary
variable taking the value 1 if child i has reached the threshold and 0 if the child has not with
respect to indicator x. The denominator, n, differs across indicators depending on the number
of actual observations. Indicators observed at household level, such as housing conditions, are
translated to all children living in the respective household, which assumes equal access and
intra-household distribution.
A second step involved building a multidimensional well-being index inspired by the Alkire
and Foster (2011) methodology for the measurement of multidimensional poverty. A child is
considered to be multidimensionally well if the weighted combination of dimensions is equal
to or exceeds 70 per cent of the total; in this index, a child must be well in at least four of six
indicators to be considered multidimensionally well. Each domain is assigned equal weight,
which facilitates the interpretation of results (Atkinson et al. 2002) but also asserts that each
dimension is considered of equal importance. The decision to set the cut-off at 70 per cent of
the aggregated indicators follows the cut-off used for multidimensional child well-being
indices (Roelen & Gassmann, 2012).
Children with and without migrant household members can then be compared, both across
indicators and on total index level. Multivariate analysis is applied to control for and identify
other correlates that determine child well-being, such as personal characteristics of the child
and regional or household characteristics. Separate binary outcome models are estimated for
selected indicators using standard probit models, specific as:
)()|1Pr( iii xxy , with i = 1, … , N
Where yi is the binary outcome variable, Φ is the standard normal distribution function, xi is a
vector of explanatory variables, and β is a vector of coefficients to be estimated. In the
following analysis, the dependent variable is the probability that an individual is well with
respect to a specific indicator. In order to assess whether the effect of migration is
significantly different between countries, models for each country are estimated separately,
and a Wald chi square test is performed to establish if the coefficients indicating migration
significantly differ from each. The formula for this statistic is written as:
(𝑏𝑀 − 𝑏𝐺)2
[𝑠𝑒 (𝑏𝑀)]2 + [𝑠𝑒 (𝑏𝐺)]2
Where 𝑏𝑀is the coefficient for Moldova and 𝑏𝐺 is the coefficient for Georgia11
. Differences in
the migration coefficients may not always indicate true differences in causal effects, however,
if the two models differ in the degree of residual variation (or unobserved heterogeneity). If
this is the case, the test would report a misleading result, as the differences in the migration
coefficient would be driven by other unobserved correlates that are not included in the model.
To correct for potential deviation in residual variation, ordinal generalized linear models are
used that estimate heterogeneous choice models that allow for heteroskedasticity for the
specified variables (in this case, the country)12
.
The following section describes the results of the multidimensional index. Descriptive
statistics for indicator- and multidimensional well-being are presented first, which test for
group differences both within and between countries. Results of these bivariate analyses are
followed by the results of the multivariate analyses, which assess the effects of migration
when taking into account other variables that can help to predict child well-being.
VI. Results
Table 4 below provides an overview of well-being rates achieved by children in each study
country for each indicator and on the total multidimensional well-being index. In Moldova,
achieved rates of well-being ranged from 73 percent in the domain of housing well-being to
96.2 percent within the protection domain. On the total index level, 84.3 percent of children
can be considered well, which reflects the overall high level of child well-being across the six
dimensions.
11
From Allison (1999). 12
For more information on these tests, see Williams (2009) and Allison (1999).

Table 4: Domain and multidimensional well-being rates
Source: Authors’ calculations. Note: *** p<0.01; ** p<0.05; * p<0.1 significance levels based on chi2 test of independence
13
T-tests were calculated to assess whether total domain well-being were significantly different between countries.
MOLDOVA Education Health Housing Protection Communication Emotional MWI
N % N % N % N % N % N % N %
Migrant 681 89.2 735 82.6 735 72.9 684 97.2 735 87.4 604 93.3 565 84.2
Non migrant 1136 92.2 1206 80.9 1206 73.4 1113 95.8 1206 85.9 1002 93.5 944 84.3
Total 1817 91.3 1941 81.5 1941 73.2 1797 96.2 1941 86.4 1606 93.4 1509 84.3
Significance *
GEORGIA
Migrant 1063 94.9 1135 70.3 1135 81.0 967 94.9 1135 96.4 873 94.8 824 90.3
Non migrant 1110 91.5 1164 65.2 1164 74.3 1068 93.9 1164 91.5 933 94.6 897 82.1
Total 2173 92 2299 66 2299 75.4 2035 94 2299 92.3 1806 94.6 1721 83.4
Significance ** ** *** *** ***
Differences
between
countries in each
domain13
*** *** ***
Children in Georgia expressed a similar level of overall well-being, with over 83 percent
considered well on the total index level. Children in Georgia achieved the worst outcomes in
the domain of physical health, with only 66 percent considered well, and the best outcomes in
the domain of emotional well-being, where 94.6 percent were considered well. Children living
in migrant and non-migrant households did not achieve significantly-different well-being
outcomes in most dimensions. In Moldova significant differences between children of
different household types can be observed only in the dimension of education, where children
in migrant households achieved lower well-being rates. Compared to their peers in non-
migrant households, children in Georgia who lived in migrant households were better off in
the single dimensions of education, health, housing, and communication, as well as in the
overall multidimensional index.
Based on the bivariate analysis, migration appears to be an important factor in shaping the
well-being outcomes of children in Georgia more so than in Moldova. Two potential
explanations can be given for this difference. The first that more households in Georgia than
in Moldova receive remittances, which are one of the easiest-to-identify ways in which
migrants contribute to household well-being. Increased household income coupled with the
transmission of knowledge from a migrant abroad have been linked to better nutrition,
increased access to consumption items (e.g., food, housing rental, clothing), and increased
human capital investment through education (UNDP, 2009). Given differences in migrant
selectivity between the two countries, it could also be suggested that the relatively higher
level of education of Georgian migrants as well as the lower rate of parental migration may
lead to more positive impacts of migration on child well-being.
Significant differences in child well-being outcomes between Moldova and Georgia could be
seen in the domains of physical health, protection, and communication. Children in Georgia
appeared to attain higher levels of wellness in the domain of communication, whereas
children in Moldova appeared to attain better outcomes in the domains of physical health and
protection.
To determine the extent to which the migration of a household member is correlated with
child well-being when accounting for other relevant covariates, multivariate analysis utilising
probit models were specified. In addition to the migration status of the household, other
explanatory variables were included that may partially explain indicator well-being outcomes.
These include personal characteristics of the child such as age, sex, and type of caregiver and
household characteristics like household size, rural/urban locale, number of children, number
of adults, poverty status, and highest level of education attained in the household. Table 5
shows the results of the model. Given the focus of the analysis of the role of migration,
however, the marginal effects and significance levels of other covariates are not displayed
here but can be found in tables 1 and 2 in the annex.
The magnitude and significance of the migration variable changes considerably with the
inclusion of other covariates, but some of the results of the bivariate analysis remain the same.
Based on the multivariate analysis, migration appears to have a more significant effect on the
well-being of children in Georgia than in Moldova. Children in migrant households in

Georgia have higher probabilities of being considered well in the domains of physical health,
housing, communication, and on total index level than do children in non-migrant households.
In Moldova, in contrast, migration does not appear to correspond to any differing well-being
outcomes. Significant differences between countries can be observed in the dimensions of
health, communication, and total multidimensional index; in all three cases, migration in
Georgia is positively correlated with well-being, whereas in Moldova the migration
coefficients are not significant.
Table 5: Marginal effect of migration status as a determinant of well-being
Model
Dimension Moldova Georgia Testa
Education 0.00
(0.02)
-0.01
(0.02)
Health -0.03
(0.03)
0.11*
(0.04) **
Housing 0.04
(0.03)
0.07+
(0.04)
Communication 0.04
(0.02)
0.08*
(0.03) *
Emotional -0.02
(0.03)
-0.01
(0.02)
Protection 0.02
(0.02)
0.01
(0.02)
MWI
0.05
(0.03)
0.12**
(0.04) *
Nº
Observations 1499 1715
Source: Authors’ calculations. Reported results are average marginal effects (dx/dy) for children
living in migrant households. Robust standard errors in parentheses; +p<0.1; * p<0.05; ** p<0.01.
Full model in appendix. aDifferences between countries in the migration coefficient are significant at a
+10% level, *5% level, and **1%level based on Wald chi square test (corrected for unequal residual
variation or unobserved heterogeneity).
Beyond household migration status, variables like household educational attainment,
household living area, and child age are important determinants of child well-being in both
Moldova and Georgia. Who the caregiver is appears to be significant in the dimensions of
protection and communication in both countries, and in housing in the case of Georgia. In
both countries, having a non-parent relative as a caregiver (as compared to a mother)
increases the likelihood of being well-off in protection and decreases it in the dimension of
communication. In Moldova, children with a father caregiver are more likely to be well-off in
the dimension of communication, while in Georgia having a non-parent caregiver decreases
the likelihood of being well-off in the dimension of housing. In Moldova female children have
a higher probability than male children of being well in the protection domain, and girls in
both countries have higher probabilities of achieving emotional well-being than boys. The
number of siblings is also important in Moldova for determining well-being, as a higher
number of co-resident children corresponds to decreased chances of attaining housing,

protection, and educational well-being. In Georgia, this variable is negatively correlated to
housing well-being and positively correlated to physical health, although only at a 10 percent
significance level.
The extent to which migration is related to child well-being not only depends on whether
there is a migrant in the household but also on who migrates and who adopts the role of the
caregiver in the household. Given the importance of the gender and role of an absent migrant
in the household, additional probit models were specified for migrant households in which
child well-being outcomes were compared according to different migrant/caregiver
combinations. The following five combinations were defined: father abroad/mother caregiver
(reference category); mother abroad/father caregiver; father abroad/grandparent caregiver;
mother abroad/grandparent caregiver; other abroad/mother caregiver, and; all other
combinations. The results of this extended analysis revealed some significant differences in
child well-being outcomes according to specific migrant and caregiver constellations. In both
countries, children with a non-parent relative abroad and who were cared for by a mother had
lower probabilities of being well in the domains of education and protection than children
with a father abroad and who were cared for by a mother. In Moldova, children who were
cared for by a father given a mother’s migration also had lower probabilities of being
considered well in the protection domain than children with a mother caregiver and father
migrant. In both countries, children with a mother abroad and a father caregiver also had
lower probabilities of being well in the housing dimension. Finally, having a mother abroad
and a grandparent caregiver was positively related with multidimensional well-being, but only
in Moldova.
VII .Conclusions
Despite active discussions on the potential benefits or costs of migration, particularly for
children ‘left behind’, the current study has found limited differences in the well-being
outcomes of children living in migrant households when compared to children in non-migrant
households. Based on bivariate analysis, household migration status appeared to influence
child well-being in Moldova in only one dimension, education, with children in migrant
households found to achieve slightly lower rates of well-being than children in non-migrant
households. This relationship disappeared once additional confounding variables were
included in the multivariate probit model, however, which suggests that the result was driven
by other factors, such as the highest level of education in the household or caregiver type. In
Georgia, bivariate analysis found that children in migrant households had higher rates of well-
being than children in non-migrant households in the domains of education, physical health,
housing, communication, and the total multidimensional well-being index level. In the
multivariate analysis, migration status was no longer found to influence education but was
still found to increase the likelihood of a child attaining well-being in the other domains.
Two important observations should be made about these outcomes. The first is that if
migration is found to have any statistically significant effect on child well-being, it is

generally positive and relatively low in magnitude: in the extended multivariate probit model,
children in migrant households were found to have higher probabilities of attaining well-being
in the significant dimensions by between eight and 12 percentage points. The second
observation is that migration appears to behave as a very different factor that shapes child
well-being outcomes in Moldova and Georgia. While migration was seen to have limited
effect on the well-being of children in Moldova, it seemed to bear more consequences for
children in Georgia. Given the very different migration trajectories, mobility patterns, and
levels of maturity of both migration streams, this is an unsurprising conclusion. What is
surprising, however, is the limited role of migration in Moldova, where a great deal of
research has focused on the dire consequences of migration for the ‘left behind’.

VII . References
Acosta, P., P. Fajnzylber, and J.H. Lopez (2007). “The Impact of Remittances on Poverty and
Human Capital: Evidence from Latin American Household Surveys.” World Bank Policy
Research Working Paper 4247.
Alkire, S. (2002).“Dimensions of Human Development”. World Development 30(2): 181-205.
Alkire, S. & J. Foster (2011). “Counting and Multidimensional Poverty
Measurement.”Journal of Public Economics 95: 476-497.
Allison, Paul D (1999) “Comparing logit and probit coefficients across groups”. Sociological
Methods & Research 28 (2):186-208.
Ben-Arieh, A. (2000). “Beyond Welfare: Measuring and Monitoring the State of Children—
New Trends and Domains.” Social Indicator’s Research 52: 235-257.
Bradshaw, J., P. Hoelscher, and D. Richardson (2007).“An Index of Child Well-Being in the
European Union.” Social Indicators Research 80: 133-177.
Brooks-Gunn, J., and G. Duncan (1997).“The Effects of Poverty on Children.” The Future of
Children, 7(2): 55-71.
Caucasus Research Resource Centres (CRRC) Georgia, 2007. “Migration and Return in
Georgia: Trends, Assessments, and Potential”. Project reported submitted to the Danish
Refugee Council within the project “Toward Durable Reintegration Mechanisms in Georgia.”
Centre of Sociological, Politological, and Psychological Analysis and Investigations (CIVIS)
and International Agency for Source Country Information (IASCI) (2010). “Strengthening the
Link Between Migration and Development in Moldova.” Report prepared for the World Bank
within the Migration and Remittance Peer-Assisted Learning Network (MIRPAL) initiative.
Cortés, R. (2007). “Children and Women Left Behind in Labour-Sending Countries: An
Appraisal of Social Risks.” United Nations Children’s Fund Working Paper. United Nations:
New York.
Edillon, R.G. (2008). “The Effects of Parent’s Migration on the Rights of Children Left
Behind.”Asia Pacific Policy Center working paper.United Nations Children’s Fund.
(de la) Garza, R. (2010). “Migration, Development, and Children Left Behind: A
Multidimensional Approach.” UNICEF Social and Economic Policy Working Paper. United
Nations Children’s Fund, Division of Policy and Practice: New York.
Giannelli, G.C. and Mangiavacchi, L. (2010). “Children’s Schooling and Parental Migration:
Empirical Evidence of the ‘Left Behind’ Generation in Albania.” Institute for the Study of
Labour Discussion Paper No. 4888.

(van de) Glind, H. (2010). “Migration and Child Labour: Exploring Child Migrant
Vulnerabilities and Those of Children Left Behind.” International Labour Organisation:
International Labour Office, International Programme on the Elimination of Child Labour
(IPEC) working paper. ILO: Geneva.
Gordon, D., S. Nandy, C. Pantazis, S. Pemberton, and P. Townsend (2003).Child Poverty in
the Developing World. The Policy Press: Bristol.
Graham, E. and L.P. Jordan (2011).“Migrant Parents and the Psychological Well-Being of
Left-Behind Children in Southeast Asia.” Journal of Marriage and Family 73: 763-787.
Hildebrandt, N., D.J. McKenzie, G. Esquivel, and E. Schargrodsky (2005).“The Effects of
Migration on Child Health in Mexico.”Economía 6(1): 257-289.
Hofmann, E.T. and C.J. Buckley (2011).“Cultural Responses to Changing Gender Patterns of
Migration in Georgia.” International Migration 50(5): 77-94.
International Monetary Fund (2006).“Republic of Moldova: Poverty Reduction Strategy
Annual Evaluation Report 2005.” IMF Country Report No. 06/185. IMF: Washington, D.C.
International Organisation for Migration (IOM), 2009. “Testing New Channels and Products
to Maximise the Development Impact of Remittances for the Rural Poor in Georgia: Tianeti
Household Census 2008 &Tianeti Emigrants to Greece 2008 Fieldwork Report”. IOM:
Georgia.
Kandel, W. (2003).“The Impact of U.S. Migration on Mexican Children’s Educational
Attainment.” In M. Cosio, R. Marcoux, M. Pilon, and A.Quesnel (eds.), Education, Family
and Population Dynamics. Paris: CICRED.
Kandel, W. and G. Kao (2001).“The Impact of Temporary Labor Migration on Mexican
Children’s Educational Aspirations and Performance.” International Migration Review 35(4):
1205-1231.
Land, K.C., V.L. Lamb, and S.K. Mustillo (2001). “Child and Youth Well-Being in the
United States, 1975-1998: Some Findings from a New Index.” Social Indicators Research
56(3): 241-320.
Levitt, P. (1998). “Social Remittances: Migration Driven Local-Level Forms of Cultural
Diffusion.” International Migration Review 32(4): 926-948.
Massey, D.S., J. Arango, G. Hugo, A. Kouaouci, A. Pellegrino, and J.E. Taylor (1993).
“Theories of International Migration: A Review and Appraisal.” Population and Development
Review 19 (3): 431-466.
Mansuri, G. (2006). “Migration, School Attainment, and Child Labor: Evidence from Rural
Pakistan.” World Bank Policy Research Working Paper No. 3945.

McKenzie, D.J. (2007). Beyond Remittances: The Effects of Migration on Mexican
Households, in Ç. Özden and M. Schiff (eds.), International Migration, Remittances, and the
Brain Drain. Palgrave Macmillan: New York.
Minujin, A., E. Delamonica, A. Davidziuk, and E. Gonzalez (2006). “The Definition of Child
Poverty: a Discussion of Concepts and Measurements.” Environment and Urbanisation 18(2):
481-500.
Moran-Taylor, M.J. (2008).“When Mothers and Fathers Migrate North: Caretakers, Children,
and Child Rearing in Guatemala.” Latin American Perspectives 35: 79-95.
(de) Neubourg, C., J. Chai, M. de Milliano, I. Plavgo, and Z. Wei (2012).“Step-by-Step
Guidelines to the Multiple Overlapping Deprivation Analysis (MODA)”. United Nations
Children’s Fund, Office of Research working paper WP-2012-10.
Pantiru, M.C., R. Black, and R. Sabates-Wheeler (2007).“Migration and Poverty Reduction in
Moldova.”University of Sussex, Development Research Centre on Migration, Globalisation,
and Poverty Working Paper C10.
Robeyns, I. (2005). “The Capability Approach: A Theoretical Survey.” Journal of Human
Development and Capabilities 6(1): 93-117.
Roelen, K., and F. Gassmann (2009). “Equal Opportunities for All Children in Vietnam:
Assessing the Distribution of Child Poverty from a Monetary and Multidimensional
Perspective”. Journal of Income Distribution 18(3-4): 206-231.
Roelen, K., F. Gassmann, and C. de Neubourg (2009). “The Importance of Choice and
Definition for the Measurement of Child Poverty—the Case of Vietnam.” Child Indicators
Research 2: 245-263.
Salah, M.A. (2008). “The Impacts of Migration on Children in Moldova.” United Nations
Children’s Fund Working Paper. United Nations Children’s Fund, Division of Policy and
Practise: New York.
Stark, O. and D.E. Bloom (1985).“The New Economics of Labour Migration.” American
Economic Review 75: 173-178.
Taylor, J.E. (1999). “The New Economics of Labour Migration and the Role of Remittances
in the Migration Process.” International Migration 37(1): 63-88.
United Nations (1998). “Recommendation on statistics of international migration:
Revision 1.” Statistical Papers Series M, no. 58, rev. 1. Department of Economic
and Social Affairs, Statistics Division. UN: New York.
United Nation Children’s Fund (UNICEF) (2009).The State of the World’s Children, Special
Edition: Celebrating 20 Years of the Convention on the Rights of the Child.
United Nations Development Program (UNDP) (2009). Human Development Report 2009:
Overcoming Barriers - Human Mobility and Development. United Nations Press: Tokyo.
Waddington, H. (2004). “Linking Economic Policy to Childhood Poverty: a Review of the
Evidence on Growth, Trade Reform and Macroeconomic Policy.” CHIP Report No. 7. CHIP.
Williams, Richard (2009) “Using heterogeneous choice models to compare logit and probit
coefficients across groups”. Sociological Methods & Research 37 (4):531-559
White, H., J. Leavy, and A. Masters (2003). “Comparative Perspectives on Child Poverty: A
Review of Poverty Measures.” Journal of Human Development 4(3): 379-396.
World Bank (2010). Migration and Remittances Factbook 2011.World Bank: Washington,
D.C..
Yang, D. (2008). “International Migration, Remittances and Household Investment: Evidence
from Philippine Migrants’ Exchange Rate Shocks.” The Economic Journal 118: 591-630.

VIII .Appendix
Table 1: Determinants of dimension well-being in Georgia. Full model
Education Health Housing Communication Emotional Protection
Migrant household -0.01
(0.02)
0.10*
(0.04)
0.07+
(0.04)
0.08*
(0.03)
-0.01
(0.02)
0.00
(0.02)
Male -0.02 -0.02 -0.02 -0.01 -0.04**
-0.01
(0.01) (0.03) (0.02) (0.01) (0.01) (0.01)
Caregiver (ref category: mother)
Father 0.00 -0.09 -0.03 0.06 -0.02 -0.00
(0.05) (0.06) (0.06) (0.04) (0.03) (0.04)
Other relative 0.03 -0.07 -0.09* -0.05* -0.01 0.06*
(0.03) (0.04) (0.04) (0.02) (0.02) (0.03)
Age 0.13** 0.02 0.00 -0.03* -0.02 -0.01
(0.01) (0.02) (0.02) (0.01) (0.01) (0.01)
Age2 -0.01** -0.00 -0.00 0.00* 0.00 0.00
(0.00) (0.00) (0.00) (0.00) (0.00) (0.00)
Urban -0.00 -
0.11**
0.22**
0.07** -0.00 -0.02
(0.02) (0.03) (0.02) (0.02) (0.01) (0.01)
Highest level of education in the household (ref category: higher education)
upper secondary -0.05 -
0.38**
-0.07 -0.11** -0.13**
-0.08*
(0.04) (0.08) (0.08) (0.04) (0.03) (0.03)
post secondary -0.05** 0.03 -0.04 -0.05** 0.01 -0.03+
(0.02) (0.04) (0.03) (0.02) (0.02) (0.02)
Nº siblings 0.01 0.03+ -0.04* 0.00 0.00 0.01
(0.01) (0.02) (0.02) (0.01) (0.01) (0.01)
Nº adults 0.00 0.02* -0.01 0.01 0.01+ 0.00
(0.00) (0.01) (0.01) (0.01) (0.00) (0.01)
Migrant*remittances 0.03 0.03 0.02 -0.03 0.02 -0.01
(0.03) (0.05) (0.04) (0.03) (0.02) (0.02)
Poverty Status 0.02 -0.01 -0.02 -0.03* -0.03 -0.02
(0.01) (0.03) (0.03) (0.02) (0.02) (0.02)
Observations 1705 1705 1705 1705 1705 1705
F stat 6.5 6.2 9.7 6.3 3.0 4.6
Prob>F 0.00 0.00 0.00 0.00 0.00 0.00
Source: authors’ calculations. Robust standard errors in italics; +p<0.1; * p<0.05; **
p<0.01.

Table 2: Determinants of dimension well-being in Moldova. Full model
Educatio
n
Health Housin
g
Communicatio
n
Emotiona
l
Protectio
n
Migrant household 0.00
(0.02)
-0.03
(0.03)
0.04
(0.03)
0.04
(0.02)
-0.02
(0.02)
0.02
(0.02)
Male -0.00 -0.02 0.01 0.01 -0.03+ -0.03**
(0.01) (0.02) (0.02) (0.02) (0.01) (0.01)
Caregiver (ref category: mother)
Father -0.04 -0.02 -0.04 0.05+ -0.01 -0.01
(0.03) (0.03) (0.04) (0.03) (0.03) (0.02)
Other relative 0.01 -0.04 0.06+ -0.05+ 0.01 0.04*
(0.02) (0.03) (0.03) (0.03) (0.02) (0.02)
Age 0.09** 0.06*
*
0.03+ 0.01 -0.01 -0.03**
(0.01) (0.02) (0.02) (0.01) (0.01) (0.01)
Age2 -0.00** -
0.00*
*
-0.00 -0.00 0.00 0.00**
(0.00) (0.00) (0.00) (0.00) (0.00) (0.00)
Urban -0.01 -
0.08*
*
0.32**
0.22** 0.00 0.04*
(0.03) (0.03) (0.04) (0.04) (0.02) (0.02)
Highest level of education in the household (ref category: higher education)
lower secondary -0.04+ -0.05+ -0.17**
-0.19** -0.02 -0.04**
(0.02) (0.03) (0.03) (0.03) (0.02) (0.01)
upper secondary -0.02 -0.02 -0.07+ -0.11** -0.02 0.04
(0.02) (0.03) (0.04) (0.03) (0.02) (0.02)
post secondary -0.03 -0.02 -0.05 -0.11** 0.00 0.01
(0.02) (0.03) (0.03) (0.03) (0.02) (0.01)
Nº siblings -0.02* -0.01 -0.03* -0.00 -0.01 -0.01+
(0.01) (0.01) (0.01) (0.01) (0.01) (0.01)
Nº adults -0.01+ 0.00 -0.02+ 0.00 -0.01 -0.00
(0.01) (0.01) (0.01) (0.01) (0.01) (0.00)
Migrant*remittance
s
-0.03 0.03 -0.00 0.03 0.05* -0.03
(0.02) (0.03) (0.03) (0.03) (0.02) (0.02)
poverty status -0.02 0.01 -0.04 -0.06** -0.01 0.01
(0.01) (0.02) (0.03) (0.02) (0.02) (0.01)
Observations 1499 1499 1499 1499 1499 1499
F stat 9.0 2.9 8.2 10.6 1.4 5.8
Prob>F 0.00 0.00 0.00 0.00 0.15 0.00
Source: authors’ calculations. Robust standard errors in italics; + p<0.1; * p<0.05; **
p<0.01.

Table 3: Determinants of multidimensional well-being
MWI Moldova MWI Georgia
Migrant household 0.05 0.12**
(0.03) (0.04)
Male -0.04+ -0.03
(0.02) (0.02)
Caregiver (ref category: mother)
Father 0.03 -0.04
(0.04) (0.05)
Grandparent -0.02 -0.07+
(0.04) (0.04)
Age 0.07** 0.05*
(0.02) (0.02)
Age squared -0.00** -0.00+
(0.00) (0.00)
Urban 0.06 -0.01
(0.04) (0.02)
Education (ref category: higher education)
Lower secondary -0.16**
(0.03)
Upper secondary -0.05 -0.29**
(0.04) (0.06)
Post secondary -0.06+ -0.05+
(0.03) (0.03)
Number of siblings -0.04** 0.01
(0.01) (0.02)
Number of adult hh
members
0.00 0.03**
(0.01) (0.01)
Poor -0.26** -0.29**
(0.02) (0.02)
Migrant*remittances -0.02 -0.04
(0.03) (0.04)
Observations 1499 1705
F-stat 13.4 6.9
Prob>F 0.00 0.00
Source: authors’ calculations. Robust standard errors in italics; + p<0.1; * p<0.05; **
p<0.01.

1
Does it Matter Where the Children Are? The Well-Being of the Elderly ‘Left
Behind’ by Migrant Children in Moldova
Jennifer Waidler1, Michaella Vanore, Franziska Gassmann, Melissa Siegel
Maastricht Graduate School of Governance/UNU-MERIT, Maastricht University
Abstract
This paper empirically evaluates the well-being of elderly individuals “left behind” by their adult
migrant children in Moldova. Using data from a nationally-representative household survey
conducted in 2011/2012 in Moldova, the well-being outcomes of elderly individuals aged 60 and
older with and without adult children living abroad are compared (n=1,322). A multidimensional
well-being index is constructed on the basis of seven indicators within four dimensions of well-
being: physical health, material living standards, social well-being, and emotional well-being.
Probit regressions are used to predict the probability of an elderly individual being considered
well in each indicator and then on total index level. The results reveal that elderly persons with an
adult migrant child have a higher probability of being well in one physical health indicator.
Following correction for the selectivity of migration using an instrumental variable approach,
however, the migration of an adult child is no longer found to significantly predict the well-being
of their elderly parents in any dimension, suggesting that migration bears limited consequences
for elderly well-being.
Key words: migration; elderly; well-being; multi-dimensional well-being; Moldova
1Corresponding author. Maastricht University, Maastricht Graduate School of Governance. PO Box 616, 6200MD
Maastricht; the Netherlands. Email: [email protected]. Phone: +31 (0)43 388 4485.

2
Introduction
Over the past decades, simultaneous demographic, social, and economic transitions have incited
growing research on how patterns of resource transfers between adult children and their aging
parents have changed (Agree, Biddlecom, & Valente, 1999; Frankenberg, Lillard, & Willis,
2004). One such transition that gerontology research has progressively addressed is the
increasing spatial dispersion of kin through internal and international migration, yet the issue of
transnational care—caregiving across political and geographical spaces—has remained under-
addressed in much literature on aging and intergenerational care (Baldassar, 2007; Zechner,
2008). More limited still is research on the intersection among caregiving, international
migration, and elderly well-being.
Despite the acknowledgement that the family provides an essential source of old-age support,
research on the relationship between the migration of adult children and elderly well-being
outcomes is scarce (Frankenberg, Lillard, & Willis, 2004). Much literature on migration and
elderly well-being has explored how long-distance eldercare is practised (Baldassar & Baldock,
2000; Baldassar, 2007; Zechner, 2008) rather than on how such transnational family
arrangements influence the well-being of elderly individuals “left behind”. There are several
notable exceptions: King and Vullnetari (2006), writing in Albania, and Grant, Falkingham, and
Evandrou (2009), writing in Moldova, for instance, have explored the emotional well-being of
elderly individuals following the migration of adult children through qualitative narratives.
Antman (2010), working in Mexico, has used quantitative methods to model the impacts of child
migration on the physical health of their elderly parents. These contributions have added essential
evidence to the study of elderly well-being in transnational family contexts, but they reveal a
marked absence of research on the links between adult child migration and elderly well-being as
a holistic concept.
This article builds on this past research by assessing the impact of adult child migration on the
multidimensional well-being of elderly parents “left behind” in Moldova. Moldova provides an
excellent case study through which migration and elderly well-being can be studied given the
sheer scale of the emigration from the country coupled with limited availability of public- and
market-based eldercare. Since the late 1990s, Moldova has experienced persistent, large-scale
emigration. By 2010, it was estimated that 21.5 percent of the population resided abroad (Ratha,
Mohapatra, & Silwal, 2011). Men constituted both greater stocks of emigrants abroad and the
largest share of flows (estimated at 63.7 percent of all outgoing migrants in 2010), but women
have increasingly entered international migration and outnumber men among migrants destined
for European Union countries such as Italy (IOM, 2012). The growing pace of female emigration
has raised concerns over eldercare, as the family—chiefly female kin—often provides both
regular and instrumental care to elderly individuals given the absence of appropriate institutional
structures to support the aging population (Grant, Falkingham, & Evandrou, 2009).
Using data derived from a nationally-representative household survey conducted across all
regions of Moldova (except Transnistria) in 2011/2012, this paper empirically evaluates how the
migration of an adult child impacts different dimensions of elderly well-being using a
multidimensional well-being index. In evaluating the relationship between adult child migration
and different indicators and dimensions of elderly well-being, the analysis reveals that the

3
physical absence of an adult child rarely corresponds to significantly worse elderly well-being
outcomes—and that the physical distance between an aging individual and potential sources of
care does not affect all aspects of well-being equally.
Conceptualisation of elderly well-being
Central to this research is understanding what “well-being” actually entails. A significant volume
of gerontology research has addressed the concept of quality of life (QOL) (see Dijkers, 2007 for
a discussion of the use of the term); in recognizing that quality of life is strongly linked to inner
perceptions about expectations and achievements, and thus difficult to capture in quantitative
assessments using standardized measurement tools, the term well-being is preferred here.
The concept of well-being—or its counter term, deprivation—provides many conceptual
advantages in understanding wellness in later life, particularly when connected to conceptual
frameworks such as the capabilities approach. Formulated as an alternative to uni-dimensional,
utilization-maximising approaches to deprivation or poverty, the capabilities approach regards
deprivation as a multifaceted dilemma resulting from an individual’s limited “capabilities” to
achieve a desired end. Rather than emphasising end “functionings”, such as being materially
well-off, for instance, the capabilities approach views the capabilities an individual has to achieve
that end—such as access to employment—as essential for cultivating well-being (Sen, 1993;
Robeyns, 2005). Well-being is inherently multidimensional in this approach, as an individual’s
sense of worth and fulfilment spans many domains of life. Deprivation in any number of
dimensions can thus result in the failure of an individual to achieve well-being (Alkire, 2002;
Sen, 1993; Robeyns, 2005; Alkire and Foster, 2011).
A concept of multidimensional well-being based on the capabilities approach recognises that
well-being is inherently tied to an individual’s stage in the lifecycle and corresponding changes to
the set of capabilities available to them. The conceptual advantages are offset by a practical
limitation of the capabilities approach, however: it does not define the components of well-being.
The literature on elderly QOL, particularly in healthcare and geriatric treatment settings, can
provide better guidance. Within the QOL literature, well-being in older age has been described as
spanning several dimensions, including physical health; mobility; social connectedness and the
ability to maintain meaningful relationships; emotional well-being, including life satisfaction and
self-esteem, and; material security, including housing and economic stability (see e.g. George and
Bearon, 1980; Fillenbaum, 1984; Farquhar, 1995; Cummins, 1996, 1999; Brown et al. 2004;
Dijkers, 2007). The literature has highlighted that these dimensions are overlapping, with
interdependencies among dimensions of well-being growing closer as an individual ages. For
instance, essential functions like maintaining independence—the ability to perform self-care tasks
such as eating and using the toilet (Fillenbaum, 1984)—have direct impacts on the ability to
maintain wellness in other domains. Deteriorating physical health, which can be associated with a
decline in the capacity to engage in social life and in relationships, can correspond to decreased
emotional well-being (Ward, Barnes and Gahagan, 2012).
The interconnectedness among functionings has given rise to the concept of functional wellness,
within which researchers and caregivers have identified five basic dimensions of elderly

4
wellbeing: activities of daily living and associated necessary standards of mobility, mental health,
physical health, and social and economic functioning (Fillenbaum, 1984). These domains have
been used in several instruments for measuring elderly well-being and poverty, including the
Gallup-Healthways Well-Being Index (Coughlin, 2010) and the elderly well-being index
developed by the Stanford Center on Longevity (Kanoda, Lee, and Pollard, 2011).
Based on the concept of multidimensional well-being derived from the capabilities approach and
the domains of well-being identified in QOL literature, the definition of elderly well-being used
here is the following:
Well-being is a multidimensional state of personal being comprised of both self-
assessed (subjective) and externally-assessed (objective) positive outcomes across four
realms of opportunity: physical health, emotional health, material living standards, and
social well-being.
This definition recognises that there are a multitude of factors within an individual’s life that
contribute to the achievement of well-being. These elements are seldom context independent and
static, changing not only with age but as the result of other complex processes. Migration is one
such process that alters the context in which individuals function, but its effects are not universal
and homogenous.
Migration and elderly well-being
The achievement of multidimensional well-being and the availability of resources and care,
particularly that provided by the family, are deeply connected. Even in countries with market or
public provision of care for aging individuals, adult children can provide important sources of
support to their aging parents, including social or emotional support, financial assistance, and
practical, hands-on assistance (Kalmijn & Saraceno, 2008). Physical proximity is not a
precondition for intergenerational support exchanges, but transnational care may imply different
types of support and different means of its provision. As noted by Baldassar, Baldock, and
Wilding (2007), transnational caregiving can and does occur, but it is subject to different
constraints than care provided locally or translocally (i.e., within the same country but at a
distance). Challenges include not only physical distance but also legal regimes that affect
possibilities for physical visits, the availability of telecommunication services that facilitate
exchange, and differences in health care infrastructures between countries of origin and
residence, among other factors (Baldassar, Baldock, and Wilding, 2007). Given these unique
features, individuals providing care transnationally may provide less direct support, such as
physical assistance, and instead provide emotional support or may organise and prioritise the care
needs to be met by someone in closer physical proximity to the recipient (Zechner, 2008).
The international migration of an adult child, and the change in care such migration may imply,
could affect the well-being outcomes among elderly kin left behind in both positive and negative
ways. Kanaiaupuni (2000), for instance, found that the international migration of adult children
from Mexico corresponded to disruptions in traditional living arrangements, increasing the
number of older individuals residing independently. The shift away from multigenerational

5
households to independent living could involve a trade-off of resources for the elderly parents of
migrants: remittances received from a child abroad could increase the financial resources
available to a parent, enabling greater expenditure on medicines and other health inputs, the
physical absence of a child could imply decreased support for routine physical activities
(Kanaiaupuni, 2000). Another study in Mexico by Antman (2010) found that the migration of
adult children corresponded to distinctly negative physical health outcomes for their aging
parents. Among the sample of elderly individuals included in the study, those with migrant
children reported higher levels of physical and emotional health deterioration and were more
likely to have suffered from heart attack or stroke since the migration of a child. Antman
cautioned that the link between reduced physical health and the migration of a child should be
more robustly tested and confirmed, but the preliminary evidence suggests a relationship between
the absence of a child through migration and reduced physical well-being.
Other research has addressed the potential consequences of a child’s migration for the social and
emotional well-being of their parents. In interviews conducted among older parents with migrant
children in Albania, King and Vullnetari (2006) found that while migrant children still provided
many forms of support to their aging parents—including financial assistance, emotional support
through telephone calls, and physical assistance during return visits—older parents experienced
losses in “the anticipated privileges and roles of old age, above all those of grand-parenting and
those that require physical proximity.” (King & Vullnetari, 2006; pp 808). The inability to
participate in family life in older age contributed to feelings of social isolation and loss of self-
respect among those parents with children and grandchildren living abroad. Similar sentiments
were documented in a study conducted among older individuals in Moldova with children living
abroad (Grant, Falkingham, & Evandrou, 2009), with some interview respondents speaking of
feelings of loss and grief regarding the absence of their children, particularly those residing
abroad illegally who would be unable to return to Moldova to attend to their parents on their
deathbeds. In contrast, a quantitative analysis of the relationship between adult child migration
and the physical and emotional health of elderly parents in Moldova found that the migration of a
child did not significantly affect the mental and cognitive health of elderly parents but did
correspond to higher body weight, consumption of a more diverse diet, a greater share of time
spent sleeping and on leisure activities, and a decrease in time spent on subsistence farming
(Böhme, Persian, and Stöhr, 2013). Other positive findings have been reported in Thailand,
where Abas et al (2009) found in an analysis of survey data that older individuals with children
living abroad had lower reported rates of depression—a result that the authors caution may reflect
a selection effect, in that migrants are more likely to come from households that have better pre-
existing socio-economic conditions, factors that independently support better mental health in old
age.
These studies have added vital insight into how the migration of a child and the well-being of
older parents left behind may be connected; in doing so, they reveal how diverse the impacts of a
child’s migration may be for different aspects of well-being. Based on the concept of
transnational care and past studies on the impacts of migration on the well-being of older parents,
this study proposes the following hypotheses: 1) a child’s migration will not correspond to
universally positive or negative well-being outcomes among elderly parents, with 2) emotional
and social well-being influenced negatively by the migration of a child and 3) physical health and
material well-being influenced positively by a child’s migration.

6
Data and methodology
Data
The following analyses of the impacts of adult child migration on the multidimensional well-
being of elderly parents remaining in Moldova uses data derived from a nationally-representative
household survey conducted between September 2011 and February 2012. Data were collected
from 3,255 households, of which 1,743 contained at least one elderly person aged 60 or older.
Rather than using the conventional age cut-off of 65 to define an individual as “elderly”, the age
of 60 was deemed more appropriate in the Moldovan context given earlier ages of retirement (62
for men and 57 for women) and lower life expectancies (64 for men and 73 for women). The
survey sample was drawn from the Moldovan Labour Force Survey (LFS) conducted in the
second quarter of 2011 and covered all regions of Moldova except Transnistria. Only households
with one or more elderly household member (aged 60+) or child (aged 0-18) were considered
eligible for completion of the survey, as the project for which this survey was conducted focused
on the impacts of migration on household dependents.
The survey collected information on the demographic features of household members, household
living conditions, members' migration histories, and the experiences and conditions of elderly
household members. To retain elderly individuals as the unit of analysis, information was
collected directly from individuals over the age 60 about work history, time allocation, physical
health and nutrition, mental health, mobility, and relationships with household and non-
household members. The survey sample included 2,278 elderly individuals, of which 1,884 had
children. The analytical sample was restricted to elderly individuals with children and with full
information on essential covariates, resulting in a final sample population of 1,322. Key
demographic information of this population is provided in Table 1.
Table 1: Key demographic characteristics of the elderly population 60-69 years 70 and older Total
# obs % # obs % # obs %
Gender
Male 327 44% 205 36% 532 40%
Female 418 56% 372 65% 790 60%
Household type
Alone 97 13% 167 29% 264 20%
With partner 160 22% 152 26% 312 24%
With other adults 234 31% 138 24% 372 28%
With children 254 34% 120 21% 372 28%
Migration status of children
Migrant child 298 40% 207 36% 505 38%
No migrant child 447 60% 370 64% 817 62%
Region

7
Chisinau 72 10% 39 7% 111 8%
Centre 231 31% 162 28% 393 30%
North 229 31% 207 36% 436 33%
South 213 29% 169 29% 382 29%
Total 745 56% 577 44% 1,322 100%
Source: Authors’ calculations
The sample of elderly individuals was distributed similarly across four types of households, with
the smallest proportion (20 percent) living alone and the largest proportion (28 percent) living in
a household with at least one child below 18 years old or in a house with other adults. The sample
contained a greater proportion of women than men, which increased with age in line with lower
male life expectancy. The elderly population was divided into two groups based on the location
of adult children, with 38 percent of the elderly sample having at least one child abroad at the
time of the survey.
Indicators
To assess the impacts of adult child migration on the multidimensional well-being of elderly
individuals, a well-being index comprised of four dimensions and seven indicators was
constructed. The index method advantageously allows for comparison of well-being outcomes of
elderly individuals with and without children living abroad, which can be disaggregated by aspect
(dimension) of well-being or aggregated to total index level to provide a single measure of well-
being.
The dimensions of well-being included in this index include physical, emotional, social, and
material well-being; the indicators included in each dimension can be seen in Table 2. Indicators
within each dimension were chosen according to several criteria: parsimony, with a minimal
number of indicators chosen to facilitate simplicity in comparison and interpretation;
commonality, with indicators having been used in prior studies of well-being or quality of life,
and; data quality, with indicators with high levels of missing data excluded from analysis.
Table 2:Well-being indicators per dimension PHYSICAL WELL-BEING & INDEPENDENCE
Individual is not under or overweight (BMI)
Individual does not have difficulty self-administering medications
Individual has retained essential mobility functions
MATERIAL WELL-BEING
Individual is living in house with appropriate flooring, electricity, and access to safe water
SOCIAL WELL-BEING
Individual has regular contact with family or friends
EMOTIONAL WELL-BEING
The individual is satisfied with current life
The individual is not depressed

8
Physical well-being is comprised of indicators measuring an individual's weight-for-height, the
body mass index (BMI); an individual's ability to take medication without aid, which is used as a
proxy for functional independence and is correlated with other activities that measure elderly
independence (Kaneda, Lee & Pollard, 2011), and; an individual’s ability to perform activities of
daily living (basic mobility functions) such as bathing, dressing, walking, and going to the
bathroom without assistance. The mobility indicator is a composite measure created through
factor analysis, which was conducted to determine the underlying factors that explain rates of
mobility. This factor analysis included several dummy variables that measured the elderly
individual’s ability to perform essential daily functions, all of which are correlated with each
other.
Material well-being is measured by indicators of housing quality, with housing conditions
considered appropriate when the house has proper flooring (not dirt, clay, or concrete) and when
the household has access to electricity and safe (potable) water.
Social well-being is measured by regular contact with friends in the community. Extensive
literature proposes that a good relationship with people in the community helps improve overall
elderly well-being (Ward, Barnes & Gahagan, 2012; Kaneda, Lee & Pollard, 2011; Fillenbaum,
1984). As some elderly individuals reside with family, which would skew the proportion of
individuals with contact with family, social contact with friends in the community was a
preferred indicator of social contact over contact with family.
Emotional well-being was measured by two subjective indicators: self-reported depression and
current life satisfaction. Questions on depression and life satisfaction were derived from the
mental health inventory (MHI-38), an instrument designed to measure mental health within the
elderly population. In line with MHI-38 scoring thresholds, an individual with a score of 13 or
more on the depression indicator was considered unwell. Life satisfaction was measured using a
ten-point Likert scale, with zero indicating complete dissatisfaction with one’s current life and
ten indicating complete satisfaction. Based on the Cantril Self-Anchoring Striving Scale, a score
of seven or higher indicates that an individual is “thriving” or satisfied with his/her own life.
Methodology
Well-being across different groups of elderly individuals was assessed and compared using this
multidimensional well-being index. First, well-being with respect to each indicator was analysed.
An elderly individual was considered not deprived if s/he met the established well-being
threshold within a given indicator (see Table 3 for an overview of thresholds per indicator).
Indicator well-being rates (IWB) were calculated by counting the number of elderly persons who
met the well-being threshold, expressed as a share of all the elderly (Roelen et al., 2011; Roelen
and Gassmann, 2012):
𝐼𝑊𝐵𝑥 = 1
𝑛∑ 𝐼𝑖𝑥
𝑛
𝑖=1
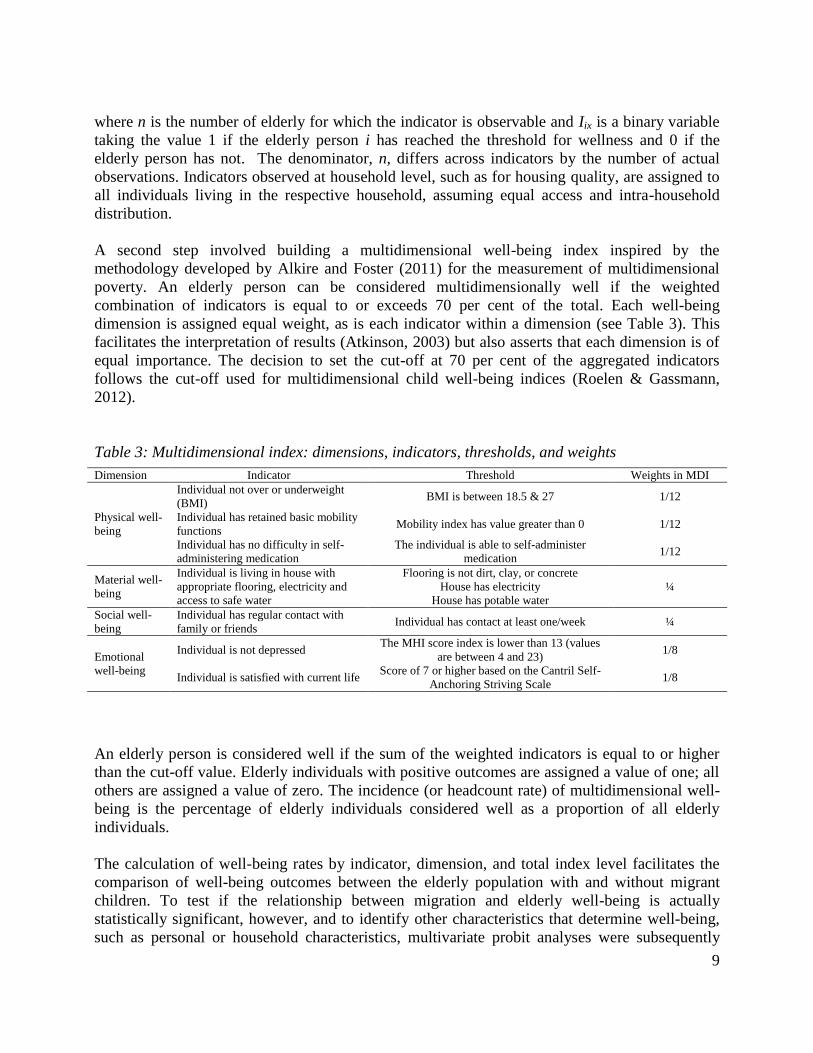
9
where n is the number of elderly for which the indicator is observable and Iix is a binary variable
taking the value 1 if the elderly person i has reached the threshold for wellness and 0 if the
elderly person has not. The denominator, n, differs across indicators by the number of actual
observations. Indicators observed at household level, such as for housing quality, are assigned to
all individuals living in the respective household, assuming equal access and intra-household
distribution.
A second step involved building a multidimensional well-being index inspired by the
methodology developed by Alkire and Foster (2011) for the measurement of multidimensional
poverty. An elderly person can be considered multidimensionally well if the weighted
combination of indicators is equal to or exceeds 70 per cent of the total. Each well-being
dimension is assigned equal weight, as is each indicator within a dimension (see Table 3). This
facilitates the interpretation of results (Atkinson, 2003) but also asserts that each dimension is of
equal importance. The decision to set the cut-off at 70 per cent of the aggregated indicators
follows the cut-off used for multidimensional child well-being indices (Roelen & Gassmann,
2012).
Table 3: Multidimensional index: dimensions, indicators, thresholds, and weights
An elderly person is considered well if the sum of the weighted indicators is equal to or higher
than the cut-off value. Elderly individuals with positive outcomes are assigned a value of one; all
others are assigned a value of zero. The incidence (or headcount rate) of multidimensional well-
being is the percentage of elderly individuals considered well as a proportion of all elderly
individuals.
The calculation of well-being rates by indicator, dimension, and total index level facilitates the
comparison of well-being outcomes between the elderly population with and without migrant
children. To test if the relationship between migration and elderly well-being is actually
statistically significant, however, and to identify other characteristics that determine well-being,
such as personal or household characteristics, multivariate probit analyses were subsequently
Dimension Indicator Threshold Weights in MDI
Physical well-
being
Individual not over or underweight
(BMI) BMI is between 18.5 & 27 1/12
Individual has retained basic mobility
functions Mobility index has value greater than 0 1/12
Individual has no difficulty in self-
administering medication
The individual is able to self-administer
medication 1/12
Material well-
being
Individual is living in house with
appropriate flooring, electricity and
access to safe water
Flooring is not dirt, clay, or concrete
House has electricity
House has potable water
¼
Social well-
being
Individual has regular contact with
family or friends Individual has contact at least one/week ¼
Emotional
well-being
Individual is not depressed The MHI score index is lower than 13 (values
are between 4 and 23) 1/8
Individual is satisfied with current life Score of 7 or higher based on the Cantril Self-
Anchoring Striving Scale 1/8

10
used. As the aim is to assess the causal impact of migration on elderly well-being, potential
endogeneity of migration due to self-selection must also be addressed. Endogeneity occurs when
the variable indicating migration is correlated with other, unobserved variables and that are also
determinants of the dependent variable (elderly well-being). As an example, unobserved family
characteristics, such as past episodes of depression, may influence present elderly well-being but
can also influence the migration propensity among the elderly person’s adult children, with the
health of an elderly parent acting as a determinant of whether or not his/her adult child is able to
migrate.
To solve this identification problem, an instrumental variable approach is used. In order for an
instrument to be valid, two conditions must hold: the instrument must have a clear effect on the
endogenous variable (in this case, migration), and it must be exogenous or uncorrelated with any
other determinant of the dependent variable (elderly well-being). In this instance, such an
exclusion restriction would imply that the instrument is not correlated with the error term and
only affects elderly well-being through migration.
An instrument created by Böhme, Persian, and Stöhr (2013) using the same dataset is used here.
The instrument is based on migrant network-economic growth interactions in destination
countries. Networks are defined as emigrant stocks in destination countries in 2004, and GDP per
capita growth rates in destination countries are calculated between 2004 and 2010. This
instrument assumes that networks are shared at the village level and decrease the cost of
migration while facilitating access to employment abroad (Böhme, Persian, & Stöhr, 2013).
Given economic growth in destination countries, individuals belonging to a network may be more
incentivized to work abroad, but such GDP growth in destination countries is expected to be
uncorrelated with elderly well-being in Moldova except through migration.
The two-stage least squares (2SLS) method of instrumental variable estimation is used. As other
variables are expected to affect both the migration of an adult child and elderly well-being, the
estimation controls for relevant covariates. The instrumental variable estimation is denoted as:
𝑌𝑖 = 𝛼 + 𝛽𝑀ℎ + 𝛾𝑋𝑖 + 𝛿𝐻ℎ + 𝜃𝑉𝑣 + 휀𝑖 (1)
Where 𝑌𝑖 is the outcome variable, the different dimensions of elderly well-being and the
multidimensional well-being index. 𝑀ℎ is the instrumented variable indicating whether the
elderly person has a child abroad, and 𝑋𝑖 indicates characteristics of the elderly person such as
age, sex, or ethnicity. 𝐻ℎ denotes household-level variables, including the highest level of
education in the household, the number of children, their mean age, and the per capita household
level old-age pensions; 𝑉𝑣 indicates urban/rural status as well as the shares of migrants to Russia,
Romania, the Ukraine and Italy in 2004, as controls of the network-growth interaction
instrument.
The indicators and dimensions of elderly well-being are expressed as binary values, either 0
(deprived) or 1 (well). This expression lends itself naturally to binary choice models such as
probit or logit and is less well-suited to models like 2SLS that work with continuous dependent
variables. Binary choice models with endogenous regressors have important drawbacks, however,
as control functions (such as the ivprobit estimation command in the Stata software package), are

11
said to be consistent only when the endogenous regressor is continuous (Dong and Lewbel,
2012). In recognizing that the use of dependent outcome variables in an estimation method
designed for continuous variables may yield inconsistent results, an additional test (2-stage
residual inclusion estimation) was run to check the sensitivity of the results to the estimation
method. Within this method, the residuals from the first-stage regression, which predicts the
likelihood of having a migration experience, are estimated and included as an additional regressor
in the second stage equation, which predicts elderly well-being. As residuals are correlated with
the unobservable characteristics that influence both the endogenous regressor (migration) and the
dependent variable in the second-stage regression (elderly well-being), their inclusion ensures
that the migration coefficient in the second-stage equation only reflects the causal effect of
migration on elderly well-being (Marchetta, 2012). This method is known for producing
consistent estimates in non-linear models (Terza et al. 2008). Results
Elderly well-being rates by indicator can be seen in Table 4 below. In the domain of physical
health, approximately 58 percent of all elderly individuals were of normal weight (not
underweight, overweight, or obese according to BMI). The relatively high share of elderly
persons with a BMI outside of the “normal” score band (defined as a BMI between 18.5 and 27)
may signal that BMI score bandings should be better refined for the elderly Moldovan
population, as the thresholds for “normal” weight apply to the whole adult population and may
not adequately measure body fat percentages in the elderly population. The measure could be
better calibrated to the population under study, but it nevertheless provides an appropriate metric
for comparison of population means. The migration status of children was not significantly
correlated to the attainment of well-being in this indicator.
Table 4: Indicator well-being rates of elderly individuals, by migration status of adult child(ren)
Indicator Total
(%)
Migrant
Child
(%)
No Migrant
Child
(%)
Significance
Level
Individual is not overweight or underweight (BMI) 58.2 (0.01)
55.9
(0.02) 59.6 (0.02)
Individual has retained basic mobility functions 58.0 (0.01)
62.9
(0.02) 55.0 (0.01)
***
Individual has no difficulties self-administering medications 71.8 (0.01)
74.6 (0.02)
70.1 (0.01)
*
Individual lives in appropriate housing (floor, water, electricity) 75.2 (0.01)
74.4 (0.02)
75.7 (0.01)
Individual has contact with friends at least once a week 68.6 (0.01)
71.3 (0.02)
67.0 (0.01)
Individual is not depressed 71.1 (0.01)
71.3 (0.02)
71.0 (0.01)
Individual is well-off in the life satisfaction indicator 48.5 (0.01)
49.6 (0.02)
47.8 (0.02)

12
Individual achieves multidimensional well-being 48.5
(0.01) 49.6
(0.02) 47.8
(0.02)
Source: Authors’ calculations. Standard errors in parentheses. Significance levels * p< 0.1, ** p< 0.05, *** p< 0.01
Over half of the elderly population were able to perform basic functions without difficulty; a
greater share of individuals with migrant children (62.9 percent) than those without (55 percent)
were considered well in this indicator, a statistically-significant difference. Over 70 percent of the
population was considered well in terms of functional independence, measured by the ability to
self-administer medication, with more individuals with a child residing abroad considered well in
this indicator. Housing well-being was the most frequently attained of all indicators, with more
than 75 percent of the elderly population enjoying appropriate housing conditions (i.e., housing
with appropriate flooring, access to electricity, and a safe source of drinking water). Housing
well-being rates did not differ significantly by the migration status of children. Almost 69 percent
of the elderly were not deprived in social well-being. Elderly individuals without a migrant child
had lower social well-being rates than elderly individuals with a child abroad, but these
differences were not significant. Around 30 percent of the total population reported being
depressed, and less than 50 percent of all respondents reported being satisfied with their lives.
Differences in well-being rates of individuals with and without migrant children were not
significant for either of these indicators. On total index level, nearly 49 percent of the elderly
population can be considered multi-dimensionally well, meaning that the weighted sum of the
indicators is equal to or larger than 0.7. Overall well-being rates did not significantly differ by the
migration status of adult children.
The comparison of well-being rates between individuals with and without children living abroad
us useful descriptively, but well-being can be driven by characteristics other than migration.
Multivariate probit models were thus estimated that predicted the relationship between adult child
migration and elderly well-being while controlling for characteristics of the elderly individual,
including sex and age, and characteristics of the household, such as the number children living in
the household and the highest level of education of household members. Table 5 shows the
abbreviated results of these models; only the coefficients associated with adult child migration
are shown for brevity, and the full models are available upon request. The probit estimation
suggests a limited relationship between migration and elderly well-being: the migration of an
adult child corresponded to significantly-different probabilities of an individual attaining well-
being only for the mobility indicator, where individuals with a migrant child had a six-
percentage-point higher probability of being considered well compared to members of their
cohort with no children living abroad. Given the potential endogeneity discussed earlier, the
results of the probit estimation imply correlation rather than causation; to demonstrate the real
impact of adult-child migration on the well-being of the elderly left behind, instrumental variable
regression was then applied.
Table 5: Probit results, relationship between adult child migration & elderly well-being
Housing BMI Mobility Medication Contact
Not
depressed Satisfied MWI
Migrant child -0.02 -0.03 0.06* 0.03 0.03 -0.03 0.01 -0.00

13
Source: Significance levels + p< 0.1, * p< 0.05, ** p< 0.01. Robust standard errors clustered at the village level) in
parentheses. Other control variables omitted for brevity--full models available upon request.
The estimation was performed in two steps: first, the migration of an adult child was estimated
based on the instrument (network-growth interaction variable) and the other exogenous variables
included in the probit estimation. Second, the fitted values of the first regression were used in the
main equation to predict elderly well-being.
The coefficients of the first-stage regression predicting migration had the expected signs: elderly
individuals with ethnic origins other than Moldovan/Romanian (e.g., Russian, Ukrainian,
Gagauzian) had a higher probability of having a child abroad compared to ethnic Moldovans. An
individual’s number of children had a positive effect on the likelihood of migration, with
diminishing increases associated with each additional child. The highest level of education in the
household was positively correlated with migration, suggesting that migrants belong to
households with above-average levels of formal education. Per capita old-age pensions
(aggregated at a household level) were also positively correlated with migration of an adult child.
Finally, living in an urban area was positively correlated with the likelihood of migration. The
instrument used to predict migration was significant at a one-percent level and positively
correlated with migration. Additional goodness-of-fit tests—the Kleibergen-Paap F statistic and
the conditional likelihood ratio test—further confirmed the relevance of the instrument. The
results from the first-stage estimation are omitted here given space constraints but are available
upon request.
The instrumental variable regression results, shown in Table 6, reveal that no indicators of elderly
well-being are significantly affected by the migration of an adult child. The difference between
the instrumented and un-instrumented results suggests that elderly individuals with migrant
children may appear more mobile because of a selection process by which adults with more
mobile parents are more likely to enter migration precisely because their parents have retained
some measure of independence. Other covariates have a stronger relationship to elderly well-
being. An individual’s age and sex were significant in many estimations: individuals within the
oldest age cohort (aged 70 and older), for instance, had lower probabilities of being well in
several indicators than did individuals in the 60-to-70-year-old age cohort. Men had higher
probabilities than women of being well in several dimensions, but this correlation could be
explained by the higher percentage of men within the youngest age cohort. Education increased
the probability of an individual being well in many indicators, whereas living in a rural area
corresponded to a marked decrease in the probability of an individual having appropriate
housing, by 14 percentage points.
Table 6: Second stage regression: Determinants of well-being
(0.03) (0.03) (0.03) (0.03) (0.03) (0.03) (0.03) (0.03)
Observations 1322 1322 1322 1322 1322 1322 1322 1322
Pseudo R2 0.07 0.01 0.13 0.11 0.05 0.05 0.02 0.06
Housing BMI Mobility Medication Contact Not
depressed
Satisfied MWI
Migrant
child
0.18
(0.37)
0.04
(0.32)
0.11
(0.28)
-0.33
(0.41)
0.28
(0.25)
0.31
(0.37)
0.18
(0.54)
0.40
(0.38)
Age 70+ -0.01 -0.01 -0.21**
-0.13**
-0.07+ -0.01 0.00 -0.09
*

14
A 2-stage residual inclusion estimation was also conducted as a sensitivity test. The results,
available upon request, confirm the findings from the 2SLS model, with migration not found to
significantly impact any dimension of elderly well-being.
(0.04) (0.05) (0.03) (0.03) (0.04) (0.03) (0.04) (0.05)
Male 0.04+ 0.05
+ 0.07
** 0.02 0.11
** 0.11
** 0.03 0.13
**
(0.02) (0.03) (0.02) (0.02) (0.02) (0.02) (0.02) (0.03)
Moldovan -0.05 -0.02 -0.06 -0.03 0.00 -0.05 -0.02 -0.05
(0.05) (0.05) (0.05) (0.05) (0.05) (0.07) (0.08) (0.06)
Rural -0.14**
0.04 0.04 -0.02 0.11* -0.00 0.02 0.03
(0.04) (0.04) (0.04) (0.05) (0.04) (0.05) (0.07) (0.06)
Mean age of
children
0.01
(0.01)
-0.01
(0.01)
0.00
(0.01)
0.01
(0.01)
0.02
(0.01)
-0.00
(0.01)
0.01
(0.01)
0.02
(0.01)
Mean age of
children
squared
-0.00
(0.00)
0.00
(0.00)
-0.00
(0.00)
-0.00*
(0.00)
-0.00+
(0.00)
0.00
(0.00)
-0.00
(0.00)
-0.00+
(0.00)
Highest level of education in the household (ref category: lower secondary)
Upper
secondary
0.04
(0.09)
-0.05
(0.08)
0.03
(0.08)
0.06
(0.10)
-0.00
(0.07)
0.02
(0.09)
0.05
(0.12)
-0.01
(0.09)
Post
secondary
0.08*
(0.04)
-0.02
(0.04)
0.15**
(0.04)
0.06
(0.04)
0.03
(0.04)
0.07+
(0.04)
0.06
(0.05)
0.06
(0.05)
Higher 0.10* -0.03 0.21
** 0.13
* 0.05 0.14
** 0.14
* 0.14
**
(0.05) (0.04) (0.04) (0.05) (0.04) (0.04) (0.06) (0.05)
Per capita
old age
pension
0.00
(0.00)
-0.00
(0.00)
0.00
(0.00)
0.00+
(0.00)
0.00
(0.00)
0.00
(0.00)
0.00
(0.00)
-0.00
(0.00)
Number of -0.05 -0.05 -0.03 0.10 -0.06 -0.01 0.03 -0.09
children (0.06) (0.06) (0.05) (0.07) (0.05) (0.07) (0.09) (0.07)
Number of
children
squared
0.01
(0.01)
0.01
(0.01)
0.00
(0.01)
-0.01+
(0.01)
0.00
(0.01)
-0.00
(0.01)
-0.00
(0.01)
0.01
(0.01)
Migrant networks to…
Italy -0.00 0.00 0.00 0.00 -0.00 -0.00 0.00 -0.00
(0.00) (0.00) (0.00) (0.00) (0.00) (0.00) (0.00) (0.00)
Ukraine 0.00 -0.00 -0.00 -0.00 0.00 0.00 0.00 0.00
(0.01) (0.01) (0.00) (0.00) (0.01) (0.00) (0.00) (0.01)
Romania 0.01 -0.00 -0.00 -0.01* 0.00 0.00 0.02
* 0.01
(0.01) (0.01) (0.01) (0.01) (0.01) (0.01) (0.01) (0.01)
Russia -0.00 -0.00 0.00 0.00 0.00 -0.00 -0.00 -0.00
(0.00) (0.00) (0.00) (0.00) (0.00) (0.00) (0.00) (0.00)
Observations 1322 1322 1322 1322 1322 1322 1322 1322
Kleibergen-
Paap weak
IV rk F stat
8.6 8.6 8.6 8.6 8.6 8.6 8.6 8.6
95% CLR
conf interval [-0.40, 0.95] [-0.68, 0.84] [-0.56, 0.83] [-1.22, 0.21] [-0.32, 1.13] [-0.26, 1.22] [-0.49, 1.04] [-0.21, 1.43]
CLR test p-
value 0.52 0.9 0.70 0.23 0.33 0.27 0.56 0.19
Source: Authors’ calculations; significance levels + p< 0.1, * p< 0.05, ** p< 0.01. The CLR tests whether the
coefficient for migration is equal to zero (𝛽 = 0) at a 5% level. In all the regressions, the null hypothesis is not
rejected: the impact of migration is not significantly different from zero.

15
Discussion
The results suggest that the impacts of migration on multidimensional well-being are marginal if
not entirely absent. The first hypothesis, which stated that a child’s migration would not
correspond to entirely positive or entirely negative well-being outcomes, was confirmed, as
indeed a child’s migration corresponded to heterogeneous impacts on different well-being
indicators. The second and third hypotheses, however, are firmly rejected. The second hypothesis
proposed that emotional and social well-being would be negatively impacted by the migration of
an adult child, but the results suggest that there is no meaningful impact of migration on these
domains of well-being. The results also lead to rejection of the third hypothesis: physical health
and material well-being were not positively impacted by migration. Elderly individuals with adult
children living abroad appeared to be healthier in terms of basic mobility functions, but this
apparently-positive relationship disappeared once potential endogenity was controlled for. This
suggests that migrant self-selection drove the relationship between migration and higher rates of
physical mobility among the elderly: potential migrants whose ageing parents had retained basic
mobility functions were perhaps more likely to have entered migration precisely because their
parents were able to physically function in their absence.
The limited influence of migration on elderly well-being outcomes likely reflects the
particularities of the Moldovan context. Despite the significant scale of migration from Moldova,
particularly among the “middle generation” of individuals of prime working age, elderly
individuals are unlikely to be left without any form of informal social assistance. As noted by
Grant, Falkingham, and Evandrou (2009), formal eldercare services or institutions are limited,
and care for ageing kin is generally organised on family level. Given this expectation, the
migration decision is likely to be made with consideration not only of individual benefits but also
of family-level obligations; individuals with ageing parents may plan their potential migration
projects in conjunction with their siblings. Stöhr (2013), using the same dataset as the present
study, suggested that siblings strategically allocate their time and “specialise” in either migrating
or staying behind to ensure that their parent(s) are not faced with a deficit of care. Indeed, only
very few elderly individuals with multiple children were “left behind” by migration; only eight
percent of elderly persons with two children and 3.6 percent of those with between three and five
children had experienced the migration of all of their children. In contrast, over a quarter of
elderly individuals who did not have multiple children were left behind by a migrant child (Stöhr,
2013). This suggests that when the option to negotiate between or among potential migrants
arises, families will do so in such a way to ensure that ageing parents will always have at least
one child in the country. The continued presence of a source of physical support and assistance is
likely to help buffer elderly individuals from potential negative externalities associated with the
migration of an adult child, contributing to overall benign consequences of migration for elderly
well-being.
The findings of this study add valuable nuance to the discussion of how migration can affect
multidimensional elderly well-being in Moldova, but the study faced some limitations that should
be addressed in future research. First, certain indicators of well-being could be refined to better
accommodate specific characteristics of the elderly Moldovan population. For example, body
mass index (BMI) was used as an indicator of physical well-being, yet the range of “normal”

16
scores represent values that have not been specified for the elderly population or for the
Moldovan population. The lack of calibration to the particular population under study would not
be expected to lead to systematic differences between individuals with and without adult migrant
children, but it does suggest that well-being rates across the population are potentially skewed.
Second, the variables used to proxy well-being could be better refined to accommodate the
transient nature of “well-being”. The data used in this analysis are cross-sectional and therefore
represent the well-being of respondents at a particular moment in time. Certain indicators of well-
being, such as self-reported depression or life satisfaction, are likely to vary across even short
time spans in response to events or conditions. Longitudinal data that collects observations from
the same individuals over time could help establish “baseline” values of subjective well-being
that could help determine whether individuals manifest temporary dips or peaks in response to
life events or circumstances (Clark, Diener, Georgellis, & Lucas, 2008). A third and final
limitation relates to the choice to only compare elderly individuals with at least one child abroad
to those with no children abroad. The well-being outcomes of elderly individuals would be
expected to differ based on the particular family situation in which an ageing person is
embedded; two elderly persons with children living abroad may have markedly different
outcomes if one of them has another children living in the same household and the other does not
have any other children aside from the migrant living abroad. The location and availability of
children matters for the type of care that an elderly person may receive; local, translocal, and
transnational caregivers are likely to have different capacities and constraints (Baldassar,
Baldock, and Wilding, 2007), emphasising the importance of better modelling the particular
family constellation in which an elderly individual lives.
Despite these limitations, this study makes several contributions to the literature. First, the
disaggregation of well-being into different domains illustrates the value in conceptualising well-
being as an inherently multidimensional concept. Well-being rates varied considerably by domain
and by indicator, signalling the danger in measuring well-being using traditional, unidimensional
approaches based exclusively on material security. Second, the use of an instrumental variable
approach to measuring the impacts of migration on the well-being outcomes of elderly
individuals provided an apt illustration of how endogenity can bias results. The relationship
between migration and well-being was significant only prior to application of an instrument,
suggesting that the apparent influence of migration on specific well-being outcomes (such as
mobility) was likely capturing unobservable characteristics of migrants and their families that
could distort the estimation results. Third, and finally, the weak relationship between the
migration of an adult child and the well-being outcomes of their elderly parents suggests that
other factors of an individual’s life—gender and education level chief among them—may play a
stronger role in shaping well-being outcomes. Women, for instance, had markedly lower
probabilities of achieving well-being in most indicators than their male counterparts, suggesting
that the ageing process is negotiated differently by men and women. Further exploration of the
difference in well-being outcomes across different sub-population groups (e.g., men/women,
rural/urban residents, poor/well educated) is likely to reveal that migration is much less strong
predictor or contributor to well-being than other factors in an individual’s life.
17
Acknowledgements
Funding for this research was provided by the European Commission through grant contract
DCI-MIGR/2010/229-604.
References
Abas, M.A., Punpuing, S., Jirapramukpitak, T., Guest, P., Tangchonlatip, K., Leese, M. and
Prince, M. 2009. Rural-urban migration and depression in ageing family members left behind.
The British Journal of Psychiatry, 195, 54-60.
Agree, E.M., Biddlecom, A.E., and Valente, T.W. 1999. Multi-generational exchanges in Taiwan
and the Philippines: A social network approach. Hopkins Population Center Papers on
Population, WP 99-06, Johns Hopkins University.
Alkire, S. 2002. Dimensions of human development. World Development 30(2), 181-205.
Alkire, S. and Foster, J. 2011. Counting and multidimensional poverty measurement. Journal of
Public Economics, 95, 476-497.
Antman, F. 2010. Adult child migration and the health of elderly parents left behind in Mexico.
American Economic, 100(2), 205-08. DOI: 10.1257/aer.100.2.205.
Atkinson, A.B. 2003. Multidimensional deprivation: contrasting social welfare and counting
approaches. The Journal of Economic Inequality, 1, 51–65.
Baldassar, L., and Baldock, C. 2000. Linking migration and family studies: Transnational
migrants and the care of aging parents. In B. Agozino (Ed.). Theoretical and Methodological
Issues in Migration Research: Interdisciplinary, Intergenerational and International
Perspectives (pp. 61−89). Aldershot Ashgate.
Baldassar, L. 2007. Transnational families and aged care: The mobility of care and the migrancy
of ageing. Journal of Ethnic and Migration Studies, 33(2), 275-297.
Baldassar, L., Baldock, C., and Wilding, R. 2007. Families Caring Across Borders: Migration,
Ageing and Transnational Caregiving. Palgrave Macmillan: New York.
Böhme, M., Persian, R., and Stöhr, T. 2013. Alone but better off? Adult child migration and
health of elderly parents in Moldova. Kiel Working Paper No. 1876.
Brown, R.I. and Brown, I. 2004. Quality of life and disability: An approach for community
practitioners. Jessica Kingsley Publishers: London.

18
Clark, A.E., Diener, E., Georgellis, Y., and Lucas, R.E. 2008. Lags and leads in life satisfaction
A test of the baseline hypothesis. The Economic Journal, 118, F222-F243.
Coughlin, J. 2010. Estimating the impact of caregiving and employment on well-being. Outcomes
& Insights, Vol.2
Cummins, R. 1996. The domains of life satisfaction: An attempt to order chaos. Social Indictors
Research, 38, 303-328.
Cummins, R. 1999. A Psychometric Evaluation of the Comprehensive Quality of Life Scale—
Fifth Edition. In L.Y. Lim, B.K.P. Yuen, and C. Löw (Eds.). Urban Quality of Life: Critical
Issues and Options (pp. 32-46). National University of Singapore.
Dijkers, M. 2007. “What’s in a name?” The indiscriminate use of the “quality of life” label, and
the need to bring about clarity in conceptualisations. International Journal of Nursing Studies,
44(1), 153-155.
Dong, Y., and Lewbel, A. 2012. A simple estimator for binary choice models with endogenous
regressors. Econometrics Reviews, forthcoming.
Farquhar, M. 1995. Elderly people’s definitions of quality of life. Social Science & Medicine,
41(10), 1439–1446.
Fillenbaum, G. 1984. The wellbeing of the elderly: Approaches to multidimensional assessment.
WHO Offset Publication No. 84. Center for the Study of Aging and Human Development, Duke
University Medical Center: USA/ World Health Organization: Geneva.
Frankenberg, E., Lillard, L., and Willis, R. J. 2004. Patterns of intergenerational transfers in
Southeast Asia. Journal of Marriage and Family, 64, 627-641.
George, L.K. and L.B. Bearon. 1980. Quality of Life in Older Persons: Meaning and
Measurement. Human Sciences Press: New York.
Grant, G., Falkingham, J., and Evandrou, M. 2009. The impact of adult children’s migration on
wellbeing in later life: Voices from Moldova. Centre for Research on Aging Discussion Paper
No. 0902, Centre for Research on Ageing, School of Social Science, University of Southampton:
UK.
International Organisation for Migration (IOM). 2012. Extended Migration Profile of the
Republic of Moldova. IOM: Chisinau.
Kalmijn, M. and Saraceno, C. 2008. A comparative perspective on intergenerational support.
European Societies, 10(3), 479-508. DOI: 10.1080/14616690701744364.
Kaneda, T., Lee, M., and Pollard, K. 2011. SCL/PRB Index of well-being in older populations.
Standford Center on Longevity.

19
Kanaiaupuni, S. 2000. Leaving parents behind: Migration and elderly living arrangements in
Mexico. Center for Demography and Ecology Working Paper No. 99-16. University of
Wisconsin: Madison.
King, R., and Vullnetari, J. 2006. Orphan pensioners and migrating grandparents: the impact of
mass migration on older people in rural Albania. Ageing & Society, 26, 783-816.
Kleibergen, F., and Paap, R. 2006. Generalized reduced rank tests using the singular value
decomposition. Journal of Econometrics, 133(1), 97-126.
Marchetta, F. 2012. Return migration and the survival of entrepreneurial activities in Egypt.
World Development, 40(10), 1999-2013.
Department of Health and Ageing. 2003. Mental Health National Outcomes and Casemix
Collection: Overview of clinician-rated and consumer self-report measures, Version 1.50.
Canberra.
Ratha, D., Mohapatra, S., and Silwal, A. 2011. Migration and Remittances Factbook 2011.
World Bank.
Robeyns, I. 2005. The capability approach: a theoretical survey. Journal of Human Development
and Capabilities, 6(1), 93-117.
Roelen, K., Gassmann, F., and de Neubourg, C. 2011. False positives or hidden dimensions:
What can monetary and multidimensional measurement tell us about child poverty in Vietnam?
International Journal of Social Welfare, 21(4), 393-407. DOI: 10.1111/j.1468-
2397.2011.00836.x.
Roelen, K. and Gassmann, F. 2012. Child Well-Being in Kazakhstan. UNICEF Kazakhstan,
Astana.
Sen, A. 1993. Capability and well-being. In M. Nussbaum and A. Sen (Eds.), The Quality of Life.
Clarendon Press: Oxford.
Stöhr, T. 2013. “Intra-family migration decisions and elderly left behind.” Kiel Working Paper
No. 1858. Kiel Institute for the World Economy.
Terza, J., Bazu, A., and Rathouz, P. 2008. A two-stage residual inclusion estimation: Addressing
endogeneity in health econometric modeling. Journal of Health Economics, 27 (3), 531–543
Ward, L., Barnes, M., and Gahagan, B. 2012. Well-being in old age: Findings from participatory
research. University of Brighton and Age Concern, Brighton. Retrieved from
http://eprints.brighton.ac.uk/10631/1/Well_being_in_old_age_findings_from_participatory_research_
full_report.pdf.
20
Zechner, M. 2008. Care of older persons in transnational settings. Journal of Aging Studies, 22,
32-44.