migration outlook - bbva research
TRANSCRIPT

Migration OutlookMexico
July 2012
Economic AnalysisThe economic crisis and the “Arizona Effect” are the main factors that have held back the flow of Mexican immigrants to the U.S.
Return migrants find jobs quickly, but mainly in the informal economy
In the U.S. Agriculture, Construction, and Accommodation and food services with contributions of Mexican immigrants higher than 10% of GDP
In California, Nevada, Arizona and Texas, Mexican immigrants contribute 9% to 12% of total state GDP
This year remittances to Mexico could reach their highest growth rate since 2007, If this trend continue in 2013 they will surpass its historic high

The publication Mexico Migration Outlook is a joint project of BBVA Bancomer Foundation and Mexico Economic Studies Department of BBVA
Research, which seeks to provide new contributions every six months in the field of Migration studies in order to have a better understanding of this
important social movement.

Mexico Migration OutlookJuly 2012
Content
1. Summary .................................................................................................................................................................................................................................................................. 2
2. The Two Main Factors that have Reduced Migratory Flows from Mexico to the U.S. ................................................................................................................................................................................................. 5
3. Returning Immigrants. Who are they and Under What Labor Conditions Do They Do It? .......................................................................................... 13
4. The contribution of Mexican immigrants to U.S. GDP ............................................................. 25
5. Statistical Appendix ................................................................................................................................................................................................................. 33
6. Special topics included in previous issues ................................................................................................................43
Closing date: July 10, 2012
REFER TO IMPORTANT DISCLOSURES ON PAGE 44 OF THIS REPORT

Mexico Migration OutlookJuly 2012
Page 2
1. Summary
This year remittances could reach their highest annual growth rate since 2007 As of the second half of 2010, remittances to Mexico began to recover and their total accumulated value both in 2010 and 2011 showed positive growth after two years of declines. We estimate that in 2012 remittances could grow between 7.3% and 8.1% in dollars term, surpassing dollar inflows received between 2009 and 2011 and posting annual growth exceeding dollar remittance revenues received in the years during the 2007-2011 period. If this trend in remittance growth continues, by the end of 2013, the accumulated flow could top its 2007 historic high of U.S. $26.049 billion.
Unlike other groups, Mexicans do not show a growth trend in their migratory flows The economic crisis that began in December 2007 in the U.S. led to lower migratory flows from various regions. Between 2007 and 2009 there were declines in the flows from Europe, the Caribbean, and Central and South America, among others. Flows from Mexico and Asia, the regions with the highest number of immigrants remained practically stable during this period.
As of 2010, signs of economic recovery started to appear in the United States and the migratory flows from different regions began to increase. By 2011 the immigrant population from Asia, Europe, the Caribbean and Central America surpassed that of 2007. Among the most important immigrant groups (in terms of volume), only Mexico and South America did not have a greater number of immigrants than in 2007, although South America is now showing a rising trend in the total number of immigrants. As the economic recovery consolidates in the U.S., Mexican migratory flows are expected to resume their growth trend prior to the crisis.
The economic crisis and the “Arizona Effect” are the main factors that have held back the flow of Mexican immigrants to the U.S.Mexican migration to the United States has not grown since 2008. Although the factors leading to this are different, there seem to be two main reasons: 1) from 2007 to 2009, the economic crisis, and 2) from 2010 to 2011, the “Arizona Effect”, due to anti-immigrant laws that began with the passing of the “Arizona Law”, which later extended to at least five other states in the U.S. (Alabama, Georgia, Indiana, South Carolina and Tennessee).
The economic crisis led nearly 500,000 Mexican immigrants to lose their jobs. Later, between the last quarter of 2009 and June or July of 2010, Mexican immigrants, as well as most of the more important immigrant groups showed a positive trend in employment, with the recovery of almost 150,000 jobs. Nevertheless, after the “Arizona Law” was passed, began a period of nearly a year of job losses among Mexican immigrants who lost some 350,000 jobs. The actions against immigrants in the various states that passed anti-immigrant laws mainly affected Mexicans, who represent nearly 60% of unauthorized workers in the U.S. In the states that passed anti-immigrant legislation, the overall population of Mexican immigrants was cut by 133,000, which deterred Mexican migratory flows to the U.S.
As of the second half of 2011, employment among Mexican immigrants has begun a new expansion phase. Labor flexibility has allowed workers to move to other economic sectors or regions, although around 340,000 more Mexican immigrants are unemployed compared to the end of 2007. If the trend in reducing unemployment among Mexican immigrants continues, this could be an incentive for an increase in the emigration of potential Mexican immigrants.

Mexico Migration OutlookJuly 2012
Page 3
Mexican immigrants contribute 4% of total U.S. GDP. If 2nd and 3rd generation Mexicans in the United States are included, their contribution to GDP is 8% Average productivity of a Mexican immigrant is on average 21.5% lower than the national average in the United States, and 16.8% lower than the overall average for immigrants in the U. S.. Nevertheless, they account for an important share of U.S. GDP. In 2003, they contributed with about 3.8% of GDP, growing each year to reach a historic high in 2007, at 4.1%. In 2009, following the effects of the crisis, the contribution of Mexican immigrants to GDP fell to 3.8%. However, if 2nd and 3rd generation Mexicans are added, their contribution to GDP is closer to 8%.
In some sectors, the economic contribution of Mexican immigrants is higher than 10% of GDP Despite the fact that less than 5% of working Mexican immigrants are employed in agriculture, forestry or fishing, they contribute nearly 18% of GDP of this sector; that is, nearly one fifth of the national value added of agriculture in the U.S. comes from the work of Mexican immigrants, and it is the economic sector where they made their greatest contribution to the U.S.
In second place is the construction sector, in which, Mexican immigrants in 2011 contributed with about 13.4% of the industry’s total national value added. Before the economic crisis, a significant increase was posted in the contribution of Mexican immigrants to this sector’s output, which was as high as 15.7% in 2007. However, due to the recession, construction was one of the sectors most affected, both in terms of general employment in the U.S. as well as specifically for Mexican immigrants.
The third sector of the economy where Mexican immigrants have a greater participation is in accommodation and food services (restaurants, beverages, hotels, among others), where they contributed with an average of 11.7% of the sector’s output between 2003 and 2011.
California, Nevada, Arizona and Texas are the states with the highest contribution to GDP by Mexican immigrantsSlightly more than 12% of California’s GDP in 2011 was due to the contribution of Mexican immigrants, with this state being where Mexican immigrants accounted for the highest participation in terms of state GDP.
In Texas, Arizona and Nevada, Mexican immigrants are also an important element for the economy. Around 9% of Texas GDP is due to Mexican immigrants, while in Nevada and Arizona, their contribution to state GDP is almost 10%.
Arizona is probably the state that has shown the greatest decline in the contribution of Mexican immigrants to state GDP recently, which was at least 11% between 2006 and 2007.
The migratory flows did not increase, but there has not been a massive return of Mexican immigrantsFigures from various official sources, both in Mexico and the U.S. indicate that there has not been a massive return of Mexican immigrants to their country of origin following the economic crisis and the toughening of migratory policy in the U.S.. For example, sources such as the Migration Survey along the Northern Border of Mexico (EMIF for Encuesta de Migración en la Frontera Norte de México) and the National Survey of Employment and Occupation (ENOE for Encuesta Nacional de Ocupación y Empleo), which report immigration figures on a quarterly basis, do not show levels surpassing those of the years prior to the economic crisis.

Mexico Migration OutlookJuly 2012
Page 4
Mexican returnees are mostly young males with low educational levels Figures from the National Survey Employment and Occupation (ENOE) reveal that, in general, the majority of immigrants that return to Mexico are males, although the proportion of women has tended to increase. Also, the majority are in their productive years, with around 80% in a range between 18 and 49 years of age. Returning immigrants 65 years of age and over also represent a relatively small proportion, which showed a slight increase of around 2% between 2006 and 2008 to slightly less than 4% in 2011. By educational level the data show that most of the immigrants who return to their home country are of a relatively low educational level (elementary school or less), although among the higher school levels (high school and professional or higher education) the proportion of returning immigrants has tended to increase in recent years.
Most of the Mexican returning immigrants find work quickly, although not all are high quality jobs Around 67% of those returning to their home country belong to the economically active population, and among this group nealy 70% find work in the first three months after returning, although between 2008 and 2010 the proportion was reduced slightly. After six months of having returned, approximately 90% of all returning immigrants have found at least one job and almost all of the returnees find jobs in less than a year.
The majority of returning Mexican immigrants are employed as paid subordinates and in second place as self-employed. In recent years, the proportion of the latter group has tended to be lower while that of the former has shown an increase. It is likely that a great number of those returning is due to lack of employment in the U.S. and consequently the proportion of immigrants that return with sufficient resources to be self-employed or employer is lower and therefore a greater proportion find jobs as subordinates or paid workers. Around 80% of Mexican returnees do not have benefits so it is probable that most of them find work in the informal economy.
With the startup of a new govenment administrations in both the United States and Mexico coinciding, this could open a window of opportunity in terms of migratory issuesEvery twelve years, federal elections coincide in Mexico and the U.S. and with this the beginning of two new government administrations in each of the two countries. This will happen in 2013 and therefore, there could be a window of opportunity with regard to migratory issures, which could be based on consideration of the benefits of migration for both countries, a reflection of the complementary aspects of both economies, some of which have been analyzed in previous editions of Mexico Migration Outlook. Some of these include satisfying the demand for jobs in the U.S., the rejuvenation of the work force, the transfer of resources for educational purposes in Mexico, taxes paid by immigrants in the U.S., which surpass the remittances that are sent to Mexico, and immigrants’ contribution to consumption and economic growth in the U.S., among others..
On June 15, the government of President Obama announced that the deportation of young people under the age of 30 who complied with certain requisites was to be temporarily suspended. Also, on June 25, the United States Supreme Court eliminated some sections of the “Arizona Law” such as considering undocumented immigrants who travel throughout the state looking for work as criminals. This type of actions could benefit both countries.

Mexico Migration OutlookJuly 2012
Page 5
2. The Two Main Factors that have Reduced Migratory Flows from Mexico to the U.S.Recently a Pew Hispanic Center study (Passel, Cohn, and Gonzalez-Barrera 2012) indicated that net Mexican migration to the United States falls to zero and perhaps less, and that this situation appears to be the result of many factors, among which are the weakened U.S. job and housing construction markets, the heightened border enforcement, an increase in deportations, the growing dangers of illegal border crossings, the long-term reduction of the birth rates and broader economic conditions in Mexico. The same document notes that Mexican migratory flows will possibly resume as the U.S. economy recovers.
In previous editions of Mexico Migration Outlook we have coincided with this last argument and have noted that the main factor that has reduced migration is the economic crisis, since Mexican migration to the U.S. is generally labor-related, and either increases or decreases in line with employment demand in the United States..
According to official data, the economic recession that began in December 2007 concluded in June 20091 and the U.S. economy has shown signs of recovery in employment. Nevertheless, the migratory flows from Mexico to the U.S. do not seem to have recovered. Does this also occur with the rest of the immigrant groups? Are better economic conditions in Mexico causing migratory flows do not increase? Is it the enhancing in border enforcement, insecurity at the border or deportations? Have all of these factors played an important role? Are there other factors that have not been considered up to now influencing these flows? These are some of the questions that we will address in this article.
Mexico, among the groups with the most immigrants in the U.S., is the only that still does not show a growing trend in its migratory flowsOne of the consequences of the economic crisis that began in December 2007 in the United States was a decline in the migratory flows from different regions. Between 2007 and 2009, the years in which the effects of the crisis were most evident, a decline was seen in the migratory population from Europe, the Caribbean, Central America, South America and other countries to the United States. Overall, we estimate that the immigrant population in the U.S. was reduced by more than 500,000. The migratory flows from Mexico and Asia, the regions with the greatest number of immigrants, remained practically stable during that period.
1 According to the National Bureau of Economic Research
Graph 1
Immigrants in the U.S. according to Region of Origin (Millions, Major Regions)
11.1 11.8 11.8 11.9 11.9 11.6
9.9 10.4 10.7 10.7 10.7 11.1
5.2 5.5 5.6 5.4 5.5 5.6
3.2 3.4 3.5 3.4 3.7 3.8 2.6 2.7 2.7 2.6 2.9 3.0
2.5 2.6 2.4 2.4 2.5 2.5
1.2 1.2 1.5 1.5 1.7 1.6
2006 2007 2008 2009 2010 2011
Mexico Asia Europe The Caribbean Central America South America Africa
Source:: BBVA Research with figures from the Current Population Survey

Mexico Migration OutlookJuly 2012
Page 6
As of 2010 signs of economic recovery started to appear in the U.S., thus, the migratory flows from various regions began to increase. By 2011, the immigrant population from Asia, Europe, the Caribbean and Central America was higher to that of 2007. Among the most important groups of immigrants (in terms of volume), only Mexico and South America are below their 2007 levels, although South America is now showing a growing trend in total immigrants. Why is it that Mexico, among the largest groups of immigrants, has not yet shown a growing trend in its migratory flows? Is it due to the economic crisis? Is it because better economic conditions in Mexico? If it is because of the greater restrictions along the Mexico-U.S. border, why are the flows from Central America growing when most of their immigrants pass through the same border area? In the following sections we will try to answer these questions.
Mexican and Central American immigrants among the most affected by the economic crisisThe sectors where most jobs were lost in the U.S. following the economic crisis were construction, manufacturing and retail. Overall the job losses in those three sectors totaled slightly more than six million. That is, 75% of the more than eight million jobs lost between 2007 and 2009.
Graph 3
U.S.: Immigrants Employed According to Region of Origin, January 2006 to June 2009 January 2006=100
Graph 4
U.S.: Immigrants Employed according to Region of Origin, July 2009 to April 2011 January 2006=100
94
97
100
103
106
109
112
May-06 May-07 May-08 May-09
Mexico
Asia
Europe
The Caribbean
Central America
South America
Economic crisis
92
96
100
104
108
112
Nov-09 Nov-10 Nov-11 Mar-12
Passing ofanti-immigrant laws
in various states
Mexico
Asia
Europe
The Caribbean
Central America
South America
Note: TRAMO/SEATS seasonally adjusted data Source: BBVA Research with Current Population Survey data
Note: TRAMO/SEATS seasonally adjusted data Source: BBVA Research with Current Population Survey data
Graph 2
U.S.: % of Immigrants Employed in Construction, Manufacturing and Retail, According to Origin
26.7
29.5
31.4
33.9
40.6
44.81
29.9
30.6
31.8
31.3
44.7
50.9
The Caribbean
Asia
Europe
South America
Central America
Mexico
2007 2009
Source: BBVA Research with figures from the Current Population Survey

Mexico Migration OutlookJuly 2012
Page 7
In 2007 the percentage of Mexican immigrants who worked in these three sectors was 51%, while that of Central Americans was 45%. The share of other immigrant groups with a greater presence in these sectors did not reach 32% in any case. That is, the economic crisis affected more those sectors with a greater concentration of Mexican and Central American immigrants, reducing their share in 2009 by 6 and 4 percentage points respectively. This caused the groups that showed the highest growth in employment between 2006 and 2007 to suffer the sharpest drops throughout 2008 and the first half of 2009. We estimate that more than 500,000 Mexican immigrants and nearly 200,000 Central Americans lost their jobs in that period.
In contrast, Asian immigrants continued to gain jobs even after the beginning of the recession, and suffered job losses only toward the middle of the recession period, but with a less steep path than that of the Mexican immigrants, because they lost close to 130,000 fewer jobs.
In June of 2009, the economic recession officially concluded. What happened after that? Did all the immigrant groups recover jobs?
The “Arizona Effect” holds back the flow of Mexican immigrantsFollowing the conclusión of the recession in the U.S., it is notable that the various immigrant groups began to gain jobs. Some faster than others, such as those from Central America and the Caribbean, but in all cases a growing trend began in employment. The Mexicans also initiated a growth phase in employment, which began in the last quarter of 2009 and concluded between June and July of 2010. During that period, Mexican immigrants were able to recover nearly 150,000 jobs. Nevertheless, at the end of that phase, there is a difference among the Mexican immigrants compared with other high volume immigrant groups; a trend in job loss, lasting almost a year, with some 350,000 jobs lost. What happened during this period that caused Mexican immigrants to lose jobs while other immigrant groups did not? Was it once again an economic situation?
During that period, although the U.S. economy was weak, economic recovery continued. The only possible explanation for the loss of jobs among Mexican immigrants is what we call the “Arizona Effect”. That is, the combination of actions against unauthorized immigrants in the U.S., which began with the passing of the “SB1070 Law” in April 2010 in Arizona, and which continued with different actions against immigrants, leading to the passing of different anti-immigrant laws in other states: Tennessee (June 28, 2010), Indiana (May 10, 2011), Georgia (May 13, 2011), Alabama (June 2, 2011), South Carolina (June 27, 2011)2, which led to the rejection of undocumented workers in some states, with some employers firing undocumented immigrants and some of these workers leaving those states.
The fact that the impact of the anti-immigrant laws was mainly on the employment of Mexicans is due to the fact that nearly 60% of unauthorized immigrants in the U.S. are Mexicans and the remaining 40% includes immigrants from different countries, according to Passel and Cohn (2011) of the Pew Hispanic Center. Also according to these authors, more than 50% of Mexican immigrants in the U.S. are unauthorized.
In those states where the anti-immigrant laws were implemented, among the groups with a greater presence of immigrants, reductions were only seen in the Mexican population between 2009 and 2011, which indicates that they were the most affected. Of the 1.12 million Mexican immigrants in those states in 2009, the figure was reduced by 133,000. This situation generated two effects in the number of persons that would potentially emigrate from Mexico to the U.S.: one was to discourage a move toward those states where the anti-immigrant laws were enacted, and also to discourage moving to those states where those immigrants had moved and had taken up jobs that new immigrants might have obtained. Moreover, the social networks among Mexican immigrants might have discouraged potential immigrants from going to the U.S. in view of these situations.
2 There are other states that also enacted anti-immigrant laws or tried to do so, such as the case of Utah, but these did not pass or were blocked.

Mexico Migration OutlookJuly 2012
Page 8
Table 1
U.S.: Immigrants in States with Anti-Immigrant Laws, according to Region of Origin (Thoudands) Total Immigrants Immigrants without citizenship
2009 2011 Var. 2009-2011 2009 2011 Var. 2009-2011
Mexico 1,239 1,106 -133 955 771 -184
Asia 637 639 2 298 281 -18
Europe 367 563 196 79 204 125
The Caribbean 105 119 14 19 55 36
Central America 180 218 39 124 140 16
South America 99 139 40 39 71 32
Note: The states with anti-immigrant laws are: Alabama, Arizona, Georgia, Indiana, South Carolina and Tennessee Source: BBVA Research with figures from the Current Population Survey
Although the laws continue, it is probable that their effect has minimizad due to the movement of Mexican immigrants to other states and the effect of the economic recovery now predominates. Job flexibility is an element that has allowed immigrants to move to other economic sectors or regions.3 Thus, from July 2011 to April 2012, there are more than 200,000 new jobs held by Mexican immigrants.
The actions against immigrants in the six states mentioned above with anti-immigrant laws have affected employment mainly among Mexican immigrants. In view of this, given that the migratory flow of Mexicans is mainly correlated with employment and if jobs were reduced, so too were migratory flows from Mexico to the U.S. Thus, the “Arizona Effect”, as it affected employment of Mexican immigrants also affected the migratory flows from Mexico to the United States, without significantly affecting the flows from other regions, which currently show an increase in their migratory flows as opposed to those from Mexico, which have not recovered yet.
The “Arizona Effect”, together with the economic crisis, led to a decline in the migratory flows from Mexico to the U.S.. In addition to these factors, are there others of significant importance? In the following sections we will address this question.
Have changes in Mexico significantly affected the migratory flows?It has been argued that both the long-term reduction of the birth rate in Mexico as well as improved economic conditions in the country have led to a decline in the number of Mexicans emigrating to the United States. However, both factors have had minimal effects on the current decline in migration as we will see in the followiing.
Graph 5
Birth Rate (Per 1000 Inhabitants)
Graph 6
Wages per employee in the U.S. and Mexico (PPA Adjusted Dollars)
0
10
20
30
40
50
80 85 90 95 00 05 10
Europe & Central Asia East Asia & the Pacific Mexico WorldLatAm & Caribbean Less developed countries
-
10,000
20,000
30,000
40,000
50,000
60,000
70,000
00 01 02 03 04 05 06 07 08 09
Mexico
USA
Source: BBVA Research with figures from the Current Population Survey
Source: BBVA Research with figures from the Current Population Survey
3 In the November 2009 issue of Mexico Migration Outlook we review the topic of sectorial and regional job flexibility of Mexican immigrants in the U.S

Mexico Migration OutlookJuly 2012
Page 9
Graph 7
U.S.: Mexican Immigrants Apprehended and Border Patrol Agents (Thousands)
Graph 8
U.S.: Mexicans Apprehended by the Border Patrol and GDP Growth
5
10
21
1,294
1,637
1,085
286 0
300
600
900
1,200
1,500
1,800
0
5
10
15
20
25
1995 1999 2003 2007 2011
Agents (left) Immigrants apprehended (right)
-4
-2
0
2
4
6
-
400
800
1,200
1,600
95 99 03 07 11
%
Th
ou
san
ds
Mexicansapprehended (left)
GDP growth rate (right)
Possible"Arizona effect"
Economic effect
Source: BBVA Research with figures from the Current Population Survey
Source: BBVA Research with figures from the Current Population Survey
As mentioned previously, among the various groups with more immigrants in the U.S. only the migratory flows from Mexico have not recovered. With regard to this, we will review different hypotheses. If this situation were due to a great extent to a lower birth rate in Mexico, it should be occurring that in Mexico birth rate is declining more significantly than in other regions and it is lower than that of other regions that have greater migratory flows. Although the birth rate in Mexico has declined, this situation has not occurred only in Mexico and it is still higher than that of some European or Asian countries, whose migratory flows toward the U.S. have shown a greater positive trend than Mexican ones. Therefore, it cannot be the birth rate that explains the recent decline in Mexican migratory flows to the U.S., although this could have some bearing in the long term, but a sudden effect is not likely.
Although in Mexico some conditions have improved which have allowed families to acquire goods and have better educational opportunities, leading to higher average education levels among the Mexican population, from 2.6 grades in 1960, to 7.5 grades in 2000 and to 8.6 grades in 2010, the fact is that these improvements have not been enough to reduce the wage gap between Mexico and the United States. Figures from the OECD indicate that the wage gap per employee between the U.S. and Mexico has increased. Thus, while there has been some economic improvement, this has not led to a reduction in the gap between wages in Mexico and the U.S. and therefore the incentives to emigrate have not declined.
The border and deportations, an important impediment to migration?It is well known that insecurity along the Mexico-U.S. border has increased and that the United States has reinforced its border surveillance at the same time that it has toughened its policy regarding the deportation of immigrants. Undoubtedly, this could have some bearing on Mexican migration to the U.S. but we should ask whether this has influenced the decline in migration to a greater extent than the economic crisis and the “Arizona Effect”.
The United States has reinforced its borders, mainly that which it shares with Mexico. In 1995, the number of border patrol agents was 5,000; by 2002, this figure had doubled and by 2011 it had grown four times, to 21,000 agents, of which 18,500 (86%) belong to the southwest border area. Contrary to the positive trend in the number of agents, the number of Mexicans arrested has shown a negative trend, mainly since 2001. To what is this due? Why is it that while there are more border patrol agents, fewer Mexicans are apprehended? Is it that while there are more agents, fewer Mexicans are emigrating and therefore fewer are arrested?

Mexico Migration OutlookJuly 2012
Page 10
Although the strengthening of border surveillance and more deportations could have some effect on migratory flows to the U.S. and therefore explain to some extent the behavior shown by the number of Mexicans apprehended, the two factors that we noted previously: the economic cycle and the “Arizona Effect” are the main reasons that seem to explain the trend of Mexican immigrants apprehended. Let us see why.
Between 1995 and 2009, the number of Mexicans apprehended by the U.S. border patrol shows a clear correlation with GDP growth in the United States. In general, economic growth leads to more jobs, and the number of Mexicans apprehended grows, while the opposite occurs when the U.S. economy contracts. This occurs because as we noted in the November 2010 issue of Mexico Migration Outlook, the most important driving force for Mexican migration to the U.S. is the economic cycle. Thus, when the economy tends to grow (and, as a result, employment) the migratory flow also increases and therefore more unauthorized Mexicans enter the country and consequently a greater number are apprehended, whereas when the economy is weak fewer Mexicans emigrate and consequently the number of Mexicans apprehended also declines.
Between 2010 and 2011, despite economic growth in the U.S. the number of those apprehended did not increase. This seems to be due mainly to what we call the “Arizona Effect”, which affected the employment of Mexican immigrants and therefore Mexican migratory flows.
Graph 9
U.S.: Mexicans and Central Americans Apprehended by the U.S. Border Patrol (Thousands)
0
20
40
60
80
100
120
140
0
250
500
750
1,000
1,250
1,500
2005 2006 2007 2008 2009 2010
Mexicans (left) Central Americans (right)
Source: BBVA Research estimates with Banxico and INEGI data.
Many Central Americans use the same border to enter the U.S. as Mexicans. If events along the border such as the strengthening of surveillance, an increase in deportations and the growing dangers related to illegal crossing had a strong impact on reducing migratory flows, they would affect not only Mexicans but Central Americans as well. However, as mentioned previously, migratory flows from Central America are beginning to recover. This situation is also seen in the number of Mexicans apprehended compared with Central Americans.
Both the number of Mexicans and Central Americans apprehended by the U.S. border patrol decreased following the economic crisis. However, between 2010 and 2011, the number of Central Americans apprehended has begun to rise, as a consequence of greater migratory flows due to an increase in the employment of Central American immigrants, while the number of Mexican immigrants apprehended has continued to decline due to the fact that the migratory flows from Mexico have not recovered.
Thus, these results suggest that although the situation along the border and immigrant deportations could have some bearing on lower migratory flows from Mexico to the U.S., the effect has not been as significant as that of the economic crisis and the “Arizona Effect”.

Mexico Migration OutlookJuly 2012
Page 11
Our forecast for remittances As mentioned previously, employment of Mexican immigrants has begun to show a rising trend, after the loss of jobs due to the “Arizona Effect”. As a result, in 2011 remittances grew 6.9% after a decline in 2008 and 2009 and only marginal growth in 2010. So far in 2012 remittances have continued to grow and in the month of May reached their highest level since October of 2008. Thus, for 2012 the base scenario of BBVA Research forecasts remittance will growth cumulatively between 7.3% and 8.1% in dollars terms, surpassing US$24.38 billion. For 2013 we expect remittances to grow between 7.6% and 8.4%, exceeding US$26 billion, and possibly also their historic high of 2007, prior to the effects of the economic recession in the U.S. If these scenarios prevail, the variations in pesos in real terms (after discounting inflation) would be between 8.3% and 9.3% this year, and for 2013 between -2.5% and -1.7%, with a not too favorable exchange rate for the families receiving the remittances..
The sharpening of economic problems in the euro zone could have greater consequences for the world economy. These factors, as well as the volatility of the exchange rate, could affect the scenario of remittances toward Mexico.
Conclusions Mexican migration to the United States has not increased since 2008. Although there could be several factors involved in this situation there are two major reasons. From 2007 to 2009, the economic crisis and from 2010 to 2011 the “Arizona Effect” which comprises a wave of anti-immigrant laws that began with the passing of the “Arizona Law” which influenced at least five other states to pass similar legislation in the U.S. (Alabama, Georgia, Indiana, South Carolina and Tennessee).
The economic crisis led to the loss of nearly 500,000 jobs held by Mexican immigrants. Between the last quarter of 2009 and June or July of 2010, Mexican immigrants as well as other major groups of immigrants had shown a rising trend in employment, recovering close to 150,000 jobs. However, following the implementation of the “Arizona Law” a period of nearly one year began with a loss of 350,000 jobs for Mexican immigrants. As of the second half of 2011, Mexican immigrants have begun a new expansion phase in employment. Nevertheless, around 740,000 Mexican immigrants are still unemployed, a figure that contrasts with the nearly 400,000 unemployed prior to the start of the economic crisis in December 2007.
Table 2
Forecast for Remittances to Mexico (Annual % change)
Graph 10
Accrued 12 Month Remittance Inflows to Mexico (Millions of U.S. Dollars, Base Scenario)
26,049.6 Dec 07
21,244.7 Dec 09
0
5,000
10,000
15,000
20,000
25,000
30,000
07 08 09 10 11 12 13
Data observed Estimates from Jun-12 to Dec-13
2012e7.3 - 8.1%
2013e7.6 - 8.4%
Source: BBVA Research estimates Source: BBVA Research with Banxico figures. e: BBVA Research estimates as of June 2012.
2012 2013
Growth rate in
U.S. dollars7.3 a 8.1 7.6 a 8.4
Growth rate in
current pesos12.1 a 13.5 1.0 a 1.8
Growth rate in
real pesos8.3 a 9.3 -2.5 a -1.7

Mexico Migration OutlookJuly 2012
Page 12
The actions against immigrants in various states leading to the passing of anti-immigrant laws mainly affected Mexican immigrants who account for nearly 60% of unauthorized workers.
In view of this situation, Mexico has been among the major immigrant groups in the United States the only that has not yet shown a rising trend in its migratory flows. Although it has been possible to minimize the impact of the anti-immigrant laws in view of the high number of unemployed Mexican immigrants that still remain in the United States, a rapid recovery of Mexican migratory flows to the United States over the coming months is not likely to occur.
In the month of May, the unemployment rate in the U.S. posted an increase after 10 consecutive months employment recovery, which reflects the labor market is still weak. Even in recent months both Mexican and Central American immigrants have shown a decline in the growth they had experienced in employment at the close of 2011 and in the early months of this year. Mexican migration recovery will depend to a great extent on the continued recovery of employment in the U.S.. Otherwise migratory flows from Mexico to the U.S. will not increase.
In the médium and long term, we believe that Mexican migration to the U.S will continue to grow, since the driving forces for it are still in place. Both Mexico and the United States benefit from migration. With the start of two new government administrations in the two countries, a window of opportunity is opened for reaching agreements on immigration issues that will benefit both countries, reflecting the complementary aspects of the two economies, some of which have been analyzed in previous issues of Mexico Migration Outlook and in notes in Mexico Migration Flash, such as satisfying employment demand in the U.S., the rejuvenation of the work force, the transfer of resources from Mexico by education costs, the payment of taxes by Mexican immigrants in the U.S. which surpass the remittances sent to Mexico and immigrants’ contribution to consumption and economic growth in the U.S., among others.
Last month, two events occurred regarding migratory matters that could benefit the U.S. and Mexico to a certain extent. On June 15, the Obama administration announced that it is temporarily detaining the deportation of young people under 30 years old who meet certain requisites; also, on June 25, the United States Supreme Court blocked parts of the “Arizona Law” such as considering unauthorized immigrants who look for work in the state as criminals. These examples illustrate that there is a possibility of reaching agreements. It is important to recognize that the economies of Mexico and the U.S. are complementary, and that it is important to respect human rights and to recognize immigrants’ contribution to the economy, as we shall analyze further on in this edition of Mexico Migration Outlook.
Bibliography Passel, J., D. Cohn, and A. Gonzalez-Barrera, (2012) “Net Migration from Mexico Falls to Zero—and Perhaps Less”, Pew Hispanic Center
Passel, J. and D. Cohn (2011) “Unauthorized Immigrant Population: National and State Trends, 2010”, Pew Hispanic Center

Mexico Migration OutlookJuly 2012
Page 13
3. Returning Immigrants. Who are they and Under What Labor Conditions Do They Do It?*Following the economic crisis that began in December 2007 and after the losses of jobs in the United States, in particular for Mexican immigrants living in that country that had recorded their highest levels of unemployment, in Mexican public opinion spread the idea of a possible massive return of immigrants. Different estimates were made known that varied from 350,000 up to 3,000,000 immigrants who would be returned to Mexico (see Alarcón, 2008, et.al.).
After some years, there is more information for evaluating what happened with greater accuracy. In this respect, the main consensus in the researches is that the growing trend in the Mexican migration flow, which began mostly since the decade of the 90´s, has stopped. Furthermore, some estimates are showing that the volume of Mexican unauthorized population living in U.S. has decreased. From 2007 to 2010, figures of the Pew Hispanic Center indicated a reduction of around 500,000 persons, while the Department of Homeland Security suggested a decrease of slightly more than 300,000. Despite this, the total number of persons born in Mexico who live in the United States has remained almost constant since 2007, at levels of around 11.8 million, according to figures of the Current Population Survey, even though, there was a slight decrease for 2011.
With regard to the causes for the decrease in Mexican migration flows, various explanations have been given (see García Zamora, 2011); but, as shown in the first article of this issue of Mexico Migration Outlook, the economic crisis and the “Arizona Effect” are the main reasons. A subject that has not been well analyzed is the recent return of Mexican immigrants. There is still not too much information about the volume of immigrants returning home, what their characteristics are, the conditions under which they are doing it, and how do they integrate to Mexican labor market at the return.
This article seeks to offer an approximation of the volume of returning Mexican immigrants in recent years, to describe some of its main characteristics, and to point out possible trends and outlook for the future. The main source of information came from overlapping the data panels from the ENOE (Encuesta Nacional de Ocupación y Empleo, an official Mexican nationwide survey on occupation and employment) for the years 2005 to 2011. In the analysis, Mexican immigrants are those persons born in Mexico and living in other countries, and returning immigrants are those persons born in Mexico who had lived abroad and returned.
Graph 11
Population Born in Mexico living in the U.S. (Millions)
0
2
4
6
8
10
12
14
9594 96 98 00 02 04 06 08 1097 99 01 03 05 07 09 11
Source: BBVA Research with figures from Current Population Survey, March supplement (1994-2011)
* Our thanks to Sara Iveth Mera Ceballos of the Department of Socio-Economic Standardization of the INEGI, for her support in explaining the INEGI methodology on international migration, as well as the review of the inter-quarterly expansion factors of the ENOE

Mexico Migration OutlookJuly 2012
Page 14
I. Data and methodology for estimating international migrantsThe ENOE1 is a survey in households that the Mexican National Institute of Statistics and Geography (INEGI for its Spanish initials) conducts on a quarterly basis. Its objective is to obtain information on the employment characteristics of the population, as well as other demographic and economic variables for analysis of labor issues. The survey gathers information since 2005 and includes slightly more than 120,000 homes in urban and rural areas.
The survey is designed as a panel, with overlapping blocks of households which are totally renewed after been followed-up over five consecutive quarters, so that in each quarter approximately one fifth of the households interviewed rotate. In the initial interview, the information is collected from the members who at that moment are living in the household, and in the subsequent four quarters, they are asked about new residents (new members of the household, births, returning persons, national and international migrants, among others) and about definite absentees (due to the separation of a member of the household, deaths, national and international migrants) in relation to the information of the first interview.
In addition to gather socioeconomic characteristics of the returning migrants, the ENOE has among its advantages that it is possible to estimate the average time the returnees last to enter into the work force in Mexico, as well as the main characteristics of the jobs they obtain when they return to the country, Nevertheless, similar to other surveys or national census, it does not include the time the immigrants remained outside the country and/or city where they resided abroad, the activity they performed or will perform and other variables related to the migration experience. The survey does not include the date of the arrival or departure of members of the household, which is why, for purposes of this study, the assumption is established that the movement were at the middle of the inter-quarterly period.
To estimate the number of international immigrants or emigrants, the ENOE demographic databases were used from the first quarter of 2005 to the first quarter of 2012, and these were compared based on the information of household residents between adjacent quarters. With the 29 quarterly data-bases, 28 panels were constructed that allow comparing information from one household in one quarter of reference with the immediately previous quarter. Given that the quarterly bases were matched and to maintain national representativeness, the expansion factors of the survey were adjusted.2
1 The ENOE and the National Household of Income and Expenses Survey (ENIGH for its Spanish initials), both conducted by the INEGI are conside-red to be the most important and the most widely used surveys for analyzing information on socioeconomic variables in Mexico. 2 The inter-quarterly population projections were done through the calculation of the population between the quarter of reference and the imme-diately previous quarter using an exponential growth method. Later, using INEGI methodology, the expansion factors were adjusted to maintain the population distribution of each one of the Primary Sampling Unit (PSU) x Area-size blocks.
Graph 12
Population Born in Mexico living in the U.S. without authorization (Millions)
4.0
4.5
5.0
5.5
6.0
6.5
7.0
7.5
00 01 03 05 07 0902 04 06 08 10
Pew Hispanic Center Homeland Security
Source: BBVA Research with figures from Current Population Survey, March supplement (1994-2011)

Mexico Migration OutlookJuly 2012
Page 15
The condition of immigrant or emigrant is estimated with information from two quarters, in this way the maximum additional panels that can be added for one person are three, which implies a follow-up of the socio-economic and employment variables for up to one year. Unlike other studies, in this one, the international migration information was matched with the variable referring to the country of birth to identify the Mexican immigrants and Mexican returnees. In this way, it is possible to know the time that a Mexican returning migrant takes to find a job (or to be employed) when return to Mexico and the characteristics of his first job.
For a better accuracy in the estimates in this study, data were analyzed grouped annually (migration data over four quarters). Thus, the data reported for a specific year are referred to the estimates of the events of international migration movements from February 15 of that year to February 14 of the following year.
Following the indications of the INEGI methodology, the greater part of the results are presented in terms of rates or proportions and we do not generate tabulations or crossed tables that try to infer information beyond what the sub-sample of international Mexican migrants allows.
II. Returning Mexican immigrants. An approach to their volume and characteristics Figures from different official sources, both from Mexico and the U.S., show that there has not been a massive return of Mexican immigrants following the economic crisis and the toughening of migration policy in the U.S.. For example, sources such as the Immigration Survey of the Northern Mexico Border (EMIF Norte for Encuesta de Migración en la Frontera Norte de México) and the ENOE, which allow calculating migration flows on a quarterly basis, do not show levels higher than those prior to the economic crisis.
The ENOE obtains information on persons that enter to live in the country and persons who leave to live in other countries. As indicated previously, the analysis that is presented here in general is based on persons born in Mexico who, as shown in Graphs 13 and 14, represent the greater part of international migration (Table 3).
Table 3
Estimates of entries into Mexico
Source Period Thousands in the
period
Average per year
(thousands)
Description
Homeland Security 2007-2010 340 85 Reduction of Mexican unauthorized
immigrants in the U.S.
Pew Hispanic Center 2007-2010 500 125 Reduction of Mexican unauthorized
immigrants in the U.S-
ENOE2006-2008 1,220 407 Entries of Mexicans from different
countries2009-2011 780 260
EMIF north
2002-2004 1,209 403
Entries from the U.S. 2005-2007 1,023 341
2008-2010 1,087 362
Census *1995-2000 528 106
Entries from different countries2005-2010 1,293 259
* The census obtains information in the middle of the initial year and in the middle of the final year of its period of reference, which is why the annual average must be calculated by dividing by 5 years. Source: BBVA Research based on official figures.

Mexico Migration OutlookJuly 2012
Page 16
Graph 13
Mexico: International Emigrants and Immigrants (Thousands)
Graph 14
Mexico: Mexican Emigrants and Immigrants (Thousands)
1134 1026
816 660
516 403 383 455 440 479 445 369 313 254
-678 -547
-376 -215 -147 -90 -130
-1.000
-750
-500
-250
0
250
500
750
1.000
1.250
2005 2007 2009 2011
MigrantsImmigrants Balance
1090974
793616
465358 333
425 437 403 379 329 264 202
-665-537
-390-236
-137 -94 -131
-1.000
-750
-500
-250
0
250
500
750
1.000
1.250
2005 2007 2009 2011
Emigrantes mexicanos Inmigrantes mexicanos Saldo
Source: BBVA Research, estimates based on the construction of ENOE panels, 2005-2012, with INEGI methodology on international immigrants
Source: BBVA Research, estimates based on the construction of ENOE panels, 2005-2012, with INEGI methodology on international immigrants.
According to the figures of this survey, both the number of emigrants and immigrants has tended to decline. Since before the start of the economic crisis, the number of international Mexican emigrants began to reduced, but it was more evident by 2008, so that from around one million Mexicans who had left the country each year between 2005 and 2006, the figure had dropped by more than half in 2009, and to one third by 2011.
In the years 2005-2011, a reduction is also seen in the inflows of migrants to Mexico. From slightly more than 440,000 migrants to Mexico registered annually between 2005 and 2008, the figure fell to around 300,000 in 2010 and to 250,000 in 2011. That is, Mexican emigration and the number of Mexicans returning home have decreased in recent years, but the number of Mexicans who leave the country continues to be higher than that of those who return.
It is also observed that after the economic crisis, the number of Mexicans who return is lower than that which habitually occurred in the 2005-2007 years. This is also perhaps because fewer Mexicans are emigrating. According to the ENOE, between 2005 and 2007, the net migration flow of those born in Mexico was on average -531,000, whereas in the years 2008 to 2011; this figure is smaller than 150,000.
Graph 15
Returning Mexican Migrants, by Sex (%)
82.2 80.3 81.4 79.6 80.2 77.7 79.5
17.8 19.7 18.6 20.4 19.8 22.3 20.5
0
20
40
60
80
100
2005 2006 2007 2008 2009 2010 2011
Per
cen
tag
e D
istr
ibu
tio
n (%
)
Men Women
Source: BBVA Research, estimates based on the construction of panels of the ENOE, 2005-2012, with the INEGI methodology on international migration.

Mexico Migration OutlookJuly 2012
Page 17
Graph 16
Returning Mexican Migrants by Age Groups (%)
7.9 6.7 6.9 6.9 8.8 8.2 6.2
56.3 57.1 56.1 57.7 52.6 54.6 56.5
24.5 26.9 27.9 25.8 28.7 26.7
22.3
7.4 7.4 7.6 7.7 7.0 8.5 11.3
3.9 1.8 1.5 2.0 2.9 2.0 3.7
0
10
20
30
40
50
60
70
2005 2006 2007 2008 2009 2010 2011
Shar
e o
f to
tal (
%)
0 to 17 18 to 34 35 to 49 50 to 64 65 or over
Source: BBVA Research, estimates based on the construction of ENOE panels, 2005-2012, with the INEGI methodology on international migration
What are the Mexican immigrants who return like? Are they older persons? Are they men? Are they married? Do they have low work qualification?
In general, most of the immigrants who return are male, although the proportion of women has tended to increase. Also they are mostly people of working age; around 80% are in the range between 18 and 45 years of age. Persons younger than 18 represent a low percentage of the returnees, lower than 9% in all the years. Returning immigrants with 65 years old and above also represent a relatively small percentage, but this has tended to increase slightly, by around 2% between 2006 and 2008, to a little less than 4% in 2011. This result is important, being that, on occasion, it is believed that those who return do so at much older ages and, consequently, the social security system in Mexico could be affected negatively due to saturation.
Graph 17
Returning Mexican Migrants, by Marital Status (%)
51.3 51.2 49.2 49.5 45.2
42.0 41.8
32.9 33.1 32.8 33.9 34.6 36.7 36.5
10.6 10.8 12.4 10.4 15.1 14.0
2.8 3.4 3.2 4.1 3.5 13.7
3.4 4.30.5 0.8 0.7 1.4 0.6 2.0 1.6 1.71.9 1.0 1.5 1.0 1.2 1.6
0
10
20
30
40
50
60
2005 2006 2007 2008 2009 2010 2011
Shar
e o
f to
tal (
%)
Married Single Common Law Union Separated Divorced Widowed
Source: BBVA Research, estimates based on the construction of ENOE panels, 2005-2012, with INEGI methodology on international migration.
The ENOE shows that the higher percentage of Mexican immigrants who return are married, a figure that has tended to decrease, while that of single persons has shown a rising trend. The ENOE data have not information to explain this behavior. A first hypothesis is that, in view of the loss of jobs, some single persons who have no family in the United States could opt to return and not assume the costs of waiting to find a job.

Mexico Migration OutlookJuly 2012
Page 18
Graph 18
Returning Mexican Migrants, by Educational Attainment (%)
47.4 51.8
46.4 46.7 41.0 39.2 36.5
31.1 29.9 30.6 31.0 35.5 33.3 34.4
17.3 11.7
16.8 17.2 16.8 21.6 20.4
4.2 6.7 6.2 5.0 6.7 6.0 8.8
0
10
20
30
40
50
60
2005 2006 2007 2008 2009 2010 2011
Shar
e o
f to
tal (
%)
Elementary school Middle school High school University or graduate studies
Source: BBVA Research, estimates based on the construction of ENOE panels for 2005-2012, with INEGI methodology on international migration.
By educational level, the data show that most of the immigrants who return have relatively low educational levels (primary or lower), a situation that coincides with their distribution in the United States, although in most of the educational levels (high school, university or higher), the percentage of those who return has tended to increase; while, in the case of the primary level, it has tended to drop. This result could suggest that for some Mexican immigrants of a lower educational level, it can be relatively less complicated to get a job within the current context in the United States and, due to this, the proportion of Mexicans with a higher educational level who return tends to increase.
Table 4
Mexico: Mexican Immigrants, by Returning Reasons (%)
2005 2006 2007 2008 2009 2010 2011
To rejoin the family 90.7 92.7 90.8 87.9 90.0 88.6 90.8
Work 2.2 2.4 1.6 3.0 2.8 2.3 2.8
Married or engage 1.2 0.5 0.9 0.9 0.4 2.8 1.4
Health problems 1.0 0.7 0.7 1.2 0.4 0.4 1.2
Study 0.9 0.8 0.6 0.7 0.8 0.4 0.8
Other reasons 4.0 3.0 5.4 6.3 5.6 5.4 3.0
Source: BBVA Research, estimates based on construction of the ENOE panels, 2005-2012, with INEGI methodology on international migration
III. The reasons for returning and their integration into the Mexican labor market
What are the reasons for some Mexican immigrants to return?
The reasons for return can be classified in two categories: voluntary and forced. The return is voluntary when the immigrant makes the decision to return because his migratory cycle has ended or because the emigration objectives have failed (Berumen and Santiago, 2011).
The ENOE asked the immigrants who returned about the motives that made them return. Among the options of response are: work, studies, marriage or common law union, separation or divorce, health problems, reuniting with the family, public insecurity and other reasons. In this last classification, those surveyed in some cases mention deportations.

Mexico Migration OutlookJuly 2012
Page 19
Graph 19
Repatriation Events of Mexicans from the United States (Thousands)
853 838 879
1100 1171 1151
791
583 560 525 557 530 528 578 601
469 405
1995 1996 1997 1998 1999 2000 2001 2002 2003 2004 2005 2006 2007 2008 2009 2010 2011
Source: Centro de Estudios Migratorios of the Instituto Nacional de Migración, based on information registered in the official repatriation points and Grupos Beta.
Graph 20
Distribution of Returning Mexican Migrants with 14 years old or above, in terms of belonging to the Economically Active Population (Thousands).
63.9 69.4 67.7 67.7 68.5
63.1 67.5
36.1 30.6 32.3 32.3 31.5
36.9 32.5
0
20
40
60
80
100
2005 2006 2007 2008 2009 2010 2011
Sh
are
of
tota
l (%
)
Economically Active Population Economically Inactive Population
Source: BBVA Research, estimates based on the construction of ENOE panels, 2005-2012, with INEGI methodology on international migration.Economically Active Population (EAP): Persons who during the period of reference is either employed (employed population) or actively seeking employment during the month before the interview (unemployed population)
As seen in the table, the main response options that the ENOE includes are inserted in what could be called voluntary return, and as a secondary option, forced return is included. Perhaps due to this situation, the survey does not seem to gather information from the forced return adequately, since no more than 2.1% of the persons who return declared that it was due to action by the migratory authorities in the countries where they were. This situation can contrast with the figures for repatration events of the Mexico’s National Migration Institute (2012), where it is shown that even though the number of repatriations of Mexicans has tended to decrease since 2001, for 2011 they are still registering slightly more than 405,000 events.
Among the motives for returning that are noted in the ENOE, in first place, at around 90% in most of the years, is rejoining the family, at a much lower percentage, this is followed by work, marriage or common law union and health motives, with less than 3% each one in all the years.

Mexico Migration OutlookJuly 2012
Page 20
Graph 21
Employed Returning Mexican Migrants, according to Placement Time in their First Job Upon Returning to Mexico (%)
72.8
74.4
72.4
69
.0
66
.5
64
.1 73.4
93.
0
92.
9
91.4
89
.3
87.
1
87.
7
90
.8
97.
1
98
.1
95.
7
93.
8
95.
1
94
.9
97.
1
100
.0
99
.5
98
.8
98
.6
99
.7
97.
8
99
.4
0
20
40
60
80
100
2005 2006 2007 2008 2009 2010 2011 e/
Cu
mu
lati
ve P
erce
nt (
%)
Less than 3 months Less than 6 months Less than 9 months Up to 1 year
Source: BBVA Research, estimates based on the construction of ENOE panels, 2005-2012, with INEGI methodology on international migration. e/ estimate
Graph 22
Employed Returning Mexican Immigrants, according to Employment Position in Their First Job Upon Returning to Mexico (%)
57.4 55.8 59.1 56.8 58.5
61.6 63.2
26.4 28.7 22.9 23.5 23.5 20.9 17.3
11.7 12.7 13.1 15.4 13.8 14.6 15.0
4.5 2.9 4.9 4.3 4.2 2.9 4.6
0
10
20
30
40
50
60
70
2005 2006 2007 2008 2009 2010 2011
Shar
e o
f to
tal (
%)
Subordinate employees Self-employed Workers without payment Employers
Source: BBVA Research, estimates based on the construction of ENOE panels, 2005-2012, with INEGI methodology on international migration.
How long do the returning immigrants take to enter the labor market in Mexico?As was shown previously, most of the Mexican immigrants who return are in working age. Around 67% belong to the Economically Active Population (EAP) and of this group close to 70% find work in the first three months of having returned to the country, although between 2008 and 2010, perhaps due to the economic crisis in Mexico, this percentage was slightly lower. Nevertheless, after six months of arriving, approximately 90% of all immigrants have found at least one job; after nine months 96% have already been employed at least once, and almost all of the returning Mexican Immigrants get a job in less than one year.
Most of the Mexican immigrants who have returned to Mexico are employed as subordinate and paid workers and, in second place, are workers self-employed. In recent years, the proportion of this last group has tended to decrease while the first one has increased. It is probable that, although the survey did not reflect it, a large number of those returning is due to the lack of employment in the United States and, consequently, the proportion of immigrants, who arrive with sufficient resources to be self-employed or to be employers, is now lower and, therefore, a greater percentage seek employment as subordinate employees.

Mexico Migration OutlookJuly 2012
Page 21
Graph 23
Employed Returning Mexican Immigrants, according to Sectors of Activity of Their First Job Upon Returning to Mexico (%)
36.9 39.3
36.0 37.1 34.3
37.1 38.9
23.4
15.4
18.9 18.4 24.3 21.7 23.1
11.4
17.9 18.6 18.1 18.9 11.7
18.2 13.8 15.4 11.9 13.0 12.4
15.9
9.1 9.0
14.4 11.7 14.4 12.2 9.8
13.6
0.1 0.2 0.1 1.2 0.3 0.0 1.7
0
10
20
30
40
50
2005 2006 2007 2008 2009 2010 2011
Sh
are
of
tota
l (%
)
Farming Services Construction Manufacturing Retail Others
Source: BBVA Research, estimates based on the construction of ENOE panels, 2005-2012, with INEGI methodology on international migration.
Graph 24
Employed Mexican Immigrants in the United States, according to Sector of Economic Activity (%)
20.4 22.4 24.7
21.5
16.6 16.6 16.6 15.0 16.3 14.5 14.9 16.6 16.6 15.4
16.6 17.8 15.6 15.2 16.1 13.8 15.2
10.9 10.0 10.0 11.0 11.3 12.2 12.0 11.7 10.5 11.2 11.0 11.0 11.5 11.9
6.6 6.8 7.0 7.6 9.3 9.2 10.0
0
10
20
30
2005 2006 2007 2008 2009 2010 2011
Sh
are
of
tota
l (%
)
Construction
Tourism
Manufacturing
Professional and Business Services
Retail
Education and Health Services
Source: BBVA Research, estimates based on the Current Population Survey, March supplement
The sectors to which Mexican immigrants are working upon return, in order of importance, are Farming, Services, Construction, Manufacturing and Retail. It is probable that a high percentage of Mexicans returnees participate in activities different from those they were involved in the places where they were. A sample of this is that in the United States, Mexican immigrant workers are concentrated in the following sectors: Construction, Tourism, Manufacturing, Professional and business services, Retail and Education and health services. The principal sector to which they return (Farming) is not as significant in the U.S. with respect to the proportion of Mexican immigrants who work in these areas.
The income received for work by immigrants who have returned to Mexico is relatively low, at most 35% earn the minimum wage. In contrast, the proportion of those workers who receive more than three minimum wages has been decreasing, by more than 20% in 2005 and 2006, to less than 13% in 2011, a situation that is also related to the weakness of the Mexican economy.

Mexico Migration OutlookJuly 2012
Page 22
Graph 26
Percentage of Employed Returning Mexican Immigrants Who Find Their First Job in the Informal Sector Upon Arriving in Mexico (%)
Graph 27
Percentage of Employed Returning Mexican Immigrants with Health Services in Their First Job Upon Arriving in Mexico (%)
32.2 32.2 33.0 35.8
39.0
29.9
34.8
0
15
30
45
2005 2007 2009 2011
Per
cen
tag
e (%
)
14.5 13.6 15.3 13.4 14.7
12.6
17.5
0
15
30
45
2005 2007 2009 2011
Per
cen
tag
e (%
)
Source: BBVA Research, estimates based on the construction of ENOE panels, 2005-2012, with INEGI methodology on international migration.
Source: BBVA Research, estimates based on the construction of ENOE panels, 2005-2012, with INEGI methodology on international migration.
Graph 25
Employed Returning Mexican Immigrants, according to the Level of Income in Their First Job Upon Returning to Mexico (%)
17.6 20.2 19.1
22.7 21.7 20.2 21.4 17.4
13.1 14.8 11.5 12.2
14.5 14.0
23.2 24.6 22.2
25.4 27.6 27.2
31.3
20.6 22.1 24.3
27.3
17.5 22.3 20.5 17.2
15.0 15.5
9.5
17.8
9.4 8.1
4.0 5.0 4.2 3.6 3.2 6.4
4.7
0
10
20
30
40
2005 2006 2007 2008 2009 2010 2011
Sh
are
of
tota
l (%
)
No income Up to 1 mw + 1 to 2 mw +2 to 3 mw +3 to 5 mw +5 mw
mw: Minimum wage in Mexico. Source: BBVA Research, estimates based on the construction of ENOE panels, 2005-2012, with INEGI methodology on international migration.
In addition to income, a significant fact is that around 80% of those who return do not have benefits, so it is possible that most of the returnees get jobs in the informal economy.
ENOE figures show that between 30% and 39% of those who had returned between 2005 and 2011 got a job in the informal sector; a figure higher than the average at a national level (In 2011 the percentage of the employed population in the informal sector in Mexico was 29%). Undoubtedly, this is a subject for analysis, since many of the immigrants who worked in other countries, even though they were unauthorized, paid taxes, but had no right to any social security services and, upon returning, they do so without pensions, and as the data reveal, without any benefits.

Mexico Migration OutlookJuly 2012
Page 23
IV. Conclusions
After the recent economic crisis in the United States, the growing trend of Mexican immigration to that country that it was showing, mainly since the decade of the 90´s, declined. This situation, in addition to the strengthening of migration policy in the U.S., has led fewer Mexicans to decide to emigrate and live in the U.S.. The number of Mexican immigrants living there has not grown since 2008.
Despite the above, figures from different official sources are not showing that a massive return is taking place. In this article of Mexico Migration Outlook, we use data from the ENOE to estimate the number of Mexican immigrants who have returned in each of the years between 2005 and 2011, as well as some of their socio-demographic and labor characteristics.
The results found are showing that the returning migration, as same as Mexican emigration, has tended to decline. In the 2005-2007 period, about 420,000 Mexican immigrants returned each year, while from 2008 to 2011, the figure fell to fewer than 300,000 on average per year.
Those who return are mainly men. The educational levels of the immigrants who return in general are relatively low (elementary school or lower), a situation that coincides with their distribution in the United States, although recently, Mexican immigrants with higher educational levels are seen among those returning, which could suggest that, within the current context of economic weakness, the search for a job in the U.S by Mexicans with a higher educational level could be getting complicated.
By age groups, most of the returning Mexican immigrants are in working age. In general, upon returning, they are employed as subordinates workers and in a second place as self-employed, a group that in recent years has been decreasing. It is probable that since some of those that have returned is due to a lack of jobs in the United States, today, the percentage of immigrants who arrive with sufficient resources to be self-employed or employer, as had happened before, is much lower.
It has also been found that the immigrants who have returned, in some cases, are assuming different occupations than those that they were engaged in the countries where they were, and that the income they are earning is relatively low and that, in addition, they are entering to the informal sector in a greater proportion than the national average. This is a topic which it is important to analyze in depth, since when immigrants work in other countries, they pay taxes even when they are unauthorized, but have no right to social security benefits, even for the authorized ones who could receive a pension, there is no system that would allow them the possibility of transferring those resources to the social security system back in home.
In the future, it is foreseeable that immigrants who return to Mexico will not increase beyond the levels seen in recent years; as a result of the recovery of employment in the U.S. for Mexican immigrants, a situation that could encourage the emigration of Mexicans and discourage their returning.

Mexico Migration OutlookJuly 2012
Page 24
Bibliography
Alarcón, R., R. Cruz, A. Díaz-Bautista, G. González-König, A. Izquierdo, Yrizar, G., y R. Zenteno (2008), “La crisis financiera en Estados Unidos y su impacto en la migración mexicana”, El Colegio de la Frontera Norte.
Berumen S. y Santiago, J. (2011), “¿Quiénes son los que regresan? Una aproximación al volumen y las características de la migración mexicana de retorno”. Presentation in the 3rd International Immigration Symposium.
Durand, J. (2000) “Origen es Destino: Redes Sociales, Desarrollo Histórico y Escenarios Contemporáneos.” pp. 247-62 in Rodolfo Tuirán, ed., Opciones de Política. Migración. México-Estados Unidos. Secretaría de Gobernación y Secretaría de Relaciones Exteriores
García Zamora, R. (2011), “Migración Cero: Declive de la migración internacional, retorno creciente y lucha presupuestal de los migrantes” Voces ciudadanas, No. 23.
Fundación BBVA Bancomer and BBVA Research (2011a), “Mexico Migration Outlook” BBVA, November 2011
Fundación BBVA Bancomer and BBVA Research (2011b), “Mexico Migration Outlook” BBVA, June 2011
INEGI (2011a) “Censo de Población y Vivienda de 2010”, INEGI
INEGI (2011b) “Censo General de Población y Vivienda de 2000”, INEGI
INEGI (2011c) “Encuesta Nacional de Ocupación y Empleo”, (ENOE) INEGI
INEGI, 2011, Metodología de estimación de migrantes internacionales. Preliminary version of the working document.
Instituto Nacional de Migración (2012) “Series Históricas”.
Somoza, J. (1975) “El Método de Encuesta Demográfica de CELADE”. Systems of Demographic Measurement Data Collection Systems. Laboratories for Population Statistics, Scientific Report Series No. 18. February 1975.

Mexico Migration OutlookJuly 2012
Page 25
4. The contribution of Mexican immigrants to U.S. GDP
Introduction In general, most studies of the economic effects of migration on the countries of origin and destination emphasize the positive effects on the countries of origin and the negative effects on the destination ones. They tend to indicate that the remittances are beneficial for the countries of origin and the countries of destination are affected by the entry of immigrants that displace native born workers’ jobs and by the use of social security and welfare systems.
In previous editions of Mexico Migration Outlook, we have addressed these issues and we have pointed out that migration has benefits and costs for countries that send and receive migrants and that the analyses of the migration phenomenon must be comprehensive. In addition to delving into the effects on migrants’ country of origin, it is also important to study the contribution that immigrants make to the countries of destination. In this article we will analyze the economic contribution that immigrants in general and Mexican immigrants in particular, make to the United States, calculating their contribution to GDP in the 2003-2011 period.
In addition to presenting estimates for the U.S. economy as a whole, we will present approximations for the contribution in some sectors and states where Mexican immigrants have a relevant participation.
Results show that the contribution of Mexican immigrants to U.S. GDP is important. Indeed, there are sectors and states where their contribution to GDP exceeds 10%. Mexican immigrants are undeniably an important driving force for the U.S. economy. Immigrants not only benefit through the income they earn, but the U.S. economy also benefits.
MethodologyAverage Labor Productivity (ALP) represents the contribution that each worker makes on average to total output. One way to estimate the contribution of immigrants to the U.S. economy is by using the methodology of Average Labor Productivity, in which the production of the economy (GDP) is the result of multiplying the ALP by the number of workers (L) involved to obtain this level of output, that is:
The higher the average productivity is, the higher production will be, and as long as the work force grows, while Average Labor Productivity remains constant, production will also increase. The available sources of information provide us with data on the number of Mexicans (including second and third generation) and Mexican immigrants working in the U.S., but we cannot assume that the average productivity of U.S. native-born is equal to Mexicans-Americans and this last ones similar to that of Mexican immigrants. As we know, Mexican immigrants in the U.S., particularly those who are undocumented, are concentrated in labor-intensive sectors, which are less dynamic economically and that, in general, are characterized as of lower value-added compared to the native-born population in the U.S.
According to the methodology proposed by Canales (2009), one way to get a better approximation of average productivity of Mexicans in U.S. and Mexican immigrants is by examining a breakdown of the global production of the economy by sectors of economic activity. If we consider that average labor productivity is largely determined by the conditions of each industry, a better estimation of the productivity of Mexicans and Mexican immigrants in the United States can be obtained.
Furthermore, it might be thought that average productivity, in addition to varying in accordance with

Mexico Migration OutlookJuly 2012
Page 26
the sector of economic activity, might be different in each geographic region. Thus, breaking down the data by sectors of economic activity results in a greater accuracy and confidence in differentiating the average productivity of U.S. native born, immigrants in general, Mexicans in the U.S., and Mexican immigrants.1
Taking into account the above considerations, in the next section we will describe the methodology for estimating the contribution to GDP made by Mexicans in the United States and Mexican immigrants. Subsequently, we will also use this method to calculate information for other U.S. population subgroups.
1. The calculation was based on considering that total U.S. GDP is equivalent to the sum of the output or GDP of each of the sectors or industries. For a greater level of accuracy, we chose to breakdown the GDP in a broad number of sectors of economic activity, based on what the available data would allow. Thus, we identified 54 sectors or industries, each exclusive of each other, which added result the total U.S. GDP.
GDP = GDPi = 1
+ GDPi = 2
+ GDPi = 3
+ · · · + GDP i = 54
Among the major industrial categories that could be broken down to more detail are: Mining, oil and gas extraction; Nondurable goods manufacturing; Durable goods manufacturing; Transportation and warehousing; Real estate and rental and leasing; Administrative and waste management services; Health care and social assistance; Arts, entertainment, and recreation; and Accommodation and food services.
In contrast, a further breakdown was not possible in the categories of: Agriculture, forestry, fishing and related activities; Utilities; Construction; Wholesale trade; Retail trade; Information services; Finance and insurance; Professional, scientific, and technical services; and Government.
2. In each sector or industry, the state in which production takes place can be identified, so the GDP of the economic sector i is calculated as the sum of GDP of each of the states in which this production takes place. In total there are 51 states including the District of Columbia.
GDPi + GDP
i, s = 1 + GDP
i, s = 2 + · · · + GDP
i, s = 51
3. Similarly, it is possible to break down employment on a national level for each industry, and then by states.
L = Li = 1
+ Li = 2
+ Li = 3
+ · · · +Li = 54
Li = L
i, s = 1 + L
i, s =2 + · · · +L
i, s = 51
4. The average productivity of sector i in state s (ALPi, s
) is calculated as output (GDPi, s
) divided by the workforce involved in its production (L
i, s).
GDPi, s
ALPi, s
= L
i, s
5. Thus, the contribution to GDP made by population group g, is estimated by adding for each sector i and each state s, the average labor productivity multiply by its percentage share of the workforce of the population in group g.
GDPg = ����ALP
i, s · L
i,s,g
1 Specifically, the article by Canales (2009) contains a breakdown of U.S. production in 34 sectors of economic activity.
i=1
54
s=1
51

Mexico Migration OutlookJuly 2012
Page 27
Population group g, can be: the total population, Hispanics, Mexicans in the United States, Mexican immigrants, Mexican immigrants with U.S. citizenship, Mexican immigrants without U.S. citizenship, among others.
6. By having two criteria for statistical breakdowns (by state and by industry) in order to estimate the average output per worker, the estimation bias is reduced and an approximation can also be made for the contribution to GDP by population group g, in relation to production in a specific sector or economic activity, or its contribution within a state.
GDPs, g
= ��ALPi, s
· Li,s,g
GDPi, g
= ��ALPi, s
· Li,s,g
Sources of informationThe data on GDP by economic sector and by state were obtained from the Bureau of Economic Analysis (BEA) of the U.S. Department of Commerce. For the calculation of average labor productivity by sector and state, we used employment data from the Current Population Survey (CPS), which are jointly prepared by the U.S. Bureau of Labor Statistics and the Census Bureau. This source allows us to have data on the total employed population of the United States, to know who declared themselves to be Mexican, and those corresponding to Mexican immigrants.
Data were obtained from 2003 to 2011 for both sources of information. In the case of the BEA, cumulative figures of 2011 are only available for the main economic sectors, so for this year data is broken down based on estimates and the results are presented as preliminary.2 For CPS employment data, to get a better estimate of average productivity and output involved in each production process, only those employed and those who reported working in the reference period of the survey were considered. In addition, for purposes of methodological simplicity, only the economic sector of the main job of each person was considered.
The data used come from two different sources of information, the GDP data from BEA estimates, and the employment figures from a survey undertaken by the Bureau of Labor Statistics and the Census Bureau. Thus, each of the calculated values of average productivities are multiplied by the same yearly adjustment factor (af) only in order for the global sum of production to be equal between both sources of information.3 Thus,
ALPi, s, t, adj
= aft · ALP
i, s, t
where t is the subindex to indicate the year from 2003 to 2011.
Given that some data are derived from estimates and from a survey, only calculations are presented for the contribution of immigrants to GDP for the economic sectors and states in which they have a major contribution.
Contribution to U.S. GDPBy using the methodology based on average labor productivity, it was estimated that the contribution of all immigrants to U.S. GDP increased from 14.2% in 2003 to 15.8% in 2011. From 2003 to 2007 and from 2010 to 2011 it can be observed that the immigrants’ GDP participation rate has been growing consistently, except in 2008 and 2009, when it declined due to the effects of the latest economic crisis related to the U.S. subprime mortgages.
i=1
54
s=1
51
2 In 2011, we conducted an Ordinary Least Squares (OLS) estimation with panel data considering the aggregated data for 2011 and reports the Bureau of Economic Analysis. 3 For example, the adjustment factor for 2003 was 1.019987418.

Mexico Migration OutlookJuly 2012
Page 28
The contribution to U.S. GDP by Mexican immigrants, which includes both those who have work permits as well as those who do not, presents a similar behavior, at least before and during the crisis. In 2003, Mexican immigrants contributed with about 3.8% of U.S. GDP, growing each year to reach a historic high in 2007, at 4.1%. In 2009, following the effects of the crisis, the Mexican immigrants’ participation rate declined to 3.8% of GDP, below the figure reported in 2003, while the fall in the participation rate by total immigrants was not as pronounced. In addition, the contribution to GDP by total immigrants was on the rise in 2010 and 2011, while for Mexican immigrants there has been an increase, but not showing a clear recovery trend. This could be associated with the phenomenon that while immigration flows for the major immigrants groups have recovered in most cases, this has not been the case with Mexican immigrants, as can be seen in the first article of this publication.
The data could suggest that if the crisis had not occurred, the contribution of immigrants to U.S. GDP, including Mexican immigrants, would have grown year by year, at least from 2003 to 2011. Furthermore, this information gives us an idea of the possible effects of an economic crisis in a host nation on immigrants already in the country and migration to it.
The decrease in the contribution of immigrants to GDP between 2008 and 2009 could be due to two factors: 1) a lower participation of this group in the work force, due to an increase in unemployment, 2) a substitution effect that would lead immigrants to be employed in other economic activities, which could be marked by lower productivity compared to previous work, given the need to obtain employment.
Graph 28
Estimates of the contribution to U.S. GDP (% of total GDP)
14.2 14.7 15.3 15.6 16.1 15.4 14.9 15.3 15.8
7.7 7.4 7.7 8.0 8.0 8.0 7.7 7.9 7.9
3.7 3.8 3.9 4.0 4.1 3.9 3.6 3.8 3.8
0
5
10
15
20
2003 2004 2005 2006 2007 2008 2009 2010 2011p
Pe
rce
nta
ge
(%
)
Total immigrants Mexicans (including 2nd and 3rd generations) Mexican immigrants
p / Preliminary data Source: BBVA Research with CPS data, March supplement and Bureau of Economic Analysis, 2003-2011.
When we analyzed Mexicans as a whole group, including immigrants born in Mexico and those of Mexican descent born in the United States or another country that still identify themselves as Mexicans in the CPS and reside in the U.S., it can be seen that between 2006 and 2008 their contribution to GDP stabilized at 8.0%, with a slight decline in 2009. But for 2010 and 2011, it returned almost to the levels registered before the crisis.
What are the sectors of economic activity that Mexican immigrants most contribute to?If all workers had similar levels of productivity it should be the case that the percentage of a specific employed population group in the total number of workers should be similar to their contribution to the total economy. As has already been noted, Mexican immigrants’ contribution to the U.S. economy was between 3.7% and 4.1% in the 2003-2011 period. However, the number of employed workers involved in the economy represents between 4.3% and 5.1% of U.S. workforce in the same period.

Mexico Migration OutlookJuly 2012
Page 29
Thus, the median productivity of a Mexican immigrant is on average 21.5% lower than the national average in the United States and 16.8% below that the average for immigrants as a whole in that country. Mexican immigrants are employed in economic sectors with median productivity lower than the national average. Given that the output of an economy is equivalent when measured by salaries and wages, this tells us that Mexican immigrants earn less than the U.S. national average.
For the period in question, 2003-2011, it can be seen that for Mexicans in the United States (including immigrants and 2nd and 3rd generation Mexicans in the U.S.) showed a declining productivity trend, although in the past two years they have narrowed the gap. But it is important to note that an average immigrant in the United States posts an average level of productivity higher than Mexicans’ one in the United States (including immigrants and non-immigrants). Most likely this is due to the low educational levels of both Mexican immigrants and 2nd and 3rd generation Mexicans in the United States, which limits their access to better job opportunities4 and leads to their being employed in sectors of economic activity with lower average productivity and less income.
Table 5
Employed population and contribution to U.S. GDP of immigrants, selected groups
Category 2003 2004 2005 2006 2007 2008 2009 2010 2011p
Immigrants in the U.S.
Employed population* 19,986.0 20,695.4 21,399.5 22,169.7 23,350.6 23,022.0 21,878.0 22,244.7 22,535.1
% of total 15.1 15.6 15.8 16.2 16.7 16.4 16.2 16.6 16.8
Gross Domestic Product (GDP) ** 1,583.8 1,743.1 1,935.1 2,090.9 2,263.0 2,199.5 2,076.2 2,227.5 2,385.2
% contribution to GDP 14.2 14.7 15.3 15.6 16.1 15.4 14.9 15.3 15.8
Average Labor Productivity (ALP)*** 93.9 94.4 96.7 96.5 96.7 93.8 91.8 92.1 94.3
Mexicans in the U.S. (Mexican immigrants and 2nd and 3rd generation Mexicans)
Employed population* 10,893.9 11,063.9 11,567.8 11,961.1 12,521.4 12,571.3 12,233.5 12,254.5 12,297.1
% of total 8.3 8.3 8.6 8.7 8.9 9.0 9.1 9.2 9.1
Gross Domestic Product (GDP) ** 855.5 876.3 975.4 1,073.4 1,127.8 1,147.8 1,071.4 1,144.6 1,199.3
% contribution to GDP 7.7 7.4 7.7 8.0 8.0 8.0 7.7 7.9 7.9
Average Labor Productivity (ALP)*** 93.0 88.8 90.2 91.8 89.9 89.7 84.7 85.9 86.9
Mexican immigrants in the U.S.
Employed population* 5,709.7 6,090.6 6,391.8 6,612.6 7,071.4 6,868.5 6,511.3 6,654.4 6,544.7
% of total 4.3 4.6 4.7 4.8 5.1 4.9 4.8 5.0 4.9
Gross Domestic Product (GDP) ** 417.4 453.5 489.5 531.3 576.1 556.1 508.5 555.3 576.5
% contribution to GDP 3.7 3.8 3.9 4.0 4.1 3.9 3.6 3.8 3.8
Average Labor Productivity (ALP)*** 86.6 83.5 81.9 82.2 81.3 79.5 75.5 76.8 78.5
* Figure in thousands ** Billions of U.S. dollars at current prices *** Indexed value 100 = U.S. National ALP p / Preliminary data Source: BBVA Research with data from the CPS March supplement, and the Bureau of Economic Analysis, 2003-2011.
4 In an article by Shultz and Hanushek (2012), they indicated that an important factor that is affecting the income distribution in the United States and which will remain as topic for discussion in the coming decades in that country is the low educational level of native born Hispanics. They note that in California, 43% of Hispanic students did not complete high school and only 10% attained a collage degree between 2005 and 2009.
When we analyze the contribution to U.S. GDP by sector of economic activity, it can be noted that even though less than 5% of Mexican immigrants workforce are engaged in Agriculture, forestry or fishing, they contribute to about 18% of US GDP in this sector, that is, almost one fifth of the national value added in U.S. agriculture comes from the work of Mexican immigrant, and it is the economic sector where they made their greatest contribution to U.S. between 2003-2011.
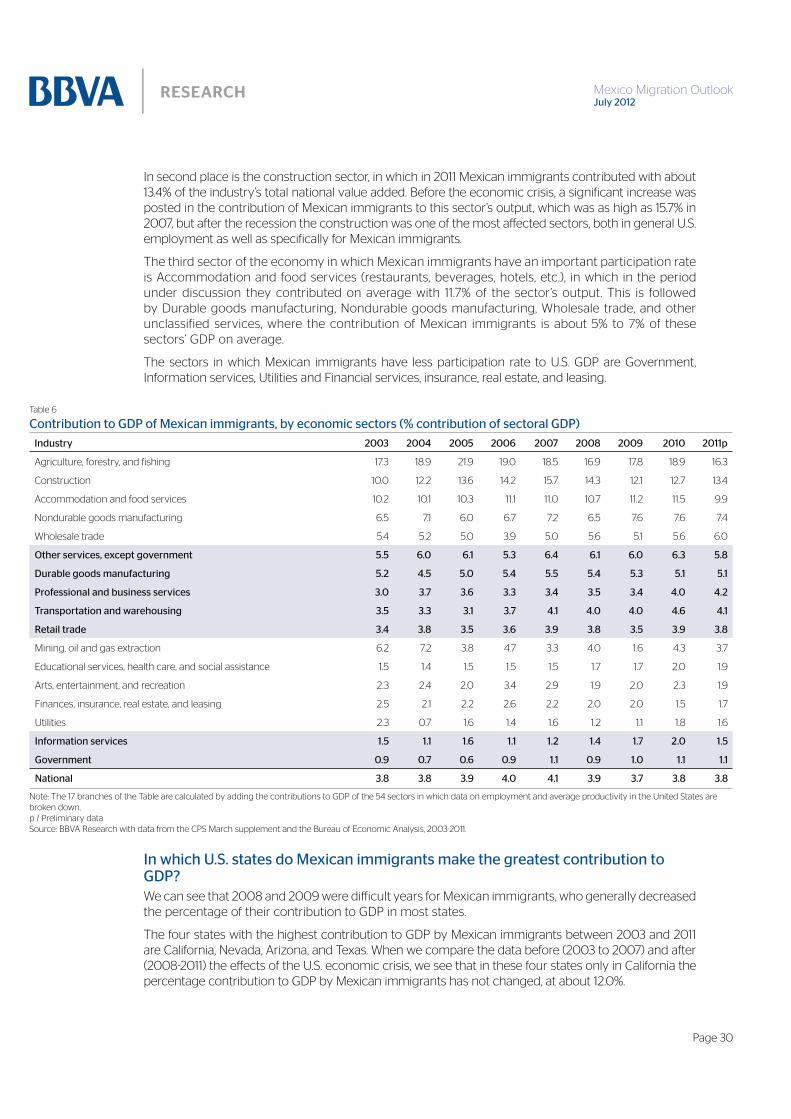
Mexico Migration OutlookJuly 2012
Page 30
In second place is the construction sector, in which in 2011 Mexican immigrants contributed with about 13.4% of the industry’s total national value added. Before the economic crisis, a significant increase was posted in the contribution of Mexican immigrants to this sector’s output, which was as high as 15.7% in 2007, but after the recession the construction was one of the most affected sectors, both in general U.S. employment as well as specifically for Mexican immigrants.
The third sector of the economy in which Mexican immigrants have an important participation rate is Accommodation and food services (restaurants, beverages, hotels, etc.), in which in the period under discussion they contributed on average with 11.7% of the sector’s output. This is followed by Durable goods manufacturing, Nondurable goods manufacturing, Wholesale trade, and other unclassified services, where the contribution of Mexican immigrants is about 5% to 7% of these sectors’ GDP on average.
The sectors in which Mexican immigrants have less participation rate to U.S. GDP are Government, Information services, Utilities and Financial services, insurance, real estate, and leasing.
Table 6
Contribution to GDP of Mexican immigrants, by economic sectors (% contribution of sectoral GDP)
Industry 2003 2004 2005 2006 2007 2008 2009 2010 2011p
Agriculture, forestry, and fishing 17.3 18.9 21.9 19.0 18.5 16.9 17.8 18.9 16.3
Construction 10.0 12.2 13.6 14.2 15.7 14.3 12.1 12.7 13.4
Accommodation and food services 10.2 10.1 10.3 11.1 11.0 10.7 11.2 11.5 9.9
Nondurable goods manufacturing 6.5 7.1 6.0 6.7 7.2 6.5 7.6 7.6 7.4
Wholesale trade 5.4 5.2 5.0 3.9 5.0 5.6 5.1 5.6 6.0
Other services, except government 5.5 6.0 6.1 5.3 6.4 6.1 6.0 6.3 5.8
Durable goods manufacturing 5.2 4.5 5.0 5.4 5.5 5.4 5.3 5.1 5.1
Professional and business services 3.0 3.7 3.6 3.3 3.4 3.5 3.4 4.0 4.2
Transportation and warehousing 3.5 3.3 3.1 3.7 4.1 4.0 4.0 4.6 4.1
Retail trade 3.4 3.8 3.5 3.6 3.9 3.8 3.5 3.9 3.8
Mining, oil and gas extraction 6.2 7.2 3.8 4.7 3.3 4.0 1.6 4.3 3.7
Educational services, health care, and social assistance 1.5 1.4 1.5 1.5 1.5 1.7 1.7 2.0 1.9
Arts, entertainment, and recreation 2.3 2.4 2.0 3.4 2.9 1.9 2.0 2.3 1.9
Finances, insurance, real estate, and leasing 2.5 2.1 2.2 2.6 2.2 2.0 2.0 1.5 1.7
Utilities 2.3 0.7 1.6 1.4 1.6 1.2 1.1 1.8 1.6
Information services 1.5 1.1 1.6 1.1 1.2 1.4 1.7 2.0 1.5
Government 0.9 0.7 0.6 0.9 1.1 0.9 1.0 1.1 1.1
National 3.8 3.8 3.9 4.0 4.1 3.9 3.7 3.8 3.8
Note: The 17 branches of the Table are calculated by adding the contributions to GDP of the 54 sectors in which data on employment and average productivity in the United States are broken down. p / Preliminary data Source: BBVA Research with data from the CPS March supplement and the Bureau of Economic Analysis, 2003-2011.
In which U.S. states do Mexican immigrants make the greatest contribution to GDP?We can see that 2008 and 2009 were difficult years for Mexican immigrants, who generally decreased the percentage of their contribution to GDP in most states.
The four states with the highest contribution to GDP by Mexican immigrants between 2003 and 2011 are California, Nevada, Arizona, and Texas. When we compare the data before (2003 to 2007) and after (2008-2011) the effects of the U.S. economic crisis, we see that in these four states only in California the percentage contribution to GDP by Mexican immigrants has not changed, at about 12.0%.

Mexico Migration OutlookJuly 2012
Page 31
Arizona is probably the state that has posted the greatest drop in the contribution of Mexican immigrants to GDP, from 11.8% on average before the crisis to 8.6% after. In Nevada and Texas, before the effects of the crisis the Mexican immigrants’ contribution to state GDP was, on average, 10.0%, and following the crisis it fell on average to 8.5% and 8.7% respectively. Other states where there were also significant decreases in the contribution to U.S. GDP by Mexican immigrants were Colorado and Utah. In addition to the effect of the crisis, anti-immigrant policies in some of these states may also have had an impact on the decline.
Idaho, Washington, and New Jersey were the states with the largest increases in percentage point contribution to GDP by Mexican immigrants in comparing the data before and after the effects of the crisis, with the variations being up to more than a one percentage point in some cases. Other states where in recent years there have also been increases in the participation rate of Mexican immigrants to GDP are South Carolina and Virginia, although more moderately.
Table 7
The 15 states with the great contribution to state GDP by Mexican immigrants (% of state GDP)
Ranking State 2003 2004 2005 2006 2007 2008 2009 2010 2011p
1 California 11.4 11.3 11.9 12.4 13.0 11.9 11.9 12.5 12.2
2 Nevada 10.0 8.1 9.9 10.1 11.7 8.9 7.0 8.1 10.1
3 Arizona 10.7 11.4 11.5 14.2 11.0 8.4 7.7 8.6 9.8
4 Texas 10.9 10.5 9.8 9.4 9.5 8.8 8.2 8.8 9.1
5 Idaho 2.4 3.3 3.4 3.0 3.5 4.0 4.2 3.1 5.0
6 New Mexico 6.3 5.5 5.2 5.4 3.9 5.6 7.3 5.3 4.8
7 Illinois 5.4 5.4 5.4 4.4 5.2 5.2 5.3 5.1 4.6
8 Washington 2.6 3.1 2.3 1.8 2.5 2.4 2.7 4.1 4.2
9 New Jersey 0.5 1.5 0.8 1.6 1.3 2.6 1.4 1.4 3.8
10 Colorado 5.1 4.4 5.0 4.8 3.3 4.4 2.8 3.6 3.7
11 Nebraska 2.0 2.1 2.7 3.0 2.1 2.2 3.1 1.8 2.9
12 Kansas 2.4 2.0 1.5 2.3 1.9 2.2 1.9 3.0 2.8
13 Georgia 2.5 2.4 3.1 3.5 3.6 3.3 2.2 2.7 2.6
14 Utah 3.5 3.6 2.3 3.2 4.5 3.9 2.6 2.7 2.5
15 South Carolina 0.3 0.8 1.1 1.2 1.3 1.4 0.8 1.1 2.3
National 3.8 3.8 3.9 4.0 4.1 3.9 3.7 3.8 3.8
p / Preliminary data Source: BBVA Research with data from the CPS March supplement and the Bureau of Economic Analysis, 2003-2011.
ConclusionsIn this article of Mexico Migration Outlook, by using the methodology based on Average Labor Productivity (ALP), we estimated the contribution of Mexican immigrants to U.S. total GDP. Between 2003 and 2011, it was found that the contribution of Mexican immigrants was from 3.6% to 4.1% of U.S. GDP. It should be taken into account that estimates only consider the direct contribution of Mexican immigrants to U.S. GDP, as there may be indirect contributions for which quantification is not as easy to measure.
In comparing average productivities, it was estimated that the median productivity of Mexican immigrants is 21.5% below the national average. In addition, Mexicans in the U.S., which include immigrants and Mexican Americans who identify as Mexicans, have an average productivity that is lower than the average for the immigrant population as a whole.

Mexico Migration OutlookJuly 2012
Page 32
This is correlated with the low educational level of both Mexican immigrants as well as 2nd and 3rd generation Mexicans, which limits their job opportunities and results in their being employed in sectors with low average productivity and lower pay scales.
Perhaps this could explain why the economic sectors in which Mexican immigrants make the largest contribution to GDP are Agriculture, forestry, and fishing (18.4% on average between 2003 and 2011); Construction (13.1%); and Accommodation and food services (10.7%).
In analyzing the data at state level, we can see that 2008 and 2009 were difficult years for Mexican immigrants, since their contribution to GDP in most states declined. In many of the states in which Mexican immigrants made an important contribution to GDP, their participation rate decreased, while in other “non-traditional” states, Mexican immigrants increased their participation in local output. Thus, it can be seen that the state concentration of the Mexican immigrant work force has become more dispersed in the period during and after the crisis (2008-2011).
Bibliography Bureau of Economic Analysis (BEA). http://www.bea.gov
Bureau of Labor Statistics (BLS). http://www.bls.gov
Canales, Alejandro I. (2009). “Migración internacional y desarrollo. Evidencias del aporte de los mexicanos a la economía de Estados Unidos” in El estado de la migración, Las políticas públicas ante los retos de la migración mexicana a Estados Unidos, CONAPO
Canales, Alejandro I. Contribución de los migrantes latinoamericanos al PIB de los Estados Unidos de América, SIMDE-Universidad Autónoma de Zacatecas
Census Bureau. http://www.census.gov
Shultz, George P. and Eric A. Hanushek (2012). Education Is the Key to a Healthy Economy, The Wall Street Journal, April 30th, 2012.

Mexico Migration OutlookJuly 2012
Page 33
Annual Inflow of Remittances (Billions of Dollars)2000 2001 2002 2003 2004 2005 2006 2007 2008 2009 2010e 2011p 2012p
World 131.5 149.5 169.2 204.2 237.0 274.9 317.9 385.0 443.2 416.0 440.1 464.0 499.0
Developed countries 50.2 54.6 58.2 66.8 77.7 82.8 91.1 106.5 118.4 108.9 114.6 118.0 125.0
Developing countries 81.3 94.9 111.0 137.4 159.3 192.1 226.7 278.5 324.8 307.1 325.5 346.0 374.0
East Asia and Pacific 15.8 21.0 27.0 32.3 40.0 50.3 57.4 71.1 85.5 85.7 91.2 98.0 106.0
South Asia 17.2 19.2 24.1 30.4 28.7 33.9 42.5 54.0 71.6 74.9 82.6 87.0 92.0
Latin America and the Caribbean 20.2 24.4 28.2 36.8 43.4 50.1 59.2 63.3 64.6 56.9 58.1 62.0 69.0
Europe and Central Asia 10.4 10.3 10.7 11.6 16.0 23.3 28.4 39.3 45.8 35.4 36.7 39.0 43.0
Middle East and North Africa 13.1 15.3 15.9 20.5 23.2 25.1 26.5 32.1 35.9 33.7 35.5 37.0 40.0
Sub-Saharan Africa 4.6 4.7 5.1 6.0 8.0 9.4 12.7 18.6 21.4 20.6 21.5 23.0 24.0
e: WorldBank estimatedp: WorldBank forecastSource: BBVA Research with figures from WorldBank
Immigration to the United States (Millons)1999 2000 2001 2002 2003 2004 2005 2006 2007 2008 2009 2010 2011
Total population 271.7 274.1 276.5 282.1 285.9 288.3 291.2 293.8 296.8 299.1 301.5 304.3 306.1
Immigrants 28.4 30.3 31.8 34.4 35.7 36.7 37.4 37.9 39.5 39.6 38.9 39.9 40.5
By sex
Men 14.1 15.1 15.9 17.3 17.9 18.4 18.9 19.1 19.9 19.9 19.4 20.0 20.1
Women 14.3 15.2 15.9 17.1 17.8 18.3 18.5 18.8 19.6 19.7 19.5 19.9 20.4
By age group
Under 15 23.2 24.7 26.0 28.5 29.5 30.4 30.9 31.4 32.8 32.7 32.2 32.9 33.4
Between 15 and 64 2.0 2.3 2.4 2.5 2.4 2.5 2.6 2.4 2.5 2.4 2.1 2.2 2.0
Over 64 3.2 3.3 3.4 3.4 3.8 3.8 3.9 4.1 4.2 4.5 4.6 4.8 5.1
By region of origen
Latin America & the Caribbean 13.9 14.9 15.5 17.5 18.4 18.9 19.4 19.7 20.7 20.5 20.3 20.9 21.0
Asia and Oceania 7.7 7.8 8.1 8.8 9.2 9.5 9.8 10.1 10.6 10.9 10.9 11.0 11.4
Europe 5.1 5.2 5.3 5.4 5.4 5.6 5.4 5.2 5.5 5.6 5.4 5.5 5.6
África 0.5 0.7 0.9 0.8 0.8 0.8 0.9 1.2 1.2 1.5 1.5 1.7 1.6
Canada 0.8 0.9 1.0 0.9 0.9 0.8 0.8 0.8 0.9 0.8 0.7 0.8 0.8
Not specified 0.4 0.8 1.0 1.0 1.0 1.1 1.1 0.9 0.6 0.3 0.1 0.0 0.1
Source: BBVA Research estimations from Current Population Survey (CPS).
5. Statistical Appendix
Table 8
International Migrants by Region of Destination (Millons)Total Women Men
1990 1995 2005 2010 1990 1995 2005 2010 1990 1995 2005 2010
World 155.5 166.0 195.2 213.9 76.4 81.8 96.1 104.8 79.1 84.2 99.2 109.1
Developed countries 82.4 94.1 117.2 127.7 42.8 48.7 60.5 65.7 39.6 45.5 56.7 62.0
Developing countries 73.2 71.8 78.1 86.2 33.6 33.1 35.6 39.1 39.6 38.7 42.5 47.2
North America 27.8 33.6 45.6 50.0 14.2 17.1 23.0 25.1 13.6 16.5 22.6 25.0
Latin America and the Caribbean 7.1 6.2 6.9 7.5 3.5 3.1 3.4 3.7 3.6 3.1 3.4 3.7
Europe 49.4 54.7 64.4 69.8 26.0 28.7 33.8 36.5 23.4 26.0 30.6 33.3
África 16.0 17.9 17.7 19.3 7.4 8.4 8.3 9.0 8.6 9.5 9.4 10.3
Asia 50.9 48.8 55.1 61.3 23.1 22.1 24.8 27.3 27.8 26.7 30.3 34.0
Oceanía 4.4 4.7 5.5 6.0 2.1 2.4 2.8 3.1 2.2 2.4 2.7 2.9
Source: BBVA Research with figures from United Nations Population Division

Mexico Migration OutlookJuly 2012
Page 34
Table 9
Labor situation of Hispanics and Mexicans in the U.S. (Figures in Thousands)
2009 2010 2011 2012
II III IV I II III IV I II III IV I
Total population*
Pop. 16 years old & over 235,459 236,093 236,739 236,996 237,506 238,104 238,712 238,851 239,316 239,871 240,431 242,437
Civilian labor force 154,811 154,235 153,544 153,707 154,132 153,913 153,788 153,314 153,510 153,679 153,960 154,658
Employed 137,656 137,544 138,273 138,667 139,261 139,273 139,077 139,549 139,607 139,770 140,567 141,912
Unemployed 14,352 14,895 15,406 15,040 14,871 14,640 14,711 13,766 13,903 13,908 13,393 12,746
Labor force participation rate 65.7 65.3 64.9 64.9 64.9 64.6 64.4 64.2 64.1 64.1 64.0 63.8
Unemployment rate 9.3 9.7 10.0 9.8 9.6 9.5 9.6 9.0 9.1 9.1 8.7 8.2
Hispanics*
Pop. 16 years old & over 32,754 33,018 33,291 33,333 33,579 33,837 34,101 34,078 34,312 34,555 34,805 36,383
Civilian labor force 22,403 22,435 22,487 22,645 22,699 22,796 22,852 22,639 22,790 22,910 23,248 24,127
Employed 19,688 19,585 19,586 19,800 19,893 20,011 19,917 20,006 20,117 20,324 20,625 21,593
Unemployed 2,716 2,850 2,901 2,845 2,806 2,785 2,935 2,633 2,673 2,586 2,624 2,534
Labor force participation rate 68.4 67.9 67.5 67.9 67.6 67.4 67.0 66.4 66.4 66.3 66.8 66.3
Unemployment rate 12.1 12.7 12.9 12.6 12.4 12.2 12.8 11.6 11.7 11.3 11.3 10.5
Hispanics
Pop. 16 years old & over 32,754 33,018 33,291 33,333 33,579 33,837 34,101 34,078 34,312 34,555 34,806 36,383
Civilian labor force 22,340 22,508 22,528 22,581 22,637 22,886 22,890 22,557 22,733 23,008 23,292 24,075
Employed 19,751 19,680 19,713 19,526 19,942 20,139 20,016 19,729 20,163 20,459 20,724 21,368
Unemployed 2,589 2,828 2,815 3,055 2,695 2,747 2,874 2,829 2,570 2,549 2,568 2,707
Labor force participation rate 68.2 68.2 67.7 67.7 67.4 67.6 67.1 66.2 66.3 66.6 66.9 66.2
Unemployment rate 11.6 12.6 12.5 13.5 11.9 12.0 12.6 12.5 11.3 11.1 11.0 11.2
Mexicans
Pop. 16 years old & over 21,006 20,716 20,913 21,284 21,183 21,170 21,432 21,249 21,315 21,731 21,781 22,586
Civilian labor force 14,349 14,140 14,168 14,468 14,322 14,361 14,462 14,117 14,149 14,524 14,651 15,026
Employed 12,671 12,350 12,398 12,471 12,642 12,745 12,632 12,285 12,558 12,935 13,011 13,258
Unemployed 1,678 1,790 1,771 1,997 1,680 1,616 1,831 1,832 1,591 1,589 1,639 1,768
Labor force participation rate 68.3 68.3 67.7 68.0 67.6 67.8 67.5 66.4 66.4 66.8 67.3 66.5
Unemployment rate 11.7 12.7 12.5 13.8 11.7 11.3 12.7 13.0 11.2 10.9 11.2 11.8
U.S.-born Mexicans
Pop. 16 years old & over 9,976 9,623 10,031 10,493 10,211 9,911 10,363 10,339 10,498 10,574 10,742 11,515
Civilian labor force 6,596 6,287 6,417 6,818 6,582 6,432 6,629 6,518 6,727 6,843 6,897 7,359
Employed 5,760 5,387 5,543 5,907 5,677 5,546 5,698 5,615 5,864 5,946 6,000 6,430
Unemployed 836 899 873 912 904 886 930 904 863 896 897 929
Labor force participation rate 66.1 65.3 64.0 65.0 64.5 64.9 64.0 63.0 64.1 64.7 64.2 63.9
Unemployment rate 12.7 14.3 13.6 13.4 13.7 13.8 14.0 13.9 12.8 13.1 13.0 12.6
Mexican immigrants
Pop. 16 years old & over 11,031 11,093 10,882 10,791 10,971 11,258 11,059 10,910 10,817 11,157 11,039 11,071
Civilian labor force 7,753 7,853 7,752 7,650 7,740 7,929 7,834 7,599 7,422 7,681 7,754 7,667
Employed 6,911 6,963 6,854 6,564 6,965 7,198 6,934 6,670 6,694 6,989 7,011 6,828
Unemployed 841 891 897 1,085 776 731 900 928 728 693 743 839
Labor force participation rate 70.3 70.8 71.2 70.9 70.5 70.4 70.8 69.6 68.6 68.9 70.2 69.3
Unemployment rate 10.9 11.3 11.6 14.2 10.0 9.2 11.5 12.2 9.8 9.0 9.6 10.9
* Seasonally Adjusted Source: BBVA Research with figures from Bureau of Labor Statistics and estimations from Current Population Survey (CPS), 2006-2012

Mexico Migration OutlookJuly 2012
Page 35
Table 10
Mexican Immigrants in the United States
1997 1998 1999 2000 2001 2002 2003 2004 2005 2006 2007 2008 2009 2010 2011
Total Mexicans in the U.S.
(Millions) n.a. n.a n.a 23.2 24.0 25.5 26.7 26.9 28.1 29.3 30.3 30.7 31.7 32.3 32.5
Mexican immigrants 7.3 7.4 7.4 8.1 8.5 9.9 10.2 10.7 11.0 11.1 11.8 11.8 11.9 11.9 11.6
2nd & 3rd generation n.a n.a n.a 14.4 14.9 16.0 16.8 16.6 17.5 18.2 18.5 18.9 19.8 20.4 20.9
Demographic characteristics of Mexican immigrants
Sex (%) 100.0 100.0 100.0 100.0 100.0 100.0 100.0 100.0 100.0 100.0 100.0 100.0 100.0 100.0 100.0
Men 55.9 54.6 54.4 53.9 54.1 55.4 55.1 55.2 55.4 55.2 56.0 55.5 55.0 55.1 53.9
Women 44.1 45.4 45.6 46.1 45.9 44.6 44.9 44.8 44.6 44.8 44.0 44.5 45.0 44.9 46.1
Age groups (%) 100.0 100.0 100.0 100.0 100.0 100.0 100.0 100.0 100.0 100.0 100.0 100.0 100.0 100.0 100.0
From 0 to 14 years old 10.3 9.7 8.0 9.4 9.3 9.1 8.6 8.6 8.6 7.7 7.3 6.6 6.1 5.5 5.3
From 15 to 29 years old 35.1 33.2 33.2 32.6 31.4 33.1 31.9 32.3 31.3 30.2 28.6 27.9 25.8 25.0 24.3
From 30 to 44 years old 33.9 35.8 36.2 36.1 35.6 36.9 37.5 37.4 37.0 37.3 38.1 37.9 38.0 38.7 37.6
From 45 to 64 years old 16.4 16.6 17.4 17.3 18.8 16.8 17.4 17.3 18.6 20.1 20.8 22.1 24.2 25.0 26.6
From 65 years or over 4.3 4.7 5.3 4.6 4.9 4.1 4.6 4.4 4.5 4.7 5.1 5.5 5.9 5.9 6.3
Average age (years) 33.1 33.8 34.5 33.9 34.4 33.6 34.3 34.2 34.5 35.2 35.2 35.8 36.7 37.2 38.6
State of residence (%) 100.0 100.0 100.0 100.0 100.0 100.0 100.0 100.0 100.0 100.0 100.0 100.0 100.0 100.0 100.0
California 46.8 46.3 46.2 47.8 44.5 42.5 39.3 38.3 42.1 39.5 39.5 40.2 39.7 39.9 38.2
Texas 21.1 21.5 21.4 19.0 21.0 20.3 23.0 21.4 20.3 19.4 19.2 19.5 20.3 20.0 22.5
Illinois 5.8 6.5 6.3 5.8 5.5 4.9 6.5 5.5 5.5 4.7 5.3 5.2 5.4 5.3 5.6
Arizona 6.8 6.7 6.4 5.3 4.7 5.6 6.0 6.2 5.5 6.4 5.7 5.8 5.0 5.1 5.0
North Carolina 0.9 0.8 1.1 1.4 1.5 1.6 1.6 2.6 2.0 2.5 2.2 1.9 1.7 2.2 2.0
Florida 1.5 1.4 2.1 2.4 3.0 3.5 2.2 2.0 2.4 2.8 3.3 2.5 2.1 2.1 1.9
Georgia 0.2 0.4 1.0 0.7 1.0 1.3 1.5 2.0 2.2 2.8 2.4 2.1 2.3 2.1 1.9
Nevada 1.3 1.1 1.5 2.0 1.7 1.8 1.8 1.6 1.9 1.8 1.9 2.0 1.6 1.7 1.9
Washington 1.6 0.7 1.0 1.4 1.1 1.3 1.5 1.9 1.0 1.0 1.4 1.4 1.5 1.9 1.8
New York 2.2 2.9 2.4 1.8 2.1 2.3 1.8 1.7 1.1 1.9 2.0 1.7 1.8 1.8 1.8
New Jersey 0.9 0.3 0.2 0.4 0.5 0.8 0.6 1.0 0.8 1.2 0.8 1.8 1.3 1.6 1.8
Colorado 2.1 1.2 1.2 2.3 1.9 2.5 2.5 2.3 2.2 2.4 2.0 2.2 1.6 1.7 1.8
New Mexico 1.4 1.2 1.3 1.0 1.1 1.1 1.1 0.8 1.1 1.1 0.9 1.0 1.1 1.0 1.0
Other states 7.5 9.1 7.8 8.6 10.3 10.4 10.5 12.6 12.0 12.6 13.3 12.7 14.8 13.6 12.7
Period of entry (%) 100.0 100.0 100.0 100.0 100.0 100.0 100.0 100.0 100.0 100.0 100.0 100.0 100.0 100.0 100.0
Before 1975 20.4 19.6 19.9 17.3 15.5 13.5 13.5 12.3 11.8 10.6 10.3 10.6 10.7 10.3 9.7
From 1975 to 1985 29.6 28.4 28.1 24.4 22.6 20.9 20.9 19.0 16.6 17.0 15.9 15.9 15.7 15.3 15.3
From 1986 to 1995 49.9 44.3 39.8 39.2 36.9 35.8 35.8 30.2 29.7 28.9 28.3 27.4 26.6 27.4 27.1
From 1996 to 2007 0.0 7.7 12.2 19.1 25.0 29.9 29.9 38.5 41.9 43.6 45.5 44.0 44.2 42.8 43.0
2008 onwards n.a. n.a. n.a. n.a. n.a. n.a. n.a. n.a. n.a. n.a. n.a. 2.1 2.9 4.2 4.9
Continued on next page

Mexico Migration OutlookJuly 2012
Page 36
1997 1998 1999 2000 2001 2002 2003 2004 2005 2006 2007 2008 2009 2010 2011
Mobility condition in the last
year (%) 100.0 100.0 100.0 100.0 100.0 100.0 100.0 100.0 100.0 100.0 100.0 100.0 100.0 100.0 100.0
Non-migrants 91.8 94.5 92.0 91.6 91.9 91.2 92.3 93.2 89.7 93.1 94.9 95.5 95.6 96.3 97.2
Internal migrants1 4.6 3.3 4.2 4.9 4.7 4.9 5.0 4.4 5.3 4.5 3.4 3.0 3.2 2.8 1.9
International migrants2 3.6 2.2 3.8 3.5 3.5 3.9 2.7 2.4 5.0 2.5 1.8 1.5 1.2 1.0 1.0
Social characteristic of the Mexican immigrants
Education3 100.0 100.0 100.0 100.0 100.0 100.0 100.0 100.0 100.0 100.0 100.0 100.0 100.0 100.0 100.0
Less than 10 grades 58.7 58.6 56.3 56.2 56.7 54.7 54.1 52.7 52.6 51.0 47.0 50.0 49.2 46.0 47.0
From 10 to 12 grades 26.9 28.0 30.3 29.9 28.7 30.6 31.4 32.9 32.9 34.3 38.0 35.0 35.2 37.2 36.8
Higher technical 9.6 8.8 8.8 9.6 9.1 9.3 9.0 9.1 9.2 9.3 9.9 9.4 9.7 9.9 10.3
Professional & postgraduate 4.8 4.6 4.6 4.3 5.5 5.4 5.5 5.3 5.3 5.4 5.0 5.6 5.9 6.9 5.9
Citizenship in the
United States (%) 100.0 100.0 100.0 100.0 100.0 100.0 100.0 100.0 100.0 100.0 100.0 100.0 100.0 100.0 100.0
U.S. citizen 18.2 21.1 22.7 22.6 22.6 21.4 21.8 21.3 20.4 21.3 21.5 22.7 24.1 25.8 27.0
Non - U.S. citizen 81.8 78.9 77.3 77.4 77.4 78.6 78.2 78.7 79.6 78.7 78.5 77.3 75.9 74.2 73.0
Poverty condition4 (%) 100.0 100.0 100.0 100.0 100.0 100.0 100.0 100.0 100.0 100.0 100.0 100.0 100.0 100.0 100.0
Poor 33.7 30.2 28.3 25.7 24.7 24.6 25.4 25.7 26.2 25.7 22.1 24.8 27.1 28.8 29.9
Not poor 66.3 69.8 71.7 74.3 75.3 75.4 74.6 74.3 73.8 74.3 77.9 75.2 73.0 71.3 70.2
Type of health coverage (%) 100.0 100.0 100.0 100.0 100.0 100.0 100.0 100.0 100.0 100.0 100.0 n.a n.a n.a n.d
Public 13.5 12.5 12.9 12.7 12.3 11.7 12.9 12.9 14.1 14.1 12.7 n.a n.a n.a n.d
Private 31.7 31.2 31.4 33.2 33.1 33.6 32.3 30.3 29.8 29.6 28.3 n.a n.a n.a n.d
Both 2.0 2.4 2.1 2.0 1.9 1.7 2.2 1.8 2.7 2.3 2.6 n.a n.a n.a n.d
None 52.8 53.8 53.6 52.1 52.7 53.0 52.6 55.0 53.4 54.1 56.4 n.a n.a n.a n.d
Labor characteristics of Mexican immigrants (%)
Population 15 years old or
over (Millions) 6.5 6.7 6.8 7.3 7.7 9.0 9.3 9.8 10.1 10.3 10.9 11.1 11.1 11.2 11.0
Economically-active pop. 4.4 4.6 4.6 5.0 5.3 6.3 6.5 6.7 6.9 7.2 7.7 7.6 7.7 7.7 7.6
Employed 4.0 4.2 4.3 4.6 4.9 5.8 5.8 6.2 6.5 6.8 7.2 7.0 6.7 6.8 6.8
Unemployed 0.4 0.3 0.3 0.4 0.4 0.6 0.6 0.5 0.4 0.4 0.4 0.6 1.0 1.0 0.8
Economically-inactive pop. 2.1 2.1 2.2 2.3 2.4 2.6 2.9 3.1 3.1 3.1 3.3 3.4 3.5 3.5 3.4
Weekly hours worked (%) 100.0 100.0 100.0 100.0 100.0 100.0 100.0 100.0 100.0 100.0 100.0 100.0 100.0 100.0 100.0
34 or less 12.5 13.0 10.6 9.3 9.7 11.6 11.1 10.3 11.0 9.5 10.5 12.4 16.4 20.2 19.7
From 35 to 44 hours 69.8 70.3 73.7 76.8 75.3 75.2 75.1 76.1 75.2 76.1 75.1 74.8 71.0 68.6 70.0
45 or more 17.7 16.7 15.7 13.9 14.9 13.2 13.8 13.6 13.8 14.4 14.4 12.8 12.6 11.2 10.4
Continued on next page

Mexico Migration OutlookJuly 2012
Page 37
1997 1998 1999 2000 2001 2002 2003 2004 2005 2006 2007 2008 2009 2010 2011
Annual wage (U.S. dollars) (%) 100.0 100.0 100.0 100.0 100.0 100.0 100.0 100.0 100.0 100.0 100.0 100.0 100.0 100.0 100.0
Less than 10 000 29.8 26.2 23.8 21.0 17.5 17.5 15.0 14.4 13.4 12.8 11.1 11.7 13.0 13.4 12.6
From 10 000 to 19 999 42.1 43.2 44.3 44.1 42.4 40.0 39.9 40.9 39.9 37.1 34.4 32.5 31.0 34.0 32.8
From 20 000 to 29 999 16.6 17.9 18.8 20.1 22.0 24.6 24.3 23.9 24.0 26.2 27.5 27.0 25.3 24.3 25.9
From 30 000 to 39 999 6.8 7.6 6.9 7.8 9.9 9.3 10.7 11.2 11.4 12.4 13.7 13.2 14.5 13.4 13.4
From 40 000 or more 4.7 5.1 6.2 7.0 8.2 8.7 10.1 9.6 11.3 11.5 13.3 15.6 16.1 14.9 15.4
Sector of activity (%) 100.0 100.0 100.0 100.0 100.0 100.0 100.0 100.0 100.0 100.0 100.0 100.0 100.0 100.0 100.0
Primary 12.4 10.2 10.6 12.1 9.5 8.3 4.4 5.0 5.7 4.2 4.0 5.2 5.2 5.5 4.9
Secondary 36.4 35.3 34.9 36.6 36.5 35.8 35.8 36.1 36.9 39.6 40.6 37.2 33.2 30.9 32.3
Tertiary 51.2 54.5 54.5 51.2 54.0 55.9 59.8 58.9 57.4 56.2 55.4 57.7 61.7 63.6 62.8
Occupation (%) n.a. n.a. n.a. n.a. n.a. n.a. 100.0 100.0 100.0 100.0 100.0 100.0 100.0 100.0 100.0
Business, management
and financial n.a. n.a. n.a. n.a. n.a. n.a. 3.3 3.7 3.2 3.6 3.9 4.4 3.7 4.3 3.9
Professional & related n.a. n.a. n.a. n.a. n.a. n.a. 4.0 3.9 3.4 3.6 3.3 3.7 5.1 4.8 4.9
Services n.a. n.a. n.a. n.a. n.a. n.a. 29.2 28.6 29.2 29.0 27.3 27.9 31.8 32.3 31.1
Sales and related n.a. n.a. n.a. n.a. n.a. n.a. 6.0 6.3 5.7 6.0 5.9 5.9 5.7 6.0 6.0
Administrative and office n.a. n.a. n.a. n.a. n.a. n.a. 5.7 5.7 5.5 5.4 5.1 5.6 5.4 6.2 7.2
Agriculture, fishing &
forestry activities n.a. n.a. n.a. n.a. n.a. n.a. 4.3 4.4 5.3 3.8 4.0 4.7 5.0 4.5 4.2
Construction & extraction n.a. n.a. n.a. n.a. n.a. n.a. 15.5 18.8 20.4 22.3 24.8 21.8 16.8 16.1 16.8
Installation, maintenance
& repair n.a. n.a. n.a. n.a. n.a. n.a. 4.2 4.0 3.2 3.1 3.3 3.7 4.1 3.8 3.8
Production activities n.a. n.a. n.a. n.a. n.a. n.a. 17.3 15.2 14.4 15.1 14.0 13.4 12.9 12.7 13.2
Transportation &
material moving n.a. n.a. n.a. n.a. n.a. n.a. 10.5 9.3 9.6 8.1 8.5 9.0 9.5 9.2 9.0
Notes: 1/ It refers to the population that resided, the year prior to the interview, in a county other than the current one. 2/ It refers to the population that resided, the year prior to the interview , in Mexico. 3/ Population 25 years or over. 4/ Methodology for poverty in the U.S.. Individuals are classified as below the poverty level using a poverty index adopted by a Federal Inter Agency Committee in 1969, slightly modified in 1981. For more information, refer to http://www.census.gov/hhes/povmeas/. n.a. not available Source: BBVA Research with CONAPO estimations based on the Census Bureau, Current Population Survey (CPS), March 1994-2007 and BBVA Research estimations from Current Popula-tion Survey (CPS), March 2008-2011.
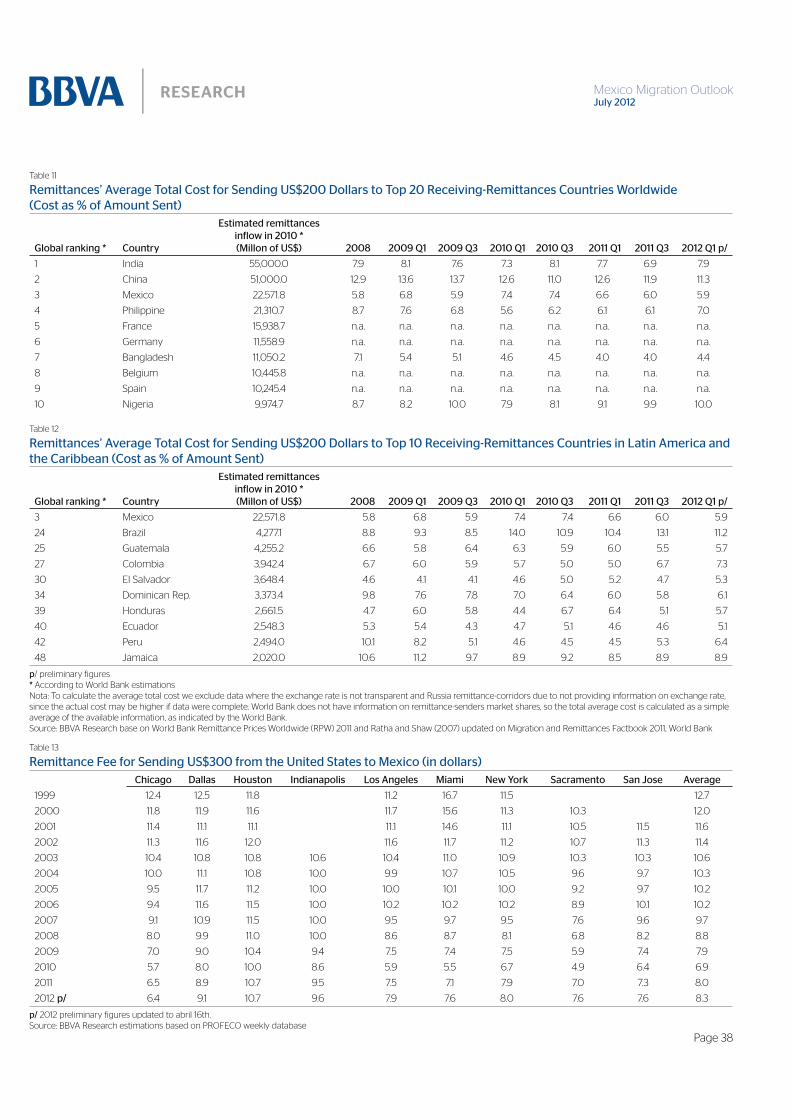
Mexico Migration OutlookJuly 2012
Page 38
Table 11
Remittances’ Average Total Cost for Sending US$200 Dollars to Top 20 Receiving-Remittances Countries Worldwide (Cost as % of Amount Sent)
Global ranking * Country
Estimated remittancesinflow in 2010 *(Millon of US$) 2008 2009 Q1 2009 Q3 2010 Q1 2010 Q3 2011 Q1 2011 Q3 2012 Q1 p/
1 India 55,000.0 7.9 8.1 7.6 7.3 8.1 7.7 6.9 7.9
2 China 51,000.0 12.9 13.6 13.7 12.6 11.0 12.6 11.9 11.3
3 Mexico 22,571.8 5.8 6.8 5.9 7.4 7.4 6.6 6.0 5.9
4 Philippine 21,310.7 8.7 7.6 6.8 5.6 6.2 6.1 6.1 7.0
5 France 15,938.7 n.a. n.a. n.a. n.a. n.a. n.a. n.a. n.a.
6 Germany 11,558.9 n.a. n.a. n.a. n.a. n.a. n.a. n.a. n.a.
7 Bangladesh 11,050.2 7.1 5.4 5.1 4.6 4.5 4.0 4.0 4.4
8 Belgium 10,445.8 n.a. n.a. n.a. n.a. n.a. n.a. n.a. n.a.
9 Spain 10,245.4 n.a. n.a. n.a. n.a. n.a. n.a. n.a. n.a.
10 Nigeria 9,974.7 8.7 8.2 10.0 7.9 8.1 9.1 9.9 10.0
Table 12
Remittances’ Average Total Cost for Sending US$200 Dollars to Top 10 Receiving-Remittances Countries in Latin America and the Caribbean (Cost as % of Amount Sent)
Global ranking * Country
Estimated remittancesinflow in 2010 *(Millon of US$) 2008 2009 Q1 2009 Q3 2010 Q1 2010 Q3 2011 Q1 2011 Q3 2012 Q1 p/
3 Mexico 22,571.8 5.8 6.8 5.9 7.4 7.4 6.6 6.0 5.9
24 Brazil 4,277.1 8.8 9.3 8.5 14.0 10.9 10.4 13.1 11.2
25 Guatemala 4,255.2 6.6 5.8 6.4 6.3 5.9 6.0 5.5 5.7
27 Colombia 3,942.4 6.7 6.0 5.9 5.7 5.0 5.0 6.7 7.3
30 El Salvador 3,648.4 4.6 4.1 4.1 4.6 5.0 5.2 4.7 5.3
34 Dominican Rep. 3,373.4 9.8 7.6 7.8 7.0 6.4 6.0 5.8 6.1
39 Honduras 2,661.5 4.7 6.0 5.8 4.4 6.7 6.4 5.1 5.7
40 Ecuador 2,548.3 5.3 5.4 4.3 4.7 5.1 4.6 4.6 5.1
42 Peru 2,494.0 10.1 8.2 5.1 4.6 4.5 4.5 5.3 6.4
48 Jamaica 2,020.0 10.6 11.2 9.7 8.9 9.2 8.5 8.9 8.9
p/ preliminary figures* According to World Bank estimationsNota: To calculate the average total cost we exclude data where the exchange rate is not transparent and Russia remittance-corridors due to not providing information on exchange rate, since the actual cost may be higher if data were complete. World Bank does not have information on remittance-senders market shares, so the total average cost is calculated as a simple average of the available information, as indicated by the World Bank. Source: BBVA Research base on World Bank Remittance Prices Worldwide (RPW) 2011 and Ratha and Shaw (2007) updated on Migration and Remittances Factbook 2011, World Bank
Table 13
Remittance Fee for Sending US$300 from the United States to Mexico (in dollars)Chicago Dallas Houston Indianapolis Los Angeles Miami New York Sacramento San Jose Average
1999 12.4 12.5 11.8 11.2 16.7 11.5 12.7
2000 11.8 11.9 11.6 11.7 15.6 11.3 10.3 12.0
2001 11.4 11.1 11.1 11.1 14.6 11.1 10.5 11.5 11.6
2002 11.3 11.6 12.0 11.6 11.7 11.2 10.7 11.3 11.4
2003 10.4 10.8 10.8 10.6 10.4 11.0 10.9 10.3 10.3 10.6
2004 10.0 11.1 10.8 10.0 9.9 10.7 10.5 9.6 9.7 10.3
2005 9.5 11.7 11.2 10.0 10.0 10.1 10.0 9.2 9.7 10.2
2006 9.4 11.6 11.5 10.0 10.2 10.2 10.2 8.9 10.1 10.2
2007 9.1 10.9 11.5 10.0 9.5 9.7 9.5 7.6 9.6 9.7
2008 8.0 9.9 11.0 10.0 8.6 8.7 8.1 6.8 8.2 8.8
2009 7.0 9.0 10.4 9.4 7.5 7.4 7.5 5.9 7.4 7.9
2010 5.7 8.0 10.0 8.6 5.9 5.5 6.7 4.9 6.4 6.9
2011 6.5 8.9 10.7 9.5 7.5 7.1 7.9 7.0 7.3 8.0
2012 p/ 6.4 9.1 10.7 9.6 7.9 7.6 8.0 7.6 7.6 8.3
p/ 2012 preliminary figures updated to abril 16th.Source: BBVA Research estimations based on PROFECO weekly database

Mexico Migration OutlookJuly 2012
Page 39
Table 14
Annual Remittance Inflows at the National Level2003 2004 2005 2006 2007 2008 2009 2010 2011 2012 p/
Million dollars
Total 15,138.7 18,331.7 21,688.3 25,566.8 26,049.6 25,138.6 21,244.7 21,271.2 22,730.9 5,372.2
Electronic transfers 13,212.4 16,228.5 19,667.2 23,854.0 24,802.7 24,113.7 20,547.5 20,583.3 22,228.9 5,254.0
Money Orders 254.6 233.6 273.2 353.2 387.3 426.3 311.0 298.2 295.3 69.5
Cash and payment in kind 1,665.3 1,869.7 1,747.9 1,359.7 859.7 598.7 386.2 389.8 206.8 48.6
Personal checks 6.4 - - - - - - - - -
Thousands of transactions
Total 47,985.9 57,013.4 64,921.7 74,184.6 75,635.8 72,618.6 66,936.9 67,434.7 69,671.9 16,872.0
Electronic transfers 43,132.7 52,087.9 60,509.4 70,697.7 73,278.7 70,478.0 65,381.4 65,930.0 68,553.1 16,624.5
Money Orders 348.3 322.7 345.4 642.3 771.2 787.2 689.1 688.6 691.5 147.1
Cash and payment in kind 4,498.1 4,602.8 4,066.9 2,844.6 1,585.9 1,353.3 866.4 816.1 427.3 100.4
Personal checks 6.9 - - - - - - - - -
Average remittance (dollars) 315.5 321.5 334.1 344.6 344.4 346.2 317.4 315.4 326.3 318.4
Table 15
Annual Remittance Inflows by State (Million Dollars)
2003 2004 2005 2006 2007 2008 2009 2010 2011 2012 p/
Nacional 15,138.7 18,331.7 21,688.3 25,566.8 26,049.6 25,138.6 21,244.7 21,271.2 17,279.6 5,372.2
Michoacán 1,787.5 2,281.4 2,442.4 2,503.7 2,435.0 2,448.2 2,126.1 2,141.2 2,238.1 538.4
Guanajuato 1,407.4 1,727.9 1,904.8 2,311.2 2,388.2 2,317.2 1,939.2 1,978.3 2,147.7 498.7
Jalisco 1,335.2 1,462.2 1,695.8 1,975.5 1,995.9 1,914.3 1,690.2 1,752.8 1,889.8 462.2
Estado de México 1,106.4 1,445.8 1,764.8 2,079.2 2,166.2 2,066.3 1,695.9 1,635.0 1,653.3 375.2
Puebla 854.0 1,009.0 1,182.1 1,482.6 1,617.0 1,615.2 1,370.8 1,369.1 1,465.1 333.6
Oaxaca 787.1 948.9 1,080.2 1,360.1 1,516.9 1,521.8 1,294.8 1,294.6 1,423.0 318.2
Guerrero 877.4 1,018.4 1,174.7 1,455.7 1,489.0 1,435.1 1,196.8 1,199.7 1,258.5 303.2
Veracruz 999.1 1,168.1 1,373.4 1,680.8 1,775.1 1,618.0 1,292.5 1,235.6 1,269.2 287.5
Distrito Federal 814.7 921.6 1,312.6 1,490.4 1,058.2 1,083.5 963.1 997.7 1,148.3 286.4
Hidalgo 608.5 725.6 815.0 982.8 1,091.8 960.7 749.9 714.5 760.3 166.7
San Luis Potosí 403.6 469.1 562.3 714.4 778.0 760.6 624.9 628.5 698.6 163.7
Zacatecas 402.4 484.7 540.5 667.7 687.1 681.3 571.6 580.8 623.5 152.6
Chiapas 435.2 587.5 765.3 940.9 920.7 810.9 607.9 573.5 593.0 137.2
Morelos 373.2 433.1 505.1 587.9 635.2 622.4 546.5 553.9 585.0 135.2
Sinaloa 320.5 374.1 451.1 503.3 522.8 487.6 455.4 469.5 510.2 124.2
Tamaulipas 234.4 284.1 425.3 496.8 516.5 500.3 413.8 401.7 443.9 111.9
Chihuahua 236.7 279.4 389.2 473.9 460.0 474.7 406.6 397.3 418.0 107.4
Durango 262.4 329.7 384.3 428.5 452.9 441.9 373.7 378.6 415.3 100.3
Baja California 142.0 165.1 256.6 302.1 334.4 334.3 321.1 347.3 395.5 96.9
Querétaro 283.3 353.4 405.9 484.1 475.0 436.3 359.1 354.0 382.1 84.1
Sonora 128.3 170.5 294.7 326.0 332.1 310.9 277.8 291.5 326.0 82.5
Nayarit 227.5 262.4 302.7 348.2 374.9 376.4 340.7 336.9 355.3 79.9
Nuevo León 189.2 295.8 283.9 342.6 327.0 323.7 292.2 283.5 308.0 79.8
Aguascalientes 260.2 314.8 322.6 379.4 372.9 332.2 281.3 293.4 305.3 78.2
Coahuila 139.9 180.0 240.7 275.3 293.1 278.3 233.6 233.7 246.2 62.7
Tlaxcala 149.2 185.0 221.1 270.7 303.3 305.1 258.2 258.2 273.7 58.1
Colima 103.7 134.3 165.0 183.2 199.6 184.5 164.3 171.3 183.3 45.6
Yucatán 60.3 75.8 94.1 122.1 136.7 136.1 109.6 112.5 117.4 29.0
Tabasco 86.0 105.3 156.4 187.9 182.7 156.1 114.0 111.1 111.4 27.0
Quintana Roo 52.9 67.5 85.0 99.5 98.5 97.2 85.4 86.7 91.8 22.8
Campeche 51.7 53.2 65.7 82.0 80.4 72.7 55.7 55.0 57.6 13.4
Baja California Sur 19.0 17.7 24.4 28.5 32.1 34.7 31.9 33.7 36.5 9.4
p/ Preliminary figures accumulated to 2012Q1.Source: BBVA Research with figures from Banxico
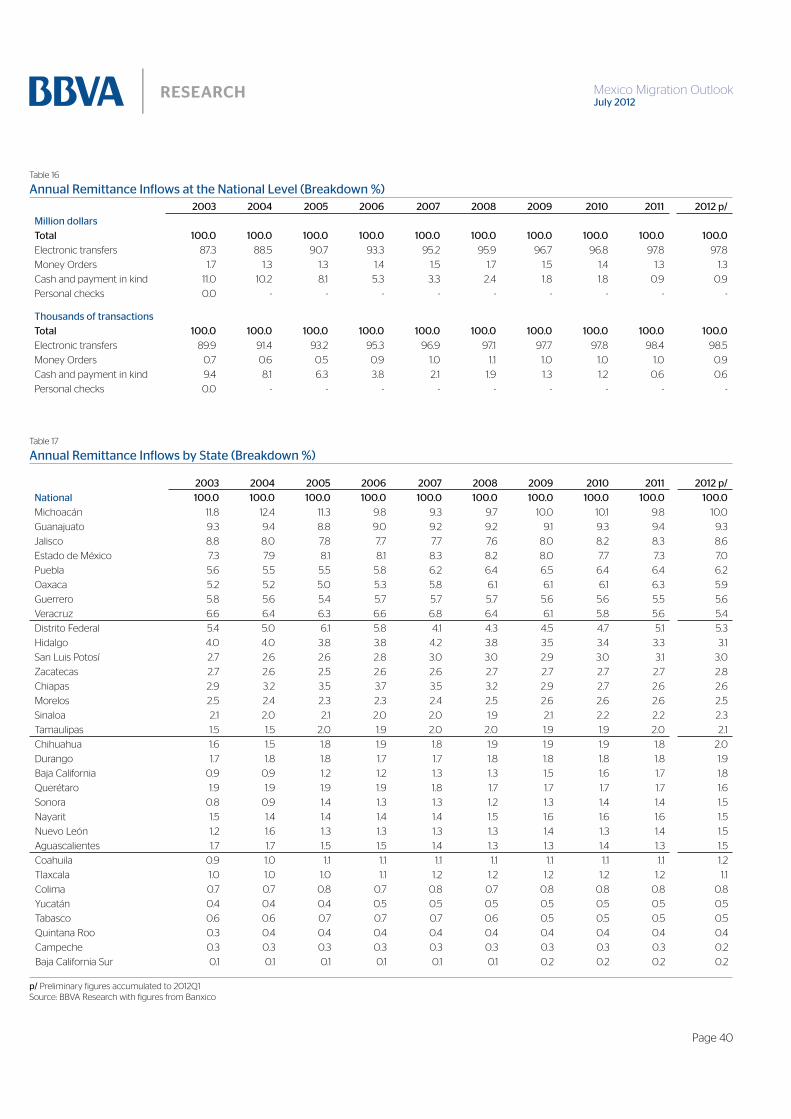
Mexico Migration OutlookJuly 2012
Page 40
Table 16
Annual Remittance Inflows at the National Level (Breakdown %)2003 2004 2005 2006 2007 2008 2009 2010 2011 2012 p/
Million dollars
Total 100.0 100.0 100.0 100.0 100.0 100.0 100.0 100.0 100.0 100.0
Electronic transfers 87.3 88.5 90.7 93.3 95.2 95.9 96.7 96.8 97.8 97.8
Money Orders 1.7 1.3 1.3 1.4 1.5 1.7 1.5 1.4 1.3 1.3
Cash and payment in kind 11.0 10.2 8.1 5.3 3.3 2.4 1.8 1.8 0.9 0.9
Personal checks 0.0 - - - - - - - - -
Thousands of transactions
Total 100.0 100.0 100.0 100.0 100.0 100.0 100.0 100.0 100.0 100.0
Electronic transfers 89.9 91.4 93.2 95.3 96.9 97.1 97.7 97.8 98.4 98.5
Money Orders 0.7 0.6 0.5 0.9 1.0 1.1 1.0 1.0 1.0 0.9
Cash and payment in kind 9.4 8.1 6.3 3.8 2.1 1.9 1.3 1.2 0.6 0.6
Personal checks 0.0 - - - - - - - - -
Table 17
Annual Remittance Inflows by State (Breakdown %)
2003 2004 2005 2006 2007 2008 2009 2010 2011 2012 p/
National 100.0 100.0 100.0 100.0 100.0 100.0 100.0 100.0 100.0 100.0
Michoacán 11.8 12.4 11.3 9.8 9.3 9.7 10.0 10.1 9.8 10.0
Guanajuato 9.3 9.4 8.8 9.0 9.2 9.2 9.1 9.3 9.4 9.3
Jalisco 8.8 8.0 7.8 7.7 7.7 7.6 8.0 8.2 8.3 8.6
Estado de México 7.3 7.9 8.1 8.1 8.3 8.2 8.0 7.7 7.3 7.0
Puebla 5.6 5.5 5.5 5.8 6.2 6.4 6.5 6.4 6.4 6.2
Oaxaca 5.2 5.2 5.0 5.3 5.8 6.1 6.1 6.1 6.3 5.9
Guerrero 5.8 5.6 5.4 5.7 5.7 5.7 5.6 5.6 5.5 5.6
Veracruz 6.6 6.4 6.3 6.6 6.8 6.4 6.1 5.8 5.6 5.4
Distrito Federal 5.4 5.0 6.1 5.8 4.1 4.3 4.5 4.7 5.1 5.3
Hidalgo 4.0 4.0 3.8 3.8 4.2 3.8 3.5 3.4 3.3 3.1
San Luis Potosí 2.7 2.6 2.6 2.8 3.0 3.0 2.9 3.0 3.1 3.0
Zacatecas 2.7 2.6 2.5 2.6 2.6 2.7 2.7 2.7 2.7 2.8
Chiapas 2.9 3.2 3.5 3.7 3.5 3.2 2.9 2.7 2.6 2.6
Morelos 2.5 2.4 2.3 2.3 2.4 2.5 2.6 2.6 2.6 2.5
Sinaloa 2.1 2.0 2.1 2.0 2.0 1.9 2.1 2.2 2.2 2.3
Tamaulipas 1.5 1.5 2.0 1.9 2.0 2.0 1.9 1.9 2.0 2.1
Chihuahua 1.6 1.5 1.8 1.9 1.8 1.9 1.9 1.9 1.8 2.0
Durango 1.7 1.8 1.8 1.7 1.7 1.8 1.8 1.8 1.8 1.9
Baja California 0.9 0.9 1.2 1.2 1.3 1.3 1.5 1.6 1.7 1.8
Querétaro 1.9 1.9 1.9 1.9 1.8 1.7 1.7 1.7 1.7 1.6
Sonora 0.8 0.9 1.4 1.3 1.3 1.2 1.3 1.4 1.4 1.5
Nayarit 1.5 1.4 1.4 1.4 1.4 1.5 1.6 1.6 1.6 1.5
Nuevo León 1.2 1.6 1.3 1.3 1.3 1.3 1.4 1.3 1.4 1.5
Aguascalientes 1.7 1.7 1.5 1.5 1.4 1.3 1.3 1.4 1.3 1.5
Coahuila 0.9 1.0 1.1 1.1 1.1 1.1 1.1 1.1 1.1 1.2
Tlaxcala 1.0 1.0 1.0 1.1 1.2 1.2 1.2 1.2 1.2 1.1
Colima 0.7 0.7 0.8 0.7 0.8 0.7 0.8 0.8 0.8 0.8
Yucatán 0.4 0.4 0.4 0.5 0.5 0.5 0.5 0.5 0.5 0.5
Tabasco 0.6 0.6 0.7 0.7 0.7 0.6 0.5 0.5 0.5 0.5
Quintana Roo 0.3 0.4 0.4 0.4 0.4 0.4 0.4 0.4 0.4 0.4
Campeche 0.3 0.3 0.3 0.3 0.3 0.3 0.3 0.3 0.3 0.2
Baja California Sur 0.1 0.1 0.1 0.1 0.1 0.1 0.2 0.2 0.2 0.2
p/ Preliminary figures accumulated to 2012Q1Source: BBVA Research with figures from Banxico

Mexico Migration OutlookJuly 2012
Page 41
Table 18
Monthly Remittance Inflows to Mexico (Million Dollars)1999 2000 2001 2002 2003 2004 2005 2006 2007 2008 2009 2010 2011 2012
Jan 399.6 456.3 655.0 711.0 1,017.3 1,081.9 1,367.6 1,758.3 1,872.9 1,781.1 1,572.6 1,324.3 1,401.5 1,501.8
Feb 388.9 447.2 637.7 718.9 962.9 1,171.8 1,428.4 1,823.2 1,856.7 1,859.4 1,810.4 1,553.7 1,647.6 1,788.4
Mar 464.9 494.5 718.1 744.5 1,099.1 1,480.2 1,691.6 2,152.8 2,186.3 2,115.9 2,111.2 1,955.3 2,052.4 2,082.0
Apr 469.2 498.8 734.8 805.9 1,202.5 1,513.5 1,753.3 2,072.7 2,166.1 2,184.2 1,784.2 1,789.4 1,872.8 2,025.8
May 571.6 590.8 798.2 912.2 1,343.8 1,770.4 2,057.3 2,534.6 2,411.8 2,371.2 1,905.2 2,144.7 2,166.5 2,336.2
Jun 521.9 541.6 747.8 860.0 1,351.2 1,684.3 1,923.3 2,340.3 2,300.4 2,264.1 1,928.9 1,890.9 2,021.9
Jul 506.7 557.6 796.6 843.1 1,361.4 1,654.4 1,840.3 2,191.7 2,369.2 2,182.3 1,838.2 1,871.5 1,897.6
Aug 532.1 608.1 789.3 849.1 1,401.3 1,786.8 2,059.2 2,334.3 2,411.9 2,097.5 1,786.7 1,954.6 2,134.7
Sep 490.5 568.6 772.1 860.6 1,365.5 1,586.8 1,886.0 2,141.0 2,186.0 2,113.4 1,747.1 1,719.3 2,084.7
Oct 474.5 559.5 792.8 848.3 1,391.0 1,530.0 1,862.3 2,316.5 2,367.4 2,636.6 1,695.6 1,731.7 1,911.5
Nov 502.0 583.1 693.8 741.4 1,203.7 1,506.2 1,887.0 1,962.8 1,958.4 1,751.7 1,500.4 1,629.2 1,773.6
Dec 587.7 666.9 759.0 919.4 1,341.1 1,565.1 1,932.1 1,938.7 1,962.8 1,781.2 1,564.2 1,706.6 1,766.3
Total 5,909.6 6,572.8 8,895.3 9,814.5 15,040.7 18,331.3 21,688.3 25,566.8 26,049.6 25,138.6 21,244.7 21,271.2 22,730.9
Monthly Remittance Inflows to Mexico (Annual % Change)
Jan 4.5 14.2 43.6 8.6 43.1 6.3 26.4 28.6 6.5 -4.9 -11.7 -15.8 5.8 7.2
Feb 6.1 15.0 42.6 12.7 34.0 21.7 21.9 27.6 1.8 0.1 -2.6 -14.2 6.0 8.5
Mar 8.8 6.4 45.2 3.7 47.6 34.7 14.3 27.3 1.6 -3.2 -0.2 -7.4 5.0 1.4
Apr 6.6 6.3 47.3 9.7 49.2 25.9 15.8 18.2 4.5 0.8 -18.3 0.3 4.7 8.2
May 9.8 3.4 35.1 14.3 47.3 31.7 16.2 23.2 -4.8 -1.7 -19.7 12.6 1.0 7.8
Jun 3.7 3.8 38.1 15.0 57.1 24.7 14.2 21.7 -1.7 -1.6 -14.8 -2.0 6.9
Jul 2.5 10.1 42.9 5.8 61.5 21.5 11.2 19.1 8.1 -7.9 -15.8 1.8 1.4
Aug 9.3 14.3 29.8 7.6 65.0 27.5 15.2 13.4 3.3 -13.0 -14.8 9.4 9.2
Sep 3.0 15.9 35.8 11.5 58.7 16.2 18.9 13.5 2.1 -3.3 -17.3 -1.6 21.2
Oct 4.4 17.9 41.7 7.0 64.0 10.0 21.7 24.4 2.2 11.4 -35.7 2.1 10.4
Nov 9.0 16.2 19.0 6.9 62.3 25.1 25.3 4.0 -0.2 -10.6 -14.3 8.6 8.9
Dec -4.3 13.5 13.8 21.1 45.9 16.7 23.5 0.3 1.2 -9.3 -12.2 9.1 3.5
Total 5.0 11.2 35.3 10.3 53.3 21.9 18.3 17.9 1.9 -3.5 -15.5 0.1 6.9
12-month Remittance Inflows to Mexico (Million Dollars)Jan 5,644.0 5,966.2 6,771.5 8,951.3 10,120.7 15,105.3 18,617.0 22,079.0 25,681.4 25,957.8 24,930.1 20,996.4 21,348.4 22,831.2
Feb 5,666.4 6,024.5 6,962.0 9,032.5 10,364.8 15,314.1 18,873.6 22,473.8 25,714.9 25,960.6 24,881.0 20,739.7 21,442.3 22,972.1
Mar 5,704.1 6,054.1 7,185.6 9,059.0 10,719.3 15,695.3 19,085.0 22,935.1 25,748.4 25,890.1 24,876.4 20,583.9 21,539.3 23,001.6
Apr 5,733.3 6,083.7 7,421.6 9,130.1 11,115.9 16,006.3 19,324.8 23,254.5 25,841.8 25,908.2 24,476.4 20,589.0 21,622.7 23,154.6
May 5,784.5 6,102.9 7,629.0 9,244.0 11,547.6 16,432.9 19,611.7 23,731.8 25,719.0 25,867.7 24,010.3 20,828.6 21,644.5 23,324.4
Jun 5,802.9 6,122.6 7,835.3 9,356.2 12,038.7 16,766.0 19,850.6 24,148.8 25,679.1 25,831.5 23,675.0 20,790.6 21,775.5
Jul 5,815.2 6,173.5 8,074.3 9,402.7 12,557.0 17,059.0 20,036.6 24,500.1 25,856.6 25,644.6 23,331.0 20,823.9 21,801.6
Aug 5,860.7 6,249.5 8,255.6 9,462.5 13,109.1 17,444.6 20,309.0 24,775.2 25,934.1 25,330.2 23,020.2 20,991.7 21,981.7
Sep 5,874.9 6,327.5 8,459.1 9,551.0 13,614.1 17,665.9 20,608.1 25,030.2 25,979.1 25,257.6 22,653.9 20,964.0 22,347.0
Oct 5,894.8 6,412.5 8,692.4 9,606.5 14,156.8 17,804.8 20,940.5 25,484.4 26,030.0 25,526.8 21,713.0 21,000.0 22,526.9
Nov 5,936.1 6,493.6 8,803.1 9,654.1 14,619.1 18,107.3 21,321.2 25,560.3 26,025.6 25,320.1 21,461.7 21,128.8 22,671.2
Dec 5,909.6 6,572.8 8,895.3 9,814.5 15,040.7 18,331.3 21,688.3 25,566.8 26,049.6 25,138.6 21,244.7 21,271.2 22,730.9
12-month Remittance Inflows to Mexico (Annual % Change)Jan 15.0 5.7 13.5 32.2 13.1 49.3 23.2 18.6 16.3 1.1 -4.0 -15.8 1.7 6.9
Feb 14.6 6.3 15.6 29.7 14.7 47.8 23.2 19.1 14.4 1.0 -4.2 -16.6 3.4 7.1
Mar 14.3 6.1 18.7 26.1 18.3 46.4 21.6 20.2 12.3 0.6 -3.9 -17.3 4.6 6.8
Apr 14.6 6.1 22.0 23.0 21.8 44.0 20.7 20.3 11.1 0.3 -5.5 -15.9 5.0 7.1
May 14.8 5.5 25.0 21.2 24.9 42.3 19.3 21.0 8.4 0.6 -7.2 -13.3 3.9 7.8
Jun 14.1 5.5 28.0 19.4 28.7 39.3 18.4 21.7 6.3 0.6 -8.3 -12.2 4.7
Jul 13.1 6.2 30.8 16.5 33.5 35.9 17.5 22.3 5.5 -0.8 -9.0 -10.7 4.7
Aug 12.8 6.6 32.1 14.6 38.5 33.1 16.4 22.0 4.7 -2.3 -9.1 -8.8 4.7
Sep 12.1 7.7 33.7 12.9 42.5 29.8 16.7 21.5 3.8 -2.8 -10.3 -7.5 6.6
Oct 11.7 8.8 35.6 10.5 47.4 25.8 17.6 21.7 2.1 -1.9 -14.9 -3.3 7.3
Nov 10.1 9.4 35.6 9.7 51.4 23.9 17.7 19.9 1.8 -2.7 -15.2 -1.6 7.3
Dec 5.0 11.2 35.3 10.3 53.3 21.9 18.3 17.9 1.9 -3.5 -15.5 0.1 6.9
Source: BBVA Research with figures from Banxico

Mexico Migration OutlookJuly 2012
Page 42
Table 19
Intensity of Migration and Remittance Inflows Indicators, by StateHouseholds in 2000 Households in 2010
Receiving
remit-
tances
(%)
With immigrant
in US in the
previous five
years
(%)
With circular
immigrant in US
in the previous
five years
(%)
With returnee
migrant from US
in the previous
five years
(%)
Receiving
remit-
tances
(%)
With immigrant
in US in the
previous five
years
(%)
With circular
immigrant in US in
the previous five
years
(%)
With returnee
migrant from US
in the previous
five years
(%)
Remittance
dependency
indicator
2010*
Remittance
depen-
dency
degree**
State
National 4.4 4.1 0.9 0.8 3.6 1.9 0.9 2.3 2.3
Guerrero 7.9 6.8 0.8 1.1 6.6 3.2 1.0 3.5 14.6 Very high
Michoacán 11.4 10.4 2.8 2.3 9.3 4.4 2.0 4.9 9.4 Very high
Oaxaca 4.1 4.8 0.6 0.7 4.9 4.1 0.9 3.1 9.3 Very high
Hidalgo 5.1 7.1 1.6 0.9 4.3 3.5 1.6 4.1 8.2 Very high
Zacatecas 13.0 12.2 3.3 2.5 11.0 4.5 2.3 5.7 6.9 Very high
Nayarit 9.6 6.8 2.0 2.0 9.1 2.1 2.3 4.4 6.0 Very high
Morelos 6.4 7.5 1.3 1.1 5.4 2.5 1.1 3.6 5.3 Very high
Tlaxcala 2.2 2.7 0.5 0.4 2.6 2.4 1.2 1.8 5.1 High
Puebla 3.3 4.0 0.5 0.7 3.8 3.0 1.0 2.1 4.4 High
Guanajuato 9.2 9.6 2.2 1.6 7.7 5.3 2.3 4.3 4.3 High
San Luis Potosí 8.2 7.4 1.3 1.2 6.6 3.1 1.3 3.3 3.7 High
Durango 9.7 7.3 1.8 1.6 6.5 2.4 1.3 3.4 3.3 High
Colima 7.3 5.6 1.4 2.1 5.2 1.8 1.1 4.2 3.3 High
Chiapas 0.8 0.8 0.1 0.1 1.1 1.1 0.5 0.9 3.3 High
Aguascalientes 6.7 6.7 2.7 1.5 4.8 2.6 1.6 3.3 2.8 Medium
Veracruz 2.7 3.2 0.5 0.2 2.5 1.8 0.8 2.0 2.7 Medium
Sinaloa 4.6 3.6 0.9 0.6 3.3 1.0 0.7 1.9 2.4 Medium
Querétaro 3.7 4.8 1.4 0.7 3.3 3.0 1.6 2.6 2.1 Medium
Mexico 2.1 2.6 0.6 0.3 1.5 1.0 0.6 1.1 2.0 Medium
Baja California 4.0 2.4 0.4 2.3 3.7 1.1 0.5 4.2 1.5 Low
Tamaulipas 3.6 3.0 0.6 0.7 3.0 1.2 0.7 2.5 1.4 Low
Chihuahua 4.3 3.7 1.0 1.3 4.4 1.7 0.7 2.8 1.4 Low
Sonora 3.2 1.6 0.3 0.9 2.7 1.1 0.7 2.9 1.3 Low
Jalisco 7.7 6.5 1.8 1.7 5.4 2.2 1.3 3.0 1.2 Low
Yucatán 1.4 1.0 0.2 0.2 1.4 0.7 0.4 0.7 0.8 Very low
Coahuila 3.4 2.2 0.8 0.7 2.4 0.9 0.5 1.5 0.8 Very low
Distrito Federal 1.7 1.6 0.4 0.3 1.2 0.6 0.4 0.6 0.7 Very low
Quintana Roo 1.0 0.7 0.2 0.2 1.2 0.5 0.3 1.0 0.7 Very low
B. California Sur 1.1 1.0 0.6 0.6 1.6 0.5 0.4 2.5 0.6 Very low
Nuevo León 2.5 1.9 0.7 0.6 1.3 0.6 0.4 1.0 0.4 Very low
Tabasco 0.6 0.6 0.2 0.0 0.8 0.5 0.3 0.5 0.3 Very low
Campeche 1.0 0.9 0.2 0.1 0.9 0.5 0.3 1.0 0.1 Very low
Note: For 2010, CONAPO estimated migration intensity indicators by house. To make data comparable between 2000 and 2010, for this last year was estimated information directly from databases. * Remittances / GDP*100. Preliminary figures. ** Classification by BBVA Research. The cutoff points were established based on standard deviations in the sample. Source: For 2000, CONAPO estimation based on the sample of ten percent of the XII Censo General de Población y Vivienda 2000. For 2010, BBVA Research estimations based on the sample of ten percent of Censo de Población y Vivienda 2010. For dependency index, BBVA Research based on INEGI and Banxico

Mexico Migration OutlookJuly 2012
Page 43
6. Special topics included in previous issues
November 2011The outlook for migration in Mexico and remittances to MexicoInset 1: The increase in poverty among Mexican immigrants in the United States: a result of the economic crisisThe new Mexican immigrants in the United States, individuals with higher educational levels and incomeHas there been an evolution in remittances? A historical reviewCost of sending remittances to different regions
The effect of access to financial services on the well-being of families receiving remittances
June 2011Outlook for Mexico on migration and remittances- 2011-2012Recent changes in the international migratory patterns in MexicoEffect of remittances on employment and school enrollment in Mexico
Are remittances a driving force for development in Mexican communities?
November 2010The impact of the recession in the United States on immigrants and remittances from Mexicans and their respective outlooksMigration from Mexico to the United States, an essentially economic linkImmigration in Arizona and the effects of the new law “SB-1070”Inset 1: The Arizona SB 1070 Law: Origin and characteristicsHighly Qualified Mexican Immigrants in the U.S.; A revealing photographInset 2: An estimate of the transfer of resources due to education expenses from Mexico to the U.S. through Mexican immigrants
May 2010The Global Crisis and Its Effects on Migration and RemittancesInset 1: Anti-immigration Policies: Motivations and Some ExamplesMigration and Climate Change: The Mexican CaseThe Importance of Social Networks in Migration
The Impact of Social Networks on the Income of Mexicans in the U.S
November 2009Effects of the Recession in the United States on Mexican Migrants and Outlook for 2010Sectorial and Regional Mobility of Mexicans in the U.S.Economic Effects of Migration in the Destination CountryRecent Changes in the Conditions of Mexican Households that Receive Remittances
Importance of the Global Forum on Migration & Development
June 2009Determining Factors of MigrationInternational Migratory FlowsMexican Migration to the U.S.: A Brief X-RayMunicipal Factors Spurring Mexican Migration AbroadHas Poverty Affected Mexican Migration to the U.S.?
Immigration Policy of the U.S.: a Historic Retrospective
Available in www.bbvaresearch.com in Spanish and English
Mexico Migration OutlookJuly 2012
This document is a translation of Situación Migración México whose ISSN is in process.
DISCLAIMER
This document and the information, opinions, estimates and recommendations expressed herein, have been prepared by Banco Bilbao Vizcaya Argentaria, S.A. (hereinafter called “BBVA”) to provide its customers with general information regarding the date of issue of the report and are subject to changes without prior notice. BBVA is not liable for giving notice of such changes or for updating the contents hereof.
This document and its contents do not constitute an offer, invitation or solicitation to purchase or subscribe to any securities or other instruments, or to undertake or divest investments. Neither shall this document nor its contents form the basis of any contract, commitment or decision of any kind.
Investors who have access to this document should be aware that the securities, instruments or investments to which it refers may not be appropriate for them due to their specific investment goals, financial positions or risk profiles, as these have not been taken into account to prepare this report. Therefore, investors should make their own investment decisions considering the said circumstances and obtaining such specialized advice as may be necessary. The contents of this document is based upon information available to the public that has been obtained from sources considered to be reliable. However, such information has not been independently verified by BBVA and therefore no warranty, either express or implicit, is given regarding its accuracy, integrity or correctness. BBVA accepts no liability of any type for any direct or indirect losses arising from the use of the document or its contents. Investors should note that the past performance of securities or instruments or the historical results of investments do not guarantee future performance.
The market prices of securities or instruments or the results of investments could fluctuate against the interests of investors. Investors should be aware that they could even face a loss of their investment. Transactions in futures, options and securities or high-yield securities can involve high risks and are not appropriate for every investor. Indeed, in the case of some investments, the potential losses may exceed the amount of initial investment and, in such circumstances, investors may be required to pay more money to support those losses. Thus, before undertaking any transaction with these instruments, investors should be aware of their operation, as well as the rights, liabilities and risks implied by the same and the underlying stocks. Investors should also be aware that secondary markets for the said instruments may be limited or even not exist.
BBVA or any of its affiliates, as well as their respective executives and employees, may have a position in any of the securities or instruments referred to, directly or indirectly, in this document, or in any other related thereto; they may trade for their own account or for third-party account in those securities, provide consulting or other services to the issuer of the aforementioned securities or instruments or to companies related thereto or to their shareholders, executives or employees, or may have interests or perform transactions in those securities or instruments or related investments before or after the publication of this report, to the extent permitted by the applicable law.
BBVA or any of its affiliates´ salespeople, traders, and other professionals may provide oral or written market commentary or trading strategies to its clients that reflect opinions that are contrary to the opinions expressed herein. Furthermore, BBVA or any of its affiliates’ proprietary trading and investing businesses may make investment decisions that are inconsistent with the recommendations expressed herein. No part of this document may be (i) copied, photocopied or duplicated by any other form or means (ii) redistributed or (iii) quoted, without the prior written consent of BBVA. No part of this report may be copied, conveyed, distributed or furnished to any person or entity in any country (or persons or entities in the same) in which its distribution is prohibited by law. Failure to comply with these restrictions may breach the laws of the relevant jurisdiction.
This document is provided in the United Kingdom solely to those persons to whom it may be addressed according to the Financial Services and Markets Act 2000 (Financial Promotion) Order 2001 and it is not to be directly or indirectly delivered to or distributed among any other type of persons or entities. In particular, this document is only aimed at and can be delivered to the following persons or entities (i) those outside the United Kingdom (ii) those with expertise regarding investments as mentioned under Section 19(5) of Order 2001, (iii) high net worth entities and any other person or entity under Section 49(1) of Order 2001 to whom the contents hereof can be legally revealed.
The remuneration system concerning the analyst/s author/s of this report is based on multiple criteria, including the revenues obtained by BBVA and, indirectly, the results of BBVA Group in the fiscal year, which, in turn, include the results generated by the investment banking business; nevertheless, they do not receive any remuneration based on revenues from any specific transaction in investment banking.
BBVA Bancomer and the rest of BBVA Group who are not members of FINRA (Financial Industry Regulatory Authority), are not subject to the rules of disclosure for these members.
“BBVA Bancomer, BBVA and its subsidiaries, among which is BBVA Global Markets Research, are subject to the Corporate Policy Group in the field of BBVA Securities Markets. In each jurisdiction in which BBVA is active in the Securities Markets, the policy is complemented by an Internal Code of Conduct which complements the policy and guidelines in conjunction with other established guidelines to prevent and avoid conflicts of interest with respect to recommendations issued by analysts among which is the separation of areas. Corporate Policy is available at: www.bbva.com / Corporate Governance / Conduct in Securities Markets”.

Mexico Migration OutlookJuly 2012
The publication Mexico Migration Outlook is a joint project of BBVA Bancomer Foundation and Mexico Economic Studies Department of BBVA
Research, which seeks to provide new contributions every six months in the field of Migration studies in order to have a better understanding of this
important social movement.

Mexico Migration OutlookJuly 2012
BBVA Research MexicoAv. Universidad 1200Colonia XocoC.P. 03339 México D.F.Publications:E-mail: [email protected]
These and other BBVA Research publicationsare available in English and in Spanish at: www.bbvaresearch.com
Other publications:
Adolfo AlboFernando GonzalezOciel HernandezCarlos A. HerreraAngel Muñoz
Toward the Strengthening of thePension Systems in Mexico:Vision and Reform Proposals
Pension Studies
BBVA Research
Group Chief EconomistJorge Sicilia
Emerging Economies:Alicia Garcí[email protected]
Cross-Country Emerging Markets Analysis Álvaro Ortiz Vidal-Abarca
Mexico Adolfo Albo [email protected]
Macro Analysis Mexico Julián Cubero [email protected]
Asia Stephen Schwartz [email protected]
Latam CoordinationJuan [email protected]
Argentina Gloria Sorensen [email protected]
Chile Alejandro Puente [email protected]
Colombia Juana Téllez [email protected]
Peru Hugo Perea [email protected]
Venezuela Oswaldo López [email protected]
Global Areas:
Financial ScenariosSonsoles [email protected]
Economic Scenarios
Innovation and ProcessClara Barrabé[email protected]
Developed Economies: Rafael Domé[email protected]
Spain Miguel Cardoso [email protected]
Europe Miguel Jiménez [email protected]
United States Nathaniel Karp [email protected]
Financial Systems & Regulation:Santiago Fernández de [email protected]
Financial Systems Ana Rubio [email protected]
Pensions David Tuesta [email protected]
Regulation and Public Policy María Abascal [email protected]
Market & Client Strategy: Antonio [email protected]
Global Equityt Ana Munera [email protected]
Global Credit Javier Serna [email protected]
Global Interest Rates, FX and Commodities Luis Enrique Rodríguez [email protected]
Editorial Board
Adolfo Albo Jorge Sicilia Gustavo Lara
This report has been produced by
EditorAdolfo [email protected]
Juan Luis Ordaz Dí[email protected]
Juan José Li [email protected]