migration profile - wyndham.vic.gov.au
TRANSCRIPT

Migration Profile

Table of Contents
Contents Introduction ............................................................................................................................................ 3
Overall migration patterns ...................................................................................................................... 4
City-wide ............................................................................................................................................. 4
Suburbs ............................................................................................................................................... 5
Age .......................................................................................................................................................... 6
Country of birth....................................................................................................................................... 7
Education ................................................................................................................................................ 9
Employment .......................................................................................................................................... 14
Labour force status ........................................................................................................................... 14
Industry ............................................................................................................................................. 17
Occupation ........................................................................................................................................ 21
Income .............................................................................................................................................. 24
Visas ...................................................................................................................................................... 28
Table of Figures and Tables
Figure 1: Current location of residents who arrived from overseas between 2011 and 2016 ............... 6
Figure 2: Per cent of the population that is born in India, 2016 ............................................................. 9
Figure 3: Per cent of the population that speaks Mandarin at home, 2016 .......................................... 9
Figure 4: Migration flow by educational attainment, Wyndham ......................................................... 10
Figure 5: Distribution of educational attainment by arrivals and departures, Wyndham, 2011-2016 11
Figure 6: Distribution of educational attainment by arrivals from overseas and from elsewhere in
Australia, Wyndham, 2011-2016 .......................................................................................................... 12
Figure 7: Proportion of the population with a Bachelor degree or higher over all arrivals and
departures in cities with large migration flows with Wyndham, 2011-2016 ....................................... 13
Figure 8: Migration flow by labour force status, Wyndham ................................................................. 14
Figure 9: Distribution of labour force status by arrivals and departures, Wyndham, 2011-2016 ........ 15
Figure 10: Distribution of labour force status by arrivals from overseas and from elsewhere in
Australia, Wyndham, 2011-2016 .......................................................................................................... 16
Figure 11: Proportion of the population that has full-time employment over all arrivals and
departures in cities with large migration flows with Wyndham, 2011-2016 ....................................... 17
Figure 12: Migration flow by industry, Wyndham ................................................................................ 18
Figure 13: Distribution of industry of employment by arrivals and departures, Wyndham, 2011-2016
.............................................................................................................................................................. 19
Figure 14: Distribution of industry of employment by arrivals from overseas and from elsewhere in
Australia, Wyndham, 2011-2016 .......................................................................................................... 20

2
Figure 15: Migration flow by occupation, Wyndham ........................................................................... 21
Figure 16: Distribution of occupation by arrivals and departures, Wyndham, 2011-2016 .................. 22
Figure 17: Distribution of occupation by arrivals from overseas and from elsewhere in Australia,
Wyndham, 2011-2016 .......................................................................................................................... 23
Figure 18: Proportion of the population that are managers and professionals over all arrivals and
departures in cities with large migration flows with Wyndham, 2011-2016 ....................................... 24
Figure 19: Distribution of income levels by arrivals and departures, Wyndham, 2011-2016 .............. 26
Figure 20: Distribution of income levels by arrivals from overseas and from elsewhere in Australia,
Wyndham, 2011-2016 .......................................................................................................................... 26
Figure 21: Proportion of the population that have high personal income over all arrivals and
departures in cities with large migration flows with Wyndham, 2011-2016 ....................................... 27
Figure 22: Proportion of the population that have low personal income over all arrivals and
departures in cities with large migration flows with Wyndham, 2011-2016 ....................................... 28
Table 1: Migration flow breakdown by origin and destination, 2011-2016 ........................................... 5
Table 2: Migration to and from other municipalities in Victoria ............................................................ 5
Table 3: Migration patterns by Wyndham suburbs ................................................................................ 6
Table 4: Median age and most common age groups by suburb, 2011-2016 ......................................... 7
Table 5: Migration flows by country of birth, 2011-2016 ....................................................................... 7
Table 6: Most popular suburbs for recent arrivals by country of birth, 2011-2016 ............................... 8
Table 7: Most popular suburbs for recent arrivals by educational attainment, 2011-2016 ................ 13
Table 8: Educational attainment of recent arrivals in Wyndham suburbs, 2011-2016 ........................ 13
Table 9: Labour force status of recent arrivals in Wyndham suburbs, 2011-2016 ............................... 17
Table 10: Most common industries of employment of recent arrivals in Wyndham suburbs, 2011-
2016 ...................................................................................................................................................... 21
Table 11: Most common occupations of recent arrivals in Wyndham suburbs, 2011-2016 ................ 24
Table 12: Income level details for recent arrivals, Wyndham .............................................................. 25
Table 13: Income level details for recent arrivals by suburb, Wyndham, 2011-2016 .......................... 28

Introduction1 This profile focuses on migration - the movement of residents into Wyndham with the intent to
reside here and the movement of residents from Wyndham with the intent to reside elsewhere.
Migration is one of three significant components of population change in Australia alongside births
and deaths. This profile covers the three types of migration: between-state migration, within-state
migration and overseas migration. For all migration streams the profile covers inward and outward
flows. The exception is overseas migration for which only data on inward flows is available.
Identifying patterns in residential inward and outward migration is pertinent in the Wyndham
context. The arrival of new residents and the departure of others affect the city’s population and,
potentially, the demand for services and infrastructure. With Wyndham’s growth rate and the
volatility of migration, identifying recent trends in migration patterns may inform how migration is
likely to impact the community, and whether specific groups are leaving or coming in to the city.
Key points from this profile are:
- Just under 60,000 residents arrived in Wyndham during the past five years, and just over
24,000 moved elsewhere.
- Around a third of those who arrived in Wyndham between 2011 and 2016 lived overseas
before moving to Wyndham.
- Net migration to most Victorian municipalities was positive; a larger number of people
arrived than left. Notable exceptions are Melton and Greater Geelong – these municipalities
had high numbers of residents moving to Wyndham, but even higher numbers going in the
opposite direction.
- Almost two thirds of those who arrived in Wyndham settled to Point Cook, Tarneit and
Truganina.
- There is little difference in the median age of those who arrive and depart Wyndham.
- More than two thirds of those who left Wyndham were born in Australia. Moreover,
Australian-born residents form 1.3% of net migration.
- As for education and employment outcomes, net migration is positive for virtually all
categories. However, differences exist between those who move in and out of Wyndham
and between those who arrived from overseas and from other locations in Australia:
o A larger proportion of highly educated, full time employees are moving out of
Wyndham compared to moving in. Those moving out also have higher income levels
than those moving in.
o A higher proportion of Managers, Professionals, Clerical and Administrative Workers
and Technicians and Trades Workers moved away from Wyndham than into
Wyndham. In contrast, there were more arrivals than departures of Machinery
Operators and Drivers and Labourers.
o Compared with those who arrived from within Australia, a larger proportion of those
who arrived from overseas have a Bachelor Degree or have finished up to high
school, and a lower proportion have a Certificate level degree.
o Residents who arrived from overseas are more likely to have higher levels of
education than those have arrived from Local Government Areas across Australia.
1 All data comes from the ABS Census of Population and Housing (2016) unless otherwise stated.

4
o Levels of unemployment are higher amongst arrivals from overseas compared to
those who arrived from across Australia.
o A larger proportion of those who arrived from overseas work as Professionals and
Labourers. Residents who arrived from another place in Australia are more likely to
work as Clerical and Administrative Workers, Managers and Technicians and Trades
Workers.
o A large proportion of Wyndham residents who are highly educated, have full-time
education, work as professionals and managers, and have higher income levels left
for municipalities close to Wyndham.
o Residents with high education levels and white collar occupations mainly choose to
reside in Point Cook, Williams Landing and Tarneit.
- As for the data on visa holders:
o 4,711 Wyndham residents were granted a visa in the past 12 months, the most
common being family visas.
o An approximately even split of visa recipients were male (2,281) and female (2,429).
o English proficiency was the poorest amongst Humanitarian visa holders, of which
347 of a total 381 spoke poor or no English.
o Skilled visa holders were most likely to speak Punjabi or English as their preferred
language
o Arabic and Karen were the most common languages spoken amongst humanitarian
visa holders.
o Tertiary qualifications were highest amongst Skilled visa holders.
Overall migration patterns
City-wide A total of 58,174 people moved into Wyndham between 2011 and 2016 from locations overseas,
other states within Australia, or from within Victoria. Over the same period, 24,217 people moved
from Wyndham to other cities in Victoria or to other states in Australia. The number of people who
left to go overseas is unknown. Migration to and from Wyndham intensified over the years: almost a
third (32.6%) of those who moved to Wyndham since 2011 did so in 2015. Of all those who left since
2011, 41 per cent did so in 2015.
Table 1 breaks down in- and outflows for the 2011-2016 period. Of the nearly 60,000 people who
moved into Wyndham, half moved from another location in Victoria. A further 36 per cent arrived
from overseas. The remaining 13% arrived from interstate. Conversely, just over 80 per cent of
people who moved from Wyndham to another location stayed within Victoria. Overall, the number
of those who moved into Wyndham was around two and a half times larger than the number of
those who moved out. In all cases in Table 1 there was net positive migration – the number of
people moving in exceeded the number of people leaving.
Because other cities in Victoria represent the majority of those who come in and moved out, Table 2
below provides additional detail of cities within Victoria that Wyndham residents have moved to and
from between 2011 and 2016. The table also indicates what proportion of these flows have taken
place in 2015.

Table 1: Migration flow breakdown by origin and destination, 2011-2016
Number of people who moved in Number of people who moved away Net migration
Total 58,174 24,217 33,957 Overseas 20,952 - - Victoria 29,497 19,539 9,958 New South Wales 2,975 1,341 1,634 Queensland 1,935 1,712 223 South Australia 882 391 491 Western Australia 814 649 165 Tasmania 451 182 269 Northern Territory 283 147 136 Australian Capital Territory 380 256 124 Other Territories 5 0 5 Not stated 13,364 - -
Hobsons Bay and Brimbank, both adjacent to Wyndham, have been the largest origins for most of
Wyndham’s arrivals in the past five years. Almost one third of the five-year inwards migration flow is
from those two municipalities. As for people leaving Wyndham, Hobsons Bay is still the most popular
destination, followed closely by Melton and Greater Geelong. In addition, more people left
Wyndham to go to Melton and Greater Geelong than vice versa.
Table 2: Migration to and from other municipalities in Victoria
Number of people who moved to Wyndham (2011-2016)
Number of people who moved from Wyndham (2011-2016)
Net migration (2011-2016)
Proportion of arrivals that took place in 2015
Proportion of departures that took place in 2015
Hobsons Bay (C) 5,332 2,283 3,049 35.6% 45.2% Brimbank (C) 3,996 1,058 2,938 31.8% 50.8% Maribyrnong (C) 2,386 835 1,551 29.4% 43.5% Melbourne (C) 1,248 586 662 45.3% 55.6% Melton (C) 1,094 1,976 -882 35.7% 40.3% Greater Geelong (C) 1,078 1,918 -840 45.8% 37.2% Moreland (C) 1,046 329 717 40.9% 52.9% Moonee Valley (C) 968 490 478 31.7% 39.6% Glen Eira (C) 941 280 661 33.7% 45.4% Monash (C) 820 479 341 35.6% 45.7% Other 10,588 10,864 -276 34.4% 33.5%
Suburbs Identifying where those moving into Wyndham come from is one half of a two-part story. The other
half is in Table 3 below – the destinations of choice in terms of Wyndham suburbs. Almost a third
(29.6%) of those who have moved to Wyndham between 2011 and 2016 have moved into Point
Cook. Another approximate third (32.5%) have moved into Tarneit and Truganina. The table also
shows what per cent of arrivals between 2011 and 2016 took place in 2015. For most suburbs
around a third of arrivals took place in that year. In Werribee South and Laverton around half of the
arrivals took place in 2015. Lastly, the table shows the proportion of migrants in the total
population. Truganina and Williams Landing are suburbs where a large proportion of the population
– more than 40 per cent – consists of recent arrivals.
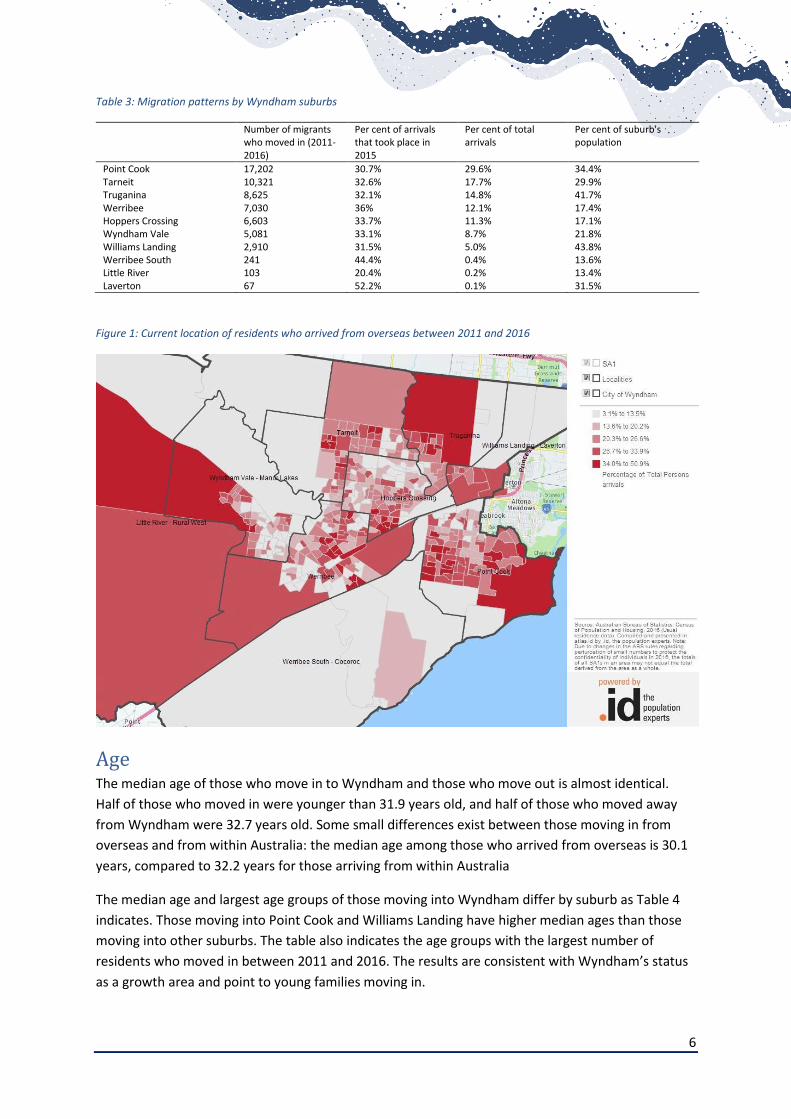
Along the above theme, Figure 1 below indicates the current locations of residents who arrived from
overseas between 2011 and 2016. The map illustrates the pattern identified in Table 3 and highlights
pockets in all suburbs where a large proportion of migrants from overseas now live. In all suburbs
except Little River and Werribee South there are areas where up to half of all residents have arrived
from overseas between 2011 and 2016.
6
Table 3: Migration patterns by Wyndham suburbs
Number of migrants who moved in (2011-2016)
Per cent of arrivals that took place in 2015
Per cent of total arrivals
Per cent of suburb's population
Point Cook 17,202 30.7% 29.6% 34.4% Tarneit 10,321 32.6% 17.7% 29.9% Truganina 8,625 32.1% 14.8% 41.7% Werribee 7,030 36% 12.1% 17.4% Hoppers Crossing 6,603 33.7% 11.3% 17.1% Wyndham Vale 5,081 33.1% 8.7% 21.8% Williams Landing 2,910 31.5% 5.0% 43.8% Werribee South 241 44.4% 0.4% 13.6% Little River 103 20.4% 0.2% 13.4% Laverton 67 52.2% 0.1% 31.5%
Figure 1: Current location of residents who arrived from overseas between 2011 and 2016
Age The median age of those who move in to Wyndham and those who move out is almost identical.
Half of those who moved in were younger than 31.9 years old, and half of those who moved away
from Wyndham were 32.7 years old. Some small differences exist between those moving in from
overseas and from within Australia: the median age among those who arrived from overseas is 30.1
years, compared to 32.2 years for those arriving from within Australia
The median age and largest age groups of those moving into Wyndham differ by suburb as Table 4
indicates. Those moving into Point Cook and Williams Landing have higher median ages than those
moving into other suburbs. The table also indicates the age groups with the largest number of
residents who moved in between 2011 and 2016. The results are consistent with Wyndham’s status
as a growth area and point to young families moving in.

Table 4: Median age and most common age groups by suburb, 2011-2016
Hoppers Crossing
Little River
Point Cook
Tarneit Truganina
Werribee Werribee South
Williams Landing
Wyndham Vale
Median age 30 29 34 32 30 30 31 34 32 Most common age group
30-34 years
10-14 years
30-34 years
30-34 years
30-34 years
25-29 years
25-29 years
30-34 years
30-34 years
Second most common age group
25-29 years
5-9 years 35-39 years
35-39 years
25-29 years
30-34 years
30-34 years
25-29 years
25-29 years
Third most common age group
35-39 years
30-34 years
25-29 years
25-29 years
35-39 years
35-39 years
35-39 years
35-39 years
5-9 years
Per cent of total migrant population
39.5% 42.1% 41.1% 47.2% 52.3% 38.3% 33.5% 48.3% 42.4%
Country of birth2 Wyndham’s multicultural character is strongly reflected in the country of birth of residents who have
moved in and out of Wyndham between 2011 and 2016. Table 5 summarises the data for the 20
largest countries of birth in terms of residents who moved in. The table also lists the number of
residents who moved out of Wyndham over the same period and the net population growth from
these migration flows. Lastly, the table indicates the number of people born in each country as a
proportion of total in- and outflows.
Australia, India, New Zealand, China and the Philippines are the most common countries of birth of
residents who moved into Wyndham between 2011 and 2016. These five countries of birth account
for more than two thirds (67.8%) of those who moved in between 2011 and 2016. As for people who
moved away from Wyndham, the top five countries of birth are Australia, India, New Zealand,
England and China – totalling 81.6 per cent. Internal and external migration is almost the same for
residents born in Australia. Almost all of Wyndham’s total net migration (some 98.7 per cent) is the
result of people who were born in countries other than Australia.
Table 5: Migration flows by country of birth, 2011-2016
Country of birth Number of people who moved in
Number of people who moved away
Net migration Per cent of those who moved in
Per cent of those who moved out
Australia 16,761 16,330 431 28.8% 67.4% India 13,820 1,250 12,570 23.8% 5.2% New Zealand 3,561 776 2,785 6.1% 3.2% China (excludes SARs and Taiwan) 3,326 671 2,655 5.7% 2.8% Philippines 1,986 338 1,648 3.4% 1.4% England 1,311 740 571 2.3% 3.1% Pakistan 1,224 93 1,131 2.1% 0.4% Bangladesh 930 79 851 1.6% 0.3% Myanmar 926 91 835 1.6% 0.4% Malaysia 899 231 668 1.5% 1.0% Sri Lanka 896 180 716 1.5% 0.7% Vietnam 643 199 444 1.1% 0.8% Indonesia 591 152 439 1.0% 0.6% Thailand 583 113 470 1.0% 0.5% South Africa 526 172 354 0.9% 0.7% Ethiopia 475 73 402 0.8% 0.3% Korea, Republic of (South) 418 126 292 0.7% 0.5% Singapore 366 109 257 0.6% 0.5% Fiji 361 75 286 0.6% 0.3% Sudan 337 29 308 0.6% 0.1%
2 The patterns present in the country of birth flows are highly similar to the patterns observed in the language spoken at home and ancestry variables. These two variables are therefore not discussed in this profile.

8
As much as there is variation in where new residents were born, so too there will be variation in the
suburbs those residents reside in. As Table 6 indicates, residents born in Australia, New Zealand and
the Philippines have relatively low proportions of people moving into any one particular suburb –
movement into Point Cook is broadly consistent with that suburb’s total population growth.
Residents born in China, England and Myanmar tend to have moved to Point Cook. For example,
more than half of residents born in China (56.1%) and around 49% of residents born in England who
moved to Wyndham in the past five years moved into Point Cook). Almost three quarters of
Myanmar-born residents who moved here in the past five years now reside in Werribee and
Hoppers Crossing (74.4%).
Note also that there is a tendency for residents from the Indian subcontinent to move into Tarneit or
Truganina: this is the case for 48.2 per cent of Indian-born residents, 51.7 per cent of Pakistan-born
residents, 43.3 per cent of Sri Lanka-born residents and 48.8 per cent of Bangladesh-born residents.
The map in Figure 2 shows the location of Indian-born residents in Wyndham. The China-born
population resides principally in Point Cook and Williams Landing as Figure 3 shows.
Table 6: Most popular suburbs for recent arrivals by country of birth, 2011-2016
Country of birth Most popular suburb Second most popular suburb
Third most popular suburb
Other suburbs
Australia Point Cook Werribee Wyndham Vale Other suburb (24.5%) (20.1%) (14.2%) (41.3%)
India Tarneit Truganina Point Cook Other suburb (28.4%) (19.8%) (18.7%) (33.1%)
New Zealand Point Cook Tarneit Werribee Other suburb (28.8%) (22.0%) (12.2%) (37.0%)
China (excludes SARs and Taiwan) Point Cook Williams Landing Truganina Other suburb (56.1%) (11.0%) (10.4%) (22.5%)
Philippines Truganina Tarneit Point Cook Other suburb (21.0%) (19.5%) (18.5%) (41.0%)
England Point Cook Werribee Wyndham Vale Other suburb (48.9%) (15.6%) (9.4%) (26.2%)
Pakistan Tarneit Truganina Point Cook Other suburb (28.1%) (22.6%) (15.6%) (33.7%)
Myanmar Werribee Hoppers Crossing Wyndham Vale Other suburb (41.9%) (32.5%) (10.8%) (14.8%)
Sri Lanka Tarneit Point Cook Truganina Other suburb (22.3%) (21.0%) (17.4%) (39.3%)
Bangladesh Truganina Tarneit Werribee Other suburb (26.0%) (22.8%) (14.1%) (37.1%)
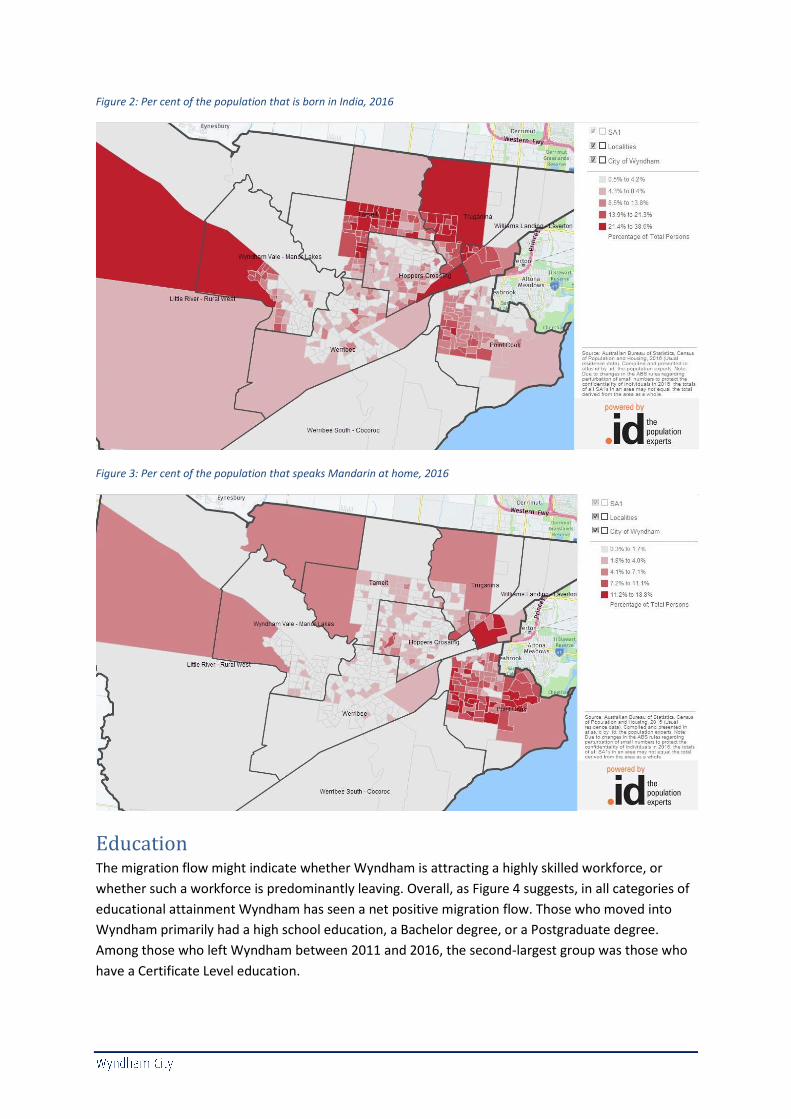
Figure 2: Per cent of the population that is born in India, 2016
Figure 3: Per cent of the population that speaks Mandarin at home, 2016
Education The migration flow might indicate whether Wyndham is attracting a highly skilled workforce, or
whether such a workforce is predominantly leaving. Overall, as Figure 4 suggests, in all categories of
educational attainment Wyndham has seen a net positive migration flow. Those who moved into
Wyndham primarily had a high school education, a Bachelor degree, or a Postgraduate degree.
Among those who left Wyndham between 2011 and 2016, the second-largest group was those who
have a Certificate Level education.

10
Figure 4: Migration flow by educational attainment, Wyndham
While net migration was positive and Wyndham saw an increase in the number of people in all
educational attainment levels, the educational attainment of those moving in was different from
those moving out as Figure 5 shows. Those with a Bachelor or Postgraduate degree formed a larger
proportion of those leaving Wyndham (38.4%) than those coming in (26.8%). On the other hand, the
relative number of people who moved to Wyndham and had a Certificate level is larger than people
who have a certificate level education and who moved elsewhere between 2011 and 2016. In other
words, a larger proportion of those leaving Wyndham was highly educated.

Figure 5: Distribution of educational attainment by arrivals and departures, Wyndham, 2011-2016
There are differences in the educational attainment of people who moved to Wyndham from
overseas, and those who came from areas across Australia. (Figure 6). For example, a higher
proportion of those who have moved to Wyndham from overseas have a Bachelor degree, and a
higher proportion have high school as their highest level of education. Conversely, a higher
proportion of those who moved to Wyndham from another location in Australia have a certificate.
The pattern of educational attainment among those who arrived from overseas likely reflects in part
a skilled migration inflow (potentially including lower-skilled spouses), and in part a humanitarian
migration inflow.

12
Figure 6: Distribution of educational attainment by arrivals from overseas and from elsewhere in Australia, Wyndham, 2011-2016
As previously mentioned, there are substantial differences in educational attainment levels between
those who move to and away from Wyndham. Figure 7 below shows for ten selected municipalities
that have high migration numbers (either to or from Wyndham) the percentage of people who have
a Bachelor degree or higher. In all ten municipalities, there are proportionally more people with a
Bachelor degree or higher who have left. This difference is largest in Hobsons Bay, which is directly
adjacent to Wyndham in the direction of the Melbourne CBD.

Figure 7: Proportion of the population with a Bachelor degree or higher over all arrivals and departures in cities with large migration flows with Wyndham, 2011-2016
There appears to be a relationship between educational attainment and suburb of preference
(Table7 7). The most attractive suburb for those with a Bachelor degree or higher is Point Cook
where almost a third of those with this level of education settled.
Table 7: Most popular suburbs for recent arrivals by educational attainment, 2011-2016
Education Most popular suburb Second most popular suburb
Third most popular suburb
Other suburbs
Bachelor degree or higher Point Cook Tarneit Truganina Other (31.0%) (18.0%) (15.4%) (35.7%)
Secondary school Point Cook Werribee Tarneit Other (23.2%) (17.7%) (16.2%) (42.9%)
Certificate level Point Cook Werribee Tarneit Other (22.2%) (19.2%) (15.1%) (43.5%)
In Point Cook, Wyndham Vale and Truganina those with a Bachelor degree or higher form the largest
group of recent arrivals (Table 8). In Hoppers Crossing, Little River, Werribee, Werribee South and
Wyndham Vale those with a secondary education form the largest group of recent arrivals.
Table 8: Educational attainment of recent arrivals in Wyndham suburbs, 2011-2016
Hoppers Crossing
Little River
Point Cook
Tarneit Truganina Werribee Werribee South
Williams Landing
Wyndham Vale
Bachelor degree or higher 22.8% 14.5% 38.6% 34.6% 40.7% 21.1% 20.0% 48.1% 24.9% Secondary school 42.2% 37.6% 32.1% 34.6% 30.3% 41.8% 46.0% 28.8% 38.1% Certificate level 17.3% 28.1% 12.3% 13.0% 10.4% 18.3% 21.1% 8.2% 19.4%

14
Employment While educational attainment, described above, indicates the skills that residents have, the other
side of the coin are employment outcomes. This section describes the migration patterns to and
from Wyndham in terms of labour force status, industry of employment, occupation and income. All
data refers to residents aged 15 years and over unless otherwise stated.
Labour force status Across all labour force status categories more people have moved to Wyndham than from Wyndham
between 2011 and 2016. The two largest categories by far are those employed full-time and those
not in the labour force (Figure 8). Almost half of those unemployed or not in the labour force have
arrived in 2015.
Figure 8: Migration flow by labour force status, Wyndham
The pattern of migration among those who move to Wyndham and those who moved away is shown
in Figure 9. Over half of those who move away from Wyndham have full-time employment (51.1%).
In contrast, 42.7 per cent of those moving to Wyndham are full-time employed. The opposite is true
for those not in the labour force where a greater proportion moving in are not in the labour force
(32.4%) compared with those moving out (24.7%).

Figure 9: Distribution of labour force status by arrivals and departures, Wyndham, 2011-2016
Labour force status also differs among those who have different places of origin. Figure 10 below
indicates that compared with those who arrived in Wyndham from another place in Australia, those
who arrived from overseas are less likely to have full-time employment, more likely to have part-
time employment or not be in the labour force.

16
Figure 10: Distribution of labour force status by arrivals from overseas and from elsewhere in Australia, Wyndham, 2011-2016
As previously mentioned, there are substantial differences in labour force status between those who
move to and away from Wyndham. Figure 11 below shows for 10 selected municipalities that have
high migration numbers (either to or from Wyndham) the percentage of people who have full-time
employment. Proportionally more full-time employed residents are moving to the nearby
municipalities of Hobsons Bay, Maribyrnong, Melbourne, Melton and Moonee Valley. Proportionally
more residents with full-time employment arrive in Wyndham from Glen Eira, Brimbank and
Monash.

Figure 11: Proportion of the population that has full-time employment over all arrivals and departures in cities with large migration flows with Wyndham, 2011-2016
The migrant population in the suburbs is as in Table 9. In Williams Landing almost half of all those
who moved there between 2011 and 2016 were full-time employed. At the same time, that suburb
also has the largest proportion of those not in the labour force. This is likely due to families where
one parent works. Werribee and Hoppers Crossing have the lowest proportions of full-time
employed recent arrivals and the highest proportion of unemployed recent arrivals – along with
Little River.
Table 9: Labour force status of recent arrivals in Wyndham suburbs, 2011-2016
Hoppers Crossing
Little River
Point Cook
Tarneit Truganina Werribee Werribee South
Williams Landing
Wyndham Vale
Full-time employed 39.1% 40.2% 47.7% 44.1% 46.0% 39.3% 41.0% 49.5% 45.3% Part-time employed 18.9% 21.9% 16.9% 18.7% 18.0% 18.1% 17.5% 18.0% 17.7% Unemployed 8.2% 7.6% 6.2% 7.1% 6.3% 7.6% 5.7% 6.6% 7.1% Not in labour force 30.7% 23.2% 26.0% 26.6% 25.7% 31.9% 31.6% 22.8% 26.8%
Industry In all industries of employment more residents have moved to Wyndham than away from
Wyndham. The one exception is the mining industry, where 90 residents left and 70 residents
arrived (Figure 12). The three industries with the highest net migration were Transport, Postal and
Warehousing, Health Care and Social Assistance, and Retail Trade.

18
Figure 12: Migration flow by industry, Wyndham
In several industries, proportionally more people have arrived in Wyndham between 2011 and 2016
than left. Figure 13 summarises the data for all industries. The Construction, Public Administration
and Safety, and Education and Training industries have seen relatively large proportions of
employees move away from Wyndham. Industries with proportionally large migration into
Wyndham were the Transport, Postal and Warehousing, Administration and Support Services and
Electricity, Gas, Water and Waste Services industries.

Figure 13: Distribution of industry of employment by arrivals and departures, Wyndham, 2011-2016
The key differences between those who arrive in Wyndham from overseas and those who arrive
from other places in Australia is that a larger proportion of those who arrived from overseas work in
service industries: Professional Scientific and Technical Services, Accommodation and Food Services,
and Administrative and Support Services. Those who arrived from another place in Australia are
proportionally more skilled in the Public Administration and Safety, Financial and Insurance Services,
and Construction industries. These substantial differences are likely due to Australia's visa program
being a primarily skills-based program.

20
Figure 14: Distribution of industry of employment by arrivals from overseas and from elsewhere in Australia, Wyndham, 2011-2016
Migrants working in particular industries also exhibit preferences to reside in particular suburbs. The
most common industries of working residents in Point Cook and Williams Landing are Professional
Services, Health Care, and Retail (Table 10). In many of the other suburbs, the Transport sector is
one of the three most common industries. The patterns in Table 10 are consistent with educational
attainment patterns observed in Table 8.

Table 10: Most common industries of employment of recent arrivals in Wyndham suburbs, 2011-2016
Hoppers Crossing
Little River Point Cook Tarneit Truganina Werribee Werribee South
Williams Landing
Wyndham Vale
Health Care and Social Assistance
Construction Professional, Scientific and Technical Services
Transport, Postal and Warehousing
Transport, Postal and Warehousing
Retail Trade Construction Professional, Scientific and Technical Services
Health Care and Social Assistance
Transport, Postal and Warehousing
Health Care and Social Assistance
Health Care and Social Assistance
Health Care and Social Assistance
Health Care and Social Assistance
Health Care and Social Assistance
Transport, Postal and Warehousing
Health Care and Social Assistance
Retail Trade
Retail Trade Manufacturing Retail Trade Retail Trade Retail Trade Transport, Postal and Warehousing
Retail Trade Retail Trade Transport, Postal and Warehousing
Occupation In all occupations, more residents have moved to Wyndham than away from Wyndham (Figure 15).
The three industries with the highest net migration were Professionals, Machinery Operators and
Drivers, and Labourers. While there were 4,419 Clerical and Administrative Workers who moved to
Wyndham, around half that number also left Wyndham. A similar ratio exists among Professionals.
As for Managers, net migration is about one third of all arrivals – while 3,261 Managers arrived in
Wyndham, just over 2,000 left Wyndham over the same period.
Figure 15: Migration flow by occupation, Wyndham
Figure 16 below shows for each occupation the proportion of total arrivals and departures. The
figure points to the different characteristics of those who moved to Wyndham between 2011 and
2016 and those who moved away in the same period. A higher proportion of Managers,
Professionals, Clerical and Administrative Workers and Technicians and Trades Workers moved away
from Wyndham. The gap is particularly large when it comes to Managers. Machinery Operators and

22
Drivers as well as Labourers are the occupations where proportionally more arrivals than departures
took place.
Figure 16: Distribution of occupation by arrivals and departures, Wyndham, 2011-2016
The key differences between those who arrive in Wyndham from overseas and those who arrive
from other places in Australia is that a larger proportion of those who arrived from overseas work as
Professionals and Labourers. Residents who arrived from another place in Australia are more likely
to work as Clerical and Administrative Workers, Managers and Technicians and Trades Workers.

Figure 17: Distribution of occupation by arrivals from overseas and from elsewhere in Australia, Wyndham, 2011-2016
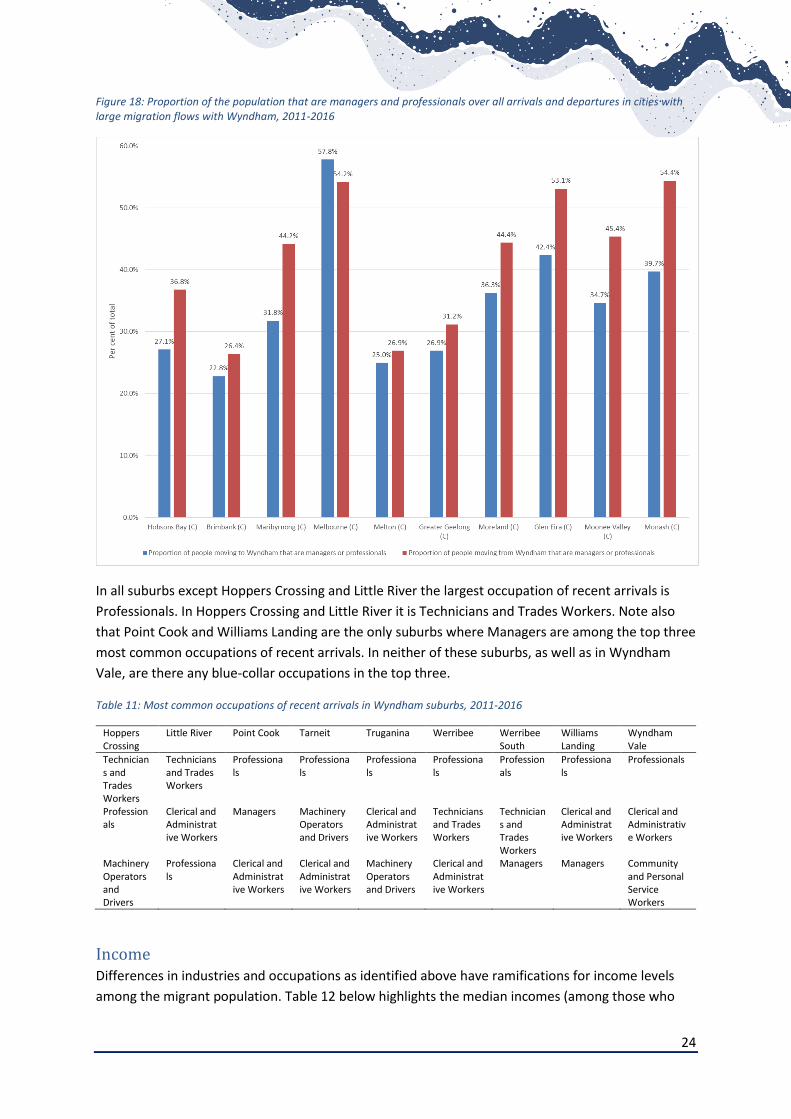
Managers and Professionals form a substantially larger proportion of those who left Wyndham for
other municipalities in Victoria than those who arrived in Wyndham between 2011 and 2016. The
only exception among the ten largest migration arrival and departure locations is the City of
Melbourne. As indicated in the Housing profile, more than 80 per cent of housing in Melbourne
consists of apartments. The movement of residents with Manager and Professional occupations
from Melbourne to Wyndham is possibly in part driven by housing affordability, and in part by
Melbourne residents having to move elsewhere if they do not want to live in an apartment.
Migration of residents in these same occupations from Wyndham to other municipalities as Figure
18 indicates is likely driven by lifestyle choices.
24
Figure 18: Proportion of the population that are managers and professionals over all arrivals and departures in cities with large migration flows with Wyndham, 2011-2016
In all suburbs except Hoppers Crossing and Little River the largest occupation of recent arrivals is
Professionals. In Hoppers Crossing and Little River it is Technicians and Trades Workers. Note also
that Point Cook and Williams Landing are the only suburbs where Managers are among the top three
most common occupations of recent arrivals. In neither of these suburbs, as well as in Wyndham
Vale, are there any blue-collar occupations in the top three.
Table 11: Most common occupations of recent arrivals in Wyndham suburbs, 2011-2016
Hoppers Crossing
Little River Point Cook Tarneit Truganina Werribee Werribee South
Williams Landing
Wyndham Vale
Technicians and Trades Workers
Technicians and Trades Workers
Professionals
Professionals
Professionals
Professionals
Professionals
Professionals
Professionals
Professionals
Clerical and Administrative Workers
Managers Machinery Operators and Drivers
Clerical and Administrative Workers
Technicians and Trades Workers
Technicians and Trades Workers
Clerical and Administrative Workers
Clerical and Administrative Workers
Machinery Operators and Drivers
Professionals
Clerical and Administrative Workers
Clerical and Administrative Workers
Machinery Operators and Drivers
Clerical and Administrative Workers
Managers Managers Community and Personal Service Workers
Income Differences in industries and occupations as identified above have ramifications for income levels
among the migrant population. Table 12 below highlights the median incomes (among those who

had a positive income) and the proportion of residents with negative or nil income for the 2011-
2016 and 2015-2016 periods. Key highlights are:
- Residents who moved away had a higher median income than those who arrived in
Wyndham ($955 per week compared with $868 per week).
- Residents who moved to Wyndham from overseas had a lower median income than those
who arrived from elsewhere in Australia ($749 per week compared with $915 per week).
- A larger proportion of residents who have moved to Wyndham had negative or nil income
compared with those who moved away (18.1 per cent compared with 9.2 per cent).
- Almost one third of residents who moved to Wyndham had negative or nil income (31.4%)
compared with just over a tenth of those who arrived here from elsewhere in Australia
(10.7%).
- Over the one-year period of 2015-2016, median incomes were lower on all accounts, and
the proportion of residents with negative or nil income was higher.
Table 12: Income level details for recent arrivals, Wyndham
2011-2016 period 2015-2016 period Median income Proportion of residents
with negative or nil income
Median income Proportion of residents with negative or nil
income
Residents who moved to Wyndham
$868 per week ($45,125 per year)
18.1% $831 per week ($43,223 per year)
24.9%
Residents who moved away from Wyndham
$955 per week ($49,666 per year)
9.2% $873 per week ($45,372 per year)
11.8%
Residents who moved to Wyndham from overseas
$749 per week ($38,927 per year)
31.4% $617 per week ($32,077 per year)
51.5%
Residents who moved to Wyndham from within Australia
$915 per week ($47,590 per year)
10.7% $869 per week ($45,164 per year)
14.3%
Figures 19 and 20 below detail the income distributions for migrant groups described in Table 12 for
the 2011-2016 period. The distribution of those who arrived in Wyndham and those who left (Figure
19) indicates that in all income categories above the $1,000-$1,249 bracket the proportion of those
who left is higher than the proportion of those who arrived. For most income groups from $1,000-
$1,249 and below the opposite is true.
The higher median income levels for local arrivals compared to overseas arrivals does not arise from
a particularly high difference in high income levels as Table 12 identifies. Rather, those who arrived
from elsewhere in Australia have substantially higher proportions of residents in middle income
groups, i.e. those between $800 and $1499 (37.1 per cent versus 28 per cent). More than half of
residents who arrived from overseas have income levels below $800 (53.5%) compared with those
who arrived from elsewhere in Australia (42.1%).

26
Figure 19: Distribution of income levels by arrivals and departures, Wyndham, 2011-2016
Figure 20: Distribution of income levels by arrivals from overseas and from elsewhere in Australia, Wyndham, 2011-2016
To identify whether there are patterns among those who have high and low incomes in relation to
moving to and from other Victorian municipalities, Figures 21 and 22 show the proportion of
residents who moved to and from the ten largest migration destinations and origins that have high
(Figure 21) and low incomes (Figure 22). In determining high and low income levels, the ABS metric
of high income being the top 20 per cent of earners and low income being the bottom 3 to 18 per
cent of earners applies. Applied to Wyndham, those who have high personal weekly income have an

income of $1,250 or higher. Those with low income levels have weekly incomes between $150 and
$399.
In relation to all the ten largest municipalities, when it comes to migration patterns, all except Glen
Eira and Melbourne receive proportionally more high income earners from Wyndham than they
send. The difference between the proportion of those with high income levels who are leaving
compared with those who are coming are highest in Greater Geelong, Hobsons Bay and Moreland.
Looking at low income earners (Figure 22), most cities are proportionally larger origins for Wyndham
residents than destinations. A higher proportion of low income earners move to Brimbank, Greater
Geelong and Hume than arrive from these locations. Taken together, Wyndham is proportionally
losing high income earners to neighbouring municipalities while gaining a proportionally high
amount of low income earners. The move to Wyndham is likely largely motivated by housing
affordability, while the move away from Wyndham is likely caused by wealth accumulation over time
which in turn allows residents to move to municipalities for lifestyle reasons.
Figure 21: Proportion of the population that have high personal income over all arrivals and departures in cities with large migration flows with Wyndham, 2011-2016

28
Figure 22: Proportion of the population that have low personal income over all arrivals and departures in cities with large migration flows with Wyndham, 2011-2016
In alignment with education, industry and occupation, some suburbs attract recent arrivals with
higher income levels. Table 13 shows that residents in Williams Landing and Point Cook have the
highest median income levels among recent arrivals, while Hoppers Crossing and Werribee have the
lowest median income levels.
Table 13: Income level details for recent arrivals by suburb, Wyndham, 2011-2016
Hoppers Crossing
Little River
Point Cook
Tarneit Truganina Werribee Werribee South
Williams Landing
Wyndham Vale
Proportion those who arrived and have nil or negative income
17.1% 9.2% 17.7% 18.5% 17.5% 12.6% 12.9% 18.1% 14.2%
Median income among those who arrived
$750 per week ($39,000 per year)
$825 per week ($42,894 per year)
$1,017 per week ($52,901 per year)
$859 per week ($44,644 per year)
$895 per week ($46,529 per year)
$744 per week ($38,712 per year)
$888 per week ($46,188 per year)
$1,042 per week ($54,174 per year)
$836 per week ($43,459 per year)
Visas The department of Social Services (DSS) developed the Settlement Reporting Facility (SRF) which
uses the Settlement Database to provide statistical data on permanent settles to Australia since
1991. The SFR brings together data from various sources such Medicare and the Department of
Immigration and Border Protection. The data presented is downloaded to the SFR in the first week of
each month, so the information is continuing to be updated. However, because of 2012 changes to

some skilled visas subclasses, these visas are not being categorised correctly and consequently a
large proportion of data is ‘unknown’. Furthermore, some of the data collected is voluntary again
leaving a lot of missing data. Other limitations to the data include no adjustment for those who have
permanently departed Australia or deceased.
In the past 12 months, it is estimated that just over 4,700 Wyndham residents were granted a visa,
the most common of these being family visas. An approximately even split of visa recipients were
male (2,281) and female (2,429). English proficiency was the poorest amongst Humanitarian visa
holders, of which 347 of a total 381 spoke poor or no English. Skilled visa holders were most likely to
speak Punjabi or English as their preferred language, while Arabic and Karen were the most common
languages spoken amongst humanitarian visa holders. Tertiary qualifications were highest amongst
Skilled visa holders.