migration working papers no. 143 oecd social ... - adaptenglishbulletin.adapt.it/docs/handel.pdf ·...
TRANSCRIPT

Please cite this paper as:
Handel, M. (2012), “Trends in Job Skill Demands in OECDCountries”, OECD Social, Employment and MigrationWorking Papers, No. 143, OECD Publishing.http://dx.doi.org/10.1787/5k8zk8pcq6td-en
OECD Social, Employment andMigration Working Papers No. 143
Trends in Job Skill Demandsin OECD Countries
Michael J. Handel
JEL Classification: J08, J23, J24
Unclassified DELSA/ELSA/WD/SEM(2012)14 Organisation de Coopération et de Développement Économiques Organisation for Economic Co-operation and Development 28-Nov-2012 ___________________________________________________________________________________________
English - Or. English DIRECTORATE FOR EMPLOYMENT, LABOUR AND SOCIAL AFFAIRS EMPLOYMENT, LABOUR AND SOCIAL AFFAIRS COMMITTEE
OECD SOCIAL, EMPLOYMENT AND MIGRATION WORKING PAPERS, No. 143 TRENDS IN JOB SKILL DEMANDS IN OECD COUNTRIES
Michael J. Handel
JEL Codes: J23, J24, J08 Keywords: skills demand, skill-biased technological change, human capital
For further information please contact Glenda Quintini ([email protected], +33 1 45 24 91 94). All Social, Employment and Migration Working Papers are available at www.oecd.org/els/workingpapers.
JT03331818
Complete document available on OLIS in its original format This document and any map included herein are without prejudice to the status of or sovereignty over any territory, to the delimitation of international frontiers and boundaries and to the name of any territory, city or area.
DELSA
/ELSA/W
D/SEM
(2012)14 U
nclassified
English - O
r. English
DELSA/ELSA/WD/SEM(2012)14
2
SUMMARY
This report examines skill trends in 24 OECD countries over the past several decades. The skill measures used include broad occupation groups, country-specific direct measures of skill requirements from international surveys, and direct skill measures from the Occupational Information Network (O*NET) database applied to both United States and European labour force surveys. Each kind of data has its own strengths and limitations but they tell a consistent story.
Economically advanced countries experienced a generally steady, continuous process of skill upgrading over the time periods for which data are available. Blue collar occupations saw the most pronounced relative declines, while less skilled white collar occupations increased their shares of the workforce initially before stabilising or declining slightly. There is no strong evidence of a general acceleration of skill upgrading in recent decades despite widespread talk of it as a consequence of the diffusion of Information and Communication Technologies. Official forecasts in the EU, Australia, Canada, New Zealand and the United States do not suggest acceleration in the next ten years.
Using the more specific skill measures in the O*NET database, analysis the suggests raised educational, cognitive and interpersonal skill requirements, while craft skills, physical demands and the frequency of repetitive physical tasks declined. Changes in European countries happened at a more rapid rate as some of the measured gap with the United States was closed. This more fine-grained method of measuring skills also suggests that trends are gradual.
The international survey data shows job educational requirements and learning times are mostly a function of occupations within an economy but are also affected by workers’ own human capital, gender, and institutional features of the employment relationship such as part-time and fixed-term contracts, as well as country differences net of these variables. Physical job requirements are affected similarly by these variables, but what is most notable is the modest rate of decline in the physical intensity of work in an ostensible age of automation and the lack of any observed decline in physical intensity within occupations.
The findings of this report do point to some, more specific, sources of concern: i) skill transferability and the sources of skill acquisition are not well understood and the available data are of poor quality; and ii) the level of cognitive skill demands among women is less than among men after controlling for a number of individual, job and family characteristics. More generally, the results point to the need to maintain education, training, and social policies that will support the process of skill upgrading observed rather consistently in the data. Although governments face strong pressures to cut their budgets, cutting human capital investment might be a drag on economic growth and living standards in the long-run. One component of such a strategy should be the development of guidance modules providing students with a full understanding of the full range of jobs available in the labour market, their entry requirements, working conditions, and monetary and non-monetary rewards. Finally, the quality of the data needs to be improved if firmer conclusions are to be drawn about trends in job skill requirements.
DELSA/ELSA/WD/SEM(2012)14
3
RÉSUMÉ
Ce rapport examine les tendances en matière de compétences observées dans 24 pays de l’OCDE au cours de ces dernières décennies. Les mesures de compétence utilisées sont les groupes généraux de professions, les mesures directes des compétences requises par pays, fournies par les enquêtes internationales, et les mesures directes de compétence de la base de données Occupational Information Network (O*NET) appliquées dans les enquêtes sur la population active aux Etats-Unis et en Europe. Chaque type de données a ses propres forces et ses propres limites, mais tous donnent des résultats cohérents.
Les pays économiquement avancés ont connu un processus continu et généralement régulier d’amélioration des compétences sur les périodes pour lesquelles des données sont disponibles. Les professions manuelles sont celles qui ont accusé le déclin relatif le plus marqué, tandis que la part des travailleurs non manuels peu qualifiés dans la population active s’est accrue avant de se stabiliser ou de baisser légèrement. Rien ne permet de conclure à une accélération générale de l’amélioration des compétences ces dernières décennies, même si l’on voit généralement dans ce phénomène une conséquence de la diffusion des technologies de l’information et de la communication. Les prévisions officielles de l’UE, de l’Australie, du Canada, de la Nouvelle-Zélande et des Etats-Unis ne laissent pas entrevoir d’accélération au cours des dix prochaines années.
Si l’on utilise les mesures de compétence plus spécifiques de la base de données O*NET, l’analyse semble indiquer une demande accrue de compétences éducatives, cognitives et interpersonnelles, mais une diminution de la demande de compétences professionnelles, de l’effort physique exigé et de la fréquence des tâches physiques répétitives. L’évolution dans les pays européens a été plus rapide et une partie de l’écart mesuré avec les Etats-Unis a été comblée. Cette méthode plus fine de mesure des compétences laisse penser aussi que l’évolution est progressive.
Les résultats d’enquêtes internationales montrent que les niveaux de formation et la durée d’enseignement requis sont essentiellement fonction des professions dans une économie mais dépendent aussi du capital humain et du sexe des travailleurs et des caractéristiques institutionnelles de la relation d’emploi, comme le travail à temps partiel et les contrats de durée déterminée, ainsi que des différences entre pays, compte non tenu de ces variables. Les exigences professionnelles physiques sont aussi fonction de ces variables, mais on remarque surtout la faible baisse de l’intensité physique du travail à l’ère de l’automatisation et l’absence de baisse observée de l’intensité physique dans les différentes professions.
Les conclusions de ce rapport passent sous silence certaines préoccupations plus spécifiques : i) la transférabilité des compétences et les sources d’acquisition de compétences ne sont pas bien comprises et les données disponibles sont de médiocre qualité ; and ii) le niveau de compétences cognitives exigé pour les femmes est moins élevé que pour les hommes, après prise en compte d’un certain nombre de caractéristiques individuelles, professionnelles et familiales. D’une manière plus générale, les résultats font ressortir la nécessité de maintenir des politiques sociales, de formation et d’éducation qui étayent le processus d’amélioration des compétences observé assez régulièrement dans les données. Même si les autorités gouvernementales sont fortement poussées à élaguer leurs budgets, réduire l’investissement en capital humain pourrait freiner la croissance économique et l’élévation des niveaux de vie dans le long terme. Un des éléments de cette stratégie devrait être de mettre en place des modules d’orientation permettant aux étudiants de comprendre pleinement l’éventail complet d’emplois offerts sur le marché du travail, les conditions d’accès à ces emplois, les conditions de travail et les récompenses monétaires en non monétaires. Enfin, il faudra améliorer la qualité des données si l’on veut tirer des conclusions plus fermes concernant les tendances des exigences en matière de compétences professionnelles.
DELSA/ELSA/WD/SEM(2012)14
4
TABLE OF CONTENTS
SUMMARY .................................................................................................................................................... 2
RÉSUMÉ ........................................................................................................................................................ 3
INTRODUCTION .......................................................................................................................................... 6
1. What is meant by skill requirements and skill demand? ......................................................................... 7 A. Defining and specifying the concept of skills ..................................................................................... 7 B. Measuring skills and skill demand ...................................................................................................... 9
2. Explaining skill shifts ............................................................................................................................ 12 A. Secular employment trends ............................................................................................................... 12 B. Technology........................................................................................................................................ 15 C. Organizational change ....................................................................................................................... 16 D. Trade and offshoring ......................................................................................................................... 17 E. Increased casualisation of employment ............................................................................................. 17
3. Outline of work ..................................................................................................................................... 18 4. Trends in the occupational distribution of employment ........................................................................ 21
A. Long-term and recent trends ............................................................................................................. 23 5. Trends in direct measures of skill requirements I: International surveys .............................................. 35
A. Explaining variation in cognitive skill requirements within and across countries ............................ 35 B. Physical job requirements across countries and over time ................................................................ 44 C. Trends in cognitive, interpersonal, and physical jobs demands in the European Union ................... 50 D. Job skill requirements by degree of specificity/generality and source of skill ................................. 56
6. Trends in direct measures of skill requirements II: National measures applied to labour force surveys in different countries ............................................................................................................................. 61 7. Conclusions and policy implications ..................................................................................................... 81
ANNEX 1. CORRELATIONS AMONG SKILL AND OTHER MEASURES IN THE EUROPEAN
SOCIAL SURVEY ....................................................................................................................................... 84
ANNEX 2. VALIDATING THE APPLICABILITY OF A COMMON SET OF OCCUPATIONAL SKILL SCORES ........................................................................................................................................... 85
ANNEX 3 OCCUPATIONAL SHARES AND THEIR CHANGES OVER TIME .................................. 102
ANNEX 4. CONSTRUCTION OF O*NET SCORES BY ISCO CODES ................................................ 109
REFERENCES ........................................................................................................................................... 113
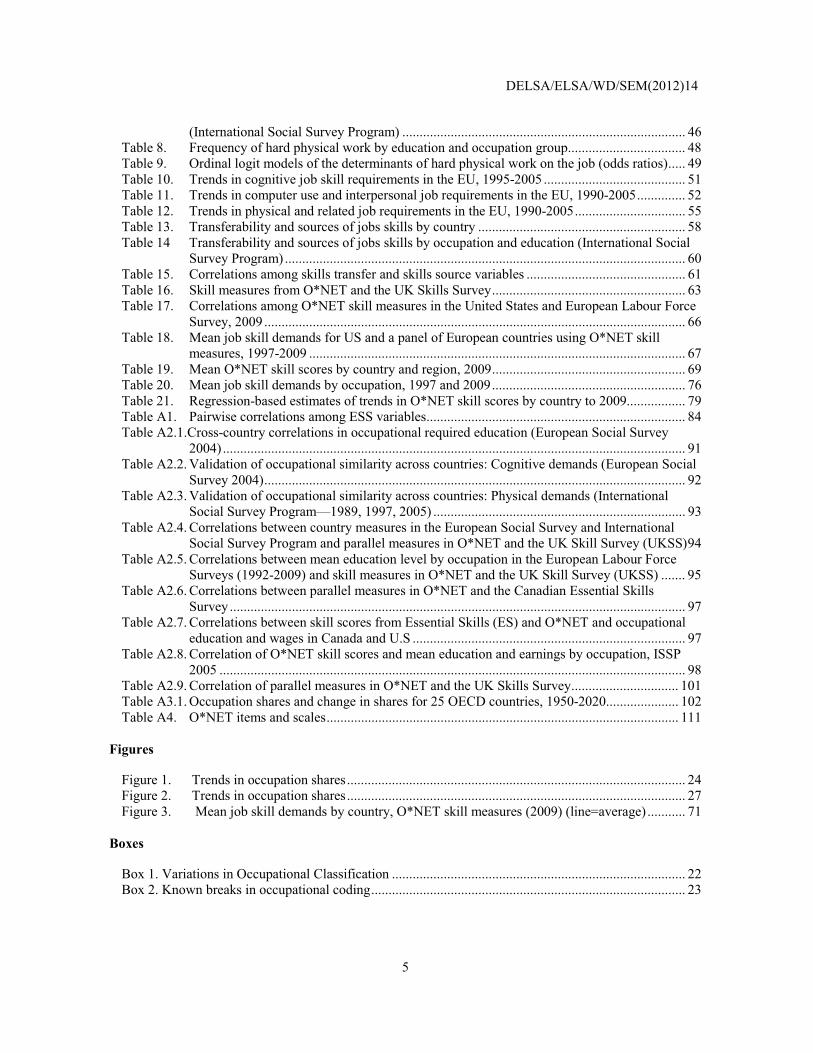
Tables
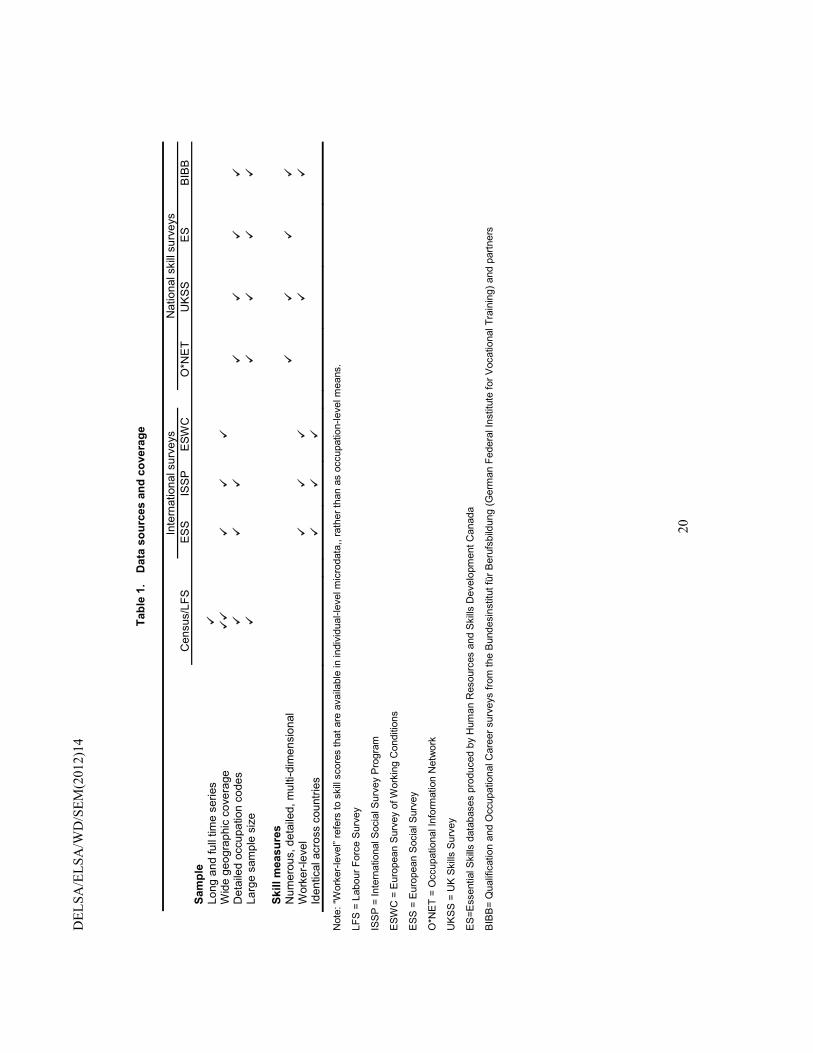
Table 1. Data sources and coverage ..................................................................................................... 20 Table 2. Trends in occupation shares ................................................................................................... 34 Table 3. Job and worker characteristics by country, 2004 (European Social Survey) ......................... 37 Table 4. Job and worker characteristics by one-digit ISCO occupation, 2004 (European Social Survey) ................................................................................................................................... 38 Table 5. Determinants of job education requirements in European countries, 2004 (European Social Survey) ................................................................................................................................... 40 Table 6. Determinants of (In) months required to learn job in European countries, 2004 (European Social Survey) ........................................................................................................................ 41 Table 7. Percentage of employees performing hard physical work across countries and time
DELSA/ELSA/WD/SEM(2012)14
5
(International Social Survey Program) .................................................................................. 46 Table 8. Frequency of hard physical work by education and occupation group .................................. 48 Table 9. Ordinal logit models of the determinants of hard physical work on the job (odds ratios) ..... 49 Table 10. Trends in cognitive job skill requirements in the EU, 1995-2005 ......................................... 51 Table 11. Trends in computer use and interpersonal job requirements in the EU, 1990-2005 .............. 52 Table 12. Trends in physical and related job requirements in the EU, 1990-2005 ................................ 55 Table 13. Transferability and sources of jobs skills by country ............................................................ 58 Table 14 Transferability and sources of jobs skills by occupation and education (International Social Survey Program) .................................................................................................................... 60 Table 15. Correlations among skills transfer and skills source variables .............................................. 61 Table 16. Skill measures from O*NET and the UK Skills Survey ........................................................ 63 Table 17. Correlations among O*NET skill measures in the United States and European Labour Force Survey, 2009 .......................................................................................................................... 66 Table 18. Mean job skill demands for US and a panel of European countries using O*NET skill measures, 1997-2009 ............................................................................................................. 67 Table 19. Mean O*NET skill scores by country and region, 2009 ........................................................ 69 Table 20. Mean job skill demands by occupation, 1997 and 2009 ........................................................ 76 Table 21. Regression-based estimates of trends in O*NET skill scores by country to 2009................. 79 Table A1. Pairwise correlations among ESS variables ........................................................................... 84 Table A2.1.Cross-country correlations in occupational required education (European Social Survey 2004) ...................................................................................................................................... 91 Table A2.2. Validation of occupational similarity across countries: Cognitive demands (European Social Survey 2004) .......................................................................................................................... 92 Table A2.3. Validation of occupational similarity across countries: Physical demands (International Social Survey Program—1989, 1997, 2005) ......................................................................... 93 Table A2.4. Correlations between country measures in the European Social Survey and International Social Survey Program and parallel measures in O*NET and the UK Skill Survey (UKSS) 94 Table A2.5. Correlations between mean education level by occupation in the European Labour Force Surveys (1992-2009) and skill measures in O*NET and the UK Skill Survey (UKSS) ....... 95 Table A2.6. Correlations between parallel measures in O*NET and the Canadian Essential Skills Survey .................................................................................................................................... 97 Table A2.7. Correlations between skill scores from Essential Skills (ES) and O*NET and occupational education and wages in Canada and U.S ............................................................................... 97 Table A2.8. Correlation of O*NET skill scores and mean education and earnings by occupation, ISSP 2005 ....................................................................................................................................... 98 Table A2.9. Correlation of parallel measures in O*NET and the UK Skills Survey ............................... 101 Table A3.1. Occupation shares and change in shares for 25 OECD countries, 1950-2020..................... 102 Table A4. O*NET items and scales ...................................................................................................... 111
Figures
Figure 1. Trends in occupation shares .................................................................................................. 24 Figure 2. Trends in occupation shares .................................................................................................. 27 Figure 3. Mean job skill demands by country, O*NET skill measures (2009) (line=average) ........... 71
Boxes
Box 1. Variations in Occupational Classification ..................................................................................... 22 Box 2. Known breaks in occupational coding ........................................................................................... 23
DELSA/ELSA/WD/SEM(2012)14
6
INTRODUCTION
1. Researchers, policy makers, and the public are keenly interested in understanding how job skill requirements are changing over time. Employers seek insight on their firms’ current and future personnel needs. Job holders, job seekers, parents, and youth want to know which job prospects look favourable and to understand their requirements in terms of education, training, and other characteristics. Educators and training providers are concerned with the direction of change to remain responsive to student needs. Policy makers want to facilitate the creation of high-quality jobs and a qualified workforce to achieve broadly shared prosperity and national competitiveness in the context of ever-changing, sometimes turbulent, domestic and global economies. The influence of the job structure on living standards, inequality, social exclusion, and well-being underscore the importance of understanding these trends in employment.
2. There is a great deal of informal commentary on the direction and pace of change, generally citing the importance of rapidly changing information and communications technology (ICT), globalization, and, less frequently, increasing use of employee involvement practices and the decline of manufacturing employment. Many of these trends are expected to continue to affect labour markets in the foreseeable future. Some, such as ICT, are believed to accelerate the pace of change relative to the past.
3. However, measuring the rate of technological change as it affects the labour market has proven difficult, and labour market policy needs to be based on more than the casual empiricism behind the claim that the world is changing faster than ever. Researchers have devoted considerable effort to address these issues, much of it summarized in a companion document to this report, “Trends in Job Skill Demands in OECD Countries: A Review of the Literature” (Handel 2011).
4. Nevertheless, as that report indicated, considerable uncertainty remains regarding critical issues. There is general agreement that the long-term trend has been toward jobs requiring more education and cognitive skills, but the rate and timing of changes, the precise level and kinds of skills in demand, and the drivers of change are matters of debate and are often poorly understood.
5. In part the state of current understanding is a function of the general reliance on imprecise measures of job task content, such as occupation and employee education levels, reflecting the limitations of existing data. Indeed, a principal recommendation that will emerge from this study is the need for a coordinated, cross-national data program to collect detailed information on job skill requirements on a regular basis to inform national labour market policy and enable international benchmarking.
6. One of the most influential accounts of developments since 1980 is the theory of skill-biased technological change (SBTC), which emphasizes the effects of the diffusion of ICT on skill demands. SBTC theory implies that the direction of change favours the growth of higher-skill jobs, the rate of recent change is at least comparable to previous periods but more likely accelerating, and may have led to a more polarized distribution of jobs by skill level. The core of this report will present analyses addressing each of these issues, including the possible influences of ICT and other variables in driving these trends.
7. Other researchers have investigated the role of factors besides ICT, such as the decline of manufacturing and the rise of service industries, deunionization and deregulation of labour markets, and growing trade with lower-wage economies.
DELSA/ELSA/WD/SEM(2012)14
7
8. To address these issues, this report includes
� (a) analyses of a newly constructed time series of the occupational distribution of employment in 25 OECD countries extending backward fifty- to sixty-years and forward to forecasts for 2020 or nearby years for most countries;
� (b) analyses of various direct measures of skill requirements collected on a consistent basis by different cross-national surveys, covering smaller groups of countries for relatively recent years;
� (c) analyses of skill trends across 34 OECD, EU, and related countries from the early 1990s to 2009 using arguably better measures from employee surveys in the United States that are applied to data from the other countries at the detailed occupation level after appropriate validation exercises showing the plausibility of extending national skill scores to other countries
9. The occupation time series is a unique contribution of this report, involving the use of a harmonized data set from several national statistical and international agencies. There does not appear to be any previous attempt to examine occupation trends in advanced economies on this temporal and geographic scale.
10. The first section of this report explains some of the main conceptual and measurement issues involved in studying skill demand. The second section discusses the principal theories offered to explain changing job skill demands. The third section summarizes the guiding concerns and describes the data. The fourth, fifth, and sixth sections examine the evidence on changing job skill requirements in the OECD using trends in broad occupational groups and various direct measures of job skill requirements.
1. What is meant by skill requirements and skill demand?
11. Understanding trends in job skill requirements raises a number of conceptual, measurement, and data issues.
A. Defining and specifying the concept of skills
12. The concept of skill has sometimes proved difficult to define. Because this report focuses on the demand for skills, for present purposes, unless otherwise noted, “skills” refer to technical task requirements that are necessary for effective performance of jobs as structured by employers. This means the principal focus is on skills required by jobs, as opposed to the skills workers possess, which may differ in level or type from those required by jobs (Quintini 2011). Related concepts, such as knowledge and abilities, are included under the term “skills” for purposes of convenience.
13. Not only is the concept of skill complicated, so is the notion of requirements. Employers may adjust their hiring standards in response to the tightness or slackness of the labour market. They may distribute tasks of differing complexity to the same or similar positions depending on the different levels of human capital held by the employees filling the positions. Thus, the nature of the position and the occupants can affect the skill used in any given job. This report will show that job skill demands are strongly affected by the structure of employment, a workplace characteristic, but may also be partly endogenous to workers’ own education and experience levels. This means that in the long-run it is possible that skill requirements within jobs rise in response to rising education levels within the workforce. However, it is also possible that some of the observed growth in education levels within jobs reflects the signalling power of education; as a greater percentage of workers attain a given level of education, employers may adjust their educational requirements upward to continue drawing from the same percentiles of job applicant distribution.
DELSA/ELSA/WD/SEM(2012)14
8
14. Job skill requirements are also multi-dimensional. In the United States, the Dictionary of Occupational Titles (DOT) introduced an influential classification of skills as involving different levels of work with Data, People, and Things, corresponding to cognitive, interpersonal (or interactive), and manual (or physical) skills. This scheme has been validated formally numerous times and has proved very useful as a broad orienting device in thinking about the evolution of employment (e.g., Autor, Levy, and Murnane 2003).
15. The content of each category can be specified further, as well. Some of the more important specific skills are noted below.
� Cognitive skills: required level of education, reading, writing, math, scientific/technical knowledge, general reasoning or problem-solving skills
� Interpersonal skills: managing people, customer service, team decision making, formal presentations
� Manual skills: levels of physical effort, kinds of physical activities (e.g., standing, lifting, carrying), use of different tools, machinery, materials, and equipment with varying complexity
16. Substantively, there is general agreement that physical job demands have declined over time and both cognitive and interpersonal demands have grown. However, there is considerable debate and uncertainty over the magnitude, rate, and timing of change, as well as the underlying causes. This report will employ the data-people-things schema and use measures that cover each domain, data permitting, to address these questions. Trends in cognitive skill requirements will receive the most attention, in keeping with most research and policy interest, because research suggests they have stronger effects on wages than the other two domains and they have the greatest relevance for education and training policy. Not surprisingly, the data are most plentiful for cognitive skills, as well.
17. Interpersonal skills, often called "soft" skills, have also been a focus of interest as employment shifts from manufacturing to services and employee involvement practices diffuse throughout the economy. The exact implications of interpersonal tasks for labour demand are not well established, although cognitive skills are more frequently measured and the greatest focus of interest in most discussions of skill issues.
18. Skills can also be distinguished on the basis of their generality (e.g., verbal and quantitative skills) versus occupational or job specificity (e.g., plumbing, computer programming). If rates of job switching have increased and job restructuring increasingly blurs traditional job boundaries, then one might expect the value of general skills to rise relative to narrower, but potentially deeper, job-specific skills. These considerations are reflected in the longstanding debate over the relative merits of German-style education systems that emphasize rigorous preparation and certification for specific careers and American-style general education systems that grant relatively few occupational credentials at the secondary level, but ostensibly permit more flexible movement between jobs and occupations across the life course. This report uses available data on the importance of formal schooling and workplace learning to shed light on the question of skill generality and specificity, and the alignment between educational and workplace skills.
19. In principle, it would be desirable to examine the kinds of specific skills used on the job in some detail. The latter can be measured partly and rather broadly according to whether or not certain field(s) of study clearly predominates among job holders in different occupations. Unfortunately, there are myriad, diverse occupationally specific skills (e.g., administering intravenous drugs, calculating net present values, operating a pneumatic jackhammer). Because each applies to small sub-populations they are quite difficult to cover in general labour force surveys, despite their obvious importance. Usually only sector-specific surveys or specialized compendia of occupational information like the Occupational Outlook Handbook
DELSA/ELSA/WD/SEM(2012)14
9
published by the United States Department of Labour have much detail on such skills. This information cannot be used for analysis even if it were in a single electronic database because the qualitative diversity of the skills prevents their conversion to units on some common scale (Handel 2008). For this report the length of time required to learn a job for the average person with the required education (job learning time) is used as a common-metric measure of specific skill demands across jobs.
20. A partial exception to the preceding is any skill of moderate generality that might cut across occupations and whose incidence is not obvious from the occupation title alone. The most important for present purposes are technology-related skills, such as computer use, which will be discussed insofar as data permits.
21. Finally, it should be noted that the concept of skill used here excludes certain personality and motivational characteristics, such as effort levels, conscientiousness, and demeanour, which often are not differentiated from skills in discussions of labour force requirements. However, this expands the concept of skill to include too much to be useful. One should distinguish between what people are able to do and what they are willing to do and between human capital and cultural capital, even if their boundaries are blurred and they interact in complex ways. All employers seek energetic, diligent, and good-natured workers, but these qualities are distinct from both cognitive and soft skills requirements; employer dissatisfactions over these qualities should not be conflated with skill shortages.
B. Measuring skills and skill demand
i. Skill measures
22. The concept of skill requires not only definition but also operationalization. However, there is no widely accepted and available standard classification or coding scheme for job skill requirements across countries comparable to International Standard Classification of Occupations (ISCO) or the International Standard Classification of Education (ISCED). Indeed, only a few countries have detailed sources of standardized information on job task content for their own workforces; cross-nationally consistent measures are even scarcer. This has forced many researchers to rely on relatively coarse or indirect measures of job skill requirements even within the context of national studies.
23. One measure is occupation title, which can be specified at varying levels of aggregation or detail. Occupation has the advantage of being widely available, relatively easy to use, and providing readily interpretable descriptions of the kind of work performed. Occupational data can also reveal the locations within the structure of employment that are driving change.
24. However, occupational title has three limitations. Occupation is a holistic concept, meaning that each occupational title refers to an indeterminate bundle of different kinds of skills (e.g., education level, reading, math). In addition, even if one wanted a scalar measure of skill, occupational title alone is insufficient because it is a nominal, not a quantitative or even fully ordinal, variable. Finally, practical considerations compel most studies of skill trends based on occupation to use relatively few, coarse categories, usually between two and ten highly aggregated groups, because results quickly become too unwieldy to interpret easily as the number of categories grows larger. Thus, occupational title is very useful, even essential, as a starting point for understanding changing skill demands, but numerical measures of job skill for multiple dimensions, such as data, people, and things, are necessary to complete the picture.
25. A readily available numerical alternative to occupational title is the mean education level of the workers in each occupation. This approach uses the education levels of workers to proxy for the required
DELSA/ELSA/WD/SEM(2012)14
10
education levels of occupations, but they may not always coincide. Surveys indicate significant numbers of workers consider their job requires a level of education different from their own (Quintini 2011). This may occur because education may be used as a credential or signal to regulate access to jobs on the basis of other characteristics, rather than serving as a genuine functional requirement. Economists also increasingly recognize that workers’ education levels reflect their social and cultural capital in addition to technical skills or human capital (Heckman and Rubinstein 2001). In these cases incumbents’ education is not a valid or clean measure of skill requirements.
26. In addition, educational quality may also vary across time and across countries. A cross-national study also needs to consider that there may be variation in the meaning of different degrees or attainment levels across countries for people with the same number of years of education.
27. Finally, education levels have been rising broadly over a long period for many reasons other than changing job demands (e.g., restrictions on child labour, changing conceptions of length of childhood and socialization requirements, conceptions of citizenship and national unity, democratized access to education). Even within demonstrably less-skilled and slowly changing occupations, such as taxi driver, it has been shown that mean education levels rose in tandem with general education levels (Handel 2000).
28. Ranking occupations by the mean cognitive test scores of their incumbents is one way around the issues of credentialism and the non-stationarity of education levels. Test scores are often considered measures of general cognitive ability, even if designed to measure somewhat more specific constructs such as literacy, and are, in principle, a more direct measure of cognitive skills than education. Test scores are also arguably closer to an interval-level measure because they are measured more finely than education and do not require deciding whether or not to weight years of secondary and tertiary education equally.
29. However, mean test scores by detailed occupation have been used infrequently because the data are scarce. There are also some substantive issues with using test scores as a measure of job skill demands. Occupations that have greater barriers to entry, such as licensing or credential inflation, may have job incumbents with higher scores than less restrictive occupations even if they have similar levels of skill demands. Test scores also measure the characteristics of job incumbents rather than the content of job tasks themselves, which contradicts the principle in occupational psychology that job measures should rate the job not the person. Mean test scores also do not yield information on the particular kinds of cognitive skills that jobs require nor do they provide information on any non-cognitive job skill requirements.
30. Sometimes mean earnings by occupation are used as indirect measures of skill but this is problematic because of other, non-skill influences on average wages (e.g., gender composition, wage-setting institutions). Moreover, earnings reflect the value of skills and may fluctuate even if the level of skill required in a job does not. This approach is also completely unusable when the goal is to relate skill demands to wages as a dependent variable. In this case an independent measure of skill demands is required to avoid correlations that are largely tautological.
31. Alternatively, researchers treating wages as skill prices have pointed to increasing returns to education in the context of non-decreasing supplies as indirect indicators of growing skill demand. This is a stronger approach but does not allow for the fact that wages are not only skill prices but also reflections of other influences, such as wage norms, the macro environment, variations in rent-sharing, labour market segmentation, and institutions like the minimum wage, the relative power of unions, and corporatist bargaining arrangements. Likewise, education reflects more than human capital, as discussed above. Finally, without more detailed measures these analyses cannot shed light on the particular kinds of skill requirements that have been changing over time.
DELSA/ELSA/WD/SEM(2012)14
11
32. Ultimately, the best measures of skill requirements are those that measure job task content directly. There are a few such measures on cross-national surveys, such as the European Survey of Working Conditions, and some national databases, such as the DOT and its successor, the Occupational Information Network (O*NET), in the United States, the UK Skills Surveys (UKSS), the Canadian Essential Skills program (ES), and the German Qualification and Career Surveys conducted by the German Federal Institute for Vocational Training (Bundinstitut für Berfusbilding or BIBB). These data measure a wide variety of skill dimensions using ordinal and sometimes interval scales.
33. DOT ratings are derived from information collected by trained job analysts who observe and interview workers during field visits to job sites. Canada has also collected occupational skill scores using expert raters as part of its Essential Skills project. Most others collect information from job incumbents using standardized surveys. These measures are optimal because they are designed to rate job characteristics directly rather than using workers’ personal characteristics as proxies, and are measured independently of outcomes like wages, which reflect other influences. Some are available only in the form of occupation means, while others are available in worker-level survey databases. The latter capture within-occupation variation but also contain significant measurement error that is averaged away in the former. Because of the scale of these projects, many are not updated regularly, so they do not capture within-occupation changes.
34. The preceding suggests that direct measures of skill are the most useful for understanding trends in job skill demands, followed by occupation, cognitive test scores, and personal educational attainment; this report relies most heavily on the first two, direct measures and occupation. Wages are a key outcome variable and also a useful diagnostic for demand trends, particularly when integrated with consideration of the supply of educated workers but are generally beyond the scope of this report due to issues of data availability and cross-national consistency.
ii. Skill demand
35. Measuring the demand for skill is also complex. The simplest approach, assuming an adequate measure of skill, is to examine the quantity demanded (e.g., occupation shares, average job skill score trends).
36. Other indicators of demand include unemployment rates by employee skill level, job vacancy rates by job skill level, employer survey reports of skill requirements, and various measures of over- and under-education and over- and under-skilling (see Quintini 2011).
37. However, it is possible that the underlying demand for skill is rising while the observed skill structure of employment is not increasing or not increasing as fast as demand because of lags or barriers to an effective supply response. This disequilibrium phenomenon would be expected to raise skill prices and is the rationale for the study of trends in the returns to education, though the results are clouded by the potential impact of institutional and other factors, as noted.
38. Finally, in measuring skill demand it is important to distinguish between levels, trends, and rates of change in demand. Both popular perception and the SBTC thesis tend toward the view that the demand for skill is high and rising at an accelerating rate, particularly given the pace of change in ICT hardware and software development. Therefore, it is important to recognize that
� high levels of skill demand at any point in time do not necessarily imply a rising trend in skill demand
� a rising trend does not necessarily imply that the level (or complexity) of skills demanded is high
DELSA/ELSA/WD/SEM(2012)14
12
� a rising trend in skill demand observed in one period does not necessarily imply that the rate of growth in demand has accelerated relative to previous periods
39. The preceding has an important implication for research. There is a common belief that the rate of change in skill requirements has accelerated over time and will continue to do so, but without an established time series showing past rates of change there is no way to know whether observed trends represent acceleration or not. Likewise, in the absence of an acknowledged absolute standard, there is no way to define “rapid change” except by reference to historical patterns. Stated simply, the present cannot be understood without comparisons to the past.
40. In addition, understanding the impacts of trends in information technology and globalization is aided greatly by data preceding their rise. While it is informative to understand whether change has continued to accelerate over the course of the present, high-tech and globalised era, one might expect that the greatest contrast would be between the period as a whole and preceding decades, such as the 1960s or 1970s. The problem is that historical data to test any form of the acceleration hypothesis are scarce and restricted to broad occupation group.
2. Explaining skill shifts
41. The preceding referred briefly to some perspectives and forces potentially affecting job skill requirements. The major research perspectives and considerations are reviewed in greater detail below (for details on empirical results, see Handel 2011).
A. Secular employment trends
42. It is important to recognize that changes in job skill requirements are not new. There is strong evidence of secular trend increases in the relative size of white collar occupations and service industries going back many decades or even over a century.
43. In the United States, the shares of workers in white-collar occupations at the upper end of the skill spectrum (managers, professionals, semi-professionals, technical workers) and at the middle or lower end (clerical, sales) increased during all or almost all of the twentieth century (Melman 1951; Chandler 1977). The causes of these changes are multiple and not fully understood. The early and continued growth of the indirect labour force within large corporations partly reflected needs for greater information, improved administration, and the elaboration of functions such as finance, accounting, R&D, operations research, planning, strategy, marketing, and personnel management. Both high-skill white collar and clerical jobs grew as a result of these changes within organizations. The proportion of high-skill workers in professions outside corporate employment (e.g., law, medicine, accounting, education) increased both as responses to these same forces and for less proximate reasons.
44. One important contributor to occupation shifts was the declining share of employment in manufacturing industries and the rising shares of various service industries, first noticed by Colin Clark in 1940 and elaborated upon by many others, particularly since the 1960s (Schettkat and Yocarini 2003). Though the timing and size of the shifts vary by country, the trend predates the widespread diffusion of computers in most OECD countries.
45. The service industries with growing employment include those that generally are considered high skill (health, education, business services, social services), some of which have many lower-skilled jobs, and those that are predominantly lower skill or at least lower paid relative to manufacturing (retail, food

DELSA/ELSA/WD/SEM(2012)14
13
service, personal services, leisure and hospitality). Because industries differ in their occupational composition, sectoral shifts in final demand for goods and services and varying rates of productivity growth will generate changes in the overall occupational distribution of employment.
46. Speaking generally, one can say that long-term sectoral trends imply declining proportions of blue-collar manufacturing workers and increasing proportions of managers and particularly professionals, as well as relatively low-skilled service workers, such as food service workers, health care aides, child care workers, and cashiers.
47. Again, a number of reasons could be cited for the relative growth of service industries:
� As living standards rise, consumer demand for services such as health, education, social services, hospitality, leisure, and retail, appears to grow faster than the demand for manufactured goods.
� The growth of female labour force participation stimulates market demand for services previously produced mostly in the home, such as meals and childcare.
� Population aging contributes to growth in healthcare services.
� The growth of the welfare state and other expectations regarding government services has increased employment in the public sector, which is disproportionately white collar.
48. In addition, labour productivity levels and growth rates within many service industries are lower than in manufacturing, so increased demand translates more directly into increased employment than in manufacturing.
49. For several decades demand has also increased at above-average rates for telecommunications, data processing and information services, and business services, such as finance and insurance. Unlike the other service industries, these industries have experienced significant productivity growth due to technological changes, including the spread of ICT, which offsets some or all of the employment effects of rising demand. The relative magnitudes of these effects are not clear from the literature and likely variable across industries and occupations (Feinstein 1999; Wölfl 2005).
50. Prior to the 1980s the shift to services was generally seen as part of a general upgrading of skill requirements and a strictly positive trend. For example, Bell (1973) popularised the concept of postindustrialism as a phase of economic and social development that succeeds industrialism, analogous to the previous shift from agricultural to industrial society. In this view, science, theoretical knowledge, and information increasingly replace energy as the driver of the economy; high-level services like finance, health, education, and government replace manufacturing as the leading industries, and highly educated professionals and technical workers replace the industrial working class and line managers as the dominant occupations. Previous class divisions, inequalities, and tensions were predicted to fade as societies become increasingly middle class.
51. Early dissenters from this positive postindustrial vision predicted that many of the growing white collar occupations would be clerical and sales positions that were either relatively low-skilled or would become deskilled through the increasing application of Scientific Management principles, often assisted by computer technology. For example, it was predicted that relatively skilled clerical jobs, such as secretaries, would be replaced by simple data entry and transcription jobs in factory-like typing pools, in which word processing software would automatically monitor keystroke rates in order to extract maximum effort (Braverman 1974, Garson 1988, Hartmann 1987).
52. In the 1980s, Bluestone and Harrison (1982, Harrison and Bluestone 1988) also cast industry sector shifts in a decidedly more negative light by noting that as relatively well-paid, medium- and low-
DELSA/ELSA/WD/SEM(2012)14
14
skill blue collar manufacturing jobs were declining, the jobs replacing them in service occupations and service industries tended to be lower-paid, such as fast food, retail, health aides, child care workers, cleaners, customer service representatives, and office temps. These jobs, sometimes called the service proletariat (Esping-Andersen 1993), tend to earn less than traditional working class jobs even when there are few discernible differences in skill (Howell and Wolff 1991). Individuals and sometimes whole communities that concentrated on manufacturing suffered as a result of the sector’s contraction. While the growing jobs clearly involve less onerous physical demands, they are also less likely to be protected by institutions such as unions, corporatist bargaining structures, or product market rent-sharing, and are more likely to be filled by women and part-time workers.
53. In this view, deindustrialization and associated occupational shifts are important not so much because they change the level of required skills but because they reduce the number of jobs with institutional protections, increasing earnings inequality and social exclusion (Harrison and Bluestone 1988). Both the deskilling and deindustrialization positions predict a more polarized occupational structure and earnings distribution, in contrast to postindustrial predictions of skill upgrading and growth in the size of the middle and upper middle classes.
54. Robert Reich (1991) synthesized the postindustrial and deindustrialization positions and added new concepts by dividing jobs into three broad categories. Routine production jobs include manufacturing production work, as well as any kind of repetitive clerical or professional job, such as data entry and routine software coding. “They are guided on the job by standard procedures and codified rules…” (Reich 1991, pp.175). Reich estimated this group accounted for 25 percent of U.S. employment in 1991 but its share is declining and its fate well-described by the deindustrialization position.
55. In-person service jobs are also routine but must be performed in the same place as their customers, including positions such as cleaners, taxi drivers, food service, hotel workers, child care providers, and real estate brokers. Though their levels of hard skills vary, the geographic requirement of co-presence limits competition from trade and offshore production, though not from imported, lower-wage immigrant labour, which is absent in Reich’s account. Many in-person service jobs also require high levels of interactive skills because creating a pleasing experience for the customer is part of the product. Reich (1991, pp. 177) estimated that in-person service work accounted for about 30 percent of employment in 1991 and would continue to grow.
56. Symbolic analysts are workers who perform research, solve complex and unstructured problems, provide insights and advice, coordinate or broker relationships, and manipulate symbols, which can include verbal representations and creative products, as well as knowledge use and data manipulation. Their work requires originality, abstract thought, and cleverness. Representative jobs include engineers, lawyers, consultants, systems analysts, marketing executives, creative professions, and university professors. In addition to working autonomously with information, such jobs also require cooperation and teamwork skills because the work is not closely directed from above and requires collaboration. Most symbolic analysts have at least a four-year university education. Some of this work is vulnerable to foreign competition, but symbolic analysts are the source of economic innovation, dynamism and competitiveness. They accounted for 20 percent of workers in 1991, compared to approximately 8 percent in 1950 (Reich 1991, pp.175, 177, 179)
57. Reich’s schema highlights the fact that work in postindustrial society involves personal service as much as information, knowledge, and creativity. Reich’s celebration of the growing importance of symbolic analysts is also balanced with concern over the vulnerability of routine production workers in a globalized world based increasingly on non-standardized products. To remedy growing inequality, Reich recommended increasing resources for education at all levels to broaden opportunities to become a symbolic analyst and upgrading the cognitive skill content of production and in-person service jobs.

DELSA/ELSA/WD/SEM(2012)14
15
B. Technology
58. In contrast to these views of secular change, the theory of skill-biased technological change (SBTC) focuses more specifically on the impressive growth of information and communications technology (ICT) in the last thirty years, which has understandably attracted broad interest as a possible driver of changing job skill requirements. ICT is a general purpose technology that has diffused widely across different industries and occupations. Prices have fallen and processing power has grown exponentially, contributing to the perception that recent trends in skill requirements have accelerated relative to the previous rates of change.
59. In the last twenty years a large research literature has investigated various paths by which ICT can increase job skill requirements. Computers can increase the skill demands within occupations because (Handel 2004):
� The software and equipment themselves require specific new skills to use them effectively
� Computer use alters job tasks in ways that require more general cognitive skills, such as conceptual understanding and abstract reasoning, quite apart from the narrower requirement to understand how to operate computer software and hardware
� Information becomes decentralized, prompting firms to restructure work roles in ways that require front-line workers to take on more decision-making and problem solving responsibilities, commonly known as employee involvement (EI) practices
60. Computers can also increase the demand for skill by altering the distribution of workers among occupations, even if the content of most jobs remains relatively unchanged (Handel 2004):
� ICT can require a greater number of skilled workers to manage the technology itself (e.g., programmers, technicians, maintenance workers) or to analyze the information it generates (e.g., accountants, market researchers)
� ICT can reduce the number of less-skilled workers by automating some positions out of existence rather directly (e.g., data entry clerks, telephone operators) or by facilitating greater self-service instead in place of service from others (e.g., word processing among managers and professionals reducing the need for secretaries).
61. Note that the within- and between-occupations distinction is important because not only are direct job skill measures scarce generally, most are suitable only for measuring the results of between-occupation shifts in the composition of the workforce. There are few repeated cross-section time series for which estimation of within-occupation skill changes are possible.
62. In a clear point of contrast to the deindustrialization argument, SBTC theory points to within-industry shifts in occupational composition as evidence of the role of technological change in skill upgrading and tend to discount the importance of the sectoral redistribution of jobs from manufacturing to services.
63. SBTC proponents initially argued that ICT altered the demand for skill according to a relatively smooth linear function; least skilled workers suffered the greatest drop in demand, middle skill workers experienced more modest declines, and the demand for high skilled workers increased. This view fit trends in wage inequality, employment, and education premiums in the 1980s, particularly in the U.S.
DELSA/ELSA/WD/SEM(2012)14
16
64. However, new patterns of inequality growth and employment shifts in the U.S. in the 1990s prompted a reassessment. Wages for the 10th percentile rose relative to the 50th percentile, which, in turn, lost ground relative to the 90th wage percentile. An influential new view consistent with this pattern is that technology has a polarizing effect on the demand for skill, reducing demand for routine cognitive and manual skills, which are believed to be mostly in the middle of the skill distribution, and increasing demand for high-level cognitive skills. In addition, interactive skills are considered intrinsically non-routine and not susceptible to substitution by machines. Because many service proletariat jobs, as well as in high-skill jobs, involve interactive tasks ICT raises demand and wages of both groups relative to middle-skill jobs.
65. The new view can be seen as elaborating Reich’s conceptions and also converges with Bluestone and Harrison’s work on polarization with the important difference that it emphasizes technology-driven demand shifts within industries rather than deindustrialization-driven changes in the distribution of jobs across industries.
66. It is not clear how proponents reconcile the linear and curvilinear accounts of skill-biased technological change. Either the curvilinear account supersedes the linear view of ICT impacts in the 1980s, which seems somewhat unlikely given the amount of research on that period, or ICT had different impacts on the structure of employment in the two periods for reasons not yet specified.
67. Although the SBTC literature focuses on the role of demand-side factors related to ICT diffusion, it is important to note that leading researchers are careful to hedge their conclusions regarding causality. Many conclude that decelerating growth in the supply of more educated workers in the United States, rather than accelerating demand for them, is an equally strong or stronger explanation of the growth in wage inequality since the late 1970s. Indeed, despite the rapid growth in computer use and computing power, there is little direct evidence of acceleration in the effects of technology on the labour market or the demand for skill (Mishel and Bernstein 1998).
C. Organizational change
68. The success of Japanese manufacturing in the 1980s and the high quality of its products prompted many employers in the United States, United Kingdom, and elsewhere to adopt employee involvement (EI) practices, which were perceived to be an important source of Japan’s competitive advantage. EI involves restructuring workplace responsibilities in ways that increase the decision making, technical problem solving, and quality control responsibilities of lower-level employees working in consultative or self-directed teams. The teams meet actively as groups and communicate with other parts of the organization, external customers, and suppliers. Thus, EI is believed to increase job requirements for both hard and soft skills. EI is usually accompanied by higher levels of employer-provided training and often more intensive selection processes, such as pre-employment skills tests and teamwork exercises (Handel and Levine 2004).
69. The nature of EI practices would be expected to increase demand for general cognitive skills, job-specific technical skills, and interpersonal or soft skills. However, the extent to which EI principles have diffused and the magnitude of their effects on jobs and skill requirements are not well established.
70. Computers are also believed to facilitate and stimulate the growth of EI programs because they replace manual tasks with mental labour within occupations and permit the decentralization of information and decision making to ordinary workers (Bresnahan, Brynjolfsson, and Hitt 2002).
DELSA/ELSA/WD/SEM(2012)14
17
D. Trade and offshoring
71. Increased trade in the last thirty years, particularly with low-wage countries, underscores the fact that OECD countries cannot be treated as closed economies; job opportunities can be reallocated not only within countries but also across them. Although most trade still occurs between developed countries an increasing share of imports now originates in lower wage countries, particularly in Asia, Mexico, and to a lesser extent in less advanced countries within Europe.
72. Few manufacturing production jobs are protected in principle from the threat of import competition. It is believed that a rising number of clerical, semi-professional, and professional jobs, often in service industries, are experiencing similar pressures (Blinder 2006).
73. Low-skill, in-person service jobs are relatively insulated from competition from low-wage foreign producers, though not from imported low-wage labour, because they must be produced at the point of consumption (e.g., food service, personal care, cleaners, transportation workers). The jobs are also difficult to computerize, as noted by recent SBTC theory. This makes it difficult to know the relative importance of demand growth, non-tradeability, and non-automatability in their persistence and growth.
74. Trade and offshoring have emerged as significant issues because they can reduce job opportunities for both older workers with long tenure, as well as new labour market entrants lacking established positions in threatened sectors. Research indicates that displaced workers with long tenure face difficult reemployment prospects and permanent wage losses (Kletzer 2001). Younger workers in communities that long relied on manufacturing employment can find their career plans disrupted in unexpected ways. This underscores the importance of worker flexibility in terms of both lifelong learning and geographic mobility, though displaced older workers clearly face barriers to reemployment that cannot be fully addressed by retraining and skills improvement alone.
75. Although trade and offshoring are clearly challenges for OECD countries, the magnitude of their effects is subject to great uncertainty and much debate. Globalization is altering job opportunities and skill requirements but its relative importance remains an open question.
E. Increased casualisation of employment
76. There is a widespread perception that the period after 1973 brought greater economic uncertainty and insecurity, particularly as it relates to employment, compared to the first twenty-five years of the post-war period. Although conditions have varied across countries and over time, the last thirty-five years have seen deep recessions, productivity slowdowns (and revivals), heightened anti-inflation vigilance, deregulation of product and labour markets, union decline, and welfare state retrenchment, in addition to forces described above, such as deindustrialization and increased import competition from low-wage countries.
77. The main implication for job skill demands, as opposed to wage levels, is that firms operating with less slack resources may contribute to the growth of temporary jobs, fixed-term contracts, and other forms of casual employment. Because employers are not committed to retaining such workers they are less likely to provide them with training. Thus, the spread of flexible staffing practices may lead employers to simplify or avoid upgrading some jobs, in contrast to the larger trend toward skill upgrading.
78. In the United States, the large numbers of low-wage, non-native speaking immigrant workers are another indication that intense competitive pressures can work in the direction of skill downgrading, though the extent of such pressures may vary according to countries’ migration policies.

DELSA/ELSA/WD/SEM(2012)14
18
3. Outline of work
79. In light of the preceding, this report uses data from multiple sources to address key descriptive and analytical questions that can be grouped into a number of categories.
Levels. What is the current state of job skill requirements and how do they vary across the advanced economies?
Trends. How are job skill requirements changing over time and has the rate of change accelerated recently?
Cross-sectional determinants. To what extent is cross-sectional variation in job skill requirements explained by:
� workplace characteristics of a technical character (e.g., occupation, industry);
� workplace characteristics of an institutional character (e.g., employment contract type)
� employee human capital
� other significant worker characteristics (e.g., gender, minority group, immigrant status)
� national effects net of the preceding that may influence the nature of jobs and educational preparation
Explaining trends. How important are long-run changes in the industrial and occupational composition of employment and more recent trends in ICT diffusion in accounting for skill trends?
80. Additional questions, such as the relative importance of formal education and general/specific skills will be addressed more briefly, as well.
81. The light that can be shed on any issue is always constrained by the quality of the data available. The ideal data set for this project would have high quality skill measures, covering many dimensions of skill, collected in a consistent fashion across time and place, ideally at the worker level, rather than as occupation means. The data would have a large sample and detailed occupation coding, covering a wide range of countries over many years in both the recent and pre-computer era.
82. No single data set available today has all of these characteristics, but several have different characteristics that make them useful sources of information on skill demand.
83. Any remaining limitations point to the desirability of an international data collection program designed specifically to provide this kind of information.
84. Census and labour force surveys have a long and full time series for all countries of interest. They cover both pre- and post-computer eras and are based on large samples, avoiding issues of reliability. Unfortunately, these data do not generally contain much skill-related information beyond occupational title and personal educational attainment.
85. Three surveys have skill measures of varying breadth, detail, and quality measured at the worker level on a consistent basis across countries: the European Social Survey (ESS), the European Survey of Working Conditions (ESWC), the International Social Survey Program (ISSP). Their country coverage is broad, but somewhat more restricted than the census and labour force surveys.

DELSA/ELSA/WD/SEM(2012)14
19
86. Unfortunately, these surveys have small samples and are available for only one to four years beginning no earlier than 1989. In addition, the ESWC, which has the widest set of skill measures, does not contain detailed occupation codes. Both the small sample sizes and limited occupational detail in the ESWC place some limitations on the analyses that can be performed using their skill variables. Response rates for these surveys also vary significantly across countries, probably more than for official government surveys, which may also affect the comparability of results across countries (Gallie 2007, Appendix).
87. The O*NET database and the UK Skills Survey have richer skill measures than the other sources but are restricted to single countries, and a single time period in the case of O*NET. This data is merged onto labour force surveys from other countries at the level of occupational means in order to examine skill trends resulting from occupational shifts.
88. The unavoidable reliance on occupational means in the absence of worker-level measures in national samples is a potential drawback, but may not be too serious as they average away error variance, as well as genuine within-occupation variation. For example, required education for one’s job measured at the individual level correlates 0.56 with personal educational attainment (Annex 1), but correlates 0.74 when required education is averaged across all respondents in the same occupation (Annex 2, Table A2.2) (for other examples see e.g., Autor and Handel 2008).
89. The assumption that occupational skill measures from one country can be generalized is tested in Annex 2 and is largely supported. Nevertheless, there is invariably some slippage between these measures and ones that would result from an international data collection program focused on job skill requirements.
90. Table 1 summarizes the characteristics of the data used or consulted for this report. Further details on the data are presented in the empirical sections that follow.
91. The first empirical section of the report examines occupational trends in OECD countries from 1950 or 1960 through 2009 and occupational projections through 2020 or nearby years. This is the only available source of information on long-run trends in skill demand and provides a useful overview perspective on levels and trends, as well as shedding some light on causal drivers. The second empirical section examines direct measures of skill that are available on a cross-nationally consistent basis in international surveys and the third section uses the skill scores in the O*NET database to examine skill trends in more differentiated fashion across a wider range of countries and years.
DEL
SA/E
LSA
/WD
/SEM
(201
2)14
20
Tabl
e 1.
D
ata
sour
ces
and
cove
rage
In
tern
atio
nal s
urve
ys
N
atio
nal s
kill
surv
eys
C
ensu
s/LF
S
ES
S
ISS
P
ESW
C
O
*NE
T U
KS
S
ES
B
IBB
Sa
mpl
e
Lo
ng a
nd fu
ll tim
e se
ries
�
Wid
e ge
ogra
phic
cov
erag
e ��
�
��
Det
aile
d oc
cupa
tion
code
s �
�
�
�
��
�La
rge
sam
ple
size
�
�
��
�
Skill
mea
sure
s
N
umer
ous,
det
aile
d, m
ulti-
dim
ensi
onal
�
��
�W
orke
r-lev
el
��
�
�
�Id
entic
al a
cros
s co
untri
es
��
�
Not
e: “W
orke
r-lev
el” r
efer
s to
ski
ll sc
ores
that
are
ava
ilabl
e in
indi
vidu
al-le
vel m
icro
data
,, ra
ther
than
as
occu
patio
n-le
vel m
eans
.
LFS
= L
abou
r For
ce S
urve
y
ISS
P =
Inte
rnat
iona
l Soc
ial S
urve
y P
rogr
am
ESW
C =
Eur
opea
n S
urve
y of
Wor
king
Con
ditio
ns
ESS
= E
urop
ean
Soc
ial S
urve
y
O*N
ET
= O
ccup
atio
nal I
nfor
mat
ion
Net
wor
k
UK
SS
= U
K S
kills
Sur
vey
ES
=Ess
entia
l Ski
lls d
atab
ases
pro
duce
d by
Hum
an R
esou
rces
and
Ski
lls D
evel
opm
ent C
anad
a
BIB
B=
Qua
lific
atio
n an
d O
ccup
atio
nal C
aree
r sur
veys
from
the
Bun
desi
nstit
ut fü
r Ber
ufsb
ildun
g (G
erm
an F
eder
al In
stitu
te fo
r Voc
atio
nal T
rain
ing)
and
par
tner
s

DELSA/ELSA/WD/SEM(2012)14
21
4. Trends in the occupational distribution of employment
92. Occupational title is useful as an indicator of general skill level and the type of work performed. Currently, there is no published, harmonized time series of long-term trends in the occupational distribution of employment in OECD countries.
93. The time series of occupational employment presented in this report was constructed from public information available from national statistical agencies, the International Labour Organisation’s (ILO) LABORSTA database, and the European Union’s (EU) central statistical agency, Eurostat. Occupational forecasts for European countries were provided by the European Centre for the Development of Vocational Training (CEDEFOP).1 Most forecasts for non-EU countries are from publicly available information produced by national statistical agencies.2
94. There are at least three sources of artefactual variation that complicate the construction of consistent and comparable time series (Hoffmann 2003; Elias and McKnight 2001; OECD 1998; Rytina and Bianchi 1984).
1. Countries differ in their definitions and classifications of occupations (geographic variation).
2. Countries report occupational data to the ILO using the International Standard Classification of Occupations (ISCO). However, international agencies have known from the beginning that national systems vary in their degree of consistency with ISCO and countries follow somewhat different rules and procedures when converting their own data into ISCO codes (recoding variation) (United Nations 1956, p.39).
3. Both countries and the ILO have revised their occupational coding schemes over time, which results in breaks in series even within geographic units (temporal variation).
95. All of these considerations make coding schemes less than fully consistent across time and place. Therefore, one needs to be alert to glaring contrasts and abrupt shifts that are more likely to be methodological artefacts than true changes in the structure of the workforce.
96. The problems are greatly reduced, but not eliminated entirely, when occupational data are aggregated to a relatively high level. A prior OECD project using fewer countries and time points than this report collapsed LFS occupational data into four large groups in order to minimize comparability issues, but at the cost of adopting quite coarse occupational categories (Colechia and Papaconstantinou 1996). This report uses seven occupation categories to preserve more detail, accepting somewhat greater likelihood of breaks in the different series. The main classification issues that arise when using one-digit occupation are summarized briefly in Box 1.
1 I thank Eurostat for providing specially requested occupational tabulations, CEDEFOP for providing
access to its country-specific occupational forecasts, and Mark Keese of OECD for originating and compiling large portions of this database.
2 I thank Gilles Bérubé and Benoit Delage of the Policy Research Directorate of Human Resources and Skills Development Canada for providing the most recent forecast of Canada’s labour demand at the 3-digit occupational level through 2018. I thank Ram Sri Ramaratnam of the New Zealand Department of Labour for providing his agency’s latest forecast of labour demand at the 3-digit occupational level through 2019.
DELSA/ELSA/WD/SEM(2012)14
22
Box 1. Variations in Occupational Classification
Occupational coding schemes face a number of choices in how to classify specific occupations even at the aggregate level of 1-digit occupational groups. Comparisons of different data series can produce contrasts that result from different classification practices rather than true differences in occupational composition, but the problems are not always large or difficult to correct through a harmonization procedure. Some of the most common classification dilemmas are described below.
Managers and administrators. There is significant variation in the classification of occupations that are categorized frequently as managers and related workers. Owners and managers of shops, restaurants and hotels, other small firms, and farms are often classified as sales, service, and farm workers, respectively, because the nature and complexity of the tasks is not as distinct from front-line workers as middle and upper managers in large firms, for example. Some systems use organizational size explicitly as a criterion in making classification decisions, while others do not. Sometimes the self-employed are included in this category if they run their own business. English-speaking countries may use more liberal definitions of managers, such as including all people who manage a function, rather than restricting the designation to those who have subordinates, responsibility for budgets, and control over a unit, as it common in other countries. First-line supervisors represent another example of the fuzzy boundary between managers and other occupations; they can be considered alternately the first level of management or the most senior member of their work group. Thus, office managers and supervisors are sometimes classified as clerical workers and blue-collar supervisors and foremen as skilled production workers, but other times as managers and administrators, depending on the occupational classification system.
Professionals, technical workers, and associate professionals. There is significant variability in whether occupations are classified as full professionals or placed in more junior categories, particularly technical workers and associate professionals, also known as semi-professionals and sometimes para-professionals. The problem is obviated in this report by treating these occupational groups as a single group, at the cost of greater within-group heterogeneity. In addition, the United States classifies business professionals as management-related workers, but other systems do not. Recent practice tends to classify sales staff in financial services and wholesaling and manufacturers’ representatives as associate professionals rather than as sales workers. Other occupations can be classified as either technical/associate professional jobs or high-skill production work, such as skilled workers who use automated manufacturing technology.
Clerical workers. In addition to the issues noted above, there is some variation in whether cashiers are classified as clerical or sales workers. Systems also differ in whether occupations like postal workers and messengers are included in the clerical group or with other workers, such as elementary occupations.
Sales workers. See entries above.
Service workers. Some classifications put higher-level or all protective service occupations in the associate professional category (e.g., police inspectors, detectives). Coding schemes also vary in whether they classify some occupations as service or elementary (laborer) occupations.
Agricultural workers. In addition to variation in the treatment of farm owners and managers noted above, low-level workers are alternately classified as agricultural or elementary workers, which are treated as part of the production and related occupations group in this report.
Production and related workers. In addition to the issues noted above, there is a great deal of variation in the assignment of workers to the major groups corresponding to craft, semi-skilled, and unskilled or elementary workers in manufacturing or similar blue-collar settings. The problem is avoided in this report by treating the three broad occupations as a single group. However, elementary occupations in the ISCO scheme (major group 9) also include occupations that are classed as service, agricultural, and to a lesser extent clerical and sales occupations in other systems.
Sources: Author’s review of various classifications and tabulations, Rytina and Bianchi 1984, Elias and McKnight 2001, Elias 2008, Elias and Birch 2010, Ganzeboom and Treiman 1996. Also helpful were conversations with David Hunter, Department of Statistics, International Labour Organization.
97. Known breaks in recent series are described in Box 2; this list is mostly drawn from European Foundation for the Improvement of Living and Working Conditions (2008) and is not comprehensive.

DELSA/ELSA/WD/SEM(2012)14
23
98. The seven categories used in this report are a modification of ISCO one-digit occupational categories:
� Managers
� Professionals, technical workers, and associate professionals
� Clerical workers
� Sales workers
� Service workers
� Agricultural workers, including farm, forestry, and fishing
� Production and related workers, including craft workers, machine operators and assemblers, labourers and other elementary occupations
Box 2. Known breaks in occupational coding
Austria. Occupations in retail trade were reclassified from salespersons to associate professionals in 2004.
Finland. Occupations in the health sector were reclassified from professionals to service workers in 2002.
Greece. Sharp drop in the number of agricultural workers without a corresponding increase in other occupations in 2004.
Ireland. Reclassification of a substantial number of agricultural workers as managers in agriculture in 1998.
Italy. Number of managers increases by 1,300,000 because retail sales and other workers reclassified as managers of small companies.
Portugal. Apparent reclassification of elementary occupations in private households as housekeeping service workers in 1998.
United Kingdom. Major change in national occupational coding system in 2001, known to have reduced the share of managers and reclassified some occupations in the health sector from professionals to service workers.
United States. Major change in national occupational coding system in 2003 known to have introduced significant discontinuities.
99. These seven categories denote different kinds of work tasks and are roughly orderable by skill, but each encompasses a wide range of skill levels and the ordinality of the categories is imperfect. These issues will be addressed in subsequent sections using direct measures of skill at the individual or detailed occupational level. The great virtue of the coarser occupational data is the long-term perspective they provide on the changing structure of employment.
A. Long-term and recent trends
100. The evidence presented below for 1950-2020 largely confirms post-industrial theory’s conception of the direction of change. With economic growth and development, the dominant occupational group shifts from farm workers to production jobs, and finally professional, associate professional, and technical jobs. Stable or rising shares of managerial jobs add to the share of high-skill jobs, while medium- and low-skill white collar jobs in clerical and sales occupations are more stable.
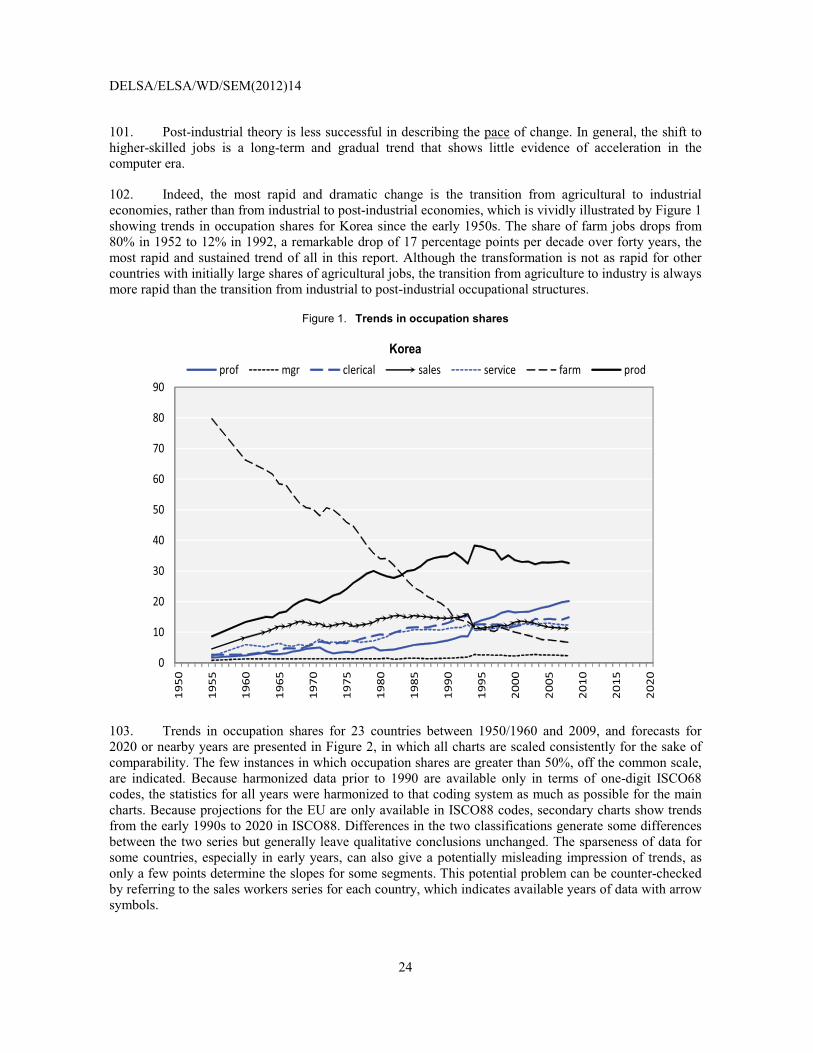
DELSA/ELSA/WD/SEM(2012)14
24
101. Post-industrial theory is less successful in describing the pace of change. In general, the shift to higher-skilled jobs is a long-term and gradual trend that shows little evidence of acceleration in the computer era.
102. Indeed, the most rapid and dramatic change is the transition from agricultural to industrial economies, rather than from industrial to post-industrial economies, which is vividly illustrated by Figure 1 showing trends in occupation shares for Korea since the early 1950s. The share of farm jobs drops from 80% in 1952 to 12% in 1992, a remarkable drop of 17 percentage points per decade over forty years, the most rapid and sustained trend of all in this report. Although the transformation is not as rapid for other countries with initially large shares of agricultural jobs, the transition from agriculture to industry is always more rapid than the transition from industrial to post-industrial occupational structures.
Figure 1. Trends in occupation shares
Korea
0
10
20
30
40
50
60
70
80
90
19
50
19
55
19
60
19
65
19
70
19
75
19
80
19
85
19
90
19
95
20
00
20
05
20
10
20
15
20
20
prof mgr clerical sales service farm prod
103. Trends in occupation shares for 23 countries between 1950/1960 and 2009, and forecasts for 2020 or nearby years are presented in Figure 2, in which all charts are scaled consistently for the sake of comparability. The few instances in which occupation shares are greater than 50%, off the common scale, are indicated. Because harmonized data prior to 1990 are available only in terms of one-digit ISCO68 codes, the statistics for all years were harmonized to that coding system as much as possible for the main charts. Because projections for the EU are only available in ISCO88 codes, secondary charts show trends from the early 1990s to 2020 in ISCO88. Differences in the two classifications generate some differences between the two series but generally leave qualitative conclusions unchanged. The sparseness of data for some countries, especially in early years, can also give a potentially misleading impression of trends, as only a few points determine the slopes for some segments. This potential problem can be counter-checked by referring to the sales workers series for each country, which indicates available years of data with arrow symbols.

DELSA/ELSA/WD/SEM(2012)14
25
104. From inspection of these time series, several patterns are apparent:
� The dominant impression is one of continuity in trends, rather than recent acceleration, as is generally assumed. Where sharp changes are observed they tend to be concentrated in a single year, suggesting a break in series due to classification changes rather than genuine change.
� Consistent with the Korean experience, if less dramatic, countries in which agricultural occupations account for at least 20% of the workforce in the early part of the series show very steep and consistent declines in that group’s share of employment before the trend usually decelerates at around 10% or less (Austria, Finland, Greece, Ireland, Japan, Korea, Portugal, Spain, and, to a lesser extent, France and Norway). Farm occupations in the United States exhibited a similar pattern prior to 1940 (Handel 2010). Annual rates of decline range from 0.65 percentage points (Norway) to 1.61 percentage points (South Korea) per year. At present, farm occupations represent only 2-5% of employment in most OECD countries, except Greece, Poland, Portugal, and Turkey. There is no question that the transition from a farm to a non-farm economy was very rapid for several OECD countries in the post-war period.
� For countries and years in which agriculture’s share was below 10%, production and related jobs clearly dominate initially in all countries. The shares of manual jobs decline notably in most countries, but generally somewhat less rapidly and consistently than trends for farm jobs. For many OECD countries, the share of production and related workers peaked at 40-50% of the workforce in the 1950s or 1960s and declined thereafter to reach 20-25% in 2009. For many of these countries the decline begins before the beginning of the modern computer in 1980 (Australia, Belgium, Canada, Germany, United Kingdom, Italy, Luxembourg, Netherlands, New Zealand, Norway, Sweden, Switzerland, U.S.). In other countries – notably, Greece, Ireland, Portugal, and Chile – the share of production and related workers peaked later at just 30-35% and declined less sharply. Finally, occupational projections suggest very modest declines in the next ten years for most countries.
� The employment share of professionals, technical, and associate professionals has grown rapidly in many, but not all, countries. This group has overtaken production workers as the largest of the seven occupational groups in all countries except Greece, Portugal, Spain, Japan, Korea, Chile, and Austria using the ISCO68 classification. This group accounts for 25-30% of the workforce in Anglo-Saxon,3 Continental, and Nordic countries using the ISCO68 classification scheme. If managers were added to this group, the employment share of high-skilled white-collar jobs in these countries would rise to about 32-40% compared to 7-15% in 1960. The level and growth of this combined group seem consistent with the notion of the rise of information- or knowledge-based economies. However, even in these countries upper white collar jobs still represent a plurality rather than a majority of jobs and include jobs spanning a wide range of the skill continuum, including many that fall well short of the more optimistic accounts of knowledge workers or symbolic analysts. In most other countries the combined high-skilled white-collar share is also substantial, generally ranging between 18-30%. However, recent and projected growth rates across all countries show continuity or deceleration relative to prior decades, rather than acceleration.
� Clerical and sales jobs, often considered as lower-skilled white-collar jobs, currently account for 23-30% of the workforce, compared to 10-25% in 1960. These middle- to low-skill jobs represent
3 The country classification generally follows that of Parent-Thirion, Fernandez Macias, Hurley, and
Vermeylen (2007). In this report, the term “Anglo-Saxon” is used only as a designation for predominantly Anglophone countries whose economies may resemble one another in certain respects due to shared histories, institutions, policy traditions and stances, and networks of communications and mutual influence.
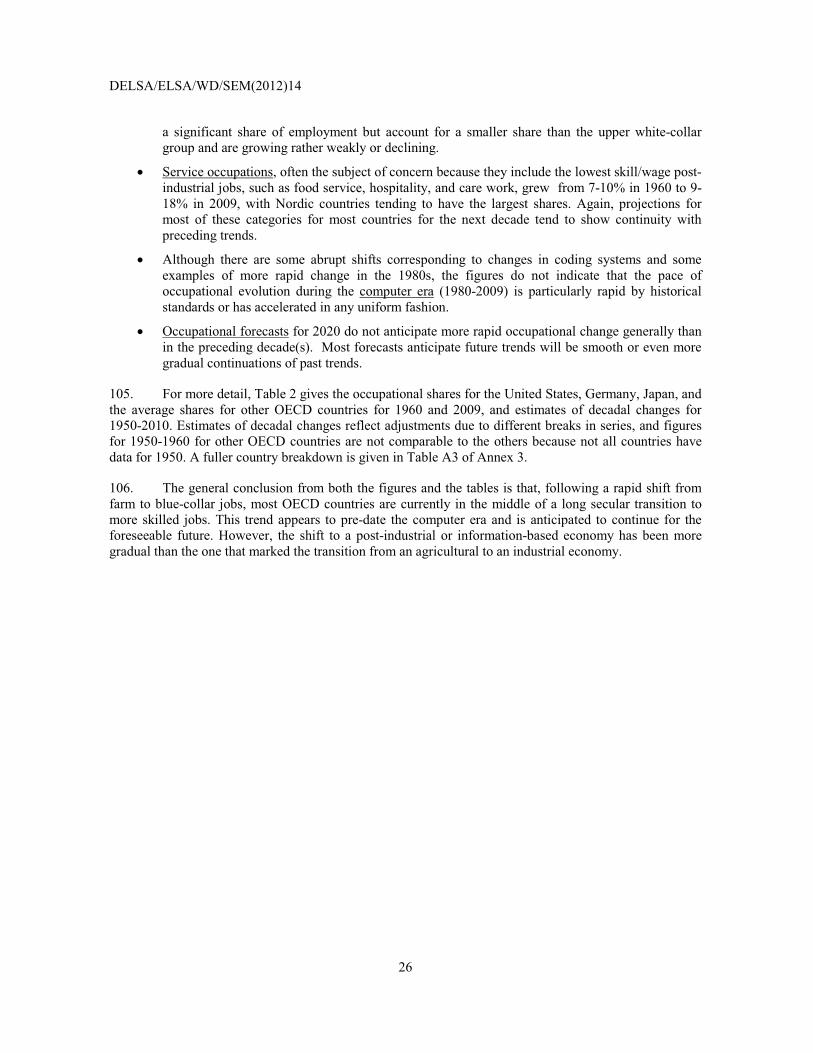
DELSA/ELSA/WD/SEM(2012)14
26
a significant share of employment but account for a smaller share than the upper white-collar group and are growing rather weakly or declining.
� Service occupations, often the subject of concern because they include the lowest skill/wage post-industrial jobs, such as food service, hospitality, and care work, grew from 7-10% in 1960 to 9-18% in 2009, with Nordic countries tending to have the largest shares. Again, projections for most of these categories for most countries for the next decade tend to show continuity with preceding trends.
� Although there are some abrupt shifts corresponding to changes in coding systems and some examples of more rapid change in the 1980s, the figures do not indicate that the pace of occupational evolution during the computer era (1980-2009) is particularly rapid by historical standards or has accelerated in any uniform fashion.
� Occupational forecasts for 2020 do not anticipate more rapid occupational change generally than in the preceding decade(s). Most forecasts anticipate future trends will be smooth or even more gradual continuations of past trends.
105. For more detail, Table 2 gives the occupational shares for the United States, Germany, Japan, and the average shares for other OECD countries for 1960 and 2009, and estimates of decadal changes for 1950-2010. Estimates of decadal changes reflect adjustments due to different breaks in series, and figures for 1950-1960 for other OECD countries are not comparable to the others because not all countries have data for 1950. A fuller country breakdown is given in Table A3 of Annex 3.
106. The general conclusion from both the figures and the tables is that, following a rapid shift from farm to blue-collar jobs, most OECD countries are currently in the middle of a long secular transition to more skilled jobs. This trend appears to pre-date the computer era and is anticipated to continue for the foreseeable future. However, the shift to a post-industrial or information-based economy has been more gradual than the one that marked the transition from an agricultural to an industrial economy.

D
ELSA
/ELS
A/W
D/S
EM(2
012)
14
27
Figu
re 2
. Tr
ends
in o
ccup
atio
n sh
ares
Ang
lo S
axon
Au
stra
liaC
anad
a
Irela
ndN
ew Z
eala
nd
05101520253035404550
1950
1955
1960
1965
1970
1975
1980
1985
1990
1995
2000
2005
2010
2015
2020
prof
mgr
cler
ical
sale
sse
rvic
efa
rmpr
od
05101520253035404550
1950
1955
1960
1965
1970
1975
1980
1985
1990
1995
2000
2005
2010
2015
2020
prof
mgr
cler
ical
sale
sse
rvic
efa
rmpr
od
05101520253035404550
1950
1955
1960
1965
1970
1975
1980
1985
1990
1995
2000
2005
2010
prof
mgr
cler
ical
sale
sse
rvic
efa
rmpr
od
1990
1995
2000
2005
2010
2015
2020
ISCO
68
clas
sific
atio
nIS
CO 8
8 cl
assi
ficat
ion
05101520253035404550
1950
1955
1960
1965
1970
1975
1980
1985
1990
1995
2000
2005
2010
2015
2020
prof
mgr
cler
ical
sale
sse
rvic
efa
rmpr
od

DEL
SA/E
LSA
/WD
/SEM
(201
2)14
28
Figu
re 2
. Tr
ends
in o
ccup
atio
n sh
ares
(con
t.)
Ang
lo-S
axon
U
nite
d K
ingd
omU
nite
d St
ates
05101520253035404550
1950
1955
1960
1965
1970
1975
1980
1985
1990
1995
2000
2005
2010
prof
mgr
cler
ical
sale
sse
rvic
efa
rmpr
od
1990
1995
2000
2005
2010
2015
2020
1951
= 6
2.6
05101520253035404550
1950
1955
1960
1965
1970
1975
1980
1985
1990
1995
2000
2005
2010
2015
2020
prof
mgr
cler
ical
sale
sse
rvic
efa
rmpr
od
ISCO
68
clas
sific
atio
nIS
CO 8
8 cl
assi
ficat
ion
Con
tinen
tal
Aust
riaBe
lgiu
m
05101520253035404550
1950
1955
1960
1965
1970
1975
1980
1985
1990
1995
2000
2005
2010
prof
mgr
cler
ical
sale
sse
rvic
efa
rmpr
od
ISCO
68
clas
sific
atio
n
1990
1995
2000
2005
2010
2015
2020
ISCO
88
clas
sific
atio
n
05101520253035404550
1950
1955
1960
1965
1970
1975
1980
1985
1990
1995
2000
2005
2010
prof
mgr
cler
ical
sale
sse
rvic
efa
rmpr
od
1990
1995
2000
2005
2010
2015
2020
ISCO
68
clas
sific
atio
nIS
CO 8
8 cl
assi
ficat
ion
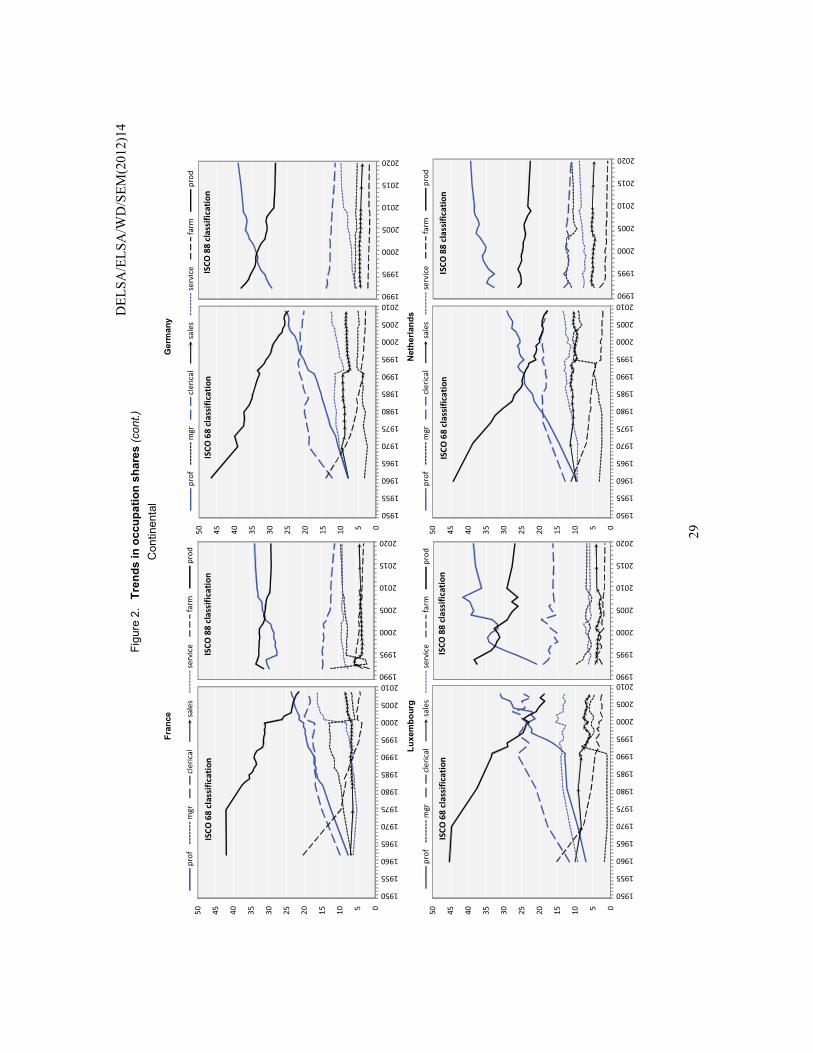
D
ELSA
/ELS
A/W
D/S
EM(2
012)
14
29
Figu
re 2
. Tr
ends
in o
ccup
atio
n sh
ares
(con
t.)
Con
tinen
tal
Fran
ceG
erm
any
Luxe
mbo
urg
Net
herla
nds
05101520253035404550
1950
1955
1960
1965
1970
1975
1980
1985
1990
1995
2000
2005
2010
prof
mgr
cler
ical
sale
sse
rvic
efa
rmpr
od
1990
1995
2000
2005
2010
2015
2020
ISCO
68
clas
sific
atio
nIS
CO 8
8 cl
assi
fica
tion
05101520253035404550
1950
1955
1960
1965
1970
1975
1980
1985
1990
1995
2000
2005
2010
prof
mgr
cler
ical
sale
sse
rvic
efa
rmpr
od
1990
1995
2000
2005
2010
2015
2020
ISCO
68
clas
sifi
cati
onIS
CO 8
8 cl
assi
fica
tion
05101520253035404550
1950
1955
1960
1965
1970
1975
1980
1985
1990
1995
2000
2005
2010
prof
mgr
cler
ical
sale
sse
rvic
efa
rmpr
od
1990
1995
2000
2005
2010
2015
2020
ISCO
68
clas
sific
atio
nIS
CO 8
8 cl
assi
fica
tion
05101520253035404550
1950
1955
1960
1965
1970
1975
1980
1985
1990
1995
2000
2005
2010
prof
mgr
cler
ical
sale
sse
rvic
efa
rmpr
od
1990
1995
2000
2005
2010
2015
2020
ISCO
68
clas
sific
atio
nIS
CO 8
8 cl
assi
ficat
ion
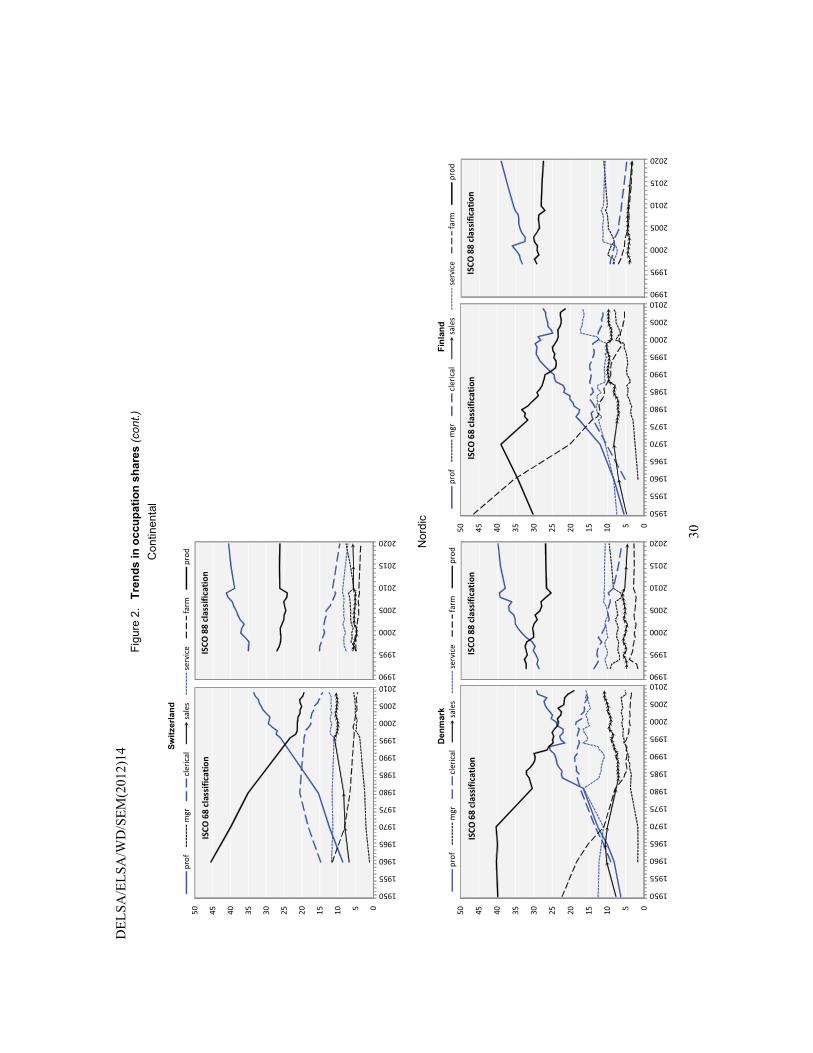
DEL
SA/E
LSA
/WD
/SEM
(201
2)14
30
Figu
re 2
. Tr
ends
in o
ccup
atio
n sh
ares
(con
t.)
Con
tinen
tal
Switz
erla
nd
05101520253035404550
1950
1955
1960
1965
1970
1975
1980
1985
1990
1995
2000
2005
2010
prof
mgr
cler
ical
sale
sse
rvic
efa
rmpr
od
1990
1995
2000
2005
2010
2015
2020
ISCO
68
clas
sific
atio
nIS
CO 8
8 cl
assi
ficat
ion
Nor
dic
Den
mar
kFi
nlan
d
05101520253035404550
1950
1955
1960
1965
1970
1975
1980
1985
1990
1995
2000
2005
2010
prof
mgr
cler
ical
sale
sse
rvic
efa
rmpr
od
1990
1995
2000
2005
2010
2015
2020
ISCO
68
clas
sific
atio
nIS
CO 8
8 cl
assi
ficat
ion
05101520253035404550
1950
1955
1960
1965
1970
1975
1980
1985
1990
1995
2000
2005
2010
prof
mgr
cler
ical
sale
sse
rvic
efa
rmpr
od
1990
1995
2000
2005
2010
2015
2020
ISCO
68
clas
sific
atio
nIS
CO 8
8 cl
assi
ficat
ion
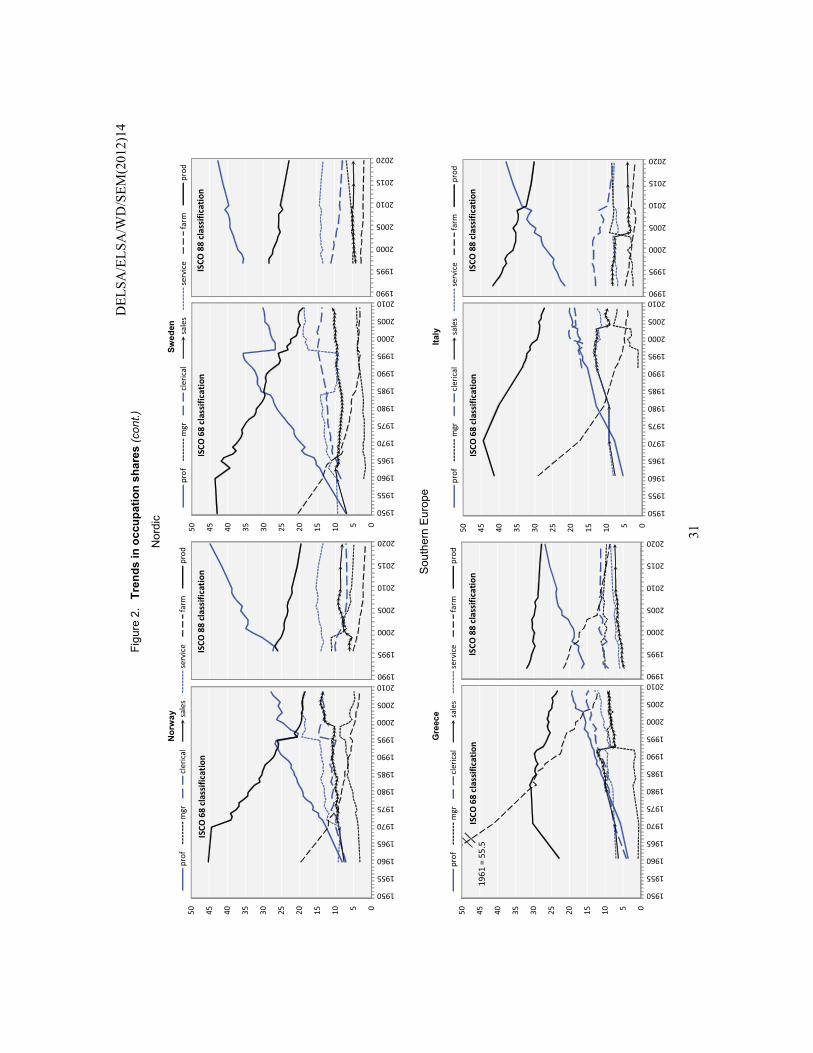
D
ELSA
/ELS
A/W
D/S
EM(2
012)
14
31
Figu
re 2
. Tr
ends
in o
ccup
atio
n sh
ares
(con
t.)
Nor
dic
Nor
way
Swed
en
05101520253035404550
1950
1955
1960
1965
1970
1975
1980
1985
1990
1995
2000
2005
2010
prof
mgr
cler
ical
sale
sse
rvic
efa
rmpr
od
1990
1995
2000
2005
2010
2015
2020
ISCO
68
clas
sific
atio
nIS
CO 8
8 cl
assi
ficat
ion
05101520253035404550
1950
1955
1960
1965
1970
1975
1980
1985
1990
1995
2000
2005
2010
prof
mgr
cler
ical
sale
sse
rvic
efa
rmpr
od
1990
1995
2000
2005
2010
2015
2020
ISCO
68
clas
sific
atio
nIS
CO 8
8 cl
assi
ficat
ion
Sou
ther
n E
urop
e G
reec
eIta
ly
05101520253035404550
1950
1955
1960
1965
1970
1975
1980
1985
1990
1995
2000
2005
2010
prof
mgr
cler
ical
sale
sse
rvic
efa
rmpr
od
1990
1995
2000
2005
2010
2015
2020
ISCO
68
clas
sific
atio
nIS
CO 8
8 cl
assi
ficat
ion
1961
= 5
5.5
05101520253035404550
1950
1955
1960
1965
1970
1975
1980
1985
1990
1995
2000
2005
2010
prof
mgr
cler
ical
sale
sse
rvic
efa
rmpr
od
1990
1995
2000
2005
2010
2015
2020
ISCO
68
clas
sific
atio
nIS
CO 8
8 cl
assi
ficat
ion

DEL
SA/E
LSA
/WD
/SEM
(201
2)14
32
Figu
re 2
. Tr
ends
in o
ccup
atio
n sh
ares
(con
t.)
Sou
ther
n E
urop
e
.
Port
ugal
Spai
n
05101520253035404550
1950
1955
1960
1965
1970
1975
1980
1985
1990
1995
2000
2005
2010
prof
mgr
cler
ical
sale
sse
rvic
efa
rmpr
od
1990
1995
2000
2005
2010
2015
2020
ISCO
68
clas
sific
atio
nIS
CO 8
8 cl
assi
ficat
ion
05101520253035404550
1950
1955
1960
1965
1970
1975
1980
1985
1990
1995
2000
2005
2010
prof
mgr
cler
ical
sale
sse
rvic
efa
rmpr
od
1990
1995
2000
2005
2010
2015
2020
ISCO
68
clas
sific
atio
nIS
CO 8
8 cl
assi
ficat
ion
Eas
t Asi
a Ja
pan
Kor
ea
05101520253035404550
1950
1955
1960
1965
1970
1975
1980
1985
1990
1995
2000
2005
2010
2015
2020
prof
mgr
cler
ical
sale
sse
rvic
efa
rmpr
od
1955
= 7
9.7
05101520253035404550
1950
1955
1960
1965
1970
1975
1980
1985
1990
1995
2000
2005
2010
2015
2020
prof
mgr
cler
ical
sale
sse
rvic
efa
rmpr
od
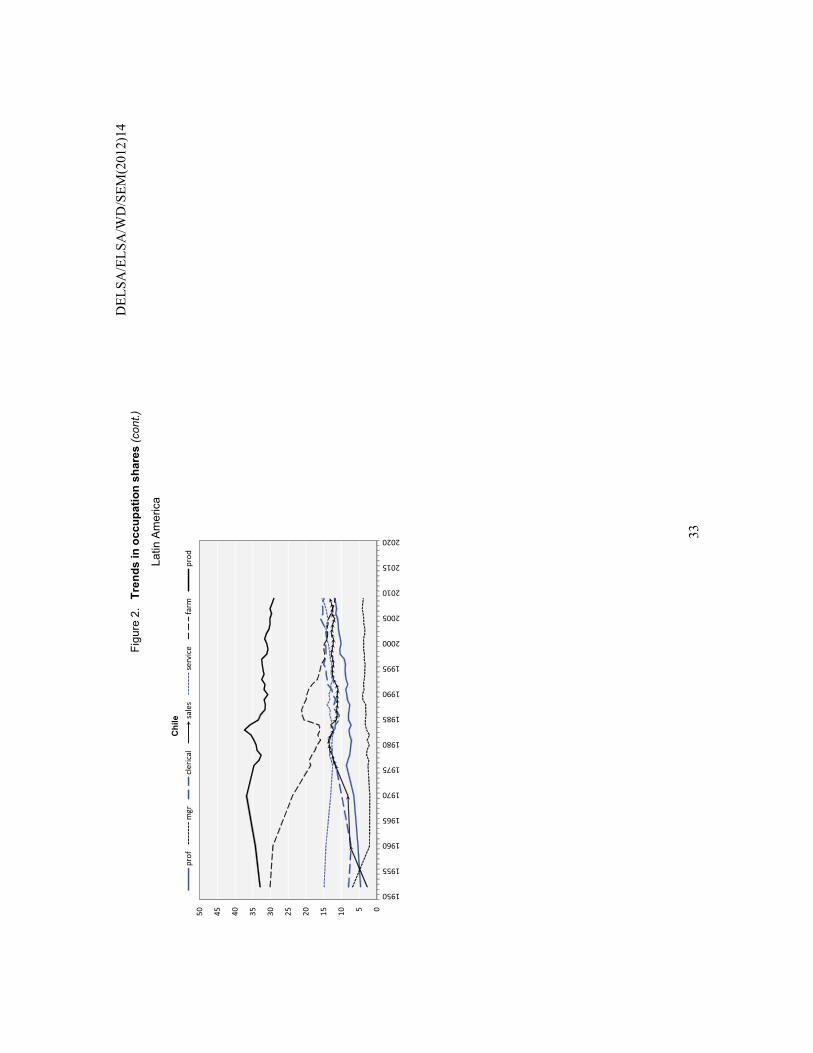
D
ELSA
/ELS
A/W
D/S
EM(2
012)
14
33
Figu
re 2
. Tr
ends
in o
ccup
atio
n sh
ares
(con
t.)
Latin
Am
eric
a C
hile
05101520253035404550
1950
1955
1960
1965
1970
1975
1980
1985
1990
1995
2000
2005
2010
2015
2020
prof
mgr
cler
ical
sale
sse
rvic
efa
rmpr
od
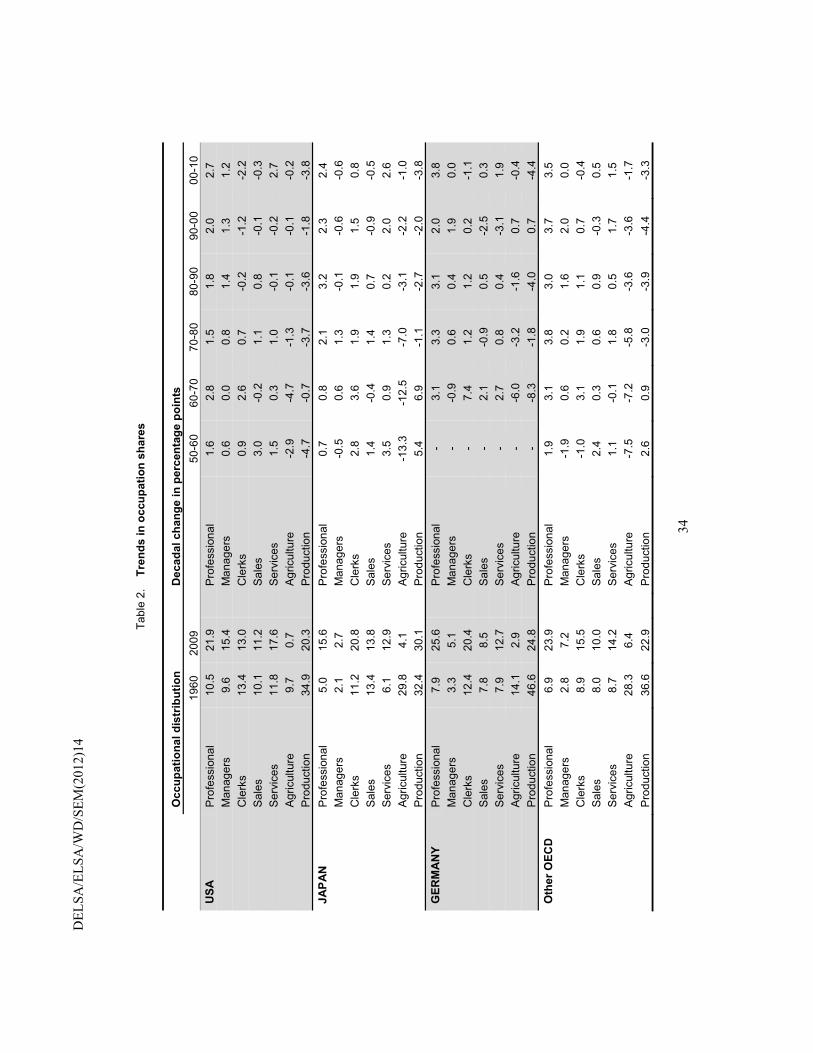
DEL
SA/E
LSA
/WD
/SEM
(201
2)14
34
Tabl
e 2.
Tr
ends
in o
ccup
atio
n sh
ares
O
ccup
atio
nal d
istr
ibut
ion
Dec
adal
cha
nge
in p
erce
ntag
e po
ints
19
60
2009
50
-60
60-7
0 70
-80
80-9
0 90
-00
00-1
0 U
SA
Pro
fess
iona
l 10
.5
21.9
P
rofe
ssio
nal
1.6
2.8
1.5
1.8
2.0
2.7
Man
ager
s 9.
6 15
.4
Man
ager
s 0.
6 0.
0 0.
8 1.
4 1.
3 1.
2 C
lerk
s 13
.4
13.0
C
lerk
s 0.
9 2.
6 0.
7 -0
.2
-1.2
-2
.2
Sal
es
10.1
11
.2
Sal
es
3.0
-0.2
1.
1 0.
8 -0
.1
-0.3
S
ervi
ces
11.8
17
.6
Ser
vice
s 1.
5 0.
3 1.
0 -0
.1
-0.2
2.
7 A
gric
ultu
re
9.7
0.7
Agr
icul
ture
-2
.9
-4.7
-1
.3
-0.1
-0
.1
-0.2
P
rodu
ctio
n 34
.9
20.3
P
rodu
ctio
n -4
.7
-0.7
-3
.7
-3.6
-1
.8
-3.8
JA
PAN
P
rofe
ssio
nal
5.0
15.6
P
rofe
ssio
nal
0.7
0.8
2.1
3.2
2.3
2.4
Man
ager
s 2.
1 2.
7 M
anag
ers
-0.5
0.
6 1.
3 -0
.1
-0.6
-0
.6
Cle
rks
11.2
20
.8
Cle
rks
2.8
3.6
1.9
1.9
1.5
0.8
Sal
es
13.4
13
.8
Sal
es
1.4
-0.4
1.
4 0.
7 -0
.9
-0.5
S
ervi
ces
6.1
12.9
S
ervi
ces
3.5
0.9
1.3
0.2
2.0
2.6
Agr
icul
ture
29
.8
4.1
Agr
icul
ture
-1
3.3
-12.
5 -7
.0
-3.1
-2
.2
-1.0
P
rodu
ctio
n 32
.4
30.1
P
rodu
ctio
n 5.
4 6.
9 -1
.1
-2.7
-2
.0
-3.8
G
ERM
AN
Y P
rofe
ssio
nal
7.9
25.6
P
rofe
ssio
nal
- 3.
1 3.
3 3.
1 2.
0 3.
8 M
anag
ers
3.3
5.1
Man
ager
s -
-0.9
0.
6 0.
4 1.
9 0.
0 C
lerk
s 12
.4
20.4
C
lerk
s -
7.4
1.2
1.2
0.2
-1.1
S
ales
7.
8 8.
5 S
ales
-
2.1
-0.9
0.
5 -2
.5
0.3
Ser
vice
s 7.
9 12
.7
Ser
vice
s -
2.7
0.8
0.4
-3.1
1.
9 A
gric
ultu
re
14.1
2.
9 A
gric
ultu
re
- -6
.0
-3.2
-1
.6
0.7
-0.4
P
rodu
ctio
n 46
.6
24.8
P
rodu
ctio
n -
-8.3
-1
.8
-4.0
0.
7 -4
.4
Oth
er O
ECD
P
rofe
ssio
nal
6.9
23.9
P
rofe
ssio
nal
1.9
3.1
3.8
3.0
3.7
3.5
Man
ager
s 2.
8 7.
2 M
anag
ers
-1.9
0.
6 0.
2 1.
6 2.
0 0.
0 C
lerk
s 8.
9 15
.5
Cle
rks
-1.0
3.
1 1.
9 1.
1 0.
7 -0
.4
Sal
es
8.0
10.0
S
ales
2.
4 0.
3 0.
6 0.
9 -0
.3
0.5
Ser
vice
s 8.
7 14
.2
Ser
vice
s 1.
1 -0
.1
1.8
0.5
1.7
1.5
Agr
icul
ture
28
.3
6.4
Agr
icul
ture
-7
.5
-7.2
-5
.8
-3.6
-3
.6
-1.7
P
rodu
ctio
n 36
.6
22.9
P
rodu
ctio
n 2.
6 0.
9 -3
.0
-3.9
-4
.4
-3.3
DELSA/ELSA/WD/SEM(2012)14
35
5. Trends in direct measures of skill requirements I: International surveys
107. Occupational categories can give only a general sense of the magnitude of skill trends because occupation is not numerical or even a fully orderable set of categories. The groups are also quite broad, each covering a wide range of skill levels, so they do not capture any changes that might be occurring within groups over time. This section analyses direct measures of job skill requirements measured consistently across countries in international surveys.
A. Explaining variation in cognitive skill requirements within and across countries
108. The European Social Survey’s (ESS) module on work in 2004 contains two of the strongest measures on job skill requirements, required education and job learning times; trend data will become available after this module is replicated beginning in September 2010. In the meantime, the cross-sectional data can shed light on country variation and the worker and workplace determinants of skill requirements in the cross-section. These country-specific skill measures will also be used to validate the applicability of similar variables from O*NET for countries outside the United States in Section 6.
109. The ESS asked respondents how many years of education beyond compulsory schooling are required for their job and how long someone with the right education and qualifications would need to learn how to do the job reasonably well. Both variables are numeric and are among the most powerful and widely used measures of cognitive skill demands (for references see Handel 2000).4
110. The ESS also asked respondents if their jobs involved “a lot of variety” and required them to “keep learning new things,” both of which were answered on a 4-point Likert scale (4=very true). The measures of job variety and continuous learning are more subjective and have relatively coarse response scales, partly reflecting the fact that the underlying constructs of interest are more difficult to define and measure precisely. Correlations among the skill variables and their correlations with personal education and wages are presented in Annex 1.
111. Table 3 presents variable means and sample information for seventeen countries and the pooled sample, which reflects weighting to account for country size. The average education level required by jobs was 2.7 years beyond compulsory schooling and national figures vary in ways that are generally consistent with expectation except for the rather low values for United Kingdom and Belgium.5 Assuming an average of ten years of compulsory schooling implies the average job in advanced European economies in 2004 required 12.7 years of education. This is significant for policy as it implies the average job now requires almost a year of post-secondary education.
112. Personal educational attainment for these workers is presented in columns 2 and 3 according to level and years of education. The average level of schooling is slightly above secondary school and 4 Unfortunately, the education question was framed in relation to standards of compulsory education,
which vary across countries and over time within countries, rather than simply years of education. Therefore, it is not easy to adjust responses to a strictly common scale, but regression models that control for country and experience limit the impact of this problem.
5 It is worth recalling in this context that the ESS does not contain post-stratification weights that adjust for differential response rates across demographic groups, only design weights that adjust for differential probability of response, reflecting variations in household size, for example. Large differences across countries in non-response by education or occupation group potentially bias the univariate statistics, but the regression analyses that follow eliminate most of any such problems.
DELSA/ELSA/WD/SEM(2012)14
36
average years of education completed is 13.2, which is half a year higher than the average job’s required education, consistent with research on over-education (see Quintini 2011).
113. The average person across the entire sample worked in a job that required 10.2 months to learn, but high values skew this number in a positive direction as the median job learning time is 7.5 months. Because countries vary in the relative emphasis they place on schools and workplaces as sources of job knowledge and training, interpreting the relative values is not straightforward.
114. Across the full sample, 68% of workers believed it was “quite true” or “very true” that their job entailed a lot of variety and 60% said their jobs required they keep learning new things. Values for Nordic countries tended to be above the average for both variables, while those for southern European countries were significantly below average.
115. Table 4 presents means for the same variables by one-digit occupation. There is a very clear ordering of occupation groups by required education level in a sensible fashion. Professional jobs have the highest educational requirements, followed by managers, and technical workers and associate professionals. The gap of nearly two years of required education between professionals and technical/associate professionals illustrates the heterogeneity within the amalgamated category used in the prior section and the need for skill measures at a finer level of occupational detail.
116. Job learning times generally follow the same ordering, with the conspicuous exception of craft workers, whose job learning times are more similar to upper white-collar workers. This is not surprising, but it is important to remember that a significant level of skill in this occupational category is acquired through workplace learning.
117. Job variety and continuous learning also vary strongly by occupation. For example, the difference between professionals and elementary workers saying their jobs require continuous learning is 56 percentage points; the difference in means is 1.35 points or 1.3 standard deviations. There is a clear ordering among upper white collar occupational groups (managers, professionals, technical/associate professionals) and among blue-collar workers (craft, operatives, elementary), but the ordering among clerical, sales, service, and agricultural workers is not as clear-cut.
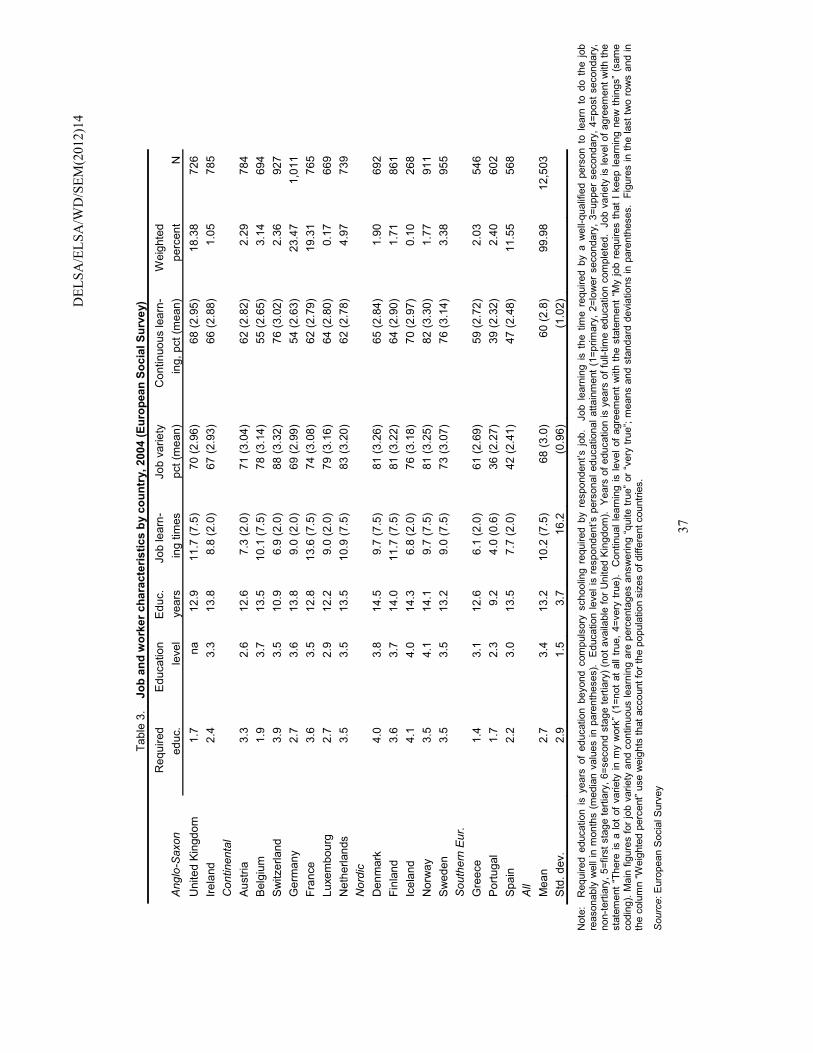
D
ELSA
/ELS
A/W
D/S
EM(2
012)
14
37
Tabl
e 3.
Jo
b an
d w
orke
r cha
ract
eris
tics
by c
ount
ry, 2
004
(Eur
opea
n So
cial
Sur
vey)
R
equi
red
Edu
catio
n E
duc.
Jo
b le
arn-
Jo
b va
riety
C
ontin
uous
lear
n-
Wei
ghte
d A
nglo
-Sax
on
educ
. le
vel
year
s in
g tim
es
pct (
mea
n)
ing,
pct
(mea
n)
perc
ent
N
Uni
ted
King
dom
1.
7 na
12
.9
11.7
(7.5
) 70
(2.9
6)
68 (2
.95)
18
.38
726
Irela
nd
2.4
3.3
13.8
8.
8 (2
.0)
67 (2
.93)
66
(2.8
8)
1.05
78
5 C
ontin
enta
l
Aus
tria
3.3
2.6
12.6
7.
3 (2
.0)
71 (3
.04)
62
(2.8
2)
2.29
78
4 B
elgi
um
1.9
3.7
13.5
10
.1 (7
.5)
78 (3
.14)
55
(2.6
5)
3.14
69
4 S
witz
erla
nd
3.9
3.5
10.9
6.
9 (2
.0)
88 (3
.32)
76
(3.0
2)
2.36
92
7 G
erm
any
2.7
3.6
13.8
9.
0 (2
.0)
69 (2
.99)
54
(2.6
3)
23.4
7 1,
011
Fran
ce
3.6
3.5
12.8
13
.6 (7
.5)
74 (3
.08)
62
(2.7
9)
19.3
1 76
5 Lu
xem
bour
g 2.
7 2.
9 12
.2
9.0
(2.0
) 79
(3.1
6)
64 (2
.80)
0.
17
669
Net
herla
nds
3.5
3.5
13.5
10
.9 (7
.5)
83 (3
.20)
62
(2.7
8)
4.97
73
9 N
ordi
c
Den
mar
k 4.
0 3.
8 14
.5
9.7
(7.5
) 81
(3.2
6)
65 (2
.84)
1.
90
692
Finl
and
3.6
3.7
14.0
11
.7 (7
.5)
81 (3
.22)
64
(2.9
0)
1.71
86
1 Ic
elan
d 4.
1 4.
0 14
.3
6.8
(2.0
) 76
(3.1
8)
70 (2
.97)
0.
10
268
Nor
way
3.
5 4.
1 14
.1
9.7
(7.5
) 81
(3.2
5)
82 (3
.30)
1.
77
911
Sw
eden
3.
5 3.
5 13
.2
9.0
(7.5
) 73
(3.0
7)
76 (3
.14)
3.
38
955
Sou
ther
n E
ur.
G
reec
e
1.4
3.1
12.6
6.
1 (2
.0)
61 (2
.69)
59
(2.7
2)
2.03
54
6 P
ortu
gal
1.7
2.3
9.2
4.0
(0.6
) 36
(2.2
7)
39 (2
.32)
2.
40
602
Spa
in
2.2
3.0
13.5
7.
7 (2
.0)
42 (2
.41)
47
(2.4
8)
11.5
5 56
8 A
ll
M
ean
2.
7 3.
4 13
.2
10.2
(7.5
) 68
(3.0
) 60
(2.8
) 99
.98
12,5
03
Std
. dev
. 2.
9 1.
5 3.
7 16
.2
(0.9
6)
(1.0
2)
Not
e:
Req
uire
d ed
ucat
ion
is y
ears
of
educ
atio
n be
yond
com
puls
ory
scho
olin
g re
quire
d by
res
pond
ent’s
job
. J
ob l
earn
ing
is t
he t
ime
requ
ired
by a
wel
l-qua
lifie
d pe
rson
to
lear
n to
do
the
job
reas
onab
ly w
ell i
n m
onth
s (m
edia
n va
lues
in p
aren
thes
es).
Edu
catio
n le
vel i
s re
spon
dent
’s p
erso
nal e
duca
tiona
l atta
inm
ent (
1=pr
imar
y, 2
=low
er s
econ
dary
, 3=u
pper
sec
onda
ry, 4
=pos
t sec
onda
ry,
non-
terti
ary,
5=f
irst s
tage
terti
ary,
6=s
econ
d st
age
terti
ary)
(not
ava
ilabl
e fo
r Uni
ted
Kin
gdom
). Y
ears
of e
duca
tion
is y
ears
of f
ull-t
ime
educ
atio
n co
mpl
eted
. Jo
b va
riety
is le
vel o
f agr
eem
ent w
ith th
e st
atem
ent “
Ther
e is
a lo
t of v
arie
ty in
my
wor
k” (
1=no
t at a
ll tru
e, 4
=ver
y tru
e).
Con
tinua
l lea
rnin
g is
leve
l of a
gree
men
t with
the
stat
emen
t “M
y jo
b re
quire
s th
at I
keep
lear
ning
new
thin
gs”
(sam
e co
ding
). M
ain
figur
es fo
r job
var
iety
and
con
tinuo
us le
arni
ng a
re p
erce
ntag
es a
nsw
erin
g “q
uite
true
” or “
very
true
”; m
eans
and
sta
ndar
d de
viat
ions
in p
aren
thes
es.
Figu
res
in th
e la
st tw
o ro
ws
and
in
the
colu
mn
“Wei
ghte
d pe
rcen
t” us
e w
eigh
ts th
at a
ccou
nt fo
r the
pop
ulat
ion
size
s of
diff
eren
t cou
ntrie
s.
Sou
rce:
Eur
opea
n S
ocia
l Sur
vey
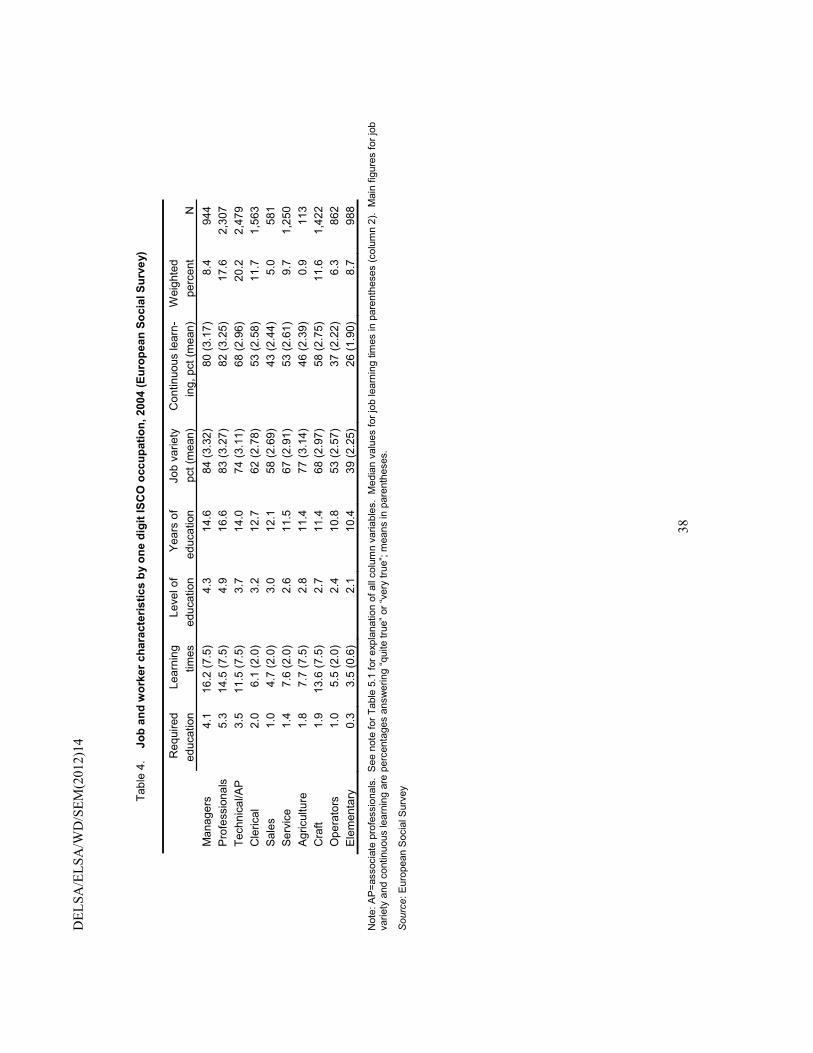
DEL
SA/E
LSA
/WD
/SEM
(201
2)14
38
Tabl
e 4.
Jo
b an
d w
orke
r cha
ract
eris
tics
by o
ne d
igit
ISC
O o
ccup
atio
n, 2
004
(Eur
opea
n So
cial
Sur
vey)
Req
uire
d Le
arni
ng
Leve
l of
Year
s of
Jo
b va
riety
C
ontin
uous
lear
n-
Wei
ghte
d ed
ucat
ion
times
ed
ucat
ion
educ
atio
n pc
t (m
ean)
in
g, p
ct (m
ean)
pe
rcen
t N
M
anag
ers
4.1
16.2
(7.5
) 4.
3 14
.6
84 (3
.32)
80
(3.1
7)
8.4
944
Pro
fess
iona
ls
5.3
14.5
(7.5
) 4.
9 16
.6
83 (3
.27)
82
(3.2
5)
17.6
2,
307
Tech
nica
l/AP
3.5
11.5
(7.5
) 3.
7 14
.0
74 (3
.11)
68
(2.9
6)
20.2
2,
479
Cle
rical
2.
0 6.
1 (2
.0)
3.2
12.7
62
(2.7
8)
53 (2
.58)
11
.7
1,56
3 S
ales
1.
0 4.
7 (2
.0)
3.0
12.1
58
(2.6
9)
43 (2
.44)
5.
0 58
1 S
ervi
ce
1.4
7.6
(2.0
) 2.
6 11
.5
67 (2
.91)
53
(2.6
1)
9.7
1,25
0 A
gric
ultu
re
1.8
7.7
(7.5
) 2.
8 11
.4
77 (3
.14)
46
(2.3
9)
0.9
113
Cra
ft 1.
9 13
.6 (7
.5)
2.7
11.4
68
(2.9
7)
58 (2
.75)
11
.6
1,42
2 O
pera
tors
1.
0 5.
5 (2
.0)
2.4
10.8
53
(2.5
7)
37 (2
.22)
6.
3 86
2 E
lem
enta
ry
0.3
3.5
(0.6
) 2.
1 10
.4
39 (2
.25)
26
(1.9
0)
8.7
988
Not
e: A
P=a
ssoc
iate
pro
fess
iona
ls.
See
not
e fo
r Tab
le 5
.1 fo
r exp
lana
tion
of a
ll co
lum
n va
riabl
es.
Med
ian
valu
es fo
r job
lear
ning
tim
es in
par
enth
eses
(col
umn
2).
Mai
n fig
ures
for j
ob
varie
ty a
nd c
ontin
uous
lear
ning
are
per
cent
ages
ans
wer
ing
“qui
te tr
ue” o
r “ve
ry tr
ue”;
mea
ns in
par
enth
eses
.
Sou
rce:
Eur
opea
n S
ocia
l Sur
vey
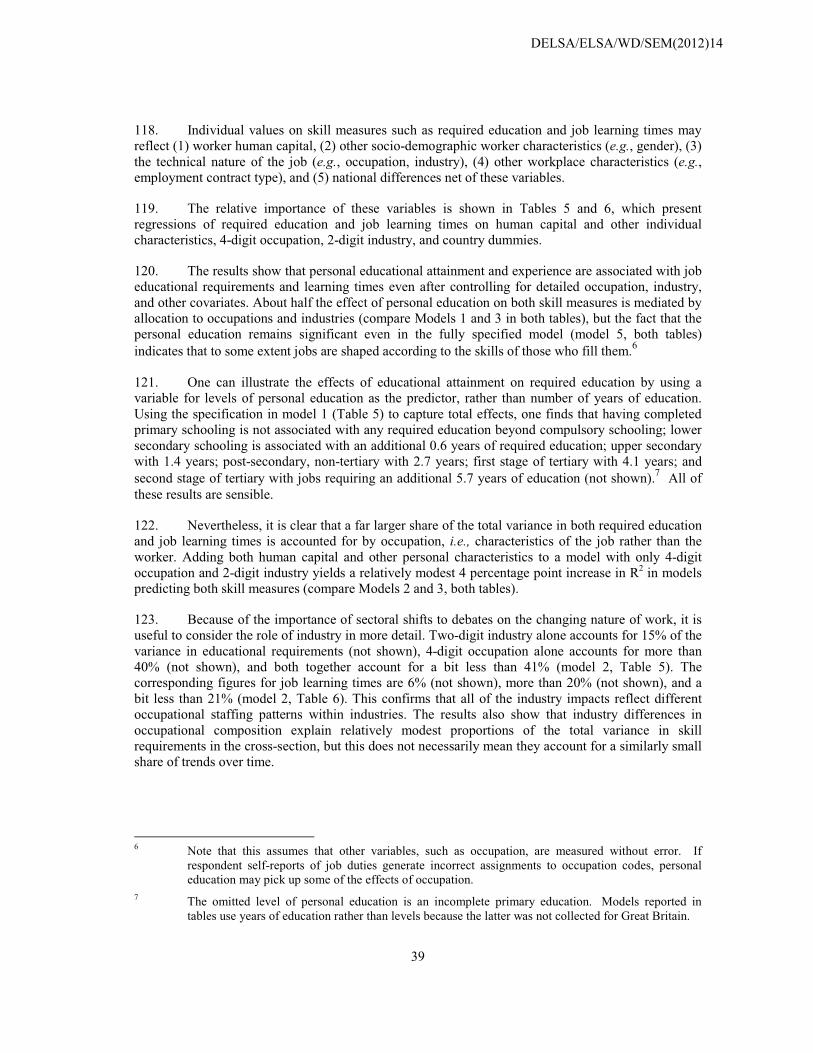
DELSA/ELSA/WD/SEM(2012)14
39
118. Individual values on skill measures such as required education and job learning times may reflect (1) worker human capital, (2) other socio-demographic worker characteristics (e.g., gender), (3) the technical nature of the job (e.g., occupation, industry), (4) other workplace characteristics (e.g., employment contract type), and (5) national differences net of these variables.
119. The relative importance of these variables is shown in Tables 5 and 6, which present regressions of required education and job learning times on human capital and other individual characteristics, 4-digit occupation, 2-digit industry, and country dummies.
120. The results show that personal educational attainment and experience are associated with job educational requirements and learning times even after controlling for detailed occupation, industry, and other covariates. About half the effect of personal education on both skill measures is mediated by allocation to occupations and industries (compare Models 1 and 3 in both tables), but the fact that the personal education remains significant even in the fully specified model (model 5, both tables) indicates that to some extent jobs are shaped according to the skills of those who fill them.6
121. One can illustrate the effects of educational attainment on required education by using a variable for levels of personal education as the predictor, rather than number of years of education. Using the specification in model 1 (Table 5) to capture total effects, one finds that having completed primary schooling is not associated with any required education beyond compulsory schooling; lower secondary schooling is associated with an additional 0.6 years of required education; upper secondary with 1.4 years; post-secondary, non-tertiary with 2.7 years; first stage of tertiary with 4.1 years; and second stage of tertiary with jobs requiring an additional 5.7 years of education (not shown).7 All of these results are sensible.
122. Nevertheless, it is clear that a far larger share of the total variance in both required education and job learning times is accounted for by occupation, i.e., characteristics of the job rather than the worker. Adding both human capital and other personal characteristics to a model with only 4-digit occupation and 2-digit industry yields a relatively modest 4 percentage point increase in R2 in models predicting both skill measures (compare Models 2 and 3, both tables).
123. Because of the importance of sectoral shifts to debates on the changing nature of work, it is useful to consider the role of industry in more detail. Two-digit industry alone accounts for 15% of the variance in educational requirements (not shown), 4-digit occupation alone accounts for more than 40% (not shown), and both together account for a bit less than 41% (model 2, Table 5). The corresponding figures for job learning times are 6% (not shown), more than 20% (not shown), and a bit less than 21% (model 2, Table 6). This confirms that all of the industry impacts reflect different occupational staffing patterns within industries. The results also show that industry differences in occupational composition explain relatively modest proportions of the total variance in skill requirements in the cross-section, but this does not necessarily mean they account for a similarly small share of trends over time.
6 Note that this assumes that other variables, such as occupation, are measured without error. If
respondent self-reports of job duties generate incorrect assignments to occupation codes, personal education may pick up some of the effects of occupation.
7 The omitted level of personal education is an incomplete primary education. Models reported in tables use years of education rather than levels because the latter was not collected for Great Britain.

DELSA/ELSA/WD/SEM(2012)14
40
Table 5. Determinants of job education requirements in European countries, 2004 (European Social Survey)
mean 1 2 3 4 5 Education (years) 13.2 0.45*** 0.21*** 0.23*** (0.01) (0.01) (0.01) Experience 21.5 0.05*** 0.02*** 0.02*** (0.01) (0.01) (0.01) Experience2/100 -0.02 0.00 0.00 (0.01) (0.01) (0.01) Female 0.48 -0.19*** -0.29*** -0.30*** (0.05) (0.05) (0.05) Minority (1=yes) 0.04 -0.19 -0.06 -0.05 (0.13) (0.12) (0.11) Citizen (1=yes) 0.96 -0.11 0.00 0.20 (0.14) (0.13) (0.13) Migration year >20 years ago 0.03 -0.05 0.05 0.00 (0.13) (0.12) (0.11) 11-20 years ago 0.02 -0.23 -0.01 0.01 (0.17) (0.15) (0.14) 6-10 years ago 0.01 -0.48* -0.13 0.08 (0.22) (0.21) (0.20) 0-5 years ago 0.02 -0.02 0.07 0.25 (0.22) (0.20) (0.19) Part-time (1=yes) 0.20 -0.44*** -0.40*** -0.33*** (0.06) (0.06) (0.05) 4-digit occupation yes yes yes 2-digit industry yes yes yes COUNTRY Anglo-Saxon United Kingdom -1.23*** -1.10*** (0.10) (0.08) Ireland -0.51*** -0.51*** (0.11) (0.08) Continental Austria 0.37*** 0.57*** (0.10) (0.08) Belgium -1.06*** -1.12*** (0.11) (0.09) Switzerland 0.91*** 1.15*** (0.09) (0.08) Germany -0.28** -0.55*** (0.09) (0.07) France 0.65*** 0.69*** (0.10) (0.08) Luxembourg -0.15 0.10 (0.11) (0.09) Netherlands 0.66*** 0.26**
DELSA/ELSA/WD/SEM(2012)14
41
Table 5. Determinants of job education requirements in European countries, 2004 (European Social Survey) (cont.)
mean 1 2 3 4 5 (0.11) (0.08) Nordic Denmark 0.97*** 0.48*** (0.11) (0.08) Finland 0.68*** 0.35*** (0.10) (0.08) Iceland 1.27*** 0.81*** (0.17) (0.14) Norway 0.49*** 0.20** (0.09) (0.08) Sweden 0.51*** 0.35*** (0.09) (0.07) Southern Europe Greece -1.48*** -1.11*** (0.12) (0.10) Portugal -1.03*** 0.09 (0.13) (0.10) Spain -0.77*** -0.63*** (0.12) (0.09) Constant -3.56*** 2.22*** -0.91** 3.00*** -1.26*** (0.18) (0.27) (0.31) (0.03) (0.31) adj. R2 0.289 0.409 0.453 0.070 0.499
Note: First column presents weighted means or proportions. Dependent variable is the number of years beyond compulsory education required by the respondent’s job. All models are OLS regressions. Standard errors in parentheses. Sample size is 11,740 for all models. The omitted group for migration year is natives. There are 441 occupation dummies and 65 industry dummies in models 2, 3, and 5. Country coefficients refer to each country’s deviation from mean of country means and were obtained through deviation contrast coding of the country variable. * p < 0.05, ** p < 0.01, *** p < 0.001
Table 6. Determinants of (In) months required to learn job in European countries, 2004 (European Social Survey)
1 2 3 4 5 Education (years) 0.11*** 0.05*** 0.04*** (0.00) (0.01) (0.01) Experience 0.04*** 0.04*** 0.04*** (0.00) (0.00) (0.00) Experience2/100 -0.07*** -0.05*** -0.05*** (0.01) (0.01) (0.01) Female -0.53*** -0.37*** -0.37*** (0.03) (0.04) (0.04) Minority (1=yes) -0.47*** -0.38*** -0.40*** (0.09) (0.09) (0.09) Citizen (1=yes) 0.18 0.15 0.12 (0.10) (0.09) (0.09) Migration year >20 years ago 0.04 0.10 0.12 (0.09) (0.09) (0.08) 11-20 years ago -0.09 0.11 0.13 (0.11) (0.11) (0.11) 6-10 years ago -0.58*** -0.25 -0.19 (0.16) (0.15) (0.15) 0-5 years ago -0.35* -0.07 -0.05 (0.15) (0.14) (0.14)

DELSA/ELSA/WD/SEM(2012)14
42
Table 6. Determinants of (In) months required to learn job in European countries, 2004 (European Social Survey) (cont.)
1 2 3 4 5 Part-time (1=yes) -0.64*** -0.45*** -0.48*** (0.04) (0.04) (0.04) Fixed-term -0.45*** -0.33*** -0.32*** contract (1=yes) (0.05) (0.05) (0.05) 4-digit occupation yes yes yes 2-digit industry yes yes yes COUNTRY Anglo-Saxon United Kingdom 0.32*** 0.49*** (0.09) (0.06) Ireland -0.28** -0.19** (0.10) (0.06) Continental Austria 0.01 0.01 (0.06) (0.06) Belgium 0.19* 0.24*** (0.10) (0.06) Switzerland -0.04 -0.07 (0.09) (0.06) Germany 0.00 -0.15** (0.09) (0.05) Luxembourg -0.14 -0.00 (0.10) (0.07) Netherlands 0.35*** 0.25*** (0.09) (0.06) Nordic Denmark 0.27** 0.22*** (0.09) (0.06) Finland 0.35*** 0.30*** (0.09) (0.06) Iceland -0.18 -0.16 (0.13) (0.10) Norway 0.21* 0.20*** (0.09) (0.06) Sweden 0.14 0.07 (0.09) (0.05) Southern Europe Greece -0.65*** -0.44*** (0.10) (0.07) Portugal -0.95*** -0.57*** (0.11) (0.07) Spain -0.46*** -0.24*** (0.10) (0.07) constant -0.71*** 0.91*** 0.00 1.04*** 0.20 (0.13) (0.20) (0.24) (0.07) (0.24) adj. R2 0.136 0.205 0.244 0.033 0.261
Note: Dependent variable is the (ln) number of months required to learn job. All models are OLS regressions. Standard errors in parentheses. Sample size is 10,760 for all models. The omitted group for migration year is natives. There are 439 occupation dummies and 65 industry dummies in models 2, 3, and 5. Country coefficients refer to each country’s deviation from mean of country means and were obtained through deviation contrast coding of the country variable. French respondents are not included in these models because they were not asked the question on fixed-term employment contracts.* p < 0.05, ** p < 0.01, *** p < 0.001
124. The nature of the employment contract also affects job skill requirements. Part-time workers report both lower educational requirements and shorter job learning times. Workers on a fixed-term
DELSA/ELSA/WD/SEM(2012)14
43
contract report shorter job learning times net of controls, as might be expected, but do not have different job educational requirements compared to otherwise similar workers.8
125. Part-time jobs and fixed-term contracts are sometimes promoted by policy-makers seeking to enhance labour market flexibility. Indeed, the number of non-standard jobs is significant and growing in some countries. On average, 20% of workers in the sample were part-time and 11% were on a fixed-term contract, reaching about 20% in Spain and Portugal; 23-36% of workers in all countries have one or the other status, except for the Netherlands where it is 42% (not shown). However, the results presented here suggest this kind of flexibility can have negative effects on job quality. Part-time and fixed-term jobs seem to offer fewer opportunities for skill utilization than standard employment.
126. In addition, individual characteristics not related to human capital affect job skill requirements. Women report working in jobs requiring less education and shorter job learning times even after controlling for education, occupation, industry, part-time status, and several other variables. Women’s disadvantage with respect to job educational requirements actually increases with the inclusion of additional controls, indicating raw effects understate the true differences. Remarkably, marital status, presence of children younger than 12 years of age in the household, and their interactions with gender were not significant for either dependent variable; they are not included in the models presented here to conserve sample size and space.
127. Also unexpectedly, there is no evidence that members of minority groups and non-citizens work in jobs with lower skill requirements net of human capital, though some evidence that recent migrants work in occupations requiring less skill.
128. Country effects alone explain a relatively small share of the overall variance (ca. 4-7%, model 4, both tables), and some of these effects are due to differences in the composition of employment (model 5, both tables). This suggests that national peculiarities are less important than occupational similarities across countries, which is an important consideration for the next section. However, it should be noted that many country effects remain robust to the inclusion of a rich set of regressors (model 5 in both tables). As a group, the Nordic countries have the most skilled jobs, even after controlling for personal education, detailed occupation, and other covariates, while the Southern European and Anglo-Saxon countries score lowest. The results for the Continental countries are quite varied and not easily summarized. Again, the results for United Kingdom and Belgium are unexpectedly low and should be interpreted with caution.
129. Because job variety and continuous learning are believed to be growing in importance, it is natural to ask whether and the extent to which they raise education and job learning requirements. Job variety is correlated moderately with required education (0.29) and job learning times (0.32), and rather weakly with years of education attained (0.19). Continuous learning on the job is somewhat more strongly correlated with required education (0.37), job learning times (0.37), and personal
8 Part-time workers defined as those working less than 35 hours per week. Employees with fixed-term
contracts are those selecting “limited duration,” “no contract,” or “not applicable,” rather than “unlimited duration” in response to the question regarding their type of work contract (WRKCTRA); two-thirds of this group selected limited duration and virtually none selected “not applicable.” Fixed-term contracts did not significantly affect required education in any specification (e.g., for model 5 in Table 5.3, �=-.086, s.e.=0.068). Because the question was not asked in France, the variable was not included in models in table 5.3 in order to preserve sample size and the widest possible country representation.
DELSA/ELSA/WD/SEM(2012)14
44
education (0.27). One might expect that more varied jobs entail more frequent learning and, indeed, the two variables correlate 0.53 with one another (not shown).
130. In models not presented, dummy variables for levels of job variety and continuous learning were added jointly to model 5 for both required education and job learning time. Workers who said it is either “quite true” or “very true” that there is a lot of variety in their work reported their jobs required an additional 0.3 years of education compared to the 9 percent of the sample who said their jobs did not have a lot of variety. The two highest levels of continuous learning were associated with an additional 0.50 and 0.87 years of required education compared to the 13 percent of the sample who said their jobs did not require learning new things.
131. All of the job variety and continuous learning dummies are associated with longer learning times compared to omitted (lowest) category. Depending on the reported level, job variety raises learning times 36-95% controlling for all covariates in model 5 (Table 6); continuous learning raises learning times 77-216% (not shown).9 In an unlogged specification, the highest level of job variety is associated with an extra 2.6 months of learning time (0.16 standard deviations) compared to the lowest level of job variety, and the highest level of continuous learning is associated with an extra 5.1 months of learning time (0.31 standard deviations).
132. Clearly, jobs with greater variety and continuous learning are associated with higher levels of required education and longer job learning times, but it should be noted that these variables only add about 2 to 5 percent points to the explained variance compared to model 5 in Tables 5 and 6.
B. Physical job requirements across countries and over time
133. It is commonly believed that physical job demands are declining due to both compositional shifts in the occupational structure and to effort-saving technological changes within occupations (Zuboff 1988). Young people who might have relied previously on manual skills and physical strength alone are urged to remain in school longer in order to acquire the necessary cognitive and interpersonal skills as industrial-era jobs are replaced by more knowledge-intensive work.
134. Analytically, physical job demands can be considered work with objects, materials, tools, and equipment, often summarized as working with things. Simple physical tasks include gross physical exertion (e.g., carrying heavy loads), elementary movements (e.g., sorting mail), use of simple tools or equipment, and machine tending. More complex physical tasks require more training, experience, and background knowledge regarding the properties of physical materials, mechanical processes, and natural laws (U.S. Department of Labor 1991, pp.3-11ff., 12-1ff). The former tend to be associated with elementary, operator and assembler occupations, while the latter are found in craft and related trades, though any occupation potentially involves some kind and level of physical effort or skill.
135. The occupational trends discussed previously suggest consistent declines in the broad production group, but the category is relatively coarse and does not distinguish simple and complex physical job requirements. More direct measures of physical job demands should enable more precise understanding of trends in this particular domain.
9 This is based on transformations of coefficient values ranging from 0.31 to 1.21 using the formula e�-
1, where � is the coefficient value.
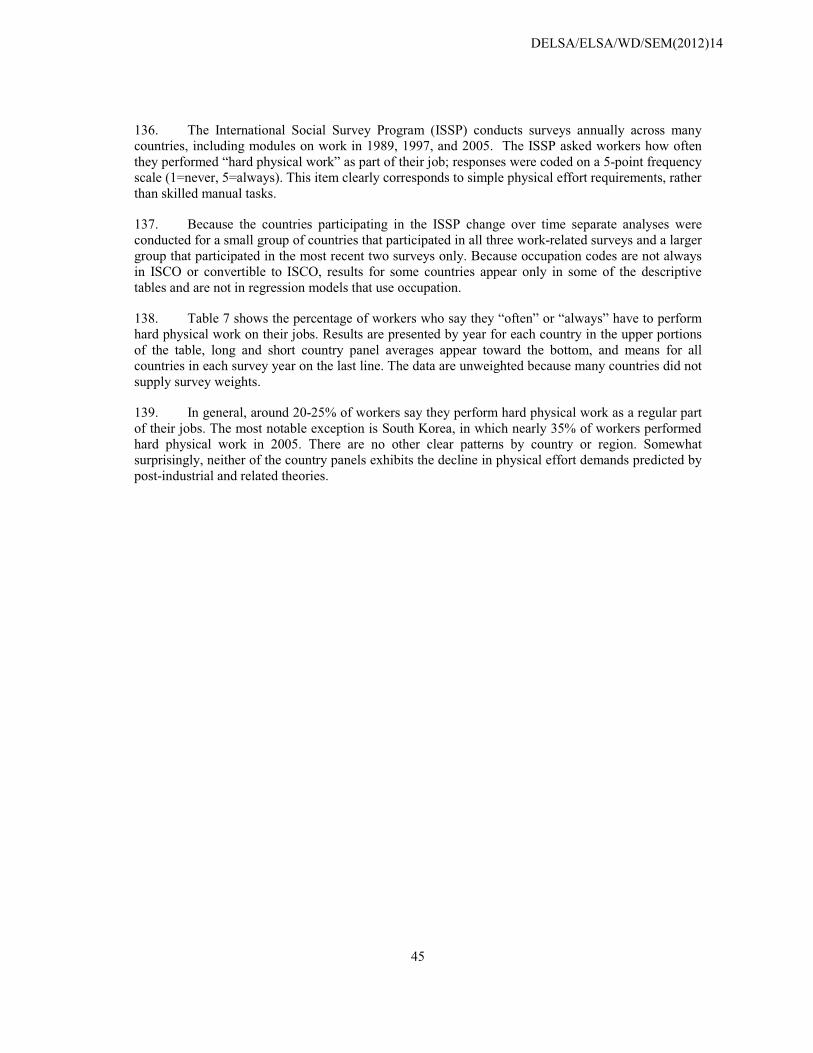
DELSA/ELSA/WD/SEM(2012)14
45
136. The International Social Survey Program (ISSP) conducts surveys annually across many countries, including modules on work in 1989, 1997, and 2005. The ISSP asked workers how often they performed “hard physical work” as part of their job; responses were coded on a 5-point frequency scale (1=never, 5=always). This item clearly corresponds to simple physical effort requirements, rather than skilled manual tasks.
137. Because the countries participating in the ISSP change over time separate analyses were conducted for a small group of countries that participated in all three work-related surveys and a larger group that participated in the most recent two surveys only. Because occupation codes are not always in ISCO or convertible to ISCO, results for some countries appear only in some of the descriptive tables and are not in regression models that use occupation.
138. Table 7 shows the percentage of workers who say they “often” or “always” have to perform hard physical work on their jobs. Results are presented by year for each country in the upper portions of the table, long and short country panel averages appear toward the bottom, and means for all countries in each survey year on the last line. The data are unweighted because many countries did not supply survey weights.
139. In general, around 20-25% of workers say they perform hard physical work as a regular part of their jobs. The most notable exception is South Korea, in which nearly 35% of workers performed hard physical work in 2005. There are no other clear patterns by country or region. Somewhat surprisingly, neither of the country panels exhibits the decline in physical effort demands predicted by post-industrial and related theories.
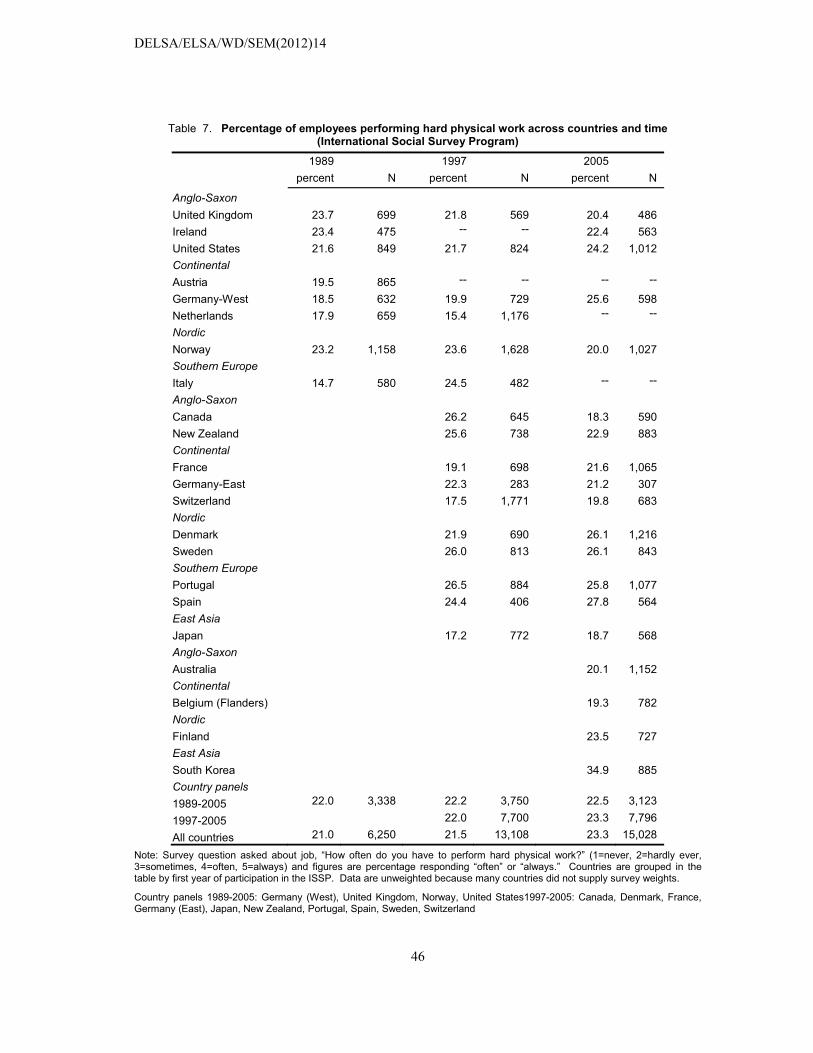
DELSA/ELSA/WD/SEM(2012)14
46
Table 7. Percentage of employees performing hard physical work across countries and time (International Social Survey Program)
1989 1997 2005 percent N percent N percent N
Anglo-Saxon
United Kingdom 23.7 699 21.8 569 20.4 486 Ireland 23.4 475 -- -- 22.4 563 United States 21.6 849 21.7 824 24.2 1,012 Continental Austria 19.5 865 -- -- -- --
Germany-West 18.5 632 19.9 729 25.6 598 Netherlands 17.9 659 15.4 1,176 -- --
Nordic Norway 23.2 1,158 23.6 1,628 20.0 1,027 Southern Europe
Italy 14.7 580 24.5 482 -- --
Anglo-Saxon Canada 26.2 645 18.3 590 New Zealand 25.6 738 22.9 883 Continental France 19.1 698 21.6 1,065 Germany-East 22.3 283 21.2 307 Switzerland 17.5 1,771 19.8 683 Nordic Denmark 21.9 690 26.1 1,216 Sweden 26.0 813 26.1 843 Southern Europe Portugal 26.5 884 25.8 1,077 Spain 24.4 406 27.8 564 East Asia Japan 17.2 772 18.7 568 Anglo-Saxon
Australia 20.1 1,152 Continental Belgium (Flanders) 19.3 782 Nordic Finland 23.5 727 East Asia South Korea 34.9 885 Country panels
1989-2005 22.0 3,338 22.2 3,750 22.5 3,123
1997-2005 22.0 7,700 23.3 7,796
All countries 21.0 6,250 21.5 13,108 23.3 15,028
Note: Survey question asked about job, “How often do you have to perform hard physical work?” (1=never, 2=hardly ever, 3=sometimes, 4=often, 5=always) and figures are percentage responding “often” or “always.” Countries are grouped in the table by first year of participation in the ISSP. Data are unweighted because many countries did not supply survey weights.
Country panels 1989-2005: Germany (West), United Kingdom, Norway, United States1997-2005: Canada, Denmark, France, Germany (East), Japan, New Zealand, Portugal, Spain, Sweden, Switzerland

DELSA/ELSA/WD/SEM(2012)14
47
140. Table 8 present results by 1-digit occupation and education group for each year. Because the participating countries differ across waves, data for each year must be treated as a separate cross-section rather than compared across years. Agricultural occupations stand out clearly as the most physically demanding; 60-70% of farm workers say they perform hard physical work. Craft and elementary jobs are generally tied for a distant second place, as 37-47% report performing hard physical work regularly, with operators and assemblers not far behind at around 35%. The share of service workers varies between about 23% and 35%. Rates for sales workers are another level lower between 15-25%. Managers, professionals, technical workers and associate professionals, and clerical workers are least likely to report physically demanding jobs with rates between 7-15%.
141. Education also shows a consistent negative relationship with physical job demands for all years (bottom panel, Table 8). When the lowest and highest educational categories are compared in terms of the original 5-point scale, the difference is approximately 1.1 points or 0.9 standard deviations (not shown).
142. However, personal education is not as important as occupation. In a simple OLS model for the long panel countries, 4-digit ISCO occupation entered alone yields an adjusted R2 of 0.41, while a model with only education, experience, gender, and marital status (and their interaction) has an adjusted R2 of 0.13.
143. Ordinal logit regressions were estimated to test more formally for time trends and other effects. Models were run separately for countries in the 1989-2005 panel (West Germany, Norway, U.S.) and the 1997-2005 panel (Canada, Denmark, East Germany, France, New Zealand, Portugal, Spain, Sweden, Switzerland). Table 9 presents results in the form of odds ratios.
144. Most notable are the small effects of the year dummies in models with only country controls (models 1 and 5). Though the year coefficients are below unity for both groups of countries, the effect is significant only for countries in the short panel, where the odds of performing hard physical work are only 0.93 times as great in 2005 as in 1997. Even this effect becomes insignificant after controlling for education and occupation composition, suggesting there was no decline in physical demands within groups as one might have expected due to automation or rising capital intensity, for example. For the three countries in the long panel, the odds of physically demanding work are actually significantly above unity after controlling for education and occupation and rather large for both 1997 and 2005 relative to 1989, meaning that physical demands apparently increased within education and occupation groups. Country-year interactions and country-specific models show the effects are only significant for West Germany and Norway, not the United States (not shown), but they are opposite of what is expected nonetheless. No country-year interactions are significant for the short panel (model 8) except for Canada, which is strongly negative (OR=0.57).
145. Thus, it appears that for the three countries in the long panel physical demands remained constant despite shifts in the educational and occupational composition of the workforce, and may have risen significantly within education and occupation groups in Norway and West Germany. The second group of nine countries experienced a modest decline in physical demands between 1997 and 2005 due to compositional shifts, while there was no change in demands within educational and occupational groups.
146. Though unexpected, these findings of modest change over recent years are within the range found in other studies for this period for the U.S. and UK (Johnson, 2004; Steuerle, Spiro, and Johnson 1999; Green 2010).
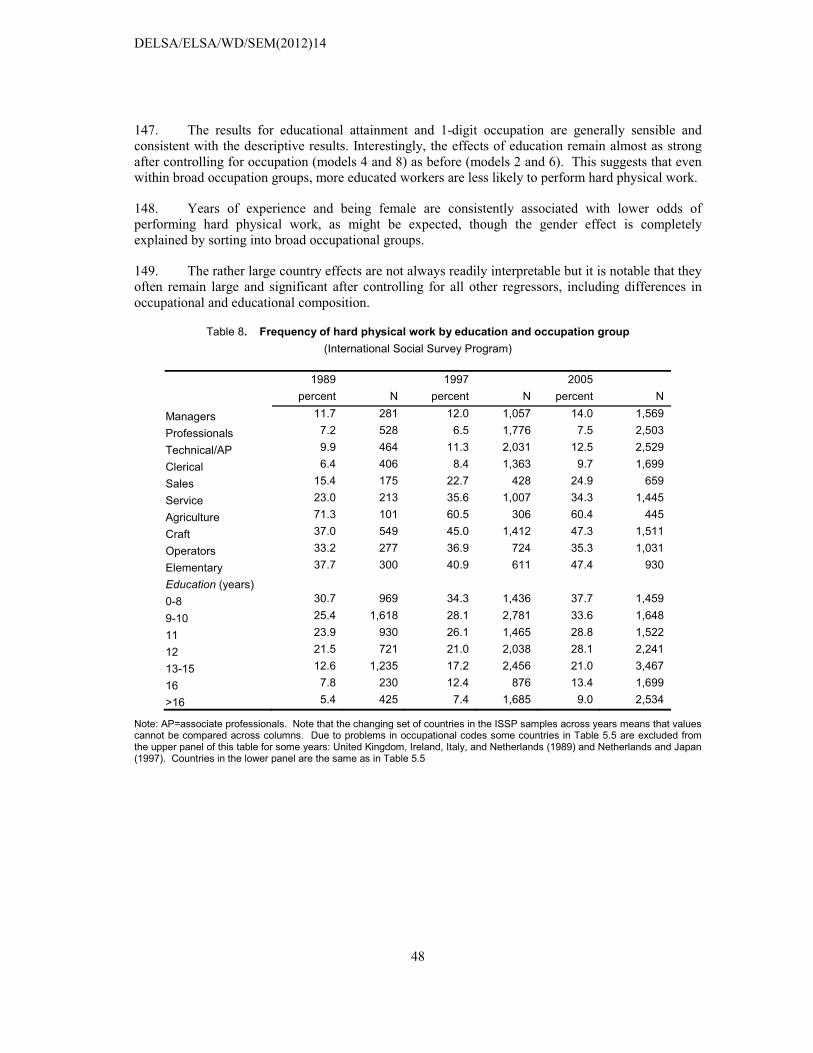
DELSA/ELSA/WD/SEM(2012)14
48
147. The results for educational attainment and 1-digit occupation are generally sensible and consistent with the descriptive results. Interestingly, the effects of education remain almost as strong after controlling for occupation (models 4 and 8) as before (models 2 and 6). This suggests that even within broad occupation groups, more educated workers are less likely to perform hard physical work.
148. Years of experience and being female are consistently associated with lower odds of performing hard physical work, as might be expected, though the gender effect is completely explained by sorting into broad occupational groups.
149. The rather large country effects are not always readily interpretable but it is notable that they often remain large and significant after controlling for all other regressors, including differences in occupational and educational composition.
Table 8. Frequency of hard physical work by education and occupation group (International Social Survey Program)
1989 1997 2005 percent N percent N percent N
Managers 11.7 281 12.0 1,057 14.0 1,569
Professionals 7.2 528 6.5 1,776 7.5 2,503
Technical/AP 9.9 464 11.3 2,031 12.5 2,529
Clerical 6.4 406 8.4 1,363 9.7 1,699
Sales 15.4 175 22.7 428 24.9 659
Service 23.0 213 35.6 1,007 34.3 1,445
Agriculture 71.3 101 60.5 306 60.4 445
Craft 37.0 549 45.0 1,412 47.3 1,511
Operators 33.2 277 36.9 724 35.3 1,031
Elementary 37.7 300 40.9 611 47.4 930
Education (years)
0-8 30.7 969 34.3 1,436 37.7 1,459
9-10 25.4 1,618 28.1 2,781 33.6 1,648
11 23.9 930 26.1 1,465 28.8 1,522
12 21.5 721 21.0 2,038 28.1 2,241
13-15 12.6 1,235 17.2 2,456 21.0 3,467
16 7.8 230 12.4 876 13.4 1,699
>16 5.4 425 7.4 1,685 9.0 2,534
Note: AP=associate professionals. Note that the changing set of countries in the ISSP samples across years means that values cannot be compared across columns. Due to problems in occupational codes some countries in Table 5.5 are excluded from the upper panel of this table for some years: United Kingdom, Ireland, Italy, and Netherlands (1989) and Netherlands and Japan (1997). Countries in the lower panel are the same as in Table 5.5

DELSA/ELSA/WD/SEM(2012)14
49
Table 9. Ordinal logit models of the determinants of hard physical work on the job (odds ratios)
(International Social Survey Program)
1989-2005 panel 1997-2005 panel 1 2 3 4 5 6 7 8 1997 0.98 1.22*** (0.05) (0.06) 2005 0.97 1.35*** 0.93* 1.04 (0.05) (0.07) (0.03) (0.04) Education 9-10 years 0.71*** 0.82* 0.60*** 0.82** (0.06) (0.07) (0.03) (0.05) 11 years 0.39*** 0.56*** 0.70*** 0.80** (0.03) (0.05) (0.05) (0.06) 12 years 0.58*** 0.55*** 0.40*** 0.59*** (0.05) (0.05) (0.03) (0.04) 13-15 years 0.27*** 0.41*** 0.38*** 0.55*** (0.02) (0.04) (0.02) (0.04) 16 years 0.16*** 0.26*** 0.24*** 0.46*** (0.02) (0.03) (0.02) (0.04) �17 years 0.11*** 0.24*** 0.16*** 0.37*** (0.01) (0.03) (0.01) (0.03) Experience 0.97*** 0.98*** 0.97*** 0.98*** (0.01) (0.01) (0.00) (0.00) Exp2/100 1.03* 1.01 1.03** 1.01 (0.01) (0.01) (0.01) (0.01) Female 0.64*** 0.91 0.74*** 0.97 (0.04) (0.06) (0.04) (0.05) Married (1=yes) 0.77*** 0.83** 1.05 1.06 (0.05) (0.05) (0.05) (0.05) Female*married 1.07 1.07 1.00 0.92 (0.09) (0.09) (0.07) (0.06) Professionals 0.46*** 0.60*** 0.63*** 0.69*** (0.04) (0.05) (0.04) (0.05) Technical/AP 0.78** 0.79** 1.08 1.05 (0.06) (0.06) (0.07) (0.07) Clerical 0.58*** 0.48*** 0.74*** 0.68*** (0.05) (0.04) (0.05) (0.05) Sales 2.53*** 1.91*** 2.42*** 2.14*** (0.27) (0.22) (0.24) (0.22) Service 3.45*** 2.64*** 4.59*** 3.96*** (0.32) (0.26) (0.34) (0.31) Agriculture 14.09*** 12.28*** 11.80*** 11.11*** (1.99) (1.78) (1.24) (1.21) Craft 6.54*** 5.04*** 6.57*** 5.62*** (0.55) (0.45) (0.47) (0.43) Operators 4.59*** 3.22*** 4.98*** 4.01*** (0.44) (0.32) (0.41) (0.34) Elementary 7.23*** 4.98*** 6.19*** 5.46*** (0.74) (0.54) (0.51) (0.48) USA 1.41*** 2.15*** (0.08) (0.15) Norway 1.33*** 1.49*** (0.07) (0.09)
DELSA/ELSA/WD/SEM(2012)14
50
Table 9. Ordinal logit models of the determinants of hard physical work on the job (odds ratios) (cont.)
(International Social Survey Program)
1989-2005 panel 1997-2005 panel 1 2 3 4 5 6 7 8 Canada 1.11 2.10*** (0.10) (0.22) New Zealand 1.20* 1.53*** (0.10) (0.15) France 0.89 1.38** (0.08) (0.13) Switzerland 0.80** 0.91 (0.07) (0.09) Denmark 1.30** 1.58*** (0.11) (0.15) Sweden 1.38*** 1.72*** (0.12) (0.17) Portugal 1.23* 0.80* (0.10) (0.08) Spain 1.34** 1.09 (0.13) (0.12) cut1 0.51*** 0.06*** 0.51*** 0.23*** 0.43*** 0.09*** 0.63*** 0.34*** (0.03) (0.01) (0.03) (0.03) (0.03) (0.01) (0.03) (0.05) cut2 1.52*** 0.21*** 2.00*** 0.95 1.24** 0.29*** 2.21*** 1.22 (0.08) (0.02) (0.12) (0.13) (0.09) (0.02) (0.12) (0.17) cut3 4.37*** 0.66*** 7.65*** 3.75*** 3.57*** 0.88 7.96*** 4.50*** (0.23) (0.06) (0.50) (0.51) (0.27) (0.06) (0.46) (0.62) cut4 17.54*** 2.84*** 36.50*** 18.53*** 13.18*** 3.37*** 34.21*** 19.58*** (1.12) (0.29) (2.81) (2.61) (1.07) (0.25) (2.22) (2.73) Log-likelihood -12,696.7 -11,795.9 -10,902.9 -10,532.6 -21309.3 -19834.9 -18640.7 -17724.5 N 8,388 8,165 7,991 7,855 13,999 13,407 13,337 12,843
Note: Dependent variable is response to question, “How often do you have to perform hard physical work?” (1=never, 2=hardly ever, 3=sometimes, 4=often, 5=always). Coefficients are in odds ratios. Standard errors in parentheses. Omitted categories are 0-8 years of education and managers for both panels, 1989 (1997) for the long (short) panel, and West Germany (East Germany) for the long (short) panel. * p < 0.05, ** p < 0.01, *** p < 0.001
C. Trends in cognitive, interpersonal, and physical jobs demands in the European Union
150. The European Working Conditions Survey (EWCS) is another rich source of information on job skill requirements. The EWCS has been conducted at five-year intervals since 1995 for all countries in the European Union and often including accession, candidate, and associate countries. The pilot conducted in 1990 also extends the time series for a small number of items even earlier. Nevertheless, the EWCS, like the ESS and ISSP, does not a very full or long time series and the country sample sizes are not large. The EWCS contains measures relating to cognitive, interpersonal, and physical job requirements. This report restricts the sample to wage and salary workers to focus on the nature of jobs demanded by employers.
151. Table 10 presents trends for three measures of cognitive job requirements. The EWCS asked workers whether or not their job involved complex tasks, solving unforeseen problems on their own, and learning new things (yes/no). The figures in Table 10 show the weighted percentage responding “yes.” Results for the EU-15 are sample averages in which person weights were adjusted by the size of each country’s workforce in that year, derived from the European Labour Force Surveys (author’s calculations). The figures for the EU-15 and individual countries show no positive trend between 1995 and 2005. For problem solving and learning new things the trend appears to be negative. Means for individual countries, such as complex tasks in Sweden, show some implausibly large swings, while the patterns for others are less erratic.
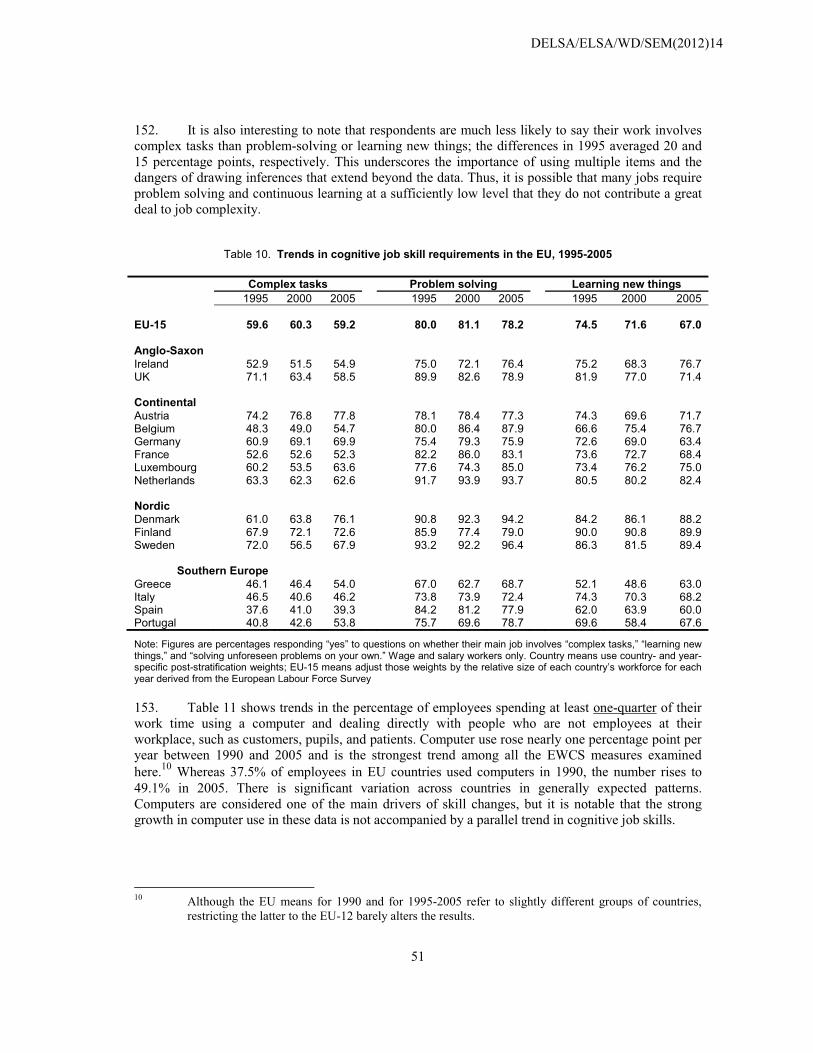
DELSA/ELSA/WD/SEM(2012)14
51
152. It is also interesting to note that respondents are much less likely to say their work involves complex tasks than problem-solving or learning new things; the differences in 1995 averaged 20 and 15 percentage points, respectively. This underscores the importance of using multiple items and the dangers of drawing inferences that extend beyond the data. Thus, it is possible that many jobs require problem solving and continuous learning at a sufficiently low level that they do not contribute a great deal to job complexity.
Table 10. Trends in cognitive job skill requirements in the EU, 1995-2005
Complex tasks Problem solving Learning new things 1995 2000 2005 1995 2000 2005 1995 2000 2005 EU-15 59.6 60.3 59.2 80.0 81.1 78.2 74.5 71.6 67.0 Anglo-Saxon Ireland 52.9 51.5 54.9 75.0 72.1 76.4 75.2 68.3 76.7 UK 71.1 63.4 58.5 89.9 82.6 78.9 81.9 77.0 71.4 Continental Austria 74.2 76.8 77.8 78.1 78.4 77.3 74.3 69.6 71.7 Belgium 48.3 49.0 54.7 80.0 86.4 87.9 66.6 75.4 76.7 Germany 60.9 69.1 69.9 75.4 79.3 75.9 72.6 69.0 63.4 France 52.6 52.6 52.3 82.2 86.0 83.1 73.6 72.7 68.4 Luxembourg 60.2 53.5 63.6 77.6 74.3 85.0 73.4 76.2 75.0 Netherlands 63.3 62.3 62.6 91.7 93.9 93.7 80.5 80.2 82.4 Nordic Denmark 61.0 63.8 76.1 90.8 92.3 94.2 84.2 86.1 88.2 Finland 67.9 72.1 72.6 85.9 77.4 79.0 90.0 90.8 89.9 Sweden 72.0 56.5 67.9 93.2 92.2 96.4 86.3 81.5 89.4
Southern Europe Greece 46.1 46.4 54.0 67.0 62.7 68.7 52.1 48.6 63.0 Italy 46.5 40.6 46.2 73.8 73.9 72.4 74.3 70.3 68.2 Spain 37.6 41.0 39.3 84.2 81.2 77.9 62.0 63.9 60.0 Portugal 40.8 42.6 53.8 75.7 69.6 78.7 69.6 58.4 67.6
Note: Figures are percentages responding “yes” to questions on whether their main job involves “complex tasks,” “learning new things,” and “solving unforeseen problems on your own.” Wage and salary workers only. Country means use country- and year-specific post-stratification weights; EU-15 means adjust those weights by the relative size of each country’s workforce for each year derived from the European Labour Force Survey
153. Table 11 shows trends in the percentage of employees spending at least one-quarter of their work time using a computer and dealing directly with people who are not employees at their workplace, such as customers, pupils, and patients. Computer use rose nearly one percentage point per year between 1990 and 2005 and is the strongest trend among all the EWCS measures examined here.10 Whereas 37.5% of employees in EU countries used computers in 1990, the number rises to 49.1% in 2005. There is significant variation across countries in generally expected patterns. Computers are considered one of the main drivers of skill changes, but it is notable that the strong growth in computer use in these data is not accompanied by a parallel trend in cognitive job skills.
10 Although the EU means for 1990 and for 1995-2005 refer to slightly different groups of countries,
restricting the latter to the EU-12 barely alters the results.
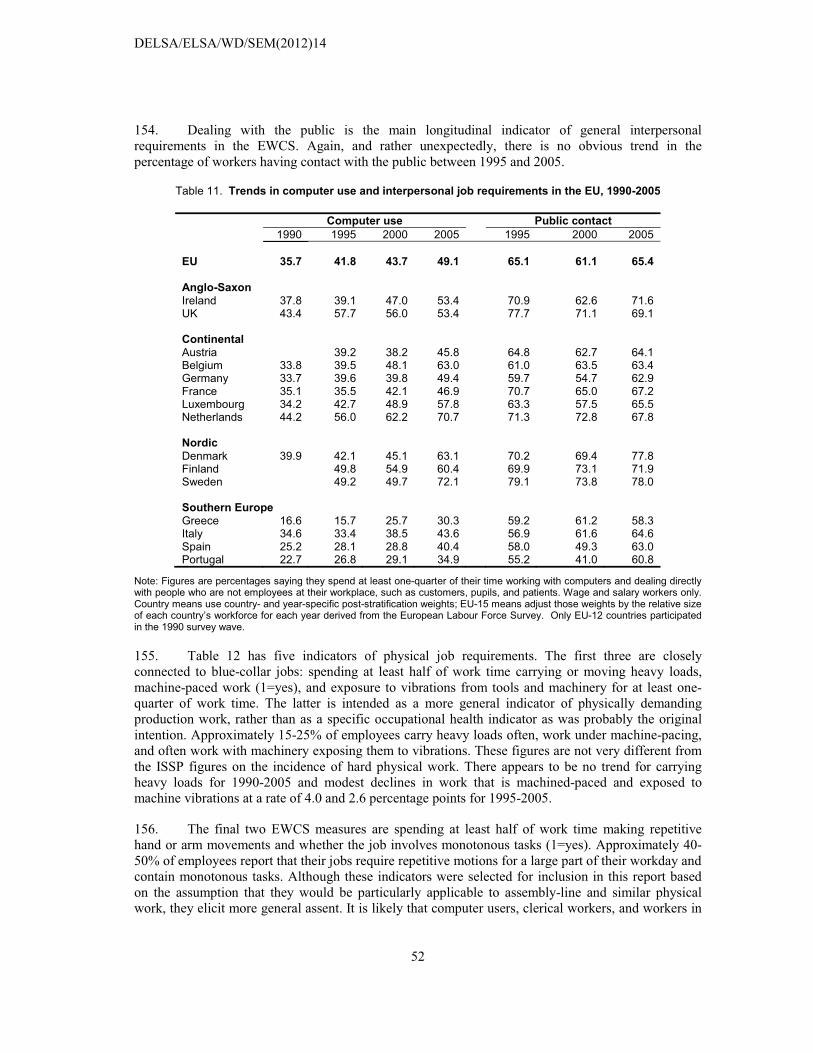
DELSA/ELSA/WD/SEM(2012)14
52
154. Dealing with the public is the main longitudinal indicator of general interpersonal requirements in the EWCS. Again, and rather unexpectedly, there is no obvious trend in the percentage of workers having contact with the public between 1995 and 2005.
Table 11. Trends in computer use and interpersonal job requirements in the EU, 1990-2005
Computer use Public contact 1990 1995 2000 2005 1995 2000 2005 EU 35.7 41.8 43.7 49.1 65.1 61.1 65.4 Anglo-Saxon Ireland 37.8 39.1 47.0 53.4 70.9 62.6 71.6 UK 43.4 57.7 56.0 53.4 77.7 71.1 69.1 Continental Austria 39.2 38.2 45.8 64.8 62.7 64.1 Belgium 33.8 39.5 48.1 63.0 61.0 63.5 63.4 Germany 33.7 39.6 39.8 49.4 59.7 54.7 62.9 France 35.1 35.5 42.1 46.9 70.7 65.0 67.2 Luxembourg 34.2 42.7 48.9 57.8 63.3 57.5 65.5 Netherlands 44.2 56.0 62.2 70.7 71.3 72.8 67.8 Nordic Denmark 39.9 42.1 45.1 63.1 70.2 69.4 77.8 Finland 49.8 54.9 60.4 69.9 73.1 71.9 Sweden 49.2 49.7 72.1 79.1 73.8 78.0 Southern Europe Greece 16.6 15.7 25.7 30.3 59.2 61.2 58.3 Italy 34.6 33.4 38.5 43.6 56.9 61.6 64.6 Spain 25.2 28.1 28.8 40.4 58.0 49.3 63.0 Portugal 22.7 26.8 29.1 34.9 55.2 41.0 60.8
Note: Figures are percentages saying they spend at least one-quarter of their time working with computers and dealing directly with people who are not employees at their workplace, such as customers, pupils, and patients. Wage and salary workers only. Country means use country- and year-specific post-stratification weights; EU-15 means adjust those weights by the relative size of each country’s workforce for each year derived from the European Labour Force Survey. Only EU-12 countries participated in the 1990 survey wave.
155. Table 12 has five indicators of physical job requirements. The first three are closely connected to blue-collar jobs: spending at least half of work time carrying or moving heavy loads, machine-paced work (1=yes), and exposure to vibrations from tools and machinery for at least one-quarter of work time. The latter is intended as a more general indicator of physically demanding production work, rather than as a specific occupational health indicator as was probably the original intention. Approximately 15-25% of employees carry heavy loads often, work under machine-pacing, and often work with machinery exposing them to vibrations. These figures are not very different from the ISSP figures on the incidence of hard physical work. There appears to be no trend for carrying heavy loads for 1990-2005 and modest declines in work that is machined-paced and exposed to machine vibrations at a rate of 4.0 and 2.6 percentage points for 1995-2005.
156. The final two EWCS measures are spending at least half of work time making repetitive hand or arm movements and whether the job involves monotonous tasks (1=yes). Approximately 40-50% of employees report that their jobs require repetitive motions for a large part of their workday and contain monotonous tasks. Although these indicators were selected for inclusion in this report based on the assumption that they would be particularly applicable to assembly-line and similar physical work, they elicit more general assent. It is likely that computer users, clerical workers, and workers in
DELSA/ELSA/WD/SEM(2012)14
53
retail, food service, and other routine services responded positively to these items.11 Significantly, these measures also show no clear trends for 1995-2005.
157. Parent-Thirion et al. (2007) present crosstabulations of all of these measures with country, occupation, education, and industry, similar to the tables in previous sections, which generally show expected patterns, so there is no need to repeat them here. Where trend data are available in publications they are consistent with the results presented here although several run contrary to expectations (Parent-Thirion et al. 2007, p.29).12 Green (2007) has found similarly unexpected results with respect to work autonomy and intensity using these and other surveys.
158. The most recent wave of the EWCS has just been released as this report was written and the first findings suggest the conclusions of this section remain generally valid for the period 2005-2010. For all of the cognitive and physical skill measures used here trends were either flat or in the opposite direction than expected from the skills upgrading perspective except for machine-paced work declined slightly.13
11 The item on monotony may be better considered as a measure of cognitive job skill requirements and
perhaps job satisfaction, as well, given the inevitably subjective quality of the judgment it seeks from respondents.
12 See also “Fifteen years of working conditions in the EU: Charting the trends, 2006” and “Ten years of working conditions in the European Union,” both published by European Foundation for the Improvement of Living and Working Conditions, available at
www.eurofound.europa.eu/pubdocs/2006/85/en/1/ef0685en.pdf www.eurofound.europa.eu/pubdocs/2000/128/en/1/ef00128en.pdf.
13 In the section on cognitive skills, the recent release on the EWCS 2010 comments: A fundamental aspect of developing in a job is having the opportunity to tackle cognitive challenges at work – for instance, learning new things, solving unforeseen problems on one’s own, or performing complex tasks. This is important both for workers’ own well-being, and for companies to ensure that they continually upgrade their in-house capacity to create and innovate. Broadly speaking, there has been no marked improvement over time in this respect. From “Changes over time – First findings from the fifth European Working Conditions Survey,” European Foundation for the Improvement of Living and Working Conditions. Available at
www.eurofound.europa.eu/pubdocs/2010/74/en/1/EF1074EN.pdf

DELSA/ELSA/WD/SEM(2012)14
54
159. More analytical work is needed to understand the reasons for these trends, most of which must be within occupations because section 3 indicates that the occupational composition has been changing in the opposite direction, which will be confirmed in section 6 when the skill implication of 3-digit occupation shifts will be examined using a common set of occupational skill scores from the O*NET database. It is also possible that there are methodological problems with the EWCS as some of the items appear rather vague, overly general, and consequently open to varying interpretations by respondents.14 Survey items that are more concrete and carefully crafted might show different patterns.
14 Some of these problems and other challenges of cross-national surveys are recognized (Parent-Thirion
et al. 2007, p.97).

D
ELSA
/ELS
A/W
D/S
EM(2
012)
14
55
Tabl
e 12
. Tr
ends
in p
hysi
cal a
nd re
late
d jo
b re
quire
men
ts in
the
EU, 1
990-
2005
H
eavy
load
s M
achi
ne p
aced
Vi
brat
ions
R
epet
itive
mot
ions
M
onot
onou
s ta
sks
19
90
1995
20
00
2005
19
95
2000
20
05
1995
20
00
2005
19
95
2000
20
05
1995
20
00
2005
EU
15.4
18
.7
23.1
18.9
22.5
22
.1
18.5
24
.023
.6
21.4
44.2
43
.5
49.2
45
.439
.342
.5
Ang
lo-S
axon
Irela
nd
17.0
17
.1
20.0
17
.2
27.0
26
.0
12.7
20
.4
22.3
16
.0
39.8
46
.9
41.7
58
.4
51.7
45
.2
UK
16
.2
18.3
24
.8
18.1
27
.0
22.8
20
.8
15.8
16
.9
14.4
52
.3
44.5
46
.9
68.0
57
.5
57.5
C
ontin
enta
l
Bel
gium
14
.7
20.0
20
.3
14.6
16
.9
19.0
15
.6
19.7
20
.2
13.6
44
.1
40.9
39
.0
36.8
31
.4
31.7
G
erm
any
14.7
17
.6
21.3
16
.1
20.2
21
.7
17.7
28
.2
27.0
26
.8
37.3
34
.5
42.7
33
.9
26.5
29
.3
Fran
ce
20.4
25
.0
28.5
27
.9
23.1
21
.3
19.2
22
.8
22.7
22
.4
53.1
57
.3
60.2
49
.6
42.6
44
.7
Luxe
m.
12.6
14
.6
19.9
18
.0
26.6
23
.7
15.5
25
.6
20.0
19
.5
35.3
41
.9
49.6
42
.8
30.6
36
.7
Net
herla
nd
11.4
14
.4
15.0
10
.8
21.6
16
.8
12.1
13
.0
13.4
13
.1
50.7
53
.3
46.1
32
.9
27.3
23
.2
Aus
tria
22
.7
21.7
22
.9
20.5
18
.4
21.1
26
.4
25.0
22
.9
42.6
40
.1
51.8
31
.7
27.8
3.
00
Nor
dic
Den
mar
k 13
.6
17.6
16
.5
13.1
14
.3
12.5
12
.0
15.5
14
.7
14.3
38
.3
39.3
50
.8
39.5
37
.4
42.3
Fi
nlan
d
14.6
16
.3
19.5
22
.1
18.9
20
.8
21.6
24
.1
20.2
55
.0
58.9
72
.5
46.2
46
.6
47.9
S
wed
en
18
.0
23.4
15
.6
12.0
9.
0 6.
5 13
.9
17.5
11
.8
29.0
50
.0
50.1
26
.6
26.8
18
.7
Sout
hern
Eur
ope
G
reec
e 18
.6
19.8
23
.9
27.1
28
.8
22.3
18
.7
32.0
24
.9
28.7
62
.2
57.7
69
.8
63.2
53
.2
57.5
Ita
ly
8.2
12.8
15
.4
12.5
24
.4
22.7
17
.7
20.5
24
.7
18.2
43
.8
42.7
53
.4
48.0
36
.2
43.5
S
pain
18
.8
21.7
29
.9
24.1
25
.2
29.0
17
.6
30.0
32
.4
19.5
54
.2
62.8
55
.4
63.5
60
.7
64.2
P
ortu
gal
17.7
15
.3
19.2
19
.0
27.0
21
.0
25.7
29
.9
30.4
28
.6
58.6
53
.9
63.9
47
.0
42.9
51
.7
Not
e: F
igur
es a
re p
erce
ntag
es s
ayin
g th
ey s
pend
at l
east
one
-hal
f of t
heir
time
wor
king
car
ryin
g or
mov
ing
heav
y lo
ads
and
mak
ing
repe
titiv
e ha
nd o
r arm
mov
emen
ts, a
t lea
st o
ne-
quar
ter o
f the
ir tim
e “e
xpos
ed to
vib
ratio
ns fr
om h
and
tool
s, m
achi
nery
, etc
.,” a
nd a
nsw
ered
“yes
” to
ques
tions
ask
ing
whe
ther
thei
r wor
k pa
ce is
“dep
ende
nt o
n th
e au
tom
atic
spe
ed o
f a
mac
hine
or
mov
ing
of a
pro
duct
” an
d w
heth
er th
eir
job
invo
lved
“m
onot
onou
s ta
sks”
or
not.
Wag
e an
d sa
lary
wor
kers
onl
y.
Cou
ntry
mea
ns u
se c
ount
ry-
and
year
-spe
cific
pos
t-st
ratif
icat
ion
wei
ghts
; EU
-15
mea
ns a
djus
t tho
se w
eigh
ts b
y th
e re
lativ
e si
ze o
f eac
h co
untry
’s w
orkf
orce
for e
ach
year
der
ived
from
the
Eur
opea
n La
bour
For
ce S
urve
y. O
nly
EU
-12
coun
tries
par
ticip
ated
in th
e 19
90 s
urve
y w
ave.

DELSA/ELSA/WD/SEM(2012)14
56
D. Job skill requirements by degree of specificity/generality and source of skill
160. The previous sections examined cross-national measures of cognitive, interpersonal, and manual skill requirements. This section approaches skills from two different angles: skill specificity/generality and the source of job skills.
161. Questions regarding the specificity or generality of job skill requirements have been a longstanding concern. Some countries, like Germany, have a strong occupational consciousness that is built into their school system at various levels and licensing/certification systems. Others, like the United States, have more general systems of occupational recruitment, weaker formal connections between education and jobs, particularly at the secondary level, and more flexibility with respect to occupational choice.
162. New labour market entrants with highly developed occupation-specific skills might have an easier transition to employment within their field compared to workers with a similar amount of education from a general program. But they might have a much harder time changing fields if their specialization is quite narrow and their training has crowded out acquisition of more general skills. If labour markets are becoming more turbulent, increasing the rate of involuntary job changing, this may be quite important.
163. A solid base of general skills potentially gives workers wider career options, greater flexibility to move among occupations and employers, and a better basis for reemployment in the event of unemployment, but may be less attractive to employers looking for a specific skill set.
164. It is difficult to determine the importance of general or specific skills relative to one another or relative to the past because they are incommensurate. It is impossible to say whether a car salesperson’s job requires more product knowledge or more interpersonal skills because these characteristics lack a common scale of measurement. One partial solution will be available when the second ESS module on work is released and one can compare whether the levels and wage returns to required education have increased more rapidly than job learning times, representing general and specific skills respectively.
165. Among available data, the ISSP asked respondents how much of their past skills and experience they use in their present job (1997, 2005) and how helpful their current skills and experience would be in seeking a new job (2005). Absolute and relative levels give some indication of the incidence of skill generality and transferability.
166. The ISSP also contains information on the importance of schooling and the workplace as sources of job skills in 1997. Although the data are cross-sectional they provide important information on the extent to which different jobs require formal schooling and the degree of integration between educational outcomes and job requirements.
167. In addition, it is likely that many skills learned in the workplace are also specific skills, while job skills learned in school are more general, but the correspondence need not be exact. Occupation-specific skills can be learned in school and transferable skills can be learned on the job. The correlation between skill transferability and skill source may be informative in this regard.
168. Table 13 gives (1) the percentage of workers in each country that said all or a lot of their past work experience and job skills were used in their present job (and the difference between figures for 1997 and 2005), (2) the percentage that said their current work experience and job skills would be very
DELSA/ELSA/WD/SEM(2012)14
57
or quite helpful if they were looking for a new job, (3) the percentage that said formal schooling was an important or very important source of job skills currently used, and (4) the percentage that said prior training or job experience was an important or very important source of current job skills.
169. These items tend to receive very high percentages responding positively, though there are exceptions. Portugal, Spain, Japan, and Korea tend to score lowest on the measures of skill transferability in the left panel. Italy, Japan, and United Kingdom score lowest on schooling as an important source of job skills, with only 35-52% responding affirmatively compared to the average of 60%. In the vast majority of countries, 80-90% of workers agree that the workplace is an important source of job skills, but the figures are closer to 65-70% for Japan, Portugal, and Spain. This is particularly surprising in the case of Japan because of its well-known emphasis on employer-provided training, at least in large firms. In most countries 5-10% does not attribute much importance to either formal schooling or employment as a source of job skills, rising to around 15% in a few others; the figure is 18% in Spain, 22% in Portugal, and 28% in Japan (not shown). It is not clear whether some of these patterns reflect national differences in how the questions are understood and answered or genuine differences in the education system and employment conditions.
170. There are three other notable aspects of Table 13. In nine of the fourteen countries participating in both surveys, the percentage reporting their past work experience and job skills as important for their current work declined between 1997 and 2005; in two countries there was little change and in three the percentage increased (column 3, Table 13). The reasons for the general decline are not immediately obvious. It is possible that the rate of skill obsolescence has risen or (contrary to expectation) the degree of job skill specificity has increased, or perhaps some compositional change accounts for the difference. The ISSP items are so general that it would not be easy to dig much deeper, but it does appear that fewer people believed their previous jobs gave them transferable skills in 2005 than in 1997.
171. By contrast, it is also the case that in 2005 people in every country except Sweden appear to be significantly more optimistic about the transferability of their current job skills in the future than about the degree to which skills from previous jobs transferred to their present job, a difference averaging nearly 20 percentage points (columns 2 and 4, Table 13). It is possible that this represents a lifecycle effect; as respondents anticipate moving up to more responsible positions they foresee their current skills becoming more relevant to future jobs, though the multi-cohort nature of the samples reduces the likelihood that this is the explanation. It is more likely that people are more limited in assessing the future than the present and have an excessively rosy view of future possibilities compared to their current situation.15 The latter possibility argues for caution in drawing strong conclusions from prospective items of this sort.
15 It should be noted that the percentages in columns 2 and 4 are not strictly comparable because the
response options differed somewhat, but it seems unlikely that this accounts for the entire difference.
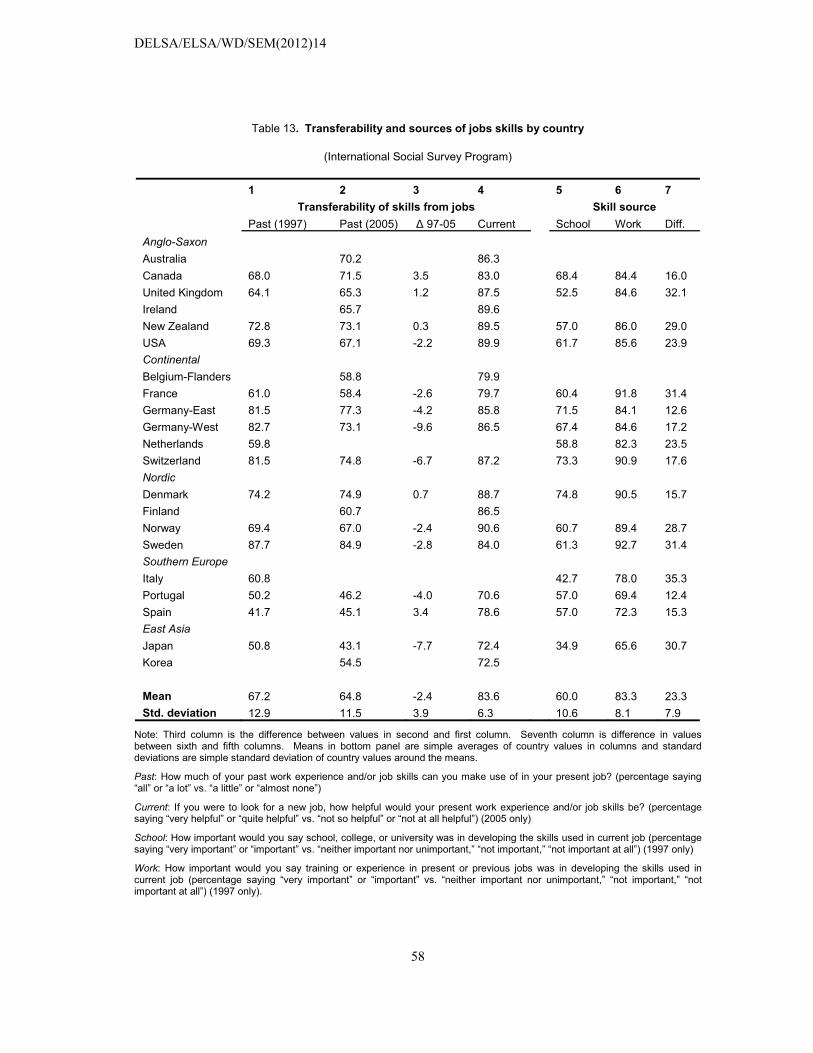
DELSA/ELSA/WD/SEM(2012)14
58
Table 13. Transferability and sources of jobs skills by country
(International Social Survey Program)
1 2 3 4 5 6 7 Transferability of skills from jobs Skill source
Past (1997) Past (2005) � 97-05 Current School Work Diff. Anglo-Saxon
Australia 70.2 86.3
Canada 68.0 71.5 3.5 83.0 68.4 84.4 16.0 United Kingdom 64.1 65.3 1.2 87.5 52.5 84.6 32.1 Ireland 65.7 89.6
New Zealand 72.8 73.1 0.3 89.5 57.0 86.0 29.0 USA 69.3 67.1 -2.2 89.9 61.7 85.6 23.9 Continental
Belgium-Flanders 58.8 79.9
France 61.0 58.4 -2.6 79.7 60.4 91.8 31.4 Germany-East 81.5 77.3 -4.2 85.8 71.5 84.1 12.6 Germany-West 82.7 73.1 -9.6 86.5 67.4 84.6 17.2 Netherlands 59.8 58.8 82.3 23.5 Switzerland 81.5 74.8 -6.7 87.2 73.3 90.9 17.6 Nordic
Denmark 74.2 74.9 0.7 88.7 74.8 90.5 15.7 Finland 60.7 86.5
Norway 69.4 67.0 -2.4 90.6 60.7 89.4 28.7 Sweden 87.7 84.9 -2.8 84.0 61.3 92.7 31.4 Southern Europe
Italy 60.8 42.7 78.0 35.3 Portugal 50.2 46.2 -4.0 70.6 57.0 69.4 12.4 Spain 41.7 45.1 3.4 78.6 57.0 72.3 15.3 East Asia
Japan 50.8 43.1 -7.7 72.4 34.9 65.6 30.7 Korea 54.5 72.5
Mean 67.2 64.8 -2.4 83.6 60.0 83.3 23.3 Std. deviation 12.9 11.5 3.9 6.3 10.6 8.1 7.9
Note: Third column is the difference between values in second and first column. Seventh column is difference in values between sixth and fifth columns. Means in bottom panel are simple averages of country values in columns and standard deviations are simple standard deviation of country values around the means.
Past: How much of your past work experience and/or job skills can you make use of in your present job? (percentage saying “all” or “a lot” vs. “a little” or “almost none”)
Current: If you were to look for a new job, how helpful would your present work experience and/or job skills be? (percentage saying “very helpful” or “quite helpful” vs. “not so helpful” or “not at all helpful”) (2005 only)
School: How important would you say school, college, or university was in developing the skills used in current job (percentage saying “very important” or “important” vs. “neither important nor unimportant,” “not important,” “not important at all”) (1997 only)
Work: How important would you say training or experience in present or previous jobs was in developing the skills used in current job (percentage saying “very important” or “important” vs. “neither important nor unimportant,” “not important,” “not important at all”) (1997 only).
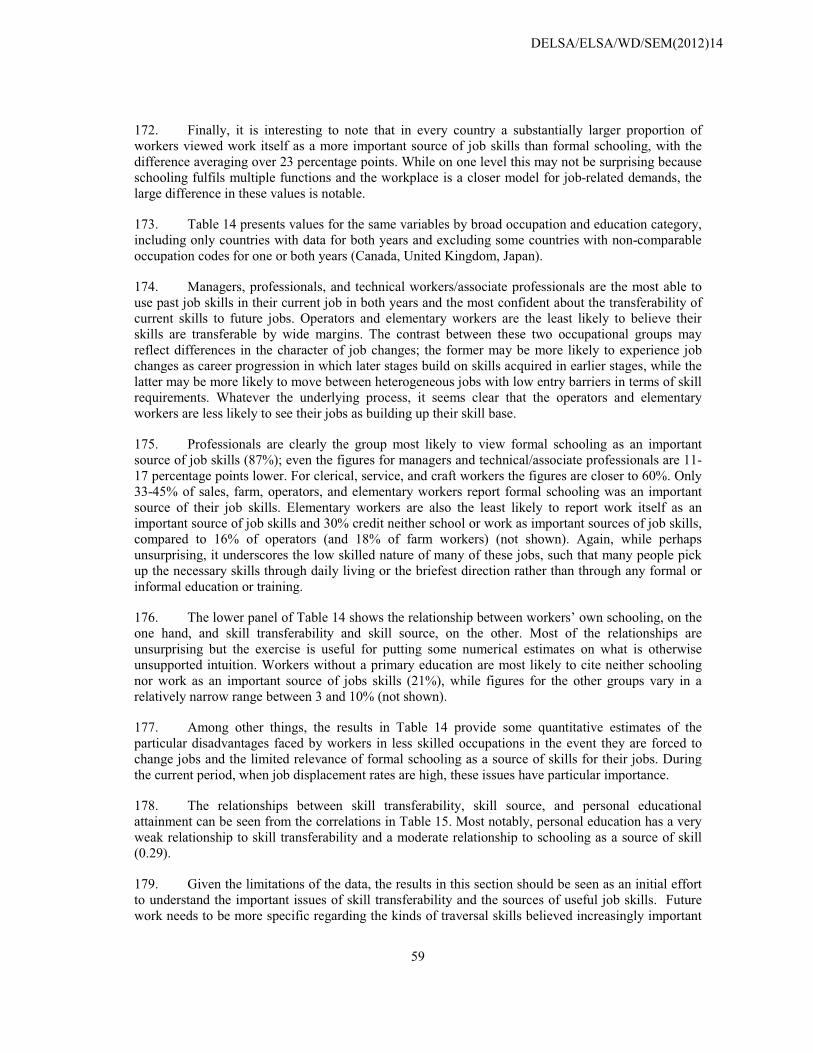
DELSA/ELSA/WD/SEM(2012)14
59
172. Finally, it is interesting to note that in every country a substantially larger proportion of workers viewed work itself as a more important source of job skills than formal schooling, with the difference averaging over 23 percentage points. While on one level this may not be surprising because schooling fulfils multiple functions and the workplace is a closer model for job-related demands, the large difference in these values is notable.
173. Table 14 presents values for the same variables by broad occupation and education category, including only countries with data for both years and excluding some countries with non-comparable occupation codes for one or both years (Canada, United Kingdom, Japan).
174. Managers, professionals, and technical workers/associate professionals are the most able to use past job skills in their current job in both years and the most confident about the transferability of current skills to future jobs. Operators and elementary workers are the least likely to believe their skills are transferable by wide margins. The contrast between these two occupational groups may reflect differences in the character of job changes; the former may be more likely to experience job changes as career progression in which later stages build on skills acquired in earlier stages, while the latter may be more likely to move between heterogeneous jobs with low entry barriers in terms of skill requirements. Whatever the underlying process, it seems clear that the operators and elementary workers are less likely to see their jobs as building up their skill base.
175. Professionals are clearly the group most likely to view formal schooling as an important source of job skills (87%); even the figures for managers and technical/associate professionals are 11-17 percentage points lower. For clerical, service, and craft workers the figures are closer to 60%. Only 33-45% of sales, farm, operators, and elementary workers report formal schooling was an important source of their job skills. Elementary workers are also the least likely to report work itself as an important source of job skills and 30% credit neither school or work as important sources of job skills, compared to 16% of operators (and 18% of farm workers) (not shown). Again, while perhaps unsurprising, it underscores the low skilled nature of many of these jobs, such that many people pick up the necessary skills through daily living or the briefest direction rather than through any formal or informal education or training.
176. The lower panel of Table 14 shows the relationship between workers’ own schooling, on the one hand, and skill transferability and skill source, on the other. Most of the relationships are unsurprising but the exercise is useful for putting some numerical estimates on what is otherwise unsupported intuition. Workers without a primary education are most likely to cite neither schooling nor work as an important source of jobs skills (21%), while figures for the other groups vary in a relatively narrow range between 3 and 10% (not shown).
177. Among other things, the results in Table 14 provide some quantitative estimates of the particular disadvantages faced by workers in less skilled occupations in the event they are forced to change jobs and the limited relevance of formal schooling as a source of skills for their jobs. During the current period, when job displacement rates are high, these issues have particular importance.
178. The relationships between skill transferability, skill source, and personal educational attainment can be seen from the correlations in Table 15. Most notably, personal education has a very weak relationship to skill transferability and a moderate relationship to schooling as a source of skill (0.29).
179. Given the limitations of the data, the results in this section should be seen as an initial effort to understand the important issues of skill transferability and the sources of useful job skills. Future work needs to be more specific regarding the kinds of traversal skills believed increasingly important
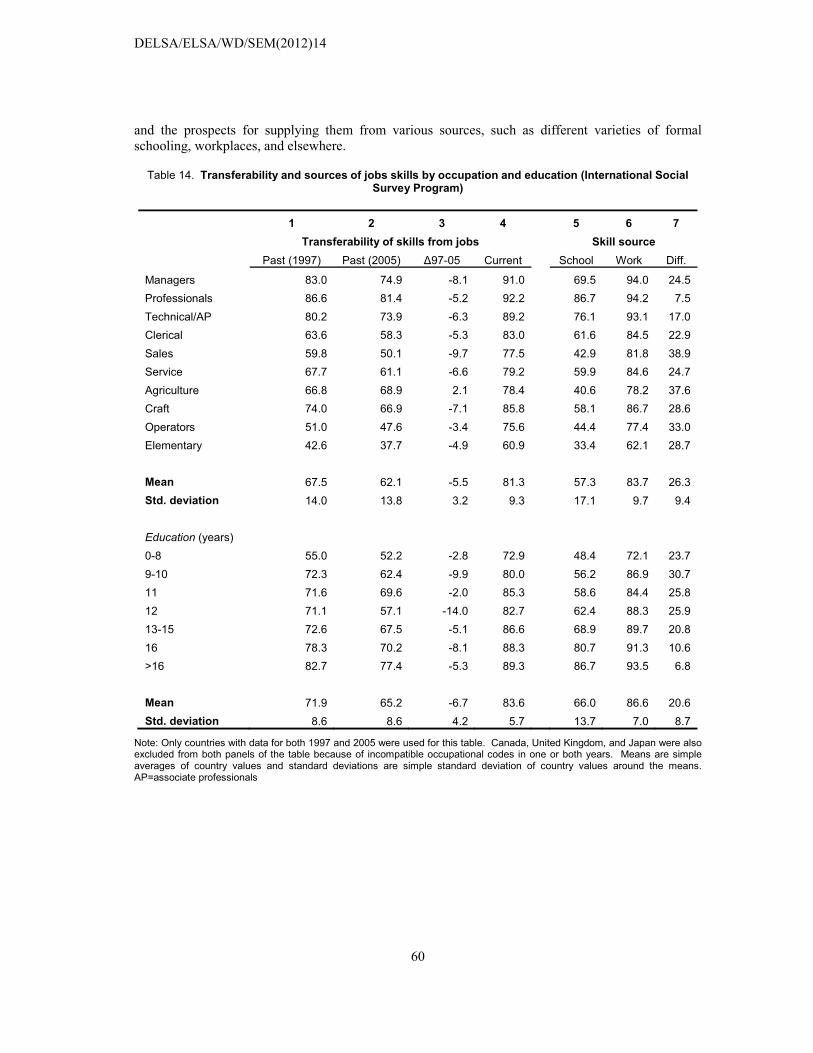
DELSA/ELSA/WD/SEM(2012)14
60
and the prospects for supplying them from various sources, such as different varieties of formal schooling, workplaces, and elsewhere.
Table 14. Transferability and sources of jobs skills by occupation and education (International Social Survey Program)
1 2 3 4 5 6 7 Transferability of skills from jobs Skill source
Past (1997) Past (2005) �97-05 Current School Work Diff.
Managers 83.0 74.9 -8.1 91.0 69.5 94.0 24.5 Professionals 86.6 81.4 -5.2 92.2 86.7 94.2 7.5 Technical/AP 80.2 73.9 -6.3 89.2 76.1 93.1 17.0 Clerical 63.6 58.3 -5.3 83.0 61.6 84.5 22.9 Sales 59.8 50.1 -9.7 77.5 42.9 81.8 38.9 Service 67.7 61.1 -6.6 79.2 59.9 84.6 24.7 Agriculture 66.8 68.9 2.1 78.4 40.6 78.2 37.6 Craft 74.0 66.9 -7.1 85.8 58.1 86.7 28.6 Operators 51.0 47.6 -3.4 75.6 44.4 77.4 33.0 Elementary 42.6 37.7 -4.9 60.9 33.4 62.1 28.7
Mean 67.5 62.1 -5.5 81.3 57.3 83.7 26.3 Std. deviation 14.0 13.8 3.2 9.3 17.1 9.7 9.4
Education (years)
0-8 55.0 52.2 -2.8 72.9 48.4 72.1 23.7 9-10 72.3 62.4 -9.9 80.0 56.2 86.9 30.7 11 71.6 69.6 -2.0 85.3 58.6 84.4 25.8 12 71.1 57.1 -14.0 82.7 62.4 88.3 25.9 13-15 72.6 67.5 -5.1 86.6 68.9 89.7 20.8 16 78.3 70.2 -8.1 88.3 80.7 91.3 10.6 >16 82.7 77.4 -5.3 89.3 86.7 93.5 6.8
Mean 71.9 65.2 -6.7 83.6 66.0 86.6 20.6 Std. deviation 8.6 8.6 4.2 5.7 13.7 7.0 8.7
Note: Only countries with data for both 1997 and 2005 were used for this table. Canada, United Kingdom, and Japan were also excluded from both panels of the table because of incompatible occupational codes in one or both years. Means are simple averages of country values and standard deviations are simple standard deviation of country values around the means. AP=associate professionals
DELSA/ELSA/WD/SEM(2012)14
61
Table 15. Correlations among skills transfer and skills source variables
(International Social Survey Program)
Transferability Skill source Past Current Work School Transferability of skills from:
1 Past jobs 2 Current job 0.40 Source of skills: 3 Work 0.46 na 4 School 0.31 na 0.38
5 Personal education 0.14 0.17 0.17 0.29
Note: Transferability of current skills to future jobs and the skill source variables cannot be correlated because they appear on different waves of the ISSP.
6. Trends in direct measures of skill requirements II: National measures applied to labour force surveys in different countries
180. Although the skill measures in the international surveys provide greater detail on the structure and evolution of job skill requirements than broad occupational groups, the measures themselves are not as detailed as those available in other data sets. In addition, their relatively small sample sizes, few years of availability, variable response rates, and frequent lack of post-stratification weights may limit their reliability and validity for detecting trends and analysing subgroup differences. The database with the largest set of measures over the longest period is the ESWC, whose utility for detailed analyses is hindered by both its very coarse occupational codes, as well as relatively small samples. Even where a time series covers fifteen years, the use of three or four data points to infer trends over that period can be hazardous given sampling variation, possible business cycle effects and other potential year-specific idiosyncrasies. Ideally, one would want worker-level data that includes a large and rich set of skill measures administered to large samples of workers across many years over a long time period.
181. In the absence of such data, occupation-level skill scores from established national programs, such as the Occupational Information Network (O*NET) database produced by the U.S. Department of Labor and the UK Skills Survey (UKSS), can be merged onto labour force survey data from other countries for analyses. Observed differences across countries and changes over time will reflect variations in the composition of employment by 3-digit ISCO occupations, holding skill measures by occupation constant at O*NET or UKSS level.
182. This is similar to the between-group component in a shift-share analysis, as variation within occupations by country and year is not captured. For any given skill, a country’s mean level is a weighted average of occupational skill requirements, where employment levels by occupation are the weights. In effect, the procedure used in this section assigns a common set of occupational skill scores to all countries and examines the impacts of variations in occupational employment, the weights, across countries over time.
DELSA/ELSA/WD/SEM(2012)14
62
183. The richness of the O*NET and UKSS measures compared to the international surveys is evident from Table 16, which shows single-item measures and multi-item scales considered for analyses. In addition to required education and various measures of job learning times, they include detailed measures of particular cognitive job requirements (math, verbal, general cognitive skills), interpersonal skills, and a differentiated set of measures for manual skill requirements (craft skills, physical effort, repetitive motions).
184. Thirty-six countries have time series data on occupational employment, beginning in various years, onto which these measures can be merged. A few previous studies have used O*NET and its predecessor, the Dictionary of Occupational Titles, in a more limited way for investigating job skill requirements across countries over time (e.g., Cully 2003; Goos and Manning 2007; Goos, Manning, and Salomon 2009).
185. Research in sociology demonstrated long ago that the public’s evaluation of the social standing of different occupations is very similar across countries (Treiman 1977). Because evaluations of occupational status are functions of occupational earnings, educational levels, and job tasks, responsibilities and working conditions, there is reason to believe that occupational skill measures will be similar across countries, as well. Indeed, previous analyses showed clearly that occupation explained large shares of the variance in skill measures in international data sets, while country and time dummies added modestly to the explanatory power of the models. Differences across occupations probably dominate other sources of variation.

DELSA/ELSA/WD/SEM(2012)14
63
Table 16. Skill measures from O*NET and the UK Skills Survey
O*NET 1 Required education2 Related prior experience 3 Formal employer training 4 Informal on-the-job training 5 Math requirements: (1) mathematics skills; (2) mathematics knowledge; (3) mathematical reasoning;
(4) number facility (�=0.92) 6 Verbal requirements: (1) reading comprehension; (2) writing skills; (3) writing comprehension; (4)
writing ability; (5) knowledge of English language rules (spelling, grammar, composition); (6) frequency of using written letters and memos (�=0.95)
7 General cognitive demands: (1) analytical thinking; (2) critical thinking; (3) complex problem solving; (4) active learning; (5) analyzing data or information; (6) processing information; (7) thinking creatively; (8) updating and using relevant knowledge; (9) deductive reasoning; (10) inductive reasoning; (11) fluency of ideas; (12) category flexibility (�=0.97)
8 People skills: (1) persuasion; (2) negotiation; (3) speaking skills; (4) frequency of face-to-face discussions; (5) frequency of public speaking; (6) communicating with persons outside organization; (7) dealing with external customers or public; (8) performing for or working directly with the public; (9) customer and personal service knowledge; (10) service orientation; (11) dealing with angry people; (12) dealing with physically aggressive people; (13) frequency of conflict situations; (14) resolving conflicts and negotiating with others; (15) instructing skills; (16) training and teaching others; (17) education and training knowledge; (18) interpreting the meaning of information for others; (19) social orientation; (20) social perceptiveness (�=0.94)
9 Craft skills: (1) controlling machines and processes; (2) repairing and maintaining mechanical equipment; (3) repairing and maintaining electronic equipment; (4) equipment maintenance; (5) repairing machines; (6) troubleshooting operating errors; (7) installing equipment, machines, and wiring (�=0.95)
10 Gross physical requirements: (1) handling and moving objects; (2) general physical activities; (3) static strength; (4) dynamic strength; (5) trunk strength; (6) stamina; and time spent (7) sitting, (8) standing, (9) walking, (10) twisting body, (11) kneeling, crouching, stooping, or crawling (�=0.98)
11 Repetitive motions (time spent making repetitive motions, 1=never, 2=less than half time, 3=about half time, 4=more than half time, 5=continually or almost continually)
UK SKILLS SURVEY1 Required education2 Job learning times 3 Number skills: importance of (1) basic arithmetic; (2) arithmetic with decimals, percentages,
fractions; (3) advanced mathematics or statistics (e.g., with calculator or computer) (�=0.84) 4 Literacy: importance of (1) reading written information; (2) reading short documents; (3) reading long
documents; (4) writing forms, notices, etc.; (5) writing short documents; (6) writing long documents (�=0.89)
5 Data: importance of (1) reading written information; (2) reading short documents; (3) reading long documents; (4) writing forms, notices, etc.; (5) writing short documents; (6) writing long documents; (7) basic arithmetic; (8) arithmetic with decimals, percentages, fractions; (9) advanced mathematics or statistics (e.g., with calculator or computer); (10) spotting problems; (11) thinking of solutions to problems; (12) analysing complex problems in depth (�=0.90)
6 People: importance of (1) dealing with people; (2) listening carefully to colleagues; (3) working with a team; (4) persuading/influencing others; (5) making speeches/presentations; (6) selling a product or service; (7) counselling, advising or caring for customers/clients; (8) teaching people (�=0.82)
7 Craft skills: importance of knowledge and operation of tools 8 Gross physical requirements: importance of (1) physical strength; (2) physical stamina
Note: Cronbach’s � in parentheses. Full text of O*NET items is available at http://www.onetcenter.org/questionnaires.html and UKSS items are given in Felstead et al. (2007). See Table A4.1 for information on the source questionnaires for individual O*NET survey items.

DELSA/ELSA/WD/SEM(2012)14
64
186. However, the procedure naturally raises questions as to whether the experience of one advanced economy can be generalized to the others. There has been only one limited, formal investigation of the validity of assigning skill scores from one country to others, though the results are generally encouraging (e.g., Taylor, Li, Shi, Borman 2008). The scale of the present effort suggested the advisability of a formal validation exercise, which involved (1) correlating country-specific skill measures from the ESS and ISSP across countries in each survey at the occupation-level, (2) correlating O*NET and occupation-level UKSS measures with parallel measures from the ESS and EU LFS, (3) correlating O*NET scores with Canadian skill scores, occupational education and occupational earnings, (4) correlating O*NET scores with occupational education and occupational earnings for other non-European countries using the ISSP, and (5) correlating parallel measures from O*NET and the UKSS with one another (see Annex 2).
187. These correlations measure what are known as criterion validity, i.e., testing the consistency between a less-established measure and a more-established measure or ultimate standard (the “criterion” variable), and convergent validity, i.e., testing the consistency of two measures believed to measure the same trait, which is one aspect of construct validity.
188. Stated briefly, the various tests demonstrated substantial consistency in occupational skill scores across countries and substantial agreement across different skill databases. The correlations, or validity coefficients, tended to average 0.80; measures with lower values were generally excluded from analyses below, the most prominent examples being level of prior experience required, training required, and job learning times. These seem to exhibit significant cross-national variation, but the validation exercise suggests that most of other measures in Table 16 can be generalized to other countries with a reasonable degree of confidence. Because there were few differences in the performance of the O*NET and UKSS measures in the validation procedures, and the latter do not cover additional skill dimensions, the analyses relied on O*NET measures in the interests of parsimony.
189. This conclusion is made while recognizing the method’s limitations. The correlations in Annex 2 are below unity and country effects remain significant in models presented in the previous section. The O*NET skill scores used in this section cannot substitute for a genuinely international database of job requirements, though it should also be noted that not all of the country effects in Section 5 are easily interpreted. International surveys, while preferable, have their own potential problems with translation, variation in the understanding of questions and response norms, and differential response rates. Nevertheless, in the absence of an international program focused on the collection of job skill measures, the present approach is the only way to study trends in job skill requirements across countries in a comparative fashion.
190. The two O*NET variables that are single item measures present few problems of interpretation. Required education is expressed in years and the question on repetitive physical motions uses a five-point frequency scale.
191. However, the O*NET scales are not so straightforward. The component items have different variances and sometimes different ranges, requiring them to be standardized before averaging. In order to give the resulting values greater meaning and comparability across time and place, it was decided to standardize the resulting scales with respect to one country-year sample, which could then serve as a common benchmark for all other country-years. Because much of the debate is rooted in the experience of the United States and because the first EU LFS data is available for 1992, the O*NET scale values were standardized using the Current Population Survey (CPS) of the United States for 1992. The mean O*NET scores by 3-digit ISCO88 occupations that resulted from this process were
DELSA/ELSA/WD/SEM(2012)14
65
then merged onto all other LFS samples (Annex 4 provides more details on the derivation of O*NET skill scores and their assignment to labour force survey data form other countries).
192. The procedure used here means that values for the O*NET scales should be interpreted as measuring differences from the CPS 1992 sample in standard deviation units. Differences will reflect only variation in the sizes of 3-digit occupations across time and space because ISCO88 occupations in all country-years were assigned the means derived from the CPS 1992. It is differences in the population weights that generate any observed variation. This procedure effectively assigns quantitative scores for multiple skill dimensions to an otherwise nominal variable, occupational title, but other sources of variation, such as temporal change within occupations or national differences in occupation scores, are not captured.
193. Table 17 presents the correlations among O*NET skill variables for the U.S. and a group of European countries in 2009 to give a sense of the structure of relationships among them. Correlations differ between the upper and lower panels as a function of the different sizes of 3-digit ISCO88 occupations in the two regions because occupations in both samples have the same O*NET scores, as noted.
194. The cognitive skills variables tend to show the highest positive correlations. Required education’s correlations with general cognitive demands and verbal skills are between 0.86 and 0.88, while the latter two variables correlate 0.92 or 0.93 with one another, the highest in the table. The correlations involving math skills are somewhat lower. Interpersonal skills correlate 0.74-0.85 with required education, general cognitive skills, and verbal skills, but only 0.52-0.55 with math skills. This pattern seems sensible. Craft skills have relatively modest correlations with all other variables except gross physical requirements (0.53). Repetitive physical motions is strongly and negatively correlated with all cognitive skills variables (-0.64 to -0.84) and positively correlated with gross physical demands (0.50 and 0.56). These relationships are also consistent with expectation. In addition to their intrinsic interest they provide another check on the validity of the O*NET database. One future extension of this exercise could be cluster analyses to identify common bundles of skills associated with different occupations.

DELSA/ELSA/WD/SEM(2012)14
66
Table 17. Correlations among O*NET skill measures in the United States and European Labour Force Survey, 2009
1 2 3 4 5 6 7
USA 1 Required educ.
2 Cognitive 0.87
3 Math 0.60 0.80
4 Verbal 0.88 0.93 0.74
5 People 0.75 0.77 0.55 0.85
6 Craft -0.26 -0.10 -0.04 -0.35 -0.47
7 Physical -0.61 -0.67 -0.67 -0.81 -0.56 0.53
8 Repetitive -0.71 -0.78 -0.65 -0.84 -0.86 0.32 0.56 Europe 1 Required educ.
2 Cognitive 0.86
3 Math 0.59 0.80
4 Verbal 0.86 0.92 0.70
5 People 0.75 0.74 0.52 0.81
6 Craft -0.22 0.00 0.12 -0.30 -0.37
7 Physical -0.62 -0.65 -0.57 -0.81 -0.54 0.53
8 Repetitive -0.68 -0.73 -0.64 -0.77 -0.82 0.20 0.50
Note: U.S. data is from the Current Population Survey and the European data is from the Labour Force Survey. See Table 6.1 for a description of the O*NET variables. European countries in the bottom panel are those with Labour Force Survey data beginning no later than 1997: Austria, Belgium, Czech Republic, Denmark, Estonia, Finland, France, Germany, Greece, Hungary, Ireland, Iceland, Italy, Luxembourg, Netherlands, Norway, Poland, Portugal, Slovenia, Spain, Switzerland, Sweden, and the UK.
195. Table 18 presents O*NET skill means for the U.S. and the same set of European countries as in Table 17, which are countries with LFS data available beginning in 1997 or earlier. The bottom panels show corresponding information for Canada and Japan. In the United States, row 1 shows the level of general cognitive, verbal, math, and interpersonal skill requirements in 1997 were already about 0.05 standard deviations above their levels in 1992 as result of occupational shifts; craft and physical demands were little changed. Between 1997 and 2009, required education rose by 0.15 years, cognitive, verbal, and interpersonal requirements rose by 0.07-0.11 standard deviations, craft skill demands fell by 0.06 standard deviations, and gross physical requirements fell the least (-0.02 standard deviations) (row 3). Repetitive physical motions fell 0.05 units on a 5-point scale (row 3). If the repetitiveness scale were interpreted (perhaps too literally) as dividing the percentage scale into quarters, this would imply that the percentage of work time spent on such activities fell from 52.3% to 51% between 1997 and 2009.16 These results show that for both the U.S. and Europe the trend toward a postindustrial society involves rising demand for both cognitive and interpersonal skills, as well as declining demand for both skilled and unskilled physical skills.
16 There was a substantial revision of occupation codes in the U.S. in 2002 but no visible break in the
trends in mean skills scores. The European panel time series also straddle national coding system changes and values for the intervening years are somewhat more erratic, with both jumps and plateaus, but no obvious pattern suggesting underestimation of growth rates.
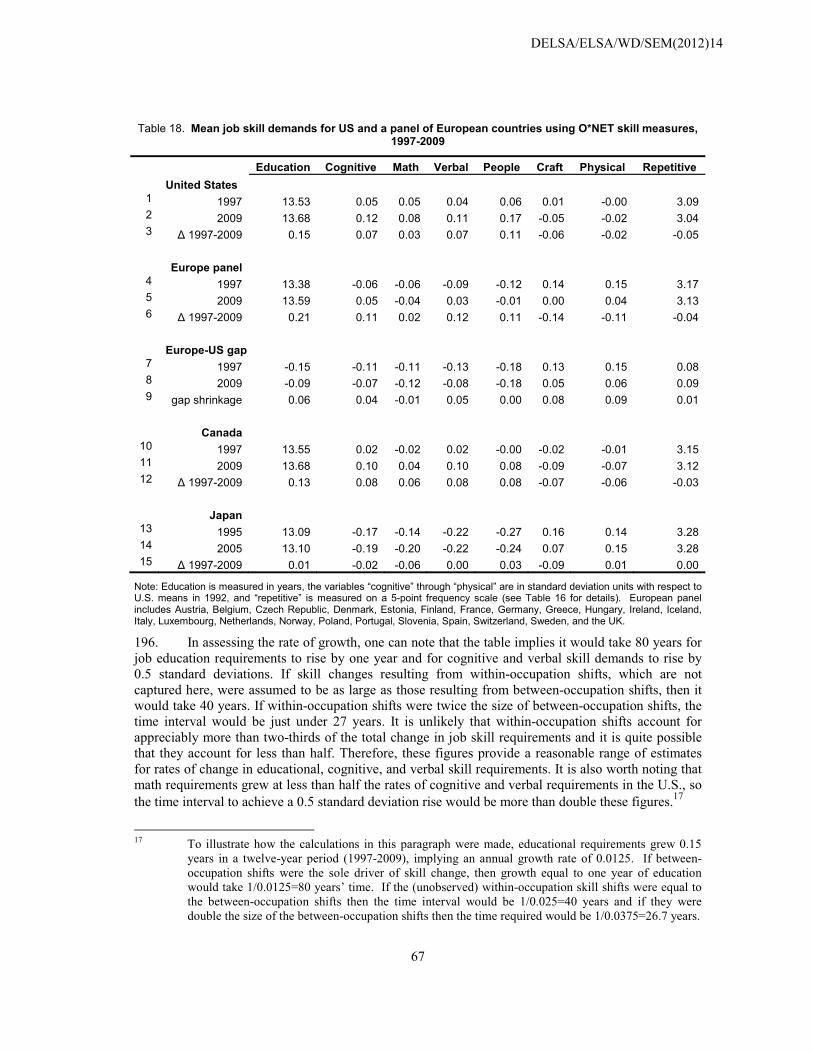
DELSA/ELSA/WD/SEM(2012)14
67
Table 18. Mean job skill demands for US and a panel of European countries using O*NET skill measures, 1997-2009
Education Cognitive Math Verbal People Craft Physical Repetitive United States
1 1997 13.53 0.05 0.05 0.04 0.06 0.01 -0.00 3.09 2 2009 13.68 0.12 0.08 0.11 0.17 -0.05 -0.02 3.04 3 � 1997-2009 0.15 0.07 0.03 0.07 0.11 -0.06 -0.02 -0.05
Europe panel
4 1997 13.38 -0.06 -0.06 -0.09 -0.12 0.14 0.15 3.17 5 2009 13.59 0.05 -0.04 0.03 -0.01 0.00 0.04 3.13 6 � 1997-2009 0.21 0.11 0.02 0.12 0.11 -0.14 -0.11 -0.04
Europe-US gap
7 1997 -0.15 -0.11 -0.11 -0.13 -0.18 0.13 0.15 0.08 8 2009 -0.09 -0.07 -0.12 -0.08 -0.18 0.05 0.06 0.09 9 gap shrinkage 0.06 0.04 -0.01 0.05 0.00 0.08 0.09 0.01
Canada
10 1997 13.55 0.02 -0.02 0.02 -0.00 -0.02 -0.01 3.15 11 2009 13.68 0.10 0.04 0.10 0.08 -0.09 -0.07 3.12 12 � 1997-2009 0.13 0.08 0.06 0.08 0.08 -0.07 -0.06 -0.03
Japan
13 1995 13.09 -0.17 -0.14 -0.22 -0.27 0.16 0.14 3.28 14 2005 13.10 -0.19 -0.20 -0.22 -0.24 0.07 0.15 3.28 15 � 1997-2009 0.01 -0.02 -0.06 0.00 0.03 -0.09 0.01 0.00
Note: Education is measured in years, the variables “cognitive” through “physical” are in standard deviation units with respect to U.S. means in 1992, and “repetitive” is measured on a 5-point frequency scale (see Table 16 for details). European panel includes Austria, Belgium, Czech Republic, Denmark, Estonia, Finland, France, Germany, Greece, Hungary, Ireland, Iceland, Italy, Luxembourg, Netherlands, Norway, Poland, Portugal, Slovenia, Spain, Switzerland, Sweden, and the UK.
196. In assessing the rate of growth, one can note that the table implies it would take 80 years for job education requirements to rise by one year and for cognitive and verbal skill demands to rise by 0.5 standard deviations. If skill changes resulting from within-occupation shifts, which are not captured here, were assumed to be as large as those resulting from between-occupation shifts, then it would take 40 years. If within-occupation shifts were twice the size of between-occupation shifts, the time interval would be just under 27 years. It is unlikely that within-occupation shifts account for appreciably more than two-thirds of the total change in job skill requirements and it is quite possible that they account for less than half. Therefore, these figures provide a reasonable range of estimates for rates of change in educational, cognitive, and verbal skill requirements. It is also worth noting that math requirements grew at less than half the rates of cognitive and verbal requirements in the U.S., so the time interval to achieve a 0.5 standard deviation rise would be more than double these figures.17
17 To illustrate how the calculations in this paragraph were made, educational requirements grew 0.15
years in a twelve-year period (1997-2009), implying an annual growth rate of 0.0125. If between-occupation shifts were the sole driver of skill change, then growth equal to one year of education would take 1/0.0125=80 years’ time. If the (unobserved) within-occupation skill shifts were equal to the between-occupation shifts then the time interval would be 1/0.025=40 years and if they were double the size of the between-occupation shifts then the time required would be 1/0.0375=26.7 years.
DELSA/ELSA/WD/SEM(2012)14
68
197. The panel of European countries in 1997 had lower cognitive, math, verbal and interpersonal skills than the U.S. in 1992, and higher usage of craft and gross physical skills (row 4). However, Europe changed more rapidly (row 6 vs. row 3), which narrowed most of the gaps by 2009 (row 9), especially for craft and physical demands, perhaps reflecting the decline of manufacturing. Again, it should be noted that these calculations reflect cross-national differences in just the distributions of workers across occupations and assumes occupations within each country have skill levels fixed at levels measured by O*NET in one time period. If country-specific occupational skill requirements are either higher or lower or occupational skill requirements change over time, the figures in the lower panel of Table 18 would need to be adjusted accordingly.
198. Canada’s skill levels and rates of change are generally comparable to the U.S., with some minor variations. The biggest surprises are both the levels and rates of change for Japan. Job requirements for education, general cognitive skills, math and verbal skills in 2005 appear well below levels in the U.S., EU panel, and Canada (row 14), and the trends for 1995-2005 were flat or even slightly negative (row 15). Similar patterns are evident for most of the other skills to a somewhat lesser extent. Given the Japan’s well-known reputation for job enrichment among production jobs comparisons of skill levels to those of other countries requires caution. However, the same considerations do not apply as strongly to within-country trends. It is likely that O*NET skill scores do a reasonable job of ranking occupations even for Japan. The flat trends suggest even more gradual skill upgrading in Japan than elsewhere.
199. The geographic focus for the EU can be widened from the panel in Table 18 for the 2009 cross-section. Table 19 presents mean skill scores for all 27+2 EU member countries and four candidate countries by region and ranked from high to low within region and O*NET measure. EU averages and the U.S. figures are presented for comparison. The same data are shown in Figure 3, with horizontal lines indicating the simple average across countries and light bars indicating simple averages for the EU27+2 and all European countries.
200. Reading across Table 19 within regions shows general but not complete consistency in rank orderings. The UK scores higher than Ireland on three of the four cognitive skills measures, higher on interpersonal skills, and lower on all three measures of physical demands, suggesting the UK has more of the qualities associated with a postindustrial economy. To continue the example, Luxembourg clearly ranks highest among the Continental countries, but it should be noted that these figures cover only those who live in the country, not the considerable number of commuters from neighbouring countries. Belgium, the Netherlands, and Switzerland collectively occupy the next three spots, though their ordering across the different skill measures is quite variable. Germany, France, and Austria occupy the remaining ranks within this group, with Austria occupying the bottom position for five of the eight measures. One of the more unexpected findings is Greece’s rather consistent ranking over Italy among the Southern European countries. Among the countries covered in prior sections, Portugal again appears to lag significantly in its levels of job skill requirements.
201. The display of these data in Figures 3a, b, d, and f are notable especially for indicating how a small number of countries at the top and bottom diverge rather sharply from the mass of countries clustered more closely around the average. The dispersion of math skill requirements is notably more compressed than most of the others (Figure 3), as is generally the case for gross physical requirements and repetitive physical motions outside most of the central/east European and candidate countries.
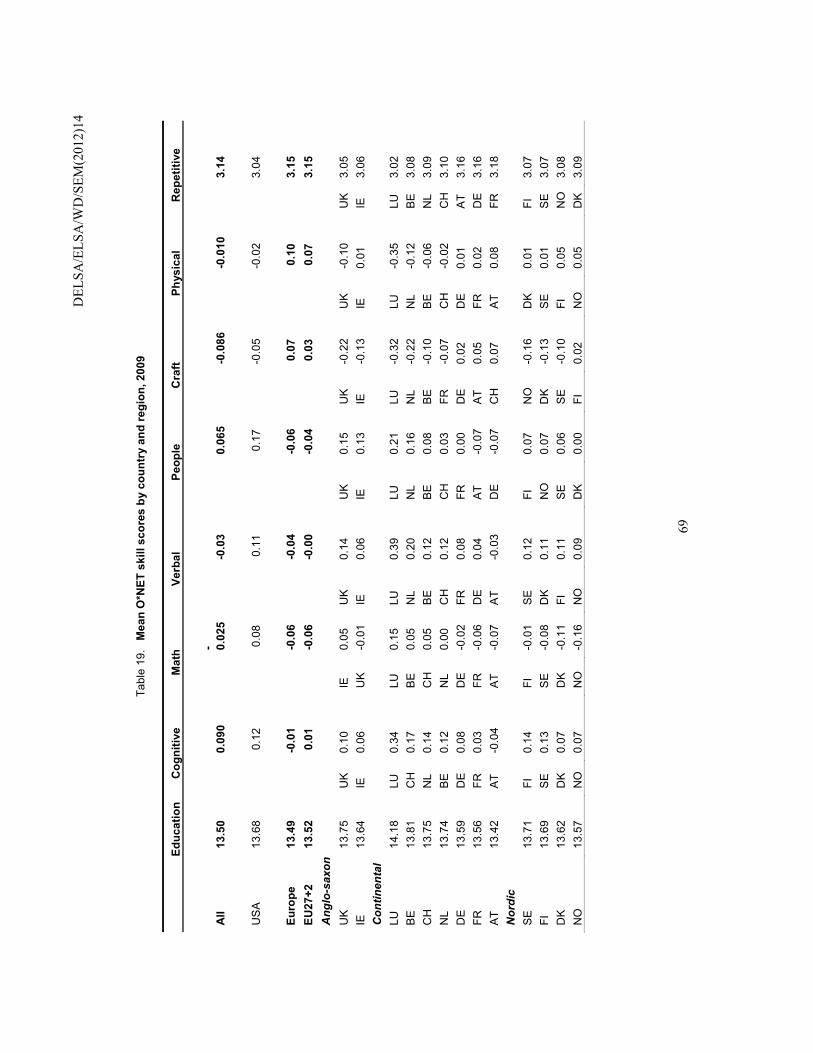
D
ELSA
/ELS
A/W
D/S
EM(2
012)
14
69
Tabl
e 19
. M
ean
O*N
ET s
kill
scor
es b
y co
untr
y an
d re
gion
, 200
9
Educ
atio
n
Cog
nitiv
e
Mat
h
Ve
rbal
Pe
ople
Cra
ft
Phy
sica
l R
epet
itive
All
13.5
0 0.
090
- 0.02
5 -0
.03
0.06
5 -0
.086
-0
.010
3.
14
US
A
13.6
8
0.1
2
0.0
8
0.1
1
0.1
7
-0.0
5
-0.0
2
3.04
Euro
pe
13.4
9 -0
.01
-0.0
6 -0
.04
-0.0
6 0
.07
0.1
0 3.
15
EU27
+2
13.5
2 0
.01
-0.0
6 -0
.00
-0.0
4 0
.03
0.0
7 3.
15
Ang
lo-s
axon
U
K
13.7
5 U
K
0.10
IE
0.
05
UK
0.
14
UK
0.
15
UK
-0
.22
UK
-0
.10
UK
3.
05
IE
13.6
4 IE
0.
06
UK
-0
.01
IE
0.06
IE
0.
13
IE
-0.1
3 IE
0.
01
IE
3.06
C
ontin
enta
l LU
14
.18
LU
0.34
LU
0.
15
LU
0.39
LU
0.
21
LU
-0.3
2 LU
-0
.35
LU
3.02
B
E
13.8
1 C
H
0.17
B
E
0.05
N
L 0.
20
NL
0.16
N
L -0
.22
NL
-0.1
2 B
E
3.08
C
H
13.7
5 N
L 0.
14
CH
0.
05
BE
0.
12
BE
0.
08
BE
-0
.10
BE
-0
.06
NL
3.09
N
L 13
.74
BE
0.
12
NL
0.00
C
H
0.12
C
H
0.03
FR
-0
.07
CH
-0
.02
CH
3.
10
DE
13
.59
DE
0.
08
DE
-0
.02
FR
0.08
FR
0.
00
DE
0.
02
DE
0.
01
AT
3.16
FR
13
.56
FR
0.03
FR
-0
.06
DE
0.
04
AT
-0.0
7 A
T 0.
05
FR
0.02
D
E
3.16
A
T 13
.42
AT
-0.0
4 A
T -0
.07
AT
-0.0
3 D
E
-0.0
7 C
H
0.07
A
T 0.
08
FR
3.18
N
ordi
c S
E
13.7
1 FI
0.
14
FI
-0.0
1 S
E
0.12
FI
0.
07
NO
-0
.16
DK
0.
01
FI
3.07
FI
13
.69
SE
0.
13
SE
-0
.08
DK
0.
11
NO
0.
07
DK
-0
.13
SE
0.
01
SE
3.
07
DK
13
.62
DK
0.
07
DK
-0
.11
FI
0.11
S
E
0.06
S
E
-0.1
0 FI
0.
05
NO
3.
08
NO
13
.57
NO
0.
07
NO
-0
.16
NO
0.
09
DK
0.
00
FI
0.02
N
O
0.05
D
K
3.09
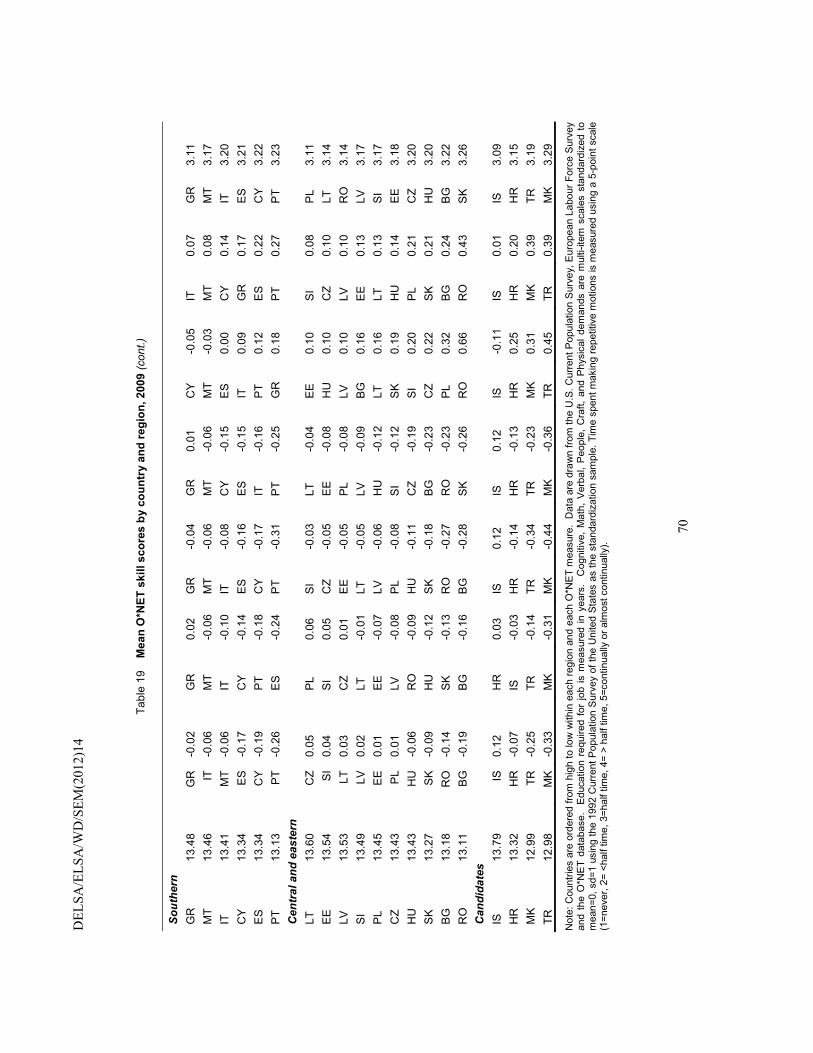
DEL
SA/E
LSA
/WD
/SEM
(201
2)14
70
Tabl
e 19
M
ean
O*N
ET s
kill
scor
es b
y co
untr
y an
d re
gion
, 200
9 (c
ont.)
Sout
hern
G
R
13.4
8 G
R
-0.0
2 G
R
0.02
G
R
-0.0
4 G
R
0.01
C
Y
-0.0
5 IT
0.
07
GR
3.
11
MT
13.4
6 IT
-0
.06
MT
-0.0
6 M
T -0
.06
MT
-0.0
6 M
T -0
.03
MT
0.08
M
T 3.
17
IT
13.4
1 M
T -0
.06
IT
-0.1
0 IT
-0
.08
CY
-0
.15
ES
0.
00
CY
0.
14
IT
3.20
C
Y
13.3
4 E
S
-0.1
7 C
Y
-0.1
4 E
S
-0.1
6 E
S
-0.1
5 IT
0.
09
GR
0.
17
ES
3.
21
ES
13
.34
CY
-0
.19
PT
-0.1
8 C
Y
-0.1
7 IT
-0
.16
PT
0.12
E
S
0.22
C
Y
3.22
P
T 13
.13
PT
-0.2
6 E
S
-0.2
4 P
T -0
.31
PT
-0.2
5 G
R
0.18
P
T 0.
27
PT
3.23
C
entr
al a
nd e
aste
rn
LT
13.6
0 C
Z 0.
05
PL
0.06
S
I -0
.03
LT
-0.0
4 E
E
0.10
S
I 0.
08
PL
3.11
E
E
13.5
4 S
I 0.
04
SI
0.05
C
Z -0
.05
EE
-0
.08
HU
0.
10
CZ
0.10
LT
3.
14
LV
13.5
3 LT
0.
03
CZ
0.01
E
E
-0.0
5 P
L -0
.08
LV
0.10
LV
0.
10
RO
3.
14
SI
13.4
9 LV
0.
02
LT
-0.0
1 LT
-0
.05
LV
-0.0
9 B
G
0.16
E
E
0.13
LV
3.
17
PL
13.4
5 E
E
0.01
E
E
-0.0
7 LV
-0
.06
HU
-0
.12
LT
0.16
LT
0.
13
SI
3.17
C
Z 13
.43
PL
0.01
LV
-0
.08
PL
-0.0
8 S
I -0
.12
SK
0.
19
HU
0.
14
EE
3.
18
HU
13
.43
HU
-0
.06
RO
-0
.09
HU
-0
.11
CZ
-0.1
9 S
I 0.
20
PL
0.21
C
Z 3.
20
SK
13
.27
SK
-0
.09
HU
-0
.12
SK
-0
.18
BG
-0
.23
CZ
0.22
S
K
0.21
H
U
3.20
B
G
13.1
8 R
O
-0.1
4 S
K
-0.1
3 R
O
-0.2
7 R
O
-0.2
3 P
L 0.
32
BG
0.
24
BG
3.
22
RO
13
.11
BG
-0
.19
BG
-0
.16
BG
-0
.28
SK
-0
.26
RO
0.
66
RO
0.
43
SK
3.
26
Can
dida
tes
IS
13.7
9 IS
0.
12
HR
0.
03
IS
0.12
IS
0.
12
IS
-0.1
1 IS
0.
01
IS
3.09
H
R
13.3
2 H
R
-0.0
7 IS
-0
.03
HR
-0
.14
HR
-0
.13
HR
0.
25
HR
0.
20
HR
3.
15
MK
12
.99
TR
-0.2
5 TR
-0
.14
TR
-0.3
4 TR
-0
.23
MK
0.
31
MK
0.
39
TR
3.19
TR
12
.98
MK
-0
.33
MK
-0
.31
MK
-0
.44
MK
-0
.36
TR
0.45
TR
0.
39
MK
3.
29
Not
e: C
ount
ries
are
orde
red
from
hig
h to
low
with
in e
ach
regi
on a
nd e
ach
O*N
ET
mea
sure
. D
ata
are
draw
n fro
m th
e U
.S. C
urre
nt P
opul
atio
n S
urve
y, E
urop
ean
Labo
ur F
orce
Sur
vey
and
the
O*N
ET
data
base
. E
duca
tion
requ
ired
for
job
is m
easu
red
in y
ears
. C
ogni
tive,
Mat
h, V
erba
l, P
eopl
e, C
raft,
and
Phy
sica
l dem
ands
are
mul
ti-ite
m s
cale
s st
anda
rdiz
ed t
o m
ean=
0, s
d=1
usin
g th
e 19
92 C
urre
nt P
opul
atio
n S
urve
y of
the
Uni
ted
Sta
tes
as th
e st
anda
rdiz
atio
n sa
mpl
e. T
ime
spen
t mak
ing
repe
titiv
e m
otio
ns is
mea
sure
d us
ing
a 5-
poin
t sca
le
(1=n
ever
, 2=
<hal
f tim
e, 3
=hal
f tim
e, 4
= >
half
time,
5=c
ontin
ually
or a
lmos
t con
tinua
lly).
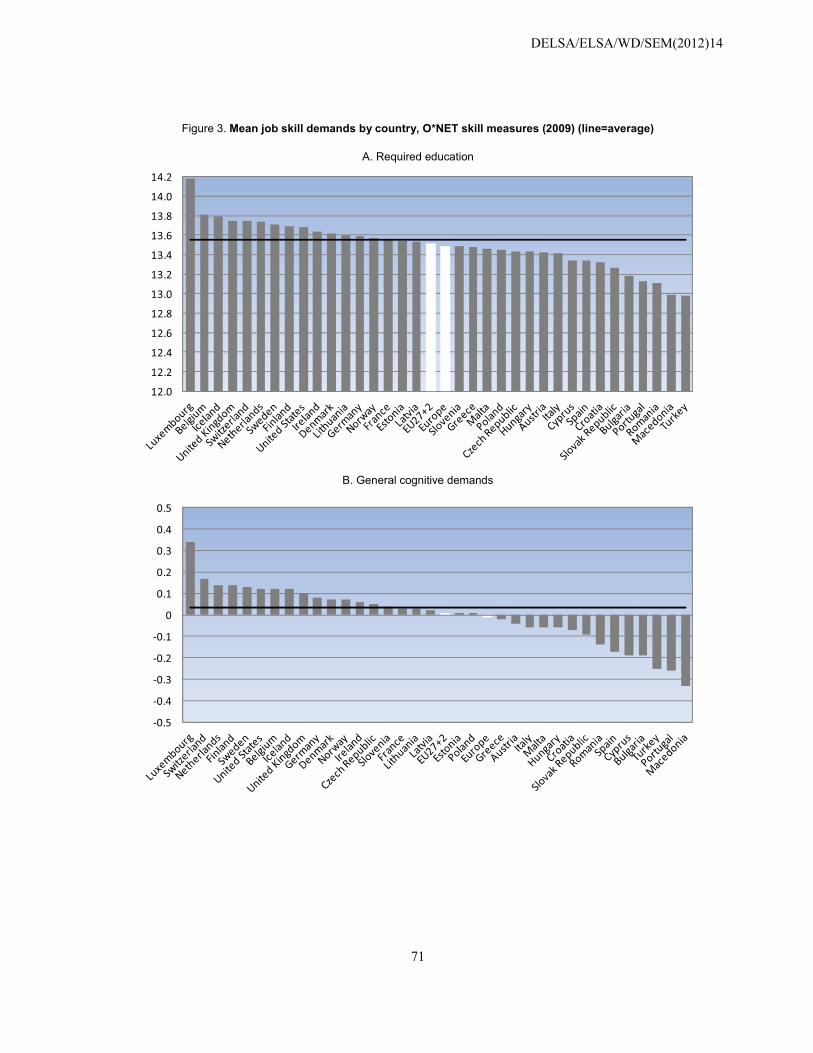
DELSA/ELSA/WD/SEM(2012)14
71
Figure 3. Mean job skill demands by country, O*NET skill measures (2009) (line=average)
A. Required education
B. General cognitive demands
12.0
12.2
12.4
12.6
12.8
13.0
13.2
13.4
13.6
13.8
14.0
14.2
-0.5
-0.4
-0.3
-0.2
-0.1
0
0.1
0.2
0.3
0.4
0.5
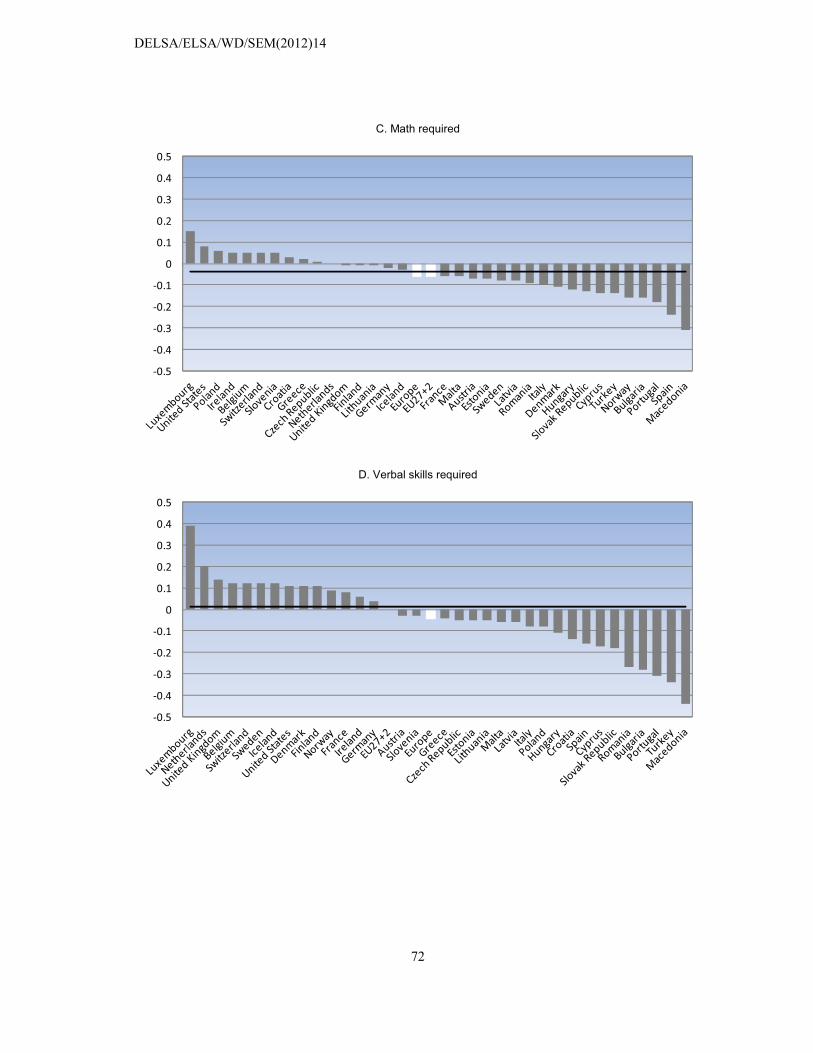
DELSA/ELSA/WD/SEM(2012)14
72
C. Math required
D. Verbal skills required
-0.5
-0.4
-0.3
-0.2
-0.1
0
0.1
0.2
0.3
0.4
0.5
-0.5
-0.4
-0.3
-0.2
-0.1
0
0.1
0.2
0.3
0.4
0.5

DELSA/ELSA/WD/SEM(2012)14
73
E. People skills required
F. Craft skills required
-0.5
-0.4
-0.3
-0.2
-0.1
0
0.1
0.2
0.3
0.4
0.5
-0.7-0.6-0.5-0.4-0.3-0.2-0.1
00.10.20.30.40.50.60.7
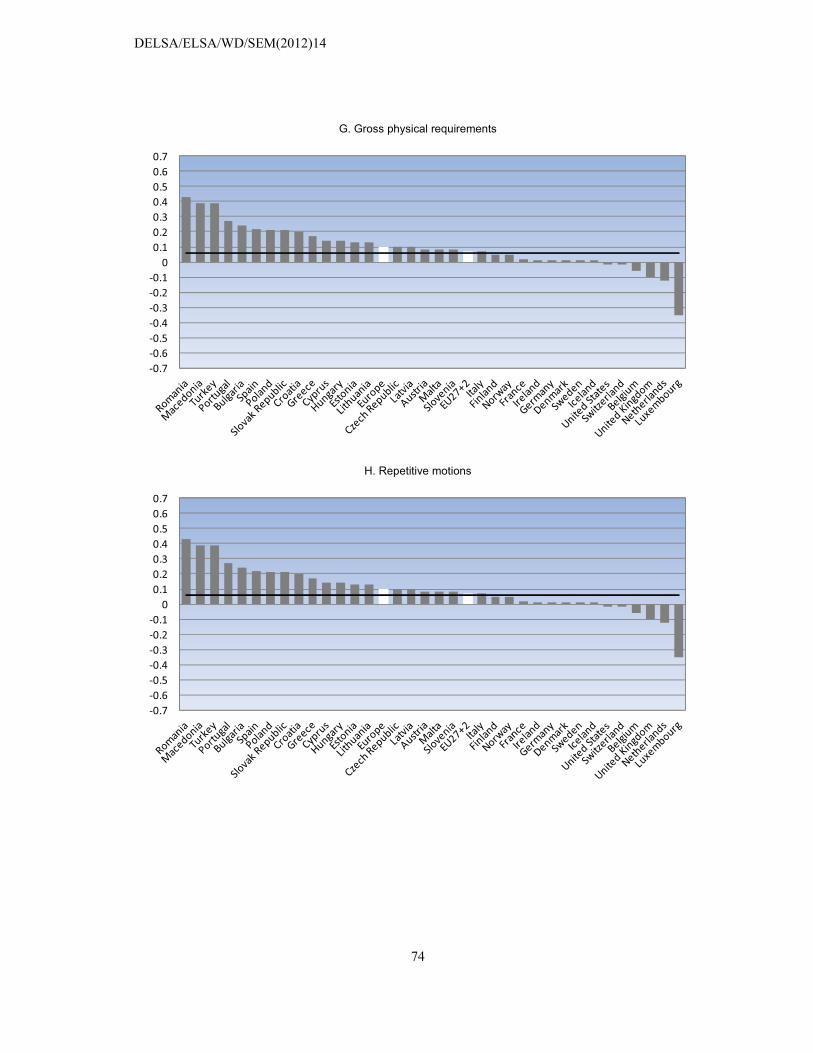
DELSA/ELSA/WD/SEM(2012)14
74
G. Gross physical requirements
H. Repetitive motions
-0.7-0.6-0.5-0.4-0.3-0.2-0.1
00.10.20.30.40.50.60.7
-0.7-0.6-0.5-0.4-0.3-0.2-0.1
00.10.20.30.40.50.60.7
DELSA/ELSA/WD/SEM(2012)14
75
202. Table 20 presents mean job skill demands by broad occupational group and year (1997, 2009) for the U.S. and the European panel. The table includes means for the seven groups in the charts in section 3, as well as detail on important sub-groups that could not be represented in that series. The general patterns by occupation are as expected.18 Full professionals’ cognitive, verbal and interpersonal skill requirements in 1997 were about 1.3 standard deviations above the U.S. average in 1992, while those skill demands for elementary workers were about 1.2 standard deviations below the average and their physical job requirements 1.2 standard deviations above average. If the repetitiveness scale were interpreted as dividing the percentage scale into quarters, European managers performed repetitive tasks 37.5% of the time in 2009, while elementary workers did so 70% of the time.
203. Table 20 also shows that the O*NET measures discriminate effectively within the production worker group; craft workers score higher than operators and elementary workers on all cognitive skills variables and on the machine control, maintenance, and repair tasks that comprise the “craft” skill variable.
204. One aspect of the table that is less expected in the near-total constancy in occupational skill means between 1997 and 2009. Although there may be skill changes within detailed occupations, it appears that there is no shift in the relative sizes of differently skilled 3-digit occupations within these broad occupation groups. The composition of the combined professional group did not shift away from associate professional/technical workers toward more full professionals and the skill mix of each of the component groups has remained stable in terms of the 3-digit occupations within them. Likewise, there is no obvious trend up or down in the skills of the production worker group and its components or in any of the other major groups. This contradicts the dominant impression from SBTC studies that one finds skill upgrading however the data are sliced. These results provide no evidence of within-occupation skill change in either the U.S. or the European countries for 1997-2009, at least when occupation is defined at the one-digit level and change is measured by shifts in 3-digit composition. This leaves open the possibility that skill upgrading occurred within 3-digit occupations, but that is not observable in the absence of an international data collection program focused on measuring job skill requirements over time.
205. The preceding also suggests that the charts in section 3, which assumed that the broad occupational groups meant the same things over time, were reasonably accurate in that regard at least in terms of their 3-digit occupation composition for the period 1997-2009. Indeed, the last two rows of both panels of Table 20 show that both seven and ten one-digit occupation dummies capture a very large share of the variance in 3-digit occupational means.
206. Some further comparisons are intriguing, if not wholly explicable. European managers and full professionals tend to score somewhat higher on cognitive skill variables than U.S. managers, while associate professional and technical workers score somewhat lower. The combined professional and associate professional/technical group has a higher score in the U.S., indicating a greater share of full professionals relative to Europe. Service jobs using higher cognitive skills are also more common in the European countries than in the U.S., but the cognitive demands of jobs in all other groups are lower in Europe than the U.S. It is not clear what explains these patterns.
18 Figures for the U.S. are adjusted for a break in series resulting from the change in occupation coding
systems in 2002. The dual-coded CPS 2002 file was used to correct for a shift in levels observed when means are calculated using the newer coding system.
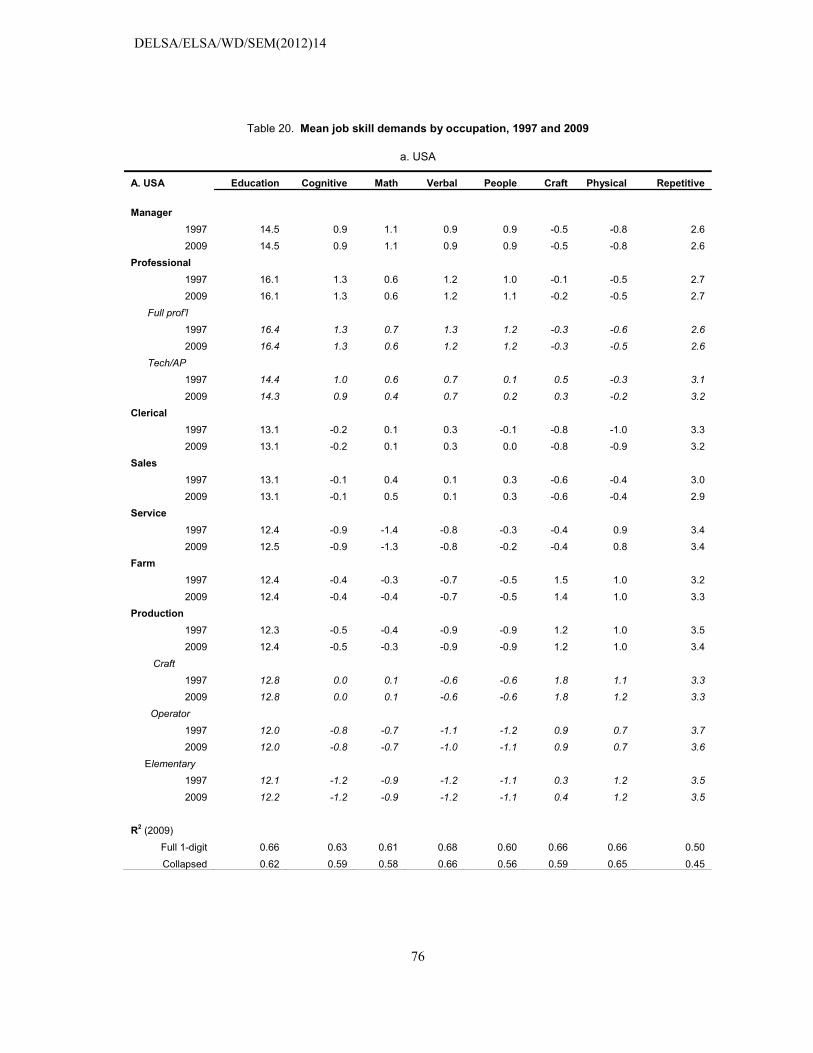
DELSA/ELSA/WD/SEM(2012)14
76
Table 20. Mean job skill demands by occupation, 1997 and 2009
a. USA
A. USA Education Cognitive Math Verbal People Craft Physical Repetitive
Manager 1997 14.5 0.9 1.1 0.9 0.9 -0.5 -0.8 2.6 2009 14.5 0.9 1.1 0.9 0.9 -0.5 -0.8 2.6
Professional 1997 16.1 1.3 0.6 1.2 1.0 -0.1 -0.5 2.7 2009 16.1 1.3 0.6 1.2 1.1 -0.2 -0.5 2.7
Full prof’l
1997 16.4 1.3 0.7 1.3 1.2 -0.3 -0.6 2.6
2009 16.4 1.3 0.6 1.2 1.2 -0.3 -0.5 2.6
Tech/AP
1997 14.4 1.0 0.6 0.7 0.1 0.5 -0.3 3.1
2009 14.3 0.9 0.4 0.7 0.2 0.3 -0.2 3.2 Clerical
1997 13.1 -0.2 0.1 0.3 -0.1 -0.8 -1.0 3.3 2009 13.1 -0.2 0.1 0.3 0.0 -0.8 -0.9 3.2
Sales 1997 13.1 -0.1 0.4 0.1 0.3 -0.6 -0.4 3.0 2009 13.1 -0.1 0.5 0.1 0.3 -0.6 -0.4 2.9
Service
1997 12.4 -0.9 -1.4 -0.8 -0.3 -0.4 0.9 3.4 2009 12.5 -0.9 -1.3 -0.8 -0.2 -0.4 0.8 3.4
Farm 1997 12.4 -0.4 -0.3 -0.7 -0.5 1.5 1.0 3.2
2009 12.4 -0.4 -0.4 -0.7 -0.5 1.4 1.0 3.3 Production
1997 12.3 -0.5 -0.4 -0.9 -0.9 1.2 1.0 3.5 2009 12.4 -0.5 -0.3 -0.9 -0.9 1.2 1.0 3.4
Craft 1997 12.8 0.0 0.1 -0.6 -0.6 1.8 1.1 3.3
2009 12.8 0.0 0.1 -0.6 -0.6 1.8 1.2 3.3
Operator
1997 12.0 -0.8 -0.7 -1.1 -1.2 0.9 0.7 3.7
2009 12.0 -0.8 -0.7 -1.0 -1.1 0.9 0.7 3.6
Elementary
1997 12.1 -1.2 -0.9 -1.2 -1.1 0.3 1.2 3.5
2009 12.2 -1.2 -0.9 -1.2 -1.1 0.4 1.2 3.5
R2 (2009)
Full 1-digit 0.66 0.63 0.61 0.68 0.60 0.66 0.66 0.50
Collapsed 0.62 0.59 0.58 0.66 0.56 0.59 0.65 0.45

DELSA/ELSA/WD/SEM(2012)14
77
Table 20 Mean job skill demands by occupation, 1997 and 2009 (Cont.)
b. European Panel
B. EUROPE Education Cognitive Math Verbal People Craft Physical Repetitive
Manager 1997 14.7 0.9 1.0 1.0 1.1 -0.6 -0.9 2.5 2009 14.8 0.9 1.0 1.0 1.1 -0.6 -0.9 2.5
Professional
1997 15.4 1.1 0.7 1.1 0.8 -0.2 -0.7 2.8 2009 15.4 1.1 0.7 1.1 0.7 -0.3 -0.8 2.8
Full prof’l 1997 16.8 1.5 1.0 1.5 1.3 -0.2 -0.8 2.5
2009 16.7 1.5 1.0 1.5 1.2 -0.2 -0.9 2.5
Tech/AP
1997 14.2 0.8 0.5 0.8 0.3 -0.3 -0.6 3.0
2009 14.2 0.8 0.4 0.8 0.4 -0.4 -0.6 3.0 Clerical
1997 12.9 -0.4 0.1 0.2 -0.3 -0.8 -0.9 3.4 2009 13.0 -0.3 0.0 0.2 -0.2 -0.8 -0.9 3.3
Sales 1997 12.5 -1.0 -0.1 -0.7 -0.2 -0.7 0.3 3.1 2009 12.5 -1.0 -0.1 -0.7 -0.2 -0.7 0.3 3.1
Service
1997 12.5 -0.6 -1.2 -0.6 0.1 -0.7 0.8 3.3 2009 12.5 -0.6 -1.2 -0.6 0.1 -0.6 0.8 3.3
Farm 1997 12.9 0.1 0.4 -0.1 0.1 1.8 0.8 2.8
2009 12.9 0.1 0.4 -0.1 0.1 1.8 0.8 2.8 Production
1997 12.2 -0.8 -0.8 -1.1 -1.1 0.9 1.1 3.6 2009 12.2 -0.7 -0.6 -1.1 -1.1 1.0 1.1 3.6
Craft 1997 12.5 -0.3 -0.0 -0.8 -0.9 1.7 1.2 3.5
2009 12.5 -0.3 -0.0 -0.8 -0.9 1.7 1.3 3.5
Operator
1997 11.9 -0.9 -0.7 -1.1 -1.2 1.0 0.7 3.6
2009 11.9 -0.9 -0.7 -1.1 -1.2 0.9 0.7 3.6
Elementary
1997 12.0 -1.5 -1.7 -1.4 -1.3 -0.0 1.1 3.7
2009 12.0 -1.6 -1.8 -1.4 -1.3 -0.1 1.1 3.8
R2 (2009)
Full 1-digit 0.77 0.82 0.65 0.84 0.73 0.67 0.74 0.62
Collapsed 0.60 0.69 0.47 0.79 0.67 0.50 0.72 0.52
Note: Tech/AP refers to technicians and associate professionals. R2 values for “Full 1-digit” are the variance explained by standard 1-digit occupational groups and R2 values for collapsed codes are the variance explained by the seven-group version used in section 3. European panel includes Austria, Belgium, Czech Republic, Denmark, Estonia, Finland, France, Germany, Greece, Hungary, Ireland, Iceland, Italy, Luxembourg, Netherlands, Norway, Poland, Portugal, Slovenia, Spain, Switzerland, Sweden, and the UK.

DELSA/ELSA/WD/SEM(2012)14
78
207. Finally, Table 21 presents more formal trend analyses for all countries. Values are coefficients and R2 values from country-specific bivariate regressions of each skill score on a linear time trend. The coefficients indicate the annual rate of change for the skill measure over the time period for which data are available for each country. The different start dates are in the second column; the end date is 2009 for all countries. The simple average and standard deviation of coefficients for EU27+2 countries is also shown. Coefficients that are insignificant are shown in bold italics. Thus, general cognitive skills in Ireland grew at an annual rate of 0.006 standard units between 1992 and 2009, which was equal to the EU27+2 average. The coefficient for Sweden is identical, but covers a shorter period (1997-2009). For a few countries, such as Turkey, the time period is too short to draw reliable conclusions so the results should be taken as very tentative and suggestive only. When the linear time trend is significant R2 values are usually quite high (e.g., >0.70), though not invariably.
208. The models in Table 21 were run also with a quadratic time specification to test for acceleration in the growth of job skill requirements. In almost no case were both linear and quadratic effects significant and similarly signed, as one would expect if certain skills were growing (e.g., cognitive) or declining (e.g., physical) at an accelerating rate (not shown).19 Although the time intervals are not nearly as long as the occupation shares displayed in section 3, the record for these direct measures of job skill requirements is strong indication that there has been no acceleration over the course of the past 15 years or so at least.
209. Also notable is that Table 21 shows that it is the math skills variable that has the most countries with an insignificant linear time trend (n=15), while craft skills has the fewest (n=4). It appears that skilled work with machinery is declining across the vast majority of countries, consistent with postindustrial expectations, while math skill requirements are changing most haltingly, which is not consistent with postindustrial expectations. The countries with the greatest number of non-significant coefficients are Estonia (n=7), Malta (n=5), Portugal (n=4), and Latvia (n=4). It would appear that the occupational structure of these countries is changing more slowly than the norm.20
19 Exceptions are interpersonal skills in Luxembourg, Denmark, and the Czech Republic, math skills,
craft and physical demands in Iceland, general cognitive and verbal skills in the Czech Republic, and craft skills in Finland. Many of Canada’s trends are best approximated by a cubic function, as there was a positive trend for the late 1980s through early 1990s and somewhat accelerated trend after 2004, while most trends showed virtually no change for the intervening ten to twelve years.
20 Macedonia and Turkey are not included in this list because LFS data are available for too short a time period to be reliable (2006-2009).

D
ELSA
/ELS
A/W
D/S
EM(2
012)
14
79
Tabl
e 21
. R
egre
ssio
n-ba
sed
estim
ates
of t
rend
s in
O*N
ET s
kill
scor
es b
y co
untr
y to
200
9
Educ
atio
n C
ogni
tive
Mat
h Ve
rbal
Pe
ople
C
raft
Phys
ical
R
epet
itive
C
ount
ry a
nd
� R
2 �
R2
� R
2 �
R2
� R
2 �
R2
� R
2 �
R2
begi
nnin
g ye
ar
US
19
92
.012
.9
5 .0
07
.90
.004
.7
5 .0
05
.91
.009
.9
6 -.0
02
.45
-.001
.1
4 -.0
04
.93
CA
19
87
.009
.7
5 .0
05
.85
.004
.9
0 .0
04
.63
.004
.5
7 -.0
02
.40
-.003
.7
0 -.0
01
.47
JP
1985
.0
05
.83
.001
.3
3 -.0
03
.57
.003
.8
0 .0
04
.97
-.010
1.
0 -.0
03
.57
-.001
.7
2
EU
27+2
M
ean
.012
.006
.001
.006
.006
-.008
-.005
-.002
sd
(.011
)
(.007
)
(.006
)
(.012
)
(.005
)
(.016
)
(.015
)
(.005
)
Ang
lo-S
axon
IE
19
92
.006
.3
7 .0
06
.75
.003
.4
1 .0
11
.80
.010
.8
0 -.0
21
.87
-.007
.6
3 -.0
04
.85
UK
19
92
.011
.8
6 .0
05
.78
.000
.0
2 .0
07
.92
.009
.9
1 -.0
10
.97
-.005
.9
4 -.0
05
.94
Con
tinen
tal
AT
1995
.0
16
.85
.014
.7
5 .0
08
.66
.016
.8
0 .0
12
.88
-.007
.5
0 -.0
14
.81
-.008
.8
3 B
E
1993
.0
13
.88
.005
.6
6 .0
01
.06
.006
.8
4 .0
05
.76
-.013
.9
6 -.0
08
.92
-.003
.7
1 C
H
1996
.0
15
.80
.006
.6
0 .0
02
.11
.003
.2
8 .0
04
.32
-.003
.3
2 -.0
01
.05
-.003
.3
6 D
E
1992
.0
13
.93
.005
.8
6 .0
00
.09
.006
.8
7 .0
08
.93
-.010
.9
7 -.0
07
.95
-.003
.8
9 FR
19
92
.011
.6
7 .0
04
.50
-.003
.1
7 .0
07
.66
.009
.6
7 -.0
05
.63
-.001
.0
5 -.0
01
.09
LU
1992
.0
43
.85
.022
.8
0 .0
09
.43
.026
.8
2 .0
19
.85
-.024
.8
7 -.0
26
.87
-.008
.6
9 N
L 19
92
.006
.6
4 .0
02
.41
-.001
.1
7 .0
05
.79
.005
.8
7 -.0
09
.93
-.006
.8
3 -.0
01
.22
Nor
dic
DK
19
92
.016
.9
3 .0
10
.93
.005
.8
3 .0
11
.93
.007
.8
6 -.0
05
.60
-.007
.8
4 -.0
04
.94
FI
1997
.0
08
.38
.004
.2
6 -.0
03
.14
.006
.6
3 .0
03
.17
-.008
.9
5 -.0
08
.94
-.003
.5
6 N
O
1996
.0
13
.87
.008
.8
2 .0
00
.01
.007
.8
3 .0
07
.82
-.007
.9
4 -.0
04
.50
-.002
.6
2 S
E
1997
.0
15
.96
.006
.7
0 .0
03
.34
.006
.8
1 .0
06
.83
-.008
.8
2 -.0
07
.85
-.003
.8
2
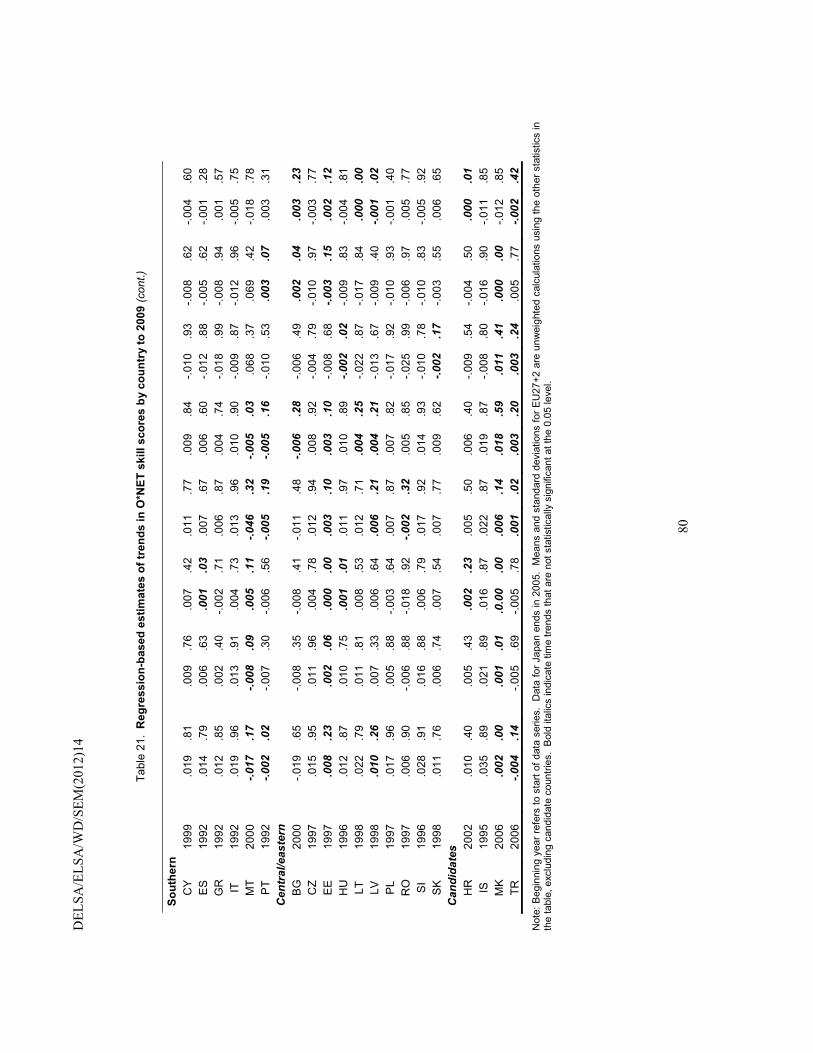
DEL
SA/E
LSA
/WD
/SEM
(201
2)14
80
Tabl
e 21
. R
egre
ssio
n-ba
sed
estim
ates
of t
rend
s in
O*N
ET s
kill
scor
es b
y co
untr
y to
200
9 (c
ont.)
Sout
hern
C
Y
1999
.0
19
.81
.009
.7
6 .0
07
.42
.011
.7
7 .0
09
.84
-.010
.9
3 -.0
08
.62
-.004
.6
0 E
S
1992
.0
14
.79
.006
.6
3 .0
01
.03
.007
.6
7 .0
06
.60
-.012
.8
8 -.0
05
.62
-.001
.2
8 G
R
1992
.0
12
.85
.002
.4
0 -.0
02
.71
.006
.8
7 .0
04
.74
-.018
.9
9 -.0
08
.94
.001
.5
7 IT
19
92
.019
.9
6 .0
13
.91
.004
.7
3 .0
13
.96
.010
.9
0 -.0
09
.87
-.012
.9
6 -.0
05
.75
MT
2000
-.0
17
.17
-.008
.0
9 .0
05
.11
-.046
.3
2 -.0
05
.03
.068
.3
7 .0
69
.42
-.018
.7
8 P
T 19
92
-.002
.0
2 -.0
07
.30
-.006
.5
6 -.0
05
.19
-.005
.1
6 -.0
10
.53
.003
.0
7 .0
03
.31
Cen
tral
/eas
tern
B
G
2000
-.0
19
.65
-.008
.3
5 -.0
08
.41
-.011
.4
8 -.0
06
.28
-.006
.4
9 .0
02
.04
.003
.2
3 C
Z 19
97
.015
.9
5 .0
11
.96
.004
.7
8 .0
12
.94
.008
.9
2 -.0
04
.79
-.010
.9
7 -.0
03
.77
EE
19
97
.008
.2
3 .0
02
.06
.000
.0
0 .0
03
.10
.003
.1
0 -.0
08
.68
-.003
.1
5 .0
02
.12
HU
19
96
.012
.8
7 .0
10
.75
.001
.0
1 .0
11
.97
.010
.8
9 -.0
02
.02
-.009
.8
3 -.0
04
.81
LT
1998
.0
22
.79
.011
.8
1 .0
08
.53
.012
.7
1 .0
04
.25
-.022
.8
7 -.0
17
.84
.000
.0
0 LV
19
98
.010
.2
6 .0
07
.33
.006
.6
4 .0
06
.21
.004
.2
1 -.0
13
.67
-.009
.4
0 -.0
01
.02
PL
1997
.0
17
.96
.005
.8
8 -.0
03
.64
.007
.8
7 .0
07
.82
-.017
.9
2 -.0
10
.93
-.001
.4
0 R
O
1997
.0
06
.90
-.006
.8
8 -.0
18
.92
-.002
.3
2 .0
05
.85
-.025
.9
9 -.0
06
.97
.005
.7
7 S
I 19
96
.028
.9
1 .0
16
.88
.006
.7
9 .0
17
.92
.014
.9
3 -.0
10
.78
-.010
.8
3 -.0
05
.92
SK
19
98
.011
.7
6 .0
06
.74
.007
.5
4 .0
07
.77
.009
.6
2 -.0
02
.17
-.003
.5
5 .0
06
.65
Can
dida
tes
HR
20
02
.010
.4
0 .0
05
.43
.002
.2
3 .0
05
.50
.006
.4
0 -.0
09
.54
-.004
.5
0 .0
00
.01
IS
1995
.0
35
.89
.021
.8
9 .0
16
.87
.022
.8
7 .0
19
.87
-.008
.8
0 -.0
16
.90
-.011
.8
5 M
K
2006
.0
02
.00
.001
.0
1 .0
.00
.00
.006
.1
4 .0
18
.59
.011
.4
1 .0
00
.00
-.012
.8
5 TR
20
06
-.004
.1
4 -.0
05
.69
-.005
.7
8 .0
01
.02
.003
.2
0 .0
03
.24
.005
.7
7 -.0
02
.42
Not
e: B
egin
ning
yea
r ref
ers
to s
tart
of d
ata
serie
s. D
ata
for J
apan
end
s in
200
5. M
eans
and
sta
ndar
d de
viat
ions
for E
U27
+2 a
re u
nwei
ghte
d ca
lcul
atio
ns u
sing
the
othe
r sta
tistic
s in
th
e ta
ble,
exc
ludi
ng c
andi
date
cou
ntrie
s. B
old
italic
s in
dica
te ti
me
trend
s th
at a
re n
ot s
tatis
tical
ly s
igni
fican
t at t
he 0
.05
leve
l.
DELSA/ELSA/WD/SEM(2012)14
81
7. Conclusions and policy implications
210. This report provides an examination of skill trends using a number of data sources covering many countries for as long time as possible. The skill measures included broad occupation groups, country-specific direct measures of skill requirements from international surveys, and direct skill measures from the O*NET database applied to both U.S. and European labour force surveys. Broad occupation is the longest time series, the international data provides a much finer set of quantitative measures, and the O*NET database has a wider range of skill dimensions that can be applied to a wider range of countries. Each kind of data has its own strengths and limitations but they tell a consistent story.
211. Economically advanced countries experienced a generally steady, continuous process of skill upgrading over the time periods for which data are available. Countries with a large share of farm workers evolved rapidly to an employment structure dominated by blue-collar jobs. Later phases of economic change saw a more gradual growth of more skilled white collar occupations to the point where they dominate the occupational structure of many countries. Blue collar occupations saw the most pronounced relative declines, while less skilled white collar occupations increased their shares of the workforce initially before stabilizing or declining slightly. Recent changes in the size of the service proletariat occupations also appear modest.
212. There is no strong evidence of a general acceleration of skill upgrading in recent decades despite beliefs regarding the consequences of the diffusion of information and communication technologies. Official forecasts in the EU, U.S., Canada, Australia, and New Zealand do not suggest acceleration in the next ten years. This does not foreclose the (likely) possibility that specific detailed occupations and sectors may have experienced or will experience more disruptive change as a result of ICT diffusion.
213. Using the more specific skill measures in the O*NET databases in conjunction with official labour force survey data, analyses suggest that changing shares of 3-digit ISCO88 occupations raised educational, various cognitive skill requirements, and interpersonal job demands, while craft skills, gross physical demands, and the frequency of repetitive physical tasks declined. European countries changed at a more rapid rate, as they closed some of the measured gap with the U.S. This more fine-grained method of measuring skills also suggests trends are gradual and seems to support the assumption of constant skill requirements within broad occupational groups implicit in the analyses of long-term occupation trends, at least for the period covered.
214. The international survey data shows job educational requirements and learning times are mostly a function of the kinds of occupations within an economy but are affected also by workers’ own human capital, gender, and institutional features of the employment relationship such as part-time and fixed-term contracts, as well as country differences net of these variables. Physical job requirements are affected similarly by these variables, but what is most notable is the modest rate of decline in the physical intensity of work in an ostensible age of automation and the lack of any observed decline in physical intensity within occupations. The various measures of cognitive, interpersonal, and physical job demands in the European Working Conditions Surveys show a surprising number of trends that were flat or in the opposite direction from expectation, even as computer use rose strongly. Given the skill consequences of the occupational shifts identified by the analyses using O*NET and LFS data it is possible that there is a problem with this data or a puzzle at the very least.
215. It is perhaps surprising that farm jobs declined much more rapidly in the transition to an industrial economy than blue collar jobs declined and skilled white collar jobs grew in the transition to a post-industrial economy. However, the measured pace of recent change is not necessarily surprising or concerning. While Moore’s Law – stating that the number of transistors that can be placed inexpensively

DELSA/ELSA/WD/SEM(2012)14
82
on an integrated circuit doubles approximately every two years – has proven a remarkably accurate guide to the evolution of computer hardware, there are not many social phenomena that exhibit similarly rapid rates of change. That job skill requirements do not change this quickly is probably fortunate. If jobs ten years from now were completely different from those of today there would be a very large secular increase in job displacement rates and long-term unemployment because the vast majority of people who will be in the labour force are already in it and retraining programs have a modest record of success. Historical and recent trends, as well as official forecasts, suggest more measured evolution in the job structure, and this is positive insofar as the labour market’s capacity to absorb change falls far short of Moore’s Law.
216. The findings of this report do point to more specific sources of concern, however. Skill transferability and the sources of skill acquisition are not well understood and the available data are rather thin. Nevertheless, one conclusion that emerges clearly is that workers in blue-collar jobs are the least likely to believe their skills are transferable and the least likely to view formal schooling as an important source of job skills, even as other sections of the report show that the numbers of blue-collar jobs and the importance of blue-collar skills were declining even before the current crisis, which raises their risk of displacement. Operators and elementary workers in particular are much less likely to have jobs requiring they keep learning new things. To have a limited set of skills that is transferable only among a shrinking pool of jobs is a form of social precarity that needs to be a specific focus of concern. Thus, one implication is that policy makers must understand how this high-risk group is faring currently and how to enhance its employability to include expanding occupations and industries. One step in addressing this issue would be to conduct transferable skills analysis, which would identify patterns of job mobility among detailed occupations and determine the sets of skills associated with occupations that share many of the same workers.
217. The results also indicate that the level of cognitive job skill demands among women is less than among men net of controls for human capital, occupation, industry, part-time and fixed-term employment, and country. This differential does not appear to be related to family responsibilities, as measured by marital status and presence of young children. This area deserves further investigation.
218. Likewise, more study is needed to understand the extent to which non-standard employment arrangements are a drag on job skill requirements despite being embraced for the increased flexibility they provide.
219. More generally, the results point to the need to maintain education, training, and social policies that will support the process of skill upgrading observed rather consistently in the data. Although governments face strong pressures to cut their budgets, cutting human capital investment might be a drag on economic growth and living standards in the long-run. The benefits of increasing skill endowments and decreasing skill inequalities within the labour force in terms of productivity, living standards, and social cohesion are well-known.
220. One question this raises is the extent to which raising the supply of skilled workers can itself stimulate demand for them. The results generally indicate countries with higher per capita income have higher cognitive and lower physical job skill demands but disentangling causality is extremely difficult. The issue can be broken down into several considerations, some of which support the idea that education can lead the process of skill upgrading and others arguing for caution. On the positive side, all else equal one would expect employers are more likely to create or locate jobs requiring high skills where the supply is plentiful. This is widely believed to be one ingredient in the rapid growth of the Irish economy in the 1990s, but so many other factors were involved that its relative weight is hard to determine. In addition, the evidence of this report indicates that even holding the job structure constant in terms of measured 4-digit occupation, more educated employees have more skilled jobs.
DELSA/ELSA/WD/SEM(2012)14
83
221. However, if macro or other conditions do not support accelerated growth of more skilled jobs, then rates of overeducation and skills mismatch will rise and occupation-specific skills will atrophy. 21 Society and the individual will lose the resources invested to a greater or lesser degree.
222. The second danger is that public schooling graduation standards are raised so high to prepare more for university that a significant number of lower-performing students who might have completed schooling under the previous system fail to complete under the regime and become even more alienated from schooling. As the results with respect to change rates demonstrated, there are still many jobs that do not require university degrees and school reforms based on the premise that an economy can be transformed rapidly into one in which everyone is a symbolic analyst are unrealistic and have potential boomerang effects.
223. These considerations lead to the recommendation that policy makers understand their country’s recent and forecast rates of growth in skill requirements and consider education reforms whose aim is to raise attainment to levels exceeding forecasted needs by a reasonable and measured amount in a fashion that maximizes educational opportunity for individuals from under-represented groups and avoids shutting out or leaving adrift those who do not seek or are not prepared for university study. This includes further examination of the potential benefits of strengthening of career, technical, and vocational education and training systems for those not attending university.
224. It is strongly suggested that one component of such a strategy be the development of modules for inclusion in social studies education that provides students with a full understanding of the full range of jobs available in the labour market, their entry requirements, working conditions, and monetary and non-monetary rewards. This material should be introduced in age-appropriate fashion in younger grades and continue throughout the years of public schooling, preferably including interactive software and multimedia elements that engage student interest and encourage exploration. This knowledge needs to be provided early enough so that students will be able to use it before facing consequential educational decisions. Sociological research on cultural capital shows clearly that one source of differential advantage for children from different socioeconomic backgrounds is the different levels of knowledge and understanding regarding schooling and work (Lareau 2003), which can lead to regrets later in life regarding the level of education attained (Halle 1987). Labour market information will not solve problems relating to low job skills but it is hard to envision the problems will be solved without it.
225. Finally, it should be clear that the quality of the data needs to be improved if firmer conclusions are to be drawn about trends in job skill requirements. Understanding skill trends more deeply requires coordinated data collection among economically advanced countries. The patchwork of data used in this report, while providing important and useful information, indicates the need for surveys that are directed specifically toward collecting information on this topic.
226. An effective data program requires large sample surveys, appropriately weighted, with standardized and commonly understood measures administered to workers across many countries at regular intervals. Such data will permit countries to monitor national progress, measure subgroup variation, identify causal processes, and benchmark performance with respect to other countries. If the data are designed to be linked to occupational forecasts, they could also provide indications of future skill needs beyond what is available from occupational titles alone.
21 There is less likelihood that general skills will atrophy. People who have qualifications in accounting will
forget the material if not employed in the field for several years but presumably would not lose general reasoning and reading skills.
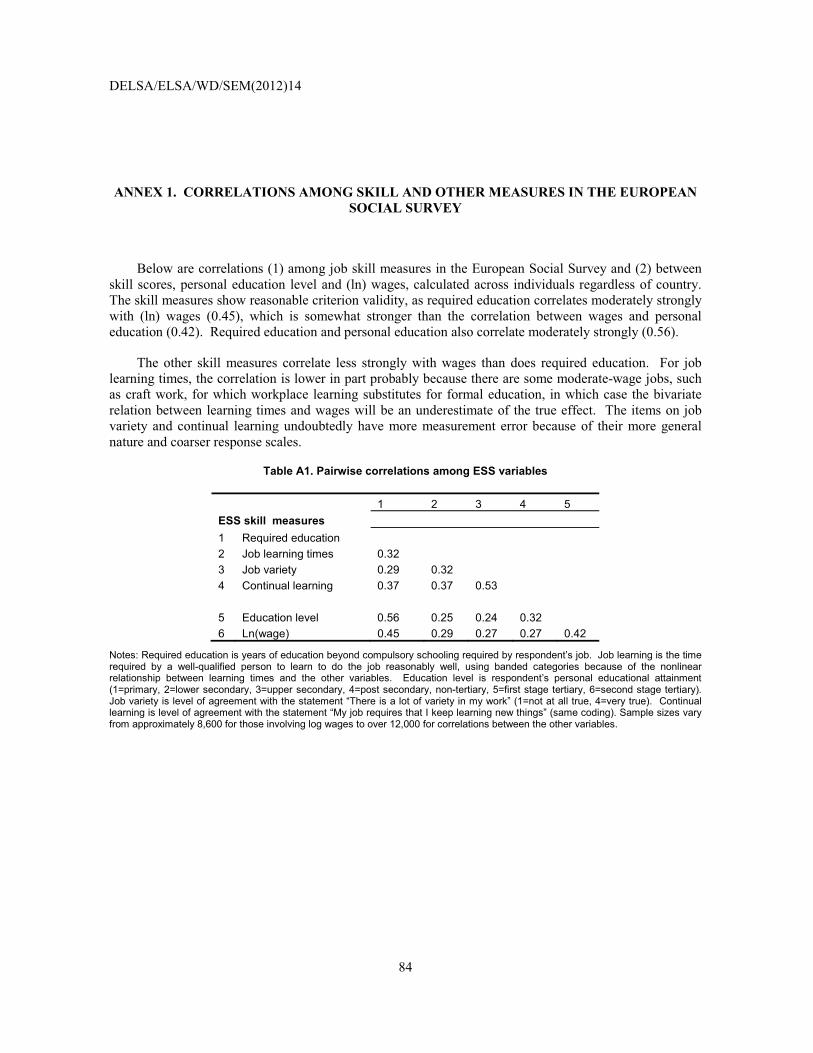
DELSA/ELSA/WD/SEM(2012)14
84
ANNEX 1. CORRELATIONS AMONG SKILL AND OTHER MEASURES IN THE EUROPEAN SOCIAL SURVEY
Below are correlations (1) among job skill measures in the European Social Survey and (2) between skill scores, personal education level and (ln) wages, calculated across individuals regardless of country. The skill measures show reasonable criterion validity, as required education correlates moderately strongly with (ln) wages (0.45), which is somewhat stronger than the correlation between wages and personal education (0.42). Required education and personal education also correlate moderately strongly (0.56).
The other skill measures correlate less strongly with wages than does required education. For job learning times, the correlation is lower in part probably because there are some moderate-wage jobs, such as craft work, for which workplace learning substitutes for formal education, in which case the bivariate relation between learning times and wages will be an underestimate of the true effect. The items on job variety and continual learning undoubtedly have more measurement error because of their more general nature and coarser response scales.
Table A1. Pairwise correlations among ESS variables
1 2 3 4 5 ESS skill measures 1 Required education 2 Job learning times 0.32 3 Job variety 0.29 0.32 4 Continual learning 0.37 0.37 0.53 5 Education level 0.56 0.25 0.24 0.32 6 Ln(wage) 0.45 0.29 0.27 0.27 0.42
Notes: Required education is years of education beyond compulsory schooling required by respondent’s job. Job learning is the time required by a well-qualified person to learn to do the job reasonably well, using banded categories because of the nonlinear relationship between learning times and the other variables. Education level is respondent’s personal educational attainment (1=primary, 2=lower secondary, 3=upper secondary, 4=post secondary, non-tertiary, 5=first stage tertiary, 6=second stage tertiary). Job variety is level of agreement with the statement “There is a lot of variety in my work” (1=not at all true, 4=very true). Continual learning is level of agreement with the statement “My job requires that I keep learning new things” (same coding). Sample sizes vary from approximately 8,600 for those involving log wages to over 12,000 for correlations between the other variables.
DELSA/ELSA/WD/SEM(2012)14
85
ANNEX 2. VALIDATING THE APPLICABILITY OF A COMMON SET OF OCCUPATIONAL SKILL SCORES
The first validation exercise uses international data containing identical measures collected in different countries. If the same occupations in different countries have similar skill scores, this supports the view that occupational titles refer to similar activities and skill demands despite differences in nationality.
Country-specific occupation means were calculated for various skill measures using the European Social Survey. If a 4-digit occupation within a country had more than five workers the average required education level, job learning time, and ratings of job variety and continuous learning were calculated. For comparative purposes, average levels of educational attainment were also calculated for those occupations in terms of both education level and years. This procedure involved using 8,153 workers to estimate means for 123 occupations across 17 countries, with a realized number of occupation-by-country cases of 688. The means for 56% of these cases are calculated based on 5-9 respondents and another 31% are based on 10-19 respondents, and the average number of cases is 12. On average, each country has means for 40 of the 123 occupations. The occupational means for each country were correlated with those for all others for each skill measure.
Table A2.1 shows the correlation of occupational required education across countries in the ESS. Thus, the required education for occupations in Austria correlates 0.75 with those it shares with Belgium in this data set, 0.87 with those in Switzerland, etc. It is clear that the values tend to be quite high across all countries with the exception of Iceland, which tend to be negative outliers, perhaps due to very small sample sizes underlying the occupation means. Indeed, seventy percent of correlations are above 0.80, despite the fact that the small samples undoubtedly add considerable noise to the means and attenuate the estimated correlations relative to their true values.
The results in this matrix and those for the other skill measures are further summarized in Table A2.2. Panel A shows that the average correlation across countries is about 0.80 for required education, as well as for personal education, with standard deviations around 0.11 for all of the education-related measures.22 The range is 0.53-0.97 after deleting values for Iceland.
In panel B individual-level regression models using the original data show that occupation alone accounts for over 40% of the variance in required education (line 5), country alone accounts for 8% (line 6) and half of that is shown to be due to variations in occupational composition across countries when a joint model is estimated (line 7).
When the same regressions are run on the data set with occupation means by country in panel C, occupation explains 71% of the variation (line 9) and country differences contribute an additional 8% when a joint model is estimated (line 11). There is also a strong correlation between individual responses and the occupation means estimated in this data (r=0.74) (Panel D). The remaining within-occupation variation reflects some unknown combination of true variance and measurement error. The results for personal 22 The standard deviation is the simple (unweighted) standard deviation of the correlations displayed in Table
A3.1.

DELSA/ELSA/WD/SEM(2012)14
86
educational attainment are quite similar. It seems occupations are quite similar across national boundaries in terms of required education, rather than nationally distinctive to any great degree.
The results are weaker for three other skill measures, particularly job variety. Cross-country correlations average around 0.65 for job learning times and continuous learning and only 0.50 for job variety; there is also greater variation in the cross-country correlations as shown by the standard deviations and ranges. However, because country dummies also generally fail to explain much variation in the regressions, it seems likely that the smaller cross-country correlations simply reflect higher levels of measurement error.23 This is reinforced by the fact that correlations between individual values and country-specific occupational means are also significantly lower than for required education (panel D). These qualities are simply harder to measure, even within countries, which will attenuate cross-country correlations even in the absence of true country effects, though national differences in workplace organization might well account for some of these results, as well.
Table A2.3 presents the results of a similar exercise for the measure physical job demands in the ISSP. The first three columns in panel A show cross-country correlations for each wave. In addition to means and standard deviations, the table also shows the average number of occupations per country represented in the column and the total number of correlations used to calculate the means and standard deviations. When all samples are pooled across years and all cross-country correlations are calculated regardless of year, there are 582 correlations whose average value is 0.80 with a standard deviation of 0.08; results within all survey waves are almost identical. Clearly, there is a lot of similarity in physical job demands by occupational title among developed economies regardless of country or time.
In addition, the ISSP data permits one to calculate within-country correlations across time (panel B) for comparison to the between-country correlations at specific points in time. Reassuringly, the within-country correlations are only modestly higher than the between-country, again suggesting that one does not do much worse using scores from other countries compared to another set of scores from the same country.24
Panel C in Table A2.3 shows that the measure of physical job demands performs well, like the measure of required education. Occupation explains over 30% of the variance in this measure taken at the individual level and 75% when occupation-by-country means are used, while country and year explain very small shares of the variance. Individual ratings and occupation-by-country means correlate 0.63 when the data are pooled across all countries and years.
Table A2.4 takes the next step of correlating the country-specific measures from the ESS and ISSP with parallel measures from O*NET and the UKSS. Country-specific measures of required education correlate about 0.80 with the corresponding measures in both O*NET and the UKSS, with relatively
23 The one exception is the significant impact of country on task variety when measured at the occupation
level (Table A2.2, lines 10 and 11). 24 The cross-country correlations differed from unity by about 0.20, while the within-country correlations are
0.10 to 0.15 below unity. If the latter were interpreted as test-retest correlations, these figures would suggest that correcting for measurement error would raise the cross-country correlations to 0.90 or 0.95. Of course, the figures in panel B are not true test-retest correlations because they may reflect true change due to the passage of time, as well as measurement error. Indeed, the average within-country correlation across the 16-year period 1989-2005 differs from unity by 0.18, which is almost exactly double the corresponding figure for each of its 8-year sub-periods (0.11 and 0.9), so perhaps all of the difference from unity represents true change. The fact that the average within-country correlations for 1997-2005 differ significantly between the long and short panels of countries in the ISSP argues for caution in all such interpretations, however.
DELSA/ELSA/WD/SEM(2012)14
87
narrow spread around these means. Indeed, the ESS estimate of required education correlates very slightly stronger with the O*NET measure (0.88) than with the one drawn from the country itself in the UKSS (0.87). There are differences between the three measures, but the generally high correlations are encouraging.
Clearly the correlations between job learning times in the ESS and related or parallel measures in O*NET and the UKSS are significantly lower. This is further argument for excluding these measures from substantive analyses.
Table A2.5 shows the correlations between O*NET and the UKSS skill scores, on the one hand, and average personal educational attainment by occupation and country, on the other, across 33 countries in the European Labour Force Survey. Variable names for parallel concepts in O*NET and the UKSS are suffixed with 1 and 2, respectively. The first line shows the correlations for the full sample, which reflects differences in country size. The second and third lines are the simple (unweighted) means and standard deviations of the country-specific correlations that are shown in the following rows. Values in the first two lines are generally quite close and the spreads of country-specific correlations around the means are generally in the range of 0.07-0.14.
Looking first at the skill variables that are closest to academic subject matter, one finds that required education, general cognitive skill requirements, and verbal skill requirements measures in O*NET correlate about 0.75-0.80 with personal educational attainment, with very low cross-country dispersion around the means (0.05-0.08), while the parallel scores from the UKSS generally perform comparably except for lower correlations in the case of verbal skills and generally more dispersion of country-specific correlations around the means. Math measures in both O*NET and UKSS perform notably worse, though O*NET again appears to be stronger in this case, as well. Other surveys in the U.S. also show a lower correlation between math and personal education than between verbal skill requirements and education (Handel 2008), so it is possible that these results reflect a genuinely modest association between workplace math requirements and personal education. This would occur if only a small share of highly-educated workers used complex math on their jobs.
The remaining correlations are presented mainly for comparative purposes because it is not clear that one would expect strong correlations between many of the remaining skill measures and personal educational attainment, i.e., it is not clear that the latter is an appropriate variable for assessing the criterion validity of the former. Nevertheless, given the general scarcity of criterion variables it is useful to examine these relationships bearing in mind the exploratory nature of this exercise.
The measures of required experience and training in O*NET have weak or very weak correlations with educational attainment, while related measures of job learning times and training in the UKSS correlate somewhat more strongly with education. Again, because experience requirements and training build on prior education in some jobs and substitute for education in other jobs it might not be surprising that bivariate correlations would be attenuated by this heterogeneity.
By contrast, interpersonal skills are correlated more strongly with educational attainment, perhaps reflecting their association with managerial and professional work. Physical demands are negatively associated with education, especially for measures that relate to unskilled physical labour, as expected.
In general, the results in Table A2.5 support the use of national skill measures for analyses of skill trends in other countries, perhaps favouring O*NET measures slightly over the UKSS. The various measure of job training and learning requirements again appear to be among the poorer performing items, though this exercise is not as well-suited to test their validity as Table A2.4.
DELSA/ELSA/WD/SEM(2012)14
88
The preceding validity coefficients apply to European countries only, so it is useful to have comparisons with other countries. The Canadian Essential Skills (ES) job ratings are derived from interviews with workers in diverse occupations (n=ca. 3,000) conducted by the ministry of Human Resources and Skills Development Canada.25 The ES variables in Table A2.6 are scales for verbal job tasks, math tasks, and general cognitive skills, and single items for complex oral communication, and complex computer tasks. 26 Approximately, 370 of the 520 detailed Canadian occupations recognized by the Canadian National Occupational Classification (NOC) scheme received ES profiles, accounting for about 80% of the Canadian workforce over the period 1987-2009 for which data are consistently coded by occupation. Occupations surveyed and rated skew toward the less skilled and coverage is spottiest for managerial occupations. This raises the issue of potential restriction of range problems in estimating correlations between ES variables and other skill measures or criterion variables, such as personal education or earnings.
To assess convergent and criterion validity O*NET scores for the much coarser 3-digit ISCO88 occupational codes were merged onto the NOC-based ES data file. All correlations presented in Tables A2.6 and A2.7 were calculated at the occupation level for NOC occupations with scores in both databases.
Table A2.6 shows the occupation-level correlations between ES and O*NET scores, with a number of key values in bold. The O*NET required education measure correlates 0.70 with the ES verbal scale, compared to 0.87 with the O*NET verbal scale, and between 0.39 and 0.54 with the ES measures of general cognitive skill requirements, math, and computer skill requirements.
The O*NET verbal scale correlates 0.69 with the parallel ES scale, the O*NET cognitive skills scale correlates 0.53 with the ES cognitive scale, the two math scales correlate 0.50, and the O*NET People scale correlates 0.62 with the oral communication item in the ES database. Interestingly, computer use in the ES database correlates more strongly with O*NET verbal, cognitive, and math scales than with their ES counterparts. In general, these results show only moderate convergent validity or levels of agreement between the two sets of skill scores.
Another way to evaluate the value of O*NET scores in the Canadian context is by comparing their correlations with occupational education and wages in Canada and the U.S. with those of parallel ES measures. Thus, Table A2.7 shows Canadian occupational wages (0.70) correlate almost as strongly with O*NET’s required education measure as with the mean educational level of Canadians themselves (0.79). Required education in O*NET also correlates more strongly with Canadian education and wages than any of the ES scales or items.
O*NET verbal (row 7) and math (row 9) scales do as good a job predicting Canadian wages as the ES verbal (row 6) and math (row 8) scales and are related more strongly to Canadians’ personal education by occupation than the ES measures.
25 I thank Christopher Bates of Human Resources and Skills Development Canada for generously providing
me with the Essential Skills database. 26 The ES items in the verbal scale are complex reading and complex writing (�=0.80). The math scale uses
ES items for (1) scheduling, budgeting and accounting, (2) measurement and calculation, (3) data analysis, (4) numerical estimation (�=0.65). The cognitive skills scale uses ES items for (1) problem solving-typical , (2) decision making-typical , (3) critical thinking-complex , (4) job task planning-typical, (5) finding information-complex (�=0.78). For more information about the Essential Skills project, see www.hrsdc.gc.ca/eng/workplaceskills/LES/definitions/research.shtml, www.hrsdc.gc.ca/eng/workplaceskills/LES/tools_resources/tools_audience/general/readers_guide_whole.shtml, and related sites. Additional explanation and analyses can be found in “Essential Skills and O*NET: Supplemental Analyses” by Michael J. Handel.
DELSA/ELSA/WD/SEM(2012)14
89
The O*NET general cognitive scale (row 11) is related much more strongly to Canadian education and wages than the ES cognitive measure (row 10), while the O*NET People scale performs worse than the ES oral communication item in predicting Canadian wages but better in predicting Canadian occupational education. In general, the criterion validity of the O*NET measures is as high as or higher than the ES skill measures.
Taken together, the results from both tables indicate O*NET scores do well in predicting the allocation of labour to Canadian occupations by skill (education) level and the rewards to those occupations, even if O*NET measures somewhat different skill concepts than the ES database.
Table A2.8 expands the focus to other non-European countries. The ISSP 2005 has ISCO88 occupation codes for seventeen countries, including Australia, New Zealand, Japan, and Korea, as well as the U.S. and a number of European countries. The eight O*NET scores are correlated with occupational education and earnings in the ISSP for occupations with at least five respondents. The countries are ranked in each column by the strength of their correlations and the unweighted means and standard deviations are presented in the bottom two lines. The final column gives the correlations between occupational education and earnings themselves for comparison. The ISSP measure of personal education is country-specific levels of attainment and the measure of earnings are midpoints of country-specific banded categories. The education correlations for the European countries cover the same ground as those in A2.5, albeit less reliably, but those for the other countries add new information, as do all the wage correlations.
The issues are whether the U.S. correlations are notably higher than the others and whether the correlations for countries unexamined so far are notably worse. On average, the U.S. correlations rank 5.4 out of 17, and the Japanese correlations, notably weaker, rank a bit over 11. This ion reinforces the need for caution in interpreting the Japanese data, discussed at several points in the body of the paper.
On average, O*NET scores are more strongly correlated with the ISSP’s education means than earnings, except for math requirements. Not surprisingly, required education and verbal job requirements correlate most strongly with personal educational attainment by occupation. General cognitive skill demands and required education correlate most strongly with earnings. Earnings correlations for Finland and Switzerland are rather consistently low compared to the others, sometimes surprisingly so. The most surprising figure is Japan’s correlation between personal education and earnings (0.24), which is well below the mean (0.58), reinforcing the impression of Japan’s unusual status.
Finally, Table A2.9 correlates parallel measures from O*NET and UKSS with one another. The first column shows unweighted correlations for 91 3-digit ISCO occupations, while the second column presents correlations weighted by occupational size using the full European Labour Force Survey (all countries, 1992-2009), representing over three billion people in the workforce.27 The latter is perhaps more appropriate as it reflects more closely the use to which the measures are to be put. Encouragingly, in almost all cases the weighted correlations are larger than the unweighted values, averaging 0.82 and 0.76, respectively. This suggests that some relatively uncommon occupations may be subject to greater inconsistency across sources. Again, the correlations for job learning times are the lowest of the group, only 0.56 in the unweighted case. By contrast, the two ratings of physical job demands correlate 0.90 when merged onto the EU LFS.
In addition to the consistency among parallel measures, which psychometricians call convergent validity, there is also evidence that correlations are weaker among constructs that are expected to be more
27 The EU LFS does not release sample sizes so it is not possible to give the number of actual respondents
that are represented by this pooled file.

DELSA/ELSA/WD/SEM(2012)14
90
distant from one another conceptually. Thus, the UKSS measure of math requirements correlates more strongly with the parallel O*NET measure (0.82) than with the measure of verbal requirements in the UKSS (0.55) (not shown) or with the measure of general cognitive skills in O*NET (0.63) (not shown). In other words, the math score seems to be targeted on math rather than just picking up general cognitive skill demands or something specific to the UK sample.
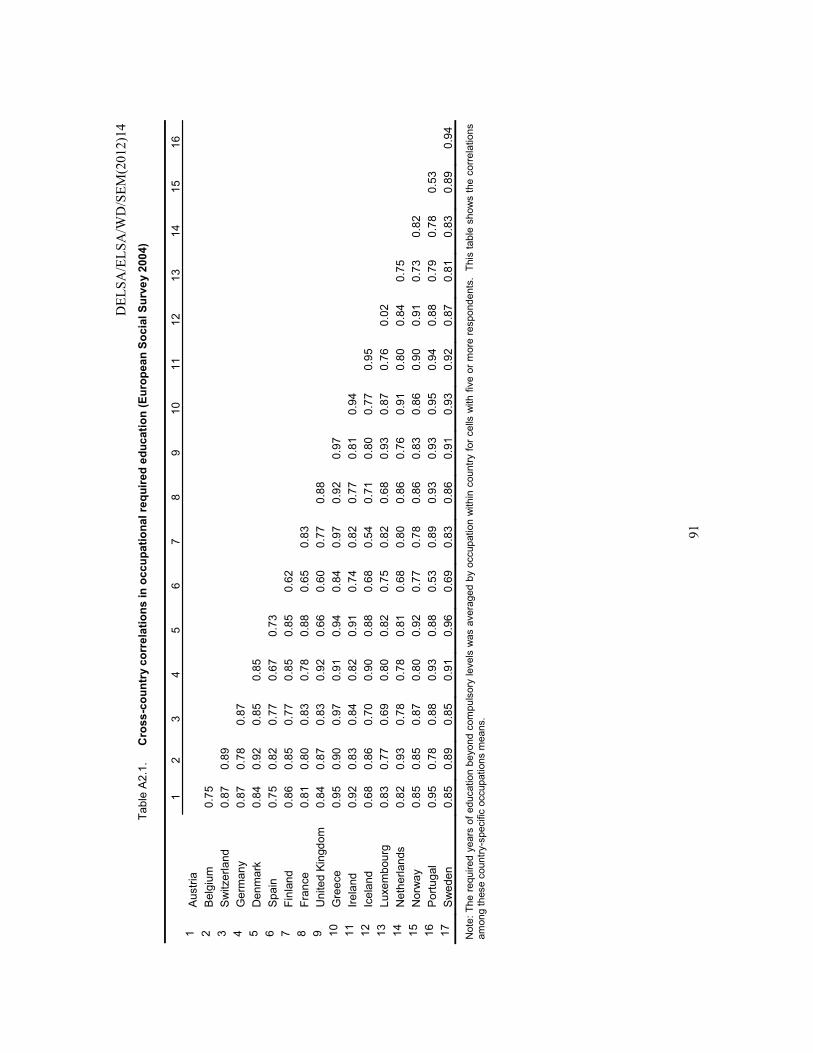
D
ELSA
/ELS
A/W
D/S
EM(2
012)
14
91
Tabl
e A
2.1.
C
ross
-cou
ntry
cor
rela
tions
in o
ccup
atio
nal r
equi
red
educ
atio
n (E
urop
ean
Soci
al S
urve
y 20
04)
1 2
3 4
5 6
7 8
9 10
11
12
13
14
15
16
1
Aus
tria
2 B
elgi
um
0.75
3
Sw
itzer
land
0.
87
0.89
4
Ger
man
y 0.
87
0.78
0.
87
5 D
enm
ark
0.84
0.
92
0.85
0.
85
6 S
pain
0.
75
0.82
0.
77
0.67
0.
73
7 Fi
nlan
d 0.
86
0.85
0.
77
0.85
0.
85
0.62
8
Fran
ce
0.81
0.
80
0.83
0.
78
0.88
0.
65
0.83
9
Uni
ted
King
dom
0.
84
0.87
0.
83
0.92
0.
66
0.60
0.
77
0.88
10
G
reec
e
0.95
0.
90
0.97
0.
91
0.94
0.
84
0.97
0.
92
0.97
11
Ire
land
0.
92
0.83
0.
84
0.82
0.
91
0.74
0.
82
0.77
0.
81
0.94
12
Ic
elan
d 0.
68
0.86
0.
70
0.90
0.
88
0.68
0.
54
0.71
0.
80
0.77
0.
95
13
Luxe
mbo
urg
0.83
0.
77
0.69
0.
80
0.82
0.
75
0.82
0.
68
0.93
0.
87
0.76
0.
02
14
Net
herla
nds
0.82
0.
93
0.78
0.
78
0.81
0.
68
0.80
0.
86
0.76
0.
91
0.80
0.
84
0.75
15
N
orw
ay
0.85
0.
85
0.87
0.
80
0.92
0.
77
0.78
0.
86
0.83
0.
86
0.90
0.
91
0.73
0.
82
16
Por
tuga
l 0.
95
0.78
0.
88
0.93
0.
88
0.53
0.
89
0.93
0.
93
0.95
0.
94
0.88
0.
79
0.78
0.
53
17
Sw
eden
0.
85
0.89
0.
85
0.91
0.
96
0.69
0.
83
0.86
0.
91
0.93
0.
92
0.87
0.
81
0.83
0.
89
0.94
Not
e: T
he re
quire
d ye
ars
of e
duca
tion
beyo
nd c
ompu
lsor
y le
vels
was
ave
rage
d by
occ
upat
ion
with
in c
ount
ry fo
r cel
ls w
ith fi
ve o
r mor
e re
spon
dent
s. T
his
tabl
e sh
ows
the
corre
latio
ns
amon
g th
ese
coun
try-s
peci
fic o
ccup
atio
ns m
eans
.
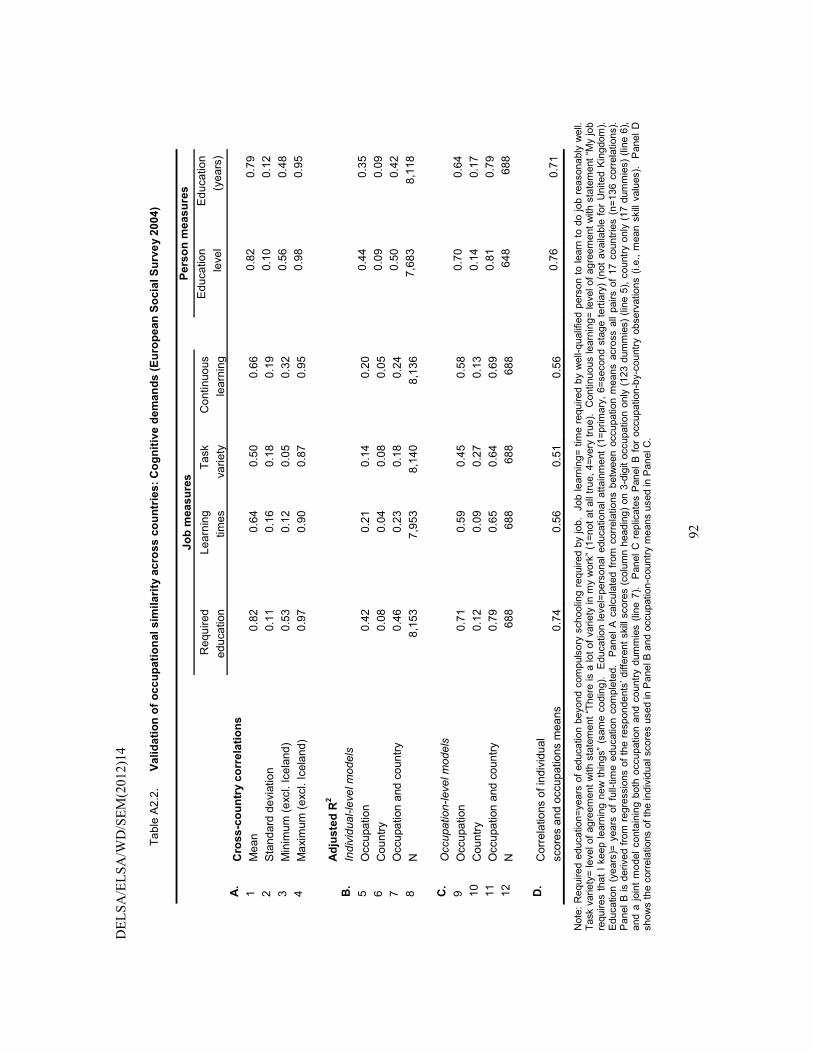
DEL
SA/E
LSA
/WD
/SEM
(201
2)14
92
Tabl
e A
2.2.
Va
lidat
ion
of o
ccup
atio
nal s
imila
rity
acro
ss c
ount
ries:
Cog
nitiv
e de
man
ds (E
urop
ean
Soci
al S
urve
y 20
04)
Jo
b m
easu
res
Pers
on m
easu
res
R
equi
red
Lear
ning
Ta
sk
Con
tinuo
us
Edu
catio
n E
duca
tion
ed
ucat
ion
times
va
riety
le
arni
ng
leve
l (y
ears
) A
. C
ross
-cou
ntry
cor
rela
tions
1 M
ean
0.
82
0.64
0.
50
0.66
0.82
0.
79
2 S
tand
ard
devi
atio
n 0.
11
0.16
0.
18
0.19
0.10
0.
12
3 M
inim
um (e
xcl.
Icel
and)
0.
53
0.12
0.
05
0.32
0.56
0.
48
4 M
axim
um (e
xcl.
Icel
and)
0.
97
0.90
0.
87
0.95
0.98
0.
95
A
djus
ted
R2
B
. In
divi
dual
-leve
l mod
els
5
Occ
upat
ion
0.
42
0.21
0.
14
0.20
0.44
0.
35
6 C
ount
ry
0.08
0.
04
0.08
0.
05
0.
09
0.09
7
Occ
upat
ion
and
coun
try
0.46
0.
23
0.18
0.
24
0.
50
0.42
8
N
8,15
3 7,
953
8,14
0 8,
136
7,
683
8,11
8
C
. O
ccup
atio
n-le
vel m
odel
s
9 O
ccup
atio
n
0.71
0.
59
0.45
0.
58
0.
70
0.64
10
C
ount
ry
0.12
0.
09
0.27
0.
13
0.
14
0.17
11
O
ccup
atio
n an
d co
untry
0.
79
0.65
0.
64
0.69
0.81
0.
79
12
N
688
688
688
688
64
8 68
8
D
. C
orre
latio
ns o
f ind
ivid
ual
scor
es a
nd o
ccup
atio
ns m
eans
0.
74
0.56
0.
51
0.56
0.76
0.
71
Not
e: R
equi
red
educ
atio
n=ye
ars
of e
duca
tion
beyo
nd c
ompu
lsor
y sc
hool
ing
requ
ired
by jo
b. J
ob le
arni
ng=
time
requ
ired
by w
ell-q
ualif
ied
pers
on to
lear
n to
do
job
reas
onab
ly w
ell.
Task
var
iety
= le
vel o
f agr
eem
ent w
ith s
tate
men
t “Th
ere
is a
lot o
f var
iety
in m
y w
ork”
(1=n
ot a
t all
true,
4=v
ery
true)
. C
ontin
uous
lear
ning
= le
vel o
f agr
eem
ent w
ith s
tate
men
t “M
y jo
b re
quire
s th
at I
keep
lear
ning
new
thin
gs”
(sam
e co
ding
). E
duca
tion
leve
l=pe
rson
al e
duca
tiona
l atta
inm
ent (
1=pr
imar
y, 6
=sec
ond
stag
e te
rtiar
y) (
not a
vaila
ble
for
Uni
ted
Kin
gdom
). E
duca
tion
(yea
rs)=
yea
rs o
f fu
ll-tim
e ed
ucat
ion
com
plet
ed.
Pan
el A
cal
cula
ted
from
cor
rela
tions
bet
wee
n oc
cupa
tion
mea
ns a
cros
s al
l pai
rs o
f 17
cou
ntrie
s (n
=136
cor
rela
tions
). P
anel
B is
der
ived
from
regr
essi
ons
of th
e re
spon
dent
s’ d
iffer
ent s
kill
scor
es (c
olum
n he
adin
g) o
n 3-
digi
t occ
upat
ion
only
(123
dum
mie
s) (l
ine
5), c
ount
ry o
nly
(17
dum
mie
s) (l
ine
6),
and
a jo
int m
odel
con
tain
ing
both
occ
upat
ion
and
coun
try d
umm
ies
(line
7).
Pan
el C
rep
licat
es P
anel
B fo
r oc
cupa
tion-
by-c
ount
ry o
bser
vatio
ns (
i.e.,
mea
n sk
ill va
lues
). P
anel
D
show
s th
e co
rrela
tions
of t
he in
divi
dual
sco
res
used
in P
anel
B a
nd o
ccup
atio
n-co
untry
mea
ns u
sed
in P
anel
C.
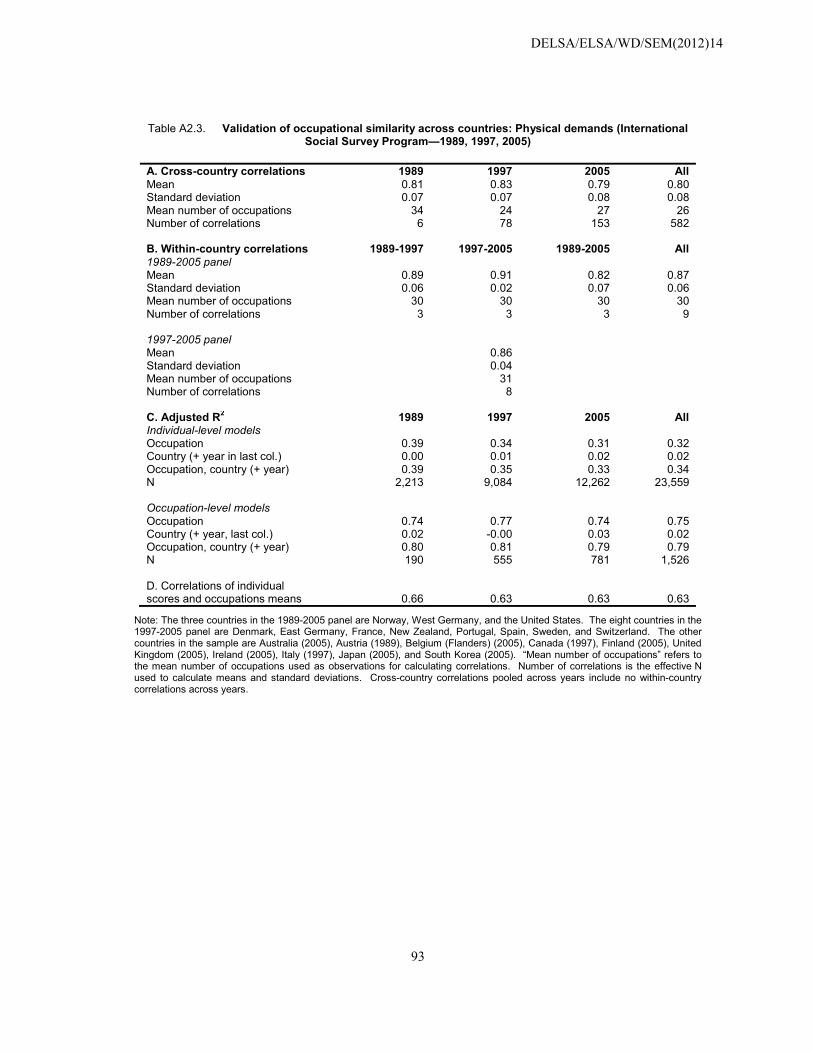
DELSA/ELSA/WD/SEM(2012)14
93
Table A2.3. Validation of occupational similarity across countries: Physical demands (International Social Survey Program—1989, 1997, 2005)
A. Cross-country correlations 1989 1997 2005 AllMean 0.81 0.83 0.79 0.80 Standard deviation 0.07 0.07 0.08 0.08 Mean number of occupations 34 24 27 26 Number of correlations 6 78 153 582 B. Within-country correlations 1989-1997 1997-2005 1989-2005 All1989-2005 panel Mean 0.89 0.91 0.82 0.87 Standard deviation 0.06 0.02 0.07 0.06 Mean number of occupations 30 30 30 30 Number of correlations 3 3 3 9 1997-2005 panel Mean 0.86 Standard deviation 0.04 Mean number of occupations 31 Number of correlations 8 C. Adjusted R2 1989 1997 2005 AllIndividual-level models Occupation 0.39 0.34 0.31 0.32 Country (+ year in last col.) 0.00 0.01 0.02 0.02 Occupation, country (+ year) 0.39 0.35 0.33 0.34 N 2,213 9,084 12,262 23,559 Occupation-level models Occupation 0.74 0.77 0.74 0.75 Country (+ year, last col.) 0.02 -0.00 0.03 0.02 Occupation, country (+ year) 0.80 0.81 0.79 0.79 N 190 555 781 1,526 D. Correlations of individual scores and occupations means 0.66 0.63 0.63 0.63
Note: The three countries in the 1989-2005 panel are Norway, West Germany, and the United States. The eight countries in the 1997-2005 panel are Denmark, East Germany, France, New Zealand, Portugal, Spain, Sweden, and Switzerland. The other countries in the sample are Australia (2005), Austria (1989), Belgium (Flanders) (2005), Canada (1997), Finland (2005), United Kingdom (2005), Ireland (2005), Italy (1997), Japan (2005), and South Korea (2005). “Mean number of occupations” refers to the mean number of occupations used as observations for calculating correlations. Number of correlations is the effective N used to calculate means and standard deviations. Cross-country correlations pooled across years include no within-country correlations across years.

DELSA/ELSA/WD/SEM(2012)14
94
Table A2.4. Correlations between country measures in the European Social Survey and International Social Survey Program and parallel measures in O*NET and the UK Skill Survey (UKSS)
Required education Job learning times
O*NET UKSS O*NET-1 O*NET-2 O*NET-3 UKSS
Austria 0.60 0.77 0.47 0.65 0.63 0.63 Belgium 0.88 0.82 0.62 0.69 0.60 0.57 Denmark 0.85 0.81 0.29 0.13 0.00 0.42 Finland 0.88 0.77 0.58 0.63 0.62 0.57 France 0.82 0.74 0.59 0.67 0.48 0.68 Germany 0.78 0.74 0.57 0.58 0.48 0.68 United Kingdom 0.88 0.87 0.62 0.72 0.63 0.76 Greece 0.94 0.75 0.40 0.57 0.26 0.62 Ireland 0.82 0.74 0.66 0.59 0.55 0.68 Iceland 0.83 0.79 0.59 0.65 0.56 0.37 Luxembourg 0.76 0.70 0.50 0.45 0.34 0.62 Netherlands 0.79 0.71 0.56 0.77 0.66 0.51 Norway 0.78 0.78 0.70 0.79 0.65 0.71 Portugal 0.84 0.76 0.25 0.40 0.12 0.62 Spain 0.53 0.86 0.53 0.59 0.47 0.69 Sweden 0.88 0.81 0.53 0.67 0.57 0.54 Switzerland 0.86 0.78 0.64 0.56 0.39 0.54
Mean 0.81 0.78 0.54 0.59 0.47 0.60 SD 0.10 0.05 0.12 0.16 0.19 0.10
Required education
ESS= years of education beyond compulsory schooling required by respondent’s job
O*NET=required level of education
UKSS=level of qualifications, if any, needed to get job today
Job learning
ESS=time required by a well-qualified person to learn to do the job reasonably well (months)
O*NET1=how much related work experience required
O*NET2=how much on-site, organized training required
O*NET3= how much on-the-job training required
UKSS= how long did it take from first starting this type of job to learn to do it well
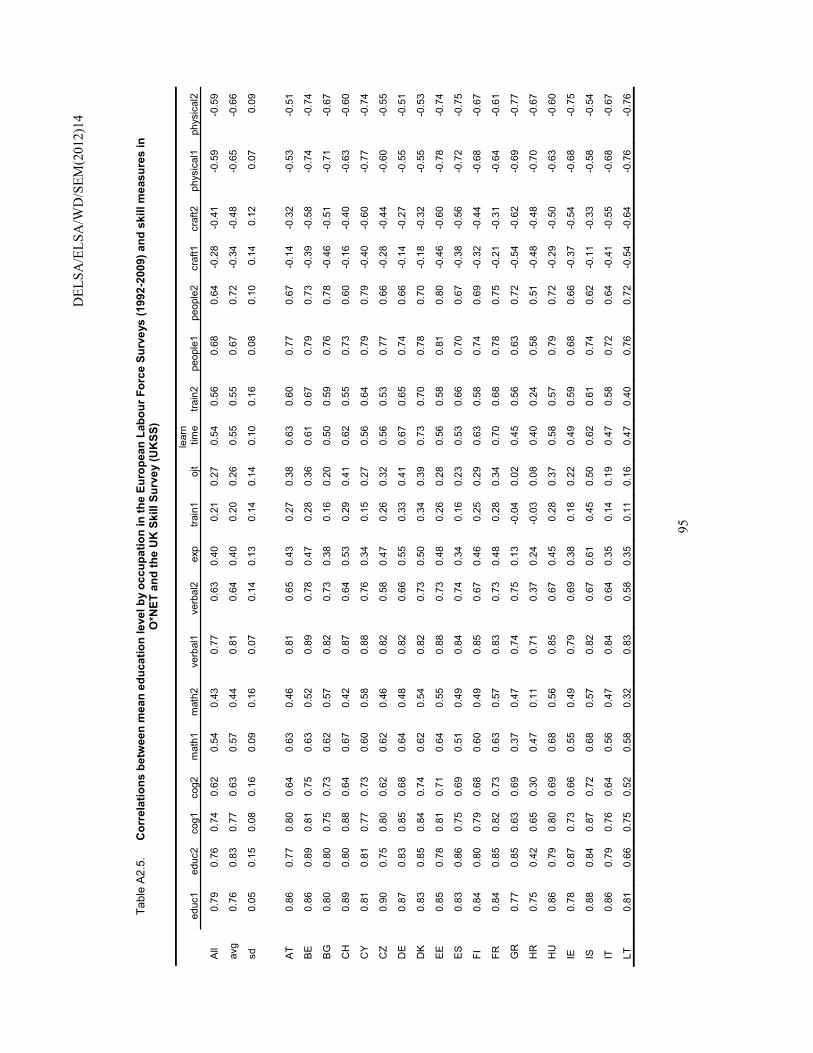
D
ELSA
/ELS
A/W
D/S
EM(2
012)
14
95
Tabl
e A
2.5.
C
orre
latio
ns b
etw
een
mea
n ed
ucat
ion
leve
l by
occu
patio
n in
the
Euro
pean
Lab
our F
orce
Sur
veys
(199
2-20
09) a
nd s
kill
mea
sure
s in
O
*NET
and
the
UK
Ski
ll Su
rvey
(UK
SS)
educ
1 ed
uc2
cog1
co
g2
mat
h1
mat
h2
verb
al1
verb
al2
exp
train
1 oj
t le
arn
time
train
2 pe
ople
1 pe
ople
2 cr
aft1
cr
aft2
ph
ysic
al1
phys
ical
2
All
0.79
0.
76
0.74
0.
62
0.54
0.
43
0.77
0.
63
0.40
0.
21
0.27
0.
54
0.56
0.
68
0.64
-0
.28
-0.4
1 -0
.59
-0.5
9
avg
0.76
0.
83
0.77
0.
63
0.57
0.
44
0.81
0.
64
0.40
0.
20
0.26
0.
55
0.55
0.
67
0.72
-0
.34
-0.4
8 -0
.65
-0.6
6
sd
0.05
0.
15
0.08
0.
16
0.09
0.
16
0.07
0.
14
0.13
0.
14
0.14
0.
10
0.16
0.
08
0.10
0.
14
0.12
0.
07
0.09
AT
0.86
0.
77
0.80
0.
64
0.63
0.
46
0.81
0.
65
0.43
0.
27
0.38
0.
63
0.60
0.
77
0.67
-0
.14
-0.3
2 -0
.53
-0.5
1
BE
0.86
0.
89
0.81
0.
75
0.63
0.
52
0.89
0.
78
0.47
0.
28
0.36
0.
61
0.67
0.
79
0.73
-0
.39
-0.5
8 -0
.74
-0.7
4
BG
0.
80
0.80
0.
75
0.73
0.
62
0.57
0.
82
0.73
0.
38
0.16
0.
20
0.50
0.
59
0.76
0.
78
-0.4
6 -0
.51
-0.7
1 -0
.67
CH
0.
89
0.80
0.
88
0.64
0.
67
0.42
0.
87
0.64
0.
53
0.29
0.
41
0.62
0.
55
0.73
0.
60
-0.1
6 -0
.40
-0.6
3 -0
.60
CY
0.
81
0.81
0.
77
0.73
0.
60
0.58
0.
88
0.76
0.
34
0.15
0.
27
0.56
0.
64
0.79
0.
79
-0.4
0 -0
.60
-0.7
7 -0
.74
CZ
0.90
0.
75
0.80
0.
62
0.62
0.
46
0.82
0.
58
0.47
0.
26
0.32
0.
56
0.53
0.
77
0.66
-0
.28
-0.4
4 -0
.60
-0.5
5
DE
0.
87
0.83
0.
85
0.68
0.
64
0.48
0.
82
0.66
0.
55
0.33
0.
41
0.67
0.
65
0.74
0.
66
-0.1
4 -0
.27
-0.5
5 -0
.51
DK
0.
83
0.85
0.
84
0.74
0.
62
0.54
0.
82
0.73
0.
50
0.34
0.
39
0.73
0.
70
0.78
0.
70
-0.1
8 -0
.32
-0.5
5 -0
.53
EE
0.85
0.
78
0.81
0.
71
0.64
0.
55
0.88
0.
73
0.48
0.
26
0.28
0.
56
0.58
0.
81
0.80
-0
.46
-0.6
0 -0
.78
-0.7
4
ES
0.83
0.
86
0.75
0.
69
0.51
0.
49
0.84
0.
74
0.34
0.
16
0.23
0.
53
0.66
0.
70
0.67
-0
.38
-0.5
6 -0
.72
-0.7
5
FI
0.84
0.
80
0.79
0.
68
0.60
0.
49
0.85
0.
67
0.46
0.
25
0.29
0.
63
0.58
0.
74
0.69
-0
.32
-0.4
4 -0
.68
-0.6
7
FR
0.84
0.
85
0.82
0.
73
0.63
0.
57
0.83
0.
73
0.48
0.
28
0.34
0.
70
0.68
0.
78
0.75
-0
.21
-0.3
1 -0
.64
-0.6
1
GR
0.
77
0.85
0.
63
0.69
0.
37
0.47
0.
74
0.75
0.
13
-0.0
4 0.
02
0.45
0.
56
0.63
0.
72
-0.5
4 -0
.62
-0.6
9 -0
.77
HR
0.
75
0.42
0.
65
0.30
0.
47
0.11
0.
71
0.37
0.
24
-0.0
3 0.
08
0.40
0.
24
0.58
0.
51
-0.4
8 -0
.48
-0.7
0 -0
.67
HU
0.
86
0.79
0.
80
0.69
0.
68
0.56
0.
85
0.67
0.
45
0.28
0.
37
0.58
0.
57
0.79
0.
72
-0.2
9 -0
.50
-0.6
3 -0
.60
IE
0.78
0.
87
0.73
0.
66
0.55
0.
49
0.79
0.
69
0.38
0.
18
0.22
0.
49
0.59
0.
68
0.66
-0
.37
-0.5
4 -0
.68
-0.7
5
IS
0.88
0.
84
0.87
0.
72
0.68
0.
57
0.82
0.
67
0.61
0.
45
0.50
0.
62
0.61
0.
74
0.62
-0
.11
-0.3
3 -0
.58
-0.5
4
IT
0.86
0.
79
0.76
0.
64
0.56
0.
47
0.84
0.
64
0.35
0.
14
0.19
0.
47
0.58
0.
72
0.64
-0
.41
-0.5
5 -0
.68
-0.6
7
LT
0.81
0.
66
0.75
0.
52
0.58
0.
32
0.83
0.
58
0.35
0.
11
0.16
0.
47
0.40
0.
76
0.72
-0
.54
-0.6
4 -0
.76
-0.7
6
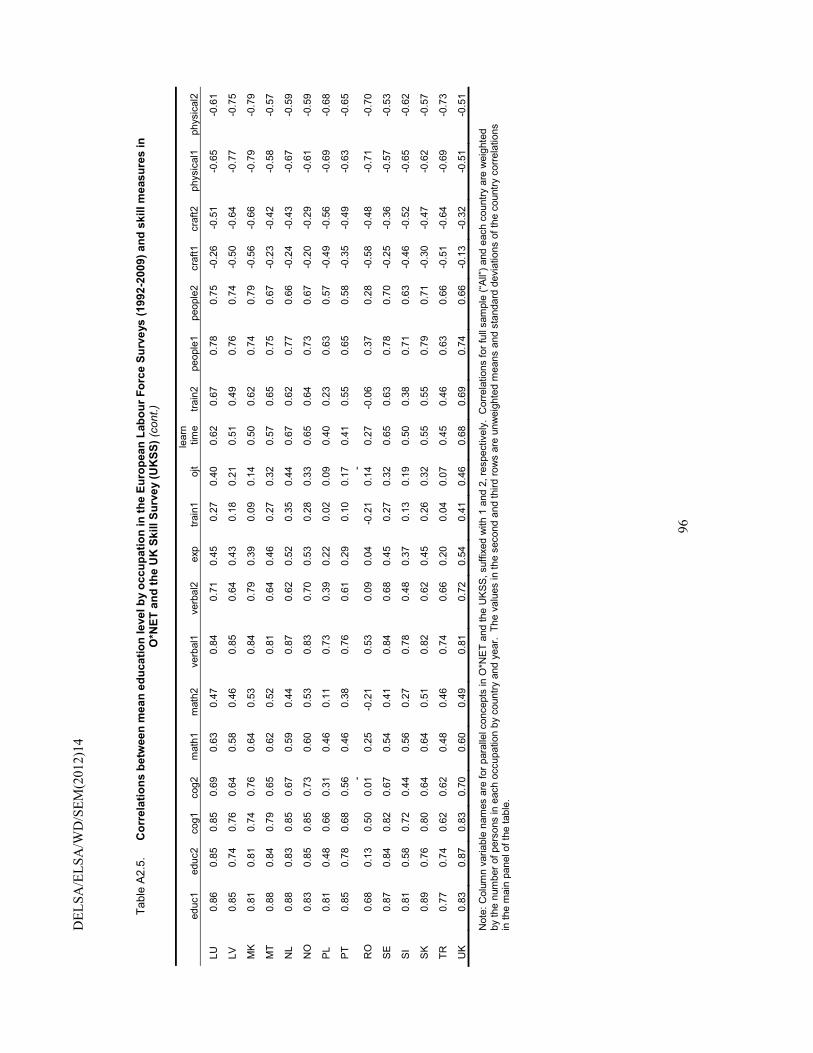
DEL
SA/E
LSA
/WD
/SEM
(201
2)14
96
Tabl
e A
2.5.
C
orre
latio
ns b
etw
een
mea
n ed
ucat
ion
leve
l by
occu
patio
n in
the
Euro
pean
Lab
our F
orce
Sur
veys
(199
2-20
09) a
nd s
kill
mea
sure
s in
O
*NET
and
the
UK
Ski
ll Su
rvey
(UK
SS) (
cont
.)
educ
1 ed
uc2
cog1
co
g2
mat
h1
mat
h2
verb
al1
verb
al2
exp
train
1 oj
t le
arn
time
train
2 pe
ople
1 pe
ople
2 cr
aft1
cr
aft2
ph
ysic
al1
phys
ical
2
LU
0.86
0.
85
0.85
0.
69
0.63
0.
47
0.84
0.
71
0.45
0.
27
0.40
0.
62
0.67
0.
78
0.75
-0
.26
-0.5
1 -0
.65
-0.6
1
LV
0.85
0.
74
0.76
0.
64
0.58
0.
46
0.85
0.
64
0.43
0.
18
0.21
0.
51
0.49
0.
76
0.74
-0
.50
-0.6
4 -0
.77
-0.7
5
MK
0.
81
0.81
0.
74
0.76
0.
64
0.53
0.
84
0.79
0.
39
0.09
0.
14
0.50
0.
62
0.74
0.
79
-0.5
6 -0
.66
-0.7
9 -0
.79
MT
0.88
0.
84
0.79
0.
65
0.62
0.
52
0.81
0.
64
0.46
0.
27
0.32
0.
57
0.65
0.
75
0.67
-0
.23
-0.4
2 -0
.58
-0.5
7
NL
0.88
0.
83
0.85
0.
67
0.59
0.
44
0.87
0.
62
0.52
0.
35
0.44
0.
67
0.62
0.
77
0.66
-0
.24
-0.4
3 -0
.67
-0.5
9
NO
0.
83
0.85
0.
85
0.73
0.
60
0.53
0.
83
0.70
0.
53
0.28
0.
33
0.65
0.
64
0.73
0.
67
-0.2
0 -0
.29
-0.6
1 -0
.59
PL
0.81
0.
48
0.66
0.
31
0.46
0.
11
0.73
0.
39
0.22
0.
02
0.09
0.
40
0.23
0.
63
0.57
-0
.49
-0.5
6 -0
.69
-0.6
8
PT
0.85
0.
78
0.68
0.
56
0.46
0.
38
0.76
0.
61
0.29
0.
10
0.17
0.
41
0.55
0.
65
0.58
-0
.35
-0.4
9 -0
.63
-0.6
5
RO
0.
68
0.13
0.
50
-0.
01
0.25
-0
.21
0.53
0.
09
0.04
-0
.21
-0.
14
0.27
-0
.06
0.37
0.
28
-0.5
8 -0
.48
-0.7
1 -0
.70
SE
0.87
0.
84
0.82
0.
67
0.54
0.
41
0.84
0.
68
0.45
0.
27
0.32
0.
65
0.63
0.
78
0.70
-0
.25
-0.3
6 -0
.57
-0.5
3
SI
0.81
0.
58
0.72
0.
44
0.56
0.
27
0.78
0.
48
0.37
0.
13
0.19
0.
50
0.38
0.
71
0.63
-0
.46
-0.5
2 -0
.65
-0.6
2
SK
0.89
0.
76
0.80
0.
64
0.64
0.
51
0.82
0.
62
0.45
0.
26
0.32
0.
55
0.55
0.
79
0.71
-0
.30
-0.4
7 -0
.62
-0.5
7
TR
0.77
0.
74
0.62
0.
62
0.48
0.
46
0.74
0.
66
0.20
0.
04
0.07
0.
45
0.46
0.
63
0.66
-0
.51
-0.6
4 -0
.69
-0.7
3
UK
0.
83
0.87
0.
83
0.70
0.
60
0.49
0.
81
0.72
0.
54
0.41
0.
46
0.68
0.
69
0.74
0.
66
-0.1
3 -0
.32
-0.5
1 -0
.51
Not
e: C
olum
n va
riabl
e na
mes
are
for p
aral
lel c
once
pts
in O
*NE
T an
d th
e U
KSS
, suf
fixed
with
1 a
nd 2
, res
pect
ivel
y. C
orre
latio
ns fo
r ful
l sam
ple
(“All”
) and
eac
h co
untry
are
wei
ghte
d by
the
num
ber o
f per
sons
in e
ach
occu
patio
n by
cou
ntry
and
yea
r. T
he v
alue
s in
the
seco
nd a
nd th
ird ro
ws
are
unw
eigh
ted
mea
ns a
nd s
tand
ard
devi
atio
ns o
f the
cou
ntry
cor
rela
tions
in
the
mai
n pa
nel o
f the
tabl
e.
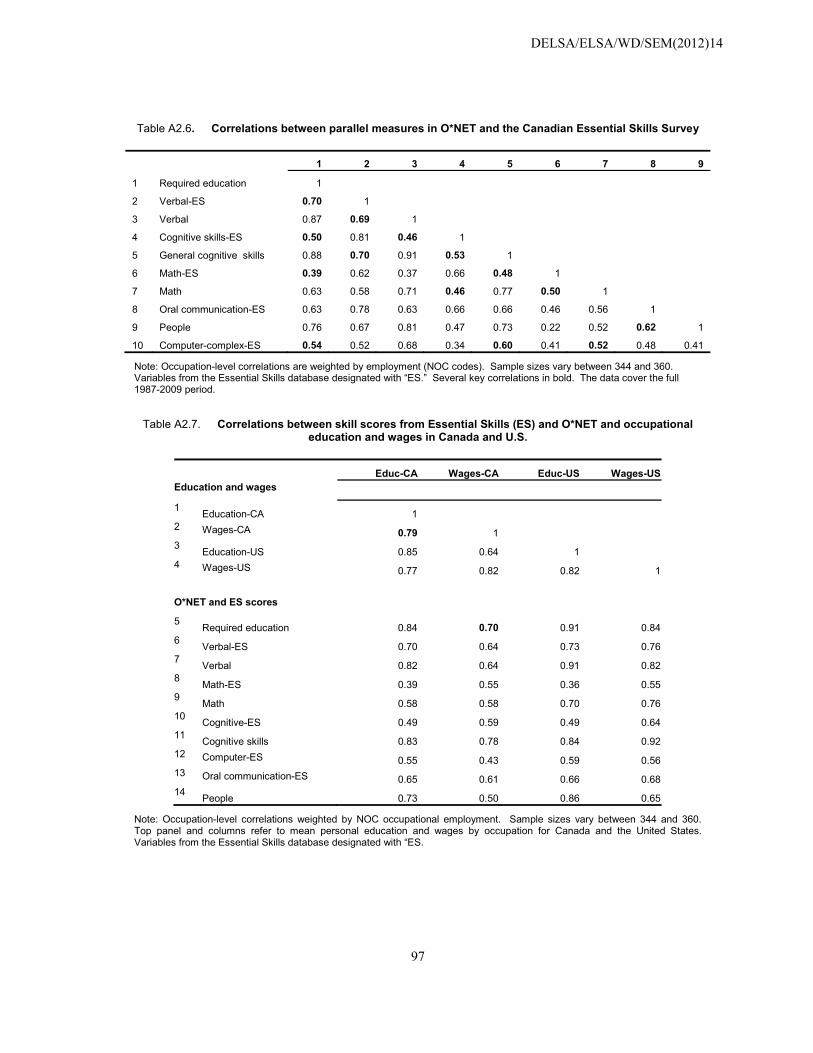
DELSA/ELSA/WD/SEM(2012)14
97
Table A2.6. Correlations between parallel measures in O*NET and the Canadian Essential Skills Survey
1 2 3 4 5 6 7 8 9
1 Required education 1
2 Verbal-ES 0.70 1
3 Verbal 0.87 0.69 1
4 Cognitive skills-ES 0.50 0.81 0.46 1
5 General cognitive skills 0.88 0.70 0.91 0.53 1
6 Math-ES 0.39 0.62 0.37 0.66 0.48 1
7 Math 0.63 0.58 0.71 0.46 0.77 0.50 1
8 Oral communication-ES 0.63 0.78 0.63 0.66 0.66 0.46 0.56 1
9 People 0.76 0.67 0.81 0.47 0.73 0.22 0.52 0.62 1
10 Computer-complex-ES 0.54 0.52 0.68 0.34 0.60 0.41 0.52 0.48 0.41
Note: Occupation-level correlations are weighted by employment (NOC codes). Sample sizes vary between 344 and 360. Variables from the Essential Skills database designated with “ES.” Several key correlations in bold. The data cover the full 1987-2009 period.
Table A2.7. Correlations between skill scores from Essential Skills (ES) and O*NET and occupational education and wages in Canada and U.S.
Educ-CA Wages-CA Educ-US Wages-US Education and wages
1 Education-CA 12 Wages-CA 0.79 13 Education-US 0.85 0.64 1 4 Wages-US 0.77 0.82 0.82 1 O*NET and ES scores
5 Required education 0.84 0.70 0.91 0.84 6 Verbal-ES 0.70 0.64 0.73 0.76 7 Verbal 0.82 0.64 0.91 0.82 8 Math-ES 0.39 0.55 0.36 0.55 9 Math 0.58 0.58 0.70 0.76 10 Cognitive-ES 0.49 0.59 0.49 0.64 11 Cognitive skills 0.83 0.78 0.84 0.92 12 Computer-ES 0.55 0.43 0.59 0.56 13 Oral communication-ES 0.65 0.61 0.66 0.68 14 People 0.73 0.50 0.86 0.65
Note: Occupation-level correlations weighted by NOC occupational employment. Sample sizes vary between 344 and 360. Top panel and columns refer to mean personal education and wages by occupation for Canada and the United States. Variables from the Essential Skills database designated with “ES.
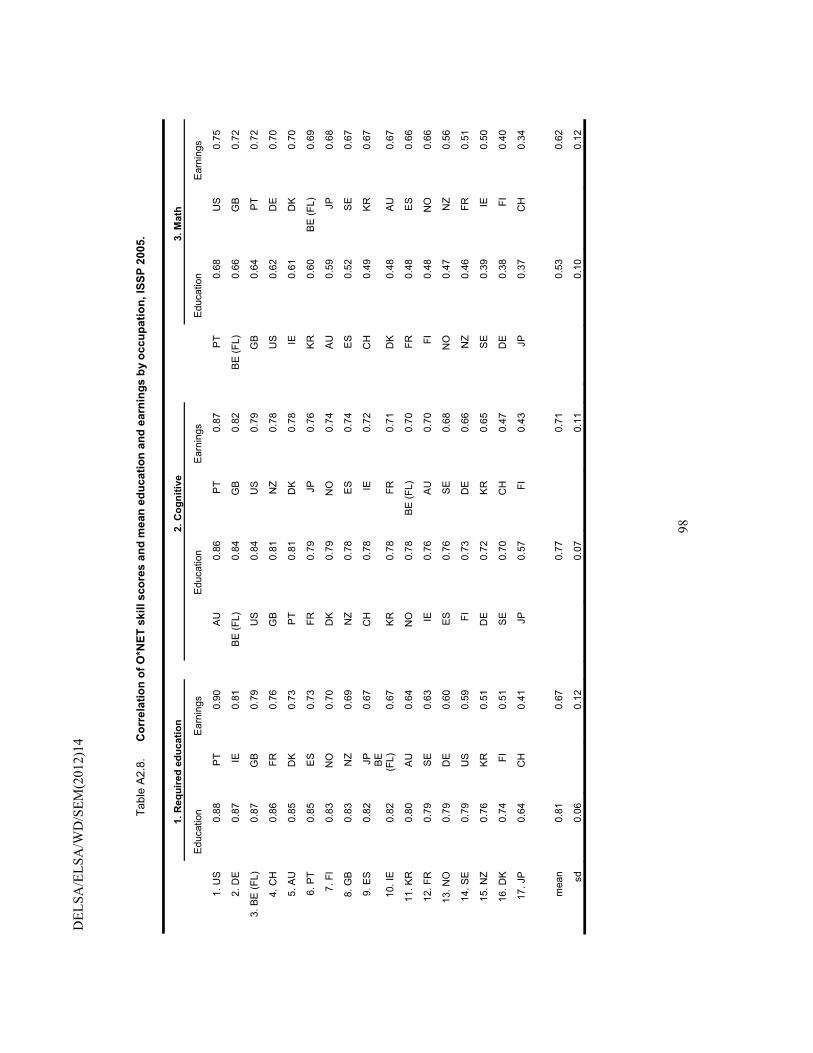
DEL
SA/E
LSA
/WD
/SEM
(201
2)14
98
Tabl
e A
2.8.
C
orre
latio
n of
O*N
ET s
kill
scor
es a
nd m
ean
educ
atio
n an
d ea
rnin
gs b
y oc
cupa
tion,
ISSP
200
5.
1.
Req
uire
d ed
ucat
ion
2. C
ogni
tive
3. M
ath
Edu
catio
n E
arni
ngs
E
duca
tion
Ear
ning
s
Edu
catio
n E
arni
ngs
1. U
S
0.88
P
T
0.90
AU
0.
86
PT
0.
87
P
T
0.68
U
S
0.75
2. D
E 0.
87
IE
0.81
BE
(FL)
0.
84
GB
0.
82
B
E (F
L)
0.66
G
B
0.72
3. B
E (F
L)
0.87
G
B
0.79
US
0.
84
US
0.
79
G
B
0.64
P
T
0.72
4. C
H
0.86
FR
0.
76
G
B
0.81
N
Z
0.78
US
0.
62
DE
0.
70
5. A
U
0.85
D
K
0.73
PT
0.
81
DK
0.
78
IE
0.
61
DK
0.
70
6. P
T
0.85
E
S
0.73
FR
0.79
JP
0.
76
K
R
0.60
B
E (F
L)
0.69
7. F
I 0.
83
NO
0.
70
D
K
0.79
N
O
0.74
AU
0.
59
JP
0.68
8. G
B
0.83
N
Z
0.69
NZ
0.
78
ES
0.
74
E
S
0.52
S
E
0.67
9. E
S
0.82
JP
0.
67
C
H
0.78
IE
0.
72
C
H
0.49
K
R
0.67
10. I
E 0.
82
BE
(FL)
0.
67
K
R
0.78
FR
0.
71
D
K
0.48
A
U
0.67
11. K
R
0.80
A
U
0.64
NO
0.
78
BE
(FL)
0.
70
FR
0.
48
ES
0.
66
12. F
R
0.79
S
E
0.63
IE
0.76
A
U
0.70
FI
0.48
N
O
0.66
13. N
O
0.79
D
E
0.60
ES
0.
76
SE
0.
68
N
O
0.47
N
Z
0.56
14. S
E
0.79
U
S
0.59
FI
0.73
D
E
0.66
NZ
0.
46
FR
0.51
15. N
Z
0.76
K
R
0.51
DE
0.
72
KR
0.
65
S
E
0.39
IE
0.
50
16. D
K
0.74
FI
0.
51
S
E
0.70
C
H
0.47
DE
0.
38
FI
0.40
17. J
P
0.64
C
H
0.41
JP
0.57
FI
0.
43
JP
0.
37
CH
0.
34
mea
n 0.
81
0.67
0.
77
0.71
0.
53
0.62
sd
0.06
0.
12
0.07
0.
11
0.10
0.
12
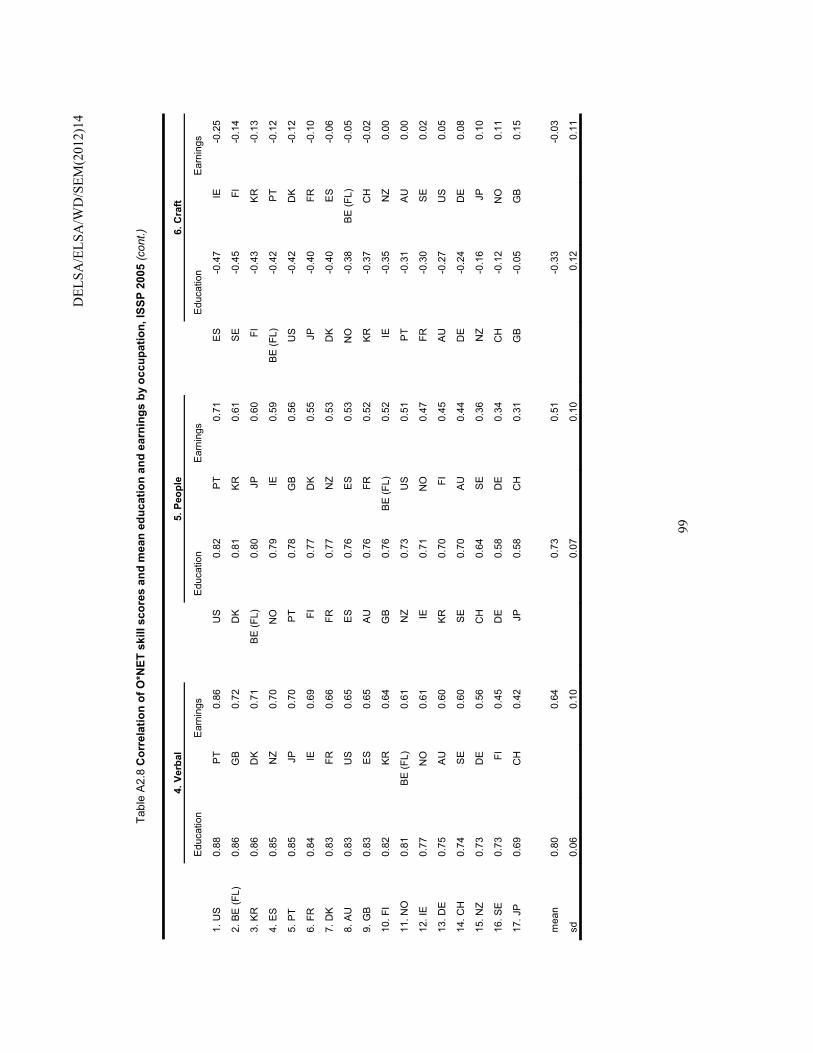
D
ELSA
/ELS
A/W
D/S
EM(2
012)
14
99
Tabl
e A
2.8
Cor
rela
tion
of O
*NET
ski
ll sc
ores
and
mea
n ed
ucat
ion
and
earn
ings
by
occu
patio
n, IS
SP 2
005
(con
t.)
4.
Ver
bal
5. P
eopl
e
6.
Cra
ft
Edu
catio
n E
arni
ngs
E
duca
tion
Ear
ning
s
Edu
catio
n E
arni
ngs
1. U
S
0.88
P
T
0.86
US
0.
82
PT
0.71
ES
-0.4
7 IE
-0
.25
2. B
E (F
L)
0.86
G
B
0.72
DK
0.
81
KR
0.
61
S
E -0
.45
FI
-0.1
4
3. K
R
0.86
D
K
0.71
BE
(FL)
0.
80
JP
0.60
FI
-0.4
3 K
R
-0.1
3
4. E
S
0.85
N
Z
0.70
NO
0.
79
IE
0.59
BE
(FL)
-0
.42
PT
-0.1
2
5. P
T
0.85
JP
0.
70
P
T 0.
78
GB
0.
56
U
S
-0.4
2 D
K
-0.1
2
6. F
R
0.84
IE
0.
69
FI
0.
77
DK
0.
55
JP
-0
.40
FR
-0.1
0
7. D
K
0.83
FR
0.
66
FR
0.
77
NZ
0.53
DK
-0
.40
ES
-0.0
6
8. A
U
0.83
U
S
0.65
ES
0.76
E
S 0.
53
N
O
-0.3
8 B
E (F
L)
-0.0
5
9. G
B
0.83
E
S
0.65
AU
0.
76
FR
0.52
KR
-0
.37
CH
-0
.02
10. F
I 0.
82
KR
0.
64
G
B
0.76
B
E (F
L)
0.52
IE
-0.3
5 N
Z 0.
00
11. N
O
0.81
B
E (F
L)
0.61
NZ
0.73
U
S
0.51
PT
-0.3
1 A
U
0.00
12. I
E
0.77
N
O
0.61
IE
0.71
N
O
0.47
FR
-0.3
0 S
E 0.
02
13. D
E 0.
75
AU
0.
60
K
R
0.70
FI
0.
45
A
U
-0.2
7 U
S
0.05
14. C
H
0.74
S
E
0.60
SE
0.70
A
U
0.44
DE
-0
.24
DE
0.
08
15. N
Z
0.73
D
E
0.56
CH
0.
64
SE
0.36
NZ
-0.1
6 JP
0.
10
16. S
E
0.73
FI
0.
45
D
E
0.58
D
E
0.34
CH
-0
.12
NO
0.
11
17. J
P
0.69
C
H
0.42
JP
0.58
C
H
0.31
GB
-0
.05
GB
0.
15
mea
n 0.
80
0.64
0.
73
0.51
-0
.33
-0.0
3
sd
0.06
0.
10
0.07
0.
10
0.12
0.
11

DEL
SA/E
LSA
/WD
/SEM
(201
2)14
10
0
Tabl
e A
2.8
Cor
rela
tion
of O
*NET
ski
ll sc
ores
and
mea
n ed
ucat
ion
and
earn
ings
by
occu
patio
n, IS
SP 2
005
(con
t.)
7.
Phy
sica
l
8. R
epet
itive
9. E
arni
ngs
E
duca
tion
E
arni
ngs
Edu
catio
n
Ear
ning
s
E
duca
tion
1. E
S
-0.7
5 D
K
-0.6
2
BE
(FL)
-0
.74
FR
-0.6
3
PT
0.88
2. B
E (F
L)
-0.7
1 P
T -0
.58
U
S
-0.7
3 P
T -0
.60
G
B
0.68
3. K
R
-0.7
0 IE
-0
.51
N
O
-0.7
3 IE
-0
.59
D
E
0.68
4. U
S
-0.6
7 K
R
-0.5
0
GB
-0
.72
KR
-0
.58
IE
0.
66
5. IE
-0
.66
DE
-0
.50
D
K
-0.7
0 G
B
-0.5
6
BE
(FL)
0.
66
6. J
P
-0.6
6 N
Z -0
.49
A
U
-0.7
0 N
Z -0
.56
N
Z 0.
65
7. F
I -0
.66
SE
-0.4
9
FR
-0.6
4 U
S
-0.5
5
FR
0.64
8. F
R
-0.6
2 FR
-0
.48
P
T -0
.64
BE
(FL)
-0
.54
K
R
0.63
9. D
E -0
.62
US
-0
.46
E
S -0
.62
ES
-0.5
3
DK
0.
62
10. D
K
-0.5
7 B
E (F
L)
-0.4
5
KR
-0
.62
JP
-0.5
0
ES
0.62
11. P
T
-0.5
7 N
O
-0.4
5
IE
-0.6
1 D
K
-0.4
9
US
0.
60
12. N
O
-0.5
5 E
S -0
.44
N
Z -0
.60
AU
-0
.48
A
U
0.57
13. A
U
-0.5
2 JP
-0
.44
S
E -0
.60
SE
-0.4
8
NO
0.
53
14. C
H
-0.4
8 A
U
-0.4
4
FI
-0.5
7 N
O
-0.4
5
FI
0.43
15. S
E
-0.4
6 G
B
-0.4
1
CH
-0
.50
FI
-0.4
5
SE
0.40
16. G
B
-0.4
4 C
H
-0.4
1
DE
-0
.46
DE
-0
.33
C
H
0.38
17. N
Z
-0.4
3 FI
-0
.38
JP
-0
.40
CH
-0
.16
JP
0.
24
mea
n -0
.59
-0.4
7
-0
.62
-0.5
0
0.
58
sd
0.10
0.
06
0.10
0.
11
0.15
Not
e: O
ccup
atio
n-le
vel c
orre
latio
ns.
Ave
rage
num
ber o
f occ
upat
ions
per
cou
ntry
is 4
2 (m
in=3
1, m
ax=5
4) a
nd u
nder
lyin
g sa
mpl
es o
f wor
kers
ave
rage
784
(min
=469
, max
=1,1
12).

DELSA/ELSA/WD/SEM(2012)14
101
Table A2.9. Correlation of parallel measures in O*NET and the UK Skills Survey.
raw weighted 1. Required education 0.82 0.80 2. Job learning timesa 0.56 0.70 3. General cognitive skillsb 0.76 0.82 4. Math 0.76 0.82 5. Verbal 0.73 0.81 6. People 0.81 0.86 7. Craft skillsc 0.77 0.81 8. Physical demandsd 0.83 0.90 Average 0.76 0.82 Cases 91 3,257,847,808
Note: All skill scores calculated at the 3-digit level. First column represents correlations in which the observations are 91 3-digit occupations. Correlations in the second column based on pooled EU LFS data for 1992-2009, where cases are weighted by the number of workers within occupations across all countries and years. There are no true cases for the weighted correlation because the data was provided in the form of a cross-classification table with population values in the cells. The EU LFS does not provide make sample sizes readily available, so the number of “cases” in column 2 of the last row is purely notional and represents the population counts i.e., number of people implied by the sampling weights when applied to all occupations cells across 462 country-years, not the number of survey respondents. a Refers to job learning times in the UKSS and informal on-the-job training in O*NET (both logged). b Refers to Data in the UKSS and general cognitive demands in O*NET. c The measure of craft demands in the UKSS is a single item for the importance of knowledge and operation of tools. d Physical demands in the UKSS is a scale composed of physical strength and physical stamina (�=0.86).
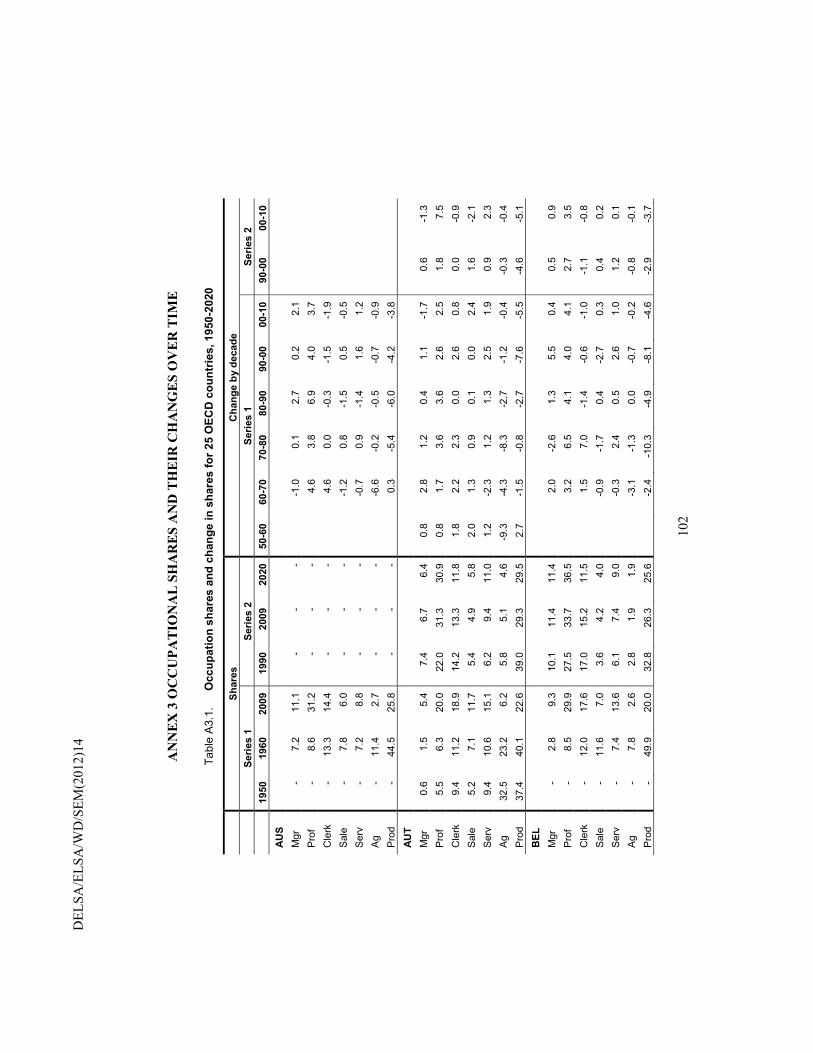
DEL
SA/E
LSA
/WD
/SEM
(201
2)14
10
2
AN
NE
X 3
OC
CU
PAT
ION
AL
SH
AR
ES
AN
D T
HE
IR C
HA
NG
ES
OV
ER
TIM
E
Tabl
e A
3.1.
O
ccup
atio
n sh
ares
and
cha
nge
in s
hare
s fo
r 25
OEC
D c
ount
ries,
195
0-20
20
Shar
es
Cha
nge
by d
ecad
e Se
ries
1 Se
ries
2 Se
ries
1 Se
ries
2
1950
19
60
2009
19
90
2009
20
20
50-6
0 60
-70
70-8
0 80
-90
90-0
0 00
-10
90-0
0 00
-10
AUS
Mgr
-
7.2
11.1
-
- -
-1
.0
0.1
2.7
0.2
2.1
Pro
f -
8.6
31.2
-
- -
4.
6 3.
8 6.
9 4.
0 3.
7
Cle
rk
- 13
.3
14.4
-
- -
4.
6 0.
0 -0
.3
-1.5
-1
.9
Sal
e -
7.8
6.0
- -
-
-1.2
0.
8 -1
.5
0.5
-0.5
Ser
v -
7.2
8.8
- -
-
-0.7
0.
9 -1
.4
1.6
1.2
Ag
- 11
.4
2.7
- -
-
-6.6
-0
.2
-0.5
-0
.7
-0.9
Pro
d -
44.5
25
.8
- -
-
0.3
-5.4
-6
.0
-4.2
-3
.8
AUT
Mgr
0.
6 1.
5 5.
4 7.
4 6.
7 6.
4 0.
8 2.
8 1.
2 0.
4 1.
1 -1
.7
0.6
-1.3
P
rof
5.5
6.3
20.0
22
.0
31.3
30
.9
0.8
1.7
3.6
3.6
2.6
2.5
1.8
7.5
Cle
rk
9.4
11.2
18
.9
14.2
13
.3
11.8
1.
8 2.
2 2.
3 0.
0 2.
6 0.
8 0.
0 -0
.9
Sal
e 5.
2 7.
1 11
.7
5.4
4.9
5.8
2.0
1.3
0.9
0.1
0.0
2.4
1.6
-2.1
S
erv
9.4
10.6
15
.1
6.2
9.4
11.0
1.
2 -2
.3
1.2
1.3
2.5
1.9
0.9
2.3
Ag
32.5
23
.2
6.2
5.8
5.1
4.6
-9.3
-4
.3
-8.3
-2
.7
-1.2
-0
.4
-0.3
-0
.4
Pro
d 37
.4
40.1
22
.6
39.0
29
.3
29.5
2.
7 -1
.5
-0.8
-2
.7
-7.6
-5
.5
-4.6
-5
.1
BEL
M
gr
- 2.
8 9.
3 10
.1
11.4
11
.4
2.
0 -2
.6
1.3
5.5
0.4
0.5
0.9
Pro
f -
8.5
29.9
27
.5
33.7
36
.5
3.
2 6.
5 4.
1 4.
0 4.
1 2.
7 3.
5 C
lerk
-
12.0
17
.6
17.0
15
.2
11.5
1.5
7.0
-1.4
-0
.6
-1.0
-1
.1
-0.8
S
ale
- 11
.6
7.0
3.6
4.2
4.0
-0
.9
-1.7
0.
4 -2
.7
0.3
0.4
0.2
Ser
v -
7.4
13.6
6.
1 7.
4 9.
0
-0.3
2.
4 0.
5 2.
6 1.
0 1.
2 0.
1 A
g -
7.8
2.6
2.8
1.9
1.9
-3
.1
-1.3
0.
0 -0
.7
-0.2
-0
.8
-0.1
P
rod
- 49
.9
20.0
32
.8
26.3
25
.6
-2
.4
-10.
3 -4
.9
-8.1
-4
.6
-2.9
-3
.7
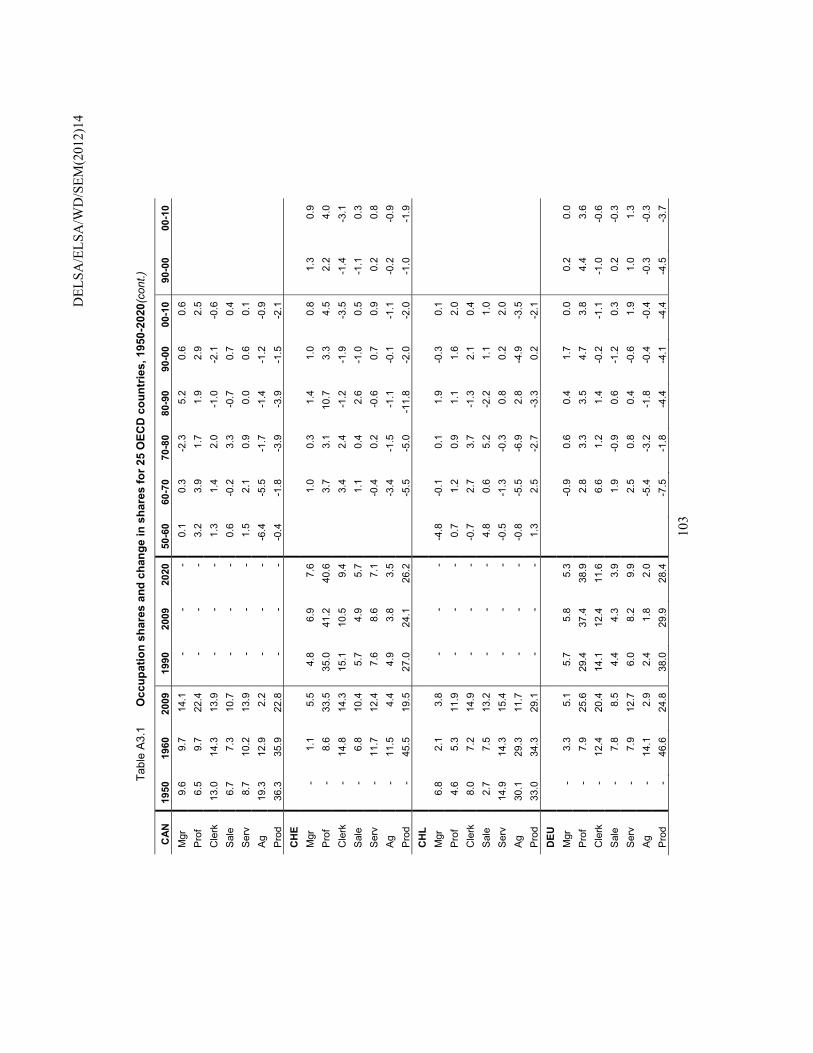
D
ELSA
/ELS
A/W
D/S
EM(2
012)
14
10
3
Tabl
e A
3.1
Occ
upat
ion
shar
es a
nd c
hang
e in
sha
res
for 2
5 O
ECD
cou
ntrie
s, 1
950-
2020
(con
t.)
CAN
19
50
1960
20
09
1990
20
09
2020
50
-60
60-7
0 70
-80
80-9
0 90
-00
00-1
0 90
-00
00-1
0 M
gr
9.6
9.7
14.1
-
- -
0.1
0.3
-2.3
5.
2 0.
6 0.
6
P
rof
6.5
9.7
22.4
-
- -
3.2
3.9
1.7
1.9
2.9
2.5
Cle
rk
13.0
14
.3
13.9
-
- -
1.3
1.4
2.0
-1.0
-2
.1
-0.6
S
ale
6.7
7.3
10.7
-
- -
0.6
-0.2
3.
3 -0
.7
0.7
0.4
Ser
v 8.
7 10
.2
13.9
-
- -
1.5
2.1
0.9
0.0
0.6
0.1
Ag
19.3
12
.9
2.2
- -
- -6
.4
-5.5
-1
.7
-1.4
-1
.2
-0.9
P
rod
36.3
35
.9
22.8
-
- -
-0.4
-1
.8
-3.9
-3
.9
-1.5
-2
.1
CH
E
M
gr
- 1.
1 5.
5 4.
8 6.
9 7.
6
1.0
0.3
1.4
1.0
0.8
1.3
0.9
Pro
f -
8.6
33.5
35
.0
41.2
40
.6
3.
7 3.
1 10
.7
3.3
4.5
2.2
4.0
Cle
rk
- 14
.8
14.3
15
.1
10.5
9.
4
3.4
2.4
-1.2
-1
.9
-3.5
-1
.4
-3.1
S
ale
- 6.
8 10
.4
5.7
4.9
5.7
1.
1 0.
4 2.
6 -1
.0
0.5
-1.1
0.
3 S
erv
- 11
.7
12.4
7.
6 8.
6 7.
1
-0.4
0.
2 -0
.6
0.7
0.9
0.2
0.8
Ag
- 11
.5
4.4
4.9
3.8
3.5
-3
.4
-1.5
-1
.1
-0.1
-1
.1
-0.2
-0
.9
Pro
d -
45.5
19
.5
27.0
24
.1
26.2
-5.5
-5
.0
-11.
8 -2
.0
-2.0
-1
.0
-1.9
C
HL
Mgr
6.
8 2.
1 3.
8 -
- -
-4.8
-0
.1
0.1
1.9
-0.3
0.
1
P
rof
4.6
5.3
11.9
-
- -
0.7
1.2
0.9
1.1
1.6
2.0
Cle
rk
8.0
7.2
14.9
-
- -
-0.7
2.
7 3.
7 -1
.3
2.1
0.4
Sal
e 2.
7 7.
5 13
.2
- -
- 4.
8 0.
6 5.
2 -2
.2
1.1
1.0
Ser
v 14
.9
14.3
15
.4
- -
- -0
.5
-1.3
-0
.3
0.8
0.2
2.0
Ag
30.1
29
.3
11.7
-
- -
-0.8
-5
.5
-6.9
2.
8 -4
.9
-3.5
P
rod
33.0
34
.3
29.1
-
- -
1.3
2.5
-2.7
-3
.3
0.2
-2.1
D
EU
Mgr
-
3.3
5.1
5.7
5.8
5.3
-0
.9
0.6
0.4
1.7
0.0
0.2
0.0
Pro
f -
7.9
25.6
29
.4
37.4
38
.9
2.
8 3.
3 3.
5 4.
7 3.
8 4.
4 3.
6 C
lerk
-
12.4
20
.4
14.1
12
.4
11.6
6.6
1.2
1.4
-0.2
-1
.1
-1.0
-0
.6
Sal
e -
7.8
8.5
4.4
4.3
3.9
1.
9 -0
.9
0.6
-1.2
0.
3 0.
2 -0
.3
Ser
v -
7.9
12.7
6.
0 8.
2 9.
9
2.5
0.8
0.4
-0.6
1.
9 1.
0 1.
3 A
g -
14.1
2.
9 2.
4 1.
8 2.
0
-5.4
-3
.2
-1.8
-0
.4
-0.4
-0
.3
-0.3
P
rod
- 46
.6
24.8
38
.0
29.9
28
.4
-7
.5
-1.8
-4
.4
-4.1
-4
.4
-4.5
-3
.7

DEL
SA/E
LSA
/WD
/SEM
(201
2)14
10
4
Tabl
e A
3.1.
O
ccup
atio
n sh
ares
and
cha
nge
in s
hare
s fo
r 25
OEC
D c
ount
ries,
195
0-20
20 (c
ont.)
DN
K
1950
19
60
2009
19
90
2009
20
20
50-6
0 60
-70
70-8
0 80
-90
90-0
0 00
-10
90-0
0 00
-10
Mgr
-
1.7
5.1
9.2
6.3
9.5
0.
0 2.
0 0.
4 1.
9 -1
.0
-1.8
-1
.0
Pro
f -
8.2
29.2
28
.7
39.5
39
.9
4.
5 3.
9 7.
6 -0
.3
6.0
4.7
6.1
Cle
rk
- 9.
1 16
.3
13.7
9.
7 6.
0
4.2
4.0
1.5
-0.4
-2
.4
-2.3
-1
.7
Sal
e -
10.2
10
.9
4.8
5.8
4.5
-0
.2
-2.4
0.
1 1.
2 2.
1 0.
2 0.
9 S
erv
- 12
.3
15.9
9.
9 10
.9
10.6
-1.2
5.
4 -5
.7
4.6
0.5
0.2
0.7
Ag
- 18
.4
3.5
1.7
2.3
2.7
-7
.4
-3.1
-3
.1
-0.7
-0
.6
0.9
-0.2
P
rod
- 40
.2
19.1
32
.2
25.4
26
.9
0.
1 -9
.8
-0.8
-6
.3
-4.7
-2
.0
-4.8
ES
P
M
gr
- 1.
1 6.
7 7.
7 8.
0 8.
1
0.0
0.5
0.3
4.8
0.1
0.2
0.1
Pro
f -
4.2
16.9
13
.4
26.1
28
.0
0.
6 2.
9 4.
4 1.
8 3.
3 7.
8 4.
9 C
lerk
-
5.9
15.9
12
.6
9.3
9.2
1.
5 2.
1 2.
3 3.
2 1.
0 -2
.8
-0.6
S
ale
- 6.
3 9.
3 4.
7 5.
3 5.
4
4.7
-0.6
0.
7 -2
.3
0.6
0.4
0.2
Ser
v -
8.6
19.8
7.
4 11
.9
12.1
0.3
3.6
1.4
1.8
4.7
1.9
2.6
Ag
- 40
.9
5.1
6.7
2.5
3.5
-1
1.4
-10.
2 -7
.5
-4.6
-2
.2
-2.2
-2
.0
Pro
d -
32.9
26
.3
47.5
36
.9
33.8
4.3
1.8
-1.6
-4
.6
-7.3
-5
.3
-5.3
FI
N
Mgr
-
1.7
8.3
8.5
10.6
11
.1
8.
3 -6
.4
1.0
3.1
0.6
1.0
1.0
Pro
f -
8.2
27.5
33
.3
35.3
39
.1
3.
7 5.
6 6.
9 3.
7 -0
.8
1.7
0.3
Cle
rk
- 5.
2 11
.0
9.4
6.4
4.9
13.4
1.
0 -1
.9
-1.7
-0
.8
-2.2
S
ale
- 6.
9 9.
7 4.
2 4.
5 3.
4
1.3
-1.1
2.
6 -0
.9
0.9
0.3
0.0
Ser
v -
8.3
16.7
8.
2 11
.8
10.7
2.3
2.3
-2.2
1.
5 5.
1 -0
.8
4.4
Ag
- 35
.3
5.4
7.1
4.4
3.3
-1
5.1
-8.1
-3
.0
-2.2
-1
.7
-1.3
-1
.4
Pro
d -
34.3
21
.5
29.4
27
.1
27.6
4.6
-5.7
-6
.3
-3.3
-2
.4
-0.1
-2
.1
FRA
M
gr
- 6.
8 6.
9 12
.3
8.9
9.5
2.
3 0.
7 1.
9 1.
4 -6
.9
-4.7
1.
3 P
rof
- 7.
7 23
.7
29.8
33
.0
33.9
4.8
2.3
2.2
3.1
3.9
-1.4
4.
6 C
lerk
-
10.0
18
.5
14.7
12
.0
11.2
5.1
1.9
0.3
-0.1
1.
6 -0
.3
-2.3
S
ale
- 7.
0 8.
6 3.
2 4.
0 4.
1
-0.7
0.
2 0.
6 -0
.5
2.2
0.3
0.5
Ser
v -
6.3
16.4
7.
4 8.
9 9.
1
-1.1
0.
7 0.
6 1.
6 9.
3 1.
9 -0
.4
Ag
- 20
.3
4.4
1.3
3.5
2.9
-1
0.6
-1.3
-2
.2
-2.5
0.
7 2.
9 -0
.7
Pro
d -
42.0
21
.6
31.4
29
.6
29.3
0.1
-4.4
-3
.5
-3.0
-1
0.7
1.2
-3.0

D
ELSA
/ELS
A/W
D/S
EM(2
012)
14
10
5
Tabl
e A
3.1
Occ
upat
ion
shar
es a
nd c
hang
e in
sha
res
for 2
5 O
ECD
cou
ntrie
s, 1
950-
2020
(con
t.)
GB
R
1950
19
60
2009
19
90
2009
20
20
50-6
0 60
-70
70-8
0 80
-90
90-0
0 00
-10
90-0
0 00
-10
Mgr
-
2.7
11.4
14
.0
15.6
15
.7
8.
3 1.
7 4.
9 -6
.3
0.1
1.2
0.3
Pro
f -
8.8
23.3
22
.9
27.9
30
.2
3.
8 3.
4 -0
.8
6.6
1.6
2.2
2.8
Cle
rk
- 13
.2
17.5
17
.1
12.9
10
.8
3.
2 0.
3 0.
5 1.
8 -1
.8
-0.8
-3
.5
Sal
e -
9.8
10.8
5.
0 5.
7 6.
3
-3.2
0.
3 -0
.4
3.6
0.7
0.5
0.2
Ser
v -
10.7
16
.5
8.3
11.8
11
.6
-4
.8
0.9
5.6
1.7
2.7
1.7
1.8
Ag
- 4.
4 2.
0 1.
3 1.
2 1.
4
-3.2
-0
.3
0.6
0.5
0.0
-0.3
0.
2 P
rod
- 50
.3
18.5
31
.3
25.1
24
.1
-4
.2
-6.3
-1
0.5
-7.9
-3
.2
-4.4
-1
.8
GR
C
Mgr
-
0.8
8.8
10.0
10
.4
9.7
-0
.1
1.5
-0.5
6.
9 0.
4 0.
0 0.
4 P
rof
- 3.
6 19
.2
16.6
23
.7
26.8
2.2
4.0
3.1
2.6
4.2
2.0
5.1
Cle
rk
- 4.
1 14
.6
9.2
10.9
11
.3
3.
5 1.
3 2.
1 2.
7 0.
9 2.
2 -0
.4
Sal
e -
6.3
9.3
4.7
7.0
7.3
1.
0 2.
5 1.
8 -3
.4
1.2
1.3
1.0
Ser
v -
7.0
12.0
5.
9 7.
8 8.
5
0.5
0.4
1.5
0.9
2.0
1.1
0.8
Ag
- 55
.5
12.8
21
.7
11.4
8.
7
-14.
4 -1
0.1
-6.8
-5
.9
-6.0
-4
.4
-5.9
P
rod
- 22
.8
23.3
31
.9
28.7
27
.8
7.
4 0.
5 -1
.1
-3.8
-2
.7
-2.2
-1
.0
IRL
Mgr
-
1.3
12.9
8.
5 16
.3
16.3
0.4
1.4
0.1
11.0
-1
.5
9.1
-1.3
P
rof
- 7.
5 23
.2
19.2
25
.9
24.5
2.3
3.8
4.4
0.4
5.4
1.4
5.2
Cle
rk
- 7.
3 15
.4
14.6
13
.4
11.6
2.4
2.4
2.9
-0.3
0.
8 -1
.6
0.4
Sal
e -
9.8
10.7
7.
8 6.
9 6.
3
0.3
1.1
-0.7
-0
.3
0.6
-1.4
0.
5 S
erv
- 8.
0 15
.3
9.0
11.9
13
.6
-0
.7
0.5
2.6
2.0
3.2
0.3
2.6
Ag
- 36
.8
1.9
10.9
0.
7 0.
9
-10.
3 -9
.4
-1.9
-1
2.4
-0.9
-1
0.0
-0.2
P
rod
- 29
.4
20.6
30
.0
25.0
26
.6
5.
6 0.
2 -7
.4
-0.4
-7
.5
2.3
-7.2
IT
A
Mgr
-
- 7.
0 2.
8 8.
1 8.
7
3.3
1.5
3.8
Pro
f -
5.9
20.3
21
.8
31.0
38
.0
2.
9 6.
9 -0
.3
1.9
3.4
5.0
4.2
Cle
rk
- -
18.9
13
.2
12.3
8.
3
-1.2
0.
6 -1
.5
Sal
e -
8.3
9.6
8.4
3.9
4.4
2.
2 0.
8 1.
5 -0
.1
-3.3
-0
.5
-3.9
S
erv
- 8.
9 12
.7
7.1
7.4
8.0
1.
8 0.
6 1.
6 -1
.2
1.0
0.8
-0.5
A
g -
31.8
4.
2 5.
0 2.
3 2.
3
-12.
0 -6
.8
-5.5
-2
.5
-0.9
-1
.7
-0.9
P
rod
- 45
.2
27.3
41
.7
35.0
30
.3
5.
1 -1
.5
-15.
4 -4
.1
-2.3
-5
.6
-1.1
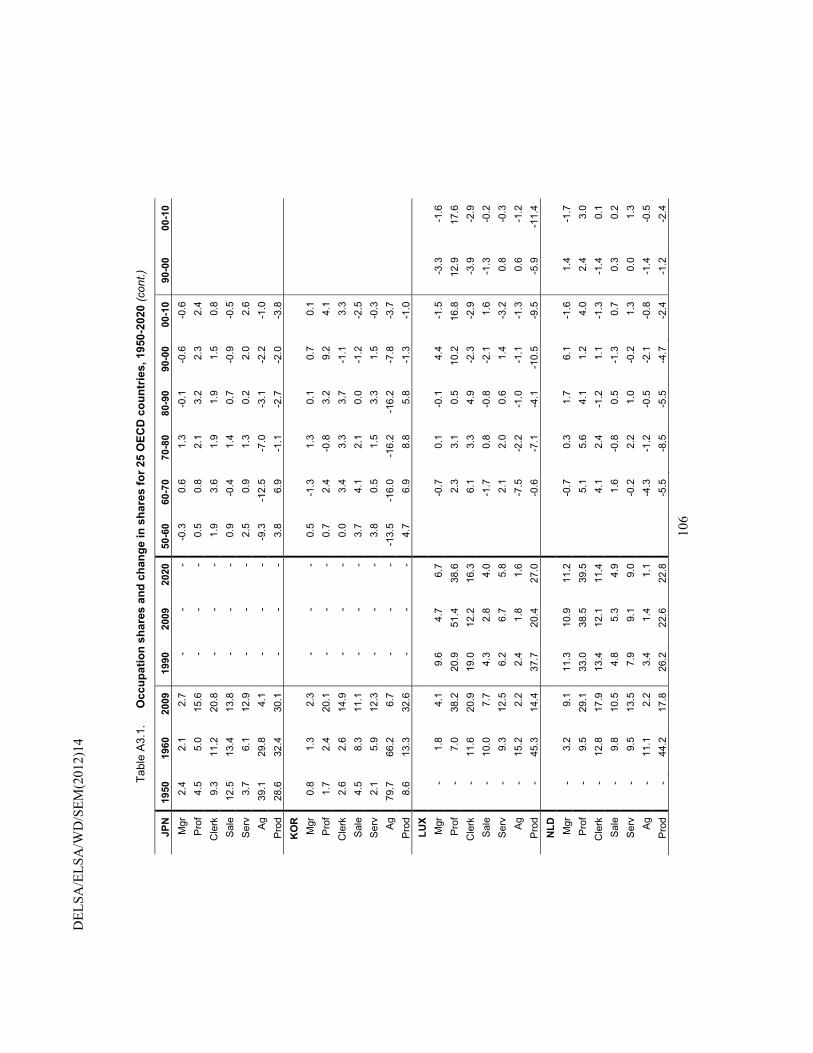
DEL
SA/E
LSA
/WD
/SEM
(201
2)14
10
6
Tabl
e A
3.1.
O
ccup
atio
n sh
ares
and
cha
nge
in s
hare
s fo
r 25
OEC
D c
ount
ries,
195
0-20
20 (c
ont.)
JPN
19
50
1960
20
09
1990
20
09
2020
50
-60
60-7
0 70
-80
80-9
0 90
-00
00-1
0 90
-00
00-1
0 M
gr
2.4
2.1
2.7
- -
- -0
.3
0.6
1.3
-0.1
-0
.6
-0.6
P
rof
4.5
5.0
15.6
-
- -
0.5
0.8
2.1
3.2
2.3
2.4
Cle
rk
9.3
11.2
20
.8
- -
- 1.
9 3.
6 1.
9 1.
9 1.
5 0.
8
S
ale
12.5
13
.4
13.8
-
- -
0.9
-0.4
1.
4 0.
7 -0
.9
-0.5
S
erv
3.7
6.1
12.9
-
- -
2.5
0.9
1.3
0.2
2.0
2.6
Ag
39.1
29
.8
4.1
- -
- -9
.3
-12.
5 -7
.0
-3.1
-2
.2
-1.0
P
rod
28.6
32
.4
30.1
-
- -
3.8
6.9
-1.1
-2
.7
-2.0
-3
.8
KO
R
Mgr
0.
8 1.
3 2.
3 -
- -
0.5
-1.3
1.
3 0.
1 0.
7 0.
1
P
rof
1.7
2.4
20.1
-
- -
0.7
2.4
-0.8
3.
2 9.
2 4.
1
C
lerk
2.
6 2.
6 14
.9
- -
- 0.
0 3.
4 3.
3 3.
7 -1
.1
3.3
Sal
e 4.
5 8.
3 11
.1
- -
- 3.
7 4.
1 2.
1 0.
0 -1
.2
-2.5
S
erv
2.1
5.9
12.3
-
- -
3.8
0.5
1.5
3.3
1.5
-0.3
A
g 79
.7
66.2
6.
7 -
- -
-13.
5 -1
6.0
-16.
2 -1
6.2
-7.8
-3
.7
Pro
d 8.
6 13
.3
32.6
-
- -
4.7
6.9
8.8
5.8
-1.3
-1
.0
LUX
Mgr
-
1.8
4.1
9.6
4.7
6.7
-0
.7
0.1
-0.1
4.
4 -1
.5
-3.3
-1
.6
Pro
f -
7.0
38.2
20
.9
51.4
38
.6
2.
3 3.
1 0.
5 10
.2
16.8
12
.9
17.6
C
lerk
-
11.6
20
.9
19.0
12
.2
16.3
6.1
3.3
4.9
-2.3
-2
.9
-3.9
-2
.9
Sal
e -
10.0
7.
7 4.
3 2.
8 4.
0
-1.7
0.
8 -0
.8
-2.1
1.
6 -1
.3
-0.2
S
erv
- 9.
3 12
.5
6.2
6.7
5.8
2.
1 2.
0 0.
6 1.
4 -3
.2
0.8
-0.3
A
g -
15.2
2.
2 2.
4 1.
8 1.
6
-7.5
-2
.2
-1.0
-1
.1
-1.3
0.
6 -1
.2
Pro
d -
45.3
14
.4
37.7
20
.4
27.0
-0.6
-7
.1
-4.1
-1
0.5
-9.5
-5
.9
-11.
4 N
LD
Mgr
-
3.2
9.1
11.3
10
.9
11.2
-0.7
0.
3 1.
7 6.
1 -1
.6
1.4
-1.7
P
rof
- 9.
5 29
.1
33.0
38
.5
39.5
5.1
5.6
4.1
1.2
4.0
2.4
3.0
Cle
rk
- 12
.8
17.9
13
.4
12.1
11
.4
4.
1 2.
4 -1
.2
1.1
-1.3
-1
.4
0.1
Sal
e -
9.8
10.5
4.
8 5.
3 4.
9
1.6
-0.8
0.
5 -1
.3
0.7
0.3
0.2
Ser
v -
9.5
13.5
7.
9 9.
1 9.
0
-0.2
2.
2 1.
0 -0
.2
1.3
0.0
1.3
Ag
- 11
.1
2.2
3.4
1.4
1.1
-4
.3
-1.2
-0
.5
-2.1
-0
.8
-1.4
-0
.5
Pro
d -
44.2
17
.8
26.2
22
.6
22.8
-5.5
-8
.5
-5.5
-4
.7
-2.4
-1
.2
-2.4

D
ELSA
/ELS
A/W
D/S
EM(2
012)
14
10
7
Tabl
e A
3.1.
O
ccup
atio
n sh
ares
and
cha
nge
in s
hare
s fo
r 25
OEC
D c
ount
ries,
195
0-20
20 (c
ont.)
NO
R
1950
19
60
2009
19
90
2009
20
20
50-6
0 60
-70
70-8
0 80
-90
90-0
0 00
-10
90-0
0 00
-10
Mgr
-
3.2
4.8
11.1
6.
1 5.
0
0.4
1.5
1.4
-0.2
-1
.7
-2.8
-2
.3
Pro
f -
8.1
27.8
27
.4
38.8
44
.8
4.
4 6.
4 5.
1 0.
4 3.
7 5.
5 5.
9 C
lerk
-
7.1
13.5
10
.1
6.8
7.1
2.
8 0.
8 0.
2 3.
0 -0
.3
-1.0
-2
.3
Sal
e -
7.6
13.4
6.
1 8.
8 8.
1
1.4
0.5
1.4
1.5
1.0
1.2
1.5
Ser
v -
9.2
18.7
14
.1
15.1
13
.6
-0
.6
4.5
0.7
4.8
0.2
-0.1
1.
1 A
g -
19.6
3.
4 5.
2 2.
4 1.
8
-7.6
-3
.6
-1.8
-1
.8
-1.4
-1
.3
-1.4
P
rod
- 45
.3
18.4
26
.1
22.1
19
.6
-0
.9
-10.
2 -6
.9
-7.7
-1
.3
-1.4
-2
.6
NZL
Mgr
2.
2 5.
8 7.
4 -
- -
3.6
-3.2
1.
0 2.
6 0.
0 1.
3
Pro
f 7.
3 9.
5 29
.8
- -
- 2.
2 3.
2 1.
6 3.
9 9.
3 2.
6
Cle
rk
13.8
13
.0
16.0
-
- -
-0.9
3.
5 0.
3 -0
.1
1.2
-2.0
Sal
e 8.
9 8.
3 9.
0 -
- -
-0.6
2.
2 -0
.6
2.2
-2.9
-0
.3
Ser
v 7.
2 6.
5 10
.0
- -
- -0
.7
0.6
1.2
2.8
-1.1
-0
.1
Ag
18.9
14
.7
8.5
- -
- -4
.2
-2.8
-0
.4
-0.8
-0
.8
-1.6
Pro
d 41
.7
42.2
19
.3
- -
- 0.
6 -3
.5
-3.0
-1
0.7
-5.6
0.
0
PRT
Mgr
-
1.4
5.4
11.5
6.
6 5.
7
-1.1
0.
8 1.
0 3.
7 -0
.5
-4.6
-0
.3
Pro
f -
2.8
13.0
17
.4
19.0
19
.6
1.
2 1.
5 3.
7 1.
0 3.
2 -2
.9
4.5
Cle
rk
- 5.
0 14
.7
11.3
9.
5 10
.1
3.
8 2.
2 2.
8 0.
4 0.
6 -1
.4
-0.3
S
ale
- 6.
4 8.
7 5.
0 5.
2 5.
7
1.4
-0.5
2.
5 -2
.2
1.3
0.1
0.1
Ser
v -
9.3
17.0
9.
4 10
.7
8.9
-0
.9
1.4
2.6
2.1
2.9
-1.3
2.
7 A
g -
43.4
12
.2
7.1
11.0
10
.3
-1
0.6
-5.6
-8
.9
-5.2
-1
.1
4.1
-0.2
P
rod
- 31
.8
28.8
38
.4
38.0
39
.7
6.
0 0.
3 -3
.7
0.1
-6.3
6.
0 -6
.4
SWE
Mgr
-
2.2
4.2
4.9
5.3
6.8
0.
2 -0
.1
1.6
-0.2
0.
6 -0
.2
0.6
Pro
f -
12.9
30
.2
35.6
40
.6
42.7
6.5
6.8
0.5
0.8
3.0
1.5
3.6
Cle
rk
- 8.
5 13
.8
11.1
8.
5 7.
9
2.5
1.2
2.7
-0.4
-0
.9
-0.6
-1
.9
Sal
e -
9.6
10.9
4.
1 5.
3 4.
8
-0.7
-0
.8
1.5
0.5
1.0
0.4
0.7
Ser
v -
9.7
18.6
13
.3
13.7
13
.3
2.
9 0.
9 4.
2 0.
4 0.
6 0.
0 0.
4 A
g -
13.6
3.
2 2.
6 2.
1 1.
9
-5.6
-2
.4
-1.7
-0
.3
-0.4
0.
1 -0
.6
Pro
d -
43.6
19
.1
28.3
24
.5
22.8
-5.9
-5
.6
-8.8
-0
.7
-3.8
-1
.1
-2.7
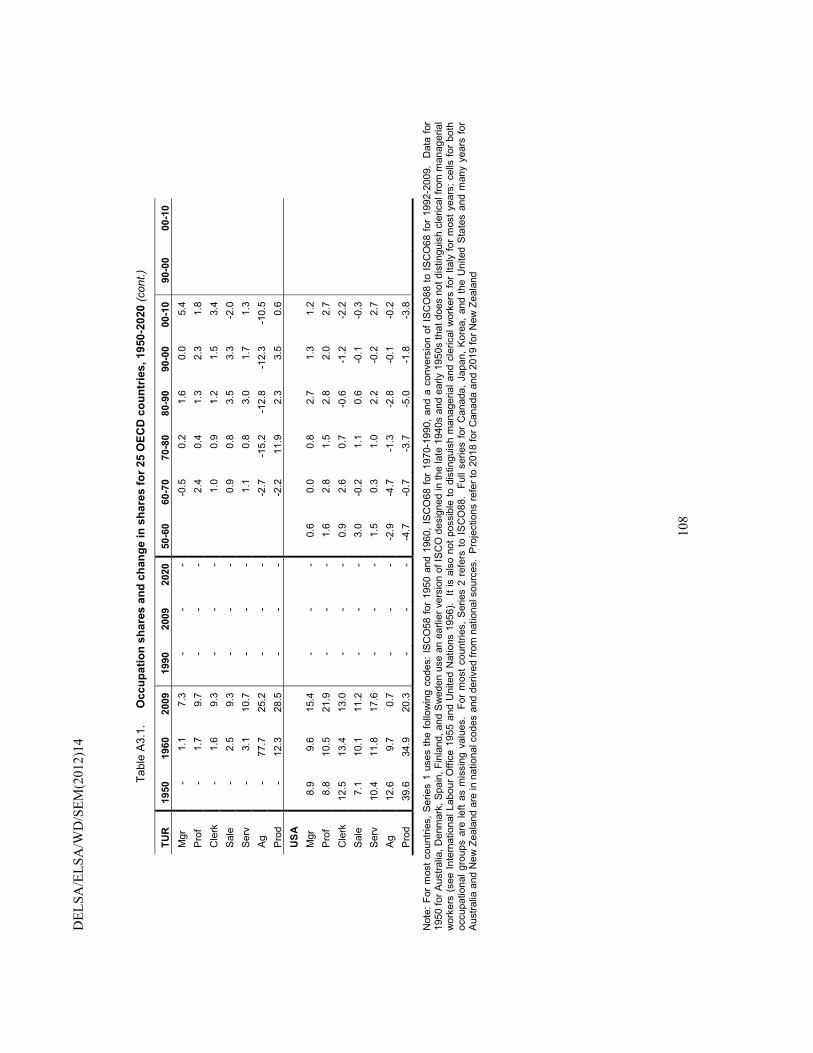
DEL
SA/E
LSA
/WD
/SEM
(201
2)14
10
8
Tabl
e A
3.1.
O
ccup
atio
n sh
ares
and
cha
nge
in s
hare
s fo
r 25
OEC
D c
ount
ries,
195
0-20
20 (c
ont.)
TUR
19
50
1960
20
09
1990
20
09
2020
50
-60
60-7
0 70
-80
80-9
0 90
-00
00-1
0 90
-00
00-1
0 M
gr
- 1.
1 7.
3 -
- -
-0
.5
0.2
1.6
0.0
5.4
Pro
f -
1.7
9.7
- -
-
2.4
0.4
1.3
2.3
1.8
Cle
rk
- 1.
6 9.
3 -
- -
1.
0 0.
9 1.
2 1.
5 3.
4
Sal
e -
2.5
9.3
- -
-
0.9
0.8
3.5
3.3
-2.0
Ser
v -
3.1
10.7
-
- -
1.
1 0.
8 3.
0 1.
7 1.
3
Ag
- 77
.7
25.2
-
- -
-2
.7
-15.
2 -1
2.8
-12.
3 -1
0.5
Pro
d -
12.3
28
.5
- -
-
-2.2
11
.9
2.3
3.5
0.6
USA
Mgr
8.
9 9.
6 15
.4
- -
- 0.
6 0.
0 0.
8 2.
7 1.
3 1.
2
Pro
f 8.
8 10
.5
21.9
-
- -
1.6
2.8
1.5
2.8
2.0
2.7
Cle
rk
12.5
13
.4
13.0
-
- -
0.9
2.6
0.7
-0.6
-1
.2
-2.2
Sal
e 7.
1 10
.1
11.2
-
- -
3.0
-0.2
1.
1 0.
6 -0
.1
-0.3
Ser
v 10
.4
11.8
17
.6
- -
- 1.
5 0.
3 1.
0 2.
2 -0
.2
2.7
Ag
12.6
9.
7 0.
7 -
- -
-2.9
-4
.7
-1.3
-2
.8
-0.1
-0
.2
Pro
d 39
.6
34.9
20
.3
- -
- -4
.7
-0.7
-3
.7
-5.0
-1
.8
-3.8
Not
e: F
or m
ost c
ount
ries,
Ser
ies
1 us
es th
e fo
llow
ing
code
s: IS
CO
58 fo
r 19
50 a
nd 1
960,
ISC
O68
for
1970
-199
0, a
nd a
con
vers
ion
of IS
CO
88 to
ISC
O68
for
1992
-200
9.
Dat
a fo
r 19
50 fo
r Aus
tralia
, Den
mar
k, S
pain
, Fin
land
, and
Sw
eden
use
an
earli
er v
ersi
on o
f IS
CO
des
igne
d in
the
late
194
0s a
nd e
arly
195
0s th
at d
oes
not d
istin
guis
h cl
eric
al fr
om m
anag
eria
l w
orke
rs (
see
Inte
rnat
iona
l Lab
our O
ffice
195
5 an
d U
nite
d N
atio
ns 1
956)
. It
is a
lso
not p
ossi
ble
to d
istin
guis
h m
anag
eria
l and
cle
rical
wor
kers
for
Italy
for m
ost y
ears
; cel
ls fo
r bo
th
occu
patio
nal g
roup
s ar
e le
ft as
mis
sing
val
ues.
Fo
r m
ost c
ount
ries,
Ser
ies
2 re
fers
to IS
CO
88.
Full
serie
s fo
r C
anad
a, J
apan
, Kor
ea, a
nd th
e U
nite
d S
tate
s an
d m
any
year
s fo
r A
ustra
lia a
nd N
ew Z
eala
nd a
re in
nat
iona
l cod
es a
nd d
eriv
ed fr
om n
atio
nal s
ourc
es.
Pro
ject
ions
refe
r to
2018
for C
anad
a an
d 20
19 fo
r New
Zea
land

DELSA/ELSA/WD/SEM(2012)14
109
ANNEX 4. CONSTRUCTION OF O*NET SCORES BY ISCO CODES
The Employment and Training Administration of the United States Department of Labor produces the Occupational Information Network (O*NET) database. O*NET is a labour market information tool intended to help facilitate matches between job seekers and employers. The database contains numerical ratings at the occupation-level for 239 job characteristics, based mostly on responses to surveys of large representative samples workers, as well as some job analyst ratings of certain job characteristics. 28 This report used the first complete version of O*NET, released in summer 2008, to assign skill scores to employment data from labour force surveys (LFS) conducted in other countries using occupation codes as the match field. Matching required that all data had to use or be converted to a common occupational coding system. Three-digit International Standard Codes for Occupations (1988) (ISCO88) were chosen to maximize the number of countries and years while maintaining a reasonably high level of occupational detail.
Most O*NET items used for this report were combined into a smaller number of additive scales, which lacked an intuitive metric. In order to maximize the interpretability of the scales, it was decided to standardize them on a single sample. If the scales were standardized by country using the first year of data available the time trends would indicate the evolution of each country’s labour market relative to its own starting point but not relative to some common baseline population, making the levels and trends non-comparable across countries. The 1992 Current Population Survey’s (CPS) merged outgoing rotation group (MORG) file was selected as the benchmark sample because many recent debates over skill are based on this data series and 1992 is the earliest year for which European LFS data are available. As will become clear, both the conversion to ISCO and the standardization process introduced some complications.
O*NET scores are occupation means expressed in a slightly modified version of the U.S. Standard Occupation Codes (SOC 2000) system. One of these modifications is that O*NET contains no skill scores for SOC 2000 codes ending in 9, which refer to residual occupations such as “Managers, All Other,” because they are not really coherent groupings of similar jobs. While sensible from a job counselling perspective it means there are no O*NET scores for some SOC occupations.
Likewise, some O*NET codes are finer divisions of standard SOC codes, presumably also reflecting a job counselling concern. Because there are no crosswalks between these O*NET-specific codes and the other coding systems used for this project the finer codes were recombined into their parent codes from the standard SOC scheme, taking simple averages of the constituent occupations’ skill scores, as no U.S. survey program collects information on the size of the O*NET-specific occupations from which weights could be derived.
To merge the skill scores from this file onto the CPS 1992 file and standardize appropriately required the following steps:
1. The file’s SOC codes were assigned Census 2000 occupation codes using a crosswalk between these closely related coding schemes;
28 For further details on the O*NET database see Handel 2011 and National Research Council 2010.

DELSA/ELSA/WD/SEM(2012)14
110
2. This file was merged onto a CPS file dual-coded in terms of both the Census 2000 and Census 1990 occupation codes and O*NET scores for Census 1990 codes calculated by collapsing the file in terms of the Census 1990 codes, using the file’s person weights29;
3. This file of O*NET scores for Census 1990 occupation codes was merged onto the CPS 1992 file and the individual O*NET items were standardized and averaged into scales (see Table A4.1 for details on the scales);
4. ISCO88 codes were assigned to the CPS 1992 file using a slight modification of the ISCO88-Census 1990 correspondence made available by Torben Iversen30;
5. Mean O*NET scale scores by ISCO88 codes were calculated by collapsing the file, using the CPS 1992 file’s person weights.
While it was possible to standardize the scales before the collapse in step 5, the standardization would have been at the 3-digit Census 1990 level, which has slightly more than 500 occupations, not the 3-digit ISCO88 level, which has slightly more than 100 occupations. Thus, when this file of O*NET scores was merged back onto the CPS 1992 file, the scales were no longer standardized, i.e., the scale means differed from 0 and the standard deviations differed from 1, so the scores had to be restandardized. Therefore,
6. The file of O*NET scores by ISCO88 codes was remerged onto the CPS 1992 file, which retained the Iversen-derived ISCO88 codes;
7. The O*NET scores were restandardized across the microdata using the CPS 1992 person weights and then collapsed again by ISCO88 codes, yielding a file of O*NET scales that were standardized at the 3-digit ISCO88 level for the CPS 1992 file. Decile cutpoint values for these standardized scales across the CPS 1992 microdata were also calculated in the process but there is considerable lumpiness in the data because of the moderate number of occupational titles, i.e., with only about one hundred 3-digit ISCO88 titles and significant clustering of workers into more populous occupations many “deciles” have more or less than ten per cent of workers if a large occupation straddles a decile cutpoint.
8. These master files of O*NET means and decile cutpoints were merged onto CPS Outgoing Rotation Group files for 1992-2009 and EU LFS files for 1992-2009.
9. The CPS uses Census 1990 codes for 1992-2002 and Census 2000 codes for 2002-present, with the 2002 file containing both codes. It was possible to use the Iversen correspondence through 2002, but not for the following years. Therefore, the 2002 overlap file was used to translate the O*NET means derived above into Census 2000 occupational means using a weighted collapse procedure. This table of O*NET means for Census 2000 codes was merged onto CPS files from 2002 onwards, using the two sets of scores generated for 2002 as a check on the continuity of the series. Unfortunately, results using the decile cutpoints proved very sensitive changes in occupational coding systems and were deferred for future analysis and development of more robust methods of detecting trends in skill inequality and polarization.
29 I thank Peter Meyer of the United States Bureau of Labor Statistics for sharing the dual-coded CPS file
with me. 30 Iversen’s Census 1990-ISCO88 correspondence is available at
www.people.fas.harvard.edu/~iversen/data/ISCO_conversion_tables.htm (accessed 23/9/2010).
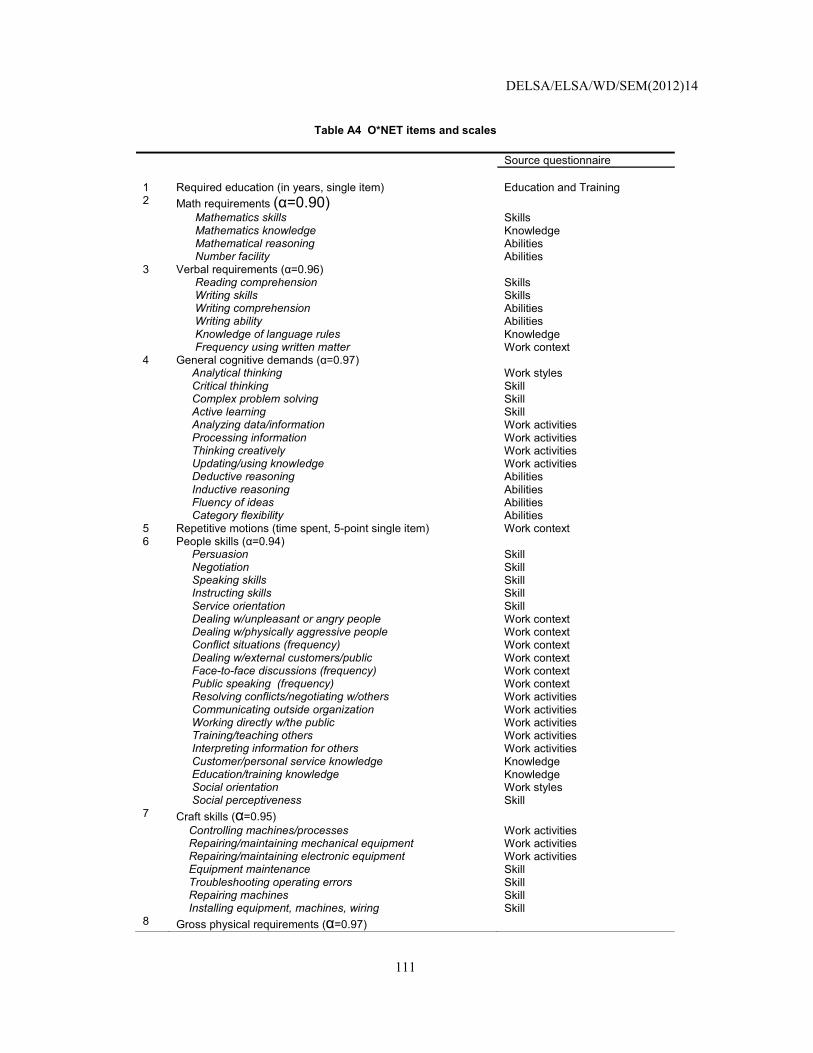
DELSA/ELSA/WD/SEM(2012)14
111
Table A4 O*NET items and scales
Source questionnaire 1 Required education (in years, single item) Education and Training 2 Math requirements (�=0.90) Mathematics skills Skills Mathematics knowledge Knowledge Mathematical reasoning Abilities Number facility Abilities 3 Verbal requirements (�=0.96) Reading comprehension Skills Writing skills Skills Writing comprehension Abilities Writing ability Abilities Knowledge of language rules Knowledge Frequency using written matter Work context 4 General cognitive demands (�=0.97) Analytical thinking Work styles Critical thinking Skill Complex problem solving Skill Active learning Skill Analyzing data/information Work activities Processing information Work activities Thinking creatively Work activities Updating/using knowledge Work activities Deductive reasoning Abilities Inductive reasoning Abilities Fluency of ideas Abilities Category flexibility Abilities 5 Repetitive motions (time spent, 5-point single item) Work context 6 People skills (�=0.94) Persuasion Skill Negotiation Skill Speaking skills Skill Instructing skills Skill Service orientation Skill Dealing w/unpleasant or angry people Work context Dealing w/physically aggressive people Work context Conflict situations (frequency) Work context Dealing w/external customers/public Work context Face-to-face discussions (frequency) Work context Public speaking (frequency) Work context Resolving conflicts/negotiating w/others Work activities Communicating outside organization Work activities Working directly w/the public Work activities Training/teaching others Work activities Interpreting information for others Work activities Customer/personal service knowledge Knowledge Education/training knowledge Knowledge Social orientation Work styles Social perceptiveness Skill 7 Craft skills (�=0.95) Controlling machines/processes Work activities Repairing/maintaining mechanical equipment Work activities Repairing/maintaining electronic equipment Work activities Equipment maintenance Skill Troubleshooting operating errors Skill Repairing machines Skill Installing equipment, machines, wiring Skill 8 Gross physical requirements (�=0.97)
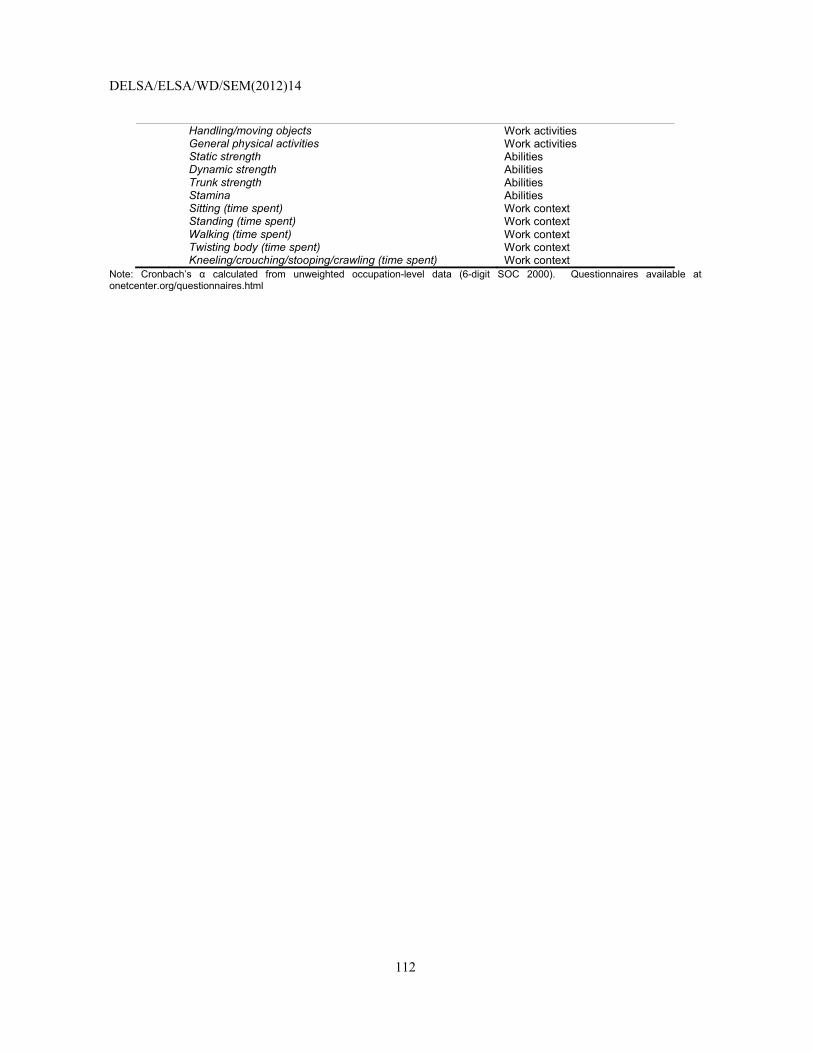
DELSA/ELSA/WD/SEM(2012)14
112
Handling/moving objects Work activities General physical activities Work activities Static strength Abilities Dynamic strength Abilities Trunk strength Abilities Stamina Abilities Sitting (time spent) Work context Standing (time spent) Work context Walking (time spent) Work context Twisting body (time spent) Work context Kneeling/crouching/stooping/crawling (time spent) Work context
Note: Cronbach’s � calculated from unweighted occupation-level data (6-digit SOC 2000). Questionnaires available at onetcenter.org/questionnaires.html

DELSA/ELSA/WD/SEM(2012)14
113
REFERENCES
Autor, D.H., F. Levy, and R.J. Murnane (2003), “The Skill Content of Recent Technological Change: An Empirical Exploration”, Quarterly Journal of Economics, Vol. 118, pp.1279-1333.
Autor, D.H., M.J. Handel (2009), "Putting Tasks to the Test: Human Capital, Job Tasks and Wages" NBER Working Paper, No. 15116, Cambridge, Mass.
Bell, D. (1973), “The Coming of Post-Industrial Society”, Basic Books, New York.
Blinder, A.S. (2006), “Offshoring: The Next Industrial Revolution?”, Foreign Affairs, March-April.
Bluestone, B. and B. Harrison (1982), “The Deindustrialization of America”, Basic Books, New York.
Braverman, H. (1974), “Labor and Monopoly Capital”, Monthly Review, New York.
Bresnahan, T.F., E. Brynjolfsson and L.M. Hitt (2002), “Information Technology, Workplace Organization, and the Demand for Skilled Labor: Firm-Level Evidence”, Quarterly Journal of Economics. Vol. 17, pp. 339-376.
Chandler, A.D. Jr. (1977), “The Visible Hand: The Managerial Revolution in American Business”, Harvard University Press, Cambridge, United States.
Colecchia, A. and G. Papaconstantinou (1996), “The Evolution of Skills in OECD Countries and the Role of Technology”, STI Working Paper 1996/8, OECD Publishing, Paris.
Cully, M. (2003), “Pathways to Knowledge Work”, National Centre for Vocational Educational Research, Kensington Park, Australia.
Elias, P. (2008), “ISCO 88 and its Pending Revision.” Presentation CESSDA PPP Expert Workshop on Harmonisation Issues in Comparative Social Surveys, Paris, April 2008, available at www.cessda.org/project/outputs/wp09workshop1, accessed September 23, 2010.
Elias, P. and M. Birch (2009), “SOC 2010: The Revision of the Standard Occupational Classification 2000”, Warwick Institute for Employment Research, May.
Elias, P. and A. McKnight (2001), “Skill Measurement in Official Statistics: Recent Developments in the UK and the Rest of Europe”, Oxford Economic Papers, Vol. 3, pp. 508-540.
Esping-Andersen, G. (1993), “Changing Classes: Stratification and Mobility in Post-Industrial Societies”, SAGE, Newbury Park, United States.
European Foundation for the Improvement of Living and Working Conditions (2008), “More and better jobs: Patterns of employment expansion in Europe.” Dublin, Ireland.
Feinstein, C. (1999), “Structural Change in the Developed Countries During the Twentieth Century.” Oxford Review of Economic Policy, Vol. 15, pp. 35-55.
DELSA/ELSA/WD/SEM(2012)14
114
Felstead, A., D. Gallie, F. Green, and Y. Zhou (2007), “Skills at Work, 1986-2006”, ESRC Centre on Skills, Knowledge and Organisational Performance, Universities of Oxford and Cardiff.
Gallie, D. (ed) (2007), “Employment Regimes and the Quality of Work”, Oxford University Press.
Ganzeboom, H.B.G. and D.J. Treiman (1996), “Internationally Comparable Measures of Occupational Status for the 1988 International Standard Classification of Occupations”, Social Science Research, Vol. 25, pp. 201-239.
Garson, B. (1988), “The Electronic Sweatshop: How Computers are Transforming the Office of the Future into the Factory of the Past”, Simon and Schuster, New York.
Goos, M. and A. Manning, (2007), “Lousy and Lovely Jobs: The Rising Polarization of Work in Britain”, Review of Economics and Statistics, Vol. 89, pp.118-133.
Goos, M., A. Manning and A. Salomons (2009), “Recent Changes in the European Employment Structure: The Roles of Technology and Globalization”, Manuscript.
Green, F. (2007), “Demanding Work: The Paradox of Job Quality in the Affluent Economy”, Princeton University Press, Princeton, New Jersey.
Green, F. (2010), “Employee Involvement, Technology, and Job Tasks”, Manuscript. Available at ftp.ukc.ac.uk/pub/ejr/RePEc/ukc/ukcedp/0903.pdf.
Halle, D. (1987), “America's Working Man: Work, Home, and Politics Among Blue Collar Property Owners”, University of Chicago Press, Chicago.
Handel, M.J. (2000), “Trends in Direct Measure of Skill”, Jerome Levy Economics Institute, Working Paper No. 301.
Handel, M.J. (2004), “Implications of Information Technology for Employment, Skills, and Wages: Findings from Sectoral and Case Study Research”, SRI International, Arlington, Virginia.
Handel, M.J. (2008), "Measuring Job Content: Skills, Technology, and Management Practices", Institute for Research on Poverty Discussion Paper No. 1357-08, University of Wisconsin, Madison, Wisconsin.
Handel, M.J. (2011a), “Trends in Job Skill Demands in OECD Countries: A Literature Review”, OECD Social, Employment and Migration Working Paper, forthcoming.
Handel, M.J. (2011b), "The O*NET Content Model: Strengths and Limitations”, Chapter in Job tasks, work skills and the labour market, OECD (forthcoming).
Handel, M.J. and D.I. Levine (2004), "The Effects of New Work Practices on Workers", Industrial Relations, Vol. 43, pp.1-43.
Harrison, B. and B. Bluestone (1988), “The Great U-Turn: Corporate Restructuring and the Polarizing of America”, Basic Books, New York.
Hartmann, H.I. (ed.) (1987), “Computer Chips and Paper Clips: Technology and Women's Employment. Volume II. Case Studies and Policy Perspectives”, National Academy Press, Washington, DC.
DELSA/ELSA/WD/SEM(2012)14
115
Heckman, J.J. and Y. Rubinstein (2001), “The Importance of Noncognitive Skills: Lessons from the GED Testing Program", American Economic Review, No. 91 May, pp. 145-149.
Hoffmann, E. (2003) “International Statistical Comparisons of Occupational and Social Structures: Problems, Possibilities and the Role of ISCO-88.” Pp.137-158 in Advances in Cross-National Comparison: A European Working Book for Demographic and Socio-Economic Variables, Jürgen H., P. Hoffmeyer-Zlotnik and Christof Wolf (eds.), Kluwer, New York.
Howell, D.R. and E.N. Wolff (1991), "Trends in the Growth and Distribution of Skills in the U.S. Workplace, 1960-1985", Industrial and Labor Relations Review, Vol. 44, No.3, pp.486-502.
Johnson, R.W. (2004), “Trends in Job Demands Among Older Workers, 1992-2002.” Monthly Labor Review”, July, pp. 48-56.
Kletzer, L.G. (2001), “Job Loss from Imports: Measuring the Costs”, Institute for International Economics, Washington, DC.
Lareau, A. (2003), “Unequal Childhoods: Class, Race, and Family Life”, University of California Press, Berkeley and Los Angeles.
Melman, S. (1951), “The Rise of Administrative Overhead in the Manufacturing Industries of the United States 1899-1947”, Oxford Economic Papers, (New Series), Vol. 3, pp. 62-112.
Mishel, L. and J. Bernstein (1998), "Technology and the Wage Structure: Has Technology's Impact Accelerated Since the 1970s?", Research in Labor Economics, Vol. 17, pp. 305-355.
National Research Council (2010), “A Database for a Changing Economy: Review of the Occupational Information Network (O*NET)”, Panel to Review the Occupational Information Network (O*NET). Tippins, N.T. and M. L. Hilton, (edits.), Committee on National Statistics, Division of Behavioral and Social Sciences and Education, The National Academies Press, Washington, DC.
OECD (1998), “OECD Data on Skills: Employment by Industry and Occupation”, STI Working Paper 4, OECD, Publishing, Paris.
Parent-Thirion, A., E. Fernández Macías, J. Hurley, and G. Vermeylen (2007), “Fourth European Working Conditions Survey”, European Foundation for the Improvement of Living and Working Conditions, Dublin, Ireland.
Quintini, G. (2011), “Right for the Job: Over-Qualified or Under-Skilled”, OECD Social, Employment and Migration Working Paper No. 120.
Reich, R.B. (1991), “The Work of Nations”, Alfred A. Knopf, New York.
Rosenthal, N.H. (1995), “The Nature of Occupational Employment Growth: 1983-93”, Monthly Labor Review, June, pp. 45-54.
Rytina, N. and S. Bianchi (1984), “Occupational Reclassification and Changes in Distribution by Gender”, Monthly Labor Review, March, pp. 11-17.
Schettkat, R. and L. Yocarini (2003), “The Shift to Services: A Review of the Literature”, IZA Discussion Paper 964, Bonn, Germany.

DELSA/ELSA/WD/SEM(2012)14
116
Steuerle, E., C. Spiro, and R.W. Johnson (1999), “Can Americans Work Longer?” Straight Talk on Social Security and Retirement Policy No. 5, Urban Institute. Washington, DC.
Taylor, P.J., W-D Li, K. Shi, and W.C. Borman, (2008), “The Transportability of Job Information Across Countries”, Personnel Psychology, Vol. 61, pp. 69-111.
Treiman, D.J. (1977), “Occupational Prestige in Comparative Perspective”, Academic Press, New York.
United Nations (1956), “Demographic Yearbook”, United Nations, New York.
U.S. Department of Labor, Employment and Training Administration, 199, The Revised handbook for analyzing jobs, Government Printing Office, Washington, DC.
Wölfl, A. (2005), “The Service Economy in OECD Countries” STI Working Paper 2005/3, OECD Publishing, Paris.
Zuboff, S. (1988), “In the Age of the Smart Machine: The Future of Work and Power”, Basic Books, New York.
DELSA/ELSA/WD/SEM(2012)14
117
OECD SOCIAL, EMPLOYMENT AND MIGRATION WORKING PAPERS
Most recent releases are:
No. 142 HELPING DISPLACED WORKERS BACK INTO JOBS AFTER A NATURAL DISASTER: RECENT EXPERIENCES IN OECD COUNTRIES Danielle Venn
No. 141 Forthcoming LABOUR MARKET EFFECTS OF PARENTAL LEAVE POLICIES IN OECD COUNTRIES Olivier Thévenon & Anne Solaz
No. 140 Forthcoming FATHERS’ LEAVE, FATHERS’ INVOLVEMENT AND CHILD DEVELOPMENT: ARE THEY RELATED? EVIDENCE FROM FOUR OECD COUNTRIES, Maria C. Huerta, Willem Adema, Jennifer Baxter, Wen-Jui Han, Mette Lausten, RaeHyuck Lee and Jane Waldfogel
No. 139 Forthcoming FLEXICURITY AND THE ECONOMIC CRISIS 2008-9 – EVIDENCE FROM DENMARK
Tor Eriksson
No. 138 Forthcoming EFFECTS OF REDUCING GENDER GAPS IN EDUCATION AND LABOUR FORCE PARTICIPATION ON ECONOMIC GROWTH IN THE OECD Olivier Thévenon, Nabil Ali, Willem Adema and Angelica Salvi del Pero
No. 137 Forthcoming THE DYNAMICS OF SOCIAL ASSISTANCE RECEIPT IN NORWAY Manudeep Bhuller and
Sebastian Königs No. 136 Forthcoming THE DYNAMICS OF SOCIAL ASSISTANCE RECEIPT IN GERMANY Sebastian Königs
No. 135 MONEY OR KINDERGARTEN? DISTRIBUTIVE EFFECTS OF CASH VERSUS IN-KIND FAMILY TRANSFERS FOR YOUNG CHILDREN Michael Förster and Gerlinde Verbist (2012)
No. 134 THE ROLE OF INSTITUTIONS AND FIRM HETEROGENEITY FOR LABOUR MARKET ADJUSTMENTS: CROSS-COUNTRY FIRM-LEVEL EVIDENCE Peter N. Gal (VU University Amsterdam), Alexander Hijzen and Zoltan Wolf
No. 133 CAPITAL’S GRABBING HAND? A CROSS-COUNTRY/CROSS-INDUSTRY ANALYSIS OF THE DECLINE OF THE LABOUR SHARE Andrea Bassanini and Thomas Manfredi (2012)
No. 132 INCOME DISTRIBUTION AND POVERTY IN RUSSIA Irinia Denisova (2012)
No. 131 ELIGIBILITY CRITERIA FOR UNEMPLOYMENT BENEFITS Danielle Venn (2012) No. 130 THE IMPACT OF PUBLICLY PROVIDED SERVICES ON THE DISTRIBUTION OF RESOURCES:
REVIEW OF NEW RESULTS AND METHODS Gerlinde Verbist, Michael Förster and Maria Vaalavuo (2012)
No. 127 THE LABOUR MARKET INTEGRATION OF IMMIGRANTS AND THEIR CHILDREN IN AUSTRIA
Karolin Krause and Thomas Liebig (2011) No. 126 ARE RECENT IMMIGRANTS DIFFERENT? A NEW PROFILE OF IMMIGRANTS IN THE OECD BASED ON DIOC 2005/06 Sarah Widmaier and Jean-Christophe Dumont (2011) No. 125 EARNINGS VOLATILITY AND ITS CONSEQUENCES FOR HOUSEHOLDS Danielle Venn (2011) No. 124 CRISIS, RECESSION AND THE WELFARE STATE Willem Adema, Pauline Fron and Maxime Ladaique (2011) No. 123 AGGREGATE EARNINGS AND MACROECONOMIC SHOCKS Andrea Bassanini (2011) No. 122 REDISTRIBUTION POLICY AND INEQUALITY REDUCTION IN OECD COUNTRIES: WHAT HAS CHANGED IN TWO DECADES? Herwig Immervoll, Linda Richardson (2011)
DELSA/ELSA/WD/SEM(2012)14
118
No. 121 OVER-QUALIFIED OR UNDER-SKILLED Glenda Quintini (2011) No. 120 RIGHT FOR THE JOB Glenda Quintini (2011) No.119 THE LABOUR MARKET EFFECTS OF UNEMPLOYMENT COMPENSATION IN BRAZIL
Alexander Hijzen (2011) No. 118 EARLY MATERNAL EMPLOYMENT AND CHILD DEVELOPMENT IN FIVE OECD COUNTRIES
Maria del Carmen Huerta, Willem Adema, Jennifer Baxter, Miles Corak, Mette Deding, Matthew C. Gray, Wen-Jui Han, Jane Waldfogel (2011)
No. 117 WHAT DRIVES INFLOWS INTO DISABILITY?EVIDENCE FROM THREE OECD COUNTRIES Ana Llena-Nozal and Theodora Xenogiani (2011) No. 116 COOKING, CARING AND VOLUNTEERING: UNPAID WORK AROUND THE WORLD Veerle Miranda (2011)
No. 115 THE ROLE OF SHORT-TIME WORK SCHEMES DURING THE 2008-09 RECESSION Alexander Hijzen and Danielle Venn (2010)
No. 114 INTERNATIONAL MIGRANTS IN DEVELOPED, EMERGING AND DEVELOPING COUNTRIES: AN EXTENDED PROFILE Jean-Christophe Dumont, Gilles Spielvogel and Sarah Widmaier (2010)
No. 113 ACTIVATION POLICIES IN JAPAN Nicola Duell, David Grubb, Shruti Singh and Peter Tergeist (2010)
No. 112 ACTIVATION POLICIES IN SWITZERLAND Nicola Duell and Peter Tergeist with contributions from Ursula Bazant and Sylvie Cimper (2010)
No. 111 ECONOMIC DETERMINANTS AND CONSEQUENCES OF CHILD MALTREATMENT Lawrence M. Berger, Jane Waldfogel (forthcoming)
No. 110 DISTRIBUTIONAL CONSEQUENCES OF LABOR DEMAND ADJUSTMENTS TO A DOWNTURN: A MODEL-BASED APPROACH WITH APPLICATION TO GERMANY 2008-09 Herwig Immervoll, Olivier Bargain, Andreas Peichl, Sebastian Siegloch (2010)
No. 109 DECOMPOSING NOTIONAL DEFINED-CONTRIBUTION PENSIONS: EXPERIENCE OF OECD COUNTRIES’ REFORMS Edward Whitehouse (2010)
No. 108 EARNINGS OF MEN AND WOMEN WORKING IN THE PRIVATE SECTOR: ENRICHED DATA FOR PENSIONS AND TAX-BENEFIT MODELING Anna Cristina D’Addio and Herwig Immervoll (2010)
No. 107 INSTITUTIONAL DETERMINANTS OF WORKER FLOWS: A CROSS-COUNTRY/CROSS-INDUSTRY APPROACH Andrea Bassanini, Andrea Garnero, Pascal Marianna, Sebastien Martin (2010)
No. 106 RISING YOUTH UNEMPLOYMENT DURING THE CRISIS: HOW TO PREVENT NEGATIVE LONG-TERM CONSEQUENCES ON A GENERATION? Stefano Scarpetta, Anne Sonnet and Thomas Manfredi (2010)
No. 105 TRENDS IN PENSION ELIGIBILITY AGES AND LIVE EXPECTANCY, 1950-2050 Rafal Chomik and Edward Whitehouse (2010)
No. 104 ISRAELI CHILD POLICY AND OUTCOMES John Gal, Mimi Ajzenstadt, Asher Ben-Arieh, Roni Holler and Nadine Zielinsky (2010)
No. 103 REFORMING POLICIES ON FOREIGN WORKERS IN ISRAEL Adriana Kemp (2010)
DELSA/ELSA/WD/SEM(2012)14
119
No. 102 LABOUR MARKET AND SOCIO-ECONOMIC OUTCOMES OF THE ARAB-ISRAELI POPULATION Jack Habib, Judith King, Asaf Ben Shoham, Abraham Wolde-Tsadick and Karen Lasky (2010)
No. 101 TRENDS IN SOUTH AFRICAN INCOME DISTRIBUTION AND POVERTY SINCE THE FALL OF APARTHEID Murray Leibbrandt, Ingrid Woolard, Arden Finn and Jonathan Argent (2010)
No. 100 MINIMUM-INCOME BENEFITS IN OECD COUNTRIES: POLICY DESIGN, EFFECTIVENESS AND CHALLENGES Herwig Immervoll (2009)
No. 99 HAPPINESS AND AGE CYCLES – RETURN TO START…? ON THE FUNCTIONAL RELATIONSHIP BETWEEN SUBJECTIVE WELL-BEING AND AGE Justina A.V. Fischer (2009)
No. 98 ACTIVATION POLICIES IN FINLAND Nicola Duell, David Grubb and Shruti Singh (2009)
No. 97 CHILDREN OF IMMIGRANTS IN THE LABOUR MARKETS OF EU AND OECD COUNTRIES: AN OVERVIEW Thomas Liebig and Sarah Widmaier (2009)
A full list of Social, Employment and Migration Working Papers is available at www.oecd.org/els/workingpapers.
Other series of working papers available from the OECD include: OECD Health Working Papers.