military technical college 11 international conference ... · proceedings of the 11th ... study for...
TRANSCRIPT
Proceedings of the 11th ICCAE-11 Conference, 19-21 April, 2016 CS 4
- 1 -
Military Technical College Kobry El-Kobbah,
Cairo, Egypt
11th International Conference on Civil and Architecture
Engineering ICCAE-11-2016
Impact of blast load on buried structure performance under different case studies
Ahmed A. Hassan1, Sherif A. Mazek1, Adel H. Salem2
Abstract In recent years, there have been numerous explosion catastrophes due to military and terrorist activities. Such accidents lead to damage structures and human casualties in military and urban areas. To protect structures and people against explosion accidents, more engineering insight on the explosion effect is required to study buried structure performance. However, the blast field test is expensive and risky to conduct. In this study, a nonlinear numerical model is proposed to understand the buried structure performance. The buried structure performance against impact of blast effect is analyzed under three case studies. The response of the buried structure is studied using 2-D finite element analysis (FEA) under the blast effect. The reviewed study cases are used to verify the proposed 2-D nonlinear numerical model. The parametric study is also conducted to choose the suitable numerical model so as to improve the buried structure performance. Different TNT explosive charges are used based on the different case studies. The blast effects on the buried structure are expressed in terms of maximum displacement at different points located at the numerical model and pressure-time history hitting the buried structures. The results obtained by the three case studies have a good agreement with those obtained by the proposed 2-D numerical model. Finally, the proposed 2-D numerical model can be used to give a good estimate to study the performance of the buried structure under the impact of blast loading.
Keywords Displacements, finite element analysis, blast wave, underground structure, CONWEP. ــــــــــــــــــــــــــــــــــــــــــــــــــــــــ1 Egyptian Armed Forces. 2 Professor of Structural Engineering, Civil Engineering Department, Ain Shams University, Cairo, Egypt.
Proceedings of the 11th ICCAE-11 Conference, 19-21 April, 2016 CS 4
- 2 -
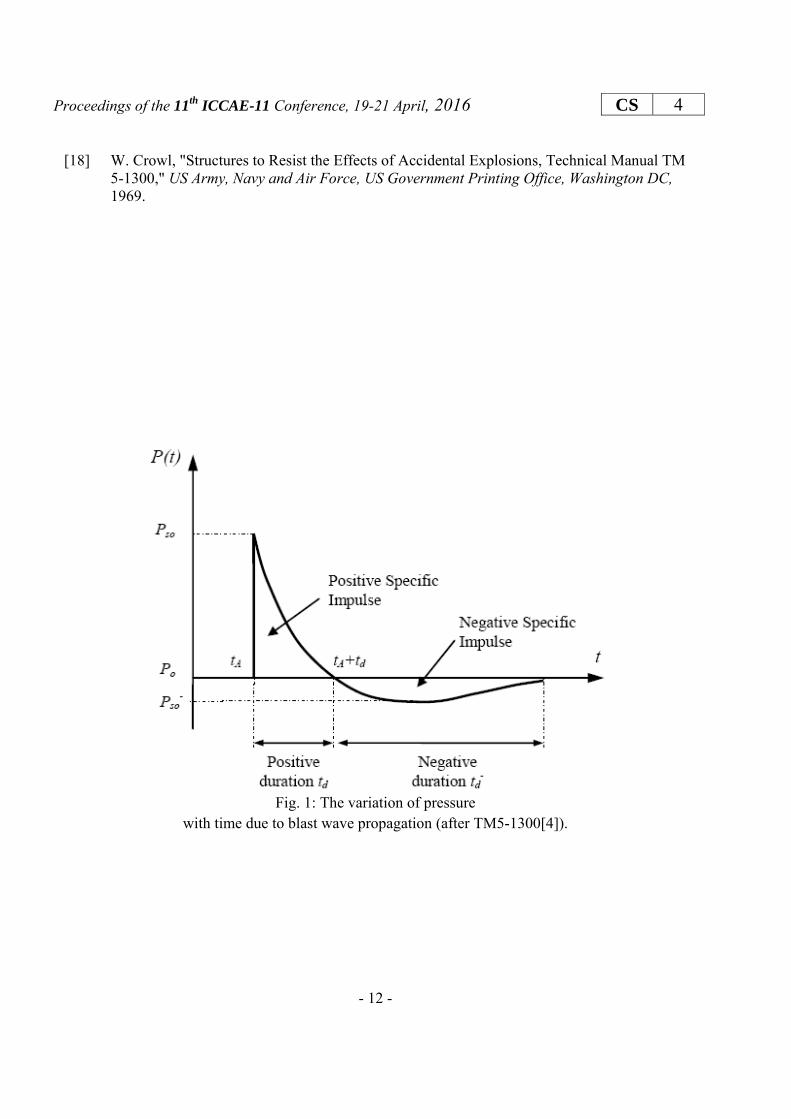
1. Introduction The dynamic response of underground structures under the effect of blast waves is an important study for military and civil engineering applications [1]. Underground fortified structures provide relatively effective protection for human and equipment from being injured and damaged by blast loads front to surface structures [2]. A ballistic attack affects a buried structure and surrounding soil characteristics. The four basic features of structure protection involve the establishment of a secure perimeter, the prevention of progressive collapse, the isolation of internal pressures from occupied spaces, and the mitigation of fragments resulting from the damaged facades [3]. Based on the progress of weapon penetration, subsurface detonation posed hazard to the buried structures which were considered safe decades ago. Based on a small stand-off distance, the structures may experience to major damage. The pressure variation with time due to a blast wave is shown in Fig. 1 [4]. As the explosive wave propagates in a radial direction from the initial charge, all structures and objects within its pathway are exposed to damage[5]. Ground shock parameters attenuate greatly as the distance from the accidental explosion increases [6]. The structure components are affected by the blast wave. While the intensity of the blast reduced with distance from the source, the range of damage depends on the charge weight, the relative position of the explosive device, and the design details [3]. From a structural point of view, the blast scenario can be subdivided into three phases. In the first phase, exterior walls, columns, and armored doors are affected. Floor slabs, roofs, and beams are affected in the second phase. In the third phase, the lateral load is resisted by frame action. Successful blast resistant design takes into account all three phases [3]. The finite element method is a powerful tool which could be used to analyze the soil structure interaction problem [7]. Complex structural configurations could be modeled using finite elements model and the response at any desired point of the structure can easily be determined [7]. In this paper, the finite element analysis program COSMOS/M [8] is used. The 2-D finite element analysis is adopted to study response of underground structure due to blast loading under the shadow of different case studies. Elasto-plastic model is chosen to model the behavior of the soil media and nonlinear model to model the concrete structure performance. The modeling of a blast load is represented as a short duration, high magnitude load acting around the buried structure. The parametric study is also conducted to study different soil depth underneath the invert of the buried structure is also discussed and varied from 2b to 6b to choose suitable model height. The results obtained by the 2-D FEA are compared with those obtained by three case studies proposed by Baylot [9], Guowei [10] and Mazek and El-khawanky [11] to evaluate the accuracy of
the 2-D finite element analysis.
2. First case study Baylot [9] studied the soil-structure interaction for a high explosive charge placed close to the wall
of a buried structure. The fortified structure was buried in dry sand soil. The
Proceedings of the 11th ICCAE-11 Conference, 19-21 April, 2016 CS 4
- 3 -
explosive source consisted of seven-kg C4 explosive charge. The C4 charge was placed opposite to the middle of the tested slab namely point (1), as shown in
Fig. 2. In these experiments, accelerometers and stress gauges were placed in the soil at various ranges from the charge to provide motion measurements. Accelerometer records
were used to record displacements. Data were only reported within 20 msec. Surrounding soil and underground structure had two different materials for concrete
and dry sand soil around underground structure. The dimensions of the first case study are shown in
Fig. 2.
2.1 Finite element model The numerical model should contain all necessary data of the different steps in the numerical
computation (geometry, elements, meshing, loads, boundary conditions, solution of equations, and output of results) [12]. The study adopted the techniques and procedures used in COSMOS/M
program [8] to create geometry model, to generate of finite element meshes, to establish boundary conditions, and to select the type of analysis. Thus, the basic steps in a finite element analysis are
shown in Fig. 3. The vertical boundaries of 2-D finite element model are restrained by roller supports to prevent a movement normal to the boundaries. The horizontal plane at the bottom of the mesh represented a rigid bedrock layer and the movement at this plane is restrained in all directions.
The movement at the upper horizontal plane is free to simulate a free ground surface, as shown in Fig. 4. The 2-D Plane strain element is used to represent the behavior of the concrete structure and
surrounding soil, as shown in Fig. 4.
2.2 Geometry building of numerical model The finite element modeling is applicable to all practical geometry models. The 2-D finite element
models is a soil block with width and height in X and Y directions, respectively, as shown in Fig. 4. The suitable geometric boundaries (model width and model height) are studied to reflect the
performance of underground structure subjected to blast effect. The study is also conducted to determine the optimum model width beyond which no changes in stresses and vertical
displacements are occurred. The 2-D FEA is used to choose suitable model width so as to realistically reflect the behavior of underground structure subjected to blast load. The model width (B) is varied from five times buried structure width 5b to 11b of buried structure width with model depth 3b of buried structure width. The results show that when the model width exceeds ten times
concrete model width (b) there is no change in displacement at point (1), which subjected to explosion as shown in
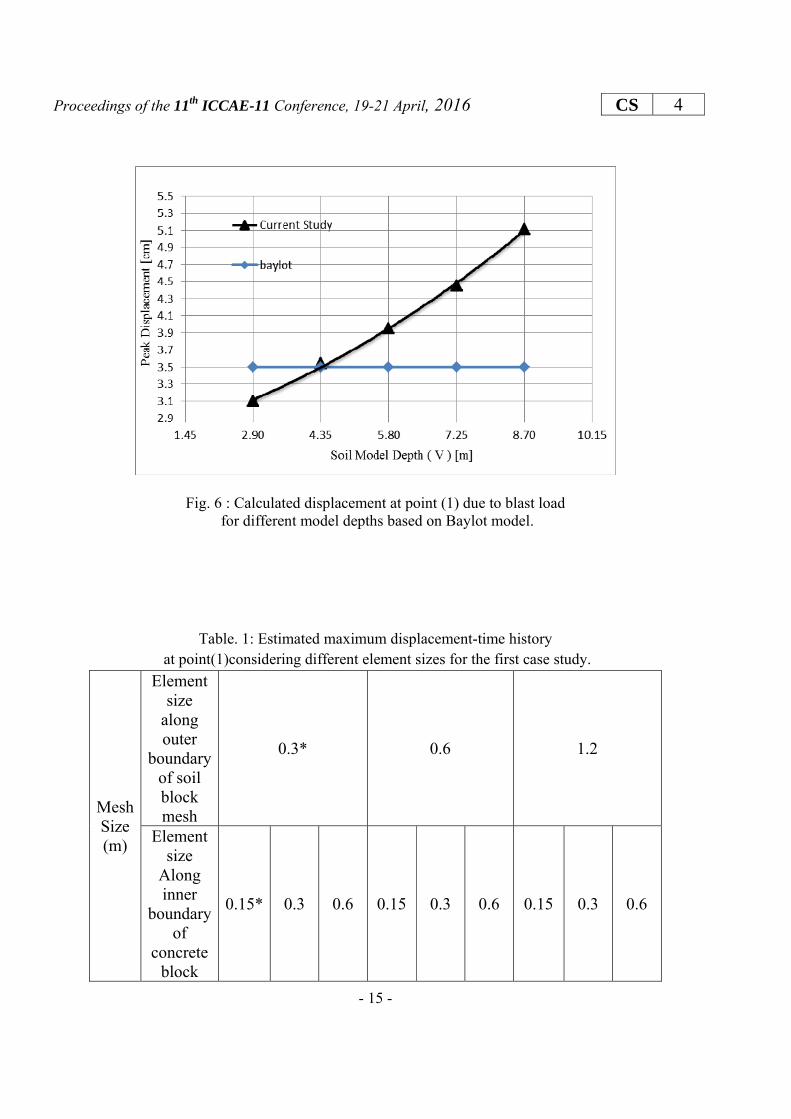
Fig. 5. Soil model depth (V) is also varied from three to six times 6b of buried structure width with the model width 10b of buried structure width is used to choose suitable model height to get the
optimum displacement value at point (1), as shown in Fig. 6. The ten times concrete width and the three times concrete width model depth are used in the analysis to compare the results obtained by 2-D FEA with the results obtained by Baylot [9]. The
Proceedings of the 11th ICCAE-11 Conference, 19-21 April, 2016 CS 4
- 4 -
finite element model width is chosen to be ten times the buried structure width. The finite element model height is chosen to be three times the buried structure width underneath the invert of the buried structure.
2.3 Mesh size The mesh size of 2-D FEM should be adopted to save time without affecting the result accuracy
[13]. The suitable mesh size is discussed to reflect the accurate performance of the underground structure subjected to blast load using the 2-D FEA. The element size is
varied from 0.3 m, 0.6 m, to1.2 m along the outer boundary of the soil block. The element size is also varied from 0.15 m, 0.3 m, to 0.6 m along perimeter of concrete structure. Based on different element sizes, the calculated maximum displacement at
point (1) is presented in
Table. 1. The 0.3- meter element size along the outer boundary of the soil block and 0.15- meter along perimeter of concrete structure are chosen for the rest and the suitable result of the
2-D FEA. As presented in
Table. 1 which proved more accuracy performance of the underground structure subjected to blast impact.
2.4 Material properties The performance of the concrete structure is modeled using nonlinear model [14] , as shown in Fig. 7. The constitutive model for the soil analysis utilizes elasto-plastic materials. A yielding function of the Mohr-Coulomb type and a plastic potential of function of the Drucker-Proger type are employed. The materials properties of concrete are taken in the finite element model (FEM) as follows: Modulus of elasticity E = 2.1x10⁶ t/m2, Poisson’s ratio = 0.17, Mass density = 0.255 t.sec2 /m4, the concrete ultimate strength, fc' (fc'=3000t/m2) and the ultimate strain, εo (the strain at stress of fc' in the uniaxial compression test, εo=0.003). The soil behavior is modeled by a Drucker-Prager model[15], in which, there are several parameters
required such as the friction angle ( ), the cohesion value (c), the modulus number (m), and the exponent number (j). These parameters such as the modulus number (m) and the exponent number (j) can be calculated by Janbu equation using the soil stress-strain relationship obtained from the triaxial test under different confining pressure ( ’). Janbu equation [16] described the relationship between the soil modulus (Mt) with the confining pressure.

Proceedings of the 11th ICCAE-11 Conference, 19-21 April, 2016 CS 4
- 5 -
1, j
tM m
……. (1)
Where (Mt) is the soil modulus, ( r) is the effective confining pressure, (m) is the modulus number, (j) is the exponent number, and ( r) is the value of atmospheric pressure expressed in appropriate units. The results obtained from the triaxial tests give the relation between the stress difference and corresponding axial strain. Drucker-Prager model can be used to simulate the behavior of soil materials such as sand, gravel, and clay. Regarding the nonlinear behavior, a Drucker-Prager model with exclusively elastic-perfectly plastic material response is chosen in this study because of number of reasons as simplicity and straightforward numerical implementation. This model is simple to use where parameters are obtained from the triaxial test under different confining pressure. The model parameters used for dry sand soil are taken in the FEM, as poisson’s ratio =
0.35, mass density = 0.1633 t.sec2 /m4, cohesion strength c = 0 and friction angle = 24o.
2.5 The load effect on the buried structure The load effects on the buried structure response are blast load and the soil media. The blast loads depend on charge weight (W), explosion depth (H), the depth of burial (DOB) and stand-off distance between the TNT charge and buried structure. Table. 2 shows the input data in CONWEP program [17] to obtain pressure time history affecting the buried structure.
3. Second case study Guowei [10] studied the analysis of underground protective structures using analytical technique based on TM5-855-1 and TM5-1300 [18]. A box-shaped underground buried structure subjected to a shock load on one side of the reinforced concrete structure (RC), and the dimensions of the wall
Proceedings of the 11th ICCAE-11 Conference, 19-21 April, 2016 CS 4
- 6 -
or floor under consideration, as shown in
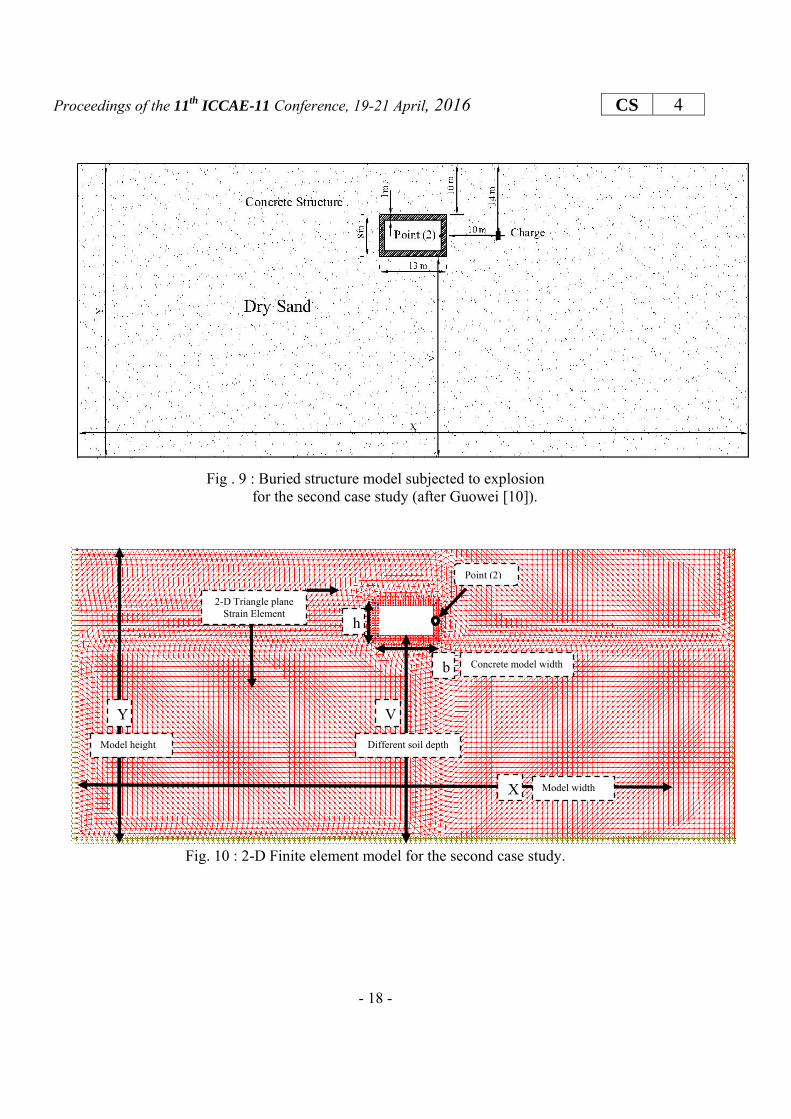
Fig . 9. The dry sand is used to be the surrounding soil around the structure. The soil structure interaction (SSI) is considered between the structural element and the surrounding soil. The explosion scenario is a scaled distance (stand-off distance divided by the cube root of the TNT equivalent charge weight) of 2 m/kg1/3 and TNT charge was placed opposite to the middle of the tested slab namely point (2), as shown in
Fig . 9. The burial depth is assumed to be sufficient so that there is no wave reflection from the ground surface.

Proceedings of the 11th ICCAE-11 Conference, 19-21 April, 2016 CS 4
- 7 -
3.1 Finite element model The study case adopts the techniques and procedures used in COSMOS/M program [8] to create geometry model, to generate finite element meshes, to establish boundary conditions, and to select the type of analysis to be compared with Guowei [10] model. The vertical boundaries of 2-D FEM are restrained by roller supports to prevent a movement normal to the boundaries[12]. The horizontal plane at the bottom of the mesh represented a rigid bedrock layer and the movement at this plane is restrained in all directions. The movement at the upper horizontal plane is free to simulate a free ground surface, as shown in Fig. 10. 2-D Plane strain element is used to represent the behavior of the concrete structure and surrounding soil, as shown in Fig. 10.
3.2 Geometry Building of Numerical Model The finite element modeling is applicable to all practical geometry models. The 2-D finite element mesh used in the analysis models a soil block with width and height in X and Y directions, respectively, as shown in Fig. 10. The suitable geometric boundaries (model width and model height) are studied to reflect the performance of underground structure subjected to blast effect. The study is also conducted to determine the optimum model width beyond, which no changes in stresses and vertical displacements are occurred. The 2-D FEA is used to choose suitable model width so as to realistically reflect the behavior of underground structure subjected to blast load. The soil model width is varied from 5b to 11b with the soil model depth (V) 3b. The results show that when the model width exceeds ten times concrete model width (b) there is no change in displacement at point (2), under blast effect as shown in Fig . 11. Soil model depth (V) is also varied from 2b to 6b with the soil model width of 10b. The finite element model is used to choose suitable model height to get the displacement at point (2), as shown in Fig. 12. The ten time concrete width and the three times concrete width model depth are used in the analysis to compare the results obtained by 2-D FEA with the results obtained by Guowei [10]. The finite element model width is chosen to be ten times the buried structure width. The finite element model height is chosen to be three times the buried structure width underneath the invert of the buried structure.
3.3 Mesh size The mesh size of 2-D FEM should be adopted to save time without affecting the result accuracy[13]. The suitable mesh size is discussed to reflect the performance of the underground structure subjected to blast load using the 2-D FEA. The element size is varied from 1 m, 3 m, to 5 m along the outer boundary of the soil block. The element size is also varied from 0.5m, 1.0m, to 1.5m along perimeter of concrete structure. Based on different element sizes, the calculated maximum displacement at point (2) is presented in Table. 4. The one-meter element size along the outer boundary of the soil block and half-meter element size along perimeter of concrete structure are chosen for the rest of the 2-D FEA, as presented in Table. 4 which proved more accuracy performance of the underground structure subjected to blast impact.
3.4 Material properties

Proceedings of the 11th ICCAE-11 Conference, 19-21 April, 2016 CS 4
- 8 -
The properties of concrete and concrete model were discussed above in the first case study. The soil behavior is modeled by a Drucker- Prager model as described above. The model parameters used for dry sand soil are taken in the finite element model, as poisson’s ratio = 0.35,
mass density = 0.1633 t.sec2 /m4, cohesion strength c = 0 and friction angle = 24o.
3.5 The load effect on the buried structure The load effects on the buried structure response are blast load and the soil media. The blast loads depend on charge weight (W), explosion depth (H), the depth of burial (DOB) and stand-off distance between the TNT charge and buried structure. Table. 5 shows the input data in CONWEP
program [17] to obtain pressure-time history affecting the buried structure.
4. Third case study Mazek and El-khawanky [11] studied a high explosive charge effect placed close to the roof of a buried structure. A box-shaped underground buried structure subjected to a shock load on one side of the reinforced concrete structure (RC), and the dimensions of the third case study are shown in Fig. 14. The structure was buried in dry sand soil. Fifty-kg TNT used to be source explosive charge. The TNT charge was placed opposite to the middle of the tested roof slab namely point (3) as shown in Fig. 14. In these experiments, accelerometers and stress gauges were placed in the soil at various ranges from the charge to provide motion measurements. Accelerometer records were used to record displacements. Data were only reported within 40 msec. Surrounding soil and underground structure had two different materials for concrete and dry sand soil around underground structure.
4.1 Finite element model The numerical model should contain all necessary data of the different steps in the numerical computation (geometry, elements, loads, boundary conditions, solution of equations, and output of results)[12]. The study adopted the techniques and procedures used in COSMOS/M program [8] to create geometry model, to generate of finite element meshes, to establish boundary conditions, and to select the type of analysis. Thus, the basic steps in a finite element analysis are shown in Fig. 3. The vertical boundaries of 2-D finite element model are restrained by roller supports to prevent a movement normal to the boundaries. The horizontal plane at the bottom of the mesh represented a rigid bedrock layer and the movement at this plane is restrained in all directions. The movement at the upper horizontal plane is free to simulate a free ground surface, as shown in Fig. 15. The 2-D Plane strain element is used to represent the behavior of the concrete structure and surrounding soil, as shown in Fig. 15.
4.2 Geometry building of numerical model The finite element modeling is applicable to all practical geometry models. The 2-D finite element models is a soil block with width and height in X and Y directions, respectively, as shown in Fig. 14. The suitable geometric boundaries (model width and model height) are studied to reflect the
Proceedings of the 11th ICCAE-11 Conference, 19-21 April, 2016 CS 4
- 9 -
performance of underground structure subjected to blast effect. The study is also conducted to determine the optimum model width beyond which no changes in stresses and vertical displacements are occurred. The 2-D FEA is used to choose suitable model width so as to realistically reflect the behavior of underground structure subjected to blast load. The soil model width is varied from 5b to 11b. The results show that when the model width exceeds ten times concrete model width (b) there is no change in displacement at point (3), under blast effect as shown in Fig. 15. Soil model depth (V) is also varied from 2b to 6b with the soil model width 10b. The finite element is used to choose suitable model height to get the displacement at point (3), as shown in Fig. 15. The ten times concrete width and the three times concrete width model height are used in the analysis to compare the results obtained by 2-D FEA and the results obtained by Mazek and El-khawanky [11]. The finite element model width is chosen to be ten times the buried structure width. The finite element model height is chosen to be three times the buried structure width underneath the invert of the buried structure.
4.3 Mesh size The mesh size of 2-D FEM should be adopted to save time without sacrificing the result accuracy [13]. The suitable mesh size is discussed to reflect the performance of the underground structure subjected to blast load using the 2-D FEA. The element size is varied from 0.5 m, 1 m, to 2 m along the outer boundary of the soil block. The element size is also varied from 0.25m, 0.5m, to 1.0m along perimeter of concrete structure. Based on different element sizes, the calculated maximum displacement at point (3) is presented in Table. 7. The half- meter element size along the outer boundary of the soil block and 0.25 meter along perimeter of concrete structure are chosen for the rest of the 2-D FEA, as presented in Table. 7 which proved more accuracy performance of the underground structure subjected to blast impact.
4.4 Material properties The properties of concrete and concrete model were discussed above in the first case study. The soil behavior is modeled by a Drucker- Prager model as described above. The model parameters used for dry sand soil are taken in the finite element model, as Poisson’s ratio = 0.35,
Mass density = 0.1633 t.sec2 /m4, Cohesion strength C = 0 and Friction angle = 24o.
4.5 The load effect on the buried structure The load effects on the buried structure response are blast load and the soil media. The blast loads depend on charge weight (W), explosion depth (H), the depth of burial (DOB) and stand-off distance between the TNT charge and buried structure. Table 8 shows the input data in CONWEP
program [17] to obtain pressure-time history affecting the buried structure.
5. Discussions For first case study displacement is calculated by the FEM due to different model widths as shown in Fig. 5 and different model depths, as shown in
Proceedings of the 11th ICCAE-11 Conference, 19-21 April, 2016 CS 4
- 10 -
Fig. 6 .The finite element model width is chosen to be ten times the buried structure width and the finite element model height is chosen to be three times the buried structure width underneath the invert of the buried structure. Estimated maximum displacement at point (1) considering different element sizes for the first case study is presented in
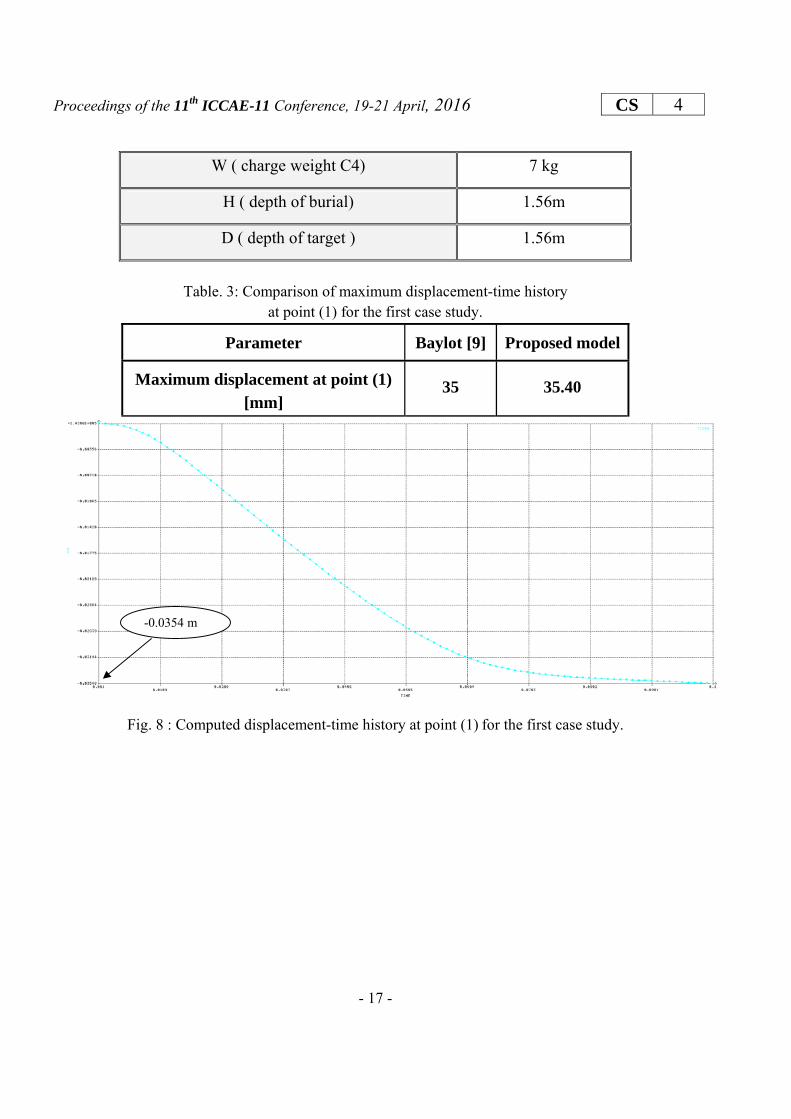
Table. 1.Maximum displacement at point (1) at 1.52 m from charge center obtained by the numerical analysis with those measured by the numerical model proposed by Baylot [9] at the same point as presented in Table. 3. The computed displacement time history at point (1) using the 2-D FEA as shown in Fig. 8 agrees better with this obtained by Baylot [9] model . For second case study displacement is calculated by the FEM due to different model widths as shown in Fig . 11 and different model depths, as shown in Fig. 12.The finite element model width is chosen to be ten times the buried structure width and the finite element model height is chosen to be three times the buried structure width underneath the invert of the buried structure. Estimated maximum displacement at point (2) considering different element sizes for the second case study is presented in Table. 4. Maximum displacement at point (2) at 4.31 m from charge center obtained by the numerical analysis with those measured by the numerical model proposed by Guowei [10] at the same point as presented in Table. 6. The computed displacement time history at point (2) using the 2-D FEA as shown in Fig. 13 agrees better with this obtained by Guowei [10] model. For third case study displacement is calculated by the FEM due to different model widths as shown in Fig. 16 and different model depths, as shown in Fig. 17. The finite element model width is chosen to be ten times the buried structure width and the finite element model height is chosen to be three times the buried structure width underneath the invert of the buried structure. Estimated maximum displacement at point (3) considering different element sizes for the second case study is presented in Table. 7. Maximum displacement at point (3) at 3 m from charge center obtained by the numerical analysis with those measured by the numerical model proposed by Mazek and El-khawanky [11] at the same point as presented in Table. 9.The computed displacement time history at point (3) using the 2-D FEA as shown in Fig. 18 agrees better with this obtained by Mazek and El-khawanky [11] model.
6. Results A 2-D nonlinear numerical model is an applicable model to predict the detailed performance
of the buried structure subjected to blast load.
The suitable geometric boundary is studied to reflect the performance of buried structure subjected to blast load.
The study is conducted to determine the suitable dimensions of soil model beyond which no changes in displacements occurred for different case studies. The suitable width (X) of the
Proceedings of the 11th ICCAE-11 Conference, 19-21 April, 2016 CS 4
- 11 -
2-D model is set at ten times buried structure width in 2-D FEA and the suitable depth (V) of the 2-D model under structure is set at three times buried structure width in the 2-D FEA .
The displacements calculated by the 2-D FEA are less than recorded displacements for different case studies. The predicted displacements underestimate by up to 1.1 % compared to the field blast tests recorded by different case studies.
7. Conclusions The 2-D FEA is a good numerical model to predict accurate performance of underground structure subjected to blast load. Finally, the 2-D FEA is applicable to use in engineering application so as to study behavior of underground structure subjected to blast impact.
References [1] J. M. Biggs and B. Testa, "Introduction to structural dynamics," 1964. [2] H. Zhou and G. Ma, "Double-layer floor to mitigate in-structure shock of underground
structures: A conceptual design," Engineering Structures, vol. 35, pp. 314-321, 2012. [3] Z. Yang, "Finite element simulation of response of buried shelters to blast loadings," Finite
Elements in Analysis and design, vol. 24, pp. 113-132, 1997. [4] A. Castellano, J. Caltagirone, F. Sock, and N. Dobbs, "Structures to resist the effect of
accidental explosions," US Department of the Army and Defense Special Weapons Agency, Washington DC, USA, Report UFC, vol. 3, pp. 340-02, 1990.
[5] L. B. Jayasinghe, D. Thambiratnam, N. J. Perera, and R. Jayasooriya, "Effect of soil properties on the response of pile to underground explosion," Structural Engineering International, vol. 24, pp. 361-370, 2014.
[6] D. Oehlers and R. Seracino, Design of FRP and steel plated RC structures: retrofitting beams and slabs for strength, stiffness and ductility: Elsevier, 2004.
[7] H. Ma, S. Quek, and K. Ang, "Soil–structure interaction effect from blast-induced horizontal and vertical ground vibration," Engineering Structures, vol. 26, pp. 1661-1675, 2004.
[8] COSMOS/M. A Finite Element Package developed by Structural Research and Analysis Corporation , version 2.6 Los Angeles , California , U.S.A .
[9] J. T. Baylot, "Effect of soil flow changes on structure loads," Journal of Structural Engineering, vol. 126, pp. 1434-1441, 2000.
[10] G. Ma, H. Zhou, Y. Lu, and K. Chong, "In-structure shock of underground structures: A theoretical approach," Engineering Structures, vol. 32, pp. 3836-3844, 2010.
[11] M. S. a. El-khawanky.T., "Experimental technical report on underground structure subjected to blast effect ." 2007.
[12] T. J. Hughes, The finite element method: linear static and dynamic finite element analysis: Courier Corporation, 2012.
[13] COSMOS/M, "A complete Finite Element Analysis System (COSMOS/M), "User's Guide"."
[14] J. C. McCormac and R. H. Brown, Design of reinforced concrete: John Wiley & Sons, 2015.
[15] H. Y. Fang, Foundation engineering handbook: Springer Science & Business Media, 2013. [16] B. Fellenius, "Basics of foundation design, a text book. Revised Electronic Edition," ed,
2011. [17] "CONWEP,"Conventional Weapons Effects Program"," 1992.
Proceedings of the 11th ICCAE-11 Conference, 19-21 April, 2016 CS 4
- 12 -
[18] W. Crowl, "Structures to Resist the Effects of Accidental Explosions, Technical Manual TM 5-1300," US Army, Navy and Air Force, US Government Printing Office, Washington DC, 1969.
Fig. 1: The variation of pressure
with time due to blast wave propagation (after TM5-1300[4]).

Proceedings of the 11th ICCAE-11 Conference, 19-21 April, 2016 CS 4
- 13 -
Fig. 2: Buried structure model subjected to explosion for the first case study (after baylot [9]).
Fig. 3: Finite element analysis steps.

Proceedings of the 11th ICCAE-11 Conference, 19-21 April, 2016 CS 4
- 14 -
Fig. 4 : 2-D Finite element model for the first case study.
Fig. 5 : Calculated displacement at point (1) due to blast load for different model widths based on Baylot model.
Point (1)
2-D Triangle plane Strain Element
V
X Model width
b Concrete width
Y
Different soil depth
Model height
h
Proceedings of the 11th ICCAE-11 Conference, 19-21 April, 2016 CS 4
- 15 -
Fig. 6 : Calculated displacement at point (1) due to blast load for different model depths based on Baylot model.
Table. 1: Estimated maximum displacement-time history at point(1)considering different element sizes for the first case study.
Mesh Size (m)
Element size
along outer
boundary of soil block mesh
0.3* 0.6 1.2
Element size
Along inner
boundary of
concrete block
0.15* 0.3 0.6 0.15 0.3 0.6 0.15 0.3 0.6

Proceedings of the 11th ICCAE-11 Conference, 19-21 April, 2016 CS 4
- 16 -
mesh
Maximum displacement at point (1)[mm] 3.
540
3.71
5
3.75
1
3.20
6
2.87
7
3.11
9
2.67
2
2.44
9
2.26
6
Fig. 7 : Stress-strain curve for concrete model [14] .
Table. 2: The input data to CONWEP [17] for the first case study.
f (Coupling factor) 0.99
C(Seismic velocity) 305 m/s
n(Attenuation coefficient) 2.75
ρ (Density of soil) 1633 kg/m3
R(horizontal range to target) 1.52m
Proceedings of the 11th ICCAE-11 Conference, 19-21 April, 2016 CS 4
- 17 -
W ( charge weight C4) 7 kg
H ( depth of burial) 1.56m
D ( depth of target ) 1.56m
Table. 3: Comparison of maximum displacement-time history
at point (1) for the first case study.
Parameter Baylot [9] Proposed model
Maximum displacement at point (1) [mm]
35 35.40
Fig. 8 : Computed displacement-time history at point (1) for the first case study.
-0.0354 m
Proceedings of the 11th ICCAE-11 Conference, 19-21 April, 2016 CS 4
- 18 -
Fig . 9 : Buried structure model subjected to explosion for the second case study (after Guowei [10]).
Fig. 10 : 2-D Finite element model for the second case study.
Point (2)
2-D Triangle plane Strain Element
V
X
Different soil depth
Model width
b Concrete model width
Y
Model height
h

Proceedings of the 11th ICCAE-11 Conference, 19-21 April, 2016 CS 4
- 19 -
Fig . 11: Measurment displacement at point (2) due to blast load
for different model widths based on Guowei model.
Fig. 12 : Calculated displacementat point (2) due to blast load
for different model depths based on Guowei model.

Proceedings of the 11th ICCAE-11 Conference, 19-21 April, 2016 CS 4
- 20 -
Table. 4: Estimated maximum displacement-time history at point (2) considering different element sizes for the second case study.
Mesh Size (m)
Element size
along outer
boundary of soil block mesh
1* 3 5
Element size
Along inner
boundary of
concrete block mesh
0.5* 1 1.5 0.5 1 1.5 0.5 1 1.5
Maximum displacement at point (1)[mm] 6.
720
5.65
2
4.24
3
6.60
7
5.59
9
3.94
8
6.57
3
5.45
4
3.92
2
Table. 5 : The input data to CONWEP [17] for the second case study.
f (Coupling factor) 0.99
C (Seismic velocity) 305 m/s
n (Attenuation coefficient) 2.75
ρ (Density of soil) 1633 kg/m3
R(horizontal range to target) 4.31m
W ( charge weight) 10 kg
H ( depth of burial) 16.4m
D ( depth of target ) 16.4m
Proceedings of the 11th ICCAE-11 Conference, 19-21 April, 2016 CS 4
- 21 -
Table. 6: Comparison of maximum displacement-time history
at point (2) for the second case study.
Parameter GUOWEI [10] Proposed model
Maximum displacement at point (2) [mm].
7mm 6.72mm
Fig. 13 : Computed displacement-time history at point (2) for second case study.
-0.00672 m
Proceedings of the 11th ICCAE-11 Conference, 19-21 April, 2016 CS 4
- 22 -
Fig. 14: Buried structure model subjected to explosion for third case study (Mazek and El-khawanky [11]).
Fig. 15 : 2-D Finite element model for the third case study.
2-D Triangle plane Strain Element
V
X Model width
b Concrete model width
Point (3)
Y
Model height
Different soil depth
h
Proceedings of the 11th ICCAE-11 Conference, 19-21 April, 2016 CS 4
- 23 -
Fig. 16: Calculated displacement at point (3) due to blast load for different model widths based on Mazek and El khawanky model.
Fig. 17 : Calculated displacement at point (3) due to blast load for different model depths based on Mazek and El khawanky model.
Proceedings of the 11th ICCAE-11 Conference, 19-21 April, 2016 CS 4
- 24 -
Table. 7: Estimated maximum displacement-time history
at point (3) considering different element sizes for the third case study.
Mesh Size (m)
Element size
along outer
boundary of soil block mesh
0.5* 1 2
Element size
Along inner
boundary of
concrete block mesh
0.25* 0.5 1 0.25 0.5 1 0.25 0.5 1
Maximum displacement at point (1)[cm] 5.
779
5.76
7
5.76
2
5.73
7
5.72
2
5.71
0
5.62
7
5.59
3
5.58
0
Table 8: The input data to CONWEP [17] for the third case study.
f (Coupling factor) 0.99
C (Seismic velocity) 305 m/s
n (Attenuation coefficient) 2.75
ρ (Density of soil) 1633 kg/m3
R(horizontal range to target) 0m
W ( charge weight) 50kg
H ( depth of burial) 3.0m
D ( depth of target ) 6.0m

Proceedings of the 11th ICCAE-11 Conference, 19-21 April, 2016 CS 4
- 25 -
Table. 9 : Comparison of maximum displacement-time history
at point (3) for the third case study.
Parameter Mazek and El-Khawanky [11]
Proposed model
Maximum displacement at point (3) [mm].
60mm 57.79mm
Fig. 18: Computed displacement-time history at point (3) for third case study.
-0.05779 m