milk and milk products november 2015 · 2015-12-22 · milk and milk products: price and trade...
TRANSCRIPT
Milk and milk products: price and trade update December 2015
Weekly Newsletter
Milk and Milk Products
Price and Trade Update: December 20151
INTERNATIONAL PRICES: Weak import demand causes prices to fall
After rising in September and October, limited buying interest resulted in international dairy
prices falling in November, a sign that major importers had accumulated adequate stocks for
their immediate needs. Quotations for butter and milk powders dropped, while those for cheese
were steady. Milk production in Oceania is anticipated to be lower for the current dairy year,
while output in the European Union is expected to be similar to last year.
The FAO Dairy Price Index averaged 151.1 points in November 2015, down 4.6 points (2.9
percent) from October. Compared with November 2014, quotations for all dairy products
covered in the Index were lower: falling by 21.1 percent to USD 1949 per tonne for skimmed
milk powder (SMP); by 18.2 percent to USD 3150 per tonne for cheddar cheese; by 10.3 percent
to USD 2420 per tonne for whole milk powder (WMP); and by 6.8 percent to USD 2978 per
tonne for butter.
1 The Milk and Milk Products: Price and Trade Update is prepared by the meat and dairy section of the Trade and Markets Division,
FAO. The present issue covers developments up to the end of November 2015.
Milk and Milk Products Price and Trade Update
December 2015

Milk and milk products: price and trade update December 2015
Trade Outlook: Overview
First decline in more than a decade
Trade in dairy products is forecast to fall by 1.2 percent in 2015 to 71.8 million tonnes of milk
equivalent, which would represent the first drop since 2001.
Although the majority of importing countries are expected to raise their level of importation in
2015, including Malaysia, the United States, the United Arab Emirates, Mexico, Venezuela,
Brazil, Egypt, Oman and Japan, a sharp downturn in China’s purchases, especially of WMP,
may cause total dairy trade to fall. Imports by the Russian Federation and, to a lesser extent,
Saudi Arabia and the EU, are also forecast to decline. Purchases by the Russian Federation are
predicted to fall markedly for the second year in a row, reflecting devaluation of the rouble,
along with the continuation of the ban imposed by the country in August 2014 on trade with
Australia, Canada, the EU, Norway and the United States, which has particularly affected
cheese.
Among exporters, high domestic prices in the United States and India, relative to those
prevailing in the world market, are anticipated to truncate external sales from these countries,
especially of skimmed milk powder. Deliveries by Argentina and New Zealand are also
expected to fall, following a contraction in output that was partly triggered by low world prices.
50
100
150
200
250
300
350
400
2008 2009 2010 2011 2012 2013 2014 2015
2002-2004=100
FAO Dairy Export Price Indices: 2008 - 2015
WMP
SMP
Cheese
Dairy Index
Butter

Milk and milk products: price and trade update December 2015
To a limited extent, a decline in exports by the above countries and elsewhere will be
counterbalanced by increased sales by Belarus, Australia and the EU.
0
2000
4000
6000
8000
10000
12000
14000
* Milk Equivalent, '000 tonnes
Milk and Milk Products Imports *
2013
2014
2015 f'cast
0
5000
10000
15000
20000
25000
New Zealand EU United States Belarus Australia Argentina
* Milk Equivalent, '000 tonnes
Milk and Milk Products Exports *
2013
2014
2015 f'cast
Milk and milk products: price and trade update December 2015
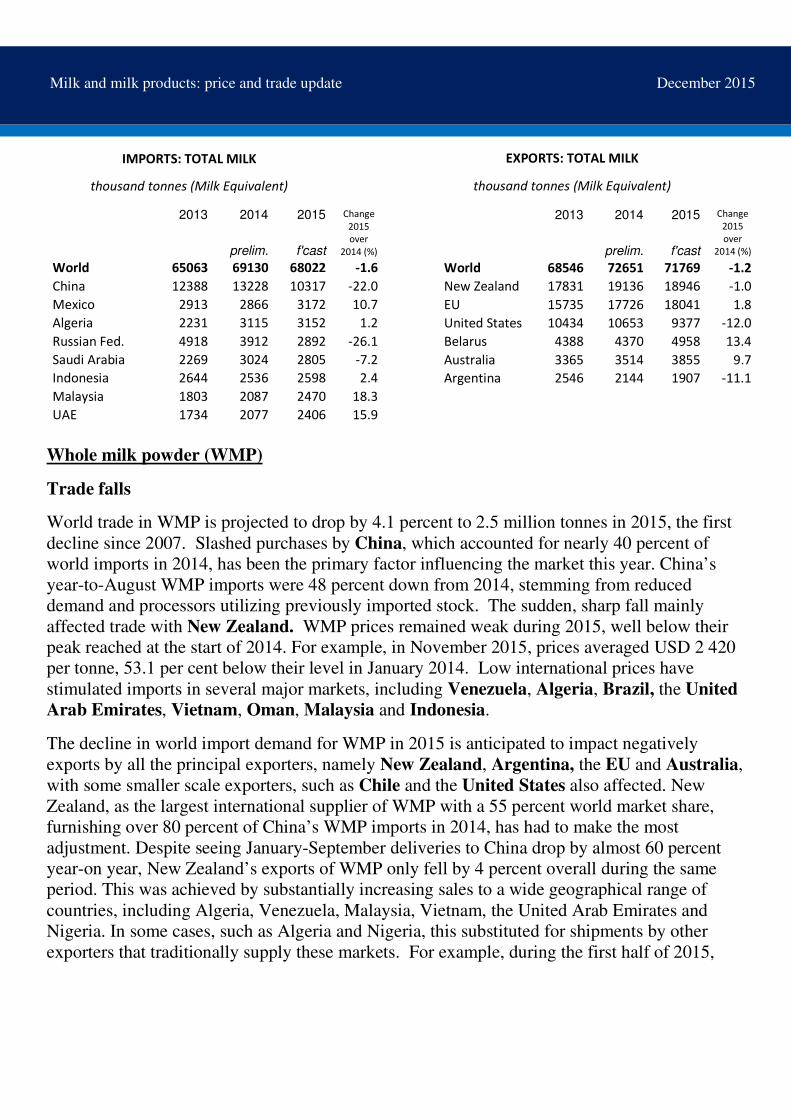
Whole milk powder (WMP)
Trade falls
World trade in WMP is projected to drop by 4.1 percent to 2.5 million tonnes in 2015, the first
decline since 2007. Slashed purchases by China, which accounted for nearly 40 percent of
world imports in 2014, has been the primary factor influencing the market this year. China’s
year-to-August WMP imports were 48 percent down from 2014, stemming from reduced
demand and processors utilizing previously imported stock. The sudden, sharp fall mainly
affected trade with New Zealand. WMP prices remained weak during 2015, well below their
peak reached at the start of 2014. For example, in November 2015, prices averaged USD 2 420
per tonne, 53.1 per cent below their level in January 2014. Low international prices have
stimulated imports in several major markets, including Venezuela, Algeria, Brazil, the United
Arab Emirates, Vietnam, Oman, Malaysia and Indonesia.
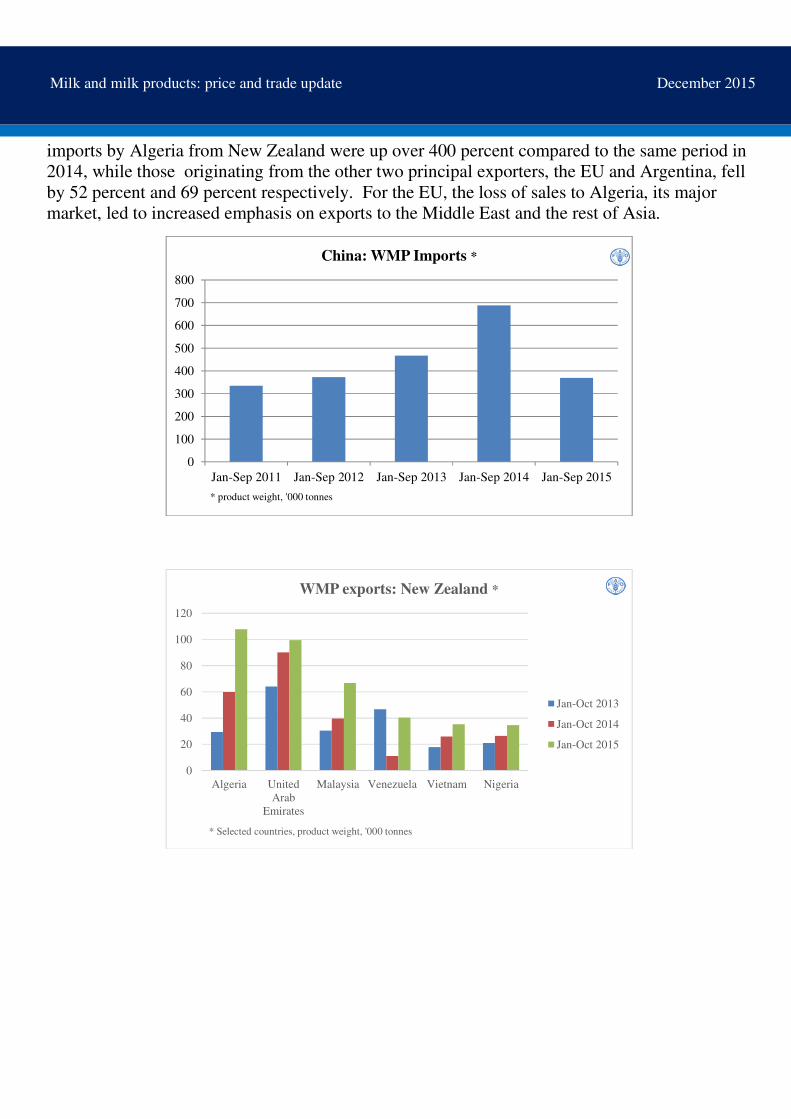
The decline in world import demand for WMP in 2015 is anticipated to impact negatively
exports by all the principal exporters, namely New Zealand, Argentina, the EU and Australia,
with some smaller scale exporters, such as Chile and the United States also affected. New
Zealand, as the largest international supplier of WMP with a 55 percent world market share,
furnishing over 80 percent of China’s WMP imports in 2014, has had to make the most
adjustment. Despite seeing January-September deliveries to China drop by almost 60 percent
year-on year, New Zealand’s exports of WMP only fell by 4 percent overall during the same
period. This was achieved by substantially increasing sales to a wide geographical range of
countries, including Algeria, Venezuela, Malaysia, Vietnam, the United Arab Emirates and
Nigeria. In some cases, such as Algeria and Nigeria, this substituted for shipments by other
exporters that traditionally supply these markets. For example, during the first half of 2015,
IMPORTS: TOTAL MILK
thousand tonnes (Milk Equivalent)
2013 2014 2015
Change
2015
over
2014 (%) prelim. f'cast
World 65063 69130 68022 -1.6
China 12388 13228 10317 -22.0
Mexico 2913 2866 3172 10.7
Algeria 2231 3115 3152 1.2
Russian Fed. 4918 3912 2892 -26.1
Saudi Arabia 2269 3024 2805 -7.2
Indonesia 2644 2536 2598 2.4
Malaysia 1803 2087 2470 18.3
UAE 1734 2077 2406 15.9
EXPORTS: TOTAL MILK
thousand tonnes (Milk Equivalent)
2013 2014 2015
Change
2015
over
2014 (%) prelim. f'cast
World 68546 72651 71769 -1.2
New Zealand 17831 19136 18946 -1.0
EU 15735 17726 18041 1.8
United States 10434 10653 9377 -12.0
Belarus 4388 4370 4958 13.4
Australia 3365 3514 3855 9.7
Argentina 2546 2144 1907 -11.1
Milk and milk products: price and trade update December 2015
imports by Algeria from New Zealand were up over 400 percent compared to the same period in
2014, while those originating from the other two principal exporters, the EU and Argentina, fell
by 52 percent and 69 percent respectively. For the EU, the loss of sales to Algeria, its major
market, led to increased emphasis on exports to the Middle East and the rest of Asia.
0
100
200
300
400
500
600
700
800
Jan-Sep 2011 Jan-Sep 2012 Jan-Sep 2013 Jan-Sep 2014 Jan-Sep 2015
* product weight, '000 tonnes
China: WMP Imports *
0
20
40
60
80
100
120
Algeria United
Arab
Emirates
Malaysia Venezuela Vietnam Nigeria
* Selected countries, product weight, '000 tonnes
WMP exports: New Zealand *
Jan-Oct 2013
Jan-Oct 2014
Jan-Oct 2015
Milk and milk products: price and trade update December 2015
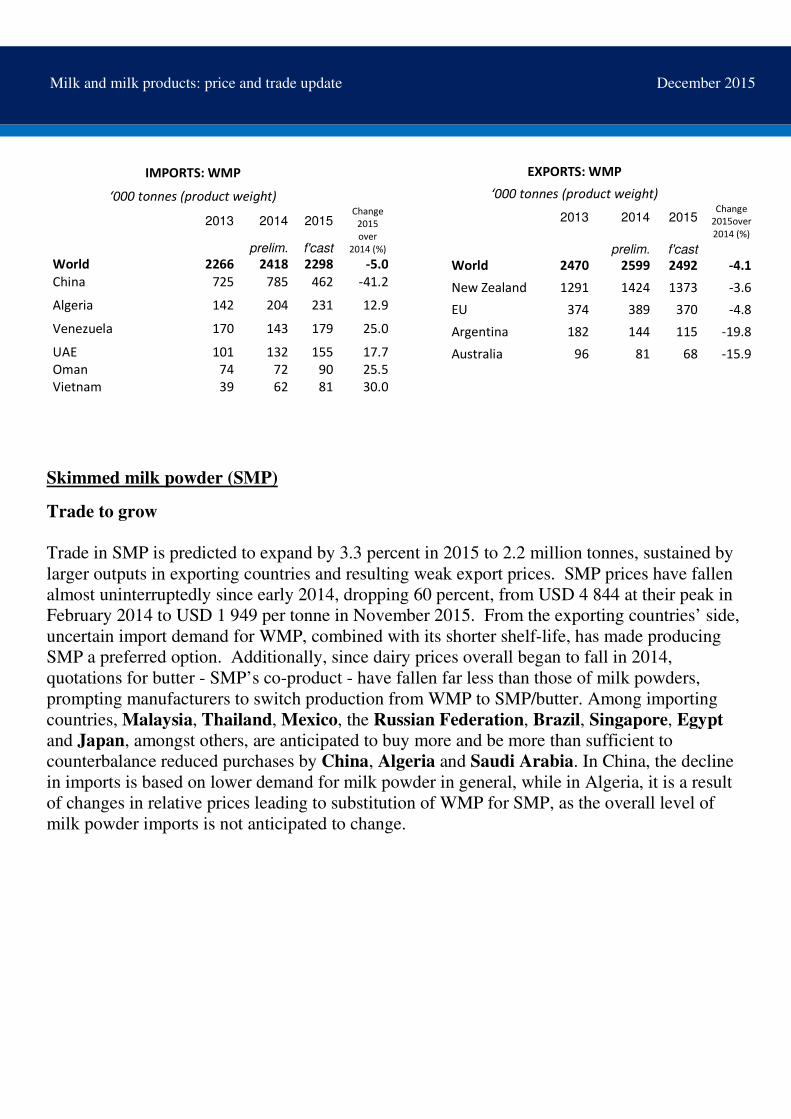
IMPORTS: WMP
‘000 tonnes (product weight)
2013 2014 2015
Change
2015
over
2014 (%) prelim. f'cast
World 2266 2418 2298 -5.0
China 725 785 462 -41.2
Algeria 142 204 231 12.9
Venezuela 170 143 179 25.0
UAE 101 132 155 17.7
Oman 74 72 90 25.5
Vietnam 39 62 81 30.0
Skimmed milk powder (SMP)
Trade to grow
Trade in SMP is predicted to expand by 3.3 percent in 2015 to 2.2 million tonnes, sustained by
larger outputs in exporting countries and resulting weak export prices. SMP prices have fallen
almost uninterruptedly since early 2014, dropping 60 percent, from USD 4 844 at their peak in
February 2014 to USD 1 949 per tonne in November 2015. From the exporting countries’ side,
uncertain import demand for WMP, combined with its shorter shelf-life, has made producing
SMP a preferred option. Additionally, since dairy prices overall began to fall in 2014,
quotations for butter - SMP’s co-product - have fallen far less than those of milk powders,
prompting manufacturers to switch production from WMP to SMP/butter. Among importing
countries, Malaysia, Thailand, Mexico, the Russian Federation, Brazil, Singapore, Egypt
and Japan, amongst others, are anticipated to buy more and be more than sufficient to
counterbalance reduced purchases by China, Algeria and Saudi Arabia. In China, the decline
in imports is based on lower demand for milk powder in general, while in Algeria, it is a result
of changes in relative prices leading to substitution of WMP for SMP, as the overall level of
milk powder imports is not anticipated to change.
EXPORTS: WMP
‘000 tonnes (product weight)
2013 2014 2015
Change
2015over
2014 (%)
prelim. f'cast
World 2470 2599 2492 -4.1
New Zealand 1291 1424 1373 -3.6
EU 374 389 370 -4.8
Argentina 182 144 115 -19.8
Australia 96 81 68 -15.9
Milk and milk products: price and trade update December 2015
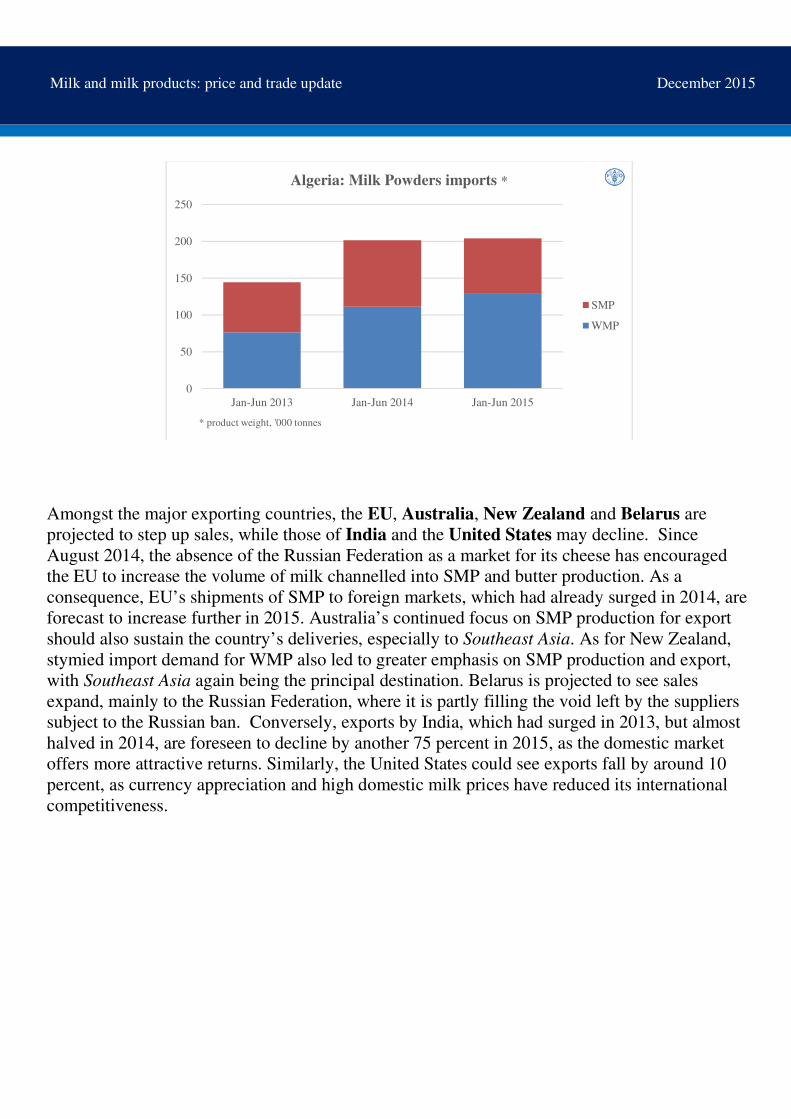
Amongst the major exporting countries, the EU, Australia, New Zealand and Belarus are
projected to step up sales, while those of India and the United States may decline. Since
August 2014, the absence of the Russian Federation as a market for its cheese has encouraged
the EU to increase the volume of milk channelled into SMP and butter production. As a
consequence, EU’s shipments of SMP to foreign markets, which had already surged in 2014, are
forecast to increase further in 2015. Australia’s continued focus on SMP production for export
should also sustain the country’s deliveries, especially to Southeast Asia. As for New Zealand,
stymied import demand for WMP also led to greater emphasis on SMP production and export,
with Southeast Asia again being the principal destination. Belarus is projected to see sales
expand, mainly to the Russian Federation, where it is partly filling the void left by the suppliers
subject to the Russian ban. Conversely, exports by India, which had surged in 2013, but almost
halved in 2014, are foreseen to decline by another 75 percent in 2015, as the domestic market
offers more attractive returns. Similarly, the United States could see exports fall by around 10
percent, as currency appreciation and high domestic milk prices have reduced its international
competitiveness.
0
50
100
150
200
250
Jan-Jun 2013 Jan-Jun 2014 Jan-Jun 2015
* product weight, '000 tonnes
Algeria: Milk Powders imports *
SMP
WMP

Milk and milk products: price and trade update December 2015
0
20
40
60
80
100
120
* product weight, '000 tonnes
EU: SMP exports *
Jan-Sep 2013
Jan-Sep 2014
Jan-Sep 2015
0
20
40
60
80
100
120
China Singapore Philippines Malaysia Indonesia Thailand
* product weight, '000 tonnes
New Zealand: SMP exports *
Jan-Oct 2014
Jan-Oct 2015
Milk and milk products: price and trade update December 2015
IMPORTS: SMP
‘000 tonnes (product weight)
2013 2014 2015 Change
2015
over
2014 (%) prelim. f'cast
World 1932 2070 2147 3.7
China 266 286 240 -16.2
Mexico 198 203 221 9.0
Malaysia 102 138 175 27.2
Algeria 120 168 148 -11.8
Indonesia 155 146 141 -3.6
Russian Fed. 131 95 109 15.0
EXPORTS: SMP
‘000 tonnes (product weight)
2013 2014 2015
Change
2015
over
2014 (%)
prelim. f'cast
World 1897 2129 2200 3.3
EU 407 646 698 8.0
United States 555 554 510 -8.0
New Zealand 392 383 420 9.7
Australia 119 164 213 30.2
Belarus 95 90 112 25.0
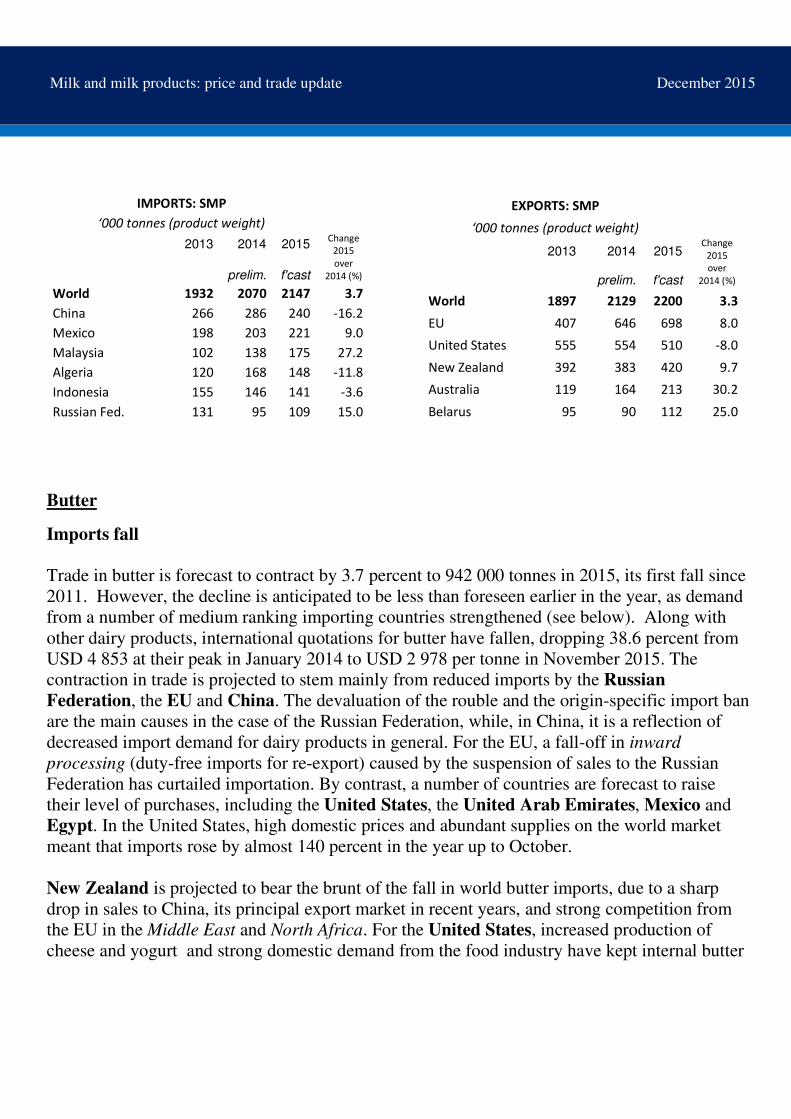
Butter
Imports fall
Trade in butter is forecast to contract by 3.7 percent to 942 000 tonnes in 2015, its first fall since
2011. However, the decline is anticipated to be less than foreseen earlier in the year, as demand
from a number of medium ranking importing countries strengthened (see below). Along with
other dairy products, international quotations for butter have fallen, dropping 38.6 percent from
USD 4 853 at their peak in January 2014 to USD 2 978 per tonne in November 2015. The
contraction in trade is projected to stem mainly from reduced imports by the Russian
Federation, the EU and China. The devaluation of the rouble and the origin-specific import ban
are the main causes in the case of the Russian Federation, while, in China, it is a reflection of
decreased import demand for dairy products in general. For the EU, a fall-off in inward
processing (duty-free imports for re-export) caused by the suspension of sales to the Russian
Federation has curtailed importation. By contrast, a number of countries are forecast to raise
their level of purchases, including the United States, the United Arab Emirates, Mexico and
Egypt. In the United States, high domestic prices and abundant supplies on the world market
meant that imports rose by almost 140 percent in the year up to October.
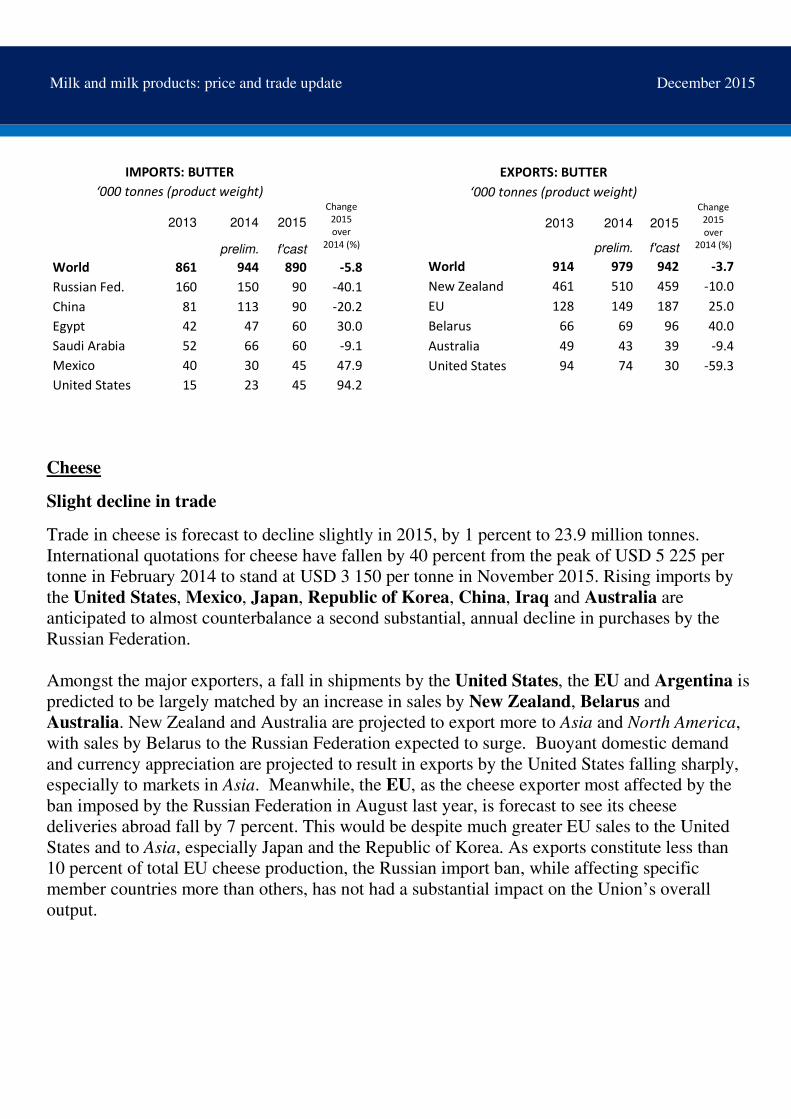
New Zealand is projected to bear the brunt of the fall in world butter imports, due to a sharp
drop in sales to China, its principal export market in recent years, and strong competition from
the EU in the Middle East and North Africa. For the United States, increased production of
cheese and yogurt and strong domestic demand from the food industry have kept internal butter

Milk and milk products: price and trade update December 2015
prices high, which is likely to depress US exports for the second year in a row: sales from
January to October were two-thirds lower than in the same period in 2014. Meanwhile, as the
devaluation of the Euro against several currencies has improved its competitiveness, EU exports
are expected to grow beyond last year’s substantial level. Elsewhere, Belarus and Uruguay may
gain from reduced competition in the Russian Federation’s market.
0
20
40
60
80
100
120
140
160
180
2011 2012 2013 2014 2015 f'cast
* Selected countries, product weight, '000 tonnes
Butter Imports *
Russian Fed.
China
Egypt
Mexico
United States
UAE
EU
0
10
20
30
40
50
60
70
80
* product weight, '000 tonnes
New Zealand: Butter exports *
Jan-Oct 2014
Jan-Oct 2015
Milk and milk products: price and trade update December 2015
IMPORTS: BUTTER
‘000 tonnes (product weight)
2013 2014 2015
Change
2015
over
2014 (%) prelim. f'cast
World 861 944 890 -5.8
Russian Fed. 160 150 90 -40.1
China 81 113 90 -20.2
Egypt 42 47 60 30.0
Saudi Arabia 52 66 60 -9.1
Mexico 40 30 45 47.9
United States 15 23 45 94.2
EXPORTS: BUTTER
‘000 tonnes (product weight)
2013 2014 2015
Change
2015
over
2014 (%) prelim. f'cast
World 914 979 942 -3.7
New Zealand 461 510 459 -10.0
EU 128 149 187 25.0
Belarus 66 69 96 40.0
Australia 49 43 39 -9.4
United States 94 74 30 -59.3
Cheese
Slight decline in trade
Trade in cheese is forecast to decline slightly in 2015, by 1 percent to 23.9 million tonnes.
International quotations for cheese have fallen by 40 percent from the peak of USD 5 225 per
tonne in February 2014 to stand at USD 3 150 per tonne in November 2015. Rising imports by
the United States, Mexico, Japan, Republic of Korea, China, Iraq and Australia are
anticipated to almost counterbalance a second substantial, annual decline in purchases by the
Russian Federation.
Amongst the major exporters, a fall in shipments by the United States, the EU and Argentina is
predicted to be largely matched by an increase in sales by New Zealand, Belarus and
Australia. New Zealand and Australia are projected to export more to Asia and North America,
with sales by Belarus to the Russian Federation expected to surge. Buoyant domestic demand
and currency appreciation are projected to result in exports by the United States falling sharply,
especially to markets in Asia. Meanwhile, the EU, as the cheese exporter most affected by the
ban imposed by the Russian Federation in August last year, is forecast to see its cheese
deliveries abroad fall by 7 percent. This would be despite much greater EU sales to the United
States and to Asia, especially Japan and the Republic of Korea. As exports constitute less than
10 percent of total EU cheese production, the Russian import ban, while affecting specific
member countries more than others, has not had a substantial impact on the Union’s overall
output.

Milk and milk products: price and trade update December 2015
0
50
100
150
200
250
300
350
400
450
500
2011 2012 2013 2014 2015 f'cast
* product weight, '000 tonnes
Cheese Imports *
Japan
United States
Russian Fed.
Saudi Arabia
Mexico
China
Rep. of Korea
0
50
100
150
200
250
300
* product weight, '000 tonnes
EU: Cheese exports *
Aug 12 -July 13
Aug 13- July 14
Aug 14- July 15

Milk and milk products: price and trade update December 2015
For comments or queries please use the following email contact: [email protected]
Use of material is subject to credit being given to source:
Milk and Milk Products: price and trade update
Trade and Markets Division
Food and Agriculture Organization of the United Nations
IMPORTS: CHEESE
‘000 tonnes (product weight)
2013 2014 2015
Change
2015 over
2014 (%)
prelim. f'cast
World 2268 2206 2182 -1.1
Japan 236 232 250 7.8
United States 148 165 206 25.0
Russian Fed. 462 316 176 -44.3
Saudi Arabia 134 148 138 -7.0
Mexico 103 99 118 19.0
China 87 108 114 6.2
Rep. of Korea 85 97 113 16.2
EXPORTS: CHEESE
‘000 tonnes (product weight)
2013 2014 2015 Change
2015
over
2014 (%) prelim. f'cast
World 2394 2410 2385 -1.0
EU 787 721 671 -6.9
New Zealand 277 278 327 17.7
United States 318 371 315 -15.0
Belarus 140 166 201 21.3
Australia 163 151 166 10.3
Saudi Arabia 111 115 120 4.3