milk dispensing machines in kenya’s dairy industry: trends
TRANSCRIPT

Milk Dispensing Machines in Kenya’s Dairy Industry: Trends and scenario analysis
Oscar Ingasia Ayuya, Dave Mwangi Ireri, Judy Kithinji, Asaah Ndambi, Catherine Kilelu, Bockline Omedo Bebe, Paul Ndung’u and Jan van der Lee
Together with our clients, we integrate scientific know-how and practical experience to develop livestock concepts for the 21st century. With our expertise on innovative livestock systems, nutrition, welfare, genetics and environmental impact of livestockfarming and our state-of-the art research facilities, such as Dairy Campus and Swine Innovation Centre Sterksel, we support our customers to find solutions for current and future challenges.
The mission of Wageningen UR (University & Research centre) is ‘To explore the potential of nature to improve the quality of life’. Within Wageningen UR, nine specialised research institutes of the DLO Foundation have joined forces with Wageningen University to help answer the most important questions in the domain of healthy food and living environment. With approximately 30 locations, 6,000 members of staff and 9,000 students, Wageningen UR is one of the leading organisations in its domain worldwide. The integral approach to problems and the cooperation between the various disciplines are at the heart of the unique Wageningen Approach.
Wageningen UR Livestock ResearchP.O. Box 65 8200 AB LelystadThe NetherlandsT +31 (0)320 23 82 38E [email protected]/livestockresearch
Livestock Research Report 0000ISSN 0000-000 3R Kenya Report 012
WLR Report 1253


Milk Dispensing Machines in Kenya’s Dairy Industry: Trends and scenario analysis
Oscar Ingasia Ayuya1,5, Dave Mwangi Ireri2,7, Judy Kithinji2, Asaah Ndambi3, Catherine Kilelu4, Bockline Omedo
Bebe5, Paul Ndung’u6 and Jan van der Lee3
1 AfriDev Economic Consulting Limited
2 Policy and Market Options
3 Wageningen UR Livestock Research
4 3R Kenya Project, ACTS
5 Egerton University
6 Kenya Dairy Board
7 Chuka University
This research was conducted by Wageningen Livestock Research, commissioned under the 3R Kenya project,
which is funded by the Embassy of the Kingdom of the Netherlands in Nairobi, Kenya, within the framework of
the Agriculture and Food & Nutrition Security program.
Wageningen Livestock Research
Wageningen, May 2020
3R Kenya Report 012
WLR Report 1253

Oscar Ingasia Ayuya, Dave Mwangi Ireri, Judy Kithinji, Asaah Ndambi, Catherine Kilelu, Bockline
Omedo Bebe, Paul Ndung’u and Jan van der Lee, 2020. Milk Dispensing Machines in Kenya’s Dairy
Industry: Trends and scenario analysis. 3R Kenya research report 012/Wageningen Livestock
Research, Report 1253.
Summary
This study analyses trends in the development of ATM milk retailing in Kenya, based on data collected
in six counties with high ATM density. Trends include growth in the ATM businesses and related
support services, consumer perceptions and demand and milk quality and safety issues in this milk
market segment. Building on the trends analysis, the second part of the study explores scenarios that
are likely to affect further growth of milk ATMs. The evidence is intended to inform the necessary
policy and regulatory framework that can support quality-driven investments in this growing retail
market segment.
This report can be downloaded for free at https://doi.org/10.18174/521451, at www.wur.nl/livestock-
research (under Wageningen Livestock Research publications) or at www.3r-kenya.org.
© 2020 Wageningen Livestock Research
P.O. Box 338, 6700 AH Wageningen, The Netherlands, T +31 (0)317 48 39 53,
E [email protected], www.wur.nl/livestock-research. Wageningen Livestock Research is
part of Wageningen University & Research.
All rights reserved. No part of this publication may be reproduced and/or made public, whether by
print, photocopy, microfilm or any other means, without the prior permission of the publisher or
author.
Wageningen Livestock Research is NEN-EN-ISO 9001:2015 certified.
All our research commissions are in line with the Terms and Conditions of the Animal Sciences Group.
These are filed with the District Court of Zwolle.
Wageningen Livestock Research Report 1253, 3R Kenya research report 012

Table of contents
Acknowledgements 7
Summary 9
1 Introduction 11
1.1 Background 11 1.2 Research objectives 12 1.3 Structure of the report 12
2 Methodology 13
2.1 Study area 13 2.2 Sampling and data collection 13
2.2.1 Survey of milk ATM operators and consumers 13 2.2.2 Key informant interviews 14
2.3 Scenario analysis method 14
3 Trends and development of milk ATMs 16
3.1 Geographical distribution of milk ATMs 16 3.2 Location of milk ATMs and related business models 17 3.3 ATM milk sales 18 3.4 ATM milk pricing and margins 19 3.5 Milk ATM businesses and employment 21
4 Consumer perceptions and quality aspects of ATM milk 22
4.1 Consumers’ milk purchasing patterns 22 4.2 Quality perception of ATM milk by consumers 26 4.3 Quality and safety assessment of milk dispensed in ATMs 27
4.3.1 Results of quality and safety of milk sampled for KDB surveillance 27 4.3.2 Selected studies on quality and safety of ATM milk 28
4.4 Best and poor practices along the milk ATM supply chain 29
5 Business ecosystem in the ATM market segment 32
5.1 Milk ATM technology business 32 5.1.1 Types of Milk ATM technologies offered by suppliers 32 5.1.2 Business development in the ATM milk supply chain 34 5.1.3 Suppliers of ATM milk 35
5.2 Milk ATM business licensing 38
6 Future development of the milk ATM supply chain: A scenario analysis 40
6.1 Enablers and disablers of ATM milk sector growth 40 6.2 Scenario analysis 41
6.2.1 Scenario 1: Business as usual 41 6.2.2 Scenario 2: Stronger regulatory framework leads to increased compliance
with KDB regulations 43 6.2.3 Scenario 3: Public ban on sale of raw milk in urban areas, leading to the
ATM market segment encroaching on the informal market segment 44
7 Conclusions and recommendations 46
References 48
Appendix 1 ATM sampling technique and extended scenario methodology 50
Appendix 2 Further analysis 55

List of tables
Table 1: Sample size distribution ........................................................................................... 14
Table 2: Overview of key informants interviewed ..................................................................... 14
Table 3: Business models for milk ATM businesses in Kenya ...................................................... 17
Table 4: Milk ATM sales patterns ........................................................................................... 18
Table 5: Quantity of ATM milk sold at different periods ............................................................. 19
Table 6: Geographical patterns in ATM average pricing and distance by ATM operators .................. 19
Table 7: Price comparison between ATM milk and other milk market segments............................. 20
Table 8: Indicative gross margin of milk ATM business .............................................................. 20
Table 9: Milk purchases and distance to ATM by male- and female-headed consumer households.... 24
Table 10: Quality perception of ATM milk by consumers ............................................................ 26
Table 11: EAC/Kenyan Standards for pasteurized and raw milk (2018) ....................................... 27
Table 12: Prevalence of detectable levels of antibiotic residues in milk from Eldoret ...................... 29
Table 13: Best practices and poor practices along the milk ATM supply chain ............................... 30
Table 14: Technology characteristics of milk ATMs supplied in Kenya .......................................... 33
Table 15: Enablers and disablers of future development of ATM milk supply chain ........................ 41
Table 16: Future projections in demand and supply of ATM milk in a business-as-usual scenario ..... 42
Table 17: Scenario with compliance rate changes through a stronger regulatory framework ........... 44
Table 18: Scenarios with public ban of raw milk in urban areas .................................................. 44
List of figures
Figure 1: Trend in setting up of licensed milk ATMs across Kenya ............................................... 16
Figure 2: Geographical distribution of milk ATMs ...................................................................... 17
Figure 3: Trainings received by milk ATM operators.................................................................. 21
Figure 4: Type of milk consumed in the past year (%) by income category .................................. 23
Figure 5: Type of milk consumed in the past one year (%) by gender ......................................... 23
Figure 6: Consumer purchasing patterns of ATM milk (%) by income bands ................................. 24
Figure 7: Reasons why consumers purchase ATM milk .............................................................. 25
Figure 8: Reasons why some consumers do not buy ATM milk ................................................... 25
Figure 9: What consumers prefer when choosing the point of ATM milk purchase ......................... 26
Figure 10: Milk test results of KDB surveillance data ................................................................ 28
Figure 11: Percentage milk of samples that do not meet standards ............................................ 28
Figure 12: Assessment of total viable count (TVC cfu/ml) at different points of the ATM ................ 29
Figure 13: Type of businesses developed around the ATM market segment ................................. 36
Figure 14: Source of ATM milk for ATM businesses ................................................................... 37
Figure 15: Nature of milk supplied to ATM operators ................................................................ 38
Figure 16: Contractual arrangements for supply of milk ............................................................ 38
Figure 17: Licensing of milk ATM businesses ........................................................................... 39
Figure 18: Trends in supply and demand of ATM milk over 10 years in business as usual scenario .. 43

List of photos
Photo 1: Milk ATM in a mini supermarket (left) and stand-alone milk ATM business (right) ............. 18
Photo 2: Illustration of the different ATM milk prices across operators ......................................... 19
Photo 3: Consumer purchasing ATM milk for home consumption (left) and a customer consuming at
milk ATM point (right) ........................................................................................................... 22
Photo 4: ATM milk operators using non-recommended milk cans in the ATM machine.................... 27
Photo 5: Sealed cans(left) and tamper-proof cans (right) used by some enterprises to secure the ATM
milk ................................................................................................................................... 30
Photo 6: Medical certificate issued by county government to milk ATM operators .......................... 31
Photo 7: Selected features in milk ATM retail market ................................................................ 33
Photo 8: Businesses selling non-dairy products (left) and dairy products (right) together with ATM
milk ................................................................................................................................... 35
Photo 9: Suka dairies cooperatives one of the suppliers of ATM milk in Nakuru ............................. 37
List of acronyms and abbreviations
ATM automated teller machine (milk-vending machine)
CIP cleaning-in-place
EAC East African Community
FAOSTAT Food and Agriculture Organization Corporate Statistical Database
GoK Government of Kenya
GSM global system for mobile communication
KDB Kenya Dairy Board
KEBS Kenya Bureau of Standards
KES Kenya shillings
KNBS Kenya National Bureau of Statistics
TBC total bacterial count
TCC total coliform count
TVC total viable count

3R Kenya Research Report 012 | Wageningen Livestock Research Report 1253 | 7
Acknowledgements
This research was conducted by Wageningen Livestock Research. The study was implemented by
Afridev Economic Consulting Limited, Policy & Market Options Limited (PMO) and the 3R research team
in collaboration with the Kenya Dairy Board. We are grateful to various stakeholders including selected
ATM operators, ATM machine suppliers, consumers, milk processors, county public health officials and
KDB inspectors for their cooperation in undertaking this study. We also thank the participants of the
policy roundtable meeting where the preliminary findings of the study were presented and during
which the scenarios were discussed and refined. We are also grateful to the field enumerators for their
support in data collection and in providing photos used in this report.
The 3R project is funded by the Embassy of the Kingdom of the Netherlands in Nairobi, Kenya, within
the framework of the Agriculture and Food & Nutrition Security program.

3R Kenya Research Report 012 | Wageningen Livestock Research Report 1253 | 8

3R Kenya Research Report 012 | Wageningen Livestock Research Report 1253 | 9
Summary
Urbanization, increasing population, rising income levels and changing dietary consumption patterns
are expected to increase demand for milk and dairy products in Kenya. The annual per capita milk
consumption of 110 litres is projected to double by the year 2030. Out of the 3.9 billion litres of cow
milk consumed, 2.1 billion litres (54%) is marketed. It is estimated that about 70% of the marketed
milk is traded informally, mostly in raw form, while the rest is processed into milk and dairy products
and marketed formally. There has been a recent technological and market development in milk
retailing in the formal milk market, called the milk-vending or dispensing machine (popularly known as
the milk ATM). There has been a widespread uptake of this innovative platform for milk retail in some
Kenyan urban and peri-urban areas.
The Kenya Dairy Board (KDB) and stakeholders in the milk ATM supply chain are engaged in a debate
on how to best develop the market segment while ensuring consumer access to quality and affordable
milk. There is therefore the need for empirical evidence on the likely growth trends in consumer
demand, as well as scenarios for factors that are likely to affect further growth trends. In addition, the
empirical evidence should inform decisions about what interventions would be relevant and supportive
to this milk retail market segment.
The research questions were:
1. What are the trends in the development of the ATM milk market segment?
2. What are key consumer patterns, quality and food safety issues related to the development of
milk ATM market segment?
3. What businesses have emerged around ATM milk market segment?
4. What are the potential scenarios that might affect the development of the ATM milk segment?
This study is based on primary data collected in the period between July and August 2019 from six
counties with a high density of milk ATMs according to KDB database, using mixed methods. Survey
questionnaires were administered on 162 ATM operators and 490 consumers (from which 352 were
considered to be of acceptable quality and analysed). Key informant interviews were conducted for
qualitative information with ATM machine suppliers, ATM milk processors, the Milk ATM Association,
KDB officials and KDB inspectors. Further, secondary data was obtained from the KDB database and
FAOSTAT and literature was reviewed to inform scenario development.
Major findings
Trends and development of ATMs over time
• About 74% of all ATMs are in Nairobi and its environs (including Kiambu, Machakos and Kajiado
counties) but we note a trend of the business spreading to other counties.
• The ATM milk market is expanding and accounts for about 16% of the milk traded in what is
characterised as the formal market.
• The current average consumer price per litre of raw milk is KES 54, ATM milk is KES 63 and
processed packaged milk is KES 93 and ultra-heated milk (UHT) is KES 110; this means that
packaged pasteurized and UHT milk on average are respectively 48% and 73% more expensive
than ATM milk, while ATM milk is 18% more expensive than raw milk. This positions ATM milk as
an emerging alternative to processed packaged milk contributing to expanding the formal market
of the Kenya dairy industry.
Consumer preferences, perceptions and quality issues related to ATM milk
• From the sample consumers, about 70% had consumed ATM mind only 17% of the population had
consumed raw milk. The consumption patterns varied by income categories. Those categorised as
high income only purchased packaged and ATM milk, while those in low and middle income
categories bought all milk types
• For consumers who currently buy ATM milk, the most (43%) notable reason for this purchase
choice was the affordability of ATM milk.
• Consumer preferences of the ATM point of purchase are based on milk quality, the reliability of
supply, favourable operation hours and cleanliness of the ATM premises.

3R Kenya Research Report 012 | Wageningen Livestock Research Report 1253 | 10
• Consumer concerns – including adulteration with preservatives, water and foreign materials – limit
their confidence in ATM milk.
• Presently, consumers trust the quality of milk from ATMs more than the quality of milk from
informal retail outlets (plastic), which should inform strategies to help milk from ATMs outcompete
milk from informal segment outlets in price and quality.
The ATM market segment and the business ecosystem
• The average volume of ATM milk bought is 1.06 litres per buyer per day.
• Almost all (99%) ATM operators sell pasteurized milk, and a majority of them (67%) have
contractual arrangements with a milk supplier (mainly processors, mini-processors and farmer
cooperatives). However, co-pasteurization business (where ATM operators source raw milk and
engage the services of a pasteurizer, for a fee) is developing, and self-pasteurization (where ATM
operators own pasteurizers to pasteurize their own milk) is emerging as an alternative model of
supplying milk to the ATMs.
• Importation of fully assembled ATM machines is falling, and there is an emerging trend of local
fabrication of ATM machines with importation of some components.
• Imported ATM machines cost about KES 1.2 million, while locally fabricated machines cost
between KES 120,000–700,000, depending on specifications and level of compliance with food
safety requirements. Besides the initial investment, ATM businesses incur other costs such as
licensing, branding and maintenance.
• Future technology demands for ATM machines, include improving their efficiency and
effectiveness, include use of food-grade materials, sales record memory, GSM messaging
systems, calibration accuracy, full automation and sensors indicating when the ATMs are running
low.
• It is estimated that there were 2030 ATMs in Kenya in 2019, creating direct employment along the
chain (each ATM employs 1.65 employees, which means 3350 employees in total, of whom 41%
are female), as well as indirect employment (transporters, servicing, branding, pasteurizing, etc.).
Future development and scenarios analysis for the milk ATM supply chain
• Based on trends since 2005, the ATM milk market segment is projected to grow threefold in 10
years, from the current 102 million litres to 343 million litres. The best-case scenario is that it will
grow by a factor of 4.38; in the worst-case scenario, the factor is 2.13.
• In a best-case scenario, where compliance has grown to 79% in the tenth year, the quantity
demanded and supplied would grow by a factor of 4.71 and 4.48 respectively. Higher demand and
supply result from increased consumer preference for ATM milk. However, laxity in ensuring
compliance by KDB would lead to mushrooming of non-compliant milk ATMs that would affect
consumer confidence.
• It is projected that with the impending milk ban in trade of raw milk in urban areas, the milk ATM
market segment will capture an extra 30% of urban milk consumers. The ban on trading raw milk
in urban areas has the potential to grow the ATM milk segment by a factor of about 6.
• The biggest potential for future expansion of the ATM milk market segment is by expanding into
the informal market segment.
Recommendations
• GoK could fast-track policy and regulations to remove unsafe operators and improve consumer
confidence in the ATM milk product in order to utilize its potential, mainly linked to its price
competitiveness, to be a game changer in the process of formalization of the milk marketing
sector.
• Consumer organizations and the public sector could sensitize consumers through various
campaigns and public media in assuring them of the market prospects for ATM milk, if quality
along the supply chain would improve.
• GoK could support KDB in strengthening its capacity in terms of enforcement officers, data
management systems, ATM milk traceability systems and appropriate systems for registering and
monitoring ATMs.
• With the investments already made by operators, the government regulations could facilitate the
supply chain, including a phased approach to stop the use of non-food-grade materials, to
safeguard the interest of the investors and move to regulated machines. On the supply side, key
enablers for the supply chain are enhancing growth of co-pasteurizers and building stronger
linkages between milk ATM machine operators.

3R Kenya Research Report 012 | Wageningen Livestock Research Report 1253 | 11
1 Introduction
1.1 Background
At approximately 110 litres per capita, Kenya’s milk consumption is five times higher than the average
of other sub-Saharan African countries. This pattern is expected to grow, as the per capita
consumption of milk and dairy products is projected to double by the year 2030, fuelled by
urbanization, rising income levels and changing dietary patterns (MoALF, 2010; Rademaker et al.,
2016). Currently, the annual milk production is about 5.2 billion litres, with the bulk being cow’s milk
(3.9 billion litres), and this is projected to grow to about 12.6 billion litres by 2030 (GoK, 2019; KDB-
supplied data, 2019). Over half of the milk produced (54%) is marketed, of which about 70% is traded
informally, mostly in raw form, while the rest is processed into milk and dairy products and sold
through formal markets (Kenya Markets Trust, 2019).
Quality and safety concerns of trade in raw milk are at the centre of debate in the dairy industry,
where stakeholders are divided over the push for formalization of the milk market in Kenya through
processing (Makoni et al., 2014; Rademaker et al., 2016; Alonso et al., 2018). The informal market
outlets in the dairy sector in Kenya are typified by high levels of non-compliance with food safety and
quality standards attributed to low investment in safe milk handling and poor adherence to standards
and regulations. However, the dominance of the informal market is linked to consumer preferences
and purchasing power as well as insufficient price and quality advantages of processed milk (Bebe et
al., 2018a; van der Lee et al., 2016). The concern over milk quality relates to the potential health
risks and public health-care burden of consuming unsafe milk (Ndambi et al., 2018) but also to how it
undermines the competitiveness of the Kenyan dairy sector (Makoni et al., 2014; van der Lee et al.,
2016).
While the government’s vision for the sector, articulated in the Kenya National Dairy Master Plan and
the Draft National Dairy Policy (MoALF, 2010; GoK, 2019), is to expand a formal processed chain in
the milk market and to improve milk quality, little headway has been made (van der Lee et al., 2016;
Makoni et al., 2014). The market share of the formal sector has been growing slowly to reach the
current estimated 30%. Milk delivered to processors increased from 535.7 million litres in 2017 to
634.3 million litres in 2018 (KNBS, 2019). The slow growth calls for diversified approaches to
upgrading of the informal sector, with the goal of expanding quality and safety-driven development
with appropriate safeguards (Makoni et al., 2014; Alonso et al., 2018). Accelerating transition to a
competitive, quality-driven industry requires exploring innovation and investment opportunities for
sustainable and inclusive sector development that will continue to contribute to food and nutrition
security, economic development and improved livelihoods.
The sector is embracing technological and marketing innovation to address quality issues along the
value chain (Gachango et al., 2014; KDB, 2016). Recently, some industry actors are experimenting
with integrating quality-based milk payment systems to control and improve milk quality along their
supply chains (Ndambi et al., 2018, 2019). An emerging market innovation is milk retailing through
vending machines (popularly known as “milk ATMs”), which are placed in strategic market locations
and sell chilled, pasteurized milk. Consumers bring their own containers, so they get affordable
access to processed milk that can be bought in flexible volumes as demanded (Bebe et al., 2018a;
Kosgey et al., 2018). The spread of milk ATMs has provided business opportunities to entrepreneurs
in urban centres, which indicates the potential for growing the formal market segment.
The current KDB strategic plan (KDB, 2016) recognizes ATMs as a technological and business
innovation that can contribute to delivering quality milk in the market. This mainly relates to
pasteurization and minimizing milk handling, which should enhance hygiene and assure quality and
safety to consumers (Bebe et al., 2018a). However, the growth in milk ATM businesses has occurred
in a context of regulatory gaps that has resulted in various compliance issues that raise concerns
about the safety of milk dispensed in ATMs (Bebe et al., 2018a; Kosgey et al., 2018). Currently, the
KDB is reviewing the regulations with the objective of enhancing compliance and to improve
consumer confidence in the industry. The emergence of milk ATMs as outlets for marketing processed
and affordable milk has the potential to transform and expand the formal market system. However,

3R Kenya Research Report 012 | Wageningen Livestock Research Report 1253 | 12
systematic information on current trends, drivers and factors that could inform the development of
the ATM market segment is scant.
1.2 Research objectives
Though the milk ATM market segment in Kenya is expanding and gaining attention in the industry,
there is limited empirical evidence about the growth trends, consumer perceptions and demands and
what scenarios and policy options are likely to affect its further development. This knowledge gap
informs the 3R Kenya study presented in this report.
Specifically, the study aimed to answer the following research questions:
1. What are the trends in the development of the ATM milk market segment?
2. What are the key consumer patterns, and quality and food safety issues related to the
development of the milk ATM market segment?
3. What businesses have emerged around the ATM milk market segment?
4. What are the potential scenarios that might affect the development of the ATM milk segment?
The insights of this study are intended to inform decisions about what interventions would be relevant
to and supportive of investment in this milk retail market segment.
1.3 Structure of the report
The remainder of this report is structured as follows. Chapter 2 explains the research methodology.
Chapter 3 describes trends in the development of the ATM milk market segment and Chapter 4
presents the consumer trends and perceptions related to the development of the milk ATM market
segment. Chapter 5 explores the business ecosystem that surrounds the ATM milk market segment in
Kenya and simulates the potential scenarios and their expected effect on development of the ATM
milk segment. Finally, Chapter 6 provides some conclusions and recommendations derived from this
study.

3R Kenya Research Report 012 | Wageningen Livestock Research Report 1253 | 13
2 Methodology
Chapter 2 overview
This chapter describes the study area and how the research was designed, including sampling and data
collection methods. The chapter provides details of the approach applied in studying the trends, consumer
perspectives, business ecosystems and in development of possible scenarios based on the past and current
trends in the ATM milk market segment.
2.1 Study area
The study was conducted in six counties with the highest density of registered milk ATMs, according
to 2018 KDB-supplied data (2019): Nairobi County (48% of all ATMs), Kiambu County (15%), Nakuru
County (11%), Kajiado County (7%), Uasin Gishu County (6%) and Machakos County (5%). Th rest
of the counties not included in this study accounted for 9% of the ATMs. In each county, areas with
high ATM concentration were then selected, informed by KDB data on registered milk ATMs.
The selected areas within each county were:
1. Nairobi county: Kariobangi, Kayole, Kawangware, Langata, Hurlinghum, Karen, Imara Daima,
Umoja 11, Kahawa West, Roysambu, Pangani, Nairobi West, Nairobi CBD and Zimmerman
2. Kiambu County: Githurai, Juja, Kikuyu town, Thika CBD, Phase 10, Witeithie, Ngoingwa and
Makongeni
3. Nakuru County: Nakuru CBD, Free area, Kaptembwa, Langa Langa, Olive Inn, Shabab,
London and White House
4. Uasin Gishu County: Eldoret CBD, Chepkoilel, West Indies and Maili Nne
5. Kajiado County: Kiserian, Rimpa, Ngong and Kitengela town
6. Machakos County: Athi River, Syokimau and Mlolongo.
Data was collected using mixed methods, including literature review, key informant interviews,
modified Delphi technique1, a survey of ATM milk chain actors and visual techniques including
photography.
2.2 Sampling and data collection
2.2.1 Survey of milk ATM operators and consumers
Two surveys were undertaken targeting consumers and milk ATM owners/operators. Quantitative and
qualitative tools/questionnaires were developed, taking into consideration the study objectives and
deliverables. A mobile (Android) phone data collection procedure was used for quantitative data,
implemented using the Open Data Kit platform. To sample ATM operators, first towns in each county
were selected using KDB-supplied data, 2019, and they were subdivided into location clusters
considering the dispersion of consumers based on their income status (low-, medium- and high-
income areas). After selection of the clusters in towns, milk ATM operators within the chosen clusters
were interviewed using random sampling to ensure the target number in each cluster was achieved.
A total of 490 individuals identified as milk consumers were randomly selected and interviewed at the
selected milk ATM sales point. For more details on the sampling technique, see Appendix 1. The
1 This involved a group of experts in the ATM market segment in a one-day meeting to validate the proposed scenarios
including their likelihood impact and behaviour of the actors. The discussions were used during reporting in section 5.

3R Kenya Research Report 012 | Wageningen Livestock Research Report 1253 | 14
number of milk consumers in each town was proportional to the number of sampled ATM machines,
except in Nairobi, which was oversampled because of the higher number of survey sites across
Nairobi County (Table 1).
Table 1 Sample size distribution.
Counties No. of registered milk
ATMs*
No. of sampled ATM
operators
No. of sampled
consumers
Nairobi 420 84 292
Nakuru 101 20 52
Kajiado 58 12 31
Machakos 45 9 23
Uasin Gishu 49 10 26
Kiambu 132 27 66
Total 805 162 490
*Source: KDB-supplied data, 2019
Note that only questionnaires where the respondent had identified themselves as being a household
head (352) were used for analysis, since they could provide the most complete information. Out of
the 352, 286 (representing about 81%) had bought ATM milk while 66 consumers (representing
about 19%) did not consume ATM milk in 2019.
2.2.2 Key informant interviews
Key informant interviews were conducted with suppliers of milk to ATMs, suppliers of ATM machines,
KDB inspectors at county levels, KDB officials at the headquarters and county public health officials.
Literature review and secondary data were used to establish the ATM milk quality and safety
attributes. Interview guides were used to interview key informants who were selected purposively
based on their acquaintance with the milk ATM supply chain. A summary of milk ATM stakeholders
interviewed is presented in Table 2.
Table 2 Overview of key informants interviewed.
Stakeholder type Number of interviews
KDB (headquarters) 1
KDB (inspectors at county levels) 5
Suppliers of milk to milk ATM operators 17
Suppliers of milk ATM machines 9
County public health officials 6
Total 38
2.3 Scenario analysis method
Scenario analysis was undertaken to consider future development of the ATM milk segment (research
question 4). It involved integration of secondary data from relevant institutions (KNBS, FAOSTAT,
KDB) and primary data from the surveys. After data collection and analysis, the scenarios were
developed and subjected to further discussions and validation using a modified Delphi technique, with
a small group of experts being used to validate the scenarios.
The scenarios were developed based on literature (MoALF, 2010; van der Lee et al., 2016; Ndambi et
al., 2018; GoK, 2019; Kenya Markets Trust, 2019) and the primary data that was collected. They are
anchored on the premise that the future is still in the making and is shaped by megatrends in existing

3R Kenya Research Report 012 | Wageningen Livestock Research Report 1253 | 15
opportunities and threats that will trigger development of the market segment. Based on the findings
from primary data, literature review and the stakeholder engagement (see Appendix 1, section A),
three scenarios were developed and simulated in MS Excel. See Appendix 1 section B for a description
of how the variables were generated.
Scenario 1: Business as usual
The business-as-usual scenario was determined and used as a starting point for other scenarios. This
scenario involved simulation of future trends, based on the current status of the ATM milk market
segment. The population demanding ATM milk and the number of ATMs were predicted using a
logistic growth function. Logistic growth was used because it is bounded by the carrying capacity,
unlike exponential growth that increases without limits.
Scenario 2: Stronger regulatory framework leading to increased compliance with KDB
regulations
The growth of the ATM market segment has taken off in an environment of inadequate regulations
and inadequate enforcement by KDB. Further, owing to the large amount of milk that is marketed
unprocessed and the weak monitoring of markets, there are concerns about public health risks
consequently undermining the emergence of a competitive dairy sector (Alonso et al., 2018; Makoni
et al., 2014; Ndambi et al., 2018). The regulator (KDB) is in the advanced stage of reviewing
regulations and the code of practice, which is likely to be a game changer in the industry in the near
future. With the impending approval of the regulations that will also govern the milk ATM market
segment, the scenario where the regulator would have a stronger basis for enforcement is likely,
therefore increasing compliance that could translate to higher consumer confidence in the quality and
safety of milk products. On the other hand, to comply, operators will need to increase investment
costs and operational costs, which are likely to be passed on to consumers.
Scenario 3: Public ban on the sale of raw milk in urban areas, leading the ATM market
segment to encroach on the informal market segment
It is estimated that currently, 30% of marketed milk is formal and 70% informal. One of the proposed
measures in the KDB regulations is a public ban on informal marketing of milk in urban areas. This
would mean that more of the informal milk traded would shift to formal milk, implying a demand
shift, which will subsequently trigger a supply shift. A public ban should come with a strong regulatory
framework as well, otherwise sales in the informal market would probably continue, regardless of the
ban. This means the ATM milk segment would start encroaching on the 70% of milk marketed
informally, which would be distributed between the processed packaged and processed ATM milk.

3R Kenya Research Report 012 | Wageningen Livestock Research Report 1253 | 16
3 Trends and development of milk ATMs
Chapter 3 overview
This chapter answers the first research question about trends in the development of the ATM milk market
segment in Kenya. The growth by number of ATMs over time, by business model and by geographical region
is presented to paint a picture of the segment while highlighting the sales patterns of ATM milk in the retail
market.
The establishment of milk ATM businesses has been growing in Kenya, as shown by KDB-supplied
data (Figure 1). The data reveal that the licensed milk ATM business started in 2005 and that growth
in the numbers gained momentum in 2010, peaking in 2018.
Figure 1 Trend in setting up of licensed milk ATMs across Kenya.
Source: KDB-supplied data, 2019
According to KDB-supplied data (2019), we were an estimated 1,550 milk ATMs in 2018, but only 883
were found recorded in the 2019 KDB database that was accessed for the study. This decline in
numbers may be due to KDB suspending the issue of licences for ATMs in 2018 in order to introduce
revised regulatory measures for milk.
However, of the 162 ATMs surveyed in this study, approximately 24% reported not ever registering
with KDB. Therefore, we extrapolate that 480 milk ATMs (representing 24% of 1,550) were not
registered in 2018. Therefore, the study estimates that in reality 2,030 ATMs were operational at the
start of 2019 nationally. A caveat is that there is lack of reliable and consistent data from KDB on the
ATM market retail outlets.
3.1 Geographical distribution of milk ATMs
From the survey data we note some geographical patterns in how milk ATM business has grown over
time. The general trend is that there is a higher concentration of ATMs in Nairobi, the densely
populated capital city, and the neighbouring Kiambu County (Figure 2). Nairobi County was the early
adopter of milk ATMs, before they spread into the other counties, and recently Kiambu County has
recorded significant growth in number of ATMs. Entrepreneurs tend to establish ATM businesses in
densely populated areas. Milk ATMs grew exponentially in 2017 across the different counties but
decreased from 2018, which confirms the initial findings in Figure 1.
-
300
600
900
1,200
1,500
1,800
2000 2005 2010 2015 2020
NU
MBER O
F L
ICEN
CED
MIL
K A
TM
S
YEARS

3R Kenya Research Report 012 | Wageningen Livestock Research Report 1253 | 17
Figure 2 Geographical distribution of milk ATMs.
Source: ATM operators survey data (n=162)
* means the data is representing a part of the year
3.2 Location of milk ATMs and related business models
The survey data provides an overview of where milk ATM businesses are located. About 21% are
located in supermarkets, and 79% are in other business premises (either stand-alone or as part of a
mixed retail shop). The majority (86%) operate from rented premises, while a few (7%) operate from
their own premises. Different rental arrangements were used, where some businesses paid a fixed
amount of rent and others paid a commission on sales volume.
The business models of milk ATM enterprises vary in relation to ownership structure, type of business
products and scale of operation (Table 3). The ownership structure of milk ATM businesses was very
diverse with the majority (79%) owned by sole proprietors, 17% owned by companies, 3% owned by
partnerships and 1% by cooperatives. Partnerships include individuals coming together to establish
the milk ATM business. On scale of operation, some milk ATM owners operated several machines in
different locations, but most (82%) ran a single machine.
Table 3 Business models for milk ATM businesses in Kenya.
Features Business models
Ownership ⮚ Owned by individual (79%)
⮚ Owned by company (17%)
⮚ Partnership (3%)
⮚ Owned by cooperatives (1%)
Type of business (products) ⮚ Only milk ATM (16%)
⮚ Milk ATM and trading other milk products, food and non-food products (84%)
Business operation ⮚ Running multiple machines in various places (18%)
⮚ Running a single machine (82%)
Source: Key informants, ATM operators survey data
Related to type of business, a few outlets sell ATM milk only (16%), but most (84%) have integrated
dairy products (such as yoghurt and buttermilk, locally known as “mala”), non-dairy food products
(such as eggs and bread) and non-food products (such as financial services and small electronic
devices like mobile phone accessories).
1 1
78
104 32 3
14
42
4
13
36
16
75
00
5
10
15
20
25
30
35
40
2012 2013 2014 2015 2016 2017 2018 2019*
Nu
mb
er o
f m
ilk A
TMs
Year
Nakuru Uasin Gishu Kiambu
Nairobi Machakos Kajiado

3R Kenya Research Report 012 | Wageningen Livestock Research Report 1253 | 18
Photo 1 Milk ATM in a mini supermarket (left) and stand-alone milk ATM business (right).
On business financing, most milk ATM operators (93%) acquired milk ATMs on cash payment, while
others used other means: credit (2%), acquired from various financial institutions; cost-sharing (1%),
which was done with other parties; leasing (1%) from the supplier or a different machine owner; hire
purchase (1%); and getting them as a gift (1%).
3.3 ATM milk sales
The results show that each ATM sells approximately 140 litres of milk daily (Table 4). Based on this
average, we can infer that an estimated 102 million litres of milk are sold through the ATM outlets
annually (average of 140 litres per day from approximately 2,030 milk ATMs nationally, assuming
sales on 360 days in a year). This represents about 16% of the formal processed milk (102 million
litres of 634 million litres marketed formally in 2018), thus contributing to expanding the formal milk
market in the country by about 5% of the total milk marketed.
Table 4 Milk ATM sales patterns.
Sales characteristics Mean
Average daily sales (in litres) 140
Average sales to individuals (% of total) 84.32
Average sales to institutions (% of total) 12.78
Average milk consumed in the business or by the owner (% of total) 2.89
Source: ATM operator survey data (n=162)
About 84% of the ATM milk volume is sold to individual customers, while 13% of the volume is sold to
institutions such as hotels, schools and hospitals (Table 4). Additionally, 3% of the volume is used by
the business for consumption (as tea or for drinking by employees at work) and by the owner for
home consumption.
Table 5 presents the quantity of ATM milk sold at different time periods by ATM operators. Milk is not
evenly demanded throughout the year, as indicated by seasonal peak volumes. On average, stable
normal milk demand runs for seven months with an average demand of 147 litres per day.

3R Kenya Research Report 012 | Wageningen Livestock Research Report 1253 | 19
Table 5 Quantity of ATM milk sold at different periods.
Characteristic Mean
Average number of normal months (number) 7.25
Average number of off-peak months (number) 1.76
Average number of peak months (number) 2.99
Average volume sold in normal months (in litres per ATM per day) 146.94
Average volume sold in off-peak months (in litres per ATM per day) 99.22
Average volume sold in peak months (in litres per ATM per day) 175.72
Source: ATM operator survey data (n=162)
3.4 ATM milk pricing and margins
Milk sold through ATMs is priced differently across the geographical regions, with price ranging
between KES 50 and KES 80 and a mean of KES 63.4 per litre (Table 6 and Table 7). Milk pricing
differed significantly across the counties. In Machakos County, ATM milk was priced the highest
(KES 70.6). This could be because most of the milk sold within the county is produced and processed
outside the county, as reflected by a high purchase price of KES 57 per litre from the supplier and the
longer distances (210 driving minutes) to ATM milk suppliers.
Table 6 Geographical patterns in ATM average pricing and distance by ATM operators
Naku
ru
Uasin
Gis
hu
Kia
mb
u
Nair
ob
i
Mach
ako
s
Kaji
ad
o
Overall
F S
tati
sti
cs
Average selling price of ATM milk
per litre
63.2 62.5 61.8 63.9 70.6 60.5 63.4 1.54
Average buying price of ATM milk
from main supplier per litre
49.7 49.2 52.9 52.5 57.1 50.1 50.9 4.37**
*
Average distance to main milk
supplier (driving minutes)
41.2 25.0 61.3 90.4 210.0 106.7 78.3 8.51**
*
Source: ATM operator survey data (n=162) ***Indicate a statistical difference at the p=0.01 level.
Photo 2: Illustration of the different ATM milk prices across operators
The retail prices of ATM milk differed in comparison with other milk products (Table 7). The price of
ultraheat treated (UHT) milk was the highest at an average of KES 109.7 per litre, while that of
pasteurized packaged milk was KES 92.9. This makes UHT and packaged pasteurized milk on average
respectively 73% and 48% more expensive than ATM milk (KES 63.4) . On the other hand, raw milk
sold informally by traders to consumers was sold at an average of KES 53.8, which makes ATM milk
18% more expensive than raw milk. This confirms what was noted by some ATM operators: raw milk
remains their major price competitor and impediment for growth.

3R Kenya Research Report 012 | Wageningen Livestock Research Report 1253 | 20
Table 7 Price comparison between ATM milk and other milk market segments.
Mean Minimum Maximum
Price of UHT milk per litre 109.7 94.0 150.0
Price of packaged pasteurized milk per litre 92.9 88.0 120.0
Retail price of raw milk per litre 53.8 35.0 70.0
Price of ATM milk per litre 63.4 50.0 80.0
Source: ATM operator survey data (n=162)
Table 8 presents an indicative gross margin based on a case study of an ATM business in Nakuru
County. The business sources raw milk and pasteurizes it before taking it to the milk ATM outlet
located in Nakuru central business district (CBD). On average the business sells about 270 litres per
day at an average price of KES 55 per litre. The cost items are also indicated; they include purchase of
milk, transportation costs, labour, rental, utilities (electricity and water), licensing (County trade
permit, advertisement permit, County public health permit for the premise, milk-handling certificate
for the operators from County public health and the KDB permit).
Table 8 Indicative gross margin of milk ATM business.
Item and description Amount (KES)
Revenue
Annual quantity sold (270 litres per day * 360 days) 97,200
Price per litre 55
Sales revenue in KES 5,346,000
Costs
Purchase of raw milk (KES 35/L for 97,200 litres) 3,402,000
Cost of pasteurization (KES 5/L for 97,200 litres) 486,000
Transportation of pasteurized milk to the ATM (KES 3/L for 97,200 litres ) 291,600
Labour costs (2 employees @ KES 9,000 per month) 216,000
Rent cost (KES 12,000/month for 12 months) 144,000
Water and electricity (KES 6,000/month for 12 months) 72,000
Trade license (annual) 9,000
County advertisement (annual) 6,000
KDB license (annual) 5,000
Public health certificate for the premise (annual) 3,000
Milk-handling certificate for operators (2 operators @ KES 300 annually) 600
Miscellaneous expenses e.g. receipt, cleaning detergents etc. @1,500 per month 18,000
Total cost 4,653,200
Gross margin 692,800
Gross margin per litre 7.13
Source: Case of a milk ATM business in Nakuru County
The main cost driver for the ATM business is acquisition of pasteurized milk, which takes about 90% of
the total variable costs (Table 8). Notably, most of the licensing costs from the county offices vary
based on the business and location. The advertisement cost varies not only by location but also by the
size of the signage. The milk ATMs give an estimated gross margin of approximately KES 7 per litre.
However, the gross margin will vary based on volume traded (influenced directly by business
positioning and population, among other factors) and pricing. To improve viability, milk ATM
businesses need to reduce the cost of pasteurized milk through strategies such as vertical integration
by investing in building their own supply chain and reducing transportation cost.
Milk ATM businesses also incur fixed costs that include business establishment costs (e.g. goodwill,
furniture and fittings, branding, plumbing works, painting works) and the cost of purchasing and

3R Kenya Research Report 012 | Wageningen Livestock Research Report 1253 | 21
installing the ATM machine. The cost of establishment varies with location, and the cost of the ATM will
vary with the features of the machine. For the case presented in Table 8, the establishment cost was
estimated at KES 400,000 and the ATM milk machine cost around KES 350,000, implying that the cost
can be recovered within two years of business operation.
3.5 Milk ATM businesses and employment
The milk ATM business has created jobs. The sampled ATM business employed is 1.65 (approximately
two operators) on average. An analysis by gender indicates that majority (59%) of the employed
operators are male compared to females (41%) Our projections estimate that milk ATMs businesses
are currently employing 3,350 operators nationally. The average age of the operators was 28 years,
indicating that most workers employed in these businesses were youth. The majority (54%) of the
employees had secondary education, 6% had primary education and 40% tertiary education as the
highest level. Further, the operators had approximately two years of working experience, which is due
to the relatively recent establishment of many businesses.
A large proportion of the ATM operators indicated that they had been trained in various activities and
operations of the milk ATM (Figure 3). All operators were trained in the basic operations: dispensing
milk, cleaning, replacing milk cans and regulating temperature. Furthermore, 93% of the operators
were trained in hygienic milk-handling practices. About 60% of the operators were trained in
calibration of the machine, ensuring the machine dispenses exact volumes of milk and payment
calibrations. Calibration could not be carried out by all employees, being password protected. To
ensure consistency and accountability of the system, only some staff are mandated to carry out
calibration.
Figure 3 Trainings received by milk ATM operators.
Source: ATM operator survey data (n=162)
0 20 40 60 80 100
Hygienic milk handling
Operating milk ATM machine
Entrepreneurship
Customer service
Calibration of milk ATM machine
Percent (%) of operators

3R Kenya Research Report 012 | Wageningen Livestock Research Report 1253 | 22
4 Consumer perceptions and quality
aspects of ATM milk
Chapter 4 overview
This chapter gives answers to the second research question: What are the key consumer patterns, and
quality and food safety issues related to the development of the milk ATM market segment in Kenya? It
also gives insights into some best and worst practices in the market segment.
4.1 Consumers’ milk purchasing patterns
The consumer survey revealed that milk consumption decisions were made mostly by women (56%).
Approximately 95% of all households bought milk regularly, with 97% of female decision makers in
the households buying milk slightly more regularly than male decision makers (92%). Most (80%)
milk purchasing decision makers had attained secondary and above level of education. About 16%
had dropped out in secondary school, and the rest had primary as the highest level of education
achieved.
Photo 3 Consumer purchasing ATM milk for home consumption (left) and a customer consuming
at milk ATM point (right).
To understand household milk consumption patterns, the consumers were classified according to the
monthly income of the household head. Households earning below KES 19,999 per month were
classified as low income, those earning KES 20,000 to KES 49,999 were classified as middle income,
and those earning above KES 50,000 were classified as high income. With the above income
classification, 52% of consumers interviewed (n=139) were low income earners, 42% (n=110) were
middle-income earners and 6% (n=15) were high-income earners. The income bands were derived
from an overview of salary guidelines provided by Kenyan labour laws and regulations of wages,
which differ by sector and location. Table A in Appendix 2 provides a summary of key variables by
income bands.

3R Kenya Research Report 012 | Wageningen Livestock Research Report 1253 | 23
Figure 4 presents results of consumption patterns of different types of milk by households in varying
income categories in the past year. Those categorised as high income only purchased packaged and
ATM milk, while those in low and middle income categories bought all milk types. In all income
categories, ATM milk is consumed alongside processed packaged milk. From the overall sample, about
ATM milk was the most consumed by about 70% of the sample and only 17% of the population had
consumed raw milk.
Figure 4 Type of milk consumed in the past year (%) by income category.
Source: Consumer survey (n=352)
The consumption patterns of milk varied based on the gender of the household decision-maker for
milk consumption (Figure 5). More households with female decision makers (68%) consumed ATM
milk anytime in the past year compared to 59% of households with male decision makers. On
contrast, 20% of households with male decision makers consumed raw milk compared to 16% in
households with female decision makers. However, the average total quantity of milk purchased per
household was about 1 litre per day and did not vary significantly with the gender of the household
decision-maker (Table 9).
Figure 5 Type of milk consumed in the past one year (%) by gender.
Source: Consumer survey (n=352)
0 10 20 30 40 50 60 70 80
Low Income
Middle Income
High Income
Overall
Percentage (%) of consumers
Packaged processed milk ATM milk Raw milk
0 10 20 30 40 50 60 70 80
Raw milk
ATM milk
Packaged processed milk
Percentage (%) of consumers
Female decision maker Male decision makers
3R Kenya Research Report 012 | Wageningen Livestock Research Report 1253 | 24
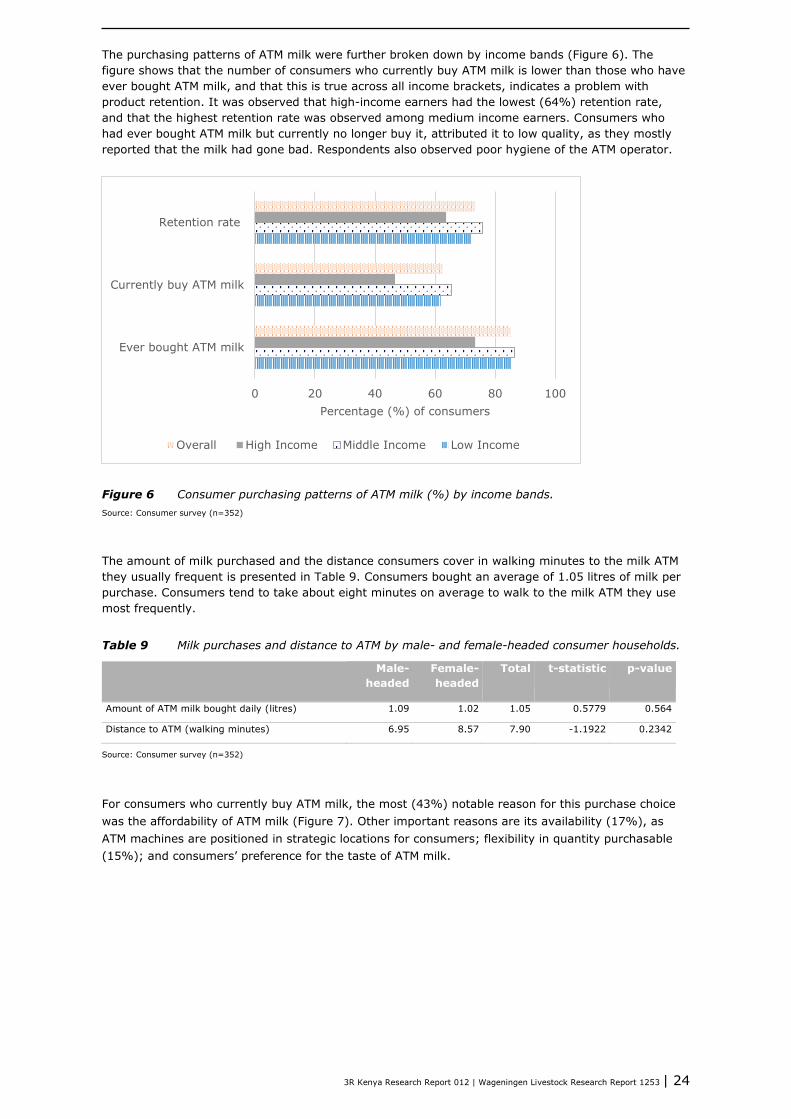
The purchasing patterns of ATM milk were further broken down by income bands (Figure 6). The
figure shows that the number of consumers who currently buy ATM milk is lower than those who have
ever bought ATM milk, and that this is true across all income brackets, indicates a problem with
product retention. It was observed that high-income earners had the lowest (64%) retention rate,
and that the highest retention rate was observed among medium income earners. Consumers who
had ever bought ATM milk but currently no longer buy it, attributed it to low quality, as they mostly
reported that the milk had gone bad. Respondents also observed poor hygiene of the ATM operator.
Figure 6 Consumer purchasing patterns of ATM milk (%) by income bands.
Source: Consumer survey (n=352)
The amount of milk purchased and the distance consumers cover in walking minutes to the milk ATM
they usually frequent is presented in Table 9. Consumers bought an average of 1.05 litres of milk per
purchase. Consumers tend to take about eight minutes on average to walk to the milk ATM they use
most frequently.
Table 9 Milk purchases and distance to ATM by male- and female-headed consumer households.
Male-
headed
Female-
headed
Total t-statistic p-value
Amount of ATM milk bought daily (litres) 1.09 1.02 1.05 0.5779 0.564
Distance to ATM (walking minutes) 6.95 8.57 7.90 -1.1922 0.2342
Source: Consumer survey (n=352)
For consumers who currently buy ATM milk, the most (43%) notable reason for this purchase choice
was the affordability of ATM milk (Figure 7). Other important reasons are its availability (17%), as
ATM machines are positioned in strategic locations for consumers; flexibility in quantity purchasable
(15%); and consumers’ preference for the taste of ATM milk.
0 20 40 60 80 100
Ever bought ATM milk
Currently buy ATM milk
Retention rate
Percentage (%) of consumers
Overall High Income Middle Income Low Income

3R Kenya Research Report 012 | Wageningen Livestock Research Report 1253 | 25
Figure 7 Reasons why consumers purchase ATM milk.
Source: Consumer survey (n=286)
Figure 8 presents the reasons why some consumers do not buy or stopped buying ATM milk. A
majority (56%) of milk consumers who do not purchase ATM milk perceive it to be adulterated, and
19% of the consumers consider that it is not clean. This implies that about 75% of consumers who do
not purchase ATM milk are making this decision because of quality issues. Addressing quality issues in
ATM milk outlets is imperative to enhance the retention rate and attract potential customers.
Figure 8 Reasons why some consumers do not buy ATM milk.
Source: Consumer survey (n=66)
Figure 9 presents factors that consumers consider in choosing which point to purchase ATM milk
from. Most consumers consider reliability in availability of milk (51%) (that is, the ATM always has
milk in stock) and perception of high quality (48%). Consumers are also attracted (42%) to a specific
milk ATM whose hours of operation suit their daily schedules. For ATM operators, it would be
advisable to assure continuous availability of milk and to have flexible opening hours based on
consumer convenience, in order to meet consumer needs.
Its affordability 43%
Its ready avaialability
17%
Like the way it tastes15%
Like its thickness/fat
content10%
Can buy in small quantities
15%
No ATM nearby
15%
Don’t like its packaging
4%
Gets spoilt easily
3%Think it's not clean19%
Think it has been
adulterated56%
It's expensive3%

3R Kenya Research Report 012 | Wageningen Livestock Research Report 1253 | 26
Figure 9 What consumers prefer when choosing the point of ATM milk purchase.
Source: Consumer survey (n=352)
4.2 Quality perception of ATM milk by consumers
Respondents were also asked about their perception of quality issues related to ATM milk (Table 10).
Perception of adulteration of milk was the most reported (28%) closely followed by cleanliness of the
ATM machines, premises and the milk handler (22%). Consumers were also concerned that they did
not know or trust the milk source implying that information on the source (the supplier) of the milk
could boost consumers’ confidence of ATM operators. Considering that the ATM milk sector is
growing, building trust among stakeholders can help increase milk demand. Sale of unpasteurized
milk was also raised as a concern about ATM milk, especially because it is difficult for consumers to
differentiate between pasteurized and raw milk.
Table 10 Quality perception of ATM milk by consumers.
Quality concern Percentage
ATM milk does not last long / easily gets spoiled 5
ATM milk has a bad taste 7
ATM milk has preservatives and chemicals 15
ATM milk is adulterated 28
Cleanliness of ATM machine, premises and handler 22
Lack of trust (not knowing milk source, not trusting operators) 6
Hygiene in handling 16
Uncertainty if ATM milk is pasteurized 1
Source: Consumer survey (n=352)
The key informants interviewed voiced additional quality concerns, such as ATM milk operators selling
milk that has gone beyond the 24 hour allowable limit for ATMs, which has health implications
especially if the right temperatures are not maintained during storage. The operator’s survey revealed
that ATM milk is maintained at approximately 4.9 degrees Celsius at the ATM machine. However,
when supplied with larger volumes of milk than the machine can hold, operators use alternative
storage facilities and 31% of the milk operators had stored ATM milk at higher temperatures than
recommended.
0 10 20 30 40 50 60
One-stop shop
Good customer service
Cleanliness of the premises
Nearest location
Favourable prices
High quality of milk
Reliability in availability of milk supply
Favourable operation hours
Percentage (%)

3R Kenya Research Report 012 | Wageningen Livestock Research Report 1253 | 27
Photo 4 ATM milk operators using non-recommended milk cans in the ATM machine.
4.3 Quality and safety assessment of milk dispensed in
ATMs
The study also sought to understand the extent to which milk sold through ATMs met established
regulatory standards for quality and safety. We did not undertake analysis of milk samples but relied
on secondary sources that included surveillance data on sampled milk ATMs from the KDB and the
results of several recent studies. The Kenyan Dairy Standards for various milk quality and safety
parameters are stipulated by the Kenya Bureau of Standards (KEBS). Some of the standards,
including those for pasteurized milk, are harmonized with the East African Community (EAC)
Standards and linked to the Codex Alimentarius for some parameters. The EAC standards for raw and
pasteurized milk were revised in 2018 and published in 2019. These standards added aflatoxin M1
residues as an additional requirement. Table 11 provides a summary of the standards for the various
parameters for raw and pasteurized milk.
Table 11 EAC/Kenyan Standards for pasteurized and raw milk (2018).
Pasteurized milk Raw milk
No added water or preservatives Yes Yes
Limits established by Codex Alimentarius Commission
Heavy metals Yes Yes
Pesticides Yes *
Veterinary drug residues Yes Yes
Minimum milk fat %+ 3.25 3.25
Minimum non-fat solids % 8.5 8.5
Maximum total plate count (TPC) per
ml†
30,000 2,000,000
Maximum coliform plate count (CPC)± 10 50,000
Escherichia Coli Per ml Absent n/a
Mycobacterium Tuberculosis per ml Absent n/a
*Pesticide limits for raw milk are explicitly included in the EAC Standards.
+Applies to whole milk; lower for fat-reduced and fat-free milk.
†Raw milk maximum TPC refers to Grade 3. The maximum for Grade 2 is 1,000,000 and for Grade 1 is 200,000.
±Raw milk maximum CPC refers to “good” quality milk; the maximum for “very good” quality milk is 1000.
Source: Brown et al., 2018
4.3.1 Results of quality and safety of milk sampled for KDB surveillance
The KDB surveillance data from a sample of 60 milk ATMs across the country in 2018 (Figure 10)
reveals compliance of this market segment with some of the set standards. About 19% of the milk
samples failed the alcohol test, an indication of milk spoilage as a result of bacterial fermentation.
Further, 15% of the samples had butter fat content below accepted levels. This is an indicator of
adulteration but can also be affected y by the breed of the cow. Aflatoxin and antibiotic residues were

3R Kenya Research Report 012 | Wageningen Livestock Research Report 1253 | 28
detected in some samples, with about 11% of the samples testing positive for tetracycline and
another 7% testing positive for sulphonamides, both of which are antibiotics. About 11% of the
samples tested positive for aflatoxin M1.
Figure 10 Milk test results of KDB surveillance data.
Source: KDB-supplied data, 2019 (n=60)
4.3.2 Selected studies on quality and safety of ATM milk
A study by Bebe et al. (2018b) assessed the quality of milk marketed through three retails options:
ATM; plastic containers, including the improved Mazzicans (raw); and packaged milk. The study was
conducted in Nairobi, Nakuru, Eldoret and Kisumu in 2017 and sampled 39 ATMs, 32 packaged milk
sachets and 29 raw milk from plastic containers sold in informal markets). The study analysed the
density, solids not fat (SNF), total bacterial counts (TBC), total coliform counts (TCC), aflatoxins,
hydrogen peroxide and antibiotics levels of the milk.
Figure 11 Percentage milk of samples that do not meet standards.
Source: Bebe et al., 2018 (n=100)
Figure 11 provides a summary of the findings on the quality of milk marketed through ATM, packages
and plastics. On TCC, results show that 24% of the sampled ATM milk did not meet KEBS standards
for pasteurized milk. The results were comparable to packaged milk, as about 28% of those samples
also did not meet the standards. For other parameters, sampled ATM milks that did not meet the
standards were slightly above that of packaged milk. Milk sold in plastic containers, which is sold
raw, had many more samples that did not meet the various standards (Bebe et al., 2018b).
14.8
18.5
0.0
14.8
3.7
11.1
0.0
7.4
11.1
0.0 20.0 40.0 60.0 80.0 100.0
Density
Alcohol test
H₂O₂
Butter fat
Freezing point
Tetracycline
Betalactums
Sulphonamides
Aflatoxin M1
% Fail % Pass
TCC TVC AntibioticsHydrogenPeroxide
ATM 23.7 18.4 7.6 7.9
Packaged Milk 28.1 0 6.5 6.3
Plastic 77.3 68.2 4.3 4.5
0102030405060708090
Per
cen
tage
Percentage of samples not complying with standards

3R Kenya Research Report 012 | Wageningen Livestock Research Report 1253 | 29
Another study, conducted by Kosgey et al. (2018) in Eldoret town focused on assessing the
prevalence of antibiotic residues from packaged milk, ATM milk and raw milk sold by informal traders
(street vendors). The study was conducted on 80 milk samples: 25 pre-packaged milk (commercial
brands), 34 milk samples from ATMs and 21 milk samples from informal traders (Table 12). The study
found different types of antibiotic residue in some of the ATM milk and raw milk (about 24% of
samples for each).
Table 12 Prevalence of detectable levels of antibiotic residues in milk from Eldoret.
Tetra-
cycline
Sulfa-
methazine
Beta-
lactams
Genta-
micin
Antibiotic
Sample type ±(%) ±(%) ±(%) ±(%) ±(%)
Commercial packaged milk 0/25 (0) 0/25 (0) 0/25 (0) 0/25 (0) 0/25 (0)
Milk-vending machine (ATM) 2/34 (5.9) 1/34 (2.9) 2/34 (5.9) 3/34 (8.8) 8/34 (24)
Raw milk from street vendor 3/21 (14) 0/21 (0) 0/21 (0) 2/21 (9.5) 5/21 (24)
Source : Kosgey et al., 2018 (n=80)
Another independent assessment was conducted on six milk ATMs businesses in various locations in
Nairobi (Anonymous, 2018). The assessment focused on understanding the different contamination
points of milk sold through the ATM. This was in consideration that one of the main challenges faced
at the ATM point of sale is post-pasteurization contamination. The results (Figure 12) show that total
viable count (TVC) in the milk ATM tanks (cans) excessively exceeded the allowable limit under the
KEBS standards. More revealing was that samples taken at the dispensing taps of the same ATMs
show a further increase in the TVC beyond the allowable limit, with some samples having a TVC of
60 million (units) which is above the EAC Standard of 30,000. This is an indication of the challenges
of cleaning and maintaining the ATM machines in a hygienic manner.
Figure 12 Assessment of total viable count (TVC cfu/ml) at different points of the ATM.
Source: Anonymous, 2018
4.4 Best and poor practices along the milk ATM supply
chain
The best and poor practices as described by the stakeholders are outlined in Table 13. The only poor
practice mentioned was use of non-food-grade materials in the fabrication of ATM machines.
ATM A ATM B ATM C ATM D ATM E ATM F
Tank/can 1,820,000 268,000 9,600,000 7,800,000 130,000 190,000
Dispensing tap 1,980,000 23,800,000 13,100,000 10,700,000 61,000,000 24,300,000
0
10,000,000
20,000,000
30,000,000
40,000,000
50,000,000
60,000,000
70,000,000

3R Kenya Research Report 012 | Wageningen Livestock Research Report 1253 | 30
Table 13 Best practices and poor practices along the milk ATM supply chain.
Best practices Poor practices
Design and fabrication of milk ATM technology
• Use of food-grade materials
• Provision of after-sales service
• CIP system
• Adherence to KEBS standards
• Provision of a user manual with proper cleaning
schedules
• Use of non-food-grade materials
Milk-handling practices
• Use of sealed cans
• Sale of pasteurized milk
• Storage of ATM milk at recommended temperature
• Good inventory management of milk (record keeping,
First In First Out; FIFO)
• Sanitization of milk cans
• Traceable source of milk
• Use of adulterated milk
• Adding non-approved preservatives or chemicals
• Sale of raw unpasteurized milk
• Unregulated independent pasteurizers
• Poor temperature control
• Sale of spoiled milk as value-added product (e.g. mala)
• Infrequent inspection and licensing
• Use of transport means not conforming with
requirements, e.g. lacking permits, refrigeration for long
distances, or insulation
• Use of unsealed and plastic containers
Operational practices
• Observing hygiene practices (protective clothing,
cleanliness, clean running water, sanitary facilities,
painting walls)
• Medical certificate of milk handlers
• Frequent milk ATM machine servicing
• Proper waste water disposal e.g. septic tanks,
connection to sewerage system etc.
• Accurate calibrations
• Adequate ventilation
• Improper waste disposal e.g. pouring on
roads/pavements.
• Corruption by some stakeholders (licensing, inspection,
milk handling)
• Corrupted calibrated systems
• Use of non-approved cleaning agents
• Infrequent cleaning
• Mounting ATMs in poorly ventilated places
• Lack of standard cleaning schedule (temperature of
water, type and concentration of detergent, recirculation
time)
At the ATM operation level, the best and poor practices centred around milk-handling practices,
certification of milk handlers, servicing of ATM technologies, waste disposal and calibration of
equipment. The best practices in terms of product quality were in the use of the recommended milk
cans and sale of pasteurized milk, while poor practices were in the adulteration of milk, sale of raw
milk and not having the required permits and licences among others.
Photo 5 Sealed cans(left) and tamper-proof cans (right) used by some enterprises to secure the
ATM milk.

3R Kenya Research Report 012 | Wageningen Livestock Research Report 1253 | 31
Photo 6 Medical certificate issued by county government to milk ATM operators.
The KDB, in a bid to address the poor practices, developed guidelines that have been incorporated into
the proposed revised dairy draft regulations currently undergoing stakeholder consultations. They look
at four different aspects of the ATM:
1. Construction and design requirements, which focus on product contact surfaces, inbuilt
product-holding area, bulk milk tanks, removable dispensing nozzle, inbuilt refrigeration
system, temperature monitoring and displaying device, exterior construction and routine
maintenance
2. Product requirements, which focus on location and layout, product handling and personnel
3. Operational requirements, which look at temperature, holding time and labelling of the
product
4. Key recording requirements, which look at milk procurement records (quantity and volumes),
cleaning schedule and records, maintenance schedule and records, calibration schedule and
records (for volume and temperature-measuring devices), relevant licences, personnel
medical and training records and rinse and swab test results.

3R Kenya Research Report 012 | Wageningen Livestock Research Report 1253 | 32
5 Business ecosystem in the ATM
market segment
Chapter 5 overview
This chapter answers the third research question: What businesses have emerged around the ATM milk
market segment in Kenya? Specifically, the chapter addresses the effect of ATM introduction on business
development and resultant employment creation effects in view of giving an idea on the contribution of
the market segment to the economy. It also gives insights on suppliers of ATM milk and ATM business
licencing.
5.1 Milk ATM technology business
The ATM technology is the core of the new milk market. Out of the nine milk ATM suppliers
interviewed, most (eight of the nine) of these businesses are located in Nairobi and one in Nakuru,
and have been established within the last eight years. Only one milk ATM supplier was importing fully
assembled milk ATMs for customers; the other eight import parts of the machine and fabricate the
milk ATMs locally. Some of the parts imported included refrigeration units, calibration units, milk
pumps, tamperproof cans, flow sensors and food-grade pipes. Some suppliers were converting
standard fridges into milk ATMs.
All milk ATM suppliers were involved in other businesses such as supplying other equipment and
machinery (e.g. refrigeration units, microwaves, water and fuel pumps, washing machines coolers,
solar technologies, pasteurizers, chillers, milk cans, milking machines and milk tanks). All milk ATM
suppliers (both importers and local fabricators) offered training with the purchase of the ATM
machines, some after-sales services and warranty after purchase (Appendix 2, Table B). The most
common after-sales service was delivery and transportation of the machine and provision of machine
installation and maintenance. Maintenance service was either offered directly by the supplier or
through third-party technicians subcontracted by the supplier, especially in cases where the supplier
did not have an office in the same town where the ATM was operating.
From the nine ATM supply businesses interviewed, about 56 employees are involved in one way or
another in the ATM business. They noted that due to declining demand for milk ATMs and growth in
the number of ATM suppliers, the number of workers per business has decreased. Most suppliers are
currently maintaining some contractual workers who are called up whenever a milk ATM assembly
contract arises. According to one of the key informants, the emergence of ATMs offers opportunities
for developing a pool of skilled personnel to fabricate and maintain milk ATMs. The enabling/regulatory
environment for milk ATM supply is supported by several government bodies, among them the KDB,
KEBS, public health offices, Kenya Revenue Authority and County governments.
5.1.1 Types of Milk ATM technologies offered by suppliers
Based on ATM suppliers’ interviews and field observations, Table 14 summarizes characteristics and
design features of the milk ATM technology in the Kenyan market.

3R Kenya Research Report 012 | Wageningen Livestock Research Report 1253 | 33
Table 14 Technology characteristics of milk ATMs supplied in Kenya.
Characteristic Variation observed
Holding capacity • Varies from 50 to 700 litres
• Some have fixed volumes, while others customize the size during assembly
Milk-holding vessel material • Stainless steel
• Aluminium
Dispensing unit • One nozzle
• More than one nozzle (rare cases)
Automation of temperature control • Automated temperature control unit
• Not automated
Cooling • Inbuilt refrigeration system
• External cooling system (e.g. deep freezer)
Piping and pumps • Food grade
• Non-food grade
Calibration options • Accepts coins
• Accepts notes
• Generates a receipt
• Volume calibration
• Calibration is password-protected
Cleaning • Automated cleaning
• Non-automated cleaning
Portability • Portable machine
• Fixed machine
Photo 7 Selected features in milk ATM retail market.
Milk ATMs available in Kenya vary from 50 to 700 litres in holding capacity (the volume of milk that
can be stored in the ATM inbuilt tank at a time). Imported ATM machines costs about KES 1.2 million,
while locally fabricated machines cost between KES 120,000 and 700,000, depending on
specifications. Some suppliers have fixed-volume machines (pre-installed tanks of varying capacities),
but others have the option of customizing the volume of the machine during assembly. Some ATMs do
not have inbuilt tanks; their refrigeration holding space can accommodate several (1–4) 50 litre cans.
KDB regulations require that all surfaces in contact with milk be food-grade materials. However, some
suppliers deceive customers who may not know which materials are food-grade, and they supply non-
food-grade components in the milk ATM. In some instances, non-food-grade pumps, which are not
suited for pumping milk and are difficult to clean, are used because they are cheaper.
Temperature control is critical for the milk ATM to be efficient in terms of power consumption, while
still providing a quality product. Suppliers offer automated temperature control units, semi-automated
units and non-automated machines. The automated temperature control is most preferred, since it
improves power efficiency (non-automated units require the operator to switch power on and off to
control milk temperatures). Moreover, the cooling system also uses temperature control. Some
machines have an inbuilt refrigeration system, while others have external cooling systems. In the
external cooling system, the dispensing units and the cooling system run separately.
The milk ATMs supplied have various calibration units, the most common being coin calibration, where
the machine differentiates coins based on weight, diameter and width; note calibration, where the
machine differentiates different currency notes based on the size and weight; and volume calibration,
where the system is set to dispense a fixed volume of milk within a certain time frame. In many

3R Kenya Research Report 012 | Wageningen Livestock Research Report 1253 | 34
cases, volume is calibrated by timing how many seconds milk is flowing, which was identified to be a
problem in cases where the pipes may swell after cleaning with hot water. Some machines have fixed
volumes calibrated in them, such that they can only dispense milk in those amounts, but others can
dispense any volume of milk. Some other machines are calibrated to generate a sales receipt upon
dispensing the milk. The majority of the calibration units are protected with a password, which is held
by a responsible operator in the business or by the owner. However, some suppliers do not give the
operators the calibration password, prompting them to be called every now and then to change the
calibrations. Automated cleaning of the machine is a common feature sought by customers. Some
suppliers have machines that are cleaned manually and others that are automated. Different types of
automation exist, where some machines have a fully functional CIP module, while most of the
machines do not. The common automation is where the machine operator replaces the milk system
with water and runs the cleaning modules for some minutes. The cleaning modules are pre-
programmed by the suppliers. Another feature of interest is the portability of the machines, with
suppliers offering machines that can be moved from one place to another as well as fixed machines
that cannot be moved after installation.
Other technological improvements would add value to milk ATMs. Suppliers reported that there is an
increased demand for machines installed with “running empty sensors” to notify operators when milk
is running low. Machines with a sales record memory are also in high demand, since they help owners
do the milk business accounting. The same was true for machines with GSM messaging systems,
which send short sales text messages periodically, for example, at close of business and to summarize
periodic performance of the milk ATM sales. This would help in monitoring the business, especially by
absent “telephone entrepreneurs”. Other technological aspects in demand include card payment
facilities, more accurate calibration units, fully automated CIP and all materials being of food grade.
For fabricators, adding value to current machines by incorporating these demands from operators may
determine future differentiation within the ATM market.
5.1.2 Business development in the ATM milk supply chain
The ATM milk market segment has led to business development and employment creation ranging
from the supplying the machine to the various support services emerging around the technology. The
businesses can be visualized as having three facets: ATM technology supply, milk supply to the ATM
operators and ATM milk retail operations (Figure 13). On the ATM technology supply side, the main
business support has been around the transportation of ATMs to the retail outlets, periodic servicing of
the ATM machines, branding of the ATMs, sale of other milk equipment such pasteurizing equipment
as milk cans, including the new tamperproof milk cans that have been recommended by KDB as
meeting the regulatory standards. Various informants were wary of this push to adopt the tamper
proof can as a requirement in ATM milk market noting the high cost of the cans that would affect
viability of business.
On the milk supply side, businesses have developed around milk supply, transportation and
pasteurization services. Where milk comes from a processing company, the milk is pasteurized at the
processing plant before delivery to the retail outlet by the processor. New milk pasteurization
businesses have emerged where independent pasteurization units or pasteurization partnerships (co-
pasteurization) are set up to offer pasteurization at KES 5–6/litre. In the case of co-pasteurization,
milk ATM operators buy milk directly from farmers and transport it to a co-pasteurization location
before taking it to their retail unit for sale. One of the challenges with this model is the issue of post-
pasteurization contamination, especially when using cans which are not properly cleaned. The findings
reveal that only 1% of the businesses use the recommended tamperproof cans (Photo 5) that have
been introduced recently in the Kenyan market. About 84% of suppliers use sealed aluminium cans to
ensure quality of milk. Sealing cans is seen as a substitute for use of tamperproof cans. The remaining
15% of suppliers used unsealed aluminium cans, which could risk compromising the quality of the milk
supplied. That is, unsealed cans pose a risk for contamination and adulteration of milk.

3R Kenya Research Report 012 | Wageningen Livestock Research Report 1253 | 35
Photo 8 Businesses selling non-dairy products (left) and dairy products (right) together with ATM
milk.
5.1.3 Suppliers of ATM milk
According to the survey of milk ATM businesses, their pasteurized milk is supplied by mini -
dairies/processors (40%), major processors (26%) and farmer cooperatives (29%) (Figure 14). The
major processors are large dairy firms with extensive penetration of the national domestic market,
while mini -processors are small but growing firms concentrating their business in small markets with
limited penetration. A majority (95%) of ATM operators source their milk from mini-processors, major
processors and farmer cooperatives. A smaller proportion (about 3%) of ATM operators get their milk
directly from farmers, while 2% get it from their own farm.

3R Kenya Research Report 012 | Wageningen Livestock Research Report 1253 | 36
Figure 13 Business ecosystem around the ATM market segment.
Transporters
Servicing of ATM
machines and
sale of spare
parts
Branding of
ATMs
Sale of other milk
products
Sale of other food
products Sale of other milk
equipment e.g.
• Pasteurizers
• Milking machines
• Milking cans
Sale of other
non-milk related
equipment and
electronics
Milk transportation
Milk ATMs
(local)
fabricators
Milk ATMs
importers
Financial service providers Regulators and licencing agencies
Sale of other non-food
products e.g.
• Financial services
(M-PESA)
• Electronics
• Packaging materials
ATM business development support
services
Sale of ATM milk Milk supply and
pasteurization

3R Kenya Research Report 012 | Wageningen Livestock Research Report 1253 | 37
Figure 14 Source of milk for ATM businesses.
Source: ATM operator survey data (n=162)
Photo 9 Suka dairies cooperatives one of the suppliers of ATM milk in Nakuru.
KDB requires that milk sold in ATMs is pasteurized, hence we asked ATM operators about compliance
levels with this regulation. The findings reveal that 99% of the businesses reported that they sell
pasteurized milk, with only 1% selling raw milk (Figure 15). Regarding the sourcing of milk, majority
(95%) of the ATM operators purchase pasteurized milk (from mini-processors, major processors and
farmer cooperatives), while only about 2% do their own pasteurization and another 2% have a co-
pasteurizing arrangement. Co-pasteurization is where a milk ATM retailer purchases raw milk and
hires the pasteurization services of an independent pasteurizer. It was evident that there is growing
business of using small pasteurizers, which might not be regulated by KDB.
Farmers3%
Mini-processors40%
Major processors26%
Own farms2%
Farmer cooperatives
29%

3R Kenya Research Report 012 | Wageningen Livestock Research Report 1253 | 38
Figure 15 Nature of milk supplied to ATM operators.
Source: ATM operator survey data (n=162)
Findings show that about 54% of the businesses put the milk cans in the ATM machine directly after
supply. A further 33% of the businesses use a refrigerator connected to the ATM where they put the
cans once supplied with milk. Approximately 22% of the businesses pour the milk directly into the
refrigerator, which could pose a risk if the milk is not fully sold within 24 hours or goes bad in the
refrigerator. About 4% of the businesses store the milk in cans outside the dispenser and not in a
freezer, which implies the milk is at room temperature and could be a medium for growth of microbial
organisms.
As shown in Figure 16, two thirds (67%) of the ATM business had contracts with the milk suppliers.
Contracts for supply of milk are important in ensuring consistency in milk supply and quality. In Uasin
Gishu County, milk ATM businesses are supposed to get into contracts with pasteurized milk suppliers
before they are licensed to operate. This is also a requirement for licensing by KDB but is being
enforced differently across counties.
Figure 16 Contractual arrangements for supply of milk.
Source: ATM operators survey data (n=162)
5.2 Milk ATM business licensing
The basic requirements to operate milk ATM businesses in Kenya are the County Business Permit, KDB
licence, Public Health Certificate (premise), and Medical Certificate issued by the public health
department to operators. Some counties require a proof of contract between the supplier of
pasteurized milk and the milk ATM business and an advertisement licence for businesses intending to
advertise their milk ATM products.
No contract with milk supplier
33%
Contract with milk supplier
67%
Supplied with pasteurized milk
95%
Supplied with raw milk, self-pasteurized
2%
Co-pasteurized2%
Supplied with raw milk, sold
raw1%
Others3%

3R Kenya Research Report 012 | Wageningen Livestock Research Report 1253 | 39
Figure 17 shows that approximately 94% of the businesses had a valid business licence, 75% had a
KDB licence, and 79% had a Public Health Certificate for the premise and food handling. Most of the
KDB licences had expired, as new requirements by KDB had not been met. However, at the time of
the study, some businesses did not have the KDB licence because its issuance had been suspended as
regulations around its use are being developed. About 94% of the businesses had a valid business
permit.
Figure 17 Licensing of milk ATM businesses.
Source: ATM operators survey data (n=162)
0 20 40 60 80 100
Public health certificate
KDB licence
Business permit
Other licences (NEMA, KEBS)
Percentage (%) of operators

3R Kenya Research Report 012 | Wageningen Livestock Research Report 1253 | 40
6 Future development of the milk ATM
supply chain: A scenario analysis
Chapter 6 overview
This chapter answers the fourth research question regarding potential scenarios and their expected effect
on development of the ATM milk segment. Scenarios are plausible snapshots of the future that help focus
thinking on key factors driving performance of the ATM milk supply chain while considering potential
emerging opportunities, challenges and threats. The scenarios under consideration were constructed
through stakeholder’s engagement during a roundtable meeting organized by the research team. The
chapter presents three scenarios that could inform potential future growth trajectories in the market
segment: business as usual; changes in compliance to quality standards; and a public ban on trading of
raw milk in urban areas, which would result in an advantage for ATM milk in the competition with informally
traded milk.
6.1 Enablers and disablers of ATM milk sector growth
The data presented in the preceding sections indicate exponential growth of milk ATM businesses,
contributing to the growth in market share in the processed milk market. To what extent will this
growth trajectory continue? During the stakeholders’ roundtable meeting, we elicited perspectives on
important enablers and disablers of growth of the ATM milk sector, which could affect future
developments (Table 15). The enablers and disablers are categorized into demand for ATM milk,
supply of ATM milk and ATM machines, and regulatory aspects.
On the consumption side, increased consumer awareness of the quality of ATM milk Key
interventions include branding of the machines on the theme of selling pasteurized milk to build
consumer trust, as some consumers still perceive ATM milk as raw milk; enhancing accuracy of
calibration to ensure that consumers get value for money; technological breakthroughs in cheaper
packaging materials to address the increased cost of packaging on dairy products due to the national
ban on use of plastic bags. In terms of disablers, as discussed in Chapter 4, some studies have
reported incidences affecting the quality and safety of purchased ATM milk (e.g. raw milk, milk
spoilage, adulteration and high usage of preservatives) which could impede growth of the sector.
These can be rectified by enhanced testing and compliance monitoring by KDB and other agencies,
such as public health agencies.
The growth of independent pasteurizers and co-pasteurization in the proximity of retail outlets will
play an important role in future development of the ATM supply chain. They reduce milk transportation
costs thereby increasing margins, and might also reduce milk spoilage due to a shorter duration of
exposure of the milk to higher temperatures since transportation is often done without cooling.
However, stronger linkages between the ATM operators and pasteurizers in terms of contracts would
guarantee reliable quality and safe milk supply to final consumers through increased traceability.
Preventing adulteration of milk could also be achieved through adoption and proper use of tamper-
proof cans and seals during transportation.
Further automation of the milk ATM machines is an enabler of growth in the ATM milk supply chain. It
leads to multiple dividends: reduced losses due to poor hygiene and temperature control and reduced
costs for labour and electricity (through improved energy efficiency). These increase the margins for
ATM machine operators, thus stimulating growth in the sector. Examples of automation systems that
could be considered include CIP, temperature regulators, volume calibration and bank note calibration.
Capacity-building of ATM personnel will increase the quality of the product and of the service, instilling
trust in consumers. This will need to include training of ATM suppliers in requirements for the milk
ATM machines and of ATM operators in operational issues such as hygienic milk handling and disposal
of wastewater.
Disablers on the supply side of ATM milk and ATM machines include contamination through
adulteration and unhygienic milk handling, as well as use of high levels of preservatives to extend the

3R Kenya Research Report 012 | Wageningen Livestock Research Report 1253 | 41
buy–sell period of milk. Milk contamination discourages consumers, affecting demand and limiting
growth of the sector. Further, some ATM machine suppliers fabricate substandard machines, for
example using non-food-grade materials in efforts to reduce costs, with implications for food safety
and lifespan of the machines. The high prices of good quality ATM machines impede growth of
numbers.
In terms of the regulatory dimension, a stronger and more conducive framework would strengthen the
ATM milk supply chain by ensuring that appropriate standards are set, approved and implemented.
This addresses the disabler of inadequate regulation in the ATM milk supply chain. Lobbying for a total
ban on trade of raw milk, or a partial ban for urban areas, would stimulate the sector, as would
lobbying for reduction of taxes on imported components of milk ATM machines, such as refrigeration
units, calibration units, milk pumps and food-grade materials.
Table 15 Enablers and disablers of future development of ATM milk supply chain.
Enablers Disablers
Demand
(consumer) side
• Consumer awareness of ATM milk quality
• Market availability (untapped, existing, projected
per capita consumption of milk, urbanization and
population growth)
• Flexibility in dispensing milk quantities
• Affordability of milk for consumers, no packaging
costs
• Trust and customer relationships
• Cases of milk spoilage
• Low trust levels regarding sourcing of milk
• Perception that ATM milk is of low quality
Supply side of ATM
milk and ATM milk
machines
• Accessible and affordable technology and services
for co-pasteurization and independent
pasteurization
• Strong market linkages between processors and
ATM operators
• Automation of machines and improvements in
efficiency of the machines (hygiene, temperature
and energy reduction)
• Milk contamination, for example by adulteration
or by high levels of usage of preservatives or
chemicals
• Competition from continued sale of raw milk
• Unhygienic conditions around ATMs
• Fluctuating milk supply and milk prices
• Substandard ATM machines
• Long distances and poor transportation
equipment
• High cost of high-quality milk ATM machines
Regulatory aspects Strong and conducive regulatory framework, for
example:
• Ban on trade of raw milk sale in urban areas
• Ease and affordability of accessing business
licences
• Introduction of regulations to reduce risk of milk
contamination (tamper-proof cans, hygiene,
inspection)
• Continued sale of raw milk
• Taxation on ATM milk equipment, such as
refrigeration units, calibration units, milk pumps
and food-grade materials
• Inadequate regulations (still in draft stage).
Source: Key informant interviews; n = 38
6.2 Scenario analysis
This section presents results for possible scenarios in the milk ATM supply chain and the implications
for sector growth (expressed as demand for milk, supply of milk and employment over the next 10
years). Scenarios are plausible snapshots of the future that help focus thinking on key factors driving
performance of the ATM milk supply chain while considering potential emerging opportunities,
challenges and threats. Scenarios were built on the premise that the future is still in the making and
can be actively shaped by anticipating emerging opportunities, challenges and threats and by taking
strategic action today that supports performance of the ATM milk supply chain. The scenarios under
consideration were constructed through consultation with experts from different relevant parties
involved in the milk ATM supply chain. The parameter choices and detailed methodology are presented
in Appendix 1.
6.2.1 Scenario 1: Business as usual
The key assumptions for the business-as-usual scenario are summarized below:

3R Kenya Research Report 012 | Wageningen Livestock Research Report 1253 | 42
1. The population demanding ATM milk and the number of ATMs were predicted using a logistic
growth function (“S-curve”). Logistic growth was used to model the data because it is
bounded by the carrying capacity, unlike the exponential growth that increases without limits.
The logistic growth function used assumes that growth begins slowly, then increases rapidly
and eventually levels off because of restrictions that place limits on the size of the underlying
population.
2. Employment in the ATM businesses was estimated by multiplying the average number of
employees per ATM (1.65; see Appendix 1) by the estimated number of ATMs.
3. The relative growth rate of the ATM sector was projected from the historical annual growth
rate. For 2019 the growth rate of milk ATMs in Kenya was estimated at 31% per year for the
normal case. For the worst-case growth rate, we took the lowest growth rate of 23% recorded
in 2014 (Appendix 1, Table C). We assume a fairly conservative best-case growth rate of 39%
(the normal growth plus the difference between the normal and worst growth rate), as the
highest growth rate ever recorded in the past, of 481%, seems unrealistic for the future.
However, it is more likely that the growth would surpass the 39% in the best case scenario.
4. A projected intercensal growth of 2% as an indicator of population is assumed. An intercensal
estimate is an estimate of population between official census in this case 2019 to 2029
5. The ATM milk market share of 16% of the formal milk market are assumed.
6. The current compliance level is estimated at 33%; if the trend continues, 50% compliance
level is assumed to be attained in the fourth year.
Table 16 presents a business-as-usual situation including normal-, best- and worst-case scenarios for
the next 10 years. If all conditions remain constant, the results reflect positive growth of the milk ATM
market segment. In this case, demand for ATM milk would increase by a growth factor of 3.36 and the
quantity supplied by 3.2 in 10 years. The change in quantity demanded exceeds change in quantity
supplied because the ATM market segment exhibits demand-led growth. Thus, suppliers of ATM milk
will lag their supply decisions, such that the market stabilizes, before committing more resources.
Further, operators prefer to clear the stock daily, instead of having surplus stock which increases risk
of incurring losses resulting from milk going bad. The increase in quantity demanded will be
accompanied by a 1.83 growth factor in the number of milk ATMs. The higher number of milk ATMs
implies growth in the sales of the machines by the suppliers, translating into further expansion of local
ATM machine fabrication, leading to expansion in indirect and direct employment (workers selling the
ATM milk machines and those selling ATM milk). The increased supply of ATM milk implies increased
pasteurization and thus more business. This trend may trigger further growth in co-pasteurization and
more investment in capacity to ensure compliance with KDB standards.
Table 16 Future projections in demand and supply of ATM milk in a business-as-usual scenario.
Variable Status quo In 10 years
Normal case Best case Worst case
Quantity demanded (ʼ000 litres) 102,205 343,307 (336%) 447,233 (438%) 217,297
(213%)
Quantity supplied (ʼ000 litres) 107,385 343,445 (320%) 443,230 (413%) 220,005 (205%)
Number of ATMs 2,030 3,710
(183%)
3,971
(196%)
2,904
(143%)
Note: Figures in parenthesis represent % change from status quo
In a best-case scenario (Table 16), projections show an increase by a factor of 4.38 for ATM milk
demanded and of 4.13 for ATM milk supplied. The findings suggest that the quantity would grow
fourfold in the best-case scenario and twofold in the worst scenario. In the best case, the number of
milk ATM machines will grow by a factor of 1.96; in the worst-case scenario, by a factor of 1.43. The
trend diagram for the changes in demand and supply in 10 years is presented in Figure 18. In the
short run, demand growth will outstrip supply growth, but later on oversupply would be a threat. This
may be because changes in demand trigger changes in supply. In conclusion, in the short run it is
likely that there would be minimal changes in demand and supply and thereafter the market segment
will grow steeply, demonstrating a bright outlook for the ATM market segment.

3R Kenya Research Report 012 | Wageningen Livestock Research Report 1253 | 43
Figure 18 Trends in supply and demand of ATM milk over 10 years in business as usual scenario.
6.2.2 Scenario 2: Stronger regulatory framework leads to increased compliance
with KDB regulations
With the impending approval of the regulations that will govern the milk ATM market segment, a
scenario is likely where the regulator will have a stronger basis for enforcement. Based on KDB-
supplied data (2019), of the estimated 1,550 ATM machines in 2018, about 436 were compliant with
KDB measures and were issued with KDB certificates, which gives a 28% compliance rate.
Benchmarking against the 80% compliance rate estimated by KDB under the current dairy sector
regulations and public health act, we make an assumption that the maximum compliance rate of the
proposed ATM market segment will be 80%. The possible scenario could involve tightening compliance
for ATM machines (e.g. use of food-grade materials) and for the milk supply chain (e.g. use of
tamper-proof cans). To comply, operators will need to increase investment costs and operational
costs, which have to be covered by the consumer to ensure sustainability of the ATM milk enterprise.
It is hypothesized that such a trend would lead to increased consumer prices of ATM milk to absorb
the investment costs. On the other hand, increased compliance would assure consumers of the quality
of ATM milk, which would build consumer trust in the product, which in turn would increase the
quantity demanded. However, competition from cheap imported milk from neighbouring countries also
may affect the price competitiveness of ATM milk.
As mentioned above, in 2018, the compliance rate was 28%. By 2019 it was estimated at 33%
according to KDB-supplied data. The relatively low level of compliance is a result of inadequate and
non-specific guidelines for the sector. Simulations project that if the growth in compliance observed in
the past continues over the coming years, compliance will be 50% in four years (normal-case
scenario). For the best-case scenario – assuming more effort, cooperation and investment by KDB and
other stakeholders in the sector – it is estimated that the sector can attain 50% compliance in two
years. However, with complacency in the sector (worst-case scenario), 50% compliance would not be
achieved until the sixth year. The results for this scenario are presented in Table 17. They show that
the expected compliance levels for the normal-, best- and worst-case scenarios in 10 years is 70%,
79% and 62% respectively.
In the best-case scenario, quantity demanded and supplied would grow by a factor of 4.71 and 4.48
respectively (Table 17). Growth in the number of ATMs would grow slightly more than in the normal
case by a factor of 1.91. The trend is explained by tightening compliance with regulations, which
results in more ATMs as non-compliant ATM enterprises close down but are compensated for by new
entrants. These new entrepreneurs are responding to the business opportunity triggered by increased
demand due to quality assurance in the ATM retail market segment. To achieve a higher level of
0
50000
100000
150000
200000
250000
300000
350000
400000
450000
500000
2018 2020 2022 2024 2026 2028 2030
Quantity
dem
anded a
nd s
upplied n
ationally
('000' lite
rs)
Years
Normal-case demand
Worst-case demand
Best-case demand
Normal-case supply
Worst-case supply
Best-case supply

3R Kenya Research Report 012 | Wageningen Livestock Research Report 1253 | 44
compliance, KDB would require additional human resources and investments in laboratory and
equipment to monitor the milk ATM machine and ATM milk supply chains. By the tenth year,
compliance would have grown to 79%. This will attract more consumers who are concerned about
quality and price of milk, providing a mechanism for the ATM segment to encroach on the processed
packaged milk market.
In contrast, in the worst-case scenario, where enhanced compliance takes longer, quantities
demanded and supplied reduce compared to the normal-case scenario (Table 17). Consumers will tend
to shift to raw milk consumption because of the price and quality effect in the market, as laxity in
ensuring compliance by KDB would lead to mushrooming of non-compliant milk ATMs.
For policymakers and stakeholders, strengthening compliance is justified for a better milk ATM market
segment. This scenario depends significantly on the capacity of the KDB to enforce the regulations.
Table 17 Scenario with compliance rate changes through a stronger regulatory framework.
In 10 years
Variable Normal case Best case Worst case
Quantity demanded (ʼ000 litres) 343,307
(336%)
481,276
(471%)
272,521
(267%)
Quantity supplied (ʼ000 litres) 343,446
(320%)
481,040
(448%)
274,977
(256%)
Number of ATMs 3,710
(183%)
3,886
(191%)
2,904
(143%)
Compliance level (%) 70% 79% 62%
6.2.3 Scenario 3: Public ban on sale of raw milk in urban areas, leading to the
ATM market segment encroaching on the informal market segment
This scenario occurs with a public intervention in the milk supply chain. Public intervention could be
implementation of the proposed partial ban on the sale of raw milk in urban areas. From the current
statistics, it is estimated that 30% of the marketable milk produced in the country is traded formally
and 70% informally (Argwings-Kodhek et al., 2005). In this scenario, the ATM milk supply chain
targets to expand into the 70% of milk traded informally, facilitated by a partial ban that will enhance
trade in pasteurized milk and lead to higher demand for ATM milk. For raw milk consumers, in terms
of cost, ATM milk is the next best alternative and thus there would be a shift in quantity supplied and
consumed. The market share of ATM milk in the next 10 years is assumed to grow from 16% to 30%
of formal marketed milk in urban areas with the remaining estimated 70% being taken by packaged
processed milk. We created two scenarios: in the best-case scenario, ATM milk supplies 30% of total
milk marketed; in the worst-case scenario it remains at 15% of the total milk marketed in the urban
areas. The results of this scenario are presented in Table 18.
Table 18 Scenarios with public ban of raw milk in urban areas.
Variable In 10 years
Normal case Best case Worst case
Quantity demanded (ʼ000 litres) 343,307
(336%)
593,004
(580%)
475,782
(466%)
Quantity supplied (ʼ000 litres) 343,446
(320%)
575,286
(536%)
477,891
(445%)
Number of ATMs 3,710
(183%)
4,749
(234%)
3,945
(207%)
The demand for ATM milk grows by a factor of 5.8 in the best-case scenario (Table 1). The additional
growth factor of 2.44 growth (5.80-3.36) can be attributed to consumers who were previously
consuming raw milk. Similarly, the supply of ATM milk grows by a factor of 5.36 up from 3.2,
triggered by increased demand. The growth in supply is projected to be less than that of demand
because suppliers speculate that since ATM milk is more expensive than raw milk, not all consumers
will change over to ATM milk. Further, the number of ATMs in the country will increase, since the
former raw market presents an extra opportunity to expand the milk ATM businesses.
In the worst-case scenario, ATM milk demand grows by an extra factor of 1.3 from the normal
projected 3.36. In this case, the ATM milk market segment does not grow fully because there a black
market to trade raw milk that is cheaper than ATM milk may develop. Overall, banning the sale of raw
3R Kenya Research Report 012 | Wageningen Livestock Research Report 1253 | 45
milk in urban areas would imply more ATMs being fabricated and installed in the market, which would
also require more effort and investment by KDB to enforce and monitor compliance levels. Such a
policy on banning of raw milk will increase the market size of pasteurizing enterprises. Farmers who
supplied raw milk to the urban areas would be required to join the formal milk segment either through
joining cooperatives or co-pasteurization. Due to the existing food safety concerns of raw milk, the
public ban is more likely to happen in the urban areas of Kenya. In conclusion, future growth of the
ATM milk sector is anchored on encroachment into the informal market segment rather than
competing with packaged processed milk.
The findings suggest that a combined intervention with a ban on the sale of raw milk and proper
monitoring systems in the ATM milk supply chain, leading to enhanced compliance, will result in a
market share of ATM milk of more than 30% of the milk marketed in urban areas.

3R Kenya Research Report 012 | Wageningen Livestock Research Report 1253 | 46
7 Conclusions and recommendations
From this study of the ATM milk market segment, the following can be concluded:
1. The Kenyan ATM milk market is growing but concentrated in a few towns, mainly in Nairobi
County and neighbouring counties. However, there is a likely general trend of the market
segment spreading to other urban areas if the sector is supported. The future potential of the
ATM market segment is in targeting growing urban areas across the different counties and
targeting all categories of income earners.
2. The ATM milk market is expanding based on affordability of milk compared to pasteurized
packaged milk and has the potential of expanding the formal milk market share beyond the
current 30%. to more consumers.
3. The flexibility in quantity of milk that is sold through milk ATM market segment has enabled
consumers to access pasteurized and potentially safe milk thus contributes to household
nutritional security. However, the finding indicate that some ATM milk does not meet the safety
standards that comprise its value proposition to consumers and the industry.
4. Consumer perceptions of milk quality h were most important in making decisions about where to
purchase ATM milk.
5. The growth of the milk ATM market is linked to a shift from the initial reliance on imported
technology towards more locally fabricated machines, which has reduced reduce the cost of the
machines. This has stimulated the development and expansion of fabrication and manufacturing
industrial cluster. However, this has led to unregulated fabrication that is compromising the
quality of these ATM machines.
6. The business ecosystem around the milk ATM retail market is expanding opportunities for job and
business creation. In addition to fabrication of milk ATMs, other businesses that have emerged
include milk pasteurizing, transportation, cooling systems, milk-handling equipment, servicing of
the machines and sale of spare parts.
7. Future growth of the ATM milk supply chain is anchored on i) enhancing design of cost-effective,
locally fabricated, automated quality assured machines (including calibration, CIP and
improvement in energy efficiency); ii) building consumer awareness on quality of ATM milk as
pasteurized milk since some consumers perceive it as raw milk, and iii) a stronger, well-thought
through regulatory framework that are more enabling and supportive of expanding milk ATMs a
quality-oriented market segment. The gaps in regulations for ATM machines and ATM milk (with
regulations still in the draft stage) have implications for consumers and the regulator, in terms of
food safety concerns as well as opportunistic behaviour of some fabricators, for example use of
non-food-grade materials so machines are cheaper to make. With the relevant policy and
regulatory framework being in limbo, there has been a rise of food safety issues in the ATM milk
market segment.
8. In terms of future outlook of the milk ATM market segment, the following can be concluded,
based on scenarios built:
• The business-as-usual scenario (status quo) projects the future potential growth of the ATM
milk market segment by factors of 2.1–4.4 over the next 10 years.
• The ATM milk market segment is likely to grow in the future, but it is sensitive to policy and
market changes. It has the potential to encroach on the informal milk market segment,
offering an alternative source of milk to consumers and resulting in maximum growth by a
factor of 5.8 of ATM milk volume supplied over the next decade.
Recommendations
• The milk ATM market segment has the potential to be a game changer in the process of
formalization of the milk marketing sector if supported with relevant policy and regulations. GoK
could fast-track policy and regulations to address unsafe operations and improve consumer
confidence in the ATM milk product in order to utilize its potential, mainly linked to its price
competitiveness, to be a game changer in the process of formalization of the milk marketing
sector.
• Despite ATM milk price competitiveness, food safety issues along the supply chain must be
addressed. To enhance safe milk handling along the ATM milk supply chain the ATM business
operators supported by Government of Kenya, consumer organisations and other stakeholder need
to:

3R Kenya Research Report 012 | Wageningen Livestock Research Report 1253 | 47
o Enhance responsible behaviour along the supply chain through labelling and effective
traceability systems, which will enhance consumer trust of pasteurized milk. This will require
development and deployment of standard operating procedures at the different nodes of the
supply chain.
o Enhance capacity of the operators through a training programme. KDB can involve other parties
to assist in this process, such as the public health department and consumer and food safety
lobby organizations. This relates to development appropriate training curriculum and identifying
effective means of delivery.
o Work with other agencies, such as the Kenya Revenue Authority to enhance access to cheap
food-grade materials, and with KEBS to development and ensure compliance with fabrication
standards, to address the quality issues in ATM milk machines. This also calls for working with
industry actors to build capacity for innovation in developing quality, affordable technology that
meets the required standards.
o Encourage private sector investment in expanding the ATM milk market, to develop a strong
and robust chain that supplies pasteurized milk to ATM market retail outlets in additional towns.
• Sensitizing consumers and assuring them of quality can grow the market prospect for ATM milk
while building on its price competitiveness.
• With the investments already made by operators, the upcoming regulations should facilitate
improvements to the supply chain, for example a phased approach can be developed to stop the
use of non-food-grade materials, to safeguard the interest of the investors and move to regulated
machines. On the supply side, key enablers for the supply chain are enhancing growth of co-
pasteurizers and building stronger linkages between milk ATM machine operators.
• GoK could enable KDB to strengthen its capacity in terms of enforcement officers, data
management systems, ATM milk traceability systems and appropriate systems for registering and
monitoring ATMs.
• Future growth depends on policy and market interventions in the sector by KDB that takes a less
prescriptive approach but empowers the different operators along the chain . The interventions to
facilitate growth in the milk ATM segment will come not only with finalizing the market and policy
direction for the segment but also with meeting KDB capacity needs in terms of enforcement
officers, data management systems, ATM milk traceability systems and appropriate systems for
registering and monitoring ATMs. Further, increased investments in laboratory capacity and
equipment as well as use of technology by KDB (e.g. using geographic information systems to map
the milk ATMs and their suppliers) is required to enhance compliance rate.

3R Kenya Research Report 012 | Wageningen Livestock Research Report 1253 | 48
References
Alam, M.R., Sharmin, Yasin A. and Parh, M. (2015). Time Series Decomposition and Seasonal
Adjustment. Global Journal of Science Frontier Research,15(9).
Alonso, S., Muunda, E., Ahlberg, S., Blackmore, E., and Grace, D. (2018). Beyond food safety: Socio-
economic effects of training informal dairy vendors in Kenya. Global Food Security 18, 86–92.
Anonymous (2018) independent assessment of some milk ATMs businesses in various locations in
Nairobi.
Argwings-Kodhek, Gem & M'mboyi, F. & Muyanga, Milu & Gamba, Paul, 2005. Consumption Patterns
of Dairy Products in Kenya's Urban Centres: Report from an Urban Household Survey. Working
Papers 202625, Egerton University, Tegemeo Institute of Agricultural Policy and Development.
Bebe, B. O. (2018a). Milk vending machine innovation for retailing milk: Operation costs, consumer
perceived risks and milk quality in Kenyan markets. Sustainable Livestock Innovation and
Technology: Roadmap to Improved Food and Nutrition Security. April 4–6, 2018, Sportsman Arms
Hotel, Nanyuki.
Bebe, B. O, van der Lee, J., and Kilelu, C. W. (2018b). Milk retailing innovation in Kenya and
consumers’ perceptions of safety. 3R Kenya Project Practice Brief 010. Wageningen Livestock
Research, Wageningen University & Research, Wageningen.
https://library.wur.nl/WebQuery/wurpubs/fulltext/496519.
Brown, L. H., Alonso, S., Lindahl, J., Varnell, H., Hoffmann, V., and Grace, D. (2018). Regulatory
compliance in the Kenyan dairy sector: Awareness and compliance among farmers and vendors.
Project Note. Washington, DC: International Food Policy Research Institute (IFPRI).
http://ebrary.ifpri.org/cdm/ref/collection/p15738coll2/id/133046Fink-Gremmels, J., 2008.
Mycotoxins in cattle feeds and carry-over to dairy milk: A review. Food Additives and
Contaminants 02, 172–180.
Gachango, F. G., Anderson, L. M., and Pedersen, S. M. (2014). Adoption of milk cooling technology
among smallholder dairy farmers in Kenya. Tropical Animal Health and Production 46, 179–184.
GoK–Government of Kenya. (2019). National livestock policy. Republic of Kenya Ministry of
Agriculture, Livestock, Fisheries and Irrigation-State. Department for Livestock, Nairobi, Kenya.
KDB––Kenya Dairy Board. (2016b). Kenya Dairy Board Strategic plan 2017–2022. Kenya Dairy Board.
Nairobi, Kenya. https://www.kdb.go.ke/wp-content/uploads/2019/06/KDB-strategic-plan-Final-
2017-to-2022.pdf
Kenya Markets Trust. (2019). Dairy sector at a glance. Available at:
https://www.kenyamarkets.org/research/
KNBS–Kenya National Bureau of Statistics. (2019). Economic Survey 2019. Nairobi, Kenya.
Kosgey, A., Shitandi, A., and Marion, J. W. (2018). Antibiotic residues in milk from three popular
Kenyan milk vending machines. The American Society of Tropical Medicine and Hygiene 98, 5,
1520–1522.
Makoni, N., Mwai, R., Redda, T., Zijpp, A., and van der Lee, J. (2014). White gold: Opportunities for
dairy sector development collaboration in East Africa. Centre for Development Innovation report
CDI-14-006, Wageningen University & Research.
MoALF (2010). Kenya National Dairy Master Plan – A situational Analysis of the Dairy Sub sector,
Volume I. Situational Analysis. Ministry of Agriculture, Livestock and Fisheries, Republic of Kenya,
Nairobi. https://www.kdb.go.ke/download/kenya-national-dairy-master-plan-vol-i/
Ndambi, A., Njiru, R., van Knippenberg, C., van der Lee, J., Kilelu, C., Ngigi, M., Muliwa, M., Asher, D.,
Mbera G., and Mwangi, W. (2018). Enhancing milk quality and safety: Towards quality-based milk
payments in Kenya. 3R Kenya Practice brief 011. Wageningen University & Research.
Ndambi A, Kilelu CW, van der Lee J, Njiru R and Koge J (2019). Making milk quality assurance work on
an unlevel playing field; Lessons from the Happy Cow pilot. Wageningen University & Research, 3R
Kenya research report 008/Wageningen Livestock Research Report 1165.
van der Lee, J., Bebe, B. O., and Oosting, S. (2016). Sustainable intensification pathways for dairy
farming in Kenya; A case study for PROIntensAfrica. Wageningen Livestock Research Report 997,
Wageningen University & Research.

3R Kenya Research Report 012 | Wageningen Livestock Research Report 1253 | 49
Rademaker, C.J., Bebe, B.O., van der Lee, J, Kilelu, C. and Tonui, C. 2016. Sustainable growth of the
Kenyan dairy sector; A quick scan of robustness, reliability and resilience. Report 3R Kenya/WLR
979.
Yamane, T. (1967). Statistics: an introductory analysis. New York: Harper and Row.

3R Kenya Research Report 012 | Wageningen Livestock Research Report 1253 | 50
Appendix 1 ATM sampling technique and
extended scenario methodology
ATM sampling technique
The milk ATMs sample was determined using the following formula by Yamane (1967) for known
population:
2)(1 eN
Nn
(1)
Where 𝑛 is the desired sample size in the target population and 𝑒 is the acceptable margin of error (𝑒
= 0.07). Replacing the above variables with known values where (𝑁 =806 registered milk ATMs, we
ended up with a sample of 162 milk ATM operators. The sample distribution is presented in Table 1.
The sample of milk consumers was determined for unknown population using the formula (Yamane,
1967):
2
2 ..
e
qpZn (2)
Where 𝑛 is the desired sample size in target population, 𝑍 is the standard normal deviate at required
confidence level of 95% (𝑍 = 1.96), P is the proportion in the target population estimated to have the
desired characteristics (milk ATM consumers p=0.5), 𝑞 is the proportion in the target population
estimated not to have characteristics (milk ATM non-consumers) being measured (𝑞 = (1- 𝑝 = 0.5),
and 𝑒 is the acceptable margin of error (𝑒 = 0.05). Replacing the above variables with known values in
the equation produces 385, which after increasing by 27% to account for contingencies (such as non-
responses) gave 490 consumers.
Note that only questionnaires where the respondent had identified themselves as being a household
head (352) were used for analysis, since they could provide the most complete information. Out of the
352, 286 (representing about 81%) had bought ATM milk while 66 consumers (representing about
19%) did not consume ATM milk in 2019
Extended scenario methodology
A. Status of the dairy sector and milk ATM supply chain today
This section presents the current statistics in the dairy industry and in the ATM milk supply chain in
Kenya. Table A presents the current trend in formal milk consumption and sources. The size of the
formal milk market is estimated to be about 807 million litres, of which about 154 million litres is
imported from Uganda. Uganda recently has had a comparative advantage and potential for milk
production reflected from its contribution of 19% of the total traded volumes in the formal market
system.
Table A Volume of milk traded in formal markets in Kenya by source, 2018–2019, in litres LME*).
Period Produced
domestically
Imports from Uganda Size of formal
market
All products UHT milk Milk
powder
Total
imports
July 2018 to June 2019 652,315,267 91,220,117 63,152,862 154,372,979 806,688,246
Average per month 54,359,606 7,601,676 5,262,739 12,864,415 67,224,021
Formal market share 81% 11% 8% 20% 100%
*LME = Liquid Milk Equivalent
Source: KDB supplied data, 2019.

3R Kenya Research Report 012 | Wageningen Livestock Research Report 1253 | 51
In terms of prices for processed and packaged milk, KDB data reveals that over the years prices have
had an average growth of 4% per year. The current price stands at about KES 120 per litre as
presented in Figure A.
Figure A Average annual prices of UHT packaged milk.
Source: KDB-supplied data, 2019.
Table B presents other key indicators in the economy, dairy sector and the milk ATM supply chain in
Kenya.
KNBS (2019) estimates that urbanization will increase to 2% intercensal growth. Urbanization has
implications on milk demand, particularly on demand for pasteurized milk, as most of the processed
milk is marketed in urban areas.
From the KDB-supplied data and primary data collected, the study estimates that there are 2,030
ATMs, of which about 480 ATMs are unregistered. KDB reported that in 2018 out of the 1,550 ATMs
registered in Kenya, 436 had fully complied. This represented a compliance rate of about 28%. KDB
estimates that the current compliance rate is at 33%. It is worth noting that KDB has currently
suspended the licensing of the ATMs pending the passage of proposed regulations for the market
segment.
Table B Current characteristics and assumptions of the dairy industry and ATM milk supply chain.
Variable Statistics Source
Urbanization currently (%) 26.56% KNBS, 2019
Projected number of milk ATMs in Kenya in 2019 2,030 Operators survey, KDB
Number of unregistered ATMs 480 Operators survey
ATMs that have complied with KDB regulations (%) 33% KDB-supplied data
Average price in KES of UHT packaged milk currently (litre) 110 Consumer survey
Average price in KES of pasteurized packaged milk currently (litre) 93 Consumer survey
Proportion of households consuming processed milk in urban areas 0.69 Argwings-Kodhek et al. 2005,
2015
Average household daily ATM milk consumption (litres) 1.06 Consumer survey
Average daily sales of ATM milk (litres per ATM) 140 Operators survey
Average consumer prices in KES for ATM milk currently (KES/litres) 63 Operators and consumer
survey
Current supply of ATM milk in tonnes 107,385 Operators survey
Current demand for ATM milk in tonnes 102,205 Consumer survey
Estimated number of people employed in ATM enterprises 3,350 Operators survey
There are 3,350 people employed directly as operators in the milk ATMs. This is the total number of
ATMs (2,030) by the mean number of employees (1.65) from the primary data collected among
operators of milk ATM machines.
2013 2014 2015 2016 2017 2018
1000ML 97.60 101.60 105.40 107.00 119.20 121.18
0
20
40
60
80
100
120
140
Pric
e (
KE
S p
er lit
re)

3R Kenya Research Report 012 | Wageningen Livestock Research Report 1253 | 52
B. Time series data decomposition
Time series was done to predict the urbanization rates. Economic time series data contains four basic
components which are mutually exclusive and collectively exhaustive: Trend (T)/Cycle (C), Seasonality
(S) and Irregular (I). Decomposition assume that the data are made as follows:
Data = pattern + error
According to Alam et al., 2015, the pattern of any data may show trends/cycles and seasonality. A
trend exists when there is a long-term increase or decrease in the data. It does not have to be linear.
Sometimes we will refer to a trend “changing direction”, that is, it goes from an increasing trend to a
decreasing trend. A seasonal pattern exists when a series is influenced by seasonal factors (e.g. the
quarter of the year, the month or the day of the week). Seasonality is always of a fixed and known
period. So we can give a standard form of the decomposition time series on the basis of the pattern of
the data.
Data = pattern + error
= (trend-cycle, seasonality, error)
An element of the error or randomness is also assumed to be present in the data. It is actually the
combined effect of the two sub-patterns of the series. This means the combined effect of the trend-
cycle, seasonality and the actual data. This is often called the “irregular” component. There are several
alternative approaches to decomposing a time series, all of which aim to isolate each component of
the series with great accuracy and precisely. Actually, the main substance is to remove the trend-cycle
and then isolate the seasonal component. The basic time series data from the above discussion can be
presented in the form:
Yt = f (St, Tt, Et)
Where Yt is the time series value (actual data) at period t, 𝑆t is the seasonal component (or index) at
period t, 𝑇t is the trend cycle component at period t, and 𝐸t is the irregular (or reminder) component
at period t.
There are two main decomposition models: additive decomposition model and multiplicative
decomposition model. An additive model assumes the addition of all the time series components. An
additive model is usually appropriate if the magnitude or the span of the seasonal fluctuation doesn’t
vary with the level of the series.
Yt = St + Tt + Et
A multiplicative model assumes that the observed time series data is composed of all components
multiplied together. A multiplicative decomposition is usually applied when the seasonal fluctuations
increase and decrease proportionally with increases and decreases in the level of the series.
Multiplicative decomposition is more appropriate for the economic series because most seasonal
economic series have seasonal variation and may vary by day, week, month and year.
Yt = St x Tt x Et
The study adopted the multiplicative model. Data on each variable was collected for the past years
and, to decompose the trend-cycle component, moving averages were adopted. A five-year moving
average was adopted because Kenya has a five-year government cycle. The moving averages were
then used to determine the trend by use of a simple linear regression. The regression coefficients were
used to determine the trend component in each observation Tt.
To determine the seasonal component, the observed data (Yt) was divided by the trend cycle
component (Tt). Mathematically this is given by:
Yt/Tt= St x Et
A seasonal adjustment factor for each period was calculated by averaging the seasonal components
data in order to leave the irregular component. These seasonal adjustment factors are known as
seasonal indices. The data is then adjusted by the indices to remove the seasonality and retain only
the trend cycle and the irregular components. This implies that the predicted trend cycle component is
multiplied with the seasonal indices to have the seasonally adjusted predictions for the future time
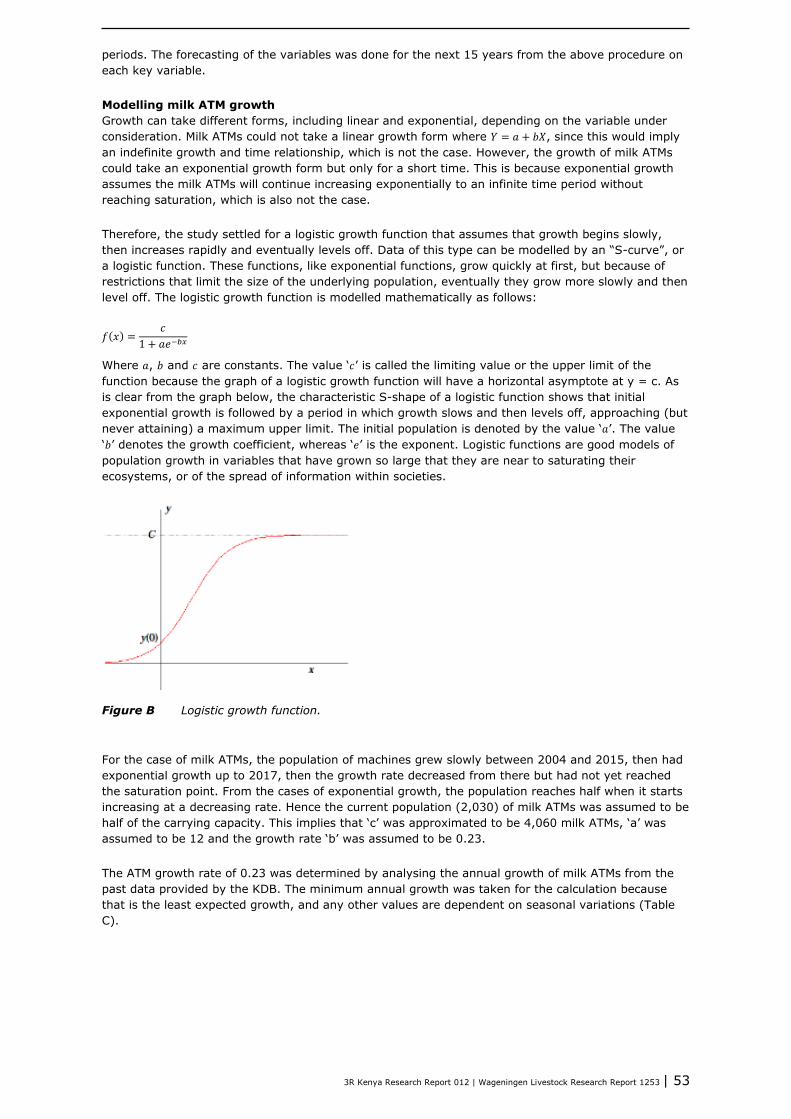
3R Kenya Research Report 012 | Wageningen Livestock Research Report 1253 | 53
periods. The forecasting of the variables was done for the next 15 years from the above procedure on
each key variable.
Modelling milk ATM growth
Growth can take different forms, including linear and exponential, depending on the variable under
consideration. Milk ATMs could not take a linear growth form where 𝑌 = 𝑎 + 𝑏𝑋, since this would imply
an indefinite growth and time relationship, which is not the case. However, the growth of milk ATMs
could take an exponential growth form but only for a short time. This is because exponential growth
assumes the milk ATMs will continue increasing exponentially to an infinite time period without
reaching saturation, which is also not the case.
Therefore, the study settled for a logistic growth function that assumes that growth begins slowly,
then increases rapidly and eventually levels off. Data of this type can be modelled by an “S-curve”, or
a logistic function. These functions, like exponential functions, grow quickly at first, but because of
restrictions that limit the size of the underlying population, eventually they grow more slowly and then
level off. The logistic growth function is modelled mathematically as follows:
𝑓(𝑥) =𝑐
1 + 𝑎𝑒−𝑏𝑥
Where 𝑎, 𝑏 and 𝑐 are constants. The value ‘𝑐’ is called the limiting value or the upper limit of the
function because the graph of a logistic growth function will have a horizontal asymptote at y = c. As
is clear from the graph below, the characteristic S-shape of a logistic function shows that initial
exponential growth is followed by a period in which growth slows and then levels off, approaching (but
never attaining) a maximum upper limit. The initial population is denoted by the value ‘𝑎’. The value
‘𝑏’ denotes the growth coefficient, whereas ‘𝑒’ is the exponent. Logistic functions are good models of
population growth in variables that have grown so large that they are near to saturating their
ecosystems, or of the spread of information within societies.
Figure B Logistic growth function.
For the case of milk ATMs, the population of machines grew slowly between 2004 and 2015, then had
exponential growth up to 2017, then the growth rate decreased from there but had not yet reached
the saturation point. From the cases of exponential growth, the population reaches half when it starts
increasing at a decreasing rate. Hence the current population (2,030) of milk ATMs was assumed to be
half of the carrying capacity. This implies that ‘c’ was approximated to be 4,060 milk ATMs, ‘a’ was
assumed to be 12 and the growth rate ‘b’ was assumed to be 0.23.
The ATM growth rate of 0.23 was determined by analysing the annual growth of milk ATMs from the
past data provided by the KDB. The minimum annual growth was taken for the calculation because
that is the least expected growth, and any other values are dependent on seasonal variations (Table
C).

3R Kenya Research Report 012 | Wageningen Livestock Research Report 1253 | 54
Table C Number and growth of milk ATMs in Kenya.
Year Number of ATMs % growth rate
2012 11
2013 18 64
2014 22 23
2015 62 182
2016 150 142
2017 267 78
2018 1,550 481
2019 2,030* 31
*projected number of ATMs in Kenya in 2019
The growth rate above was assumed to remain constant when modelling the growth in population
demanding ATM milk, capacity utilization for milk ATM machines and the changes in compliance levels
for the ATM milk market segment. In modelling growth in the population demanding ATM milk, several
factors were considered. First, the study acknowledges that the ATM milk market segment is mainly in
the urban areas of Kenya. Therefore, the number of urban households was calculated from the total
population, and the urbanization rates were predicted from the time series data. The urban population
was then adjusted to get the proportion of households demanding pasteurized milk by multiplying by a
constant of 69% (Argwings-Kodhek et al., 2005).
The households demanding pasteurized milk in the urban areas and the number of households
demanding ATM milk were computed by multiplying by 16%, which is the ATM milk market share
estimated from survey and KDB-supplied data as follows. The total urban households are estimated at
urbanization rate (27%) of 12,143,900 households from 2019 Census data (KNBS, 2019). Therefore,
the number of households demanding ATM milk is calculated as a proportion of households consuming
pasteurized milk in urban areas (69%) times the share of ATM market (16%) giving approximately
361,985 households. Based on the consumer survey, each household consumes an average of 1.06
litres of milk, hence the total demand for ATM milk is approximately 102,205 tonnes. From KDB data,
the estimated share of formal milk market is approximately 806,688 tonnes (KDB-supplied data,
2019).
The model assumes that this capacity grows at the same growth rate as the growth in demand for
ATM milk. Similarly, the current compliance rate was estimated at 33% from extrapolation of KDB
data on compliant ATMs in 2019. That is, 436 milk ATMs of the 1,550 milk ATMs registered in 2018
were compliant, which was approximately 28% compliance. Assuming the growth rate remains
constant, then a third of the milk ATMs were compliant in 2019. However, the estimated maximum
compliance rate of milk ATMs is restricted to 80%, which is the highest level of compliance rate with
KDB regulations in the dairy sector.
Supply of milk through ATMs was estimated as a function of the number of milk ATMs and the capacity
utilization. The current volume supplied was calculated by multiplying the number of ATMs (2,030) by
the average amount of milk supplied to milk ATMs per day, estimated at 146.94 litres from the ATM
operator survey data.

3R Kenya Research Report 012 | Wageningen Livestock Research Report 1253 | 55
Appendix 2 Further analysis
Table A Characteristics by income groups.
Low
income
Middle
income
High
income
Total F Prob>F
Amount of milk bought in a day 0.92 1.26 1.45 1.09 4.93 0.008
Price of milk bought 74.93 71.74 71.80 73.41 0.52 0.594
Price of raw milk 55.74 55.19 55.00 55.47 0.02 0.982
Price of processed milk 99.28 100.85 104.17 100.21 0.43 0.653
Distance to ATM 7.73 7.17 14.55 7.83 1.85 0.159
Amount of ATM milk bought in day 1.00 1.04 1.68 1.05 1.99 0.141
Price of ATM milk 58.87 63.01 66.43 61.00 1.20 0.305
Household size 2.86 3.05 3.20 2.96 0.64 0.526
Education of household head 11.53 12.72 14.33 12.19 12.75 0.000
Source = Consumer survey (n=352)
Figure A After-sales services offered after acquisition of milk ATMs.
Source = Operators survey (n=162)
No aftersale services …
Received aftersale services…
01020304050607080
Per
cen
tage


Rapporttitel Verdana 22/26Maximaal 2 regelsSubtitel Verdana 10/13Maximaal 2 regels
Namen Verdana 8/13Maximaal 2 regels
Wageningen Livestock Research creates science based solutions for a sustainable and profitable livestock sector. Together with our clients, we integrate scientific knowledge and practical experience to develop livestock concepts for future generations.
Wageningen Livestock Research is part of Wageningen University & Research. Together we work on the mission: ‘To explore the potential of nature to improve the quality of life’. A staff of 6,500 and 10,000 students from over 100 countries are working worldwide in the domain of healthy food and living environment for governments and the business community-at-large. The strength of Wageningen University & Research lies in its ability to join the forces of specialised research institutes and the university. It also lies in the combined efforts of the various fields of natural and social sciences. This union of expertise leads to scientific breakthroughs that can quickly be put into practice and be incorporated into education. This is the Wageningen Approach.
Wageningen Livestock ResearchP.O. Box 3386700 AH WageningenThe Netherlands T +31 (0)317 48 39 53E [email protected]/livestock-research
CONFIDENTIAL