milk production from the indigenous malawi goat fin al report … · 2016-08-02 · final report...
TRANSCRIPT

.
MILK PRODUCTION FROM THE INDIGENOUSMALAWI GOAT
FIN AL REPORT
.
NOVEMBER 1995
PRESENTED BY:
ALAN COOPERSEALE-HAYNE FACULTY OF AGRICULTURE
UNIVERSITY OF PLYMOUTH
NEWTON ABBOT
DEVON TQ12 6NQ
1
Acknowled2ements
This work was undertaken at Bunda College of Agriculture, University of Malawi.
Thanks are due to:
The Principal, Dr. Z. Kasomakera, for making facilities available.
Dr. L. Karnwanja, Dr. J. Banda and Mr G. Mkanansi, Animal Science Dept, for their help andsupport.
Mr Owen Adijere and the rest of the "goat team" for their care of the animals.
This project was funded by a grant from the ODAINRI livestock production programme,whose support is acknowledged.
2

FINAL REPORTMILK PRODUCTION FROM THE INDIGENOUS MALA WI GOAT
PRO.TECT NO. XO254
Summary
These trials aimed to achieve four objectives:
To examine the milk production potential of the indigenous Malawi goat.a)
To evaluate the effects of removing milk for human consumption on the liveweight andreproductive performance of the lactating doe.
b)
To develop an improved feeding regime for lactating goats using locally available feedby-products.
c)
To compare the perfonnance of indigenous and Saanen x indigenous does under similarmanagement regimes.
d)
From 21:t3 days (4 days for Saanen x) does were separated from their kids at housing andhand milked every morning before turnout.
ii)
Feeding was unimproved "bush" grazing. Where supplementation was used, 25O:tlOg maizebran was fed each evening.
ill)
Mean milk yield in supplemented (MS) does was higher in 1993-94 (29.2:t18.3litres) than in1994-95 (27 .9:t15.2Iitres) but differences were not significant (P=O.67)
iv)
Mean yield in unsupplemented (MNS) animals was 15.O:t8.6Iitres in 1993-94 and 20.2:t12.6litres in 1994-95 but this difference was not significant (P=O.22)
v)
In 1993-94 supplementation produced a significant yield response (P<O.Ol) in each of the first20 weeks of lactation. In 1994-95 the response was only significant in week 4 (P<0.05)
vi)
Post-partum wight loss averaged 1.9::tO.59kg in supplemented animals, O.7:tO.54kg inun supplemented and 1.5:tO.69kg in unmilked (C) controls. Kidding weights had beenregained by weeks 17, 14 and 12 respectively.
vii)
.4:tO.5
and 1.7:tO.5 inLitter sizes, in litters produced following treatment, were 1.9:tO.7,MS, MNS and C does, respectively.
viii)
3
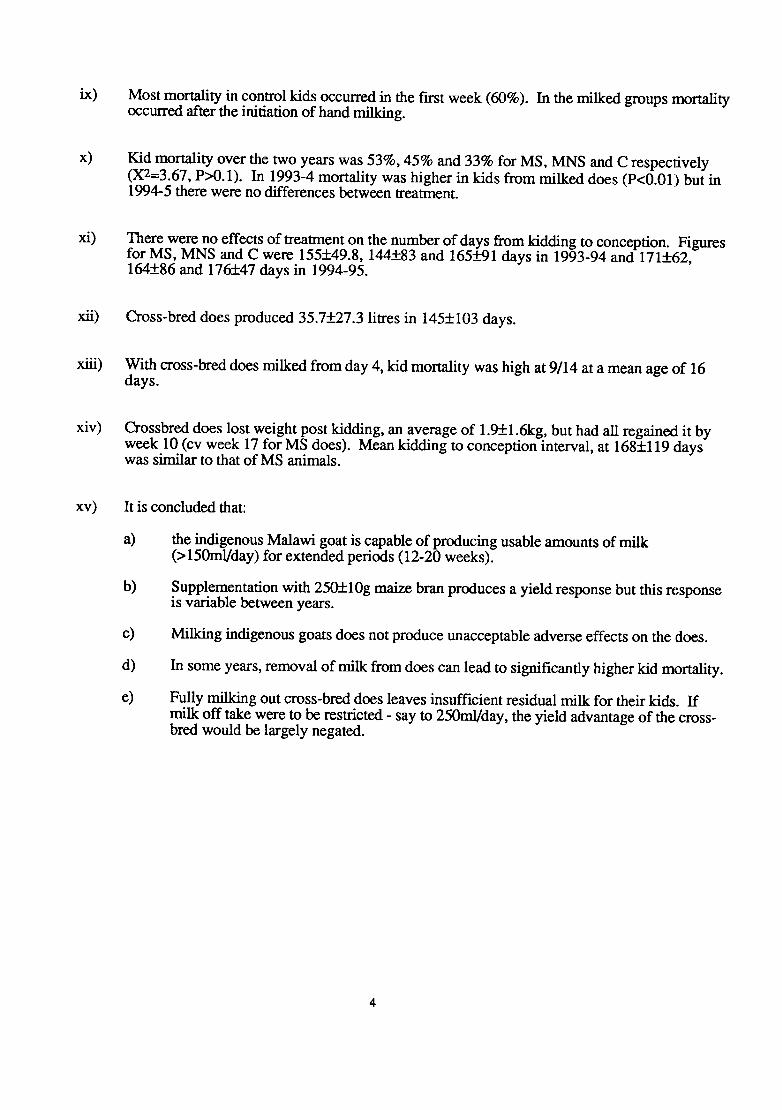
ix) Most mortality in control kids occurred in the first week (60%). In the milked groups mortalityoccurred after the initiation of hand milking.
x) Kid mortality over the two years was 53%,45% and 33% for MS, MNS and C respecrively(X2=3.67, P>O.I). In 1993-4 mortality was higher in kids from milked does (P<O.OI:) but in1994-5 there were no differences between treatment.
xi) There were no effects of treatment on the number of days from kidding to conception. Figuresfor MS, MNS and C were 155:t49.8, 144:t83 and 165:t91 days in 1993-94 and 171:t62,164:t86 and 176:t47 days in 1994-95.
xii) Cross-bred does produced 35. 7:t27.3 litres in 145:tl03 days.
xiii) With cross-bred does milked from day 4, kid monality was high at 9/14 at a mean age of 16days.
xiv) Crossbred does lost weight post kidding, an average of 1.9::t1.6kg, but had all regained it byweek 10 (cv week 17 for MS does). Mean kidding to conception interval, at 168::!:119 dayswas similar to that of MS animals.
xv) It is concluded that:
a) the indigenous Malawi goat is capable of producing usable amounts of milk(> 150m1/day) for extended periods (12-20 weeks).
b) Supplementation with 25O:tlOg maize bran produces a yield response but this responseis variable between years.
c) Milking indigenous goats does not produce unacceptable adverse effects on the ,does.
d) In some years, removal of milk from does can lead to significant! y higher kid mortality.
e) Fully milking out cross-bred does leaves insufficient residual milk for their kids. Ifmilk off take were to be restricted -say to 250ml/day, the yield advantage of the cross-bred would be largely negated.
4

FINAL REPORTMILK PRODUCTION FROM THE INDIGENOUS MALA WI GOAT
PRO.TECT NO. XO254
Collaboratine Institutions
Seale-Hayne Faculty of Agriculture, Food and Land Use, Newton Abbot, Devon, TQ12 6NQ,England. (Dr Alan Cooper)
Bunda College of Agriculture, Box 219, Lilongwe. (Dr James Banda)
Programme Area: Livestock Production
Introduction
It has been estimated that in some areas of Malawi the incidence of malnutrition in children under the
age of 5 may be as high as 70%. The problem is particularly severe in children who have been weaned
off breast milk. Milk is seen as being of special benefit to such children and in many parts of the
world the source of that milk would be the goat. Estimates of the number of goats in Malawi vary
between 1.0m and 1.5m and yet, with the exception of a few localised areas, those goats are not
milked. There does not appear to be any custom or taboo prohibiting the consumption of goats milk.
Indeed, in a survey, Banda (1992a) showed that goats' milk was acceptable to many people and was
even preferred to that of the sheep or cow. The aim of this project was therefore to examine the
milking potential of the indigenous Malawi goat to determine the feasibility of producing goat's milk in
subsistence-farming situations.
Oh:o..f:"o~'"uJ".."I"..~:
To examine the milk production potential of the indigenous Malawi goat.1,
To evaluate the effects of removing milk for human consumption on the liveweight and
reproductive performance of the lactating doe.
11.
To develop an improved feeding regime for lactating goats using locally-available feed by-
products.
iii.
To compare the production and performance of indigenous and Saanen x indigenous does
under similar management regimes.
IV.
5

The original finish date for this project was 31st March 1995. Following delays in obtaining Saanen x
does pennission was sought for an extension to 31st September 1995 at no additional cost. That
extension allowed the collection of data on completed cross-bred lactations. All the above objectives
have therefore been achieved.
6

Materials and Methods
This project was undertaken at Bunda College, University of Malawi (14°S, 33°E). All does grazed
indigenous pastures by day (7am to 4pm) (plate 1), with access to maize gardens during the dry
season (May to October), and were housed at dusk. Housing, in groups of 10-15 was in a blue-gum
pole and chain-link fence 'khola' with concrete floor and corrugated iron roof (Plate 2). Pens were not
bedded and were cleaned out weekly. The kids of does being milked were removed from their dams at
housing, penned in an adjacent pen and returned to their dams at turnout the following morning.
Supplemented does received a feed of maize bran (250.:t 10g/head) each evening. Proximate analysis
of the bran is given in Appendix 1.
Initially, indigenous does were allocated sequentially at kidding to one of four treatment groups:
Milked, supplemented (MS)Milked, unsupplemented (MNS)Unmilked, supplemented (NMS)Unmilked, unsupplemented (NMNS)
At the suggestion of the Programme Advisory Committee of NRI, the NMS treatment was dropped
and a single unmilked, un supplemented group created as the control group (C). A total of 57 "milked"
and 30 "unmilked" lactations were recorded during the programme.
A separate, cross-bred group of does was also established during 1994 (n=15). Indigenous does were
of varying ages. In order to improve comparability of data, when the Saanen x Indigenous does were
acquired, an attempt was made to find animals with an equivalent age spread (as estimated from incisor
teeth). Three yearlings and four each with 4, 6 and 8 permanent incisor teeth were found.
Milking took place once daily, immediately before turnout. Individual yields were measured with a
measuring cylinder and the bulked quantity sent to the College's 'under-fives' clinic. Milking of
indigenous does commenced 21 .:.t 3 days after kidding but, in expectation of higher yields, the Saanen
x does were milked from day 4. Milking ceased when production dropped below 50ml. on three
consecutive days. Kids continued to run with their dams after hand milking ceased and were allowed
to wean naturally. Does and kids were weighed on the day after kidding and fortnightly thereafter until
milking was stopped (monthly in 1993). Oestrus was determined from the behaviour of the does.
Males were housed separately and oesn-ous does were hand mated at each oestrus. Routine
prophylactic veterinary n-eatments were not applied. A veterinary assistant was given responsibility for
the project in October 1993. Veterinary n-eatments were given to individual animals, as appropriate,
and the cause of all deaths was established where possible.
7

The indigenous animals used were largely those remaining at the end of a previous trial programme in
September 1992 (see final report XOI24). In the hope that further funding would be available
treatments were applied, as does kidded, from April 1993 onwards. Thus, although the project
memorandum for contract XO254 starts on 1 September 1993 the lactation data presented are for the
two years April 1993 -March 1994 and April 1994 to March 1995.
8


~ I I II
NQ)
co-c. G
)
0c
Results and Discussion
1)
Indieenous Does
ReQroductive Performancea.
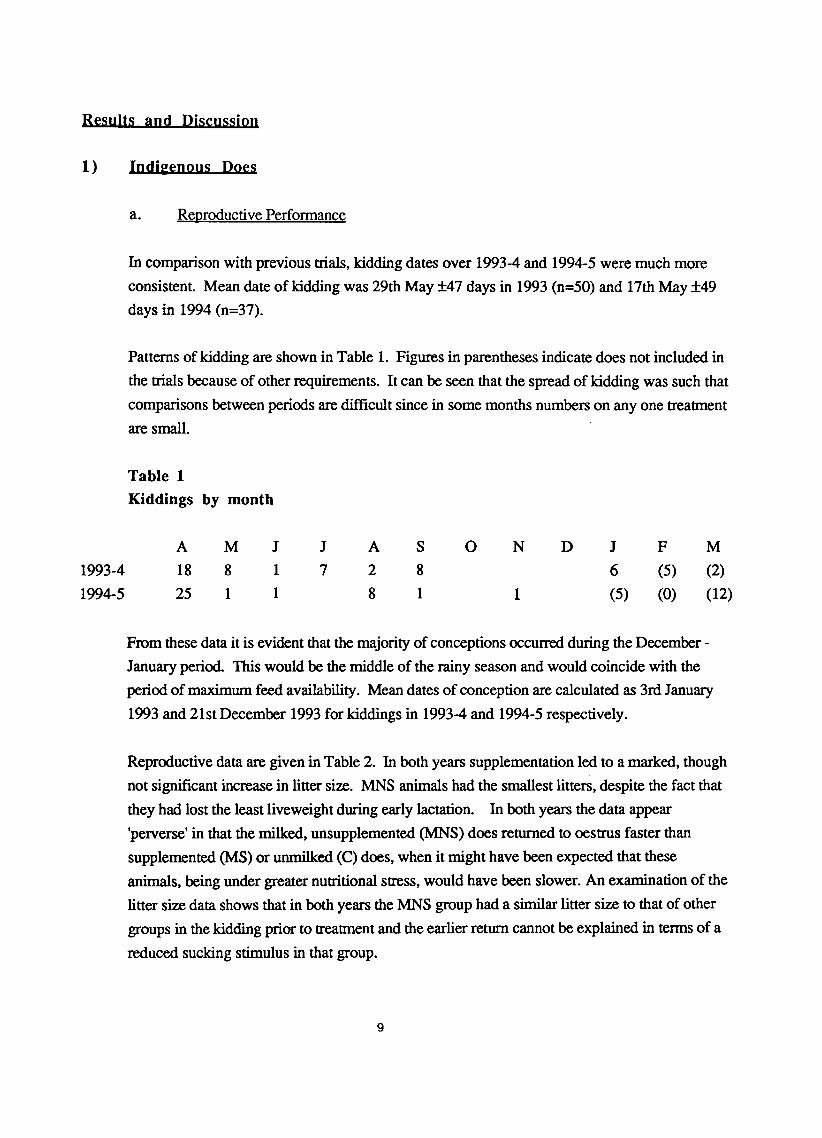
In comparison with previous trials, kidding dates over 1993-4 and 1994-5 were much more
consistent. Mean date of kidding was 29th May :!::47 days in 1993 (n=50) and 17th May :!::49
days in 1994 (n=37).
Patterns of kidding are shown in Table 1. Figures in parentheses indicate does not included in
the trials because of other requirements. It can be seen that the spread of kidding was such that
comparisons between periods are difficult since in some months numbers on anyone treatment
are small.
Table 1
Kiddings by month
S
8
1
0 N F
(5)
(0)
A
18
25
M
8
1
J
1
1
J
7
A
2
8
D J
6
(5)
M
(2)
(12)
1993-4
1994-5 1
From these data it is evident that the majority of conceptions occurred during the December -
January period. This would be the middle of the rainy season and would coincide with the
period of maximum feed availability. Mean dates of conception are calculated as 3rd January
1993 and 21st December 1993 for kiddings in 1993-4 and 1994-5 respectively.
Reproductive data are given in Table 2. In both years supplementation led to a marked, though
not significant increase in litter size. MNS animals had the smallest litters, despite the fact that
they had lost the least liveweight during early lactation. In both years the data appear
'pelVerse' in that the milked, unsupplemented (MNS) does returned to oestrus faster than
supplemented (MS) or unmilked (C) does, when it might have been expected that these
animals, being under greater nutritional stress, would have been slower. An examination of the
litter size data shows that in both years the MNS group had a similar litter size to that of other
groups in the kidding prior to treatment and the earlier return cannot be explained in terms of a
reduced sucking stimulus in that group.
9

Table 2
Effect of Treatment on reproductive performance (mean:!:SD)
Year Treatment
MS MNS c
1.9:tO.8a 1.3:tO.5a1993-94 1.7:tO.5aLitter size
1994-95 1.9:!:O.7a 1.4:!:O.5a 1.6:f:O.5a
1993-94 155:t49.8a 143.7::t83.0a 164.6:t91.4aKidding to
Conception (Days)1994-95 171:t61.6a 163.9::1:86.3a 175.9::f:47.3a
Within rows, means with different superscripts differ significantly, P<O.O5
Unfortunately a number of does did not have any recorded oestrus/service, yet they managed to
kid again! For these animals effective service date has been taken as kidding date minus 147
days. With the exception of does which died, data are available for all but 4 animals in 1993-4
and all but 2 in 1994-5. Because not all services were recorded, data are given as days to
presumed conception. It is evident that milking did not adversely affect conception rates once
cyclicity was re-established. Nor was there a relationship between milk yield (to hand milking)
and days to conception. The regression of days to conception on milk yield (Y) gave the
equation D = 134+O.0039Y in 1993-94 (r2 = 0.05). The equivalent equa.non for 1994-95 was
D = 85+0.0024Y (r2 = 0.27). There was no relationship between date of kidding and days to
conception or litter size.
b. Kid Mortality
Kid mortalities differed between years (fable 3). In 1993-94 there was significantly higher
mortality in the milked groups (p<O.01) with the majority of deaths occurring after hand
milking had started. Mean age at death was 66.3:t36.7 days, 50.1:1:38.1 days and 24.6:1:42.3
days forMS, MNS and C respectively. Three of these deaths followed the death of dams
(2MNS, 1 C) and 7 occurred during an outbreak of bacterial scour in a 2-week period in early
June (3MS, 3MNS, 1C). The figures also include kids which died immediately after birth, an
event not related to the treatment of the does.
10

Most deaths in the control group (60%) occurred in week 1 and all of these were in kids born
as twins. For MS and MNS animals the percentage of deaths in kids born as twins was 67%
and 59% respectively.
Following the appointment of a Veterinary Assistant to take responsibility for the goats (as
required by the project memorandum) mortalities reduced. In the year 1994-5 there were no
differences between treatment in terms either of numbers dying or mean age at death
(54.4:!:56.1 days, 60.8:1:48.9 days and 84.8:1:50.5 days for MS, MNS and C respectively).
Again, the majority of deaths was among kids born as twins or triplets (75%, 67% and 83%
for MS, MNS and C). "Scours" (11 deaths) and pasteurella pneumonia (5 deaths) were
identified as the main problems. In both years the main "season" for deaths was the period May
to July (26 in 1993, 12 in 1994) but this is seen as a reflection of mean kidding date rather than
of a climatic effect.
When mortality data for the two years are amalgamated, overall deaths were 53%, 45% and
33% for MS, MNS and C respectively. These differences were not significant (X2=3.67,
P>O.l).
Table 3
Kid mortality by year and treatment (No. and [%])
Treatment
MNSMS c
1993-94
l7
[63] a 14[58]a 6[20]b
1994-95 8 [40]a 6 [30]a 6 [36]a
Within row, means with different superscripts differ significantly, P<O.Ol.
Kid Liveweightsc.
In 1993 only kids from does being handmilked were weighed monthly. Their weights are
shown in Table 4. There were no differences between MS and MNS animals until week 14,
when MNS kids were significantly lighter. (p<O.O5). By week 18, this difference had been
made good, but it must be remembered that mortalities in these groups were high and thus
numbers were decreased making interpretation of the data difficult since it was usually the
smaller kids which died.
1

Table 4
Kid liveweights 1993 (kgISD)
Age (wks) MNSBirth 1.78:tO.33
2 3.20:tO.76
6 5.30:tO.91
10 ; 6.90Il.50
14 7.64Il.75
18 9.25Il.19
(n=24)
MS
2.00:f:O.37
3. 78:f:O. 75
4.95:1:1.30
6.70:t1.96
8.68:i:2.20
9. 13:i:2.33
(0=27)
(n=14) (0=14)
(n=ll)
(n=10)(0=10)
In 1994-5 all kids were weighed fortnightly. (fable 5) There were no differences between treatments
until 14 weeks, at which age kids from MS does were significantly lighter than others (P<O.O5). At
16 weeks the differences were even greater (P<O.OI) with MS kids not putting on any weight during
the previous 14 days. By week 18 however growth had been re-established and differences were no
longer significant although MS kids remained lighter. Mean liveweight at any age was not affected by
season of birth.
Table 5
Liveweights of kids 1994-95 (k g::tS D)
Age(wks) MNS
(0=18)1.86:tO.33
3.64:tO.82
5.1O:tl.42
5.78:tl.43
6.97:tl.34
8.28:tl.91
9.33:tl.8910.72:t2.14
10.86:tl.99
11.04:tl.89
11.4:t2.07
12.3:tl.73
12.8:tl.50
SIGMS
(n=21)
1.86:t:O.63
3.69:t:O.97
5.03::tl.47
6.32::tl.86
6.85::tl.69
7.38::tl.93
7.35::t2.13
7.92::t2.05
8.86::t2.63
9.36::t2.40
lO.1::t2.44
10. 7::t2. 70
11.5::t2.82
C
(n=24)2.22:tO.59
3.78:tO.734.75:tl.14
5.45:tl.67
6.65:tl.90
7.12:tl.82
9.45:tl.91
lO.O6:tl.64
lO.33:t2.25lO.25:tl.99
BIRTH2
4
6
8
10
12
14
16
18
20
22
24
NS
NS
NS
NS
NS
P<O.O5
P<O.Ol
NS
NS
NS
NS
NS
NS
12


do Doe Liveweight
Control group does were slightly heavier at kidding (33.0:t 7.0 kg) than MS (31.7 :t 6.9kg) or
MNS (31.1 :t 5.9kg). Patterns of weight change are shown in Figure 1. Mean weight loss
was not great, averaging 1.9:tO.59kg in MS, 1.5:tO.69kg in C and 0.7:tO.54kg in MNS
animals. Thus those animals under the greatest potential nutritional stress lost the least.
Minimum body weight (29.8:t 7.3 kg) was reached in week 10 in MS animals. Comparative
figures were 30.4:t 5.3kg in week 10 and 31.5:t 5.4kg in week 8 for groups MNS and C
respectively. Control group animals had regained their kidding weight after 12 weeks, MNSanimals took 14 weeks and MS animals 17 weeks. There was no relationship between milk
yield and weight loss. The correlation co-efficients were 0.101 for MNS and 0.239 for MS.
e. Milk yields and lactation lengths
In January 1994 the trial site was hit by a hurricane and the roof was completely blown off the
goat unit During this event the lactation data for the previous 6 weeks were destroyed. These
were largely for the September kidding does. Milking continued after the accident Thus
lactation lengths are available for all animals but accurate lactation yields are not For these
animals (MNS = 3, MS = 2) total lactation data have been excluded from the following
analyses.
Yield details for 1993-4 and 1994-5 are given in Tables 6 and 7. Overall, supplemented
animals produced significantly more than unsupplemented ones (30.7:1:17.01 vs 17.5:1:10.5 I,
P<O.OI) but between years there were no differences within treatment. Mean lactation length
was not significantly different between years (1993=132.1:1:47.4 days, 1994=159:f:64.6 days)
but within treatment, between years supplemented animals had a significantly longer lactation
in 1994-5 (183.7:1:53.3 vs 139.5:1:42.0 days, P<0.05).
13

Figure 2
Mean Weekly Milk Yields 1993-94 (ml)
Mean
Weekly
Yield
(dl)
Week of lactation
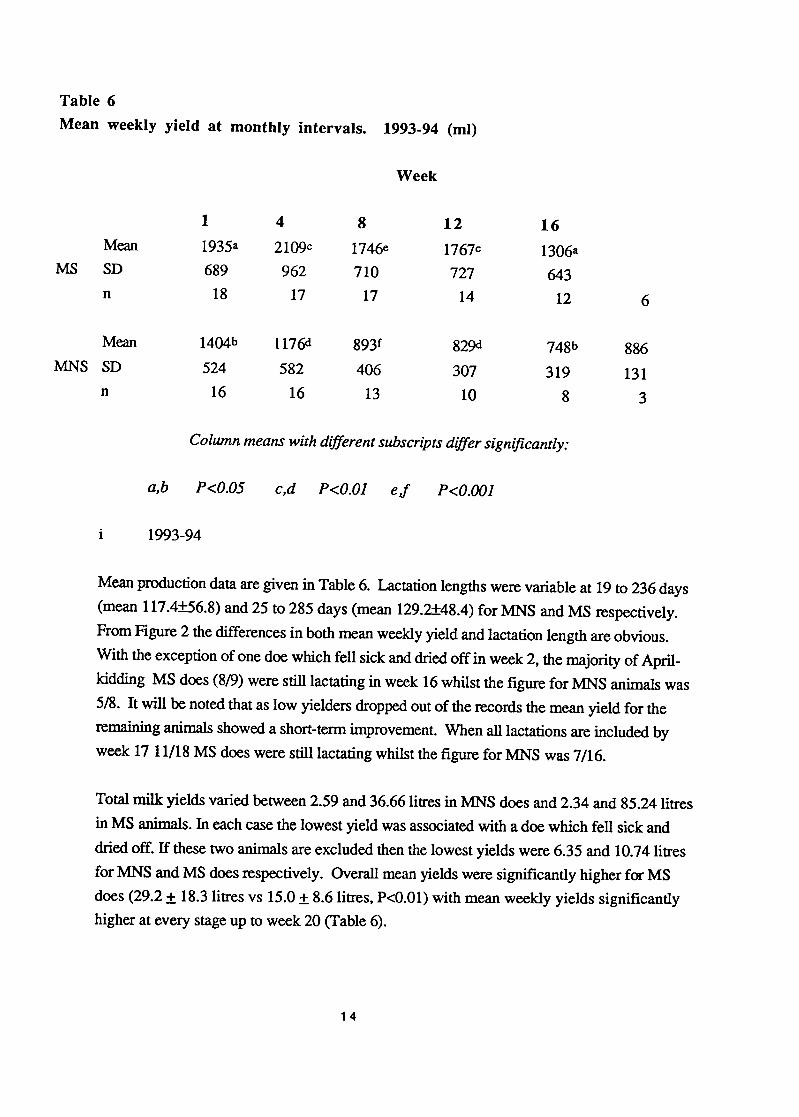
Table 6
Mean weekly yield at monthly intervals. 1993-94 (ml)
Week
1
1935a
689
18
4
2109c
962
17
8
1746e
710
17
12
1767c
727
14
16
1306a
643
12
Mean
SDMS
n 6
Mean
MNS SD
1404b
524
16
L176d
58216
893f
406
13
829<1
307
10
748b
319
8
886
131
3n
Column means with different subscripts differ significantly:
a,b P<O.O5 c,d P<O.OI eJ P<O.OOI
1993-94i
Mean production data are given in Table 6. Lactation lengths were variable at 19 to 236 days
(mean 117.4:f:56.8) and 25 to 285 days (mean 129.2::1:48.4) forMNS and MS respectively.
From Figure 2 the differences in both mean weekly yield and lactation length are obvious.
With the exception of one doe which fell sick and dried off in week 2, the majority of April-
kidding MS does (8/9) were still lactating in week 16 whilst the figure for MNS animals was
5/8. It will be noted that as low yielders dropped out of the records the mean yield for the
remaining animals showed a short-term improvement. When all lactations are included by
week 1711/18 MS does were still lactating whilst the figure forMNS was 7/16.
Total milk yields varied between 2.59 and 36.66 litres in MNS does and 2.34 and 85.241itres
in MS animals. In each case the lowest yield was associated with a doe which fell sick and
dried off. If these two animals are excluded then the lowest yields were 6.35 and 10.741itres
for MNS and MS does respectively. Overall mean yields were significantly higher for MS
does (29.2:t. 18.3 litres vs 15.0:t. 8.6 litres, P<O.OI) with mean weekly yields significantly
higher at every stage up to week 20 (Table 6).
14

Figure 3
Mean Weekly Milk Yields 1994-95 (ml)
Mean
Weekly
Yield
(dl)
-..:
: ", "- 2 4 6 8 10 12 14 16 18 20
Week of lactation

11.
1994-95
Lactation length was again very variable, ranging from 63 to 273 days in MNS (mean J.55.2.:t
70.3 days) and from 118 to 266 days in MS (mean 194.4.:t 55.6 days). As in 1993-94 there
was a marked tendency for more does to dry off 'early' in the MNS group (Figure 3). Only
7/12 does were still milking in week 16 compared to 11/11 for MS. Total milk yields were
equally variable. The mean yield for MNS does was 20.2.:t 12.64litres (range 5.2 to 51.5
litres) whilst for MS it was 27.9.:t 15.181itres (range 14.2 to 64.5Iitres) (Table 7).
Table 7
Mean weekly yield at monthly intervals -1994-95 (ml)
1
1466
566
11
4
1535a
568
11
8
1392
592
11
12
1140
514
11
16977
612
11
20930
435
8
24875346
7
28
877
465
6
Mean
SDMS
n
Mean
SD
1398
496
12
997b
384
12
968
421
12
845 929
456
7
857
418
7
797
320
6
752
367
5
MNS 412
10n
Colwnn means with different superscripts differ significantly, P<O.O5
Compared with 1993-94 overall yields were lower, with the difference for MS animals being
particularly marked Treatment differences were only significant in week 4 (P<O.O5). Thus
supplementation produced a smaller yield response in 1994/95 than it did in 1993 (Table 8).
Table 8
Differences in weekly yields 1993 -94 and 1994-95 [MS-MNS](ml)
Week
1
531
68
4
933
538
8
853
424
12
834
295
16
57848
20
465
73
24 281993-94
1994-95 78 125
15

Kidding patterns were similar in the two years, with a majority of does kidding in April and May. This
would coincide with a reduction in herbage availability following cessation of rains. However, in both
years rainfall patterns were similar and cannot be used to explain these differences.
2. Crossbred Doe~
Reoroductive PerfonnanceR.
Thirteen does of the 15 acquired kidded in 1994. With only one doe producing twins,
mean litter size was low at 1.07. Five does subsequently kidded again before the
completion of the trial and again litter size was low at 1.00. Kid mortality was high
with 9/14 kids dying at a mean age of 16 days. Unlike the indigenous does, which
were allowed to suckle their kids for 21 .:t 3 days before being milked by hand,
crossbred does were milked from day 4. With hindsight this policy was almost
cenainly detrimental. A subsequent small-scale observation on indigenous does, when
oxytocin injections were used to determine levels of residual milk following hand
milking, (fable 9) suggested that the residual milk averaged 48.7%.
Table 9
Levels of milk :-in indigenous does milked with or without oxytocin (ml).
Week
Oxytocin 1
16.323.2
3
16.722.8
4
14.720.8
5
16.117.1
6
8.219.8
7
8.613.8+
This amount would be enough to provide some nutrients for the young kids. If cross-
bred goats have a 'better' let-down reflex then it is likely that milking from day 4 did
not leave adequate feed for the kids.
Rebreeding performance was very variable. Mean kidding to conception inteIVal was
161.6:t 118.5 days and predicted mean kidding index 308.4:t 127.6 days. These
means were not dissimilar to those for the indigenous does (fable 2) though the ranges
were greater. There was no correlation between rebreeding and milk yield
(D=140+0.0014Y, r2=0.097).
16
2
15.524.7

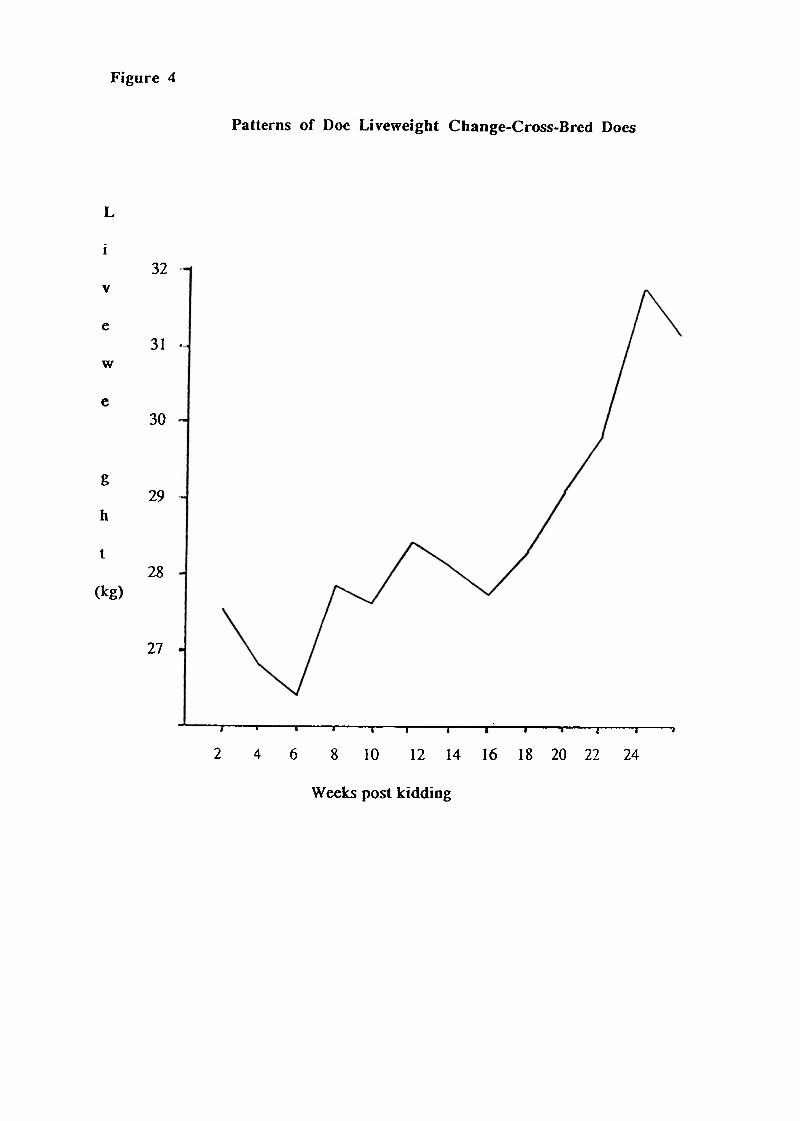
Figure 4
Patterns of Doe Liveweight Change-Cross-Bred Does
L
I
32v
e31 .-
w
e30
g29
h
t28
(kg)
27
~ I' .., I II' , , I'
2 4 6 8 10 12 14 16 18 20 22 24
Weeks post kidding

b. Doe Liveweight
With a mean liveweight at kidding of 27.6 ::t 6.7 kg crossbred does were slightly lighter
than indigenous animals, though the range of weights was similar. Weight loss was
also similar at 1.9::t 1.6 kg. Interestingly, minimum weight was reached more quickly
in the cross-breds, with 75% of does in a weight gain situation by week 6 and all of
them by week 10. It is likely that this was a reflection of low body fat levels at kidding.
Mean weight gain continued (Figure 4) so that by 26 weeks post-kidding does were
similar in weight to the indigenous MS animals (31.3::t 5.9lkg vs 31.3::t 7.1kg). As
with indigenous does, there was no correlation between yield and weight loss (Corr
coeff. 0.050).
Milk Yieldsc.
One doe failed to give any milk to hand milking and attempts were discontinued. For
the remaining 12 lactations mean yield was 35.7 j;: 27.3 litres in 144.8 j;: 102.8 days.
Yield patterns are shown in Table 10 and Figure 5.
Table 10
Mean weekly yield at monthly intervals. crossbred does (ml).
Week
8
2045
1050
10
1
2241
1072
12
4
2145
927
11
12
1469
761
9
16
1353
485
6
20
1471
522
4
Mean
SD
n
When yields are recalculated from day 21, to make them more comparable to those of indigenous
does, then the mean yield becomes 31.8.:t. 25.4litres, a figure very similar to the 27.9 .:t. 15.21ittes
achieved by MS animals in the same year. The range of yields (5.6 to 93.11itres) which led to the
large Standard Deviation, does indicate the increased potential in at least some cross-bred animals, but
equally it is clear that crossbreds do not demonsttate an obvious superiority under low-input
conditions. Given the number of does drying off early, there may well be scope for a selection
programme designed to identify persistency of lactation but such an approach could increase the cost of
animals and this would run counter to the minimum-cost philosophy necessary if milk is to be
consumed rather than sold.
17


Discussion
The data generated here largely support earlier findings in teImS both of the magnitude of parameters
measured and of the between-year variability demonstrated. Over five years of trials, supplementation
has consistently produced a yield response, but that response has varied according to month of kidding
(project XO124) and even with similar kidding patterns (project XO254). In a uni-modal rainfall
situation a month-of-kidding effect was to be expected and may be explained in teImS of availability of
forage at critical times. Between-year variation, when kidding dates were similar, is more difficult to
explain, particularly when rainfall patterns were apparently similar in both years.
If the milk taken from indigenous does is to be useful then daily production needs to be in excess of
150ml. The compositional quality of this milk has been shown to be high with 53g prot/kg. (Banda
1992b) Two hundred millilitres can thus provide a child with over 109 high quality protein (50% of
RDA) as well as valuable amounts of Calcium and Vitamin A. In these trials supplemented animals
sustained these production levels for an average of 20 weeks in 1993-94 and 12 weeks in 1994. The
lower production of unsupplemented animals would still make a contribution to the diets of small
children but would be unlikely to justify the effort involved.
However, any such production will only be acceptable if it does not prejudice other outputs and
outcomes. Where does were milked but not supplemented kidding was 130%. This figure is not high,
in view of the perception of the goat as a fecund animal, but it is better than the 109% reponed by
Reynolds (1979) and the 107% ofKarua (1988). It is clear that supplementation in the period leading
up to service improved ovulation rate and hence litter size, as would be expected. Kid monality is
clearly a potential problem, though variations between years have been shown to be considerable. Of
the 5 years covered by projects XOI24 and X0254 four have not produced any treatment effects. Over
that period overall kid monality has averaged 38%. The 60% monality experienced in kids from
milked does in 1993 was thus both distressing and unexpected and the outbreak of bacterial scour
aside, not easily explained. In terms of growth the 9.18::1:1.64 kg at 18 weeks attained by those
surviving to that age was higher than those attained in the earlier trials and in line with those reponed
by Renolds (1979), for kids from unmilked does, which averaged 8.2::!:2.0kg at 12 wks and
11.9::I:2.7kg at 24 weeks. Malnutrition does not therefore appear to have been a problem, in surviving
kids at least!
It is normally expected that lactating females lose weight in early lactation and this weight loss may be
associated with delays in fe-establishment of oestrus and/or poor conception rates, especially if it
exceeds 5% of bodyweight. All three trial groups lost weight, as expected, but losses were within the
acceptable range and did not affect subsequent reproductive performance. It is therefore suggested that
the handmilking of does is a practice which may be undertaken without detriment to the doe or to her
8

.
production. It is clear, however that kid monality may be substantial and that the benefits of having
milk available will need to be weighed against these potential losses. Nonetheless, it is accepted that,
despite attempts to min-or subsistence farming conditions, it is possible that in a genuine village
situation the impact of the strategy might be greater. It is considered desirable that an evaluation of the
technique be canied out under village conditions. Further, given that the routine, daily milking of does
with very small teats might be considered tedious, such an evaluation would allow evaluation of the
acceptability of the technique and the likelihood of its uptake. In view of the intention to make any
milked produced available to the younger children in a family, it is desirable that the woman of the
house be the main participant in any such trial.
ProDosal~
In view of the findings reponed here, and those from project XO124 it is proposed that consideration
be given to:
i) Establishing a field nial in which these findings may be tested in a subsistence-fanning
environment and the acceptability of the technique determined.
ii) Extending the project to other countries in the region. Given the widespread occurrence of
goats of this type in Mocambique, Zambia and Zimbabwe, and in view of the child malnutrition
prevalent in these countries, it is desirable to determine whether similar strategies are capable of
providing similar benefits there.
References
Banda, J. 1992a. Acceptability of goats', sheeps' and cows' milk in Malawi. J Cons. Stud.& Home
Econ. 16. 129-138
Banda, J. 1992b. Genotypic and seasonal influences on milk yield and composition of sheep and goats
in Malawi. Ph.D. Thesis, University of Giessen.
Karua, S. 1988. Reproductive perfonnance of indigenous Malawi goats under traditional management.
Munco, Goat Development Workshop, Bikika, Zimbabwe.
Reynolds, L. 1979. Breeding performance and growth rates of indigenous Malawi goats. Bunda
College Res. Bull, 10,90-100
19

.
Appendix I
Proximate analysis of maize bran
%
91.0
10.18.87.06.259.0
14.0 MJ/kgDM
Dry Matter
Crude Protein
Other Exttact
Crude Fibre
Ash
Nitrogen -free extract
Estimated ME
20

,.SMALL STOCK PROJECT XO254
MILK PRODUCTION, ETC
FINAL ACCOUNT
1993-94
£1994-95
£
Total
£
Salaries 4850 4850 9700
Overheads 2108 2108 4216
Consumables 1150 1115 2265
550 50 600Misc Costs
Travel/Subs 3450 3235 6685
Total 12108 11358 23466
I certify that the above expenditure has been wholly and necessarily expended under the grant, in
accordance with the terms and conditions of research project XO254.
Project Leader
21
/)