milk value chain analysis: industry competitiveness … milk value chain analysis: industry...
TRANSCRIPT

1
Milk value chain analysis: industry competitiveness and the dairy policy
environment in Pakistan
S. S. GodfreyA, C, G. C. RamsayA, K. BehrendtA T.L. NordblomA, B and P. C. WynnA
AGraham Centre for Agricultural Innovation (alliance between Charles Sturt University and NSW
Department of Primary Industries), Wagga Wagga, NSW 2650, Australia.
BStrategic Policy and Economics Branch, NSW Trade and Investment, Wagga Wagga, NSW 2650,
Australia.
CCorresponding Author: Sosheel Godfrey E-mail: [email protected] /
1. Introduction
This paper develops and uses value chain analysis framework as a lens to examine the Pakistani dairy
industry. It explains the functioning of a rural-urban milk value chain case study with a particular
focus on the poor and disadvantaged. The literature review initially focuses on Pakistan and its dairy
industry to understand the challenges that it faces. The later section then dwells deeper into the value
chain theory, which has been used as a framework to design the questionnaires needed for this
research.
Effective value chains are essential in meeting the evolving needs of the poor. These typically
represent small-scale production and marketing systems, which offer the means to increase access to
animal sourced foods for poor consumers, and present opportunities for poor producers and
marketers: thus they have a pro-poor value chain focus (Echeverría, Solh, Seré, & Hall, 2011.
Urbanization also provides economies of scale for markets closer to home and opportunities for a
local production base from farmers whose livelihoods depend on related food systems {Food and
Agriculture Organization, 2013 #309). Policies and development strategies in many countries,
2
however, often fail to recognize and provide adequate support to smallholder production systems and
value chain development, focusing instead on higher‐profile industrial production (Echeverría et al.,
2011).
Pakistan faces numerous domestic and external challenges. The country’s economic performance, in
the last several years, has continuously been affected adversely by devastating floods, internal
security hazards, and a severely crippling energy crisis that has led to large-scale power outages and
depressed output (Ahmad, 2013; International Monetary Fund, 2013a, 2013b). Agriculture has a 21
percent share of GDP in 2012-13 and is important to the country’s economy with livestock making
up a 56% share of the agricultural economy (Ahmad, 2013). The agriculture sector is the major
employer absorbing 45% of the total labour force (Mazhar, 2013). Agriculture engages half the
country’s households and 59% of those households are in Punjab (Government of Pakistan, 2010).
The sector is though categorized as non-wage employment. The value added to the economy per
worker in the primary sector stands quite low at $US 1,187 (World Bank, 2012).
Pakistan’s 184 million people is growing at two percent per annum. The country is projected to be
world’s fifth most populous nation by 2050 (Mazhar, 2013; United Nations, 2012; World Bank,
2014). Thirty-six percent of country’s population is urban. Punjab is population wise country’s large
with 53% of the total population (Mazhar, 2013; United Nations, 2012; World Bank, 2014).
The research focused on milk supply chains from irrigated rural districts to the urban Lahore city,
second most populous city of Pakistan with and population of nine million plus(Government of
Pakistan, 2011; Government of the Punjab, 2012; Mazhar, 2013).
According to a 2008 survey, 21% of the country’s population was below the extreme income poverty
measure of $1.25 a day, while 60% have incomes of less than $2 a day (World Bank, 2013).
The Multidimensional Poverty Index (MPI) provides an index of overlapping deprivations in health,
education and standard of living. Using this criterion, Pakistan ranks as the second highest in South
Asia with 49% of the population living in multidimensional poverty (Malik, 2013). Poverty is closely
3
linked with undernourishment assessed by energy intake (Food and Agriculture Organization,
2013b). Pakistan’s annual development plan 2013-14, disclosed that 33% of the country’s children
under five years of age and 18% of mothers are underweight (Planning Commission, 2013). These
facts highlight the issue of under nutrition in Pakistan and studying the diets of average Pakistanis.
Milk and particularly fresh milk is important in the diet of an average Pakistani household that which
spends almost eleven percent of the household budget on milk and milk based products1 (Government
of Pakistan, 2013). Milk2 provides 10.6% of the 1700 calories and 18.7% of the 45 grams of protein
consumed per capita per day (Pakistan Bureau of Statistics, 2011; Wynn et al., 2006). Despite, the
significant importance of fresh milk in human diet and high production base, consumption per capita
has shown a decreasing trend in the last ten years. The fresh per capita milk consumption has gone
down by about 5% since 2007 (Government of Pakistan, 2011, 2013).
This pattern can be linked directly to inflation and food price escalation in particular. Pakistan has
experienced double-digit inflation for five consecutive from the fiscal year 2007 to 2012 (Khan,
2012). Food inflation in the same period averaged 14%, which has resulted in phenomenal food price
increases. This steep rise in prices is an enormous challenge in particular as real household incomes
have been stagnant since FY 2000 (Asian Development Bank, 2011; Siddique, 2011). Average own
price elasticity of demand for dairy products in Pakistan is inelastic (-0.571)3 (United States
Department of Agriculture [USDA], 2005).Income elasticity of demand for dairy products is 0.779,
which means their consumption is less sensitive to incomes, a common occurrence with basic
necessities (Andrew, Seale, Meade, & Regmi, 2013; United States Department of Agriculture
[USDA], 2005).
Livestock is a crucial component of country’s mixed crop-livestock farming system. Pakistan ranks
as the second and eleventh largest country for whole fresh buffalo and cow milk production
1 From HEIS 2011-12, average household spends 45.01% on food. Of that 20.59% goes to fresh milk and 25.21% to all dairy products combined. This makes the share of fresh milk as 9.3%=45.01÷100×20.59 and milk and milk based products as 11.3%=45.01÷100×25.21, in the total consumption
expenditure. 2 unpackaged fresh, packaged and powdered 3 1% increase in the prices will decrease demand by only -0.571
4
respectively (FAOSTAT 2011). Overall, the country is ranked the third largest milk producer in the
world (Hemme, 2010).
Milk production in Pakistan has grown at 3.3 % per annum in the last decade (Food and Agriculture
Organization, 2013a). The country raises buffalo and cattle for milk and meat remains a by-product
of these animals (Wynn et al., 2006). FAO data for 2011 suggest milk from buffalo and cattle is the
most valuable of all the agricultural commodities produced in the country (Food and Agriculture
Organization, 2013a). Punjab has a 63% share of milk production (Fakhar, Fakhar Law International,
& Walker, 2006).
Small dairy holders dominate the sector. Milk is crucial to meet the nutrient needs of dairying
communities and to maintain regular cash flows. Livestock also acts as a buffer to mitigate risk from
damage to crops (Afzal, 2010; Fakhar et al., 2006; Farooq, 2012; Teufel & Gall, 1999).
Approximately 80 percent of milk is produced in rural areas with urban and peri-urban areas
accounting for 20% of the total production. Approximately 60% of the milk produced in rural farms
is consumed at the household level and the rest is sold (Zia, Mahmood, & Ali, 2011). Despite decades
of livestock rearing the productivity remains low at 1290 kg per annum per animal whereas it is 5773
kg per cow per annum in Australia (Fakhar et al., 2006) (Wynn et al., 2006).
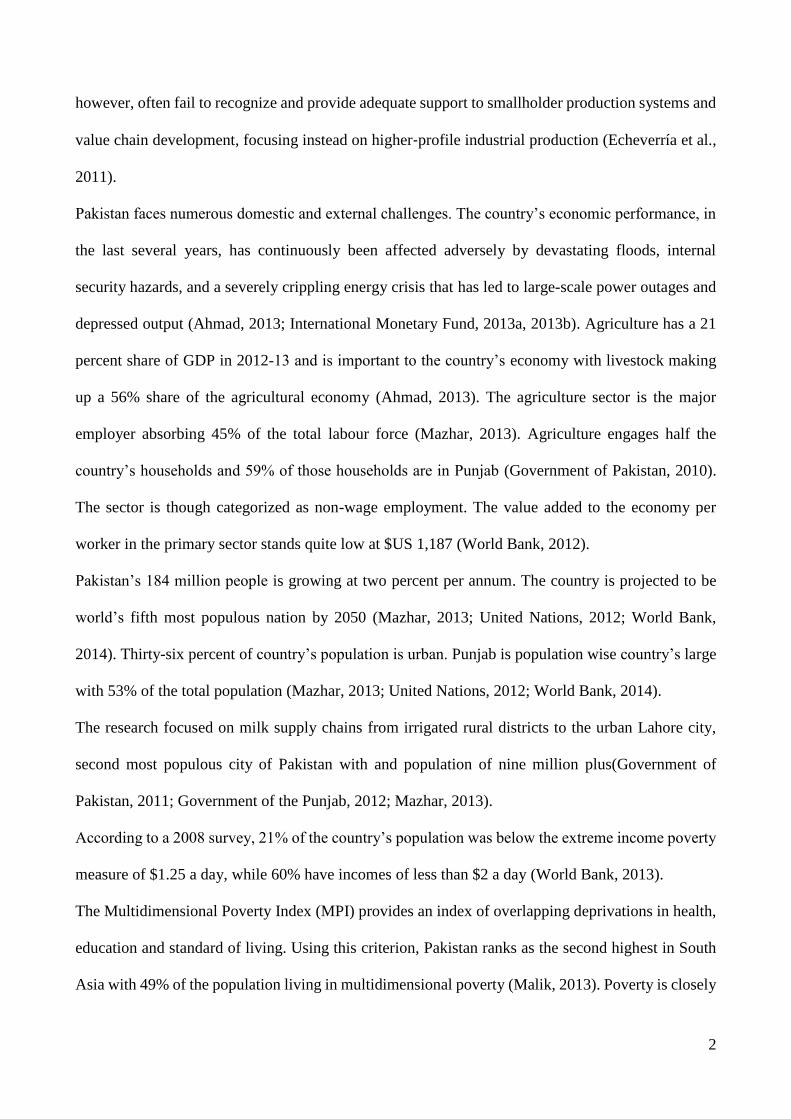
Domestic milk supply is seasonal and inversely related to demand. Milk demand peaks in summer
due to increased usage of milk based drinks and yogurt, whereas supply declines with decreased
production in winter (Figure 1).

5
Figure 1: Seasonal changes in milk production and the related practices
Data Source: Adopted from Anjum, Lodhi, Raza, Walters, and Krause (1989)
Production of milk falls to 55% of peak production at its lowest point in mid-June, while the demand
increases 60% during this time compared to December when the milk supply is ample. The supply of
buffalo milk decreases in the summer months of May-June and increases by an estimated 88 % in
winter during January-February. For buffalo, winter is widely recognized as the period of flush
production whereas heat stress is linked to the decline in summer.
Cows, on the other hand, are more productive during the summer with high milk production in May-
June and low production in November-December. This offsets the buffalo yield pattern to maintain a
more constant milk supply in addition to the wide use of reconstituted powdered milk by the formal
sector. During the lean season, when the availability of the milk is very limited, the prices increase
(Anjum et al., 1989; Fakhar et al., 2006).
Modern processing plants were introduced as early as the 1960s, to meet the growing urban demand
for milk. The 23 milk pasteurization plants were located around the major cities of Islamabad, Lahore
and Karachi. These plants have all closed which signaled poor acceptance of reconstituted milk by
consumers. In 1977, ultra heat treated (UHT) milk was introduced by a local packaging company and
later taken over by Nestlé Pakistan. Currently, there are twelve large-scale dairy processing plants in
50
60
70
80
90
100
Jan Feb Mar Apr May Jun Jul Aug Sep Oct Nov Dec
Ind
ex o
f p
rod
uct
ion
&
con
sum
pti
on
Seasonal change in milk supply and demand
Supply
Water
Demand
Excess demand met by recostituted, powder and diluted milk
Excess supply that is converted to powder and other processed products
Milk supply
Dilution
(milk + water)
Demand
6
Pakistan that on average operate at 50 percent of their capacity. The operational capacity goes down
particularly in summer when production is low and demand is high (Anjum et al., 1989; Zia et al.,
2011).
Although the country’s formal processing industry segment has negligible (less than five percent)
market share, there has been a strong overall industry growth (Staal, Pratt, & Jabbar, 2008, p. x). Milk
is supplied to the consumers by two main types of chains that can be defined as informal and formal
chains. The main differences between the two are cool chain infrastructure and logistics, hygiene and
handling practices and packaging (Zia et al., 2011).
Quality remains a continuous concern in these informal chains. Milk adulteration is associated with
dilution by up to 60% with poor quality water as well as the use of penicillin, formalin, hydrogen
peroxide, milk productivity hormones and many other potentially harmful preservatives and residues
(Staal et al., 2008). Informal milk value chains operate with minimal technology and infrastructure
but remain a dominant link between millions of urban consumers and predominantly smallholder
dairy producers. The function of milk collection, transport, and distribution is performed by different
tiers of small, medium and large vendors, colloquially known as dodhis. The milk is sold by
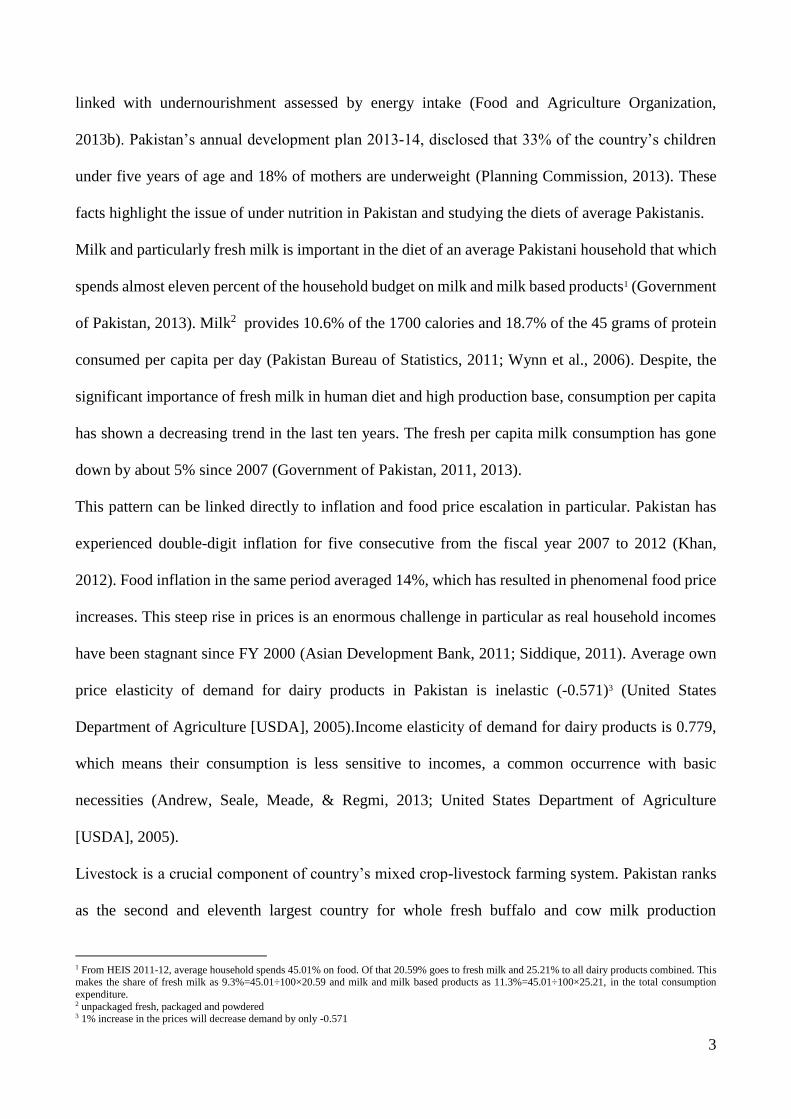
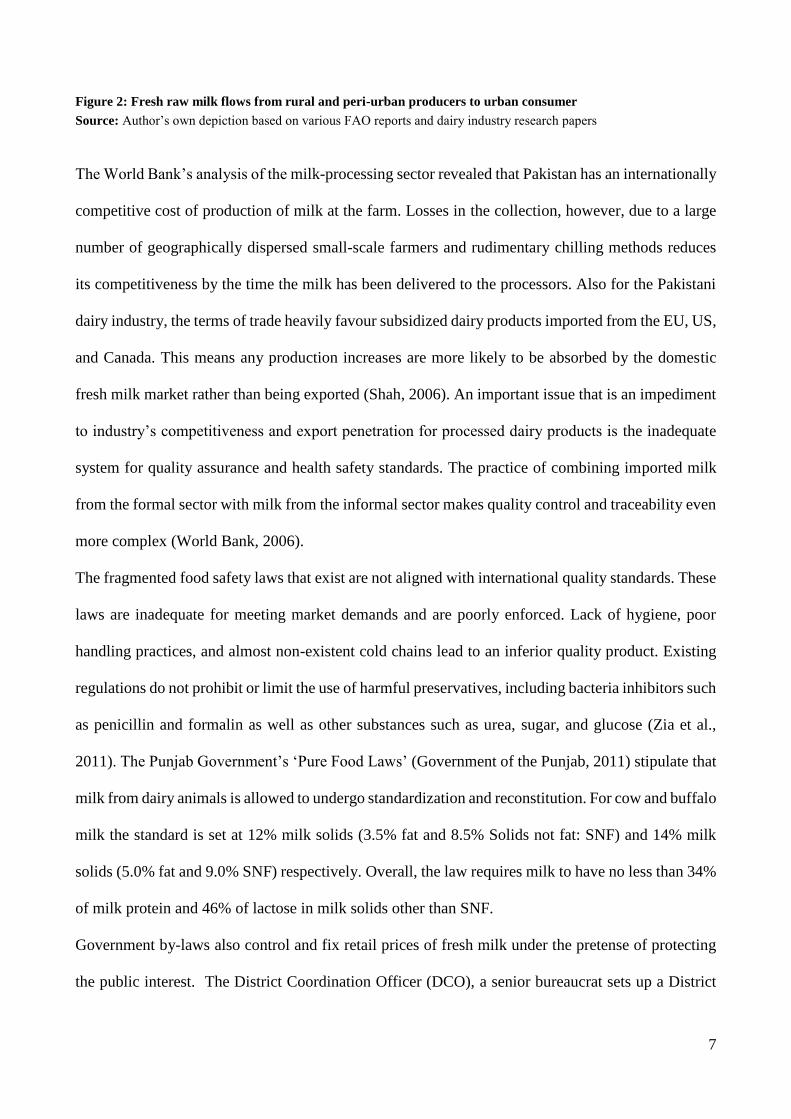
specialized retail milk shops to final consumers (Figure 2) (Burki & Khan, 2007; Burki, Khan, &
Bari, 2004).
Domestic milk
production
• 80% rural (60%
consumed at source)
• 20% urban & peri-
urban
40% of rural production
• 85% procured by small, medium
and large dhodhis
• 10% goes to dairy processors
• 5% to bakers or confectioner
Urban fresh
unpackaged milk
consumption (39.5%
of total production)
• Specialized retail
milk shops
• Home delivery by
retail shops and
dhodhis
• Self pick up by
consumers from peri
urban dairies
Whole urban & peri-urban production
• 85% sold directly to urban
consumers
• 15% sold to specialized retail milk
shops
Supply Chains
52% of total
production
Total production
(0.8% imports and 0.02%
exports)
44.5% of total
production
Urban & rural total
packaged fresh milk
consumption is (4.75% of
total production)
7
Figure 2: Fresh raw milk flows from rural and peri-urban producers to urban consumer
Source: Author’s own depiction based on various FAO reports and dairy industry research papers
The World Bank’s analysis of the milk-processing sector revealed that Pakistan has an internationally
competitive cost of production of milk at the farm. Losses in the collection, however, due to a large
number of geographically dispersed small-scale farmers and rudimentary chilling methods reduces
its competitiveness by the time the milk has been delivered to the processors. Also for the Pakistani
dairy industry, the terms of trade heavily favour subsidized dairy products imported from the EU, US,
and Canada. This means any production increases are more likely to be absorbed by the domestic
fresh milk market rather than being exported (Shah, 2006). An important issue that is an impediment
to industry’s competitiveness and export penetration for processed dairy products is the inadequate
system for quality assurance and health safety standards. The practice of combining imported milk
from the formal sector with milk from the informal sector makes quality control and traceability even
more complex (World Bank, 2006).
The fragmented food safety laws that exist are not aligned with international quality standards. These
laws are inadequate for meeting market demands and are poorly enforced. Lack of hygiene, poor
handling practices, and almost non-existent cold chains lead to an inferior quality product. Existing
regulations do not prohibit or limit the use of harmful preservatives, including bacteria inhibitors such
as penicillin and formalin as well as other substances such as urea, sugar, and glucose (Zia et al.,
2011). The Punjab Government’s ‘Pure Food Laws’ (Government of the Punjab, 2011) stipulate that
milk from dairy animals is allowed to undergo standardization and reconstitution. For cow and buffalo
milk the standard is set at 12% milk solids (3.5% fat and 8.5% Solids not fat: SNF) and 14% milk
solids (5.0% fat and 9.0% SNF) respectively. Overall, the law requires milk to have no less than 34%
of milk protein and 46% of lactose in milk solids other than SNF.
Government by-laws also control and fix retail prices of fresh milk under the pretense of protecting
the public interest. The District Coordination Officer (DCO), a senior bureaucrat sets up a District

8
Price Review Committee comprising representatives from the livestock department, dairy farmers,
milk retailers, consumers and various stakeholders in the milk trade. This price review committee,
under the overall leadership of the DCO, reviews and sets the price of milk and thus plays a significant
role in the fresh milk market (Zia, 2007). These prices are not based on the cost of production but
favour urban consumers. Although not strictly enforced yet, these prices act as a disincentive to
investors to improve and invest in the production of better quality milk (Ministry of Food, 2007).
The livestock sector has long been identified by the government as being of crucial importance to
support the pro-poor growth (Amjad, 2010). There exists an unapproved national livestock
development policy initiated in 2007 that recommends rationalization of milk and meat prices. It also
raises the need for easy access to credit for small livestock farmers, who fail to meet the collateral
requirement for financial institutions and a liberal credit regime from production, processing through
to marketing. Another important point that the policy raises is the provision of a level playing field
for the local dairy industry by imposing duty and taxes on imported milk powder and other dairy
products equivalent to the production and export subsidies provided by the exporting countries
(Ministry of Food, 2007).
Despite the importance of fresh unpackaged milk supply chains, very little is known about them and
how and why have they been operating so successfully over so many decades. The work done on
these chains so far, very broadly identifies traditional milk marketing channels and role of chain actors
(Ali, 2006; Anjum et al., 1989; Fakhar et al., 2006; Raja, 2001; Sharif & Farooq, 2004; Zia, 2007;
Zia et al., 2011). Therefore, this research project aims to look at these chains from a developing
country’s pro-poor value chain perspective.
9
Competition and the role of firms in a market economy, competitive advantage, and the
value chain
The section aims to set the scene for studying the competitiveness of an industry and where value
chains impact on industry efficiency in a developing country.
Bain (1968) developed the industry structure-conduct and performance (S-C-P) model to examine the
efficiency of the industry. The model suggests classification of industries according to their
characteristics that provide a framework to test the influence of market structure on market conduct
and performance. Bain describes market economies, as a multitude of privately owned enterprises
that produce goods and services. These enterprises determine what and how much of each commodity
is produced and how they distribute it to the end users. The Government’s role is as referee and rule
maker to put in place certain minimal restraints in the public interest otherwise a laissez-faire4
approach would be the rule.
Porter (1998) built on the industrial organization theory and brought firm at the centre of focus to
understand competitiveness that is the ability of a firm to develop and maintain an edge over rivals in
an industry. To diagnose competitive advantage, it is necessary to define a firm’s value chain in
relation to a particular industry. A value chain is a basic tool that examines all the activities performed
by a firm and their interactions help establish their competitive advantage. The structure of an industry
both shapes the value chain of a firm and is a reflection of the collective value chains of competitors.
Structure determines the bargaining relationships with buyers and suppliers that are reflected in both
configuration of a firm’s value chain and how the margins are divided (Porter, 1998).
This S-C-P model and the value chain theory are the genesis of this research’s analysis framework.
From here onwards, the review will dwell deeper into the value chain theory to develop a basis for
the analysis.
4 French, literally "let (people) do (as they think best),"
10
Value chains approach and analysis framework
In value chain approach, the competition or rivalry debate shifts from that among the firms and
industry to value chains and firms within those chains competing against each other in order to get a
larger share of the final consumers’ expenditure on food (Boehlje, 1999). The competitiveness is
influenced by inter-firm interactions (Collins, 2009) with competition in many instances, evaluated
as a network of co-operating firms competing with other firms along the entire chain (Spekman,
Kamauff Jr, & Myhr, 1998). The chain starts from the production system of the raw materials and
will move along the linkages with other enterprises engaged in trading, assembling, processing and
marketing the product(Purcell, Gniel, & van Gent, 2008). Customers are businesses that are the next
links in the chain to which the product is sold while consumers are the final users of the finished
product (Fearne, 2009).
For developing countries, value chains and the way they are governed have important development
implications and therefore need to be understood. The chains have different patterns of organization
and it is important to recognize these differences to identify the inherent risks and opportunities
arising from these patterns, especially for poor people. This is required to form policies that optimize
social inclusiveness without sacrificing long-term competitiveness (Altenburg, 2006c). How different
forms of industrial organization impact on the availability, quality and price of products is, therefore,
a development issue, especially if the goods concerned make up a substantial share of the poor
households’ consumption basket (Altenburg, 2006b) and affect the prospects for economic growth
and poverty reduction in the development of less demanding local markets (Humphrey, 2006).
The basic principle of value creation is to produce or provide a product or services that will create
sufficient value for customers and end users (Boehlje, 1999), as customer value is a single major
source of competitive advantage (Woodruff, 1997). The term value from a chain’s perception refers
to those attributes that are valued by the next customer downstream or the final consumers who use
11
the finished product supplied by a specific chain (Collins, 2009) with the consumer as the ultimate
target of the activities of a chain (Collins, 2006).
A few key definitions of value chains that will guide this value chain analysis framework are as
follows:
Collins (2009) defines “Food value chains as systems driven by the interaction of their technical
(production, processing, transport etc.), economic (profitability), information-related
(communication) and governance (human relationships) systems”.
Boehlje (1999), makes a case for the structural realignments in agricultural industries that relate to
transactions between various tiers of firms, require an understanding of relationships and information
flows as well as physical and financial flows, best described by taking a value chain approach
(Boehlje, 1999). He thus advocates using VCA as an industry wide tool. Boehlje suggested that the
conceptual framework to study the structural changes in an agricultural industry would come from
various fields or disciplines. The challenge is to integrate the appropriate concepts into a
comprehensive analytical framework (Boehlje, 1999).
Altenburg (2006a) linked VCA to industry analysis that focuses on the impediments to growth,
studying upstream and downstream operations as a relevant framework influencing an industry’s core
competitiveness.
At the heart of chain mapping is the wider industry and key linkages (Purcell et al., 2008). VCA plays
a key role in understanding the need and scope for systemic competitiveness and is useful analytical
tool in understanding the policy environment (Kaplinsky & Morris, 2001).
This research will draw on VCM literature to identify key building blocks for a VCA framework to
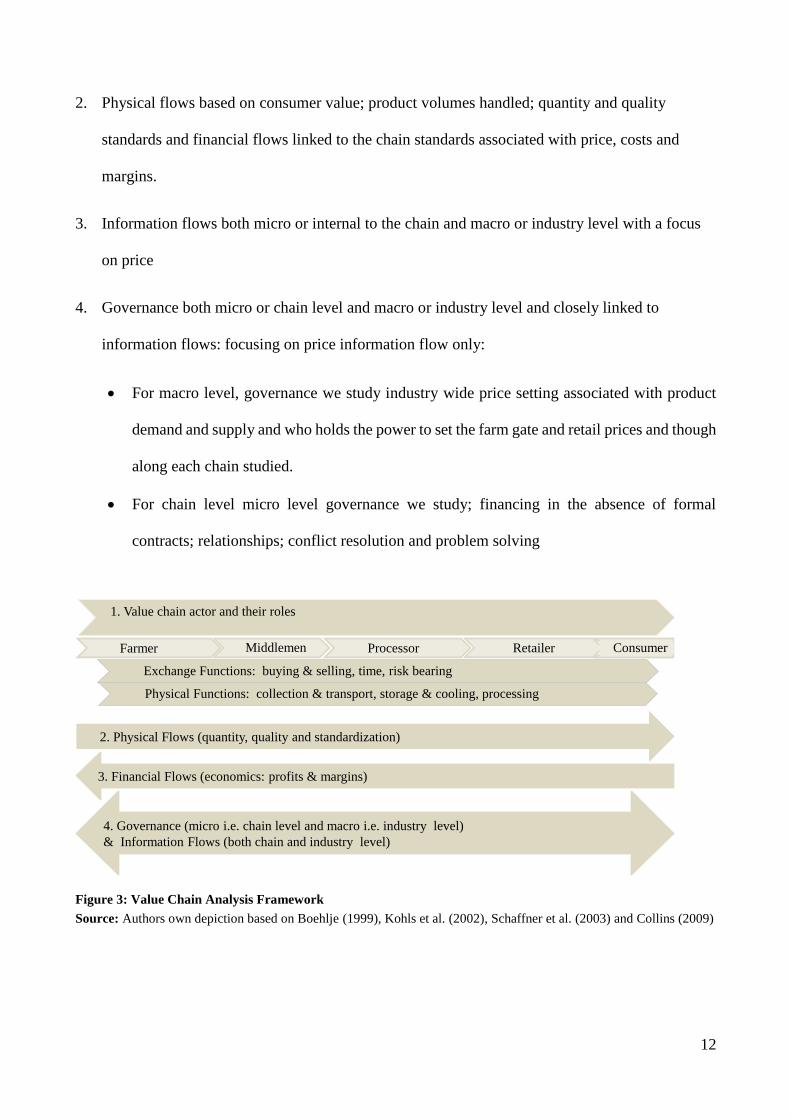
carry out this research and its analysis, focusing on the following four key areas (Figure 3):
1. Actors and their core roles along the chain, which includes buying and selling; technology used
and physical functions of production, storage and cooling, processing and transport and the time
associated with these physical functions; risks associated with handling a perishable product.
12
2. Physical flows based on consumer value; product volumes handled; quantity and quality
standards and financial flows linked to the chain standards associated with price, costs and
margins.
3. Information flows both micro or internal to the chain and macro or industry level with a focus
on price
4. Governance both micro or chain level and macro or industry level and closely linked to
information flows: focusing on price information flow only:
For macro level, governance we study industry wide price setting associated with product
demand and supply and who holds the power to set the farm gate and retail prices and though
along each chain studied.
For chain level micro level governance we study; financing in the absence of formal
contracts; relationships; conflict resolution and problem solving
Figure 3: Value Chain Analysis Framework
Source: Authors own depiction based on Boehlje (1999), Kohls et al. (2002), Schaffner et al. (2003) and Collins (2009)
4. Governance (micro i.e. chain level and macro i.e. industry level)
& Information Flows (both chain and industry level)
Farmer Middlemen Processor Retailer Consumer
2. Physical Flows (quantity, quality and standardization)
3. Financial Flows (economics: profits & margins)
Exchange Functions: buying & selling, time, risk bearing
1. Value chain actor and their roles
Physical Functions: collection & transport, storage & cooling, processing
13
Value chains actors and their core roles, technology and infrastructure and physical
spoilage risks
Food systems have various business structures and contributors that have various roles (Tansey &
Worsley, 1995). A range of physical activities are performed in the food chains that create value for
the final consumer. Transport is required to move products from where they are produced to
consumption centres. Storage and cooling is required to buffer day-to-day variations in supply and
demand, which are seldom in balance. Fresh produce, in particular, is highly perishable and ideally
requires cool chain infrastructure to maintain a certain temperature, which is often quite a costly
endeavour.
Processing of fresh produce adds value and is essentially a form changing activity. Risk bearing is
another component of a fresh produce supply chain. Product deterioration or spoilage is a major risk,
which can result in substantial losses to the firm holding the product title (Gunderson, Wysocki, &
Stern, 2009; Kohls & Uhl 2002; Schaffner et al., 2003). Mapping the product flow along the chain
identifies the product transformation from raw material to final product and creates a clear picture of
what forms of products are handled, transformed and transported at each stage of the value chain
(Purcell et al., 2008). Smart firms customize logistics according to the requirement and profitability
of the customer segment (Anderson, Britt, & Favre, 2007).
Physical and financial flows and capital invested along the chain
In the contemporary production systems, the primacy is the product characteristics pulled by the final
market (Kaplinsky & Morris, 2001). Commercial product standards should be set by the government
or else the private systems of coordination within a chain implement their own standards. VCA
identifies how information about applicable rules and standards are transmitted through the value
chain and its impacts, both at the industry level and internally through the lead firm via its
coordination system. Quantity or product volume flows can be estimated at different stages of the

14
chain (Purcell et al., 2008). Quality is driven by attributes valued by the final consumer. At the retail
or final consumption point, fresh food products have specific attributes such as taste, freshness and
overall sensory experience that consumer loosely integrates into what is termed quality. The final
consumer weighs price and quality to determine whether the product is good value for money or not.
The challenge for the chain is, therefore, to understand and deliver this value profitably (Collins,
2009). Consumer value links marketing strategy back to the biological production process. In terms
of the dairy industry, this means, the milk composition that meets specific needs of the market. With
respect to attributes, price structures can give economic signals to appropriate parties leading to the
development of a system that rewards those who meet these specific component contents (Boehlje &
Schiek, 1998).
15
Product seasonality, price determination, pricing dynamics and information flows
The biological production processes are associated with variability. For the dairy industry, seasonality
of milk production and associated utilization, is the biggest challenge (Boehlje & Schiek, 1998).
Changes in demand or supply of a commodity are reflected by a change in price. Price is a highly
effective communication signal capable of inducing change. Both consumers and producers respond
independently to price changes in order to maximize utility and profitability (Williamson, 1991).
Along the chain, the response at each stage can be initiated only after price signals the need for change
in quantity or quality. The ability to respond quickly to economic changes is critical to maintaining
profit margins. Quick recognition of erroneous decisions, followed by appropriate adjustments and
corrections, are essential to survival and success (Boehlje & Schiek, 1998).
Information mapping in the value chain involves showing the flow of information between actors at
each tier of the chain (Purcell et al., 2008). An integrated value chain requires continuous information
flows that help makes best product flows possible with the final consumer being the primary focus of
all the chain activities. The kind of information passed among chain members and its frequency has
a strong influence on a chain’s efficiency (Lambert & Cooper, 2000). Information is a significant
force in industries characterized by negotiated or personal linkages. The firms or individuals with
unique and accurate information and knowledge exercise increasing power and control in the
agricultural production system that garners better profits from and transfers risk to others with less
power (Boehlje & Schiek, 1998).
16
Governance along the value chains
Governance conceptualizes complex value chain structures with a range of patterns of industrial
organization that occurs between the two extremes of spot markets or arm’s length trade and vertical
integration (Altenburg, 2006c ; Williamson, 1971).
Governance refers to both the official rules that directly relate to management of the commercial
environment to ensure the preservation of competition between firms: it involves unofficial
instruments that range from contracts between chain actors to unwritten norms or understandings.
There are potential key actors within and outside the value chain that influence the governance
structure and they may establish their own set of wider rules which have broader implications for the
wider industry (Purcell et al., 2008). VCA highlights the role of governance, which can be internal or
external to the chain (Kaplinsky & Morris, 2001).
External governance is important from a policy perspective and identifies the institutional
arrangements that may need to be targeted to improve wider capabilities of value chains operating in
the industry. These may be very specific commercial rules including the association of quality grades
with pricing of the product (Kaplinsky & Morris, 2001; Purcell et al., 2008).
There are dominant firms in the industry promulgating practices that constrain economic and social
development. These firms may choose to impede competition or abuse market power to squeeze the
margins of other firms upstream and/or downstream in the value chain. These dominant firm(s) have
common interests with their suppliers as far as the overall efficiency of the supply chain is concerned,
but pursue different policies, which favour their commercial profitability when it comes to negotiating
purchasing prices and quality standards. These leaders try to gain monopsonistic market power by
creating competition among suppliers in order to enhance their own bargaining power (Altenburg,
2006b). These dominant firms set the parameters of industrial organization and engage in quasi-
hierarchical relationships with firms upstream and downstream in the value chain that are legally
independent but nevertheless to a high degree reliant on their decisions (Kaplinsky, 2001). Rogers
17
and Sexton (1994) highlighted the need to consider the monopsony/oligopsony issues in the policy
debate particularly in the agricultural markets to promote competition.
In the formal sector, processors have to maintain adequate processing capacity to handle milk during
the peak supply season, but plants are often idle during the off-season. This excess capacity adds
substantial system costs for processors (Boehlje & Schiek, 1998). Demand and supply conditions in
agricultural chains vary with seasons, and influence the governance and power of different chain
actors (Purcell et al., 2008). Price fluctuation is a risk associated with variation in supply and demand,
which can lead to changes in the governing rules. The risk associated with pricing volatility is borne
by the product title owners and the ability to manage this risk associated with changes in supply and
demand is a key factor in the sustainability of chain function (Gunderson et al., 2009; Kohls & Uhl
2002).
Internal value chain governance is process control through non-market mechanisms to coordinate
economic activities along the chain. It refers to the structure of relationships and coordination
mechanisms that exist between actors along the value chain to monitor the activities of supplier firms.
The management of risk across the chain is important to ensure that no one essential contributor fails
financially thereby leading to major disruption to the marketing of product. Governance takes various
forms and differs significantly with respect to how strongly governance is exercised, how much it is
concentrated in the hands of a single firm, and how many lead firms exercise governance over chain
members (Gereffi, Humphrey, Kaplinsky, & Sturgeon, 2001; Kaplinsky & Morris, 2001). Effective
chain governance minimizes transaction costs and enhances efficiency (Dyer & Singh, 1998).
Relationships between sellers and buyers are important, defined as a social connection between two
parties, where trust provides social capital that enables efficient linkages through the reduction of
transaction costs (Purcell et al., 2008). The relationships a lead firm has with suppliers can either be
helpful to improve the competitiveness of the industry based on long term commitments or can be
predatory with a focus on realizing a quick profit in the short-term (USAID Microlinks, n.d.). Firms
18
reduce price risks using coordination and control mechanisms, which are different to the open market
pricing system. A common business strategy is to reduce the risk of high input prices by contracting
for supplies combined with contracting product sales (Boehlje & Schiek, 1998).
The success of a business, in a competitive environment, depends on its ability to manage its intricate
network of business relationships with multiple firms (Lambert & Cooper, 2000). Dyer and Singh
(1998) link relationships in which a firm is committed to a source of competitive advantage. Effective
inter-firm relationships are crucial to the performance of value chains and enhancing industry
competitiveness over time (Campbell, 2008).
2. Methods
The study originated from the irrigated Okara and arid Bhakkar districts of Punjab (Figure 4 a & b).
The choice of the districts studied was based on the availability of farm economic analysis data from
a two-year longitudinal survey (Wynn, Unpublished) for these two districts.
The study involved two stages. The first stage involved a scoping study which used a purposive
sampling method (Patton, 2002) to identify and sample fresh unpackaged milk informal and formal
chains in both districts. Twenty-seven producers, 11 small, 8 medium and 5 large dhodhis, 22
retailers, 2 formal processors and 11 consumers were interviewed personally, using four different
questionnaires. In total twenty-five informal chains and two formal processor chains were studied.
The questionnaires were developed using a simple value chain analysis framework to identify key
functions being performed along the chain. The initial rural participants were identified with the help
of the Australian Centre for International Agricultural Research (ACIAR) project team (Wynn, 2010)
and their buyers were then tracked and subsequently interviewed. Some middlemen colloquially
known as “dhodhis” and retailers were also randomly surveyed to provide greater cross-sectional
perspectives. During the course of this research, the Okara-Lahore chain model stood out because of
its complexity and author did some preliminary analysis of the chain.

19
Figure 4a. Map of Pakistan highlighting the Punjab province; b. Map of Punjab showing Kasur district and Lahore city
Source: City and border data spatial from 2012 ESRI data & maps

20
In the second stage, four fresh unpackaged rural-urban fresh milk value chains were identified in the
irrigated Punjab (Figure 4b). The choice of rural-urban chains was based on the outcome of the
scoping study and the need to review individual cases more thoroughly at the rural–urban fringe
where there are burgeoning urban populations of milk consumers.
Yin’s (2009) case study method was used for this research. The use of case study approach for an
empirical inquiry allows the researcher to investigate a contemporary phenomenon that is the “case”
in depth and within its real life context.
The selection of specific villages and districts was based on author's close association with and
support from the ongoing ACIAR dairy project (Wynn, 2010) presence in these areas, whose staff
had good standing with the smallholder producers, the entry point for this study. The number of
participants interviewed for Okara-Lahore chain is provided in Table 1, which also describes the
number of tiers for other chains studied.
Table 1: Number of rural-urban milk value chains participants interviewed and the number of tiers for each chain
and the formal milk processors/companies
Milk
Producers
Small
Dhodhi
Medium
Dhodi
Large Dhodhi Retail milk
shops
Consumers
Value
chain:
rural
Okara-
urban
Lahore
chain
Producer1
&
Producer2
Small
Dhodhi 1
&
Small
Dhodhi 2
One Medium
Dhodhi
One Large
Dhodhi (two
brothers)
Five of the
eight retail
buyers were
approached.
Two retailers
outside the
family did not
cooperate
Retailer1 5
Retailer2 6
Formal Processor and multinational Nestlé’s senior collection manager interviewed. Engro & Haleeb, however, are
also big players in the domestic milk market and have frequently been referred to by the informal chain participants
Source: Author’s field research
21
The research was underpinned by mixed methods that are qualitative and quantitative techniques to
collect and analyze data. The method combines the use of both quantitative and qualitative
methodologies within the same study in order to address a single research question. The integration
of these two approaches to collect data helps develop a complete understanding of the research
problems than what either one by itself would net. These studies can later be brought together and
integrated, by casting them within a larger theoretical framework (Bergman, 2008; Creswell, 2010;
Creswell & Plano Clark, 2011; Jupp, 2006).
The quantitative data collected for each value chain case study will give a clear picture of
a) Physical flows including product quantity, quality and time to transfer product along the chain
b) Financial flows represented by costs and margins and value creation and distribution
c) Technology and infrastructure used in transport, storage, cooling and processing and its
economic value
The qualitative data collected for each value chain case study identified
a) Value chain participants and their functions (who?), roles (what?) and rules (how / why?)
b) Governance internal to the chain that is relationships, power dynamics, conflict and problem
solving. External governance in terms of government and dominant market players and their
influence on price, quality and price information flows
c) Information flows with a particular focus on price to understand the type, direction, timing,
completeness, accuracy and distortion if any in these flows
d) Consumers and what they value
For this research field observations were made and face-to-face in-depth interviews were carried with
milk value chain participants using four questionaries that included fixed-choice and open-ended
questions. The questionnaires from the first stage were further refined to go deeper using the
framework developed in the literature review to both collect and analyze the data. The purpose of the
research was explained to each respondent to gain the trust.
22
Patton (2002) and Yin (2009) point towards the use of interviews and personal observations as the key
tools for data collection in the qualitative case study research. Clarke (1999), describes interviews as a
conversation with a purpose. He describes that in a structured interview, questions are asked in a
systematic and consistent order while semi-structured interviews follow a less rigid format and
include open-ended questions.
For this research, structured questions were asked to get the numbers. Both Likert scale and ranking
scale were used to determine the priorities of respondents. The semi-structured questions were used
to understand how and why the chain participants do what they do. The semi-structured questions
generated more in-depth responses although often the structured questions also lead to further
discussions and insight. USAID (2005) qualitative interview manual was also used as a guide for
doing the research in a developing country setting. The author tested the questions with a colleague
with several years of fieldwork experience in the dairy sector of Pakistan. The sequence of questions
was refined several times after each case study.
The practices and understanding of two keys aspects of milk quality and quantity varied for chain
participants and across the milk value chains. Evidence related to these practices was gathered
through direct observation of their participation and practices at various tiers of the chain. Apart from
taking occasional field notes outside the formally designed questionnaires, pictures and voice
recording were extremely valuable tools for the analysis of data collected later on.
In this research, validity aspect was addressed by collecting data from multiple sources. This approach
to construct validity is consistent with Patton (2002) and Yin (2009) who recommend multiple
sources of evidence in case studies.
The primary data sources were milk producers, dhodhis at different tiers, retailers and final consumers
of milk whose statements were cross-examined. Various government reports and local research
publications on the dairy industry of Pakistan also helped make better sense of the local industry
although it was somewhat generic and biased against the local milk chains.
23
The most important advantage presented by using multiple sources of evidence is the development of
converging lines of inquiry or triangulation, a technique to ensure that an account is rich, comprehensive
and well developed (Patton, 2002; Yin, 2009). The author relied on the triangulation through matching
and cross-examining the response of chain participants about the same thing to check the consistency.
Finally, the milk quality collected by Aslam (2015) at each tier of the milk value chain case study
identified by the author was a key source of validation and has been used to develop an even deeper
understanding of the chains studied and the dairy industry of Pakistan.
24
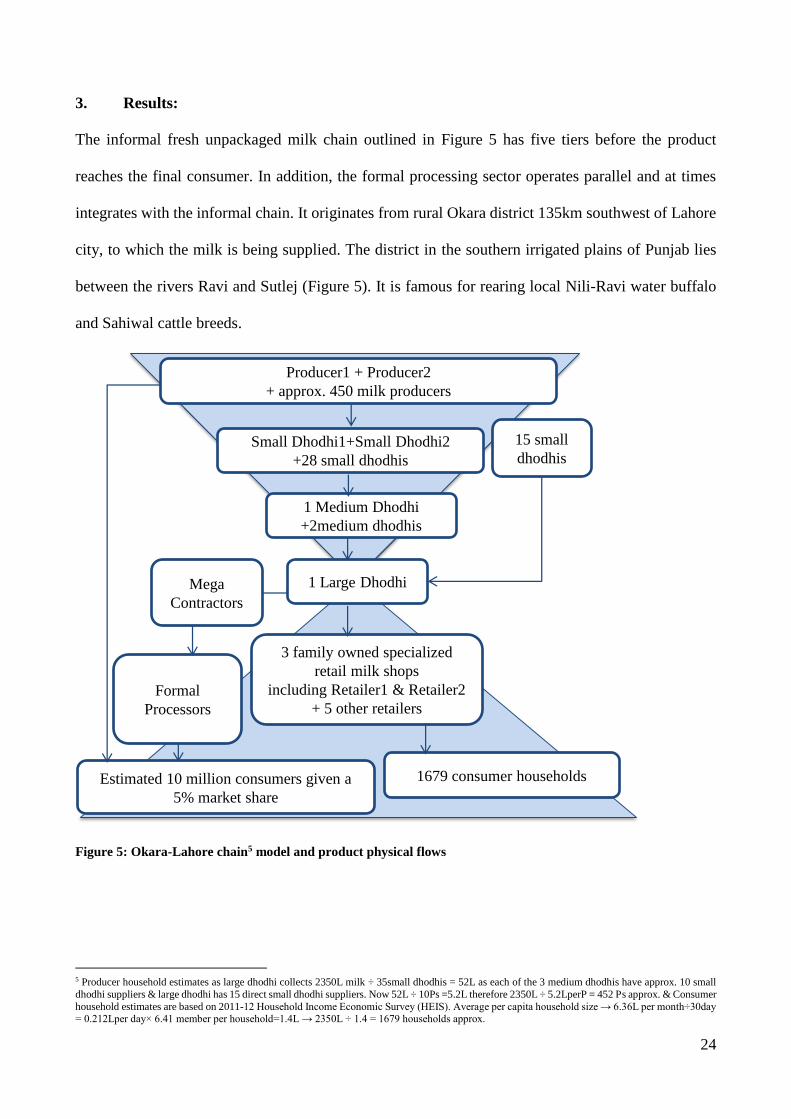
3. Results:
The informal fresh unpackaged milk chain outlined in Figure 5 has five tiers before the product
reaches the final consumer. In addition, the formal processing sector operates parallel and at times
integrates with the informal chain. It originates from rural Okara district 135km southwest of Lahore
city, to which the milk is being supplied. The district in the southern irrigated plains of Punjab lies
between the rivers Ravi and Sutlej (Figure 5). It is famous for rearing local Nili-Ravi water buffalo
and Sahiwal cattle breeds.
Figure 5: Okara-Lahore chain5 model and product physical flows
5 Producer household estimates as large dhodhi collects 2350L milk ÷ 35small dhodhis = 52L as each of the 3 medium dhodhis have approx. 10 small
dhodhi suppliers & large dhodhi has 15 direct small dhodhi suppliers. Now 52L ÷ 10Ps =5.2L therefore 2350L ÷ 5.2LperP = 452 Ps approx. & Consumer
household estimates are based on 2011-12 Household Income Economic Survey (HEIS). Average per capita household size → 6.36L per month÷30day = 0.212Lper day× 6.41 member per household=1.4L → 2350L ÷ 1.4 = 1679 households approx.
Producer1 + Producer2
+ approx. 450 milk producers
Small Dhodhi1+Small Dhodhi2
+28 small dhodhis
3 family owned specialized
retail milk shops
including Retailer1 & Retailer2
+ 5 other retailers
1679 consumer households
1 Large Dhodhi
Formal
Processors
1 Medium Dhodhi
+2medium dhodhis
15 small
dhodhis
Mega
Contractors
Estimated 10 million consumers given a
5% market share
25
Introduction of value chain actors, product physical flows and spoilage risks
Rural milk Producers1 and 2 sell milk to Small Dhodhis 1&2. Medium Dhodhi buys milk from
these and ten other small dhodhis. He operates from a small shop at a bus stand called “adda6”, which
is a midpoint between rural village roads and is quite near to the main highway. Large Dhodhi is
from a powerful Gujjar clan that dominates the urban Lahore milk market. He buys milk from three
medium and directly from fifteen small dhodhis and then supplies to eight retail shops in Lahore city
of which four belong to his close relatives. He is also vertically integrating at the retail end, as his
close family members own fresh milk retail shops in urban Lahore. Two specialized milk retailers 1
and 2 who are close relatives of an buy milk from the same large dhodhi were interviewed in Lahore
city. Data from ten consumers interviewed at these two-retail shop will be used in the later sections.
Formal Processors operate outside but are linked to the informal Okara chain as illustrated in Figure
5. There is are no incentives for higher fat content offered by the formal processors whereas the Large
Dhodhi gives a relatively better price for higher fat content buffalo milk to the farmers. Large Dhodhi
sells any unsold milk and excess winter production to the formal processors and said, “[winter months
when] there is plenty of milk at the back [rural suppliers] and less demand [in urban Lahore market]
and we then sell to companies at a loss...[we sell to] any company where we find a relatively better
rate” (Figure 5).
Milk collection and distribution, using transport is the key function carried out by the dhodhis, though
this transport is not refrigerated. The two retailers perform overnight storage using refrigerators and
retailer1 does some processing. The chain also generates 979 employment7 opportunities. The milk
producers, Large Dhodhi and retailers work for a substantially large number of hours in their
enterprises. The chain works every day of the week with only exception being the holiday of
6 Bus stop in Urdu language or the centre of some activity. Central collection point of informal chains in this case. 7 Average 904 at farms as an estimated 452 farms household with 2workers taking care of livestock + 45small dhodhis + 3medium dhodhi and their 3 record keeper + large dhodhi brothers their 3 loaders and 2 drivers +8 retail shop owners & 2 workers on average at each shop

26
Gyarwee8 Sharif each month; a day in Islamic calendar when producers are said to give away their
milk to the needy for free.
Producers do not face the risk of physical spoilage but the level of risk varies from small dhodhi to
the retailer. In summer, Small Dhodhis do not use ice since Large Dhodhi pays a premium for higher
fat content, suggesting small dhodhis are prepared to accept the risk in order to gain the higher price.
Large Dhodhi manages risk by collecting milk and carrying it to Lahore in relatively small 128 L and
160 L blue plastic cans9. Large Dhodhi said, “No it [spoilage] is rare, only if we get late [on our way
to the city] or ice [used to dilute milk] is not [of] good [quality] but not the whole quantity [spoiled],
just a matti10”. Retailer2 said, “Yes [milk does get spoiled] several times...just recently a whole matti
was spoiled”, which illustrates that the spoilage risk increases downstream.
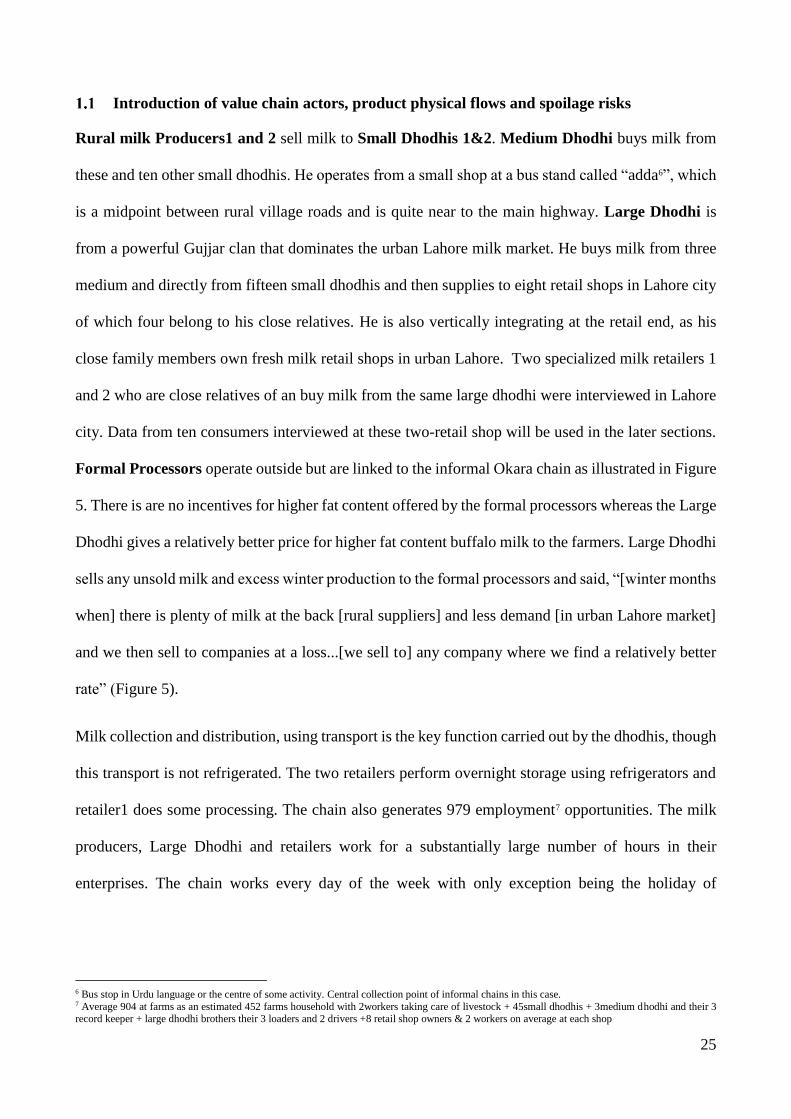
Consumer value, quality determination; grading and quantity measurements along the
chain and gross margins
Higher fat content associated with buffalo milk followed by the sweeter taste of milk are of prime
importance in this chain. Figure 6 portrays the units of volume and various pots used to handle milk
and the mechanism for quality assessment along the chain. In brief, more volume is obtained from
producers. According to the Large Dhodhi, the higher fat content milk11 is standardized to 4.5% fat
by diluting with ice, and finally, lesser quantities are sold to the consumers. This mechanism will be
discussed in detail later in the section.
8 11th in Urdu language 9 Not in a tanker where all the milk has to be mixed up
10 Recycled 128 L and 160 L plastic cans (Figure 6) that have previously been used for holding chemicals 11 Dhodhi collect both cow and buffalo cow milk. Buffalo milk has 7.4% fat compared to 3.7% in cow’s milk (Fellows & Hampton, 1992).
27
Figure 6: Quantity and quality
along the Okara-Lahore chain
Data Source: Author’s field research
Producer Small Dhodhi Large Dhodhi Retailer
Retailer Quantity
At retail
Retailer1 & Retailer2 sell
1litre = 925ml
i.e. 75 ml less per litre
Large Dhodhi’s 46 litres Lahori panda or maund
=
Retailer’s 48 litres
i.e. 46 ÷ 0.925 = 49.7 litres
SD’s seer or gadvi
for producer
Medium Dhodhi /
Large Dhodhi’s
measure used to convert SD’s gadvi to litres
Large Dhodhi uses 128 and 160 litre plastic drums
to collect milk from Small Dhodhi
Gadvi OR litre
for consumer
Medium Dhodhi
Weight
Lahori 46 litrepanda or 46kg
maund for retailers
Large Dhodhi’s urban Quality standard
Large Dhodhi then lowers the fat for retailers from the average of 6% to around 4.5% by diluting it with
ice
1ice : 8 milk
7.2 ice : 50.4 milk
Therefore easy for Large Dhodhi to make 46litre Lahori panda or maund
Large Dhodhi’s rural Quality standard
Large Dhodhi has set a 6% fat standard for Small Dhodhiswith
a reward and penalty system in place
Premium = (litres × actual fat) ÷ 6% fat standard
Assuming Small Dhodhis 46.5L milk had 6.2% fat
Premium Paid = (46.5L × 6.5) ÷ 6% = 50.4 litres i.e. Small Dhodhi gains another 3.5litres
This is only possible as Small Dhodhi given 0.7% extra for fat in summer and 0.5 % in winter
Producer Quantity
At farm gate
1 seer OR gadvi = 1073 ml i.e. Small Dhodhi gets 73ml
extra per litre
Producer1’ s 1 gadvi= Small Dhodhi’s
1.073litres
i.e. 1 × 1.073=1.073
Price between Producer & Small
Dhodhi is fixed however for a 40 kg or
litre maund
Small Dhodhi Quantity
With extra quantities from producers
40 gadvis becomes 43 litres
i.e. 40 × 1.073 = 43 approx.
So the same farm gate maund becomes 43litres & not 40kg or litre
Small Dhodhis gains some more volumes at Medium Dhodhi’s central collection point since Large Dhodhi gives him leverage
i.e. buys 0.925
therefore
43 ÷ 0.925 = 46.5 litres
i.e. a gain of 6.5 litres for Small Dhodhi in total
28
Value chains are driven by what the final consumer values. Comments by the final consumers
interviewed at the two milk retail shops highlight that butterfat or cream closely followed by taste are
attributes most valued by the final consumer. A consumer (C6) at retailer1 said, “taste [is
important]...to my wife quality means more cream after boiling milk”. The milk is used after boiling
and the amount of cream set on the top, associated with higher fat content buffalo milk is an indicator
of quality. The final consumers also have very little understanding of the units used by the retail shops
to sell milk.
At the farm gate, there is no precise mechanism for the quality assessment of milk. “[Small Dhodhi2]
doesn’t really check anything in milk [while buying] and takes it with his eyes closed”, said Producer2
and this is due to rural cultural norms. There is little clarity and no consistency on the use of measuring
units. Producer2 who is well-educated and understood units said, “We sell milk [to Small Dhodhi2]
in gadvi. Gadvi has 16 chatanks12. The Small Dhodhi nonetheless gets 17 chatank per gadvi”, which
means there is a social acceptance for this to happen. Small Dhodhi2 said, “We buy in gadvi and sell
in litres”. “We buy from the farmer chantank more and sell chantank less [to Large Dhodhi]” Small
Dhodhi1 further elaborated, “…in a maund13 we save 4 to 5 kg14 as the quantity has increased”.
Collection pots used to collect milk from producers, and utensils to measure this collection belong to
Medium Dhodhi. The small dhodhis trust these measurements. Medium Dhodhi clarified the
complicated unit conversion, explained as follows:
Small Dhodhi′s gadvi for producer is 1073 ml instead of actual 1000ml
Therefore small dhodhi obtains 73ml of extra milk per gadvi
Large Dhodhi gives leverage to small dhodhi i. e. 1073 ÷ 0.925
= 1160ml. Small Dhodhi has gained 148ml extra milk per gadvi in total
12 Producer2 is educated and knows the correct chatank in a kg 13 40kg or litre at which price is set between Producer & small dhodhi 14 These participants kept switching between various units
29
Producers consider the aggregate unit of maund, for which milk price is agreed between them and
small dhodhi, to be 40 L, also referred to as kg, which is contrary to the reality. This becomes evident
by applying the above conversions to a maund.
Small Dhodhi′s maund for producer → 40 × 1073 = 42.92L i. e. approx. 3L extra per maund
Large Dhodhi′s leverage given to small dhodhi → 43 ÷ 0.925 = 46.5L i. e approx. 6.5L gain in total
Small dhodhis unload their milk collection directly to Large Ddhodhi’s plastic cans (Figure 6). Prior
to that, however, Medium Dhodhi’s hired munshi15 takes a sample from each of the twelve small
dhodhi supplier’s milk to him to measure the butterfat percentage using the Gerber16 method. The fat
percentage is recorded for making payments later on to small dhodhis. At Medium Dhodhi’s central
collection point Large Dhodhi offers a premium for butterfat above 6% and penalizes small dhodhis
with lesser fat, using the following formula:
Premium Paid = [(Milk in 𝑙𝑖𝑡𝑟𝑒 × %actual fat) ÷ 6%base target fat content] × Base Price per 𝑙𝑖𝑡𝑟𝑒
In the chain, there is feedback from final consumer in place too to check quality. Medium Dhodhi
explained, “At times small dhodhis are able to deceive us and our tests fail. For example if cooking
oil is added to cow’s milk17, we can’t detect it but next day we may get some feedback after complaint
by consumers [at urban retail milk shops] who set yogurt [from the milk]. If this [complaints]
continues we can track the culprit and it would result in termination of purchase [from that small
dhodhi”. This demonstrates an efficient check and balance mechanism.
Large Dhodhi is quite careful, prior to purchase decision, and tests the milk once again. He said “We
first taste then check sample [fat] and finally measure the quantity [of small dhodhi’s milk].We check
fat, LR and temperature”. Large Dhodhi further added, “Both fat and LR [lactometer reading] are
important. Just the fat on its own can be increased by putting cream18 into water. Fat test tells
15 Record keeper and milk tester 16 Milk fat content test to determine the price to be paid. 10 ml of sulphuric acid followed by 11 ml milk and 1 ml of Amyl alcohol added to butyrometer, which is then placed in a hand-operated centrifuge machine and spined for a few minutes to get an estimated butterfat percentage in milk.
17 To increase fat and get an incentive for higher fat content buffalo milk given by large dhodhi 18 possibly cheap powdered milk
30
chicknai19 and LR tells the powder in the milk. LR and temperature have to go together, if fat is more
and LR is less or vice versa that means the milk is adulterated. If the temperature is higher, LR or
gravity will reduce and vice versa. For example at 20 °C temperature the LR has to be 27, LR will be
26 at 17 °C and so on i.e. LR will change by one [centigrade] with every three degrees of temperature
change”. These statements show that Large Dhodhi is the real master of this trade and knows the
product quality aspect really well.
Large Dhodhi dilutes the milk purchased from small dhodhis at central collection point with ice,
already present in his blue plastic cans (Figure 6). Ice is required to avoid milk spoilage, particularly
in hot summers and to gain volumes as Large Dhodhi said, “After buying ...for example 110 L of
milk and 18 kg of ice for a 128 L matti. We are supplying in summer at around 4.5 [%] fat and 22 to
23 LR”, which is Large Dhodhi’s standard at retail end of the chain.
Both retailers sell lesser quantities to the final consumer as Retailer2 said, “We buy in gadvi and sell
in litre...We sell 925 ml litre and that is how we make money”. He further said, “Lahori maund is 46
litres, I don’t know what happens in the rural market”. This is when he buys milk from Large Dhodhi
and before selling lesser quantities. Large Dhodhi, Retailer1 and Retailer3 later changed their
statement saying gadvi is same as litre.
Five retail buyers who are not part of Large Dhodhi’s extended family do check milk quality “by
making khoya20”, said Large Dhodhi. Retailer1 and Retailer2, who are large dhodhi’s close relatives,
are not performing any explicit quality tests for the milk supplied. Retailers are well aware of the
quality sought by the consumer as Retailer1 said, “[consumers seek] thickness [in milk] while
Retailer2 said “[Consumers want] better quality at cheap price”.
19 A word for fat in Urdu language 20 A traditional practice in Lahore market where around 2400ml of milk is boiled to get a certain amount of milk solids, based on which quality is determined
31
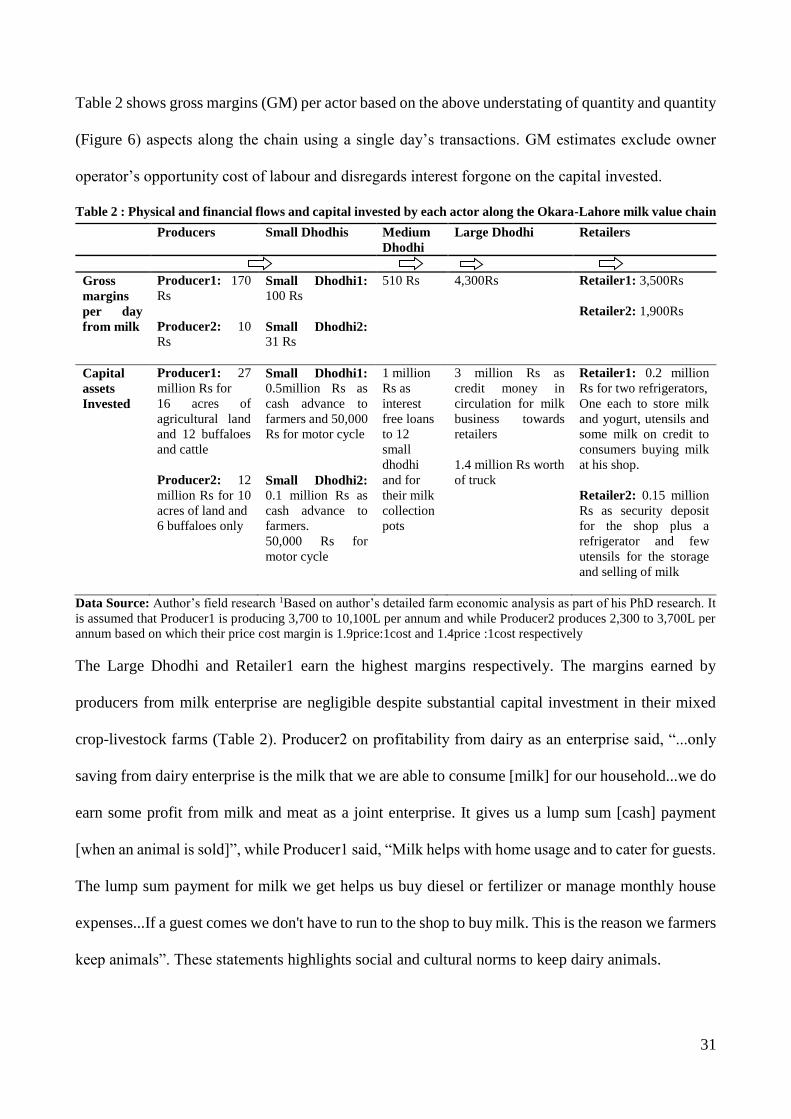
Table 2 shows gross margins (GM) per actor based on the above understating of quantity and quantity
(Figure 6) aspects along the chain using a single day’s transactions. GM estimates exclude owner
operator’s opportunity cost of labour and disregards interest forgone on the capital invested.
Table 2 : Physical and financial flows and capital invested by each actor along the Okara-Lahore milk value chain
Producers Small Dhodhis Medium
Dhodhi
Large Dhodhi Retailers
Gross
margins
per day
from milk
Producer1: 170
Rs
Producer2: 10
Rs
Small Dhodhi1:
100 Rs
Small Dhodhi2:
31 Rs
510 Rs 4,300Rs Retailer1: 3,500Rs
Retailer2: 1,900Rs
Capital
assets
Invested
Producer1: 27
million Rs for
16 acres of
agricultural land
and 12 buffaloes
and cattle
Producer2: 12
million Rs for 10
acres of land and
6 buffaloes only
Small Dhodhi1:
0.5million Rs as
cash advance to
farmers and 50,000
Rs for motor cycle
Small Dhodhi2:
0.1 million Rs as
cash advance to
farmers.
50,000 Rs for
motor cycle
1 million
Rs as
interest
free loans
to 12
small
dhodhi
and for
their milk
collection
pots
3 million Rs as
credit money in
circulation for milk
business towards
retailers
1.4 million Rs worth
of truck
Retailer1: 0.2 million
Rs for two refrigerators,
One each to store milk
and yogurt, utensils and
some milk on credit to
consumers buying milk
at his shop.
Retailer2: 0.15 million
Rs as security deposit
for the shop plus a
refrigerator and few
utensils for the storage
and selling of milk
Data Source: Author’s field research 1Based on author’s detailed farm economic analysis as part of his PhD research. It
is assumed that Producer1 is producing 3,700 to 10,100L per annum and while Producer2 produces 2,300 to 3,700L per
annum based on which their price cost margin is 1.9price:1cost and 1.4price :1cost respectively
The Large Dhodhi and Retailer1 earn the highest margins respectively. The margins earned by
producers from milk enterprise are negligible despite substantial capital investment in their mixed
crop-livestock farms (Table 2). Producer2 on profitability from dairy as an enterprise said, “...only
saving from dairy enterprise is the milk that we are able to consume [milk] for our household...we do
earn some profit from milk and meat as a joint enterprise. It gives us a lump sum [cash] payment
[when an animal is sold]”, while Producer1 said, “Milk helps with home usage and to cater for guests.
The lump sum payment for milk we get helps us buy diesel or fertilizer or manage monthly house
expenses...If a guest comes we don't have to run to the shop to buy milk. This is the reason we farmers
keep animals”. These statements highlights social and cultural norms to keep dairy animals.
32
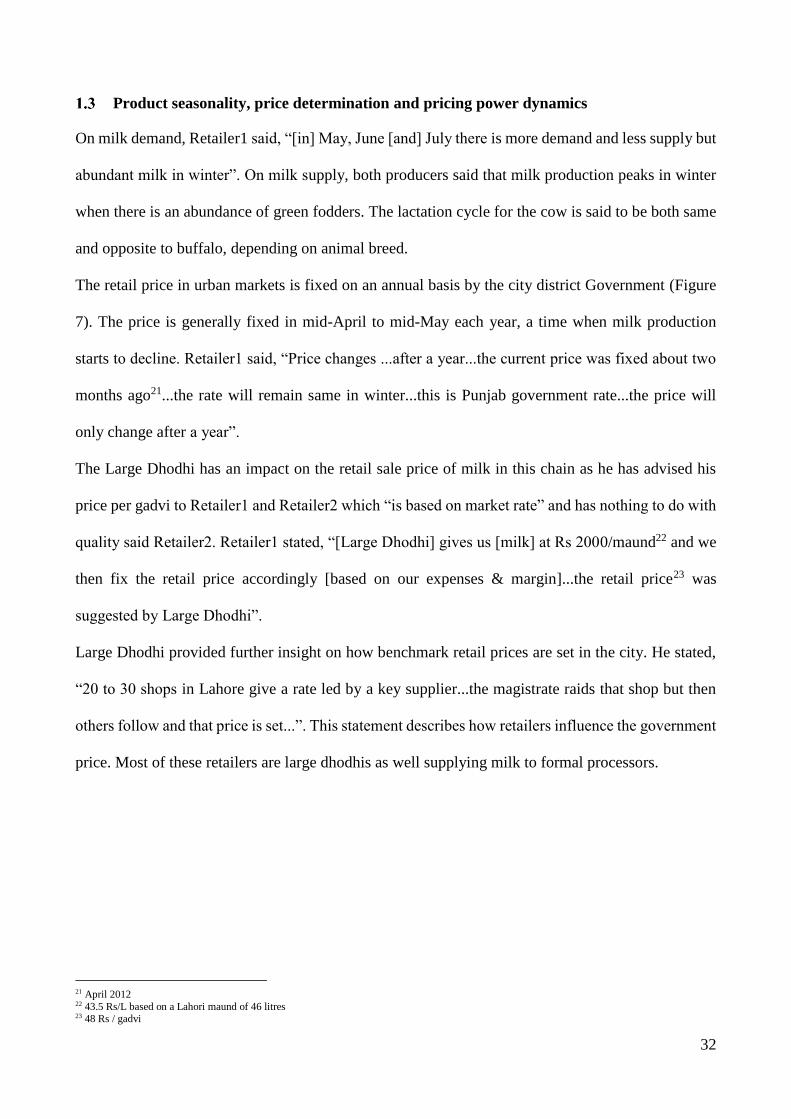
Product seasonality, price determination and pricing power dynamics
On milk demand, Retailer1 said, “[in] May, June [and] July there is more demand and less supply but
abundant milk in winter”. On milk supply, both producers said that milk production peaks in winter
when there is an abundance of green fodders. The lactation cycle for the cow is said to be both same
and opposite to buffalo, depending on animal breed.
The retail price in urban markets is fixed on an annual basis by the city district Government (Figure
7). The price is generally fixed in mid-April to mid-May each year, a time when milk production
starts to decline. Retailer1 said, “Price changes ...after a year...the current price was fixed about two
months ago21...the rate will remain same in winter...this is Punjab government rate...the price will
only change after a year”.
The Large Dhodhi has an impact on the retail sale price of milk in this chain as he has advised his
price per gadvi to Retailer1 and Retailer2 which “is based on market rate” and has nothing to do with
quality said Retailer2. Retailer1 stated, “[Large Dhodhi] gives us [milk] at Rs 2000/maund22 and we
then fix the retail price accordingly [based on our expenses & margin]...the retail price23 was
suggested by Large Dhodhi”.
Large Dhodhi provided further insight on how benchmark retail prices are set in the city. He stated,
“20 to 30 shops in Lahore give a rate led by a key supplier...the magistrate raids that shop but then
others follow and that price is set...”. This statement describes how retailers influence the government
price. Most of these retailers are large dhodhis as well supplying milk to formal processors.
21 April 2012 22 43.5 Rs/L based on a Lahori maund of 46 litres 23 48 Rs / gadvi
33
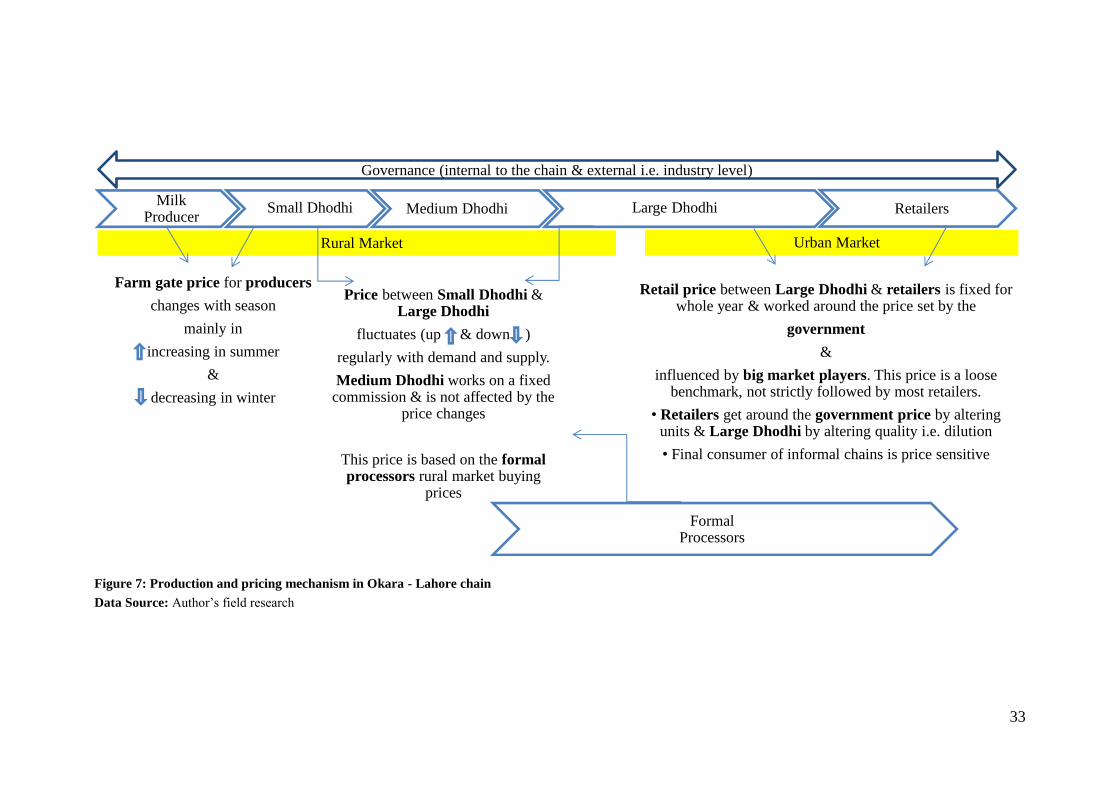
Figure 7: Production and pricing mechanism in Okara - Lahore chain
Data Source: Author’s field research
Farm gate price for producers
changes with season
mainly in
increasing in summer
&
decreasing in winter
Price between Small Dhodhi & Large Dhodhi
fluctuates (up & down )
regularly with demand and supply.
Medium Dhodhi works on a fixed commission & is not affected by the
price changes
This price is based on the formal processors rural market buying
prices
Milk Producer
Small Dhodhi Large Dhodhi Retailers
Formal Processors
Rural Market Urban Market
Retail price between Large Dhodhi & retailers is fixed for whole year & worked around the price set by the
government
&
influenced by big market players. This price is a loose benchmark, not strictly followed by most retailers.
• Retailers get around the government price by altering units & Large Dhodhi by altering quality i.e. dilution
• Final consumer of informal chains is price sensitive
Medium Dhodhi
Governance (internal to the chain & external i.e. industry level)

34
The formal processors control farm gate milk prices. “[Rural market] price is determined on the basis
of company24 rate...we have to offer 1 or 2 Rupees higher than that offered by the company to be able
to procure milk [from medium dhodhis & small dhodhis]”, said Large Dhodhi. This statement
highlights the influence that formal processors have on rural pricing and the competition between the
informal and formal channels to procure milk.
Large Dhodhi’s statement was further consolidated by Medium Dhodhi who explained, “Different
dealers25 have an Adda26 rate and we are bound by it. We can’t pay less than that price [to small
dhodhis]...that is our minimum price...The oldest adda gives the rate”. Small Dhodhi1 verified what
Medium Dhodhi said, “Contractor’s [medium dhodhis] commission may vary with the loan extended
but the price offered by Lahori [Large Dhodhi] can’t be different and has to be same at each adda”.
This shows that the large dhodhi is bound to give a minimum price to his small dhodhi suppliers,
determined by the addas.
Medium Dhodhi explained that the add rate is dictated by the formal processors and he described,
“These days Adda “name” is giving the rate...the key price fixation though is based on factory27
rate...in this area dominated by Adam Cheese, CDL28, Nestlé and Engro”. These addas are also
Medium Dhodhi’s key source of price information as he said, “[We check price] from different
addas...there are 12 addas in this area”.
Medium Dhodhi further said “...in winter...production is high and lesser demand...the [farm gate]
price goes down from December to March and then increases with increase in demand from April to
almost November29 as [its] summer and [therefore] higher consumption of milk and other dairy
products. He further explained, “…the major price change is with these two seasons and prices are
relatively stable otherwise...It [price] varies with demand increase such as 1 to 2 Rupees will increase
24 formal processor 25 Milk traders like medium dhodhi and large dhodhi 26 Central rural collection points where a number of dhodhis bring their rural collection before it is transported to Lahore 27 Formal processors 28 Chaudhry Dairies Limited, one of the big national milk processor 29 Error! Reference source not found.

35
in the month of Ramadan30...political instability, less demand...imports of powdered milk by
factories31 will lead to lower prices in the market”.
On pricing mechanism between small dhodhi and producers, Small Dhodhi1 said, “Lahori [Large
Dhodhi] gives us the rate and we pass the same rate to our farmer...whenever the rate changes...it is
communicated to us”, which means that the price is generally passed on to the producer. There is an
annual fixed price arrangement, however, is place between Producer1 and Small dhodhi1. Producer1
said, “We have mutually fixed a price that will go on for both summer and winter. We have agreed
that it will not change. We have told the dhodhi [Small Dhodhi1] that milk is yours, whether cheaper
or expensive. Here all the houses are taking cash advance [but we haven’t and therefore able to fix a
price]”. This fixed price is rare.
Commonly the price changes with the season as Producer2 said, “The price only changes twice that
is summer and winter”. The producer explores local prevailing prices as Producer2 said, “We ask
other dhodhis, chiller [formal processors village collection centre] and tubwala32 [adda rate] to know
what they are paying the small dhodhi, we do investigate [price]”.
Facilitating functions of financing and relationships
There is an intricate set of facilitating functions in the chain that enable it to operate in the absence of
formal contracts illustrated in Figure 8.
Producers take cash advances from their small dhodhi buyers. The account between producer and
small dhodhis is settled once every month and the cash advance keeps rolling with producer owing
small dhodhi. The producer also borrows from small dhodhi whenever a need arises and it is then
deducted from the milk account. Producer1 said, “We get payment [i.e. cash from Small Dhodhi1]
30 Muslim holy month of fasting 31 Formal processors 32 Medium dhodhi has a huge unrefrigerated steel tank sitting at his shop, which is not used as milk is transferred directly from small dhodhi to large dhodhi. This steel tank is however called tub and wala means owner i.e. owner of tub
36
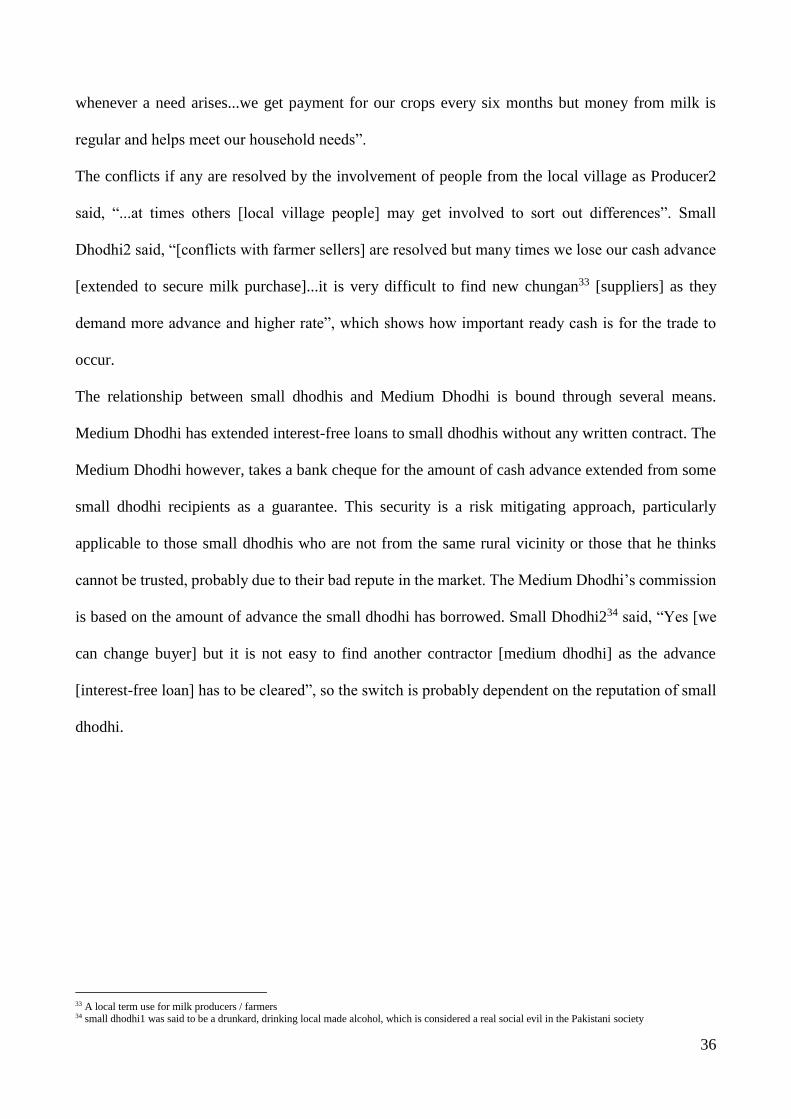
whenever a need arises...we get payment for our crops every six months but money from milk is
regular and helps meet our household needs”.
The conflicts if any are resolved by the involvement of people from the local village as Producer2
said, “...at times others [local village people] may get involved to sort out differences”. Small
Dhodhi2 said, “[conflicts with farmer sellers] are resolved but many times we lose our cash advance
[extended to secure milk purchase]...it is very difficult to find new chungan33 [suppliers] as they
demand more advance and higher rate”, which shows how important ready cash is for the trade to
occur.
The relationship between small dhodhis and Medium Dhodhi is bound through several means.
Medium Dhodhi has extended interest-free loans to small dhodhis without any written contract. The
Medium Dhodhi however, takes a bank cheque for the amount of cash advance extended from some
small dhodhi recipients as a guarantee. This security is a risk mitigating approach, particularly
applicable to those small dhodhis who are not from the same rural vicinity or those that he thinks
cannot be trusted, probably due to their bad repute in the market. The Medium Dhodhi’s commission
is based on the amount of advance the small dhodhi has borrowed. Small Dhodhi234 said, “Yes [we
can change buyer] but it is not easy to find another contractor [medium dhodhi] as the advance
[interest-free loan] has to be cleared”, so the switch is probably dependent on the reputation of small
dhodhi.
33 A local term use for milk producers / farmers 34 small dhodhi1 was said to be a drunkard, drinking local made alcohol, which is considered a real social evil in the Pakistani society
37
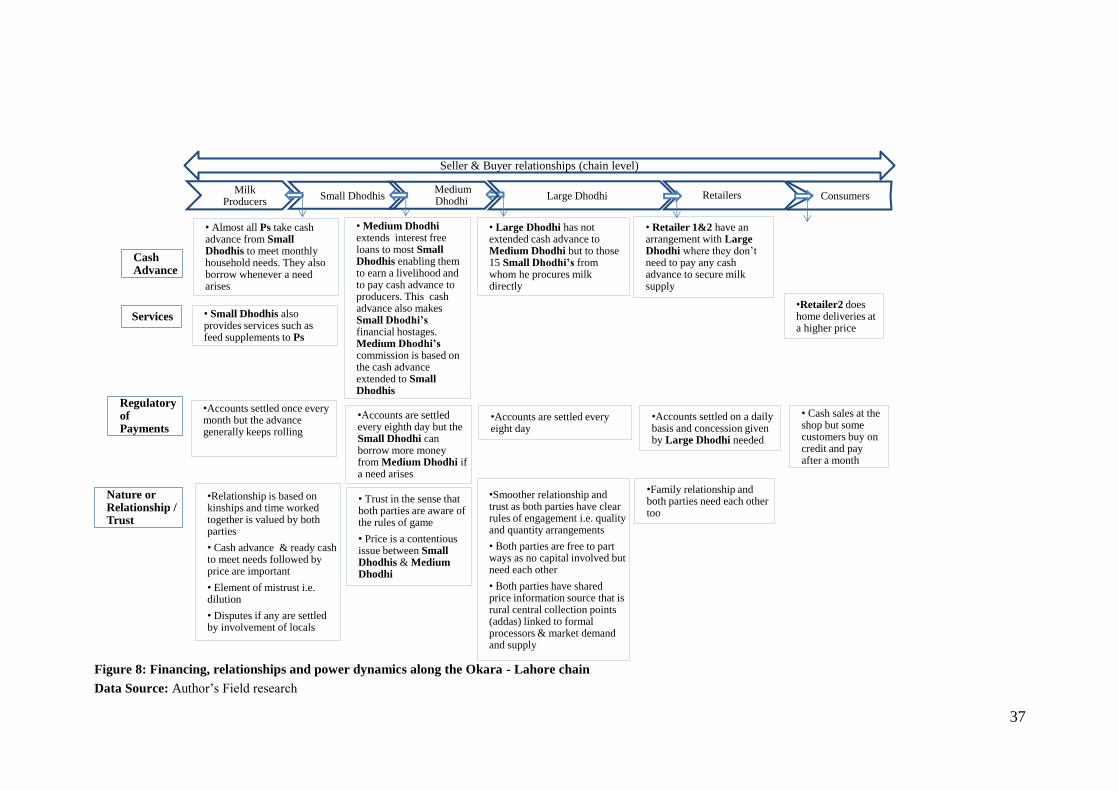
Figure 8: Financing, relationships and power dynamics along the Okara - Lahore chain
Data Source: Author’s Field research
• Almost all Ps take cash advance from Small Dhodhis to meet monthly household needs. They also borrow whenever a need arises
• Retailer 1&2 have an arrangement with Large Dhodhi where they don’t need to pay any cash advance to secure milk supply
•Retailer2 does home deliveries at a higher price
• Medium Dhodhiextends interest free loans to most Small Dhodhis enabling them to earn a livelihood and to pay cash advance to producers. This cash advance also makes Small Dhodhi’sfinancial hostages. Medium Dhodhi’scommission is based on the cash advance extended to Small Dhodhis
Milk Producers
Small Dhodhis Large Dhodhi Retailers ConsumersMedium Dhodhi
• Large Dhodhi has not extended cash advance to Medium Dhodhi but to those 15 Small Dhodhi’s from whom he procures milk directly
Cash Advance
Services
Regulatory of Payments
Nature or Relationship / Trust
• Small Dhodhis also provides services such as feed supplements to Ps
•Accounts settled once every month but the advance generally keeps rolling
•Relationship is based on kinships and time worked together is valued by both parties
• Cash advance & ready cash to meet needs followed by price are important
• Element of mistrust i.e. dilution
• Disputes if any are settled by involvement of locals
•Accounts are settled every eighth day but the Small Dhodhi can borrow more money from Medium Dhodhi if a need arises
• Trust in the sense that both parties are aware of the rules of game
• Price is a contentious issue between Small Dhodhis & Medium Dhodhi
•Smoother relationship and trust as both parties have clear rules of engagement i.e. quality and quantity arrangements
• Both parties are free to part ways as no capital involved but need each other
• Both parties have shared price information source that is rural central collection points (addas) linked to formal processors & market demand and supply
•Accounts are settled every eight day
•Family relationship and both parties need each other too
•Accounts settled on a daily basis and concession given by Large Dhodhi needed
• Cash sales at the shop but some customers buy on credit and pay after a month
Seller & Buyer relationships (chain level)
38
Medium Dhodhi and Large Dhodhi have more professional business dealings as both parties have
clear rules of engagement and are better informed than the other chain participants. Medium Dhodhi
has been supplying milk to Large Dhodhi for the last two years and gets paid every 2nd day. Medium
Dhodhi said, “Our relationship is good as we maintain a supply of good quality milk to [name of
Large Dhodhi]”. The Large Dhodhi has not extended any cash advance to Medium Dhodhi. He though
has extended cash advances to his 15 small dhodhi direct suppliers.
Large Dhodhi, on relationships with his retailer buyers, said, “We have fixed [permanent retail]
customers”, so the price is not an issue of contention and in fact Large Dhodhi suggests the retail milk
price to the two retailers. On the relationship and conflict, Retailer1 said, “....baradri [kinship] based
[relationship with Large Dhodhi] and we can’t really speak... He is my sandu [brother in-law]...we
never have a conflict”.
A key benefit of this relationship is not having to pay any cash advance to secure milk supplies as
Retailer2 said, “We are relatives...we only get milk based on our relationship [with Large Dhodhi]…”
This also highlights that both parties are aware of prevailing Lahore urban market prices and are
confident they have a good arrangement in place. Milk is being supplied without any advance taken
as security, which is otherwise a common practice in Lahore market.
The milk is being sold on a cash basis to final consumers at both retail shops though there are a few
customers buying on credit and paying after a month.
4. Discussion and Conclusion:
The research has provided a deeper insight into the operations of this informal rural-urban chain and
its interactions with the formal sector to make sense of why the industry works the way it does.
The informal milk chain was pro-poor and generated an estimated 979 employment opportunities
from farm to market. Job creation is one of the key policy instruments for any government.
The chain operated with minimal cool chain infrastructure, which limited Large Dhodhi to collect
evening milking. The lack of cool chains increased the spoilage risks downstream and these physical

39
risks (Boehlje, 1999) were mainly borne by the Large Dhodhi who also bore the price risks associated
with regular price fluctuations, which are assumed to be dealt with, by dilution of milk. Proper cool
chains, if installed, will require capital investment and the costs will have to be borne by the final
consumer in terms of higher milk prices. The question is: is it feasible given the current levels of
poverty (World Bank, 2013) amongst the clientele in the markets that the chain caters to?
Governance through financing at various tiers of the chain and interdependent relationships was a
key strength of the chain, apart from low operational costs and product differentiation, which was
occurring at the retail end. The financial arrangements along the chains held them together. Regular
cash flows were passed to the producers upstream, interest free loans to dhodhis at the middle tier
and credit downstream to the retailers. These financing mechanisms locked-in the two parties
involved in a transaction along the chain, at almost all times. Small dhodhis were captive to producers
due to their cash advance arrangement. The Medium Dhodhi exercised a fair degree of control on
small dhodhi suppliers through loans extended. On the other hand, the small dhodhis by using these
loans were not only able to then extend cash advances to the farmers and buy a motor cycle for their
business but they also secured a source for their milk supply. The cash advances and loans made
exiting the chain an unattractive option for most receivers (Gereffi, Humphrey, & Sturgeon, 2005) as
there was a high degree of interdependence between operators (Stych & Gulati, 2008).
The strong relationships designed to establish shared competitive advantage (Dyer & Singh, 1998)
along the chains and the unique conflict resolution mechanism, in the absence of formal contracts,
was another of their key strengths. This was important, as operators were unable to pursue costly and
potentially unpredictable litigation.
The chain was vertically integrating at the retail end. The Large Dhodhi was establishing his own
family brand name for the milk supplied to the urban market. Final consumers preferred cheaper
milk with higher fat. The Large Dhodhi and retailers were well aware of this buying behaviour of

40
consumers. Large Dhodhi was focusing on procuring higher fat buffalo milk valued by the final
consumer and had checks in place to ensure this happens.
In the absence of government industry standards and labeling regulations (Purcell et al., 2008), the
chain had its own standards for quality and quantity measures, which assisted in providing the
framework for positive gross margins for all operators in the chains, from farm gate onwards.
An important policy intervention outcome from this research is the need for uniform quality and
quantity standards and a balanced pricing mechanism across the industry.
The producers and consumers need to be educated on these standards. At the farm end, this will
address the level of distrust between producers and small dhodhis, as illustrated in the chain. At the
retail end, it will give confidence to the consumers who need to be made aware of the nutritional
virtues of milk and the losses associated with dilution of the product they are purchasing, protein in
particular.
There is another issue of price linked to the quality and quantity. The control of farm gate prices by
the formal processors due to the oligopolistic market structure needs to be addressed. Antitrust laws
are required to address this situation. The importation of cheap powdered milk not only suppresses
the local prices but distorts competition in favour of formal processors. It has to be either totally
banned or strict import quotas attracting high duties have to be set, to allow the domestic industry to
come out of its infancy.
The existing retail milk price setting practice by the government authorities is counterproductive.
These prices are influenced by some powerful large dhodhis who also operate as retailers and are
known to supply milk to the formal processors (Competition Commission of Pakistan, 2012). If the
policy goal is rural poverty alleviation and better nutrition for consumers, the milk retail pricing
mechanism will have to account for the costs of milk production and all other costs associated with
bringing the product to the final market.
41
The milk value chains, their operations, and interactions between formal and informal sectors are
complex. This research has highlighted some of the challenges facing the dairy industry of Pakistan.
This study is expected to be the foundation stone for key future work to understand and support
informal milk value chains that are of immense importance to Pakistani farmers, middlemen, retailers,
and consumers.
REFERENCES
Afzal, M. (2010). Re-designing smallholder dairy production in Pakistan. Pakistan Veterinary
Journal, 30(3), 187-190.
Ahmad, I. (2013). Pakistan economic survey 2012-13: Growth and investment. Retrieved from
Government of Pakistan, Ministry of Finance website:
http://www.finance.gov.pk/survey/chapters_13/01-Growth%20and%20Investment.pdf.
Ali, T. (2006). Regoverning markets: Small-scale producers in modern agrifood markets: A case
study of milk production and marketing by small and medium scale contract farmers of
Haleeb foods Ltd., Pakistan (pp. 50). Retrieved from http://pubs.iied.org/pdfs/G03258.pdf
Altenburg, T. (2006a). Donor approaches to supporting pro-poor value chains. Donor Committee
for Enterprise Development: Working Group on Linkages and Value Chains, with the
support of UNIDO and FAO. Retrieved from http://www.value-
chains.org/dyn/bds/bds2search.details2?p_phase_id=568&p_lang=en&p_phase_type_id=6.
Altenburg, T. (2006b). Governance patterns in value chains and their development impact. The
European Journal of Development Research, 18(4), 498-521.
Altenburg, T. (2006c). Introduction to the special issue: Shaping value chains for development. The
European Journal of Development Research, 18(4), 493-497.
Amjad, R. (2010). Key challenges facing Pakistan agriculture: How best can policy makers
respond? A note. Pakistan Institute of Development Economics. Islamabad. Retrieved from
http://www.pide.org.pk/pdf/foodsecurity/research/FS1.pdf
Anderson, D. L., Britt, F., F., & Favre, D. J. (2007). The 7 principles of supply chain management.
Supply Chain Management Review, 11(3), 41-46.
Andrew, M., Seale, J. L., Meade, B., & Regmi, A. (2013). International evidence on food
consumption patterns: An update using 2005 international comparison program data.
Retrieved from United States Department of Agriculture, Economic Research Service
wesbite: http://www.ers.usda.gov/media/129561/tb1929.pdf.
Anjum, M. S., Lodhi, K., Raza, A., Walters, F., & Krause, S. (1989). Pakistan's dairy industry:
Issues and policy alternatives. In Directorate of Agricultural Policy and Chemonics
International Consulting Division (Series Ed.) (pp. 76). Retrieved from
http://pdf.usaid.gov/pdf_docs/pnabh020.pdf
Asian Development Bank. (2011). Global food prices and developing Asia. Manila: Asian
Development Bank.
Aslam, N. (2015). Transfer of aflatoxins from feed to milk and urine in Nili-Ravi buffaloes and flow
of aflatoxins and milk quality in informal milk marketing chains in Pakistan. (Unpublished
doctoral thesis), Charles Sturt University, Wagga Wagga, Australia.
Bain, J. S. (1968). Industrial organization (2nd ed.). New York: John Wiley & Sons Inc.
42
Bergman, M. M. (2008). Advances in mixed methods research: Introduction: Whither mixed
methods? London, UK: SAGE Publications Ltd.
Boehlje, M. (1999). Structural changes in the agricultural industries: How do we measure, analyze
and understand them? American Journal of Agricultural Economics, 81(5), 1028-1041. doi:
10.2307/1244080
Boehlje, M., & Schiek, W. (1998). Critical success factors in a competitive dairy market. Journal of
Dairy Science, 81(6), 1753-1761. doi: 10.3168/jds.S0022-0302(98)75744-3
Burki, A. A., & Khan, M. A. (2007). Milk districts and efficiency of smallholder dairy producers in
Pakistan. http://www.pide.org.pk/psde23/pdf/Abid%20A.%20Burki.pdf
Burki, A. A., Khan, M. A., & Bari, F. (2004). The state of Pakistan's dairy sector: An assessment.
The Pakistan Development Review, 43(2), 149-174.
Campbell, R. (2008). Transforming inter-firm relationships to increase competitiveness. Retrieved
from
http://www.microlinks.org/sites/microlinks/files/resource/files/ML6027_transforming_inter-
firm_relationships_briefing_paper.pdf.
Clarke, A. (1999). Evaluation research an introduction to principles, methods and practice.
London: SAGE Publications.
Collins, R. (2006, 7-10 August, 2006). The function and consequences of alternative fresh produce
supply chain models. Paper presented at the IV International Conference on Managing
Quality in Chains - The Integarted View on Fruits and Vegetables Quality, Bangkok,
Thailand.
Collins, R. (2009). Value chain management and post harvest handling: Partners in competitiveness.
In W. J. Florkowski, R. L. Shewfelt, B. Brueckner & S. E. Prussia (Eds.), Postharvest
handling: A systems approach (2nd ed.). Burlington: Elsevier Science.
Competition Commission of Pakistan. (2012). CCP issues policy note for reform of price
determination practice for fresh milk presently in use by local authorities. Islamabad:
Retrieved from
http://www.cc.gov.pk/index.php?option=com_content&view=article&id=237:16-april-
2012&catid=2:uncategorised.
Creswell, J. W. (Producer). (2010). When should I choose a mixed methods approach? Retrieved
from http://www.srmo.sagepub.com.ezproxy.csu.edu.au/view/when-should-i-choose-a-
mixed-methods-approach/SAGE.xml?rskey=2sGzeU&row=1
Creswell, J. W., & Plano Clark, V. L. (2011). Designing and conducting mixed methods research
(2nd ed.). California: Sage Publications.
Dyer, J. H., & Singh, H. (1998). The relational view: Cooperative strategy and sources of
interorganizational competitive advantage. The Academy of Management Review, 23(4),
660-679.
Echeverría, R., Solh, M., Seré, C., & Hall, S. (2011). More meat, milk and fish – by and for the
poor. [Proposal submitted to the CGIAR Consortium Board]. International Livestock
Research Institute.
Fakhar, H., Fakhar Law International, & Walker, G. (2006). The white revolution "Dhoodh Darya"
white paper on Pakistan's dairy sector. Retrieved from
http://s3.amazonaws.com/zanran_storage/www.pakistan.gov.pk/ContentPages/19050134.pdf
.
Farooq, O. (2012). Pakistan economic survey 2011-12: Agriculture. Retrieved from Government of
Pakistan, Ministry of Finance website: http://www.finance.gov.pk/survey/chapter_12/02-
Agriculture.pdf.
Fearne, A. (Producer). (2009, 31 March). Value chain toolkit: Fundamentals of value chain thinking
DVD. Retrieved from http://www.pir.sa.gov.au/valuechains/value_chain_toolkit
43
Fellows, P., & Hampton, A. (1992). Small-scale food processing - A guide for appropriate
equipment Retrieved from http://www.fao.org/WAIRdocs/x5434e/x5434e00.htm#Contents
Food and Agriculture Organization. (2013a). FAO statistical yearbook 2013: World food and
agriculture. Rome: Food and Agriculture Organization of the United Nations.
Food and Agriculture Organization. (2013b). The state of food and agriculture 2013: Food systems
for better nutrition. Rome: Food and Agriculture Organization of the United Nations.
Gereffi, G., Humphrey, J., Kaplinsky, R., & Sturgeon, T. J. (2001). Introduction: Globalisation,
value chains and development. IDS Bulletin, 32(3), 1–8.
Gereffi, G., Humphrey, J., & Sturgeon, T. J. (2005). The governance of global value chains. Review
of International Political Economy, 12(1), 78-104. doi: 10.1080/09692290500049805
Government of Pakistan. (2010). Agricultural census 2010. Retrieved from Pakistan Bureau of
Statistics website: http://www.pbs.gov.pk/content/agricultural-census-2010-pakistan-report.
Government of Pakistan. (2011). Household integrated economic survey 2010-11. Retrieved from
Pakistan Bureau of Statistics website: http://www.pbs.gov.pk/content/household-integrated-
economic-survey-hies-2010-11.
Government of Pakistan. (2013). Household integrated economic survey 2011-12. Retrieved from
Pakistan Bureau of Statistics website: http://www.pbs.gov.pk/content/household-integrated-
economic-survey-hies-2011-12.
Government of the Punjab. (2011). The Punjab pure food rules, 2011. Retrieved from Health
Department website: http://www.punjabfoodauthority.gov.pk/instruction/PFR2011.pdf.
Government of the Punjab. (2012). Punjab development statistics 2012. Retrieved from Bureau of
Statistics website: http://bos.gop.pk/?q=system/files/Development-Statistics-2012.pdf.
Gunderson, M. A., Wysocki, A. F., & Stern, J. A. (2009). A functional evaluation of business
models in fresh produce in United States. In W. J. Florkowski, R. L. Shewfelt, B. Brueckner
& S. E. Prussia (Eds.), Postharvest handling: A systems approach (2nd ed.). Burlington:
Elsevier Science.
Hemme, T. (Ed.). (2010). Dairy Report 2010. Keil, Germany: International Farm Comparison
Network (IFCN).
Humphrey, J. (2006). Policy implications of trends in agribusiness value chains. European Journal
of Development Research, 18(4), 572-592. doi: 10.1080/09578810601070704
International Monetary Fund. (2013a). IMF mission and Government of Pakistan reach a staff-level
agreement on EFF-supported program [Press release]. Retrieved from
http://www.imf.org/external/np/sec/pr/2013/pr13249.htm
International Monetary Fund. (2013b). World economic outlook, April 2013: Hopes, realities, risks.
Washington DC: International Monetary Fund.
Jupp, V. (2006). The SAGE dictionary of social research methods: Mixed methods research.
London: SAGE Publications.
Kaplinsky, R. (2001). Spreading the gains from globalization: What can be learned from value
chain analysis? IDS Working Paper 110: Institute of Development Studies.
Kaplinsky, R., & Morris, M. (2001). A handbook for value chain research (Vol. 113). Ottawa:
IDRC.
Khan, A. (2012). Pakistan economic survey 2011-12: Inflation Retrieved from Government of
Pakistan, Ministry of Finance website: http://www.finance.gov.pk/survey/chapter_12/07-
Inflation.pdf.
Kohls, R., & Uhl , J. N. (2002). Marketing of agricultural products (9th ed.). New Jersey: Prentice
Hall.
Lambert, D. M., & Cooper, M. C. (2000). Issues in supply chain management. Industrial Marketing
Management, 29(1), 65-83.
Malik, K. (2013). Human Development Report 2013: The rise of the South: Human progress in a
diverse world. New York: United Nations Development Programme.
44
Mazhar, N. (2013). Pakistan economic survey 2012-13: Population, labour force and employment.
Retrieved from Government of Pakistan, Ministry of Finance website:
http://www.finance.gov.pk/survey/chapters_13/12-Population.pdf.
Ministry of Food, Agriculture and Livestock, Government of Pakistan. (2007). Livestock
development policy of Pakistan. Unpublished report.
Pakistan Bureau of Statistics. (2011). National Nutrition Survey. Unpublished report. Government
of the Pakistan. Islamabad.
Patton, M. Q. (2002). Qualitative research and evaluation methods (3rd ed.). Thousand Oaks,
California: Sage Publications.
Planning Commission. (2013). 2013-14 Annual plan: Health, nutrition and Population. Retrieved
from Government of Pakistan, Ministry of Planning, Development & Reform website:
http://www.pc.gov.pk/annual%20plans/2013-
14/17%20Health,%20Nutrition%20and%20Population.pdf.
Porter, M. E. (1998). Competitive advantage: Creating and sustaining superior performance: With
a new introduction. New York: Free Press.
Purcell, T., Gniel, S., & van Gent, R. (Eds.). (2008). Making value chains work better for the poor:
A toolbook for practitioners of value chain analysis. Phnom Phen: Agricultural
Development International.
Raja, R. H. (2001). Pakistan smallholder dairy production and marketing. Retrieved 12 August
2011, from http://www.ilri.cgiar.org/InfoServ/Webpub/fulldocs/South_South/ch09.htm
Rogers, R. T., & Sexton, R. J. (1994). Assessing the importance of oligopsony power in agricultural
markets. American Journal of Agricultural Economics, 76(5), 1143-1150.
Schaffner, D. J., Schroder, W. R., & Earle, M. D. (2003). Food marketing: An international
perspective (2nd ed.). Boston: McGraw Hill.
Shah, F. (2006). Pakistan: Value chain analysis. Washiston DC: Retrieved from World Bank
website: http://documents.worldbank.org/curated/en/2006/03/7125324/pakistan-value-chain-
analysis.
Sharif, M., & Farooq, U. (2004). Study on current and potential market supply & demand, market
opportunities and consumer preferences for indigenous breed animals/products. Neirobi:
National Agriculture Research Centre & International Livestock Research Institute.
Siddique, A. H. (2011). Pakistan economic survey 2010-11: Poverty. Retrieved from Government
of Pakistan, Ministry of Finance website: http://www.finance.gov.pk/survey/chapter_11/13-
Poverty.pdf.
Spekman, R., E, Kamauff Jr, J. W., & Myhr, N. (1998). An empirical investigation into supply
chain management: A perspective on partnerships. Supply Chain Management: An
International Journal, 28(8), 630-650. doi: 10.1108/09600039810247542
Staal, S. J., Pratt, A. N., & Jabbar, M. (2008). Dairy development for the resource poor. Part 3:
Pakistan and India dairy development case studies. Rome: Retrieved from International
Livestock Research Institute website: http://cgspace.cgiar.org/handle/10568/1582.
Stych, M., & Gulati, R. (2008). Creating value together. MIT Sloan Management Review, 50(1), 12-
13.
Tansey, G., & Worsley, T. (1995). The food system: A guide. London: Earthscan.
Teufel, N., & Gall, C. F. (1999). Characteristics of village milk production in the Punjab of
Pakistan. http://ftp.gwdg.de/pub/tropentag/proceedings/1999/referate/STD_A3.pdf
United Nations. (2012). Population division, population estimates and projections section.
Retrieved 15 December 2012, from http://www.un.org/esa/population/
United States Department of Agriculture [USDA]. (2005). International food consumption patterns.
Retrieved from: http://www.ers.usda.gov/data-products/international-food-consumption-
patterns.aspx#.Ued2d40yZ5U
45
USAID. (2005). In-depth interview guides Tanzania country study qualitative component.
Retrieved 1 March 2012, from http://www.microfinancegateway.org/sites/default/files/mfg-
en-toolkit-in-depth-interview-guides-tanzania-country-study-qualitative-component-dec-
2005_0.pdf
USAID Microlinks. (n.d.). Value chain development. Retrieved 12 March 2012, from
https://www.microlinks.org/good-practice-center/value-chain-wiki
Williamson, O. E. (1971). The vertical integration of production: Market failure considerations. The
American Economic Review, 61(2), 112-123. doi: 10.2307/1816983
Williamson, O. E. (1991). Comparative economic organization: The analysis of discrete structural
alternatives. Administrative Science Quarterly, 36(2), 269-296. doi: 10.2307/2393356
Woodruff, R. B. (1997). Customer value: The next source for competitive advantage. Journal of the
Academy of Marketing Science, 25(2), 139-153.
World Bank. (2006). Pakistan - Growth and export competitiveness Washington DC: Retrieved
from World Bank website:
http://documents.worldbank.org/curated/en/2006/04/6807253/pakistan-growth-export-
competitiveness.
World Bank. (2012). World development report 2013: Jobs. Washington DC: Retrieved from
https://openknowledge.worldbank.org/handle/10986/11843.
World Bank. (2013). World development indicators 2013. Washington DC: Retrieved from
http://databank.worldbank.org/data/download/WDI-2013-ebook.pdf.
World Bank. (2014). 2014 World development indicators. Washington DC: Retrieved from
http://data.worldbank.org/sites/default/files/wdi-2014-book.pdf.
Wynn, P. (2010). Strengthening dairy value chains in Pakistan through improved farm management
and more effective extension services. Retrieved 12 December 2012, from
http://aciar.gov.au/project/lps/2010/007
Wynn, P. (Unpublished). Improving dairy production in Pakistan through improved extension
services. Retrieved 12 October 2012, from http://aciar.gov.au/project/LPS/2005/132
Wynn, P., Harris, D., Moss, R., Clem, B., Sutton, R., & Doyle, P. (2006). Report on dairy mission
to Pakistan carried out under the auspices of the Australia-Pakistan agriculture sector
linkages program. Canberra: Retrieved from Australian Centre for International
Agricultural Research (ACIAR) website:
http://aciar.gov.au/files/node/740/Dairy%20constraints%20analysis%20report.pdf.
Yin, R. (2009). Case study research: Design and methods (4th ed.). California: Sage Publications.
Zia, U. e. (2007). Improved market access and smallholder dairy farmer participation for
sustainable dairy development. Islamabad, Pakistan: Food and Agriculture Organization of
the United Nations.
Zia, U. e., Mahmood, T., & Ali, M. R. (2011). Dairy development in Pakistan. Rome: Food and
Agriculture Organization of the United Nations.