miller and walker creeks basin monitoring sampling and … · · 2011-04-15to prioritize the list...
TRANSCRIPT

Miller and Walker Creeks Basin Monitoring Sampling and Analysis Plan
King County i
Miller and Walker Creeks Basin Monitoring Sampling and
Analysis Plan
April 14, 2011
Alternate Formats Available
206-296-6519 TTY Relay: 711
Miller and Walker Creeks Basin Monitoring Sampling and Analysis Plan
King County ii
Miller/Walker Creek Basin Monitoring
Sampling and Analysis Plan
Submitted by
Dean Wilson King County Water and Land Resources Division Department of Natural Resources and Parks

Miller and Walker Creeks Basin Monitoring Sampling and Analysis Plan
King County i
Table of Contents
1.0. Monitoring Program description ......................................................................................... 1
1.1 Introduction. .................................................................................................................... 1
1.2 Prioritization of Monitoring Parameters. ........................................................................ 2
1.3 Structure of the Monitoring Sampling and Analysis Plan. ............................................. 5
2.0. Sampling design .................................................................................................................. 7
2.1 Monitoring Area.............................................................................................................. 7
2.2 Hydrology. ...................................................................................................................... 7
2.2.1 New Gauge Locations ................................................................................................. 9
2.2.2 Quality Control ......................................................................................................... 11
2.3 Water Quality ................................................................................................................ 11
2.3.1 Temperature, Dissolved Oxygen, Turbidity, and pH ................................................ 11
2.3.2 Nutrients .................................................................................................................... 11
2.3.3 Metals ........................................................................................................................ 12
2.3.4 Organics and Pesticides ............................................................................................ 13
2.3.5 Bacteria ..................................................................................................................... 15
2.3.6 Dioxins ...................................................................................................................... 16
2.3.7 Sampling Procedures ................................................................................................ 16
2.3.8 Data Quality Objectives ............................................................................................ 18
2.3.9 Reporting Limits ....................................................................................................... 18
2.3.10 Measurement Procedures ...................................................................................... 20
2.3.11 Quality Control ..................................................................................................... 21
2.3.12 Data Quality Assessment, Qualification, and Reporting ...................................... 25
2.3.13 Proposed Laboratory Qualifiers. ........................................................................... 25
2.4 Ecological Indicators .................................................................................................... 27
2.4.1 Benthic Invertebrate Monitoring............................................................................... 27
2.4.2 Coho Prespawn Mortality ......................................................................................... 28
3.0. Implementation Considerations ........................................................................................ 30
3.1 Continuation of Existing Monitoring. ........................................................................... 30
3.2 Change in Monitoring Prioritization: Origin of Stormwater and Juvenile Fish. ......... 31
3.3 Role of Volunteers in Monitoring. ................................................................................ 31
3.4 Next Steps. .................................................................................................................... 32
Miller and Walker Creeks Basin Monitoring Sampling and Analysis Plan
King County ii
4.0. References ......................................................................................................................... 33
Tables
Table 1. Nutrients to be sampled ............................................................................................ 12
Table 2. Metals to be Sampled ................................................................................................ 13
Table 3. Organic Parameters ................................................................................................... 14
Table 4. Containers and Hold Times for Nutrients, Metals, Organics, and Bacteria ............. 17
Table 5. State Water Quality Standards for Temperature, DO, Turbidity, and pH in Miller
and Walker Creeks. ............................................................................................................... 19
Table 6. Washington State Water Quality Standards for Metals at a Hardness of 25
mg/CaCO3. ............................................................................................................................ 19
Table 7. Methods and Detection Limits Conventionals, Bacteria, and Organics ................... 20
Table 8. Methods and Detection Limits for Metals ................................................................ 21
Table 9. Conventionals Quality Control ................................................................................. 21
Table 10. Metals Quality Control ............................................................................................. 22
Table 11. Organics Quality Control .......................................................................................... 22
Table 12. Laboratory Qualifiers ................................................................................................ 25
Figures
Figure 1. Miller and Walker Creeks Basin – Vicinity Map ....................................................... 6
Figure 2. Current (2011) Hydrologic Monitoring Locations – Miller and Walker Creeks ........ 8
Figure 3. Future Monitoring Locations and Parameters – Miller and Walker Creeks ............. 10

King County 1 4/14/11
1.0. MONITORING PROGRAM
DESCRIPTION
1.1 Introduction.
This document describes the Miller and Walker Creeks Monitoring Sampling and Analysis
Program. The purpose of the Monitoring Program is to provide information to help the Highline
community:
Understand the status and trends of the health of the lands and waters of the Miller and
Walker Creeks basin (Figure 1),
Determine the likely causes of key water quantity, water quality, and habitat problems,
and
Evaluate changes in the health of land and water as a result of conservation/restoration
actions, stormwater management, and land use changes.
In the broadest sense, the Monitoring Program is intended to give the Highline community
information to effectively manage the part of Puget Sound it cares for.
This monitoring program was developed from a recommendation in the Miller and Walker
Creeks Basin Plan (Executive Proposed – February 2006). The broad outlines and prioritization
of data collection in this program was developed by the community in a series of three
workshops held in the fall of 2008.
The 2006 Executive Proposed Basin Plan describes the current conditions within the basin,
including documentation of water quality problems and makes recommendations to improve
conditions within the creeks. The plan was developed by six agencies with jurisdiction in the
basin: City of Burien, City of Normandy Park, City of SeaTac, King County, Port of Seattle, and
the Washington State Department of Transportation.
The Basin Plan recommended that a basin monitoring program be designed and implemented.
The Basin Plan stated:
An ongoing basin monitoring program should be initiated that will allow for trend
analysis of flow, water quality, and habitat data. The flow data to be collected should
include precipitation and stream gauge information sufficient to assess trends in high and
low flows and erosive work, and to evaluate the effectiveness of capital projects and
regulations. Water quality data to be collected should include data sufficient to conduct
trend analysis of conventional water quality parameters, including hardness and
temperature; metals; nutrients; and organics. Habitat data to be collected should include
spawner surveys and B-IBI data sufficient to determine biological trends in the Basin.
Specific parameters to be measured, sampling locations, and sampling frequencies will
need to be more fully developed as part of a sampling and analysis plan [emphasis
added]. Automated sampling should be used to the extent practicable. Estimated cost:
$50,000 annual combined costs for both Miller Creek and Walker Creek. (page 5-4)

King County 2 4/14/11
1.2 Prioritization of Monitoring Parameters.
Following the Basin Plan recommendation, an ad hoc advisory committee was convened to
develop recommendations for a monitoring program. The advisory committee – made up of all
interested jurisdiction/agency staff and basin residents – met three times in late 2008. The
advisory committee’s recommendations were summarized in a report produced in 2009
(Recommendations for Miller and Walker Creek Basin Monitoring Coordination, June 2009).
The advisory committee identified questions important to Miller and Walker Creeks that the
monitoring program should answer. The committee also prioritized watershed concerns and
identified locations where monitoring ought to occur. The monitoring questions developed by
the advisory committee are as follows:
Flow-Related Questions
Flow: Are flow volumes adversely affecting beneficial uses? Are peak flows and low
flows a problem in Miller and/or Walker Creek? Are management actions in the basins
improving the flow regime? Where do stormwater volumes originate in the Miller Creek
basin? Is there a low flow problem in Miller Creek and/or Walker Creek?
Stormwater Origin: Where do stormwater volumes originate in the Miller Creek basin?
Erosion and Sedimentation: Are there erosion and sedimentation problems? If so,
where are the significant areas?
Water Quality-Related Questions
Temperature: Are water temperatures supporting aquatic life? Are management actions
in the basins improving the temperature regime?
Conductivity, Turbidity, Dissolved Oxygen, and pH: Are water conductivity, turbidity,
dissolved oxygen, and pH during storm events and base flow conditions supporting
aquatic life? Are management actions in the basins improving the water conductivity,
turbidity, dissolved oxygen, and pH parameters?
Metals: Are metals (e.g., copper, lead, zinc, etc., in association with dissolved ions
[hardness]) concentrations affecting aquatic life? Are management actions in the basins
improving metals concentrations?
Nutrients: Are nutrient (e.g., nitrogen, phosphorous) levels supporting aquatic life in
terms of impairing dissolved oxygen? Are management actions in the basins improving
nutrient conditions?
Organics: Are organic contaminants (e.g., hydrocarbons, phthalates, endocrine
disruptors, surfactants) affecting aquatic life?
Bacteria: Are bacteria (e.g., fecal coliform) levels safe for human bathing in Walker
Creek? If not, where are the bacteria originating from?
Pesticides: Are pesticides affecting aquatic life?
Toxicity: Is water quality toxic to aquatic life?

King County 3 4/14/11
Biological Indicators and Habitat Questions
Adult Fish Returns: What are the adult fish returns? Is coho pre-spawn mortality a
problem? What is origin of adult fish?
Benthic Index of Biotic Integrity (BIBI): Are management actions in the basins
improving aquatic food web productivity/diversity?
Juvenile Fish (Coho) Presence and Numbers: Where are juvenile fish (coho)
abundant? What is the productivity of stream?
Juvenile Fish Outmigrant Numbers: What are juvenile outmigrant fish numbers (coho
and chum)?
In-stream Physical Habitat Structure: Are management actions in the basins
improving physical habitat features including pools, riffles, and large wood?
Riparian Terrestrial Vegetation: Are management actions in the basins improving
riparian terrestrial vegetation (e.g., percent shade cover, invasive species abundance)?
To prioritize the list of parameters that could be monitored, the Ad Hoc Advisory Committee
categorized the parameters above into two categories, the first being the highest priority:
1) Monitoring focused on ―vital signs‖ of stream and watershed ecosystem health.
These vital signs are monitored to understand status and/or trends in the watershed.
In order to reveal status and trends, these parameters must be continuous (as in the
case of flow) or annual (as in the case of adult fish return counts). These parameters
– listed in no particular order – are:
Flow (continuous)
Temperature (continuous)
Conductivity, turbidity, dissolved oxygen (continuous), and pH
(these are grouped because they are relatively easy to collect simultaneously)
Benthic Index of Biotic Integrity (BIBI)
Adult fish return numbers
Juvenile fish (coho) presence and numbers1
Juvenile fish outmigrant numbers2
1 Juvenile fish (coho) presence and numbers and juvenile fish outmigrant numbers were listed as ―first priority‖
―vital signs‖ monitoring parameters by the Ad Hoc Advisory Committee. In this sampling and analysis plan, these
parameters have been re-assigned to ―second priority‖ although they remain ―vital signs‖ parameters because they
need to be monitored annually to reveal status and trends. See Section 3.2 for discussion of the re-prioritization.
2 See preceding footnote.
First Priority
King County 4 4/14/11
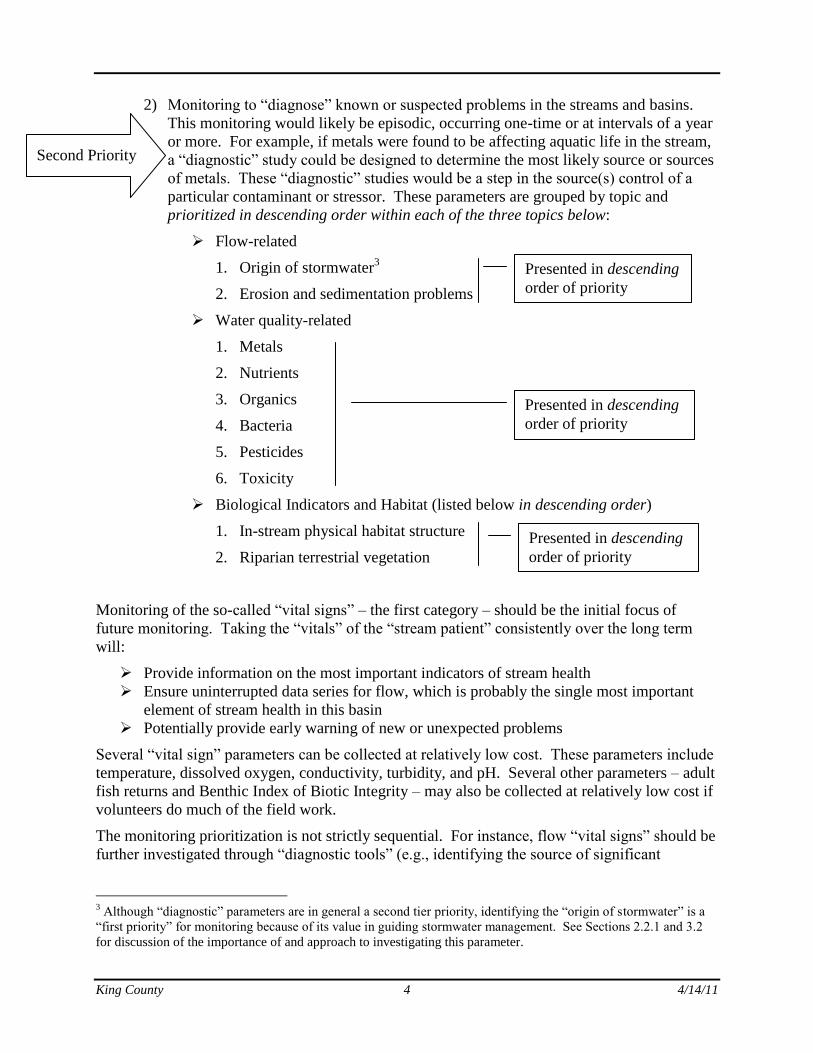
2) Monitoring to ―diagnose‖ known or suspected problems in the streams and basins.
This monitoring would likely be episodic, occurring one-time or at intervals of a year
or more. For example, if metals were found to be affecting aquatic life in the stream,
a ―diagnostic‖ study could be designed to determine the most likely source or sources
of metals. These ―diagnostic‖ studies would be a step in the source(s) control of a
particular contaminant or stressor. These parameters are grouped by topic and
prioritized in descending order within each of the three topics below:
Flow-related
1. Origin of stormwater3
2. Erosion and sedimentation problems
Water quality-related
1. Metals
2. Nutrients
3. Organics
4. Bacteria
5. Pesticides
6. Toxicity
Biological Indicators and Habitat (listed below in descending order)
1. In-stream physical habitat structure
2. Riparian terrestrial vegetation
Monitoring of the so-called ―vital signs‖ – the first category – should be the initial focus of
future monitoring. Taking the ―vitals‖ of the ―stream patient‖ consistently over the long term
will:
Provide information on the most important indicators of stream health
Ensure uninterrupted data series for flow, which is probably the single most important
element of stream health in this basin
Potentially provide early warning of new or unexpected problems
Several ―vital sign‖ parameters can be collected at relatively low cost. These parameters include
temperature, dissolved oxygen, conductivity, turbidity, and pH. Several other parameters – adult
fish returns and Benthic Index of Biotic Integrity – may also be collected at relatively low cost if
volunteers do much of the field work.
The monitoring prioritization is not strictly sequential. For instance, flow ―vital signs‖ should be
further investigated through ―diagnostic tools‖ (e.g., identifying the source of significant
3 Although ―diagnostic‖ parameters are in general a second tier priority, identifying the ―origin of stormwater‖ is a
―first priority‖ for monitoring because of its value in guiding stormwater management. See Sections 2.2.1 and 3.2
for discussion of the importance of and approach to investigating this parameter.
Presented in descending
order of priority
Presented in descending
order of priority
Second Priority
Presented in descending
order of priority

King County 5 4/14/11
stormwater inputs) before all other ―vital signs‖ monitoring is under way. See section 2.2.1 for
discussion of how this could occur.
Taken together over the long run, the ―vital signs‖ and ―diagnostic tools‖ monitoring should:
Reveal trends in aquatic ecosystem health (for those parameters monitored continuously
or periodically),
Diagnose the nature, origin, and degree of problems in the basin, thereby informing
management actions on the best, most cost effective ways to restore stream ecosystem
health, and
Indicate whether management actions are having a positive effect on aquatic ecosystem
health.
Lastly, a third type of monitoring is necessary on occasion. During August-November 2010,
monitoring to measure concentrations of toxins produced by algae on Lake Burien took place for
the first time and detected very high levels of hepatotoxins. In early 2011, very low levels of a
neurotoxin were detected for the first time. Data from such monitoring is needed to protect the
health and safety of people and domestic animals that swim in or recreate on the lake. This
monitoring is occurring according to protocols established by the Washington State Department
of Ecology and the King County Environmental Lab and thus is not discussed in detail in this
Sampling and Analysis Plan. Monitoring is expected to continue as conditions warrant.
Through mid-2012, funding is provided by the Department of Ecology. To date, toxic algae
have not been identified in Arbor Lake, the only other lake in the basin frequented by people.
1.3 Structure of the Monitoring Sampling and
Analysis Plan.
This monitoring program Sampling and Analysis Plan (SAP) documents the monitoring program
that has been designed to answer the questions and reveal the trends summarized above.
This SAP divides indicators of watershed health into three key areas and discussed each in turn
in Section 2:
Hydrology
Water Quality
Ecological indicators
Section 3 discusses implementation considerations including practical and cost considerations
that should guide decisionmaking on monitoring and the use of volunteers in collecting data.
Two appendices cover data collection protocols for Benthic Index of Biotic Integrity and adult
fish return/pre-spawn mortality surveys.

King County 6 4/14/11

King County 7 4/14/11
2.0. SAMPLING DESIGN
2.1 Monitoring Area
The Miller and Walker Creek basins are located south of Seattle and west of SeaTac
International Airport in southern King County (Figures 1 and 2). The headwaters of Miller
Creek begin in unincorporated King County in White Center and flow south into the city of
Burien. Upon entering the city of SeaTac, a large segment of the creek flows onto the Port of
Seattle property on the northwest area of SeaTac Airport. Downstream of the Port of Seattle
property, the creek once again enters the city of Burien. The creek then flows into the city of
Normandy Park before draining into Puget Sound.
The Walker Creek basin is located just south of the Miller Creek basin. The upper Walker Creek
basin is on the Port of Seattle property at SeaTac Airport in the city of SeaTac. As a clearly-
defined creek, Walker Creek flows from the headwater wetlands in Burien west into Normandy
Park. The creek continues through Normandy Park and joins Miller Creek just before the latter
stream empties into Puget Sound.
The combined Miller and Walker Creeks basin covers approximately nine square miles.
2.2 Hydrology.
Hydrologic modeling was conducted as part of the Basin Plan for both Miller and Walker
Creeks. In Miller Creek, this modeling indicates that current peak storm flows range from 70 to
1,600 percent higher than before development occurred in the basin. The erosive force of these
peak flows in Miller Creek is currently between 400 and 450 times greater than before the basin
was developed, causing significant damage to the instream habitat. In Walker Creek, the erosive
force of current peak flows is much less than Miller Creek but current peak flows are about 30
percent more erosive than before the basin was developed. Because conditions differ between
Miller and Walker Creek peak flows, different monitoring strategies are proposed. For Walker
Creek, continued monitoring will determine if changes within the basin cause any degradation of
the hydrology over time. In Miller Creek, monitoring will be designed to investigate where the
largest peak flows are originating.
Existing flow gauges in the Miller and Walker Creek basins are located in several places
(Figure 2). In Miller Creek, gauges are located:
Near the mouth of the creek (in late 2010, this gauge – 42A – was re-located from 175th
Place S.W. at River Mile 0.3 upstream to the grounds of the Southwest Suburban Sewer
District at RM 0.75; given the limited stream inputs between the two locations, flow is
believed to be essentially the same between the two locations, with the new location
providing more accurate readings),
Just upstream (to the east) of SR 509/Des Moines Memorial Drive (gauge 42J),
At the Miller Creek Regional Detention facility just upstream from the Lora Lake
confluence (gauge 42B), and
At Lake Reba outlet, a tributary to Miller Creek (gauge 42R).

King County 8 4/14/11

King County 9 4/14/11
In Walker Creek, gauges are located just upstream from the confluence with Miller Creek at 13th
Ave. S.W. (gauge 42E) and below SR 509 (gauge 42K).
Analyses of the data from the existing gauges on Miler Creek indicate that the highest peak flows
at the mouth of the creek are originating from downstream of the gauge near SR 509.
Additionally, these data show that rainfall in this area is quickly concentrated and routed to the
stream. Two main tributaries to Miller Creek between these gauges are stormwater being
discharged from the Ambaum Pond regional detention facility and the outflow creek from Lake
Burien, which also intercepts a large amount of stormwater. Both of these tributaries receive
stormwater from highly developed areas in the basin that contain mostly impervious areas.
Analysis was also conducted on data from a gauge (no longer active) located just upstream of
SR 518, in the upper Miller Creek basin. Data from this gauge in the upper basin was compared
to data from the gauge at the mouth of the creek to determine the relative contributions from the
upper basin to the peak flows at the mouth. The timing of the flow down the creek shows that
water from the upper basin courses through the creek and arrives at the mouth after flows have
peaked at the mouth. This indicates that flow from higher up in the basin (at least above SR 518)
does not contribute to the peak flows at the mouth. Therefore, no new monitoring that far
upstream is proposed.
2.2.1 New Gauge Locations
The primary goal of monitoring flow at additional locations in Miller Creek is to refine where the
largest peak flows are originating in the basin and to evaluate progress made in reducing
stormwater runoff volumes. To this end, two new permanent sites will be monitored
continuously for flow (Figure 3)
The first new location will be on the mainstem of Miller Creek just downstream of where
the Ambaum Pond regional detention facility discharges into the creek west of 1st
Avenue SW and south of 160th
Street. This location also corresponds to the boundary
between the cities of Burien and Normandy Park functionally from a stormwater
discharge perspective.
The second location will be on the Lake Burien outlet tributary near the intersection of
160th
Street and 4th
Avenue S.W.
Following installation of these two new permanent gauges, it is recommended that additional
future flow monitoring be an iterative process. After one year of collecting continuous data from
the two new locations, it should be possible to narrow the possible areas that are contributing the
greatest flows. By comparing data from these two new gauges to the gauge at the mouth, we will
be able to determine the relative contributions from the subbasin(s) contributing stormwater to
the Lake Burien outlet stream, and the subbasin stretching north from the Ambaum detention
pond south of Five Corners (S. 160th
St.) up First Ave. S. to approximately S. 146th
St. Once the
stormwater contribution of these areas is quantified then further refinement can occur by placing
flow metering equipment temporarily in additional upstream locations. By iterative flow
monitoring in this manner, data collected using this design will show which drainage areas
contribute the highest peak flows to the creek. Once this is known, priority for stormwater
control or demonstration low impact development projects can be assigned to areas that would be
the most effective areas to reduce runoff.

King County 10 4/14/11

King County 11 4/14/11
2.2.2 Quality Control
Flow data collected in association with this monitoring program will be reviewed for quality
assurance purposes. These data will be examined for gaps, anomalies, or inconsistencies
between the discharge, water level, and/or precipitation data from the various monitoring
stations. In the event that quality assurance issues are identified on the basis of these reviews, a
site visit will be performed immediately to troubleshoot the problem and to implement corrective
actions if possible. Any quality assurance issues that are detected through these reviews will be
documented in the electronic data record and in separate tracking forms. This review will be
performed to ensure that all data are consistent, correct, and complete, and that all required
quality control information has been provided.
Flow measurement devices and methods will be consistent with accepted scientific practices and
will be selected and used to ensure the accuracy and reliability of measurements of the volume of
monitored discharges. The devices will be installed, calibrated, and maintained to ensure that the
accuracy of the measurements is consistent with the accepted industry standard for that type of
device. Frequency of calibration will be in conformance with manufacturer's recommendations
or at a minimum frequency of at least one calibration per year. Calibration records will be
maintained for a minimum of three years.
2.3 Water Quality
2.3.1 Temperature, Dissolved Oxygen, Turbidity, and pH
The process of urbanization within the Miller and Walker Creek basins over the past century has
resulted in both the increase in impervious surfaces and the loss of riparian habitat. The increase
in impervious surfaces has different effects in the wet season as compared to the dry season. In
the wet season, stormwater flows quickly to the creek and into Puget Sound. Very little of these
flows infiltrate into ground water. This increased flow erodes stream beds, banks, and riparian
areas, entraining sediment into the water column and causing the turbidity of the stream to
increase. Additionally, the reduced ground water infiltration results in lower groundwater flows
into the creeks after the wet season. Lower dry-season flows provide less habitat – the wetted
area of the stream is simply smaller than with higher flows – and have less heat capacity, causing
the stream to warm more quickly when exposed to the sun. This change in hydrology coupled
with the loss of the shading provided by riparian vegetation can cause creek temperatures to rise
to levels that can be harmful to organisms living in the creek. With higher temperatures, less
oxygen can be dissolved into the water column, which then also can become a limiting factor for
stream-dwelling organisms.
Because of these concerns, temperature, DO, turbidity, and pH will be monitored near the
mouths of both Miller and Walker Creeks. These data will be collected at or near the
installations of flow gauges 42A and 42E. Data will be compared to State Water Quality
Standards.
2.3.2 Nutrients
Nutrients have only been monitored sporadically in both Miller and Walker Creeks. Nutrients
such as nitrogen, phosphorus, and silica are necessary for plant and animal growth. However,

King County 12 4/14/11
increasing nutrient availability can increase the growth of aquatic plants, which can cause
nuisance blooms that subsequently decay. The decomposition of algae can deplete oxygen to
levels incapable of sustaining many aquatic organisms, thus leading to more problems. In the
temperate latitudes, phosphorus is most often the primary nutrient of concern in freshwater
systems because it is usually the nutrient that is in shortest supply, thus limiting algae growth
(Welch and Jacoby, 2004). In marine systems, nitrogen is the nutrient in shortest supply. Excess
phosphorus in the freshwater and nitrogen in marine waters can cause nuisance algal blooms or
even algal blooms that produce toxins, as occurred in Lake Burien in late summer/fall 2010.
Additional nitrogen and phosphorus from human activities enters water bodies via pathways such
as the discharge of detergents, runoff containing fertilizers, pet waste, car washing and seepage
from failing septic systems.
To monitor whether nutrients are in concentrations that support (and do not impair by reducing
dissolved oxygen) diverse aquatic organisms in the creeks, nutrient samples will be collected
monthly. Samples will be collected at the mouths of the streams at or near the flow gauge
installations.
Table 1. Nutrients to be sampled
Parameter
Ammonia Nitrogen
Nitrate+Nitrite Nitrogen
Orthophosphate Phosphorus
Total Nitrogen
Total Phosphorus
2.3.3 Metals
Metals sampling conducted by the Department of Ecology in lower Miller Creek in 2004 and
2006 and in lower Walker Creek in 2008 show no exceedances of several metals tested. The
sampling was conducted routinely every month by water year. This indicates that metals
sampling could be viewed as a lower priority than other sampling; however, metals concentration
in urban streams are typically higher during storm sampling. If metals sampling were to be
conducted, it should also be conducted during stormflows for a better understanding of the total
load of metals in the creeks.
Collecting metal samples four times during one water year is proposed. Two of these samples
should be collected during storm conditions. Samples should be collected at the mouths of the
streams at or near the flow gauge installations. Metals samples should consist of four individual
grab samples collected over a one-hour period that are composited into a single sample for
analysis. Metals data will be compared to water quality standards. If monitoring indicates water
quality problems, additional samples will be collected upstream at locations identified in the
monitoring coordination recommendations report to better refine the source of metals to the
creeks.

King County 13 4/14/11
Table 2. Metals to be Sampled
Metal
Total & Dissolved Aluminum
Total & Dissolved Arsenic
Total & Dissolved Cadmium
Total & Dissolved Chromium
Total & Dissolved Copper
Total & Dissolved Lead
Total & Dissolved Nickel
Total & Dissolved Silver
Total & Dissolved Zinc
Total Mercury
Hardness
2.3.4 Organics and Pesticides
Organic contaminants and pesticide concentration data have not been collected from Miller or
Walker Creeks. These data would be collected to survey if problems exist. A variety of organic
compounds could be analyzed; however, there are hundreds of current-use pesticides. A
representative list of organic compounds is presented below. Samples will be collected at the
mouths of the streams at or near the flow gauge installations. Data will be compared to water
quality standards or effects threshold values found in the scientific literature. If monitoring
indicates water quality problems, additional samples will be collected upstream at locations
identified in the monitoring coordination recommendations report to better refine the source of
organics to the creeks.
Organic samples will be collected four times during one water year. Two of these samples will
be collected during storm conditions. Samples will be collected at the mouths of the streams at
or near the flow gauge installations. Organics samples should consist of four individual grab
samples collected over a one-hour period that are composited into a single sample for analysis.
Data will be compared to water quality standards. If monitoring indicates water quality
problems, additional samples will be collected upstream at locations identified in the monitoring
coordination recommendations report to better refine the source of metals to the creeks.

King County 14 4/14/11
Table 3. Organic Parameters
Base-Neutral-Acid Extractable Compounds (PAHs, Phthalates)
2-Methylnaphthalene
Acenaphthene
Acenaphthylene
Anthracene
Benzo(a)anthracene
Benzo(a)pyrene
Benzo(b)fluoranthene
Benzo(g,h,i)perylene
Benzo(k)fluoranthene
Benzyl Butyl Phthalate
Bis(2-Ethylhexyl)Phthalate
Chrysene
Dibenzo(a,h)anthracene
Diethyl Phthalate
Dimethyl Phthalate
Di-N-Butyl Phthalate
Di-N-Octyl Phthalate
Fluoranthene
Fluorene
Indeno(1,2,3-Cd)Pyrene
Naphthalene
Pentachlorophenol
Phenanthrene
Pyrene

King County 15 4/14/11
Base-Neutral-Acid Extractable Compounds (PAHs, Phthalates)
Organophosphorus Pesticides
Prometon
Diazinon
Dichlobenil
Malathion
Chlorpyrifos
Herbicides
MCPA
2,4-D
Triclopyr
Endocrine Disrupting Compounds
Total 4-Nonylphenol
Bis(2-ethylhexyl)adipate
Bisphenol-A
2.3.5 Bacteria
Currently Miller Creek is on the 303(d) list for fecal coliform bacteria. Fecal coliform samples
are collected weekly in lower Miller Creek by the Southwest Suburban Sewer District. The
District collects these data to alert them to potential problems with their trunk sewer line, which
is buried next to the creek upstream of their plant. This effort should continue and additional
fecal coliform monitoring should be undertaken in Walker Creek. Samples should be collected
at the mouth of Walker Creek at or near the flow gauge installation. These data, both the
bacteria data being collected in Miller Creek and samples that could be collected in Walker
Creek, can form the baseline information that can be used to design a fecal coliform source
control study that can determine the sources of bacteria to the creeks with the goal of eliminating
them.

King County 16 4/14/11
2.3.6 Dioxins
Dioxins have been detected in stormwater and catch basin sediments within the Miller Creek
basin at the site of the old Lora Lake Apartments (Port of Seattle, 2010). Investigations are
currently underway to determine if stormwater and catch basin sediments dioxins are attributable
to the site and if they have passed from the Lora Lake property to Lora Lake itself and into
Miller Creek. The Port of Seattle and the Department of Ecology have entered into an Agreed
Order under which the Port agreed to conduct a Remedial Investigation/ Feasibility Study
(RI/FS)(Ecology’s Lora Lake web site, accessed April 2011). The RI/FS will assess the
magnitude of the contamination and develop alternatives for cleanup. Because of the nature of
the hazardous chemicals found so far on the site and the uncertainties in this beginning phase of
the remedial investigation, additional monitoring is not currently recommended in this proposed
Miller and Walker Creeks Monitoring Sampling and Analysis Plan. Some sediment monitoring
in Miller Creek is proposed at the time of writing. Once the terms of the Agreed Order have
been fulfilled, the basin partners should decide whether and how to investigate further the
potential impacts of dioxin and/or any other contaminants of concern from the site on the stream
ecosystem.
2.3.7 Sampling Procedures
2.3.7.1 Temperature, Dissolved Oxygen, Turbidity, and pH
Temperature, dissolved oxygen, turbidity and pH will be collected continuously. Water quality
sensors will be installed near or along with installations at gauges 42A and 42E.
2.3.7.2 Nutrients, Metals, Organics, Bacteria
Water quality samples will be collected using grab sampling techniques. The goal of the
sampling is to collect a representative sample, which includes avoiding contamination or
sediment disruption.
Sampling personnel walk to the sample site wearing all proper gear including gloves and hip
boots or hip waders, and carrying all sample bottles.
Prior to entering the stream, the sampler determines the safety of entry and if deemed safe, enters
just downstream of sample site, wading in a manner to avoid disturbing the water with sediment
disruption. Samples should be collected from the deepest, swiftest moving portion of the stream,
especially during low flows.
Facing upstream, the sampler removes the cap from the sample bottle, tips the sample container
downward at a 45 degree angle and plunges the container so that the mouth is approximately 5
inches below the surface. In the same motion, the sample container is turned upward so it begins
filling with ambient water. The container must remain below the surface until it is full.
Once the container is full, it is brought above the surface of the water and the cap is replaced.
During this process, atmospheric exposure should be kept to a minimum. The sampler must try
to avoid collecting any debris, including sticks, leaves, feathers, etc. This process is repeated
until all sample containers for this site are filled. All sample containers are transported to the
laboratory on ice (King County, 2007).

King County 17 4/14/11
Microbiology samples are collected in 500-ml HDPE wide mouth bottles. The bottles are
autoclaved and kept capped following cleaning. Do not rinse Microbiology bottles. Do not fill
bottles above shoulder.
Samples for total metals are collected into one 500 ml bottle. Samples for dissolved metals are
collected into one 500 ml bottle and then filtered into and stored in the bottom portion of the
filtering apparatus. Dissolved metals samples are to be filtered within 15 minutes. Samples for
mercury are collected into one 500ml FEP bottle. Rinse all trace metals bottles three times. Do
not fill bottles above shoulder. This headspace is used for mixing and adding preservative.
Table 4. Containers and Hold Times for Nutrients, Metals, Organics, and Bacteria
Parameter Recommended Quantity
Container Holding Time Preservation
Total Nitrogen 250 mL 250 mL HDPE CWM
2 days w/o pres.;
28d H2SO4,pH<2;
28 days @ -20oC
Refrigerate, 4 °C
Total phosphorus 250 mL 250mL CWM HDPE
28 days Freeze at -18°C
Orthophosphate Phosphorus (ORTHOP)
60 mL 60 mL CWM HDPE (Collect together with NO23)
Field filter within 15 minutes of collection, then 14 days frozen
Freeze at -18°C
Ammonia Nitrogen 250 mL 250 mL HDPE CWM
14 days @ -20oC Filter and Freeze
@ -20 oC
Nitrate-nitrite (NO23) 60 mL 60 mL CWM HDPE (Collect together with ORTHOP)
Filter within one day, then 14 days frozen
Freeze at -18°C
Dissolved Metals 250 mL Acid washed 500 mL HDPE
6 months Field Filter within 15 minutes; then HNO3 to pH<2 at lab
Dissolved Mercury 500 mL Acid washed 500 mL HDPE bottle
28 days Field Filter within 15 minutes; then HNO3 to pH<2 at lab
Total Mercury 500 ml Acid washed 500 mL HDPE bottle
28 days HNO3 to pH<2
Total Metals 500 mL Acid washed 500 mL HDPE bottle
6 months HNO3 to pH<2

King County 18 4/14/11
Parameter Recommended Quantity
Container Holding Time Preservation
Hardness (CaCO3) (may be included in Total Metals bottle)
500 ml Acid washed 500 mL HDPE bottle
6 months HNO3 to pH<2
BNAs (PAHs, Phthalates)
4 X 1 liters 1 liter amber glass jar
7 days pH tested adjusted 6 to 9 within 15 min. of sampling. Store at 4 degrees C
Herbicides: 2 X 1 liters 1 liter amber glass jar
7 days Store at 4 degrees C
Pesticides: 4 X 1 liters 1 liter amber glass jar
7 days pH tested adjusted 5 to 9 within 15 min. of sampling. Store at 4 degrees C
Fecal coliform 500 mL 500 mL polypropylene autoclaved bottle
6+2 hours If chlorine is expected in the sample, then request thiosulfate preservative
2.3.8 Data Quality Objectives
Accuracy of measurements can be assessed by evaluating both precision and bias. Precision is a
measure of data scatter due to random error, while bias is a measure of differences between a
parameter value and the true value due to systematic errors. Measurement quality objectives
(MQO) specific to the parameters to be reported for this project are summarized in the Quality
Control section. It is expected that the quality objectives for this project will be achieved if the
sampling plan and procedures in this document are followed and the frequency and acceptance
limits in the Quality Control section are met.
2.3.9 Reporting Limits
Sufficient reporting limits are needed to ensure that data can be compared to water quality
standards and thresholds so that ecological and human health risks can be identified. Available
water quality standards, listed below, are used to design the laboratory analyses.
From the State Water Quality Standards (WAC 173-201A) it appears that Miller and Walker
Creeks are core salmon summer habitat and juvenile coho salmon and cutthroat trout are
observed in the stream year round. The following table lists the State Water Quality Standards
for temperature, dissolved oxygen (DO), turbidity, and pH for core salmon summer habitat.

King County 19 4/14/11
Table 5. State Water Quality Standards for Temperature, DO, Turbidity, and pH in
Miller and Walker Creeks.
Parameter State Water Quality Standards
Temperature 16°C
Dissolved Oxygen 9.5 mg/L
Turbidity 5 NTU over background if 50 NTUs or less, or 10% over background if background is greater than 50 NTUs
pH 6.5 to 8.5
Previous data collected on both Miller and Walker Creeks (Ecology 2004, 2006) have shown that
a hardness of 25 mg/CaCO3 is very low, resulting in commensurately stringent water quality
standards for hardness-adjusted metals. Using a hardness of 25 mg/CaCO3 represents a
conservative approach for identifying detection limits for metals analysis.
Table 6. Washington State Water Quality Standards for Metals at a Hardness of
25 mg/CaCO3.
Parameter Unit Acute Chronic
Arsenic, Dissolved µg/L 190
Cadmium, Dissolved µg/L 0.8227 0.3693
Chromium (III), Total µg/L 176.3104 57.1933
Copper, Dissolved µg/L 4.6090 3.4719
Iron, Dissolved µg/L -- --
Lead, Dissolved µg/L 13.8822 0.5410
Mercury, Dissolved µg/L 2.1 --
Mercury, Total µg/L -- 0.012
Nickel, Dissolved µg/L 438.0648 48.6506
Selenium, Total µg/L 20 5
Silver, Dissolved µg/L 0.3179 --
Zinc, Dissolved µg/L 35.3574 32.2867

King County 20 4/14/11
2.3.10 Measurement Procedures
Adherence to standardized analytical protocols and associated quality assurance/quality control
(QA/QC) guidelines for both chemical and microbiological testing will help produce data able to
meet the project goals and objectives.
This section presents the chemical and microbiological analytical methodologies that will be
employed during this project, along with associated detection limits. The distinction between a
method detection limit (MDL) and a reporting detection limit (RDL) is as follows:
The MDL is defined as the minimum concentration of a chemical constituent that can be
detected.
The RDL is defined as the minimum concentration of a chemical constituent that can be
reliably quantified.
Table 7. Methods and Detection Limits Conventionals, Bacteria, and Organics
Parameter Method Method Detection Limit
Reporting Detection Limit
Hardness as CaCO3 EPA 200.8/SM2340B.ED19
0.066 (mg CaCO3/L) 0.33 (mg CaCO3/L)
Fecal coliform SM9222D 1 cfu/100mls 1 min., 1E6 max cfu/100mls
Total phosphorus SM4500-P-B,F 0.005 mg/L 0.01 mg /L
Orthophosphate Phosphorus SM4500-P-F 0.002 mg/L 0.005 mg /L
Total Nitrogen SM4500-N-C 0.05 mg/L 0.1 mg/L
Nitrate-nitrite SM4500-NO3-F 0.01 mg/L 0.02 mg/L
PAHs SW846-8270D 0.05 ug/L 0.1 µg/L
Phthalates SW846-8270D 0.5 ug/L 1.0 µg/L
Herbicides SW846-8270D-SIM 0.01-1 ug/L 0.01 – 1.0 µg/L
Pesticides, Organophosphorus
SW846-8270D-SIM 0.01-1.0 ug/L 0.01 – 1.0 µg/L

King County 21 4/14/11
Table 8. Methods and Detection Limits for Metals
Parameter Method Method Detection Limit Reporting Detection Limit
Total and dissolved arsenic EPA 200.8 0.1 ug/L 0.5 ug/L
Total and dissolved cadmium EPA 200.8 0.05 ug/L 0.25 ug/L
Total and dissolved chromium EPA 200.8 0.2 ug/L 1.0 ug/L
Total and dissolved copper EPA 200.8 0.4 ug/L 2.0 ug/L
Total and dissolved lead EPA 200.8 0.1 ug/L 0.5 ug/L
Total and dissolved mercury EPA 245.1 0.05 ug/L 0.10 ug/L
Total and dissolved nickel EPA 200.8 0.1 ug/L 0.5 ug/L
Total and dissolved silver EPA 200.8 0.05 ug/L 0.25 ug/L
Total and dissolved zinc EPA 200.8 0.5 ug/L 2.5 ug/L
2.3.11 Quality Control
Laboratory quality control (QC) samples for conventional analyses and associated control limits
are summarized below. These QC samples will be analyzed at a frequency of one per analytical
batch of 20 or fewer samples.
Table 9. Conventionals Quality Control
Conventionals
Water Samples QC Sample
Parameter Method Blank Lab Duplicate RPD (%)
Matrix Spike Recovery (%)
Lab Control Sample Recovery (%)
Ammonia Nitrogen <MDL 20 75-125 85-115
Nitrate+Nitrite Nitrogen <MDL 20 75-125 85-115
Orthophosphate Phosphorus
<MDL 20 75-125 85-115
Silica as Silicate <MDL 20 65-120 85-115
Total Phosphorus <MDL 20 75-125 85-115
Total Nitrogen <MDL 20 75-125 85-115
King County 22 4/14/11
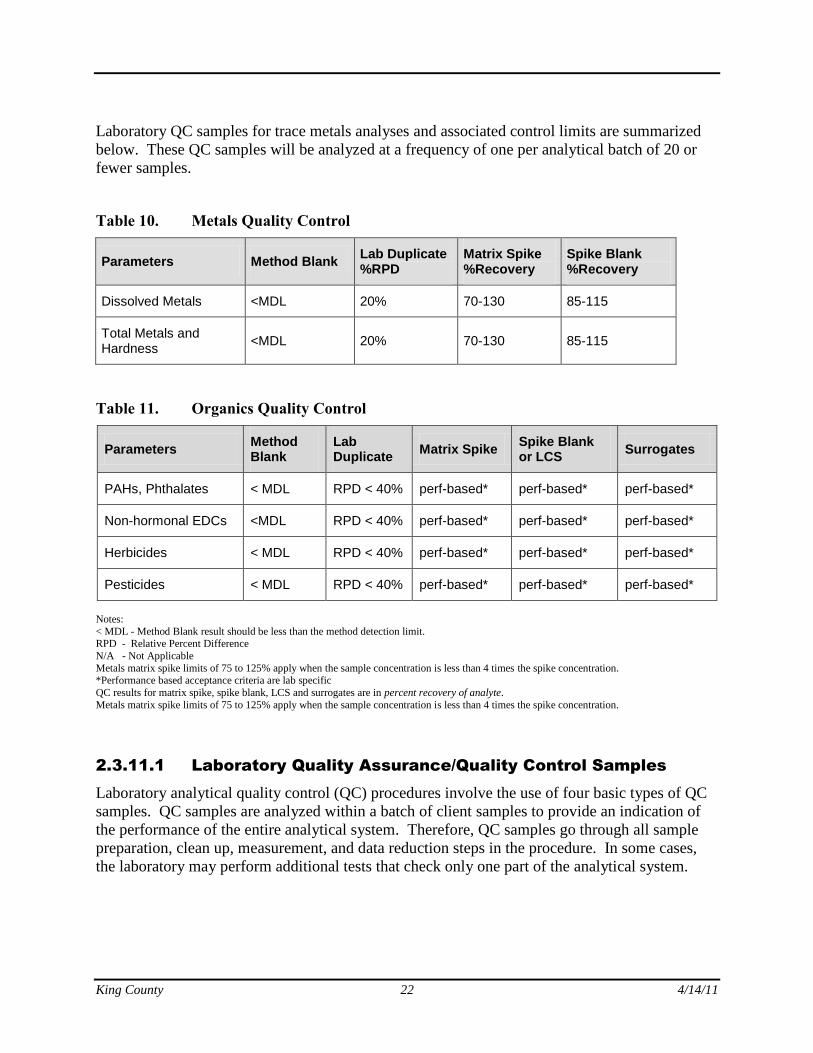
Laboratory QC samples for trace metals analyses and associated control limits are summarized
below. These QC samples will be analyzed at a frequency of one per analytical batch of 20 or
fewer samples.
Table 10. Metals Quality Control
Parameters Method Blank Lab Duplicate %RPD
Matrix Spike %Recovery
Spike Blank %Recovery
Dissolved Metals <MDL 20% 70-130 85-115
Total Metals and Hardness
<MDL 20% 70-130 85-115
Table 11. Organics Quality Control
Parameters Method Blank
Lab Duplicate
Matrix Spike Spike Blank or LCS
Surrogates
PAHs, Phthalates < MDL RPD < 40% perf-based* perf-based* perf-based*
Non-hormonal EDCs <MDL RPD < 40% perf-based* perf-based* perf-based*
Herbicides < MDL RPD < 40% perf-based* perf-based* perf-based*
Pesticides < MDL RPD < 40% perf-based* perf-based* perf-based*
Notes:
< MDL - Method Blank result should be less than the method detection limit. RPD - Relative Percent Difference
N/A - Not Applicable
Metals matrix spike limits of 75 to 125% apply when the sample concentration is less than 4 times the spike concentration.
*Performance based acceptance criteria are lab specific
QC results for matrix spike, spike blank, LCS and surrogates are in percent recovery of analyte.
Metals matrix spike limits of 75 to 125% apply when the sample concentration is less than 4 times the spike concentration.
2.3.11.1 Laboratory Quality Assurance/Quality Control Samples
Laboratory analytical quality control (QC) procedures involve the use of four basic types of QC
samples. QC samples are analyzed within a batch of client samples to provide an indication of
the performance of the entire analytical system. Therefore, QC samples go through all sample
preparation, clean up, measurement, and data reduction steps in the procedure. In some cases,
the laboratory may perform additional tests that check only one part of the analytical system.

King County 23 4/14/11
2.3.11.2 Types of Laboratory Quality Control Samples
Check standards
Check standards are QC samples of known concentration prepared independently of the
calibration standards. They are sometimes called laboratory control samples (LCS) or spiked
blanks. Results are used to verify that analytical precision in the control and whether or not the
level of bias due to calibration is acceptable. If the results for the check standards do not fall
within established control limits, the measurement system should be recalibrated. In some
analytical methods, sample results may be qualified when associated check standard results are
not within acceptable limits. Check standards are usually prepared in de-ionized water by the
laboratory. Their concentration should be in the range of interest for the samples, and at least
one check standard should be analyzed with each batch of 20 samples or fewer. Reference
materials that more closely match the matrix of environmental samples may be used as check
standards for the project. Some proficiency testing (PT) samples from commercial vendors can
be stored and used as check standards once the true values are known. The acceptance limits for
the results of analyses of these commercial samples should not be those set by the vendor but
should be established in the laboratory by replicate analyses of the PT sample. An exception
may occur when reference materials are sent to the laboratory for analysis as blinds. The
Department of Ecology’s Laboratory Accreditation Section can help identify suppliers of PT
samples and certified reference materials.
Laboratory analytical duplicates
The laboratory can analyze duplicate samples of one or more samples within each sample batch.
Results are used to estimate analytical precision for that matrix at that concentration. The project
manager may specify which samples are to be analyzed in duplicate. If the samples selected for
duplicate analyses do not contain measurable amounts of the analyte of interest, the results
provide no information on precision. In addition, if the laboratory selects samples from another
study with significantly different levels of the analyte or different matrices, the estimate of
precision may not be applicable to your samples.
Matrix spikes
A matrix spike is an aliquot of a sample to which a known amount of analyte is added at the start
of the procedure. Matrix spike recoveries may provide an indication of bias due to interference
from components of the sample matrix. Since the percent recovery is calculated from the
difference between the analytical results for the spiked and un-spiked samples, its precision may
be relatively poor if the spiked amount is much less than the sample concentration. If the spike
is too high relative to the sample concentration, any interference effect at the sample
concentration level could be masked. The laboratory will spike at a concentration approximately
equal to the concentration in the sample before spiking. The project manager may indicate to the
laboratory which samples might be most appropriate for use as matrix spikes and, if necessary,
larger sample volumes will be provided to the laboratory for this purpose. In some cases, many
replicate spikes would need to be analyzed in order to distinguish bias from the effects of random
error on the recoveries. Matrix spike results will only be used in conjunction with other QC data
to qualify them. The primary use of matrix spikes is to indicate the presence of bias. Duplicate
spike results can be used to estimate analytical precision at the concentration of the spiked
samples. The project manager may instruct the laboratory to spike certain samples since matrix
spikes are not automatically included in all analytical methods.

King County 24 4/14/11
Laboratory blanks
Blanks are prepared and analyzed in the laboratory to document the response of the measurement
system to a sample containing effectively none of the analyte of interest. Depending on the
analytical method, the analyst will analyze one or more blanks with each batch of samples and
compare the results to established acceptance limits. A positive blank response can be due to a
variety of factors related to the procedure, equipment, or reagents. Unusually high blank
responses indicate laboratory contamination. The blank response becomes very important when
the analyte concentration is near the detection limit. Blank responses are sometimes used to
correct the sample responses and to determine the limit of detection.
Field blanks
Field blanks are samples of ―clean‖ material, which are exposed to sample collection procedures
in the field. They should be analyzed like any other sample. The results for field blanks may
indicate the presence of contamination due to sample collection and handling procedures (in the
field or during transport to the laboratory) or to conditions in the field, such as boat or vehicle
exhaust. Clearly identify field blanks so that they are not selected for analytical duplicates or
matrix spikes. Field blanks are used when there is reason to expect problems with contamination
or to meet programmatic or contractual requirements to demonstrate absence of contamination.
Field blanks can be used to determine whether or not consistent and adequate field procedures
are conducted during sampling. The use of good operational procedures in the field and
thorough training of field staff reduces the risk of contamination. Several types of field blanks
are described below. The pure water or other ―clean‖ material used to prepare them must be
obtained from the laboratory or other reliable supplier.
Field blanks can include:
Transport blanks (trip blanks): A container of pure water, which is prepared at the
laboratory and carried unopened to the field and back with the other sample containers to
check for possible contamination in the containers or for cross-contamination during
transportation and storage of the samples.
Equipment blanks: Prepare by exposing clean material to the sampling equipment after
the equipment has been used in the field and cleaned. The results provide a check on the
effectiveness of the cleaning procedures. The rinsate blank may also detect
contamination from the surroundings, from containers, or from cross-contamination
during transportation and storage of the samples and is therefore the most comprehensive
type of field blank.
Filter blanks: Prepare by filtering pure water through the filtration apparatus after routine
cleaning. The filter blank may detect contamination from the filter or other part of the
filtration apparatus. Ideally, the results for your field blanks will be ―not detected.‖ If the
results are positives, you will need to consider them when reporting sample results and
determining whether your MQOs have been met.
Field filtration blank: (e.g., field filtration blank for orthophosphorus or dissolved metals
filtration) Carry reverse osmosis water into the field and filter using field equipment.
King County 25 4/14/11
2.3.12 Data Quality Assessment, Qualification, and Reporting
Data reported by the lab, including field measurements, must pass a review process before final
results are available to the client. A ―Peer Review‖ process is used where a second analyst or
individual proficient at the method reviews the data set. The reviewer will complete a data
review checklist which will document the completeness of the data package and if any quality
control failures exist. The Project Manager will coordinate this data review.
Quality control elements identified in the Quality Objectives section will also be examined to
determine whether the data quality objectives for the project have been met. Results from these
reviews will be documented in quality assurance worksheets that will be prepared for each batch
of samples. In the event that a potential quality assurance issue is identified through these
reviews, the quality assurance technical lead will review the data to determine whether any
response actions are required.
Once the data review has been completed, signatures or initials of the lab lead and reviewer(s)
indicate formal approval of hardcopy data or reports typically on the review checklist. A copy of
this approved checklist should be stored with the final hardcopy data package.
Data will not be distributed to clients until it has met the full definition of final data. ―Final
Data‖ is defined as approved data or is otherwise in its final reportable and stored format. This
implies the data has been appropriately peer reviewed, properly qualified and is in its final
format in terms of units and significant figures. Not only is final data assured of a higher level of
quality through peer reviewing and qualification, but it will also match any future reports since it
has come from the final storage location.
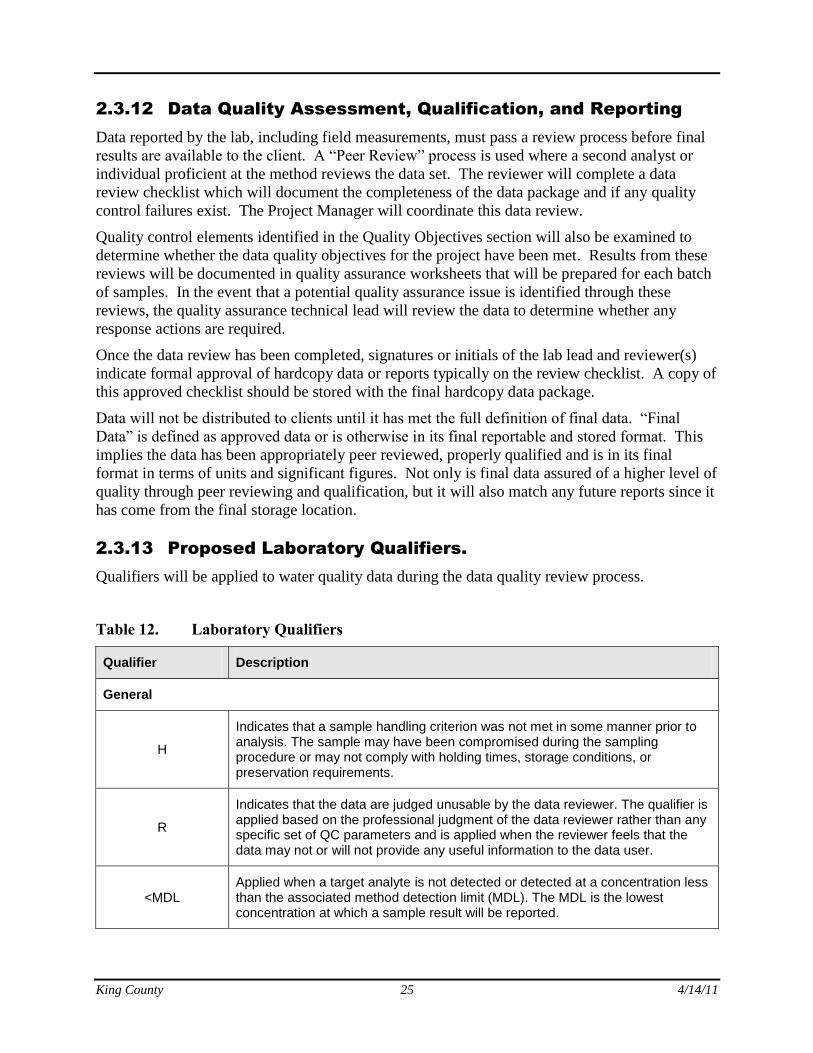
2.3.13 Proposed Laboratory Qualifiers.
Qualifiers will be applied to water quality data during the data quality review process.
Table 12. Laboratory Qualifiers
Qualifier Description
General
H
Indicates that a sample handling criterion was not met in some manner prior to analysis. The sample may have been compromised during the sampling procedure or may not comply with holding times, storage conditions, or preservation requirements.
R
Indicates that the data are judged unusable by the data reviewer. The qualifier is applied based on the professional judgment of the data reviewer rather than any specific set of QC parameters and is applied when the reviewer feels that the data may not or will not provide any useful information to the data user.
<MDL Applied when a target analyte is not detected or detected at a concentration less than the associated method detection limit (MDL). The MDL is the lowest concentration at which a sample result will be reported.

King County 26 4/14/11
Qualifier Description
<RDL
Applied when a target analyte is detected at a concentration greater than or equal to the associated MDL but less than the associated reporting detection limit (RDL). RDL is defined as the lowest concentration at which an analyte can reliably be quantified.
RDL Applied when a target analyte is detected at a concentration that, in the raw data is equal to the RDL.
TA Applied to a sample result when additional narrative information is available in the text field. The additional information may help to qualify the sample result but is not necessarily covered by any other qualifier.
Chemistry
B
Applied to a sample result when an analyte was detected at a concentration greater than the MDL in the associated method blank. The qualifier is applied when the sample concentration is less than ten times the blank concentration (5 times the blank concentration for Trace Organics). The qualifier indicates that the analyte concentration in the sample may be significantly influenced by laboratory contamination.
E
Applied to a sample result that was measured at a concentration greater than the calibration range of the method. It is applied when the detected analyte concentration exceeds the upper instrument calibration limit and further dilution is not feasible. The reported value is an estimated analyte concentration.
J Applied to a sample result that is considered an estimated value.
JG Applied to a sample result that is considered an estimated value with a low bias. This will typically be applied when QC results indicate the recovery of the analyte is below the expected limits of the method.
JK Applied to a sample result that is considered an estimated value with an unknown bias. This will typically be applied when QC results indicate the method precision did not meet the expected limits of the method.
KL Applied to a sample result that is considered an estimated value with a high bias. This will typically be applied when QC results indicate the recovery of the analyte is above the expected limits of the method.
Microbiology
FAIL The result of the positive or negative control failed (applied to QC results only)
PASS The result of the positive or negative control passed (applied to QC results only)
C Value is an estimate, based on presence of confluent growth

King County 27 4/14/11
2.4 Ecological Indicators
2.4.1 Benthic Invertebrate Monitoring
The primary objective of this monitoring program is to characterize aquatic macroinvertebrate
populations to assess the biological conditions within the Miller and Walker Creeks basin.
Aquatic macroinvertebrates are aquatic animals without backbones that are visible to the naked
eye, including insects, crustaceans, worms, snails, and clams. Benthic macroinvertebrates spend
all or most of their lives in or on the bottom of the streambed and other substrates such as logs or
plants in the stream channel. Benthic macroinvertebrates are monitored because they are good
indicators of the biological health of stream systems and play a crucial role in the stream
ecosystem (Karr and Chu, 1999). Since they complete most or all of their life cycle in the
aquatic environment and they are relatively sedentary, benthic communities are reflective of
local sediment, water quality, hydrologic and habitat conditions. The monitoring of
macroinvertebrate populations provides a relatively inexpensive and powerful tool to assess the
short and long-term effects of a wide range of environmental disturbances.
The Benthic Index for Biotic Integrity (B-IBI) used for this program was developed specifically
for Puget Sound lowland stream systems (Karr, 1998, 1999; Fore et \ al., 2001; Morley and Karr,
2002). It is composed of ten metrics that measure different aspects of stream biology, including
taxonomic richness and composition, tolerance and intolerance, habit, reproductive strategy,
feeding ecology, and population structure. Each metric describes some aspect of the community
that responds to degradation. The raw value of each metric is calculated, and from the raw value,
a score of 1, 3, or 5 is assigned to the metric. The ten metric scores are then added to produce
the overall B-IBI score that ranges from 10 to 50. Based on this score the streams are rated on a
qualitative scale as excellent, good, fair, poor or very poor.
The objectives of this BIBI program are to:
1. Characterize existing aquatic macroinvertebrate conditions of the Miller and Walker
Creeks basin.
2. Collect yearly data that can be used for detecting long-term trends in benthic
macroinvertebrate communities that reflect changes within the basins that affect
biological conditions within the streams.
3. Collect data of sufficient quality to enable comparisons to other Puget Lowland streams.
Samples will be collected at one location in each creek. In Miller Creek the sampling location is
at South 175th
Place (Snake Road). In Walker Creek, the sampling location is on the grounds of
the Normandy Park Swim Club just downstream of the flow monitoring gauge. In both cases the
sampling location is near the mouths of each creek and should reflect the impact of actions
upstream in the basins. The monitoring design is for samples to be collected yearly to track any
changes in the basin that affect ecological conditions within the streams over time. Habitat and
substrate information is also collected at the same time to aid in interpretation of the benthic
taxonomic data.
Samples will be collected using a Surber sampler. To characterize benthic conditions in the
lower reaches of both creeks will require three replicate samples at each location. Previous data
has shown that one Surber sampler sample results in at least 500 individual invertebrates,
therefore one Surber sampler will be sufficient for each replicate. If less than 500 individuals are

King County 28 4/14/11
routinely collected, then additional samples should be collected and composited for each
replicate sample. Having at least 500 individuals per sample will insure a robust dataset that can
be analyzed statistically. Three replicate samples can be collected from the same riffle, but care
should be taken to ensure that each replicate sample should be taken from an undisturbed
location. The taxonomy of the invertebrates collected in the samples will be identified by a
qualified taxonomic consultant. The identification of taxonomic samples may be added to an
existing King County program and cost-shared if desired by the basin partners. These details
will be resolved before sampling begins.
BIBI sample collection procedures, habitat data collection procedures, taxonomic identification,
quality assurance, and data management are in Appendix A.
2.4.2 Coho Prespawn Mortality
NOAA, Wild Fish Conservancy, the City of Seattle, King County and others have conducted a
number of assessments concerning coho salmon in Seattle area creeks (Collier et al. 2003, Scholz
et al. 2004, and McCarthy et al. 2008). Findings of these efforts indicate that while salmon were
successfully returning to many urban streams, a high proportion of sexually mature female coho
carcasses showed large numbers of retained eggs. Investigators documented highly erratic
swimming behavior and prespawn mortality among both male and female coho. Affected fish
from different urban streams displayed a common suite of symptoms, including surface
swimming and gaping, fin splaying, spasming, disorientation, and loss of equilibrium. The coho
usually died within a few minutes to a few hours after becoming overtly symptomatic. Visual
inspections generally indicated that the affected coho spawners were in good condition, with the
silver coloration typical of salmonids that have recently transitioned to freshwater from the ocean
(McCarthy et al. 2008). This phenomenon has been termed coho prespawn mortality (PSM).
In Miller and Walker Creeks, PSM has been documented and is probably a serious concern for
the recovery of coho populations in the basin. Yearly systematic surveys of PSM in the basin of
a data quality sufficient to determine percent survival and percent PSM of adult coho returning to
spawn will provide information for several purposes. The most important information will be to
determine to what extent PSM occurs in the Miller/Walker basin. Severity and variability from
year to year can provide clues as to causal factors. Because PSM is thought to be an ongoing
phenomenon in Miller and Walker Creeks, monitoring every year for an extended timeframe
could give us an indication if changes designed to improve the aquatic ecology of these creeks
are having their intended effects. It may also be possible to see the degree of change of a given
basin improvement based on PSM data. Collecting yearly PSM data could therefore be an
important indicator of the effectiveness of our efforts to improve basin hydrology and water
quality over time.
Currently, systematic surveys have only been done on Longfellow Creek in Seattle. PSM data
on Miller/Walker will provide important regional data that is currently lacking and may also
attract other research on the phenomena as part of a synergism of study.
In addition to gathering data on PSM, the Miller and Walker Creeks survey will systematically
survey selected locations to generate the minimum estimate of adult coho and chum adult returns
to the streams. A better understanding the range of adult fish returning to the streams was one of
the top recommendations the community identified as part of coordinated monitoring of the

King County 29 4/14/11
streams (http://www.kingcounty.gov/environment/watersheds/central-puget-sound/miller-
walker-creeks/monitoring.aspx ).
PSM studies and adult fish counts on Miller and Walker Creeks occurred October 8 – December
23, 2010. Future surveys are expected to follow the same protocol as employed in 2010.
Trained volunteers conducted the daily surveys. Classroom training prior to the survey season
was augmented by field training of each team during their initial survey. A quality assurance
survey by the basin steward was conducted with each team part way through the 11-week data
collection period to confirm volunteers were adhering to data collection protocols. Survey
volunteers collected information on the number of returning coho, including the number of
returning fish, the number of PSM fish, and the number of carcasses that experienced predation.
Survey volunteers collected the following measurements for each dead fish encountered: fork
length, girth, and postorbital and hypural. In addition, information was recorded concerning
adipose fin presence, sex, percent egg retention, and spawning status.
The survey reaches on Miller and Walker Creeks in 2010 were selected to balance known
spawning areas, areas where property owner access was obtained, and areas that volunteers could
survey in about three hours each day. During 2010, there were two survey areas on each creek
and all four locations were in the lower reaches of the streams in Normandy Park.
In 2011, additional locations upstream in Burien will be added if there are enough volunteers and
property access can be obtained.
Survey methods and a daily survey sheet example and fish measurement how-to are in
Appendix B.
Information—How to measure fish in Appendix C.

King County 30 4/14/11
3.0. IMPLEMENTATION CONSIDERATIONS
3.1 Continuation of Existing Monitoring.
Thanks to the efforts of multiple governments and citizen volunteers, there are monitoring efforts
underway that should be continued. These efforts encompass much but not all of the
recommended ―vital signs‖ monitoring. Several of these efforts are required by regulation but
not all of them will necessarily continue in perpetuity.
The following data collection programs should be continued to provide an unbroken stream of
―vital signs‖ data:
Adult fish count and pre-spawn mortality surveys (begun in 2010); this volunteer
program is run by the Miller/Walker Creeks basin steward and the cost of staff time is
part of the program paid for jointly by Burien, Normandy Park, SeaTac, the Port of
Seattle, and King County
Benthic Index of Biotic Integrity (BIBI) sampling on Miller Creek at 175th
Place S.W.
and on Walker Creek at 13th
Ave. S.W. by volunteers
Dissolved oxygen, fecal coliform, pH, and water temperature: data collected on Miller
Creek at sewer plant collected weekly by Southwest Suburban Sewer District at nominal
cost
Rain gauge at Lake Reba operated by the Port of Seattle
Flow monitoring and water temperature: Port of Seattle funding to King County for
operation of six stream gauges (42A, 42B, 42E, 42J, 42K, 42R [Figure 2]) costing
$15,000 per year
Benthic Index of Biotic Integrity (BIBI) sampling on Miller Creek at S. 160th
St. by Port
of Seattle: invertebrate data collected four times annually and BIBI calculated once per
year through 2012 and costing $10,400 per year; beginning in 2013 and continuing until
2022, invertebrate data will be collected once per year and BIBI calculated once per year
at an annual cost of $4,0004
Fish use surveys on Miller Creek (SeaTac International Airport property only) by Port of
Seattle: data collected annually through 2022 and costing $6,800 per year5
In-situ and laboratory sublethal toxicity monitoring: monitoring is conducted by the Port
of Seattle as required under NPDES stormwater discharge permit that last five years
(current permit ends in 2014) and costing $28,100 per year6
4 Reporting the results of BIBI and fish use surveys costs an estimated $7,000 (combined for both surveys) per year.
5 Ibid.
6 While not part of the ―vital signs‖ monitoring described in Section 1.2, this sublethal monitoring provides a means
of detecting problems in the stream environment. The types of sublethal toxicity monitoring – in-situ versus
laboratory – may change in the future.
King County 31 4/14/11
Monitoring by the Port of Seattle largely is required under NPDES stormwater, third runway
Section 401 Clean Water Act, and Section 404 Clean Water Act permits. Funding is expected to
be guaranteed during the time period required under the permits.
3.2 Change in Monitoring Prioritization:
Origin of Stormwater and Juvenile Fish.
In the two years since the 2008 monitoring prioritization discussions with the community, King
County staff have further studied the conditions and issues in the basin.
The overall prioritization scheme – sorting parameters into ―vital signs‖ and ―diagnostic tools‖ –
remains robust but two considerations have led to the following recommendations with regard to
prioritization:
Identifying where stormwater volumes originate in the Miller Creek basin should be a
―first priority‖ monitoring parameter. As shown in Section 1.2, the ―origin of
stormwater‖ remains a ―diagnostic measure‖ because it does not need to be collected
continuously or annually. Analysis of stream flow data leads to the hypothesis that
stormwater discharges from the Ambaum detention pond and possibly the Lake Burien
outlet tributary may be the most important drivers of the peak flows that are most harmful
to stream ecology in Miller Creek. Consequently, this Sampling and Analysis Plan
recommends the installation of two new gauges followed by iterative placement of
temporary gages to identify and quantify the major sources of stormwater inputs as
described in section 2.2.1.
Juvenile fish monitoring should be downgraded to a ―second priority.‖ Juvenile fish
monitoring consists of two parameters:
Juvenile fish (coho) presence and numbers
Juvenile fish outmigrant numbers
In contrast to the other ―vital signs‖ parameters, these two parameters require a much
longer period of data collection (at least 10 years) to be worthwhile and have a
considerably greater cost to collect. The reason a longer period of data collection is
required is that the numbers of juvenile fish produced in small, highly urbanized streams
such as Miller and Walker Creeks vary greatly from year to year. High variability makes
distinguishing trends challenging in the shorter term (i.e. less than 10 years). Annual
collection of data over 20 or more years probably would be necessary to determine
meaningful trends that reflect underlying habitat conditions in the basin. The cost of
measuring such parameters is significantly higher than for other parameters (including
adult monitoring, where volunteers can play a major role). If collected continuously or
annually, the other ―vital signs‖ parameters should suffice to show changes in the status
and trends of stream ecology.
3.3 Role of Volunteers in Monitoring.
Use of volunteers in monitoring can provide the following benefits:

King County 32 4/14/11
More timely data collection where volunteers live on the stream (for example, they can
respond quickly to storm events)
Perspective and historical knowledge that provides context
A means of educating the broader public as volunteers share their experiences with their
friends and neighbors and as people see them collecting data
Lower cost
To be effective, use of volunteers in monitoring should:
Include training to ensure an adequate level of quality assurance/quality control (QA/QC)
is met during data collection
Focus on tasks that meet the interests and abilities of volunteers
Include redundancy or backup to ensure data are collected even if individual volunteers
do not follow through
Participation of volunteers does not reduce the cost of monitoring to zero. Volunteers still
require training and management. High priority data collection requires ―backup‖ and QA/QC
assistance from professionals. Data management typically requires professional labor.
The ways in which volunteers can best help with monitoring in this basin include:
―Vital Signs Monitoring‖ Adult fish counting -- 20 volunteers began annual counting in 2010 and produced high
quality data
Benthic Index of Biotic Integrity sample collection -- volunteers have several times
collected invertebrate samples at three locations in Normandy Park and have had them
analyzed
Fry/smolt counts – this work can be done with volunteers in a manner similar to the adult
fish counting but the level of effort and the challenge of juvenile fish identification and
measurement is greater than for the adult surveys
―Diagnostic Monitoring‖ Visual monitoring and collection of algae scum at Arbor Lake and Lake Burien
Measuring in-stream physical habitat structure -- volunteers did this in 1993 and 2008 in
this basin (the volunteers used a U.S. Forest Service method of analysis, which differs
from the common U.S. EPA protocol)
3.4 Next Steps.
Use of this Monitoring Sampling and Analysis Plan should guide decisions about ambient
monitoring of conditions in Miller and Walker Creeks. The prioritization contained in this
document is the basis for governments and citizens to make worthwhile investments of public
dollars in continued and additional monitoring.
The recommendations in this plan also should be used to guide monitoring that may be proposed
in the Drainage Master Plan being initiated by the City of Burien in 2011.
A future step is to identify which of the monitoring efforts in this basin can be tied to larger
efforts to monitor the health of Puget Sound. It is likely that parameters measured here can
contribute to the region’s efforts to track changes in the health of Puget Sound lands and waters.

King County 33 4/14/11
4.0. REFERENCES
Miller and Walker Creeks Basin Plan – Executive Proposed, February 2006
Miller and Walker Creeks Basin Plan, Appendix D. Summary of Hydrologic Modeling.
Table of Water Quality/Quantity Parameters Monitored to Date. Miller and Walker Creeks.
May 14, 2009.
Welch, E.B. and J. M. Jacoby. 2004. Pollutant effects in freshwater. Spoon Press, London and
New York.
King County. 2007. Standard operating procedure sampling methods for streams and rivers.
SOP #214v3. Seattle Washington.
Port of Seattle, Lora Lake Apartments, Stormwater Interim Action Data Report Draft.
September 30, 2010. Prepared for the Port of Seattle by Floyd and Snider. Seattle
Washington.
Washington State Department of Ecology. 2004. Miller Creek water quality data accessed from
website.
Washington State Department of Ecology. 2006. Miller Creek water quality data accessed from
website.
Washington State Department of Ecology. 2008. Walker Creek water quality data accessed from
website.

King County 34 4/14/11
APPENDIX A
Benthic Invertebrate Sample Collection
Sampling Equipment for Field Bag
The following collection equipment is required at each sampling site:
Large canvas bag
Surber sampler, (1 ft2 frame with 500 μm mesh net, and removable plankton bucket with
500 μm mesh openings)
1 – Tub for cleaning rocks, etc.
1 - 500 μm sieves (tall side, not short)
1- Funnel with 500 μm mesh (strain water through funnel to spray bottle and other clean
water uses)
Weed pulling tool, marked 10 cm from end of tool
2 L Ethyl alcohol, 95%, denatured
1 - 2 L sample container with lid
5 – 1 L sample container with lid
Clipboard
2 – Pencils: 0.9 mm
2 – tube extra lead: 0.9 mm HB
2 - Permanent marking pens
Waterproof paper (same as field data sheet, just blank. Found in folder.)
Sample site premade labels (Found in folder)
Internal bottle labels (Found in folder)
Clear packaging tape
Spray bottle
Spatula, plastic spoons, plastic knife
Steel Metric ruler
100 foot cloth measuring tape
Thermometer (Celsius)
2 Pair of fine tip forceps (e.g., entomological forceps)
Stopwatch
Field data sheet (Found in folder)
1 – Water scoop
2 – Bobber
1 – Hand shears
1- Roll pink flagging
1 – First Aid kit
1 – 1‖ Black 3-ring binder, field notebook
1 – Folder with labels, maps, aerial photos, etc.
1 - 5 gallon bucket

King County 35 4/14/11
Riffle Selection
The location of the riffles to be sampled will be determined prior to entering the stream. To
accomplish this, the stream reach at the site must be defined. Ideally, the reach should be
representative of overall conditions in the area, and should be 20 times the average wetted
channel width. Three riffles within the reach are selected and should be representative of varying
riffle habitats (e.g., riffle depths, flow rates, and/or substrate characteristics). In the absence of
well-defined riffles, choose the fastest flowing, most turbulent, non-depositional location
possible. In the absence of three distinct riffles it may be necessary to sample at different
locations within the existing one or two riffles. It is important to avoid walking in the stream or
causing any disturbance upstream of any location yet to be sampled.
Surber Sampler Placement
Enter the stream below the furthest downstream sampling location. Collect the sample at the
lateral center of each selected riffle. The Surber sampler should be placed on the substrate
surface by approaching from downstream, with the team member averting their eyes from the
stream bottom to avoid bias in setting the net. The sampler is placed firmly down onto the
substrate with the net opening facing upstream. Press the net frame down into the substrate. The
Surber frame must be securely ―sealed‖ against the substrate to prevent organisms from washing
under the frame. If any large cobble lying under the edge of the frame prevents a good ―seal,‖ it
should be immediately pulled within the perimeter of the frame. Even if part of the cobble lies
outside the frame area, it should be pulled into the frame area and included as part of the sample.
In areas with high stream velocity, it may be necessary for one team member to hold the net
down (typically from a downstream position) while another collects the sample. Care must be
taken not to disturb the upstream substrate during this process. Once the net has been placed, the
sample collection must be done quickly to minimize the movement of organisms into or out of
the sampling area.
Sediment Agitation and Sample Collection
All large objects (e.g., large gravel and woody debris) within the sampling area will be picked up
and scrubbed by hand inside the collection net. Examine the objects and remove any organisms
that were not removed by the scrubbing process and discard the object downstream after
inspection.
The weed tool is used to vigorously agitate the substrate within the perimeter of the frame to a
depth of approximately 10-cm, for 60 seconds. The frame must stay securely anchored to the
substrate during this process.
Large gravel or cobble particles that have washed into the net during agitation of the sediment
should be picked up but not removed from the net. Physically scrub the object with your hand
inside the net, and then inspect it to make sure all organisms were removed. Ensure that your
hands are well rinsed by the stream water inside the net before removing them.
The Surber sampler should be removed from the stream by pulling the sampler in an upward and
upstream motion. While holding the net vertically, use stream water and a squirt-bottle to rinse
organisms and debris on the inside of the net into the plankton bucket at the bottom of the net.

King County 36 4/14/11
When using stream water, the water will be splashed from the outside of the net or poured
through a 500 μm sieve to ensure that no organisms are inadvertently added to the sample.
Sample Processing
One team member will be responsible for transferring the sample from the net to the sieve or
dishpan while the other team member checks the inside of the net for any organisms that were
not transferred. To remove the organisms from the net, detach the plankton bucket from the net
and pour it into the sieve or dishpan. Rinse the plankton bucket carefully and inspect it to make
sure all organisms are transferred into the sieve or dishpan. For mussels that were collected, a
note of their number and presence will be made on the field data sheet and a penciled note
representing the organism will be placed into the sample jar. The mussel should be gently
returned to the stream. Also, note and return any fish to the stream.
The collected sample material is then gently sieved and rinsed with water from the spray bottle to
remove any excess fine material (i.e., < 500 μm). Use the spatula, knife, spoon and/or spray
bottle to concentrate the sample material on one side of the sieve and then transfer the material
into the sample container.
Sample Preservation and Documentation
After the sample is transferred into the sample container, it will be preserved by filling the
sample container with sieved water and 95% denatured ethanol to an approximate concentration
of 70-80% alcohol.
Utilize the preprinted labels provided to identify the sample jars externally and internally. Fill in
required information on the labels using permanent marking pen externally and pencil on the
internal tag. A piece of clear packing tape will be used to cover the outside label once it has been
completely filled out. Each label will consist of the sample identification number, date, and the
collectors’ initials. After the sample jar is labeled (internally and externally), tightly secure the
lid.
Habitat Evaluation
The following habitat and physical stream parameters will be measured at each site:
Water and air temperature
Riffle width, length, depth and flow velocity
Water clarity
Riparian bank vegetation parameters including; vegetation type, density, and size class
Woody debris presence
Wolman pebble counts (Wolman, 1954): 35 particles are counted just upstream of each
Surber sample location to be combined for a total count of >100 particles.
Distance to nearest known road crossing noted as either upstream or downstream and
within set distance categories (from <10ft to crossing to >200ft).
King County 37 4/14/11
QUALITY CONTROL
Field Sampling
To reduce the chance of sample organisms being lost during field collection, the following QA
steps will be implemented.
Discarding Material
Before any rocks are discarded back into the stream, they will be visually inspected to ensure no
organisms are still attached or trapped on the surface. Any organisms discovered will be
transferred to the sample bottle.
Sampling Equipment
To assure that no organisms remain entrapped on the sampling equipment the following steps
will be taken. One team member will turn the Surber sampler net inside out for visual inspection
and remove any macroinvertebrates or organic material (e.g., macrophytes, detritus). The
plankton bucket and sorting pan will also be inspected for entrapped sample material. All
entrapped material will be removed with entomological forceps and placed into the sample
bottle.

King County 38 4/14/11
APPENDIX B
Coho Prespawn Mortality Survey Methods
Methods
Objective: Collect as much information as possible on living adult salmon and dead coho and
chum within the stream or found on land. Spawning status is more important for females than
males. If you can determine male status, record it, otherwise record as unknown.
Day of Sampling:
Be sure to take each of the items below to the field:
Sampling kits
data sheets, site maps and clipboard (you provide clipboard)
pencils for recording data
Sharpie pen for marking ―flags‖
folding knife
orange Zak knife for gutting fish
tape measure
flagging tape
gloves (work gloves for handling fish)
paper towels
garbage bags (to carry out all trash)
Video Camera (optional) – can use video on digital camera if necessary (for documenting
symptomatic fish,)
Rain gear, boots, waders
Stream Sampling Instructions
If it has rained and the creek is cloudy or if the water level is high you will probably not be able
to see fish or redds. It may also be impossible to walk in the stream and dangerous to walk along
it. Do not attempt to walk the stream. Wait until visibility is better (this may require cancelling
the survey in part or totally for a given day).
If the creek is clear, walk the stream to see if there are live symptomatic fish and/or mortalities
(videotape symptomatic fish if equipped to do so).
Watch for redds, mark the redds (see ―Flagging Redds‖ below) and don’t step on the redds!
Further information on how to walk the streams safely and observe fish are found in the separate
document titled ―How to Survey for Adult Salmon.‖

King County 39 4/14/11
Recording Data on the Daily Survey Sheet
The formatting of the Daily Survey Sheet has been modified several times at the beginning of the
2010 survey season to improve its ease of use by volunteers. The most up-to-date version of the
survey form always will be posted at the ―CSI: Highline‖ web page:
http://www.kingcounty.gov/environment/watersheds/central-puget-sound/miller-walker-
creeks/salmon-monitoring.aspx
The Daily Survey Sheet: TOP
o Fill in DATE. This means there is a new worksheet for every day of sampling.
o SURVEYORS’ NAMES: First initial and last name of all surveyors.
The Daily Survey Sheet: BOTTOM
o Fill in START TIME and END TIME.
o Fill in WEATHER. Check more than one if applicable.
The Daily Survey Sheet: Dead Adult Fish
o FISH ID# is the label you will assign to each
fish recorded (see below for formula)
o FORK LENGTH: measure in centimeters. This
is the measure from the tip of the nose to the
indent (fork) of the tail.
o GIRTH: distance around largest section of fish
(typically in front of dorsal fin)
o POH: distance from postorbital (behind eye) to hypural plate (point in tail where it will
not bend upward, last vertebrae are fused to support caudal rays)
o ADIPOSE FIN PRESENT? Y = Yes, N = No.
o SEX: M = Male, F = Female, UNK = Unknown
o % EGG RETENTION: Choose from 0-25, 25-50, 50-75 or 75-100%.
o SPAWNING CONDITION/PREDATION: Mark either:
o Pre-spawn (PSM) for females full of eggs w/no sign of predation. Also check the
PSM box if you find a male with clearly full testes.
o Post-spawn (POST) for females and males that are spawned out and have no sign
of predation.
o Predation (PRED) for males or females if they have been eaten in any way.
o Unknown (UNK) for fish where pre- or post-spawning condition is
undeterminable.
o SPECIES: Identify species: coho, chum, or unknown
o NOTES:
Important Point: PSM
investigation is for ADULT fish
only. If you encounter dead
juvenile fish, describe them on
your form but do not conduct
necropsy.

King County 40 4/14/11
o Write notes on anything you observe about the fish that is unusual. For example,
if there is evidence of predation, how much of the fish has been eaten? Were parts
missing?
Important Reminder: Only count tails to avoid double counting fish so, if you find only a
head or fish parts, do not count if as a dead fish found that day. On the other hand, if you
only find a tail, punch/slit a hole in it, flag it with a PRED + the date label on the
flagging tape and count it as a mortality for the day.
FISH ID#
Each fish mortality will receive a Fish ID#. The Fish ID # follows the formula:
Date+Site+Status+sequential number
EXAMPLE 1: 101510UprMlr_PSM01 is first dead fish found on Oct 15th
at Upper Miller Creek
survey site, and it was a pre-spawn mortality.
EXAMPLE 2: 101710UprWlr_UNK01 is first dead fish found on Oct 17th
at Upper Walker
Creek survey site, and it was too heavily predated to determine whether it had spawned or not.
Use acronyms for fish condition as defined on the field sheet (PSM, POST, PRED or UNK).
Writing in pencil will allow you to modify the coding if you change your assessment of likely
mortality during the necropsy.
Flagging Fish Mortalities
Carefully cut a slit/hole in the meaty part of the tail (using the folding knife) of any fish that you
count so that following groups will not count the same fish again. Cut a long piece of flagging
tape and mark ―2010 PSM STUDY + the date‖ on it. Then tie the flagging tape through the hole
you made in the fish tail. The tape should be large enough so it can be seen easily underwater.
Return fish to where you found it in the wetted area of the stream. Whittle a stake from a tree
branch and drive it into the body behind the gill cover and into the stream substrate. If the
carcass is out of the water, put it back in. Anchoring will lengthen the time the carcass stays in
the stream so it is more available for predation by aquatic organisms and decomposition.
Sexing Fish
Determine the sex of fish by making an incision using the orange Zak knife on the ventral
surface of the body from a point immediately anterior to the anus toward the head to a point
immediately posterior to the pelvic fins. If necessary, a second incision should be made on the
other side of the fish from the initial point of the first incision toward the dorsal fin. The
resulting flap can be folded back to observe the gonads. Ovaries have a granular texture and
depending on the species can range from orange/red to dark green/blue or even whitish in color.
Testes appear creamy off-white and have a smooth texture. Record the sex of each fish on the
Processing Bench Sheet using M for male, F for female, U for unknown. Add a question mark
(?) after M or F for unsure. Fish will be categorized in one of the following 4 categories:

King County 41 4/14/11
Pre-spawn mortality (PSM) = fish that are dead and have not spawned completely. We will
collect the following information from pre-spawn mortalities:
o Assign a FISH ID# (see ―FISH ID#‖ above). You may wish to wait to assign the
complete fish number when you have completed the necropsy and can determine
with confidence what the condition of the fish is.
o Fork Length
o Girth
o Post-orbital to hypural length (behind the eyeball to the ―flex‖ in the tail)
o Percent egg retention for females
o Presence/absence of adipose fin
Post-spawn mortality (POST) = fish that are dead and have spawned completely. Collect
the same information from post-spawners as from PSM fish.
Preyed upon mortality (PRED) = fish that are dead and have been preyed upon. Collect as
much of the same information as possible from the preyed upon fish as from PSM fish. Be
sure to write “PRED” in the “note section” on Daily Survey Sheet.
Unknown (UNK) = fish for which pre- or post-spawn status can’t be determined (that is, if
predation or damage is too severe).
The Daily Survey Sheet: Live Adult Fish
Record the number of live adult fish seen in each survey area. Record as ―coho‖ or ―chum‖
those fish that you are confident you have identified correctly. You should be able to see at least
two distinctive features of each species to be able to ID the fish as a given species. If in doubt
about the species, DO NOT GUESS. Instead, record it as an ―Other Adult Fish.‖
Use the ―Notes‖ section for each survey area to record anything of interest including:
Adult symptomatic fish = adults opening and closing mouth rapidly (gaping), loss of
equilibrium, fins splayed, and spasming. These behaviors are correlated with pre-spawn
mortality.
Juvenile fish observed
Wildlife observed
Stream conditions including clarity of water, flow volume, presence/absence of foam
The Daily Survey Sheet: Suspected Redds
Use this line to make notes about any redds identified as new and marked for the first time.
Flagging Redds
Flag any new redds with flagging tape. Write ―REDD PSM STUDY + the date‖ on the flagging
tape and tie it on a branch above the redd so that samplers will not walk in the redd on future
surveys. If there is no convenient branch overhead, find a large rock to tie flagging to and drop

King County 42 4/14/11
in the pit of the redd, not on the mound. (All flagging from both carcasses and redds will be
removed by the final survey crew in December.)
Sample Prespawn Daily Survey Sheet

King County 43
Date: / /2010
Team Members: ____________________________
Site: Miller and Walker Creeks
Dead Adult Fish
Fork
Length
Fish
Girth
POH
Ad
Fin?
Sex
% Egg Retention
(dead females)
Spawning Condition
Species
Notes
(including presence/absence of milt in males)
Fish ID#
(cm) (cm) (cm) (Y/N) (M/F) 0-25 25-50 50-75 75-100 PSM POST PRED UNK
Example: 101510_
LwrMlr_PSM01
52 40 36 Y F X X Lower jaw missing

King County 44
Suspected redds (list location and marking/flagging that your team placed): _________________________________________
___________________________________________________________________________________________________________
Start Time__________ End Time___________ Weather: ____Sunny _____Cloudy ______Rainy
Version 10.27.10
Ad = adipose fin POH = distance from back of eye to bend in tail. Location codes: LwrMlr = Lower Miller, LwrWkr = Lower Walker, UprWkr = Upper Walker, UprMlr = Upper Miller
Live Adult Fish
Location
Coho
Chum
Other Adult Fish (record here if not
confident of species ID)
Notes Regarding Adult and Juvenile Fish, Wildlife, Stream Condition (flow volume, clarity,
presence/absence of foam)
Lower Miller
Lower Walker
Upper Walker
Upper Miller

King County 45
APPENDIX C
HOW TO MEASURE FRESHWATER FISH
(FROM FLORIDA FISH AND WILDLIFE
WEBSITE)
All freshwater Florida Fish and Wildlife Conservation Commission regulations and the "Big Catch" program depend on "total length."
The image below depicts the most commonly used measurements for fish. For freshwater fish, the measurements that you need to use are total length and girth.
Fork Length Measurement
The fork length is the length of the fish to the fork in the tail, with the mouth closed. The best way to
obtain this length is to push the fish's snout up against a vertical surface with the mouth closed and the fish laying along a tape measure. Do NOT pull a flexible tape measure along the curve of the fish. The photo to the right shows a bass on a measuring board with the mouth held shut.

King County 46
Girth Measurement
"Girth" is best measured with a fabric ruler, such as tailors use. It can also be determined by drawing a
string around the fish at its widest point marking where the string overlaps and then measuring the distance between the overlapping points on a conventional ruler. The measurement should be taken perpendicular to the length of the fish. This measurement is analogous to measuring the circumference of someone's waist. Knowing the girth is important when trying to certify a fish for a record, and provides useful information to biologists about the relative condition of a fish.

King County 47
Internal Fish Anatomy
The following illustration of a largemouth bass shows some of the common internal features that are used to describe the differences between fish that are described in more detail below.
Spine:
The primary structural framework upon which the fish's body is built; connects to the skull at the front of the fish and to the tail at the rear. The spine is made up of numerous vertebrae, which are hollow and house and protect the delicate spinal cord.
Spinal Cord:
Connects the brain to the rest of the body and relays sensory information from the body to the brain, as well as instructions from the brain to the rest of the body.

King County 48
Brain:
The control center of the fish, where both automatic functions (such as respiration) and higher behaviors ("Should I eat that critter with the spinning blades?") occur. All sensory information is processed here.
Lateral Line:
One of the fish's primary sense organs; detects underwater vibrations and is capable of determining the direction of their source. (See Issue 8 of The City Fisher for more information.)
Swim (or Air) Bladder:
A hollow, gas-filled balance organ that allows a fish to conserve energy by maintaining neutral buoyancy (suspending) in water. Fish caught from very deep water sometimes need to have air released from their swim bladder before they can be released and return to deep water, due to the difference in atmospheric pressure at the water's surface. (Most freshwater anglers in Florida need not concern themselves with this!) Species of fish that do not possess a swim bladder sink to the bottom if they stop swimming.
Gills:
Allow a fish to breathe underwater. These are very delicate structures and should not be touched if the fish is to be released! (See Issue 15 of The City Fisher for more information)
Kidney:
Filters liquid waste materials from the blood; these wastes are then passed out of the body. The kidney is also extremely important in regulating water and salt concentrations within the fish's body, allowing certain
fish species to exist in freshwater or saltwater, and in some cases (such as snook or tarpon) both. (See Issue 11 of The City Fisher for more information.)
Stomach and Intestines:
Break down (digest) food and absorb nutrients. Fish such as bass that are piscivorous (eat other fish) have fairly short intestines because such food is easy to chemically break down and digest. Fish such as tilapia that are herbivorous (eat plants) require longer intestines because plant matter is usually tough and fibrous and more difficult to break down into usable components. A great deal about fish feeding habits can be determined by examining stomach contents. (See Issue 1 of the City Fisher for an example of a stomach content analysis of the butterfly peacock.)
Pyloric Caeca:
This organ with fingerlike projections is located near the junction of the stomach and the intestines. Its function is not entirely understood, but it is known to secrete enzymes that aid in digestion, may function to absorb digested food, or do both.
Vent:
The site of waste elimination from the fish's body.
Liver:
This important organ has a number of functions. It assists in digestion by secreting enzymes that break down fats, and also serves as a storage area for fats and carbohydrates. The liver also is important in the destruction of old blood cells and in maintaining proper blood chemistry, as well as playing a role in nitrogen (waste) excretion.

King County 49
Heart:
Circulates blood throughout the body. Oxygen and digested nutrients are delivered to the cells of various organs through the blood, and the blood transports waste products from the cells to the kidneys and liver for elimination.
Gonads (Reproductive Organs):
In adult female bass, the bright orange mass of eggs is unmistakable during the spawning season, but is still
usually identifiable at other times of the year. The male organs, which produce milt for fertilizing the eggs, are much smaller and white but found in the same general location. The eggs (or roe) of certain fish are considered a delicacy, as in the case of caviar from sturgeon. (For a related topic, see Issue 14. of City Fisher)
Adult Male Chum Salmon
Female Chum
Male coho

King County 50
Adult female coho PSM