mine 2015 the gloves are off - pwc · mine 2015 the gloves are off ... 10. top 40 companies...
TRANSCRIPT

Mine 2015The gloves are off
www.pwc.com/mining
Review of global trends in the mining industry
2015

Mine 2015
2004 Mine
2008 As good as it gets?
2012 The growing disconnect
2006 Let the good times roll
2010 Back to the boom?
2014 Realigning expectations
2005 Enter the Dragon
2009 When the going gets tough
2013 A confidence crisis
2007 Riding the wave
2011 The game has changed
2015 The gloves are off
The Mine Series

Mine 2015
Table of contents
1. Executive summary 3
2. The industry in perspective 5
3. Financial analysis 16
4. Copper production 30
5. Governments entering the ring 32
6. Equipment & people productivity – sustainable lower operating costs 34
7. Out for the count? – availability of capital 36
8. 10 year trends, 2005 through 2014 40
9. Glossary 41
10. Top 40 companies analysed 42
11. Explanatory notes for aggregated financial information 43
12. Contacting PwC 44
13. Other PwC mining publications 46

2 The gloves are off
Mine 2015
Everyone expected it would be a tough fightCommodity prices were down, with short-term volatility increasing, putting pressure on operating models
High expectations were set around cost efficiency, improved capital management and rewarding shareholders
The initial scorecard for the Top 40 was mixedFree cash flow has turned positive at $24 billion, but net profit excluding impairment was down by 9% and resulting ROCE was down to 8.4%
Capital velocity declined for the first time since 2010
Production was up, and a mix of productivity measures, currency devaluations and lower input costs boosted margins
Market values declined a further 16%, and net assets declined for the first time
Dividend yields were at an all-time high
But the fight has now descended into a brawlGovernment intervention has been widespread - some welcomed but most not
Participants have turned on each other, sparking a wide-ranging debate on strategies and their consequences as the impact of lower prices is felt in many quarters
Stakeholder activism continues its rise
…and it’s clear that the gloves are off

3 Review of global trends in the mining industry
Mine 2015
1. Executive summary
Welcome to Mine: PwC’s 12th annual review of the top trends in the global mining industry. Our analysis is based on the financial performance of the Top 40 mining companies by market capitalisation.
It has been another challenging year for the sector, and these senior producers in particular. The prolonged downswing in commodity prices has forced companies to fight hard to implement various measures to improve free cash flow. A major focus was on reducing costs. The Top 40 know lower prices aren’t temporary and need to cut costs to allow appropriate returns to be generated in the current environment. As we forecasted in last year’s report, these cost-reduction and efficiency efforts have started to pay off. Another cash-conservation strategy was to reduce capital spending. The Top 40 have been saying for a few years that they will reduce capital spending, and delivered in 2014. Meantime, the pace of mergers and acquisitions has slowed dramatically, especially compared to 2011, when many commodity prices were at or near record highs.
There have been improvements in most financial statement metrics across the Top 40. Still, market values continued to decline. The Top 40 miners lost $156 billion, or about 16% of their combined market value, in 2014. The good news is that’s only half of last year’s slide. The market value decline in 2014 was driven largely by iron ore miners, in particular the diversified companies with large exposure.
It was a better year financially for the Top 40, despite a continued dip in almost all commodity prices, as various cost initiatives, fewer high-dollar impairments, and lower input costs helped to improve the bottom line. Commodity prices remained under pressure, as iron ore, coal, and copper took another tumble in 2014. Gold prices were volatile, but remained relatively steady compared to prior years. Iron ore was hardest hit in 2014, with prices falling by half as a result of oversupply and a negative short-term demand outlook. Nickel was one of the few commodities to see a boost in 2014, gaining about 15% due mainly to supply issues.
Some of the stories related to the price changes were contentious. There’s been a vigorous debate among miners in the iron ore space around the appropriate supply strategy given the drop in demand. With nickel, certain government policies had a significant impact on supply and price.
The general outlook for the global metals and mining market remains subdued due to the combination of a slower rate of global economic growth, particularly in emerging
markets, and signs of an oversupply of several commodities, most notably iron ore and coal. Lower crude oil prices and a stronger US dollar are proving beneficial for miners by helping to lower operating costs. The uneven global economic recovery and divergent monetary policies continue to create uncertainty around medium-term supply and demand across the mining industry.
A slowdown in China’s economic growth, to around 7% from double-digit growth in recent years, is expected to weigh on the industry in the months to come. China accounts for as much as 40% to 50% of global commodity demand. This slower growth has already had a major impact on demand for key steelmaking commodities, namely iron ore and metallurgical coal. With potentially more weaknesses to come in the real estate market, as well as an overall lower pace of urbanisation, demand could weaken further. However, to put China in perspective, the lower projected 2015 GDP growth will still create about a $1-trillion increase in the base – more than the combined market capitalisation of the Top 40. We believe that the reforms being undertaken will place China in a good position to continue to grow over the long term, albeit at a slower pace.
The commodity price downturn has also sparked a wave of resource nationalism, as governments seek to maintain their mining revenues, despite shrinking overall returns across the industry. Initiatives implemented to date have been mainly negative for the industry, including tax and/or royalty rate changes and the introduction of mandated beneficiation in-country, as was done in Indonesia. Also, China moved to protect its domestic coal industry by changing import tariffs and quotas, placing additional pressure on seaborne demand. There were some positive moves though, such as tax changes in Australia.
When it comes to supply, expectations vary by commodity group. Iron ore and coal will continue to be under pressure, as both commodities struggle with oversupply. This is caused partly by marginal operations having been slow to close. The outlook for base metals may not be as bleak, especially for nickel, copper, zinc, and aluminium. Tighter supply for these commodities has led to either a stabilisation or increase in prices. Nickel supply, in particular, could see constraints as stockpiles decrease following a ban on exports

4 The gloves are off
Mine 2015
of unprocessed ore in Indonesia. Meantime, the shutdown of older mines is expected to favourably impact the price of certain commodities, such as zinc.
With few exceptions, the commodity price outlook remains dim, forcing miners to keep up their guard. As the old saying goes, survival will be of the fittest, and for miners also the leanest. Miners across all metals and minerals continue to focus on core operations, cost cutting, and capital discipline in their quest to improve their relative position on the cost curve and remain profitable during this prolonged period of low prices.
Operationally focused CEOs drove improved results, despite a weaker market:
• The Top 40’s total assets declined by 1% in 2014 compared to an increase of 7% in 2013, driven by $26 billion fewer capital expenditures. This is the result of lower capital expenditures, and another round of impairments valued at $27 billion.
• Although net profit increased, when adjusted for impairments, the result was a decline in adjusted net profit of 9% to $72 billion.
• Free cash flow improved from $3 billion in the red for 2013, to a much healthier $24 billion in the black in 2014, due in large part to a decrease in capital expenditures. This reversal allowed companies to return funds to shareholders without having to increase their debt. In fact, there was a 20% decrease in proceeds from borrowings and a 7% increase in debt repayments.
We’ve highlighted certain results where there were interesting differences based on where the companies are headquartered. For the purposes of this report, we have used the term BRICS more broadly to describe companies headquartered in countries from Brazil, Central & Eastern Europe, China, India and Saudi Arabia (realizing that, strictly speaking, all of Central and Eastern Europe and Saudi Arabia aren’t typically included in this group). OECD has been used to describe companies headquartered (and/or listed), in countries from Australia, Canada, Japan, Mexico, the United Kingdom, and the United States. Some notable differences between OECD and BRICS companies include:
• BRICS companies tend to focus on mining in emerging markets exclusively, whereas OECD companies tend to have more diverse global portfolios. Adding to this divergence is the breadth of new development potential in emerging markets and differing shareholder expectations.
• Barriers to entry in emerging markets are often underestimated, which may mean lower returns than expected.
In our 2012 report, we showed that a quarter of the Top 40 miners changed leaders amid volatility in the industry. What’s more, half of the Top 10 saw a new CEO take the helm. That trend continued in 2013, when another seven of the Top 40 miners changed leaders, mostly in the Top 20 companies. There was more stability in 2014, at least in the higher ranks. The message to new CEOs in the Top 40 was clear: Cut costs, refocus on core businesses and limit the pursuit of growth opportunities. In the last year the Top 40 has focused on these goals.
How the industry will grow in the months and years ahead will be heavily impacted by a number of factors, including:
• Existence of tier 1 assets that can produce substantial quantities at costs significantly below average;
• Demand for commodities from China and other BRICS countries;
• Mining cost increases related to local taxation, increased environmental regulations and export limitation policies;
• Unwillingness by majors to enter into greenfield projects, with a focus instead on developing smaller brownfield projects;
• A lack of financing available to the juniors to pick up the greenfield exploration slack created by the majors.
In 2014, the Top 40 made no significant new investment commitments, but some moved to significantly increase production. At the same time, some chose to curtail production and are considering disposals of non-core assets. Miners will need to need to stay on the defensive and in lean, fighting form, as they bob and weave through a number of ongoing challenges ranging from slumping commodity prices and volatile markets, to growing pressures from government and shareholders. It’ll be a tough match.
John Gravelle Global Mining Leader PwC
Stuart Absolom Mine Project Leader PwC
James Terry Mine Project Team Leader PwC

5 Review of global trends in the mining industry
Mine 2015
• Commodity prices continued to take some hefty blows, with iron ore, coal, and copper prices falling 50%, 26% and 11%, respectively. This decline continued in the first four months of 2015, as the price of iron ore, coal, and copper fell a further 12%, 5% and 6%, respectively. Gold prices remained relatively stable.
• Oversupply of bulk commodities, particularly iron ore and coal, combined with China’s economic growth slowdown, are major contributors to the price slump.
• EBITDA for the Top 40 is down 5%. Some factors to consider:
» The slump in commodity prices hasn’t yet been offset by a reduction in operating costs.
» Production increases were mitigated, to a certain extent, accounting for a concurrent increase in operating costs. However the celebrated 5% savings may be closer linked to external factors such as foreign currency devaluations and the 40% commensurate reduction in crude oil prices.
• Although some majors have reduced production in response to the oversupply of certain commodities, in an attempt to sustain prices, others have continued planned
expansions in hopes of sustaining profits. This could push high cost producers out of the market.
• The focus continues to be on better capital allocation and improved efficiencies to drive higher free cash flow.
• A number of the OECD miners in the Top 40 are turning to asset rationalisation as a strategy in the current downturn.
On the ropes, again
The market capitalisation for the Top 40 was $791 billion at the end of 2014, which is where it sat 10 years ago. That’s a drop of 16% from $947 billion at the end of 2013. It’s the second consecutive year of declines. Incredibly, the market capitalisation of the Top 40 is only about half of its value four years ago.
Coal miners in the BRICS countries saw their value increase 19% over the period, recovering under half of the value they lost in the prior year. After a significant 44% drop in 2013, gold stocks were relatively stable in 2014, finishing the year down 8%. There was greater diversity in share price performance among the Top 40 in 2014, with 15 miners seeing their values appreciate while 25 declined. That’s an
2. The industry in perspective
45%
• Soft equity markets• Downgrades impacting
cost of debt
• Domestic protectionism• Global instability
• Lower Chinese growth and housing market and urbanization slump
• Continued EU financial woes
• Legacy projects coming on-line• Significant dormant capacity
• National assistance• Domestic growth initiatives
• Improved market cap since 31 December 2014
• Significant sideline funds
• US economic recovery• Global infrastructure improvements
• Low-margin mine closures• Strong capital discipline• Lower input costs and local
currency devaluation• Operating cost improvements
Demand
Supply
Financing
Political
Demand
Financing
Political
Current state
Supply

6 The gloves are off
Mine 2015
improvement from 2013, when there were only a handful of positive performers.
The declines were disproportionate between OECD companies and BRICS: In 2014, 59% of BRICS companies improved in value, compared to 22% of OECD companies. This led to a 21% drop in value of OECD companies and only 7% in BRICS (or $137 billion versus $19 billion, respectively). Three Chinese companies; Zijin Mining (gold), China Coal (coal), and Yanzhou Coal (coal) led the way, each with impressive gains of more than 30%.
Changes in our Top 40:
• The market capitalisation threshold for attaining Top 40 status dropped by almost 15% for mining companies, to $4.5 billion.
• Two of the three new entrants in this year’s Top 40 were Chinese companies and one was North American.
• This year saw no companies in South Africa from the Top 40 list – the first time a company from this traditional mining heavyweight has not been part of our analysis, and a far cry from the five companies included in our 2004 first edition of Mine.
1250
1200
1150
1100
1050
1000
950
900
850
800
7502011 2012
+3%
-22%
2013 Diversified Iron Ore Coal Copper Gold Other 2014
1250
1200
1150
1100
1050
1000
950
900
850
800
750
Changes in Top 40 market capitalization ($ billion, year end December 31st)

7 Review of global trends in the mining industry
Mine 2015
Divestiture and demerger talks could begin to shake up the Top 40:
• BHP Billiton has simplified its portfolio by demerging a group of “non-core” assets to create an independent global mining company called South32. Given its trading value debut, this new company is expected to be part of the Top 40 in 2015.
• Vale is in the process of evaluating whether to carve out a stake in its base-metals division, including copper and nickel mines in Brazil, Canada, and Indonesia, with a goal to present a recommendation to its board by the end of 2015, for a possible listing in 2016.
• Anglo American continues to evaluate alternatives to maximise shareholder value by executing on its previously announced strategy to dispose of certain assets.
• India and China are moving toward more consolidation of key resource companies. As some of their largest miners are brought together, we would expect some to feature in the Top 40 in years to come.
Iron ore upset
Iron ore prices sank to a 10-year low at the start of April 2015, then went on to record their biggest monthly gain in more than two years after BHP Billiton said it was shelving its planned de-bottlenecking, restraining the pace of its expansion. Still, prices remain depressed and the outlook is dim.
The drop in value of iron ore is having a significant impact on the Top 40 with exposure to the commodity. The iron ore majors (BHP Billiton, Rio Tinto, and Vale) have taken slightly different approaches to the slump in prices and resulting market oversupply.
Rio Tinto remains committed to increasing supply by around 100Mt/a while BHP Billiton’s deferred de-bottlenecking will impact the time taken to achieve its production goal of 290Mt/a. Vale has reaffirmed its commitment to $17 billion
of expansions, but says it would be prepared to withhold 30Mt from the market if weak prices persist. The merits of these strategies have been challenged by those most affected by the current price environment, including other producers, unions and governments whose revenues have been curtailed. A very public debate has ensued, leading to calls in Australia for a parliamentary inquiry into the iron ore market, amid allegations being levelled at BHP Billiton and Rio Tinto that they are driving down prices.
In China the government stepped in to support local producers by cutting resource rent tax on iron ore by 60%. Iron ore producing regions in China would like more protectionism, perhaps in the form of an import duty similar to what has been done to protect coal miners. However, this isn’t expected given the country’s reliance on iron-ore imports
“Unprofitable juniors needed to take responsibility for investing capital into unviable projects” – Andrew Harding, Rio Tinto CEO of Iron Ore
Major iron ore producers are still expecting to post healthy margins if commodity prices remain low, due largely to the quality of their projects and their focus on operational cuts that are helping to improve margins. But smaller players will continue to face difficulties. Some companies in Australia are already up against the wall, while some iron ore mines in China have reportedly closed.
Transportation costs for iron ore producers have eased, thanks to lower crude oil prices and shipping prices. An example is Vale, which has benefited from the combined effects of lower energy prices and the introduction of its Valemax shipping fleet. Together, these measures have halved the cost of moving iron ore from Brazil to China.
Meanwhile, primary demand out of China has failed to live up to expectations. This, along with the slowdown in Chinese capital spending and real estate development, alongside increased local supply, has led to a stock piling of ore at Chinese ports. Li Xinchuang (China Metallurgical Industry Planning and Research Institute) stated that

8 The gloves are off
Mine 2015
0
50
100
150
200
05
1015202530354030
30
40 3632
2517 18
140 160
Global Iron ore reserves (in billion tonnes) Average iron ore life of mine (years)
Top 40Rest of industry Rest of Top 40Vale, BHP and Rio Tinto
20132013 2014 2014 2015F
Source: PwC Analysis using US Geological Survey data
demand for steel has reached its peak and will decline. US steel producers have acknowledged that the steel market is oversupplied, with Chinese and Taiwanese steel being dumped in their primary markets. As a result, US steel producers are requesting a tariff on imported steel to protect their businesses. These factors together suggest there will be continuing pressure on iron ore prices.
Given the relatively small proportion of global iron ore reserves residing with the Top 40, and the remaining lives of their mines, its hard to see where a meaningful reduction in global supply would come from in the near term.
The Top 40 increased production in 2014, despite the steep drop in iron ore prices. Many ramped up projects started in previous years. In 2014, the Top 40’s share of global iron ore production grew from 27% to 30%. About 95% of the output increase comes from the iron ore majors that expanded in an oversupplied market, following the ‘survival of the leanest’ strategy.
“We had a balanced market of buyers and sellers, but what has driven the market down and created a manipulated market is the nauseously repeated statements of oversupplying the market, driving down the iron price” – Andrew Forest, Fortescue Metals Group Chairman
Coal taking it on the chin
A number of mining companies faced shareholder activism and we discuss two examples:
The first was compensation strategies. Some shareholders, looking more closely at executive compensation amid weaker overall industry performance, have been calling for more transparency on what executives are being paid for. Some miners have responded by opening the books more widely on their compensation practices in the current reporting season.
Another hot button issue, with potentially wide-ranging industry impacts, is a call by certain investor groups, including university endowments and investment funds, to have miners exit their coal businesses. They cite concerns about the negative impact of coal emissions on the environment. These investors are publicly threatening to sell their investments and stop putting their money into coal miners altogether if there is no change. To date, the industry’s response has been muted. However, coal is expected to continue to play a significant role in meeting the world’s need for energy, especially in the developing world. India has 280 million people without access to electricity, and has confirmed that coal will continue to remain the centerpiece of its energy needs for the “foreseeable future.” Clearly, this is a challenge that’s not expected to go away anytime soon.

9 Review of global trends in the mining industry
Mine 2015
0
5,000
10,000
15,000
20,000
25,000
30,000
202020192018201720162015201420132012201120102009200820072006200520042003200220012000
GD
P
Source: The World Bank
China GDP at constant prices and GDP growth rate (RMB Billions)
0
5
10
16
202020192018201720162015201420132012201120102009200820072006200520042003200220012000G
DP
Gro
wth
%
The perspective on China
Slower economic growth in China has cast a shadow over the once-bright outlook for the mining industry. China is still growing, but the focus is expanding beyond from infrastructure development and towards sustainable growth driven by consumers. That could be good news for base metals such as copper and nickel, which are used in products such as cars and computers, as well as zinc used to galvanize steel. However, it’s more concerning for iron ore and metallurgical coal used in steelmaking for broader infrastructure projects. As we noted earlier in this report, China’s growth is still considered strong at around 7%, and that’s now measured across a much larger economic base than in years past. There’s also potential growth coming from other emerging economies, such as India, which could help underpin demand for commodities in the long term.
China’s growth is still considered strong at around 7%, and that’s now measured across a much larger economic base than in years past.

10 The gloves are off
Mine 2015
Short-term volatility – learning to roll with the punches
Commodity prices have been more volatile over the past year, in particular iron ore. Volatility has also increased in copper and coal markets, while gold has been relatively steady after an unstable year in 2013.
Greater price volatility underscores the need for miners to develop more flexible operating strategies, adaptable mine plans including phased expansions and partial curtailments. Miners are adopting a variety of different approaches, each with an aim to reduce costs and develop a healthier balance sheet through strict capital discipline. These measures will help to create more resilience in both up and down cycles in future.
Miners versus all comers
The FTSE 100 and Dow Jones indices outperformed the HSBC Global Mining index by 17% and 28% respectively in 2014. That’s after the mining index spent the first nine months of the year trending in line with or better than the broader market indices.
The divergence is more pronounced when we look back over a longer period. The HSBC Global Mining Index fell by 50% between January 2012 and April 2015, while the FTSE 100 and Dow Jones gained around 20% and 40%, respectively over the same period. As of April 2015, the HSBC Global Mining Index was at a five-year low, heading to levels not seen since the last global financial crisis. With no evidence to support an imminent turnaround of events in 2015, it appears unlikely the gap between broader markets and the mining index will close quickly.
%
5
10
15
20
25
30
35
Iron Ore Nickel Zinc Copper Gold Coal
Three-Month Rolling Volatility
Apr 14
Source: PwC Analysis using data compiled from Bloomberg
Jul 14 Oct 14 Jan 15 Apr 15

11 Review of global trends in the mining industry
Mine 2015
PE ratios get worked over
Net profit of the Top 40 for 2014, excluding impairments, was $72 billion, which is down 9% from 2013. The drop in commodity prices was only partially offset by increased volumes, particularly in iron ore, where supply has increased on the back of large expansions. Continued operating cuts helped to support some of the earnings growth for the Top 40.
Although historical earnings and PE ratios are not an indicator of future results, they do provide some insight into the market’s view of expected profitability. Excluding the impact of impairment on net earnings, this would indicate that the market’s expectation of future performance declined during the year. That reflects a view that a material price recovery across the major commodities is not imminent, especially given concerns over excess supply/demand imbalance and China’s slowing growth not generating sufficient demand.
0.6.000
0.8.000
1.0.000
1.2.000
0.6 0.6
0.8
1.0
1.2
0.8
1.0
1.2
Dow Jones FTSE 100 HSBC Global
Mar-15Feb-15Jan-15Dec-14Nov-14Oct-14Sep-14Aug-14Jul-14Jun-14May-14Apr-14Mar-14Feb-14Jan-14
Global mining indices
Source: Bloomberg
Top 40 Price-to-earnings ratio
PE Ratio (excluding impairment)PE Ratio
Source: PwC analysis
0
10
20
30
40
50
201420132012201120102009

12 The gloves are off
Mine 2015
Fighting fit? What’s really driving those cost savings?
Many of the Top 40, credit their cost-cutting programs for helping to improve returns. However, cost savings are also coming as a result of the dramatic fall in crude oil prices since last summer, as well as currency devaluations in major metal and mineral producing countries.
Some studies show the average miner can save between 10% and 25% on energy costs in today’s low crude oil-price environment. Miners with high costs in local currencies also realised a benefit benefit from the strength of the US dollar.
For example, miners with high labour costs in Canada or Australia would have enjoyed a significant cost reduction in US-dollar terms due to currency fluctuations. Consider that the Australian dollar has devalued 13%, the Brazilian real 28%, the Canadian dollar 8%, the Russian ruble 57%, and the South African rand by 13% against the US dollar. Anglo American, for example, has quantified the effect at a positive $1.3 billion to underlying EBIT (27%).
%
0
20
40
60
80
100
120
140
160
0
20
40
60
80
100
120
140
160
Apr-15Mar-15Feb-15Jan-15Dec-14Nov-14Oct-14Sep-14Aug-14Jul-14Jun-14May-14Apr-14Mar-14Feb-14Jan-14
Commodity price movements
Source: World Bank
GoldNickelCopperIron oreCoal

13 Review of global trends in the mining industry
Mine 2015
Return on capital falling to a ten-year low
Return on capital employed (ROCE) fell to its lowest level in the history of Mine, to 9% in 2014, down from 9.5% in 2013. ROCE is defined as net profit, excluding impairment, divided by property, plant and equipment plus current assets less current liabilities.
Total capital employed by the Top 40 was 4% higher in 2014, compared to a year earlier. Earnings, excluding impairment, were down 8% as lower commodity prices offset the improvements achieved through volume growth and lower per unit production costs.
Our analysis doesn’t support claims of an unwinding of capital commitments associated with major growth projects over the past few years, with the benefits starting to hit the bottom line improving ROCE. Moreover, it was not a different story for the iron ore exposed miners compared to the other in the Top 40, with reductions from 10.5% to 9.5% and from 8.8% to 7.8% respectively.
Companies in OECD countries were better able to slow the decline in ROCE, with a rate of 10% versus 16% for the BRICS miners. This is due to a steeper decline in earnings and a large increase in capital employed, highlighting the capital discipline focus by OECD companies. Meantime, BRICS companies appear more willing to pursue growth, despite the lower returns.
The average ROCE is largely below the minimum hurdle investment rate of 15% to 20% set by several companies. Only six of the Top 40 exceeded the 15% benchmark. They include; Coal India (coal), Norilsk Nickel (nickel), NMDC (iron ore), Randgold (gold), Shandong Gold (gold), and Newcrest (gold). This suggests that further actions are needed around capital allocation and cost control.
Top 40 return on capital employed (ROCE)
5%
10%
15%
20%
25%
20142013201220112010200920082007200620052004
Source: PwC analysis (Note: Net profit excluding impairment)

14 The gloves are off
Mine 2015
Capital Velocity – no longer on the attack
Capital velocity is the ratio of capital expenditures to the capital employed in the business and a proxy for measuring the growth agenda of organisations in capital-intensive industries.
In 2014, the Top 40 miners finally delivered on their commitment to reduce capital expenditures, which led to a slowdown in capital velocity. While miners have been cutting capital expenditure commitments for more than three years, indications of a slowdown in capital spending only started to materialise in 2014.
Not unexpectedly, capital velocity reduced to just over 12% in 2014. A further reduction is expected in 2015, as major miners continue to defer capital expenditures. Capital velocity slowed across both OECD and BRICS companies, however, BRICS companies slowed less than their OECD company counterparts, which is aligned with shareholder expectations.
“ Our longstanding capital management framework defines four priorities for cash flow: to retain a solid A credit rating to maintain a strong balance sheet through the cycle; to at least maintain or grow our progressive base dividend in every reporting period; to invest selectively in high-return opportunities through the cycle; and to return excess capital to shareholders in the most efficient way” – Andrew Mackenzie, BHP Billiton CEO
“ With lower commodity prices and uncertain global economic trends, the operating environment remains tough. However, in these conditions Rio Tinto’s qualities and competitive advantages deliver superior value. Our combination of world-class assets, disciplined capital allocation, balance sheet strength, operating and commercial excellence, and a culture of safety and integrity gives me confidence in our ability to continue to generate sustainable returns for our shareholders” – Sam Walsh, Rio Tinto CEO
Top 40 Capital Velocity compared to capital expenditure ($ billions)
0
40
80
120
160
200
2014201320122011201020090%
10%
20%
$ B
illio
ns
Per
cent
Capital expenditure Capital Velocity
Source: PwC analysis

15 Review of global trends in the mining industry
Mine 2015
Shareholder returns were up, a little
Higher free cash flow didn’t translate into higher dividends for the Top 40 in 2014. That was more of a story in 2013, a year when dividends increased despite negative free cash flow. Many of the Top 40, including BHP Billiton and Rio Tinto, promote a dividend payout policy that rewards shareholders with a consistent cash flow stream. The policy is based on a long-held belief that cash dividends certainty attracts and retains shareholders, which in turn reduces share price volatility. BHP and Rio together accounted for about a quarter of the Top 40’s cash dividends in 2014.
The Top 40 barely covered dividends in 2014 at 1.1. That’s after having borrowed the year before to satisfy dividend payments. This practice isn’t sustainable in the long-term. Although not as drastic as in 2013, dividends paid in 2014 consumed all available cash, reducing the balance sheet flexibility of miners in the expected continuing lean times.
Due to the decrease in market capitalisation, the average dividend yield for the Top 40 increased to 5% from 4.3%. This is the highest dividend yield in the history of Mine where the 10-year average is 2.8%. Interestingly, for iron ore majors BHP Billiton, Rio Tinto, and Vale, the dividend yield was 6%, which suggests a desire to maintain their dividend policies. This is an attractive entry point for investors, assuming the dividends can be sustained.
As we enter a potentially prolonged period of lower commodity prices and profits, miners are walking a fine line. On the one hand, some want to maintain a stable dividend policy. On the other hand, they have a responsibility to ensure that dividends paid don’t undermine the health of their balance sheets. This is important given that eight of the Top 40 had their credit ratings downgraded in 2014 and another 10 were placed on a negative outlook.
Dividend coverage and yield
0%
1%
2%
3%
4%
5%
6%
20142013201220112010200920082007200620052004
Source: PwC analysis (Note: Net profit excluding impairment)
0
1
2
3
4
5
6
Dividend coverageYield
“BHP Billiton has a progressive dividend policy. The aim of this policy is to at least maintain or steadily increase our base dividend in US dollars terms at each half-yearly payments” – BHP Billiton website
16 The gloves are off
Mine 2015
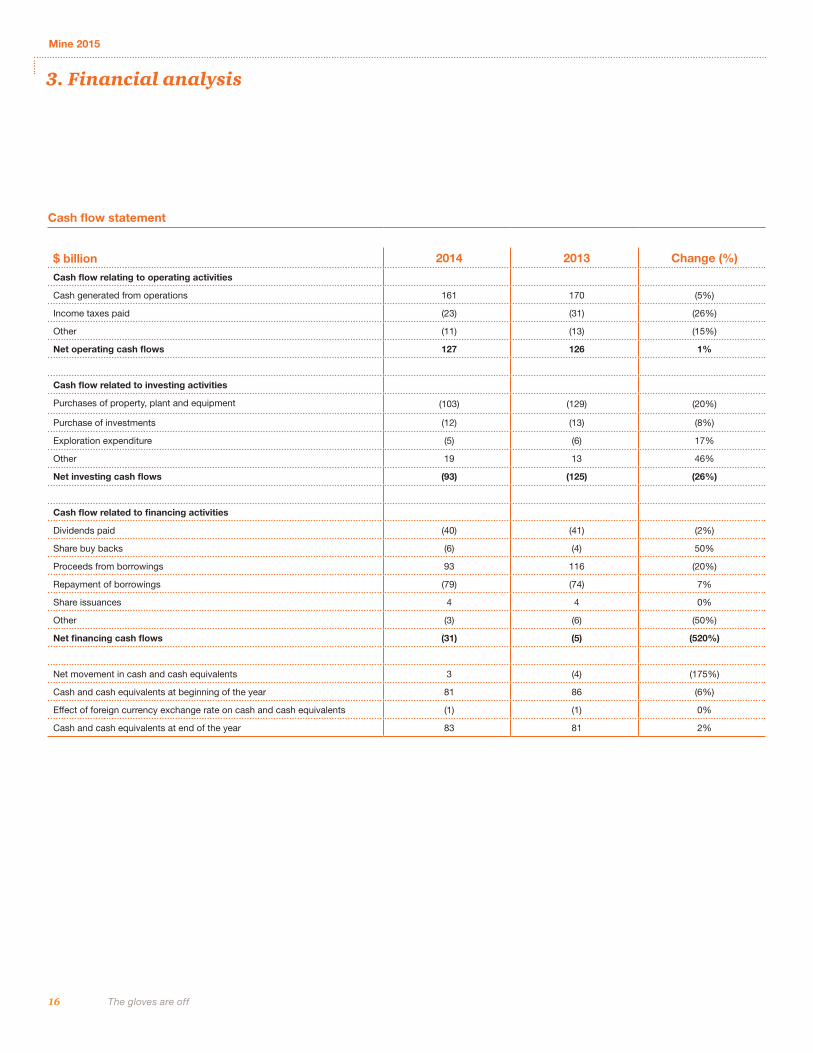
Cash flow statement
$ billion 2014 2013 Change (%)
Cash flow relating to operating activities
Cash generated from operations 161 170 (5%)
Income taxes paid (23) (31) (26%)
Other (11) (13) (15%)
Net operating cash flows 127 126 1%
Cash flow related to investing activities
Purchases of property, plant and equipment (103) (129) (20%)
Purchase of investments (12) (13) (8%)
Exploration expenditure (5) (6) 17%
Other 19 13 46%
Net investing cash flows (93) (125) (26%)
Cash flow related to financing activities
Dividends paid (40) (41) (2%)
Share buy backs (6) (4) 50%
Proceeds from borrowings 93 116 (20%)
Repayment of borrowings (79) (74) 7%
Share issuances 4 4 0%
Other (3) (6) (50%)
Net financing cash flows (31) (5) (520%)
Net movement in cash and cash equivalents 3 (4) (175%)
Cash and cash equivalents at beginning of the year 81 86 (6%)
Effect of foreign currency exchange rate on cash and cash equivalents (1) (1) 0%
Cash and cash equivalents at end of the year 83 81 2%
3. Financial analysis

17 Review of global trends in the mining industry
Mine 2015
Top 40 Free cash flow & shareholder returns ($ billion)
Shareholder returnFree cash flow
Source: PwC analysis
-5
0
5
10
15
20
25
30
OECD 2014BRICS 2014OECD 2013BRICS 2013
Operating cash flow increased slightly to $127 billion in 2014, from $126 billion in 2013, which reflects benefits from cost controls and working capital management initiatives. Investing cash flow for the Top 40 fell 26% in 2014 to $93 billion, versus $125 billion in 2013. That gave a boost to overall cash flows as miners delivered on promises to reduce capital expenditures. Capital investments dropped to $103 billion, versus $129 billion in 2013.
OECD companies appear to be following tighter cash management policies compared to their BRICS peers. While net operating cash flow for the Top 40 remained stagnant, OECD companies reduced their investing activities by 30%. That compares to a 17% reduction by BRICS companies, which generally have lower debt levels and greater ability to buy when the price is right.
In the previous edition of Mine, we noted that more than half of the Top 40 miners replaced their CEOs over a two-year period, with a greater focus on operational management over growth and M&A. In 2014, CEOs seem to be delivering on promises of controlling their investments in Property, Plant and Equipment (PP&E). Investment in PP&E fell 20% in 2014 to $103 billion, compared to $129 billion in 2013.
With all of the easier cash flow wins now under their belts, the Top 40 will need to identify more holistic changes (as we explore in our productivity spotlight). Or, they will need to follow through on previously implemented process improvement strategies in order to further improve free cash flow. This is especially important in a market that is expected to remain volatile in the short term, and given a shareholder base that expects both dividend returns and debt reductions.
OECD companies reduced dividend payouts by 12% in 2014, to $23 billion, compared to $25 billion in 2013. That’s despite a $21 billion increase in free cash flow. Meantime, BRICS companies increased dividend payments slightly in 2014 to $17 billion, up from $16 billion a year earlier.
Shareholder returns tell a slightly different story: Share buybacks increased by more than $4 billion for OECD companies, but fell by more than $2 billion for BRICS companies in 2014.
One major solution to the problem of how to grow and distribute free cash flow is through the one-two punch of reductions in capital expenditure and lower M&A activity, as announced by several of the Top 40. In our last report, we estimated capital expenditure by the Top 40 would be down by about 11% in 2014. Miners delivered, and then some, by cutting their capital expenditures 20% in 2014 compared to 2013.
The Top 40 reduced capital expenditure across almost all commodities. The intensity of cuts was different by region, with the Top 40 OECD companies slashing capital expenditure by 23%, which is 9% higher than their BRICS counterparts. This is also because of different market conditions and needs, as more of the BRICS markets are still growing at rates significantly in excess of those in the OECD markets.
The market still looks bearish for mining stocks, with the Top 40 expected to further reduce their capital expenditures. In 2015, capital expenditure of the Top 40 is expected to be only about $85 billion to $95 billion, based on announced capital expenditure programs.

18 The gloves are off
Mine 2015
These cost challenges aren’t new for most miners, as the industry grapples with low productivity, committed capacity, and infrastructure investment requirements in recent years. Many have tried to boost free cash flow through a series of measures, although some have been short-term solutions, such as reduction in capital and exploration spending.
As a result, exploration has suffered in recent years. The Top 40 companies have decreased their exploration spending by 53% to a miserly $4.9 billion in 2014. This contrasts with the $6.3 billion allocated in 2013 and $12 billion in 2012. Interestingly, the OECD companies spent more than their BRICS counterparts.
Actual and projected capital spend by commodity ($ billion)
2014 2015F2013
Source: PwC analysis
0
10
20
30
40
50
60
70
80
OtherPotashGoldIron oreCoalCopperDiversified

19 Review of global trends in the mining industry
Mine 2015
0
1
2
3
4
5
36
Top 40 exploration expenditure by BRICS compared to OECD
BRICSOECD
2013 2014
Source: PwC analysis
The great untapped
The reduction in exploration spending by the Top 40, and the move away from greenfield to brownfield exploration, isn’t in itself a reason for concern for the long-term sustainability of the industry. The concern comes from the increasing difficulty of junior miners to raise capital targeted for greenfield exploration activities.
As an example, 2013 and 2014 saw a significant decrease in capital raised in the market for exploration, when proceeds from IPO, secondary offers, and convertible notes decreased to under $2 billion. Of note, the average proceeds per issue also fell significantly from levels in 2011 and 2012. That indicates a reduced appetite for investors to fund mining exploration.
The trend among the major miners of concentrating on a small handful of tier 1 projects, and moving away from the greenfields, is adding to the difficulties for junior miners looking to find promising new prospects. Recent investor wariness of the mining sector, due to slumping prices, has caused junior financings to dry up. What’s more, as oversupply fears linger for most commodities, fewer companies are willing to make the large capital investments.
These reductions in capital raised and spent on exploration call into question the ability of miners to find additional low-cost reserves to remain competitive, as well as their ability to respond to eventual increases in commodity demand. The industry’s inertia will come at a price. If reserve levels continue to decrease, the expectation is that it may further exacerbate the demand and supply volatility witnessed in recent years.
Use of proceeds on exploration activities ($ billion)
0
1.1
2.2
3.3
4.5
5.6
6.7
7.8
9.0
2014201320122011
Use
of p
roce
eds
on e
xplo
ratio
n
Ave
rage
pro
ceed
s p
er is
sue
Secondary offer IPO Convertible notes Capital Velocity
Source: PwC analysis using Thomson Reuters information
.05
.010
.015
.020
.025
20 The gloves are off
Mine 2015
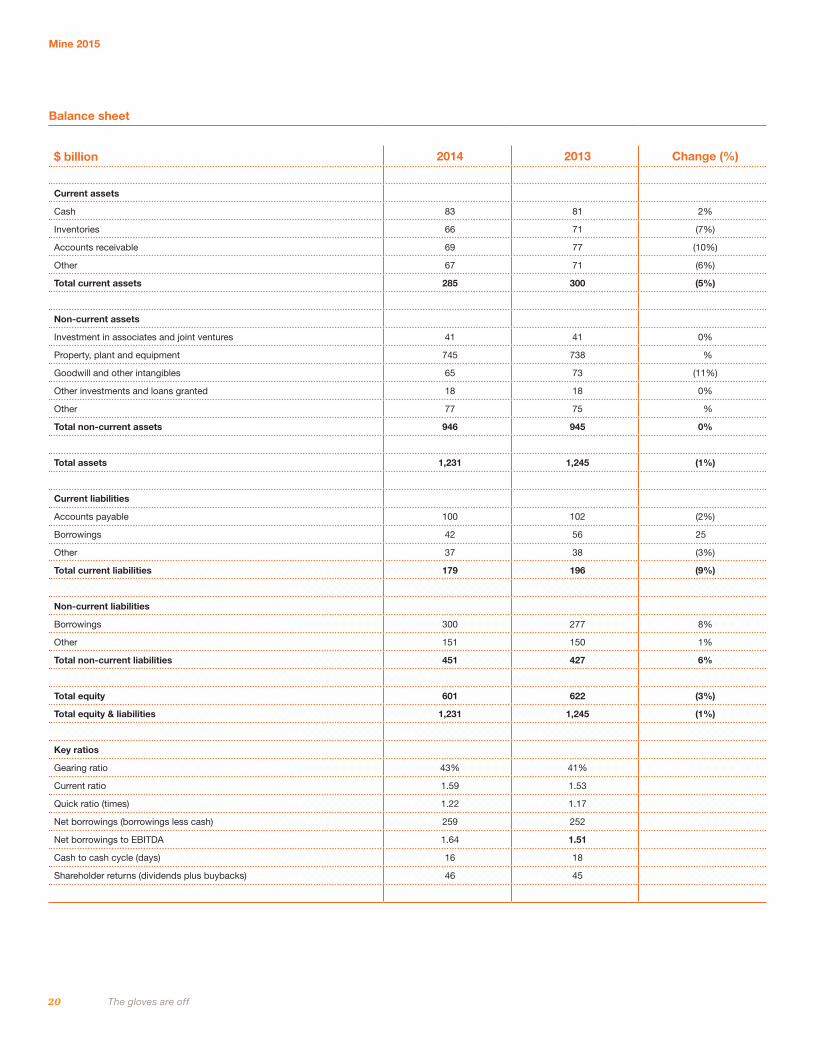
Balance sheet
$ billion 2014 2013 Change (%)
Current assets
Cash 83 81 2%
Inventories 66 71 (7%)
Accounts receivable 69 77 (10%)
Other 67 71 (6%)
Total current assets 285 300 (5%)
Non-current assets
Investment in associates and joint ventures 41 41 0%
Property, plant and equipment 745 738 1%
Goodwill and other intangibles 65 73 (11%)
Other investments and loans granted 18 18 0%
Other 77 75 3%
Total non-current assets 946 945 0%
Total assets 1,231 1,245 (1%)
Current liabilities
Accounts payable 100 102 (2%)
Borrowings 42 56 (25%)
Other 37 38 (3%)
Total current liabilities 179 196 (9%)
Non-current liabilities
Borrowings 300 277 8%
Other 151 150 1%
Total non-current liabilities 451 427 6%
Total equity 601 622 (3%)
Total equity & liabilities 1,231 1,245 (1%)
Key ratios
Gearing ratio 43% 41%
Current ratio 1.59 1.53
Quick ratio (times) 1.22 1.17
Net borrowings (borrowings less cash) 259 252
Net borrowings to EBITDA 1.64 1.51
Cash to cash cycle (days) 16 18
Shareholder returns (dividends plus buybacks) 46 45

21 Review of global trends in the mining industry
Mine 2015
The total asset base of the Top 40 declined by 1% in 2014 compared to an increase of 7% in 2013. Capital expenditures, including non-mining activities, were $103 billion in 2014, versus $129 billion in 2013. Over the past few years, the Top 40 has been curtailing new project spending. Those cuts finally materialised in the 2014 results, as many projects have been completed or cancelled.
Significant transactions in the year included Glencore’s sale of its Las Bambas asset for $7 billion and Freeport-McMoRan’s sale of Candelaria for $2 billion, to parties not included in the Top 40. This decrease was partly offset by Agnico Eagle’s acquisition of a 50% interest in Osisko Mining for $1.8 billion. The Top 40 saw a net increase in property, plant and equipment (PP&E) of $34 billion, excluding another round of impairment charges totalling $27 billion. Overall, the Top 40 saw a decline in total asset base driven primarily by shareholder returns, impairments, and disposals.
Many of the Top 40 introduced working capital reduction programs in 2013, which continued into 2014, the results of which have been mixed. Total current assets and total current liabilities both declined by 5% and 9% respectively, resulting in net working capital increases of $2 billion. The
Top 40 saw improvements in operating cash flows, thanks in part to their focus on managing working capital. However, it’s yet to be seen whether any further improvements can be achieved. The cash-to-cash cycle decreased to 16 days in 2014, versus 18 days in 2013.
Days inventories outstanding increased by one day in 2014, to 49 days, reflecting increases in production volume. While this appears contrary to the aims of many OECD CEOs, their companies held inventories for 47 days, compared to 53 days for BRICS companies. This highlights the different working capital practices and contrasting strategies of pursuing operating efficiencies and growth between OECD and BRICS companies.
Increasing borrowings and returns of capital to shareholders in recent years are increasing leverage: The gearing ratio at the end of 2014 was 43% versus 41% in 2013. There was no significant move in the gearing ratio for OECD companies versus a slight increase for BRICS companies. The gearing ratio increased 12% from 2012 to 2013, with a corresponding decrease in market capitalisation of the Top 40 by 23%. The lesson learned from 2013 was that higher risk must be accompanied by increases in expected rewards.
Top 40 gearing ratio (%)
0%
10%
20%
30%
40%
50%
2014201320122011201020092008200720062005
Source: PwC analysis

22 The gloves are off
Mine 2015
Net borrowings to EBITDA increased to 1.64 in 2014, compared to 1.51 in 2013 for the Top 40. There was a noticeable variance between OECD companies at 1.58 (versus 1.62 in 2013) and BRICS companies 1.73 (1.29 in 2013). This difference is due largely to improvements in EBITDA for OECD companies, compared with declines in EBITDA for BRICS companies, rather than changes in net borrowing levels. OECD companies saw improvements in liquidity ratios, but it’s worth noting that a significant number of BRICS companies are state-backed enterprises, where debt levels and liquidity ratios may not have the same impact on their ability to borrow.
In our review, we noted four companies within the Top 40 with net borrowings to EBITDA greater than 4:1. Of these, all are state-backed or owned entities. Over the past few years, many of the Top 40 have taken advantage of lower interest rates and rolled over long-term borrowings. Interest expense on debt was under 5% for both 2014 and 2013.
Most borrowings are held in OECD countries and with the diversified companies in particular, which are typically more resilient to individual commodity volatility. The Top 40 miners appear to have some flexibility in managing their capital structures in the upcoming year.
Top 40 debt by maturity ($ billion)
2–3 years<1year >5 years4–5 years
0
50
100
150
BRICsOECD
Source: PwC analysis
25
48 45
112
1729
21
42

23 Review of global trends in the mining industry
Mine 2015
Income statement
$ billion 2014 2013 Change (%)
Revenue 690 728 (5%)
Operating expenses (509) (535) (5%)
Other operating expenses (22) (26) (15%)
EBITDA 159 167 (5%)
Impairment charges (27) (58) (53%)
Depreciation & amortization (48) (42) 14%
PBIT 84 67 35%
Net finance cost (15) (16) 6%
Income tax expense (24) (30) (20%)
Net profit 45 21 114%
Effective tax rate (ETR) 35% 59%
Equity 601 622
Capital employed 851 842
Key ratios
EBITDA margin 23% 23%
Adjusted net profit (excl. impairment) 72 79
Return on capital employed (excl. impairment) 8.4% 9.5%
Return on equity 7% 3%

24 The gloves are off
Mine 2015
The uneven global economic recovery and divergent monetary policies from countries around the world continue to create volatility and downward pressure on commodities. Prices decreased by 6% in 2014 due to the combination of additional supply and weaker demand growth, primarily from China. The impact on the sector has led to a drop in revenues for the Top 40, to $690 billion in 2014, down from $728 billion in 2013. More than half (27) of the Top 40 saw a decline in revenue in 2014. About two-thirds (67%) of the Top 40 revenues come from copper, coal, and iron ore. Of note, nickel, zinc, and platinum were the only commodities to increase revenues from prior year.
Unlike in previous years, the Top 40 managed to reduce operating costs in line with revenues in 2014, posting a 5% year-over-year reduction in operating expenses. Still, revenues were lower.
Net profits rose to $45 billion in 2014, a 114% increase from $21 billion in 2013. This is a positive turnaround from 2013, as we predicted in last year’s Mine. Net profits were down a staggering 72% between 2012 and 2013, setting the largest single year-on-year decrease in net profit margin, and reaching its lowest level in the past decade. However, due to the record 2013 impairments recorded, a more appropriate comparison of net profit adjusted for impairment shows a different story with a decrease of 9%.
Revenue by commodity ($ billion)
0
20
40
60
80
100
120
140
Other metalsPlatinumDiamondsZincAluminiumNickelGoldIron oreCoalCopper
20142013
Note: Chart excludes Glencore’s marketing and trading revenues, and certain other companies’ non-mining revenuesSource: PwC analysis

25 Review of global trends in the mining industry
Mine 2015
The balance of aggregate adjusted net profit contributed by OECD companies increased in 2014, comprising nearly 70% of total adjusted net profit of the Top 40. BRICS companies in the Top 40 contributed a reduced aggregate adjusted net profit of $22 billion, down 15% from $26 billion in 2013. OECD companies only reduced their contribution slightly from $53 billion in 2013, to $50 billion in 2014.
Top 40 year-on-year change in operating revenues and expenses (%)
-15%-12%-9%-6%-3%0%3%6%9%
12%15%
Other metalsPlatinumDiamondsZincAluminiumNickelGoldIron oreCoalCopper
Operating expenses from ordinary activities, %Revenue from ordinary activities, %
Source: PwC analysis

26 The gloves are off
Mine 2015
Top 40 adjusted net profit contribution
02
4
6
8
10
12
14
16
18
20
0%
20%
40%
60%
80%
100%
120%
2013 Net Profit(excluding impairment)
2014 Net Profit(excluding impairment)
2014 Cumulativecontribution
2013 Cumulativecontribution
Source: PwC analysis
Ura
lkal
i
Alro
sa
Poly
us
Agni
co
Mon
golia
Bao
tou
Zhon
gjin
Shan
Don
g
Peno
les
Chi
naco
al
Con
solE
nerg
y
Ran
dgol
d
Cam
eco
Teck
New
mon
t
Inne
rMon
golia
Saud
iAra
bian
Zijin
Jian
gxi
Pols
ka
Gol
dcor
p
Sum
itom
o
Anto
faga
sta
New
cres
t
NM
DC
Firs
tQua
ntum
Mos
aic
Bar
rick
Yanz
hou
Vale
Pota
sh
Gru
poM
exic
o
Nor
ilsk
Forte
scue
Angl
oAm
eric
an
Gle
ncor
e Fr
eepo
rt
Coa
lIndi
a
Rio
Tint
o
Shen
hua
BH
P
($ b
illio
n)
In a market of falling prices and margin reductions, the diversified players have managed to boost their profit contribution from the prior year, from $9 billion in 2013 to $25 billion in 2014. This was the result of a 5% reduction in operating costs, which led to savings of $18 billion. That was coupled with a reduced impairment charge of $9 billion in 2014, versus $28 billion in 2013.
There was a greater concentration of profits in 2014 among the top performers in the Top 40. Among them, 10 contributed 75% of net profits in 2014. There has been a definite drop in profitability across the group. It took an additional two companies (a total of 12) to bring home three quarters of the profits in 2013.
At $27 billion, impairment charges were down 53% in 2014 versus 2013, when they reached a whopping $58 billion. Five Top 40 players contributed 75% of the impairments in 2014. Almost all of these were gold companies or members of the Top 5 diversified players. For example, although Anglo American saw significant operational improvement in 2014, it reported an impairment charge of $3.8 billion related to
the decrease in the carrying value of its Minas-Rio iron ore project. Apart from the impairment of this project, the only other in iron ore was $1.1 billion related to Vale’s project in Guinea. Other large impairments came from Freeport McMoRan’s oil and gas division, Barrick’s copper properties, Newcrest’s gold properties, and Goldcorp’s gold properties.
Following a period of record impairment charges in 2012 and 2013, 2014 saw impairment as a proportion of capital expenditure level off to 26%. However, that’s still above the six-year average of 24%. Impairments will need to be watched closely in the next years, especially if we’re in what might be considered the norm for near-term commodity prices. Companies will continue to reduce maintenance and sustaining capital, which will ultimately impact the long-term viability of operations.
The gradual reduction in the ratio of market capitalisation to net asset value confirms the negative investor sentiment in the mining sector. Pursuant to most accounting standards, this indicates impairment testing may be underway.
There was a greater concentration of profits in 2014 among the top performers in the Top 40.

27 Review of global trends in the mining industry
Mine 2015
Top 40 impairment as a percentage of capital expenditure (%)
Impairment—% of Capex
Source: PwC analysis
0%5%
10%15%20%25%30%35%40%45%50%
201420132012201120102009
Top 40 market capitalisation to net asset value ratio
Market capitalisation
Source: PwC analysis
0.0
0.5
1.0
1.5
2.0
2.5
3.0
3.5
20142013201220112010
Top 40 Market capitalisation and net asset value ($ billion)
Net asset valueMarket capitalisation
Source: PwC analysis
0
100
200
300
400
500
600
700
BRICS (2014) BRICS (2013) OECD (2014) OECD (2013)
Even more pronounced in our analysis was the significant compression of OECD companies’ market capitalisation to net asset value ratio. This indicates a catch up, relative to BRICS companies, whose market capitalisations were more heavily punished in recent years.
Although continued financial distress is expected in the industry, issuer ratings are expected to remain somewhat stable in the short-term, with the exception of those with significant iron ore exposure. Our analysis of 237 global mining companies indicates that 21% had a net borrowings/EBITDA ratio of 3 or higher in 2013/14. That’s a significant increase from 2011, when only 9% of the companies had a ratio of 3 or higher. Brokers and rating agencies continue to downgrade the mining sector. Most recent examples include Citigroup’s downgrade of the sector from “bullish” to “neutral,” as well as the downgrading of major diversified miners by various credit agencies. That said, issuer ratings are expected to remain somewhat stable for three main reasons:
1. Agencies have already lowered ratings in recent years in anticipation of lower prices.
2. The industry is expected to continue to reduce capital expenditures and lower its gearing level.
3. The industry is expected to continue to benefit from a lower energy costs as a result of the drop in crude oil prices and weaker currencies against the US dollar in key mining countries such as the Australia, Brazil, Russia, Canada and South Africa.

28 The gloves are off
Mine 2015
Tax Transparency —an issue of trust
The call for higher public disclosure of tax payments in the mining industry has long been recognised. Non-governmental organizations (NGOs) have been focusing on the morality aspect of paying tax; making the argument that the corporate responsibility lens should be used in considering whether the amount of tax a company pays is “fair,” not just allowable under that countries rules and regulations.
For their part, global mining companies are concerned that payments to government at all levels are not always fully disclosed to the communities in which they operate, which increases the risk of misallocation or potential mismanagement of resource endowments. Many companies have responded to this through voluntary entry into disclosure regimes such as the Extractive Industry Transparency Initiative. The EITI requires mining companies and the government in a compliant country to account for payments made and received, so that an independent consultant can make reconciliation in an EITI compliant report. At present, 31 countries are EITI compliant, and 48 more are implementing the requirements.
According to EITI.org, a cumulative $1.568 trillion in government revenues from oil, gas, and mining have been disclosed in EITI reports. Versions of the EITI reporting that some companies already make is set to become mandatory with the US Securities and Exchange Commission set to issue a new proposal on the Dodd-Frank Act transparency measures in late spring 2015. Others, such as the European Union (Chapter 10 of Accounting Directive 2013/34) and Canada (the Extractive Sector Transparency Measures Act), continue to advance their legislative agendas in this area.
Corporate tax payments —a lack of trust.
With governments across the world looking to repair their balance sheets through higher taxes and reduced expenditures, there is rising community concern that large multi-national companies (MNCs) are inappropriately shifting profits to low tax jurisdictions offshore, with the primary goal of reducing their corporate tax contribution in the locations in which they operate. In response, finance ministers of the G20 approved the OECD to implement a 15-point Action Plan on Base Erosion and Profit Shifting (BEPS). The aim of BEPS is to tackle “multi-national tax avoidance” through increased transparency, tighter restrictions on use of cross-border tax planning and measures to limit the ability of companies to earn “stateless income.”
While much of the public debate has focused around the corporate tax planning structures and activity of companies in the technology industry (and other industries with highly mobile intellectual property assets), the BEPS measures will affect all industries, including mining.
The immediate impact of the BEPS project for global mining companies will include an increased focus by tax authorities on tax planning through the use of debt and making investments via intermediate treaty jurisdictions, as well as higher mandatory disclosure (to tax authorities) of the extent to which profits are earned in locations other than where extractive activity is carried out. Because each country will need to implement BEPS recommendations at a local level, there is also a risk of “double taxation” unless countries effectively co-ordinate their (multilateral and bi-lateral) response.
Despite improvements in transparency, governments continue to pressure mining companies with additional mining taxes and royalties enacted or proposed in 2014, including Mexico and Zambia. Although not uniform across commodities, trends worldwide indicate that more, rather than less, taxes and royalties are on the horizon.

Mine 2015
29 Review of global trends in the mining industry
How are companies responding?
Through current transparency disclosures about tax burdens, mining companies in the NGO spotlight aim to demonstrate they pay more than their fair share of tax to all levels of government in the countries in which they operate.
The effective tax rate (ETR) of the Top 40 for 2014 was 35%, compared to 59% in 2013. The higher effective tax rate in 2013 is mostly related to the substantial impairment charges taken and the large catch-up tax payment made by Vale. When adjusted for impairment charges, the 2013 number is a more aligned with the 2014 impairment-adjusted ETR for the Top 40, or 25%, versus 28% in 2013. The Top 40 paid $23 billion in income taxes in 2014, compared to $31 billion in 2013.
Not all companies provide detailed public disclosures of tax payments. Of the top 5 that provided detail, total government payments (made up of corporate income tax, government royalties, licence fees, permitting fees, property taxes, employment taxes, sales taxes, stamp duties, and any other required payments) were $29 billion compared to $9 billion disclosed as income taxes paid (2013: $14 billion), demonstrating the increasingly high volume of non-income based taxes paid by the Top 40.
Because the corporate tax debate has played out largely in the media (through high profile public inquiries), it can present a picture of global MNC’s (particularly in high-taxed industries like mining) that does not take into account all factors. Rather than engaging publicly in relation to their tax affairs - including making the observation (often forgotten) that countries compete against each other for mining investment through their taxation policy - many companies have adopted a passive approach.
Our observation is that companies need to increase their engagement in this space and not be fearful of the “politics of tax.” In our view, beyond the required minimalist disclosure, there is a broad and satisfying narrative on the sustainable, long-term benefits that mining investment creates in communities, and how those benefits are shared among employees of the company, its shareholders, the government, and the community at large.
Top 5 reporting companies - income taxes paid and total government payments
Other government paymentsIncome tax
Source: PwC analysis
26 Billion
14Billion
2013
29 Billion
9Billion
2014

30 The gloves are off
Mine 2015
4. Copper production
Copper is the largest revenue contributor to the Top 40, reflecting its key role in the global economy. Copper started the year at around $3.40/lb and ended it at a low for the period of just under $2.90/lb. Despite the price drop driven by a supply surplus and weaker demand, world mine production increased 1%. That number was lower than expected due to lower grades at existing mines and slower production growth, as fewer operations ramped up than had been anticipated. There have also been supply disruptions as a result of geopolitical, technical or environmental factors at operations worldwide.
Copper production across the Top 40 was flat in 2014. Strong results from Glencore’s mines in Africa and the ramp up of Rio Tinto’s Oyu Tolgoi mine, which doubled its production in the period, were offset by reduced output from Freeport’s operations in Indonesia due to export restrictions and labour-related issues.
Global copper production
Based on 2015 US Geological Survey Data, the growth in copper mine production in 2014 was estimated at 2.6%, much lower than the prior year’s growth rate of 8.1%.
Growth was strongest in the Congo (13.4%) while Indonesia suffered the biggest production decline (21%).
Chile remains the largest producer at 5.8 million tonnes in 2014, which accounts for more than 30% of global copper production. There was no notable production growth reported for Chile in 2014. Production was stagnant due to declining grades, which has forced companies to mine more tonnes and increase processing capacity just to maintain current production levels.
“Productivity is a great challenge for the mining industry in Chile. This is not just an issue for the copper industry, but for the country, it affects the whole economy. Investments to improve extraction capacity and processing have helped to compensate, but have not been enough” – Diego Hernandez, Antofagasta Plc CEO
The International Copper Study Group (ICSG) forecasts for 2015 and 2016 indicate that world refined copper production is expected to exceed apparent refined copper demand by 364,000 tonnes and 228,000 tonnes, respectively. However, world mine copper production is expected to increase by around 5% in both 2015 and 2016, to 19.5 million tonnes and 20.5 million tonnes, respectively. This reflects
Global copper production
2013A 2014F2012A
Source: US Geological Survey
0
1,000
2,000
3,000
4,000
5,000
6,000Oth
ers
Zam
bia
Russia
Polan
d
Peru
Mex
ico
Kazak
hsta
n
Indo
nesia
Congo
China
Chile
Canad
a
Aust
ralia
Unite
d St
ates

31 Review of global trends in the mining industry
Mine 2015
expansions at existing operations, a ramp-up in production from mines that have recently come on stream and output from a few new mine projects (the largest of which are the Las Bambas project in Peru and the Sentinel project in Zambia)
The ICSG forecast for a copper surplus account for just 2% of supply in 2015 and 1% in 2016, which isn’t very significant. That could easily turn into deficit should planned world copper production not materialise due to factors such as unexpected events caused by severe weather, labour unrest or technical issues, all of which are fairly commonplace.
In South America, lower copper prices have led to a drop in new project investments. For example, Peru, one of the largest copper producers in South America, saw mining investments fall 12.3% in 2014, according to the Peruvian National Society of Mining, Oil and Gas, and Energy. Many projects have also been delayed for various reasons, including a switch in strategy by the majors to focusing on their core assets, a complex permitting process, as well as environmental and social challenges. That said, Peru has climbed seven positions in the list of best countries for mining investment, based on the latest global mining study from the Fraser Institute.
Copper is a widely used metal, in everything from cars to electricity transmission, and will continue to be needed to make the goods that the world’s growing population can’t live without. The growth rate of urbanisation in China is not what it once was, but copper prices haven’t been punished like other commodities, due to a slower pace of production at mines around the world. That suggests some long-term potential for the copper industry, especially if emerging countries industrialise at a faster pace. Still, there’s a growing concern over stability of supply over the medium and long-term. Deteriorating deposit quality, labour unrest and increased government intervention in several countries can have a significant impact on supply.
At current copper prices, many miners are showing little appetite for starting new projects. However, in December 2014, Codelco, the world’s largest copper producer, announced that its board had approved a $3.3-billion investment to develop the Chuquicamata underground mine, a record amount allocated by Codelco, in addition to $894 million already spent. The company has an additional $22-billion investment plan approved for the next five years. In Peru, growth in copper production of 10.2% for 2015 was forecasted by the Peruvian Central Reserve Bank, which is expected to come from projects such as Constancia, Las Bambas, and the expansion of Cerro Verde.
With uncertainty over whether commodity prices will improve, it is difficult to predict whether a supply deficit will actually materialise. Strong demand growth is not expected in the short term and there are rumours that China has made significant copper purchases in the last year, which may have protected prices. Many copper miners are in the stand-by mode, waiting for prices to improve before making a decision to invest in new projects. As Glencore notes with copper, “the consensus surplus” has so far been elusive.
Copper Market Forecast 2015–2016 (1,000 tonnes)
Refined Production Refined UsageMine Production
Source: International Copper Study Group
0
5,000
10,000
15,000
20,000
25,000
30,000
20162015 2014
“ There is a supply story attached to copper that is different from other commodities and it’s that limitation to copper supply that drives my long-term optimism …. There is no shale copper” – Javier Targhetta, Freeport McMoRan’s SVP Marketing & Sales

32 The gloves are off
Mine 2015
5. Governments entering the ring
In recent years, the mining industry has seen an increasing trend of governments looking to maximise returns from their national resources through different strategies to extract a greater share of the value from mining operations. These strategies include, but are not limited to, increasing taxes and royalties, requiring in-country processing or beneficiation prior to export, imposing export restrictions and increasing export levies on unrefined ores, and restricting foreign ownership. Given the negative impact lower commodity prices are having on the industry, and in turn the revenues it pays to governments, it will be interesting to see whether there will be a softer stance in future around resource nationalism and domestic protectionism.
Aggressive resource nationalism policies by governments often make those countries less attractive for mining investment. Some countries appear to understand this better than others, and are changing regulations to attract mining investment. Others are implementing measures to protect domestic industries and production, while at the same time trying not to limit appeal to foreign investment. Either way, governments are entering the ring to ensure that mining revenues continue to support their local economies.
Below are some examples of domestic protectionism around the world, further demonstrating the growing risk miners face:
• Chile has rigorously enforced environmental legislation over the last two years. In 2013, Barrick suspended development of the Pascua-Lama project, due to the outstanding resolution of various environmental and regulatory hurdles. In April 2015, Chile’s Environmental Court ruled in favour of Barrick, rejecting environmental damage claims in the longstanding dispute over the Pascua-Lama project. This decision appears to be a major positive development in the debate on one of the world’s largest undeveloped gold deposits.
• Zambia: The country introduced major changes to taxes applicable to miners. They include: royalty rates on open-pit mining being increased to 20% from 6%; an increase to 8% from 6% for underground mining; a
new a 30% corporate processing and smelting tax and 30% tax for tolling income. Following changes in the Zambian mining tax regime effective in 2015, Barrick reported that (along with lower estimated long-term copper prices compared to the year ago estimates), the increased royalty created an unsustainable level of taxation for the Lumwana operation. Barrick announced its plan to suspend operations at the copper mine in the second quarter 2015. In April 2015, the Zambian government introduced amendments to the mining tax regime, reducing the gross royalty on open pit mines from 20% to 9% along with the reintroduction of a 30% corporate income tax and a 15% variable profits tax. In response, Barrick reported that these amendments would enable Lumwana to remain free cash flow positive and announced its plan to continue operations at Lumwana. Copper accounts for more than 70% of Zambia’s foreign revenue earnings.
• Indonesia: The country introduced a ban on export of unprocessed mineral ore, effective January 2014, in an effort to increase domestic processing capacity and the value-add from the minerals sector. Production of bauxite fell in 2014 to less than one million tonnes, compared to 55.7 million tonnes in 2013. Indonesian Energy and Mineral Resources Ministry officials have recently affirmed relaxing the mineral export ban. In 2014, Freeport-McMoRan and the Indonesian government started negotiations over amending its contract of work, which enabled the resumption of copper concentrate exports in August 2014, albeit subject to a new export levy.
• Mongolia: The Rio Tinto joint venture Oyu Tolgoi underground development project was halted by negotiations with the government on outstanding shareholder matters and project financing for the last two years. A new prime minister took office in November and it was recently reported that the two sides have “reached agreement, in principle, on the main points of dispute.”

33 Review of global trends in the mining industry
Mine 2015
Some governments appear to be supportive, or not as hostile as they used to be
In September 2014, the Australian government repealed its Minerals Resource Rent Tax (MRRT), a 22.5% mining profits tax on coal and iron ore. The repeal of the MRRT is in stark contrast to the environment which existed in May 2010 when (without warning to the industry) the tax was initially proposed as a “Resource Super Profits Tax” with a higher tax rate of 40%, and to a broader range of commodities.
Prior to that, in July 2014, the Australian government repealed the carbon tax. Further support in Australia is evident in royalty relief offered in Western Australia to junior iron ore miners grappling with falling prices and the limited Exploration Development Incentive (EDI) program as part of the 2014- 2015 federal budget. The EDI will allocate A$100 million over the next three years to allow investors in early stage exploration projects to receive tax breaks for expenditures. Such expenditures were previously held as a tax loss for individual companies, and could only be claimed once adequate revenue had been generated, a great difficulty for junior explorers.
Domestic protectionism – China’s story
China’s demand for commodities remains a key driver for global miners. While growth has slowed in the world’s second-largest economy, its rate is still higher than other major economies in the world, and off an ever-increasing base. China is still just part way through its aggressive plans of industrialisation and urbanisation, where a fair amount of additional infrastructure and real estate will still need to be added.
The Chinese government is also eager to expand China’s influence in Asia, as well as in the world, which can be seen from the creative plans around developing the Silk Road Economic Belt, the 21st Century Maritime Silk Road, and the creation of the Asian Infrastructure Investment Bank with $100 billion in capital.
When looking at these factors, there still appears to be strong long-term fundamentals to support increased demand for commodities, which should benefit prices down the track. That said, enthusiasm should be tempered given that heavy current investment in infrastructure will make domestic sourcing to meet higher demand, more readily available. Also, that supply is available currently and the new sources of demand may be years away.
In 2014, China responded to calls for support from the country’s domestic miners, many of which are seeing widespread losses due to oversupply of coal. The China National Coal Association sent a proposal to the government calling for imports of low-quality coal with ash and sulphur content exceeding 15% and 0.6%, respectively, to be halted. The association’s rationale is to try to cut total imports by about 10% to restore balance in the domestic market.
In response to this proposal and in a bid to tackle air pollution, China announced new regulations to ban the import and local sale of coal with high ash and sulphur content, starting in 2015. China has also recently cut the resources tax it charges its iron ore miners in an effort to support an industry struggling under an onslaught of cheaper and better-quality ore from Australia and Brazil. The resources tax on iron ore, which is a percentage of value rather than a flat rate, will be lowered to 40% of its original level starting May 2015.

34 The gloves are off
Mine 2015
6. Equipment & people productivity – sustainable lower operating costs
Following more than two years of depressed metal and mineral prices, a common battle cry from the boardroom to the corner office in 2014 was, “cut costs.” Many companies have implemented cross-functional aggressive cost cutting measures, often over multiple years. Strategies ranged from staff layoffs, to delaying capital projects, divestiture of non-core assets, and operational improvements.
In 2014, we saw operating expenses for the Top 40 decline 5%, compared to 2013. Cost reduction is a positive story for the industry, but was partly due to external factors, such as exchange rate fluctuations and the dramatic drop in crude oil prices.
With the low hanging fruit already picked, miners need to do more to achieve systematic and sustainable cost reductions by focusing on the core operational productivity improvement aspects. The three key levers available to miners for improving productivity through improving equipment efficiency are:
1. Mine operating strategy
a. Volume strategy: Favoured during periods of high commodity prices and often leads to lower truck performance as the focus shifts to loader performance; and
b. Cost strategy: Focus on cost control often relates to higher truck utilisation and lower loader utilisation.
2. Data: Data recording, management and analysis to drive decision-making and bring about change. This technique is already embraced in many sectors but still limited in mining sector.
3. People: This is most critical given that full potential of mine strategy and sound data management systems can’t be achieved if the mining company lacks either the right people and skills
Most companies measure their labour productivity, although an integrated approach to operations, data and people is
often ignored. For the integrated approach, the key is to measure and analyse data at an operational level for each major piece of equipment. A more detailed understanding of productivity in mining, based on operational level, has been made possible by data collected by PwC’s Mining Intelligence & Benchmarking practice. According to the PwC database, the global mining industry’s open cut equipment productivity (i.e. annual output/capacity of input) has declined approximately 20% over the past seven years despite a push for increased output and declining market conditions. The equipment performance data reveals that company-wide equipment performance for many global miners sit in the second and third quartiles, with wide variation in performance among their own mines.
Based on the operational performance of various pieces of mining equipment, PwC has developed the Open Cut Mining Equipment Productivity Index (MEPI). MEPI suggest that efficiency of mining equipment has declined across the sector from its peak in 2006. However, the decline in productivity is not same across all regions, with Australia’s mining equipment productivity underperforming other regions with the exception of Africa. The continuous decline in productivity emphasizes a need of a mind-set shift in the way operations are managed to achieve the goal of sustainable cost reduction and efficiency improvement.
Administrative • Headquarter overhead reductions• Strengthening US dollar
Capital • Delaying capital projects• Divesting non-core assets
Supply Chain • Input cost reductions• Maintenance cost reductions
Exploration • Reductions for low-margin projects• Reduced asset latency times
Operational • Improved effeciency and re-handling• Divesting low-margin assets

35 Review of global trends in the mining industry
Mine 2015
Creating a sustainable model provides economic stability in low price environments and becomes a strong foundation for profit growth when the market rebounds. The PwC approach uses a rapid business evaluation to define a sustainable business model and improvement approach that focuses on long-term sustainable growth, focusing on current performance, capability set, the market landscape, and strategy, size and scale, to identify targeted value levers, required integration levels, and capital structure & deployment.
PwC's Mining Equipment Productivity Index by region (MEPI)
2003 200620052004 2007 2008 2009 2010 2011 2012 2013
Source: PwC Analysis
70.000
80.000
90.000
100.000
110.000
120.000
130.000
140.000
South America North America Asia Africa Australia

36 The gloves are off
Mine 2015
7. Out for the count? – availability of capital
Access to new capital proved more difficult in 2014; investors diverted away from the mining sector
Until very recently, the deployment of capital by the Top 40 has focused on increasing production to satisfy burgeoning demand in BRICS markets. As the growth rate in these economies slows, the Top 40 is now turning to capital markets to refinance previous developments and to further invest in existing operations to improve competitiveness and decrease production costs.
Traditional sources of capital are exiting the sector, as stakeholders lose confidence in the ability of miners to deliver adequate returns. The investment environment is poised for alternative capital providers to fill the void left by traditional sources. This includes non-traditional private capital backed by patient institutional investors, and supported by experienced mining executives who are empowered and incentivised to create value through the cycle and capitalise on counter-cyclical buying opportunities.
Top 40 TSR Performance, S&P500 Total Return Index
(50%)
(30%)
(10%)
10%
30%
50%
70%
90%
Jan 2015Jul 2014Jan 2014Jul 2013Jan 2013Jul 2012Jan 2012Jul 2011Jan 2011
S&P500 Index (Total Retum) Top 40 TSR Index
Source: S&P Capital IQ
Since 2011, the Top 40 has underperformed the S&P 500 in total shareholder returns by a differential of over 100%

37 Review of global trends in the mining industry
Mine 2015
The value of new equity raised has steadily decreased since 2008, falling to $14.8 billion in 2014. While the volume of raises has been more consistent (961 in 2014), the average value per raise has decreased as a greater proportion of equity issues were done by issuers with limited alternatives, accessing markets as a last resort on a dilutive basis. This is evidenced by the increased proportion of proceeds allocated to refinancing debt, to 21% in 2014, versus 8% over the past 8 years.
From a Top 40 perspective, Saudi Arabian Mining Company to successfully accessed the equity markets, raising $1.5 billion in equity as a part of a larger financing package to fund project construction.
Secondary offerings volume and proceeds (2007–2014)
0,000
20,000
40,000
60,000
80,000
100,000
-
200
400
600
800
1,000
1,200
20142013201220112010200920082007
Pro
ceed
s U
S$m
Volu
me
Proceeds Number
Source: Thomson Reuters

38 The gloves are off
Mine 2015
Debt markets have shown a similar trend since 2012, as investment in major projects was curtailed. In 2014, there were 86 bond issues for $45.3 billion of new debt across the entire mining industry, with 8 of the Top 40 announcing over $15 billion in bond issues. All of the Top 40 issues were used to refinance existing debt or to provide working capital.
The signal from investors is clear: They will be very selective with providing new capital. Miners will need to adjust by allocating capital to projects with acceptable rates of return.
“Our pipeline of development projects has an expected average rate of return in excess of 20 per cent and we will continue to test all investment decisions against challenging criteria” – Andrew Mackenzie, BHP Billiton CEO
There is a large amount of dedicated capital available from alternate sources for a limited number of high-quality, longer-term opportunities
Interest from end users and trading houses well leveraged to customers in BRICS markets will continue as mid-stage commodities are sought to underpin their business models.
Capital in Sovereign Wealth Funds has grown at a compound annual rate of 12% since 2009 to amass $6.3 trillion globally. By sheer volume of availability, we anticipate these funds to increasingly invest in the sector. Of particular interest is the growth in dedicated funds available via non-traditional private equity with an estimated $12 billion
of funds raised in specific mining-only funds or investment vehicles.
Outside of the Top 40, we believe that smaller mining focused private equity funds will play a greater role in providing capital to smaller to mid-sized players who are facing difficulty accessing traditional capital markets.
What do we expect from these alternative sources of capital?
Mining private equity funds have been designed and structured to capitalise on counter-cyclical buying opportunities by leveraging mining expertise.
Patient, sophisticated investors that are focused on higher risk adjusted returns over a longer-term investment horizon of 5-to-10 years back them. This empowers them to make strategic decisions focused on value creation through the cycle.
Debt volume and proceeds (2007–2014)
0,000
50,000
100,000
150,000
200,000
-
50
100
150
200
250
20142013201220112010200920082007
Pro
ceed
s U
S$m
Volu
me
Loan proceedsBond proceeds Number
Source: Thomson Reuters

39 Review of global trends in the mining industry
Mine 2015
The key to unlocking this over the long term is in the hands of an increasing number of experienced mining executives who have partnered with major private equity firms. These executives understand the complex risks and operational challenges associated with the mining industry and are expertly aligned and incentivised to the interests of their financial partners.
Country Attractiveness
“Where Not to Invest” by Behre Dolbear produces a ranking of Countries for Mining Investment: based on relevant factors to risks specific to the mining industry in the countries, such as economic and political system, the degree of social issues affecting mining in the country, the delays in receiving permits due to bureaucratic and other issues, corruption, currency stability, and tax policy competitiveness.
Last year rankings show Canada, Australia, and the United States in the top three places where to invest. Then comes four Latin American countries (Chile, Mexico, Brazil, and Peru), and three African economies in the 8th to 10th places (Botswana, Namibia, and Ghana). The list includes another 15 countries, with Russia and the DRC at the bottom.
The Fraser Institute, which publishes an Investment Attractiveness Index considering both mineral and policy perception, presents similar findings for these countries.
Of particular interest to private equity will be the asset portfolios that are being carved out of the Top 40, typically in an auction style processes. This is pertinent given the ability for private capital to perform due diligence and deploy capital quickly.
The Top 40 has recently completed divestments, but a number of assets remain for sale. The available buyers are financially astute and will not pay a price for an asset that does not allow them to deliver the requisite internal rate of return.
As commodity prices continue to languish, and the number of potential strategic buyers decreases, so will the value expectations of sellers. Current conditions could be the catalyst for deployment of significant private equity in the next 12-to-18 months.
What assets are likely to attract capital?
“If we take a view that a commodity has a future price, we need to be certain that our operating costs are well below this future price”
“The best hedge against price volatility is to have low operating costs, to ensure we occupy the lowest position in the cost curve so that we’re successful in any price environment” — Peter Kukielski, Warburg Pincus

40 The gloves are off
Mine 2015
8. 10-year trends, 2005–2014
10 year trends
$ billion 2014 2013 2012 2011 2010 2009 2008 2007 2006 2005
Aggregate market capitalisation 791 947 1,234 1,202 1,605 1,259 563 1,481 962 791
Aggregated income statement
Revenue 453 482 525 539 435 325 349 312 249 222
Operating expenses (531) (561) (340) (311) (246) (217) (208) (176) (141) (141)
EBITDA 159 167 185 228 189 108 141 136 108 81
Amortisation, depreciation and impair-ment
(75) (100) (86) (42) (34) (31) (57) (19) (12) (16)
PBIT 84 67 99 186 155 77 84 117 96 65
Net finance cost (15) (16) (6) (6) (7) (6) (6) (5) (3) (4)
PBT 69 51 93 180 148 71 78 112 93 61
Income tax expense (24) (30) (25) (48) (38) (22) (21) (32) (27) (16)
Net profit 45 21 66 132 110 49 57 80 66 45
Adjusted net profit excl. Impairment
72 79 111 147 112 60 88 82 66 45
Year on year increase/ (decrease) in revenue
(6%) (8%) (3%) 24% 34% (7%) 12% 25% 12% 21%
Year on year increase/ (decrease) in EBITDA
(5%) (10%) (19%) 21% 75% (23%) 4% 26% 33% 47%
Year on year increase/ (decrease) in net profit
120% (68%) (49%) 20% 124% (14%) (29%) 21% 47% 61%
EBITDA margin 23% 35% 35% 42% 43% 33% 40% 44% 43% 36%
Aggregated cash flow statement
Operating activities 127 126 137 174 137 83 104 95 77 58
Investing activities (93) (125) (169) (142) (79) (74) (102) (126) (67) (38)
Financing activities (31) (5 21 (28) (35) 10 14 36 4 (11)
Free cash flow 24 (3) 11 76 70 19 38 44 40 27
Aggregated balance sheet
Property, plant and equipment 745 738 701 601 511 467 402 371 262 224
Other assets 486 507 544 538 432 334 274 284 192 148
Total assets 1,231 1,245 1,245 1,139 943 801 676 655 454 372
Total liabilities 629 623 563 482 387 354 339 329 217 178
Total equity 602 622 682 657 556 447 337 326 237 194
Note: All income statement data presented excludes Glencore marketing and trading revenue and costs
The information included below includes the aggregated results of the Top 40 mining companies as reported in each respective edition of Mine, except for 2013, which uses the current years’ Top 40’s financial comparative financial results.

41 Review of global trends in the mining industry
Mine 2015
EBITDA margin EBITDA/revenue
Adjusted net profit Net profit excluding impairments
Capital employed Property plant and equipment plus current assets less current liabilities
Capital expenditure Purchases of property, plant and equipment
Capital velocity Ratio of capital expenditure to capital employed
CEO Chief Executive Officer
Cash to cash cycle Days inventory outstanding plus days sales outstanding less days payables outstanding
Current ratio Current assets/current liabilities
Dividend coverage earnings per share/dividends per share
Dividend pay-out ratio Dividends paid/adjusted net profit
Dividend yield Dividends paid/market capitalization
EBIT Earnings before interest and tax
EBITDA Earnings before interest, tax, depreciation, amortisation, and impairments
EBITDA margin EBITDA/revenue
ETF Exchange-Traded Fund
ETR Effective tax rate
Free cash flow Operating cash flows less investment in property, plant and equipment
GDP The monetary value of all the finished goods and services produced within a country’s borders
Gearing ratio Net borrowings/equity
IMF International Monetary Fund
Iron ore majors Collectively BHP Billiton, Rio Tinto, and Vale
M&A Mergers and Acquisitions
Market capitalisation The market value of the equity of a company, calculated as the share price multiplied by the number of shares outstanding
MEPI Mining Equipment Productivity Index
MNC Multinational corporation
Mt/a Metric tonnes per annum
Net assets Total assets less total liabilities
Net assets ratio Total assets/total liabilities
Net borrowings Borrowings less cash
Net profit margin Net profit/revenue
NPV Net present value
Oz Troy ounce
PBIT Profit before interest and tax
PBT Profit before tax
Price-to-earnings ratio (PE ratio)
Market value per share/earnings per share
Quick ratio (Current assets less inventory)/current liabilities
R&D Research and development
Return on capital employed (ROCE)
Net profit excluding impairment/property, plant and equipment plus current assets less current liabilities
Return on equity (ROE) Net profit/equity
Top 10 BHP Billiton, Rio Tinto, China Shenhua, Glencore, Vale, Coal India, Potash Corp, Anglo American, Freeport-McMoRan, and Grupo México
Top 40 40 of the world’s largest mining companies by market capitalisation as of 31 December 2014
Top 5 diversifieds BHP Billiton, Rio Tinto, Glencore, Anglo American, and Vale
Working capital Current assets less current liabilities
9. Glossary

42 The gloves are off
Mine 2015
10. Top 40 companies analysed
NameCountry (**)
OECD(O)/BRICS(B)
Year-end 2014 Ranking 2013 Ranking
BHP Billiton Plc/BHP Billiton Limited UK/Australia O 30-Jun 1 1
Rio Tinto plc/Rio Tinto Limited UK/Australia O 31-Dec 2 2
China Shenhua Energy Company Limited China/Hong Kong B 31-Dec 3 5
Glencore plc UK O 31-Dec 4 4
Vale S.A. Brazil B 31-Dec 5 3
Coal India Limited India B 31-Mar 6 8
Potash Corp. of Saskatchewan, Inc. Canada O 31-Dec 7 9
Anglo American plc UK O 31-Dec 8 7
Freeport-McMoRan Copper & Gold Inc. United States O 31-Dec 9 6
Grupo México S.A.B. de CV Mexico O 31-Dec 10 11
MMC Norilsk Nickel Russia B 31-Dec 11 10
The Mosaic Company United States O 31-Dec 12 13
Goldcorp Inc. Canada O 31-Dec 13 14
China Coal Energy Company Limited China/Hong Kong B 31-Dec 14 23
Barrick Gold Corporation Canada O 31-Dec 15 12
Antofagasta plc UK O 31-Dec 16 18
Zijin Mining Group Co. Ltd China/Hong Kong B 31-Dec 17 32
Inner Mongolia Yitai Coal Company Limited China/Hong Kong B 31-Dec 18 25
Saudi Arabian Mining Company (Ma’aden) Saudi Arabia B 31-Dec 19 28
Newmont Mining Corporation United States O 31-Dec 20 19
NMDC Limited India B 31-Mar 21 24
Polyus Gold International Limited UK O 31-Dec 22 21
First Quantum Minerals Limited Canada O 31-Dec 23 20
Jiangxi Copper Company Limited China/Hong Kong B 31-Dec 24 31
Sumitomo Metal Mining Company Japan O 31-Mar 25 33
Yanzhou Coal Mining Company Limited China/Hong Kong B 31-Dec 26 34
Teck Resources Limited Canada O 31-Dec 27 16
Consol Energy Incorporated United States O 31-Dec 28 26
Industrias Penoles S.A.B. de CV Mexico O 31-Dec 29 22
ALROSA Russia B 31-Dec 30 29
Fortescue Metals Group Limited Australia O 30-Jun 31 15
Newcrest Mining Limited Australia O 30-Jun 32 37
Cameco Corporation Canada O 31-Dec 33 27
Randgold Resources UK O 31-Dec 34 35
KGHM Polska Miedz Spolka Akcyjna Poland B 31-Dec 35 30
Uralkali Russia B 31-Dec 36 17
Agnico-Eagle Mines Ltd. *** Canada O 31-Dec 37 38
Zhongjin Gold Corp., Ltd. *** China B 31-Dec 38 39
Shandong Gold Mining Co., Ltd. *** China B 31-Dec 39 40
China Northern Rare Earth (Group) High-Tech Co., Ltd *
China B 31-Dec 40 36
(*) 2014 name change from Inner Mongolia Baotou Steel Rare-Earth Hi-Tech Co. Limited in last year’s Mine(**) Refers to the country of primary listing where shares are publicly traded(***) Refers to companies which were not included in the 2013 analysis

43 Review of global trends in the mining industry
Mine 2015
11. Explanatory notes for aggregated financial information
We have analysed 40 of the largest listed mining companies by market capitalisation. Our analysis includes major companies in all parts of the world whose primary business is assessed to be mining. The results aggregated in this report have been sourced from the latest publicly available information, primarily annual reports and financial reports available to shareholders.
Where 2014 information was unavailable at the time of data collation, these companies have been excluded. Companies have different year-ends and report under different accounting regimes, including International Financial Reporting Standards (IFRS), United States Generally Accepted Accounting Principles (US GAAP), and others.
Information has been aggregated for the financial years of individual companies and no adjustments have been made to take into account different reporting requirements and year-ends. As such, the financial information shown for 2014 covers reporting periods from 1 April 2013 to 31 December 2014, with each company’s results included for the 12-month financial reporting period that falls within this period. All figures in this publication are reported in US Dollars, except when specifically stated. The results of companies that report in currencies other than the US Dollar have been translated at the closing US Dollar exchange rate for the respective year.
Some diversifieds undertake part of their activities outside the mining industry, such as the oil and gas businesses of BHP Billiton, Consol Energy and Freeport-McMoRan, parts of the Rio Tinto aluminium business, and Glencore’s marketing and trading revenues and costs. No attempt has been made to exclude such non-mining activities from the aggregated financial information, except where noted.
Entities that are controlled by others in the Top 40 and consolidated into their results have been excluded, even when minority stakes are listed.
Financial Reporting
2 April 2013–31 December 2014
The financial information shown for 2014 covers reporting periods from 1 April 2013 to 31 December 2014, with each company’s results included fro the 12-month financial
reporting that falls within this period.

44 The gloves are off
Mine 2015
12. Contacting PwC
Global Mining Leadership TeamGlobal Mining Leader & Canada John Gravelle, Toronto +1 (416) 869 8727 john. [email protected]
Africa Michal Kotze, Johannesburg +27 11 797 4603 [email protected]
India Kameswara Rao, Hyderabad +91 40 4424 6688 [email protected]
Indonesia Sacha Winzenried, Jakarta +62 21 5289 0968 [email protected]
Australia Jock O’Callaghan, Melbourne +61 3 8603 6137 [email protected]
Latin American Mining Leader Jim Moraga +51 (1) 211-6500 x 2080 [email protected]
Peru Alfredo Remy, Lima +51 1 211 6500 [email protected]
Brazil Ronaldo Valino, Rio de Janeiro +55 21 3232 6139 [email protected]
Central and Eastern Europe Evgeny Orlovskiy, Moscow +7 495 223 51 76 [email protected]
United Kingdom Jason Burkitt, London +44 20 7213 2515 [email protected]
United States Stuart Absolom, Denver +1 720 931 7246 [email protected]
China Ken Su, Beijing +86 10 6533 7290 [email protected]
Marketing Manager Amy Hogan +1 857 260 4547 [email protected]
Functional Mining Leadership TeamAdvisory Calum Semple +1 (416) 815 5325 [email protected]
Deals Wim Blom +61 (7) 3257 5236 [email protected]
Tax James Strong +61 (3) 8603 6599 [email protected]
Assurance Jason Burkitt, London +44 20 7213 2515 [email protected]
For a deeper discussion, please contact one of our regional leaders or your local PwC partner:

45 Review of global trends in the mining industry
Mine 2015
Alex Walker, Australia (1) Kevin Cheung, Canada (6) Carlos Lobaton, Peru (2) Pukhraj Sethiya, India (7) Dedy Lesmana, Indonesia (3) Rebecca Allerman, United States (8) Fabio Buckeridge, United Kingdom (4) Salavat Kalibekov, Kazakhstan (9)
James Terry, United States (5) Wayne Smith, South Africa (10)
The following individuals provided help and support from abroad: Prince Adufutse, Ghana Xin Liang, China
Key contributors to Mine.
106
8
1
9 7
2
3
45

46 The gloves are off
Mine 2015
13. Other PwC mining publications
Our commitment to the industry goes beyond our services. As industry leaders, we are globally recognised for our broad knowledge of the mining industry and the laws that govern it. Set out on this page is examples of recent mining thought leadership publications.
January 2015
Miners adjust to volatile commodity markets
This report explores what leaders in the industry expect in the years ahead, and looks at what producers are doing now to keep costs down and ensure future growth and profitability
Contact: John Gravelle, Toronto T : +1 416 869 8727 E : [email protected]
March 2014
Being strategic in resources: JVs remain key
JVs allow companies to share capital investment and project risk and can act to fill an exploration gap in a company’s business strategy.
Contact: John Gravelle, Toronto T : +1 416 869 8727 E : [email protected]
September 2014
Trends in M&A: China outbound deals: 2014 first-half update
The strong growth in China’s outbound mergers and acquisitions anticipated at the end of last year has emerged, with $32.1bn worth of deals announced in the first six months of 2014, up 40% on the previous half.
Contact: Jock O’Callaghan T : +61 (3) 8603 3183 E : [email protected]
August 2014
Mining for Efficiency
With the evolution of new technology and mining methods, combined with projects of ever increasing scale, one might have reasonably expected productivity in the Australian mining sector to have increased over time. But for a range of reasons, at an industry wide level, the reverse has actually been the case.
Contact: Jock O’Callaghan T : +61 (3) 8603 3183 E : [email protected]
November 2013
Financial reporting in the mining industry (FRIM)
Our 2013 edition of FRIM looks at how IFRS is applied in practice by mining companies, identifying unique issues for the industry, and highlighting key differences from US GAAP.
Contact: Jason Burkitt, London T : +44 20 7213 2515 E : [email protected]

47 Review of global trends in the mining industry
Mine 2015
Regional Mine Publications Besides the Global Mine publication, PwC prepares a number of regional mine publications which focus on analysis of trends in the mining industry in particular regions.
2015
Mining in Québec: the post-election outlook
The sector employs over 15,000 people directly and probably the same again indirectly. Some communities exist only because of mining or processing. In 2013, the value of Québec’s mine production was more than C$8 billion, which was close to 20% of the total for Canada.
Contact: Nochane Rousseau, Québec T : 1 514 205 5199 E : [email protected]
November 2014
Aussie Mine 2014: Standing out from the crowd
This report provides an industry and financial analysis of the largest 50 mining companies listed on the Australian Securities Exchange (ASX) with a market capitalisation of less than $5 billion at 30 June 2014 (the mid-tier 50)
Contact: Jock O’Callaghan T : 61 (3) 8603 3183 E : [email protected]
October 2014
Junior Mine 2014:Waiting out uncertainty
The junior mine sector continues in survival mode, but we’re starting to see signs that the worst may be over. Our eighth annual Junior Mine Report looks at the top 100 mining companies by market capitalisation on the TSX Venture Exchange (TSXV).
Contact: John Gravelle, Toronto T : +1 416 869 8727 E : [email protected]
November 2014
SA Mine: Highlighting trends in the South African mining industry
This is the sixth in our series of annual publications highlighting trends in the South African mining industry. The 2014 financial year was again marred by labour unrest. In addition, local cost pressures and international demand weakness resulted in shrinking margins and wide ranging impairment provisions.
Contact: Hein Boegman T : +27 (11) 797 4335 E : [email protected]

48 The gloves are off
Mine 2015
Integrate a boots on the ground approach
Mine site visitsVisiting your mine is an important part
of managing your business, which means you’re going to want consultants who have first-hand knowledge of what’s going on both from a head office and mine site perspective. That’s why we make it a point to regularly visit your mines. Our Assurance teams have a “boots on the ground” approach, bringing in-person value to mine sites around the world. We would be delighted to schedule a mine site visit, and discuss how you can derive more value from your audit and assurance process.
Strategize with industry leaders
Tax forumsThe ability to brainstorm tax
strategies with your finance peers is invaluable. As a result, we became active contributors to ICMM’s Tax Forum. While this group is made up primarily of Chief Tax Officers from senior mining companies, we would be happy to assemble a similar group in your region - so you too have the opportunity to strategize with your peers and industry influencers.
Refine ideasWhiteboard sessions Cost management and productivity are pressing issues for mining teams around the world. Competing to be the lowest cost producer - while cashing up your balance
sheet – is an intense mandate. Understanding the importance of this, our consultants are working with mining companies to create effective solutions that provide notable
results. We would be pleased to host a whiteboard session with your team to strategize additional ways your company can manage costs and implement solutions.
Proven experience
#1We audit the largest percentage of the Top 40 global mining companies
65%We’ve recently provided consulting services to over 65% of the Top 40 global mining companies
80%We provide tax services to over 80% of the Top 40 global mining companies
Focusing on pleasing investors today, while preparing for tomorrow’s growth is no easy task – especially considering current price volatility and regulatory instability.To help you accomplish this we have put together a global team of consultants who have years of mining experience and a proven track record of adding value. Here are some practical ways we can add value to your company.
Supporting profitable growth
www.pwc.com/mining

49 Review of global trends in the mining industry
Mine 2015

50 The gloves are off
Mine 2015

51 Review of global trends in the mining industry
Mine 2015

pwc.com
© 2015 PricewaterhouseCoopers LLP, a Delaware limited liability partnership. All rights reserved. PwC refers to the United States member firm, and may sometimes refer to the PwC network. Each member firm is a separate legal entity. Please see www.pwc.com/structure for further details. This content is for general information purposes only, and should not be used as a substitute for consultation with professional advisors. 24370 GX E&M Mine