mine 2016, by pwc
DESCRIPTION
Versión en inglés del informe minero de la consultora PwC, dado a conocer a principios de junio de 2016.TRANSCRIPT

Mine 2016Slower, lower, weaker... but not defeated
Review of global trends in the mining industry
ForewordWelcome to PwC’s 13th annual review of global trends in the mining industry – Mine. This analysis is based on the financial performance and position of the global mining industry as represented by the Top 40 mining companies by market capitalisation.
1 PwC’s Mine 2016

Contents
3 Introduction
5 Industry in perspective
25 The Top 40
28 Financial analysis • Income statement • Balance sheet • Cash flow
43 10 year trends
45 Glossary
47 Explanatory notes to the financial analysis
49 Key contributors to Mine
50 Contacting PwC
PwC’s Mine 2016 2

Records tumble 2015 was a race to the bottom with many new records set by the Top 40 mining companies. The Top 40 experienced their first ever collective net loss, their lowest return on capital employed, unprecedented capex containment and the tag team effect of prevailing debt levels plus impairments, sending leverage to new heights. Such records are stark and irrefutable.
There has been no shortage of analysis suggesting that late 2015 marked the bottom of the market. Sporadic rallies in early 2016 built expectations, with many pens poised
to herald a gradual but sustained return to prosperity. However, most aspirations have since been snuffed, dismissed as unfortunate interpretations of increased volatility. Some industry leaders have taken the opportunity to reinforce their expectations of subdued conditions persisting through 2016 and beyond.
Whether 2015 or 2016 marks a turning point remains to be seen, but we maintain the view that these results do not mean the Top 40 are defeated.
Only a few years ago, the Top 40 lived up to Olympic expectations… The Top 40 were faster in their pursuit of production. Rampant Chinese demand led to a fierce race to increase capacity at any cost. Business models were adapted to accommodate short-term decisions and production junkies emerged.
The market climbed higher, reaching dizzying levels. Production records were smashed, and the industry was awash with cash. Big licks of the prize money was then plunged into new projects (and acquisitions), leading to bulging balance sheets, prepared to take on escalating demand.
And the belief was stronger for longer! Higher prices were the expected new norm. China’s demand would continue to strengthen forever and miners were masters of the market.
However, the boom, like all others, had its limits. Many of the Top 40 let their attention stray too long from the marathon of mining and the 2015 scoreboard is telling … slower, lower, weaker.
Slower The Top 40 bulked up when prices were high, but they now face many handicaps to progress. There is now less free cash, a lower appetite for expansion from lenders and shareholders alike and infringements arising from past decisions – these are borne out in the high levels of impairments that have been revealed and will continue to emerge. Whilst falling short of a Mine record , the Top 40 had impairments of
$53 billion in 2015 and have now written-off the equivalent of 32% of capex spent since 2010. It is no wonder that inertia prevails.
The Top 40 are looking to maximise value from shedding assets, and mothballing marginal projects or curtailing capacity. This is further evidenced by a significant drop-off in capex, signalling an almost stagnant investment environment.
Introduction
3 PwC’s Mine 2016

WeakerWhilst there has been an overall reduction in absolute debt balances, leverage is at an all-time high of 46% and cash used to repay debt is broadly equal to cash from borrowings. The result was that the Top 40 are more vulnerable and, in 2015, those miners carrying heavy debt loads were particularly unloved.
In previous years, the Top 40 took advantage of favourable debt markets and locked in longer dated, lower interest debt. What they hadn’t expected was the abrupt evaporation of earnings and, in some instances, this has impacted covenant compliance.
Ratings and, in turn, valuations reflected the increased liquidity risk among the Top 40.
Investors responded by reducing their exposures, whatever the longer-term investment proposition. Monetisation of both core and non-core assets was essential for some, whether executed during the year or not. Disposal programs have been accelerated and alternative financing is more widespread in the Top 40 than ever before.
Thermal coal miners are particularly exposed to challenges beyond traditional market conditions, including shifting social norms and geopolitical pressures. This has led to the declaration by some of a “war on coal” and we note the casualties of former Top 40 stalwarts Peabody and Arch Coal, which sought bankruptcy relief over the past year.
…But not defeatedIt is within the power of the Top 40 to rebuild their investment propositions and rise off the canvas. But if there is one thing that 2015 has shown, it is that the foundation cannot be as dependent on China and no one holds expectations of a sequel to “Mine 2005 - Enter the Dragon.”
Significant restructuring needs to continue and deal volumes are likely to reshape the industry ownership mix and hierarchy in the near future. Costs have already been cut deeply, but need to be demonstrably sustainable at these levels if prices stay depressed. Pressure will rise as attention turns to the next wave of productivity initiatives, which will have longer-term paybacks and require fundamental rethinking of structures, processes, systems, technology, organisational designs and capability needs. This is unchartered territory for the industry, at a time of rapid change in all sectors of the global economy.
A crowd favourite in 2015 emerged in lithium, cheered on by the acceleration of the battery boom. For the first time, a lithium company has made the Top 40. Whilst this must be viewed in the context of the much larger traditional energy sources, there is no doubt that the energy landscape is changing and new world disrupters will have a role to play.
Longer term victors within the Top 40 are harder to place. How might the 2025 edition of Mine reflect on the impact of unrelenting social licence to operate pressures on the Top 40 composition? How might risk tolerances drive higher industry participation from non-traditional sources, or greater government ownership? Runners are lining up, with fresh contenders being nominated from many locations. Or will the old guard remain largely intact, proving there is no substitute for experience? Time will tell. We will explore some of these broader industry disruption themes in more detail over the coming months.
LowerLower demand for bulk commodities, combined with a bleak global outlook and a production hangover, sent commodity prices down. All mining companies, regardless of size or commodity diversification, felt the pinch, with the traditional miners taking the biggest hit.
The market capitalisation of the Top 40 dropped 37% in 2015, a drop disproportionately greater than that in commodities prices. Investors were concerned by liquidity and punished the Top 40 for poor investment and capital management decisions and, in some quarters, for squandering the benefits of the boom.
The almost complete erosion of the gap between the market capitalisations and net book values
demands attention. In an industry where the main asset – namely, the ore reserves and resources – is generally not included on the balance sheet, should we conclude that the market is simply being circumspect in ascribing nil value to the vast majority of these long life assets? Or do we condition ourselves for more pain, beyond the nearly $200 billion of impairments in the past five years, if prices do not recover?
Medals should be on offer to those who made demonstrable inroads on costs, with some “wind assistance” via lower input costs. However, the commodities price decline proved insurmountable and EBITDA slumped by 39%. The bottom line for 2015 was the first net loss in the history of Mine and, as expected, dividends were cut.
Jock O’Callaghan Global Mining Industry Leader
Jason Burkitt Mining Leader United Kingdom
Simon McKenna Mine Project Team Leader
PwC’s Mine 2016 4
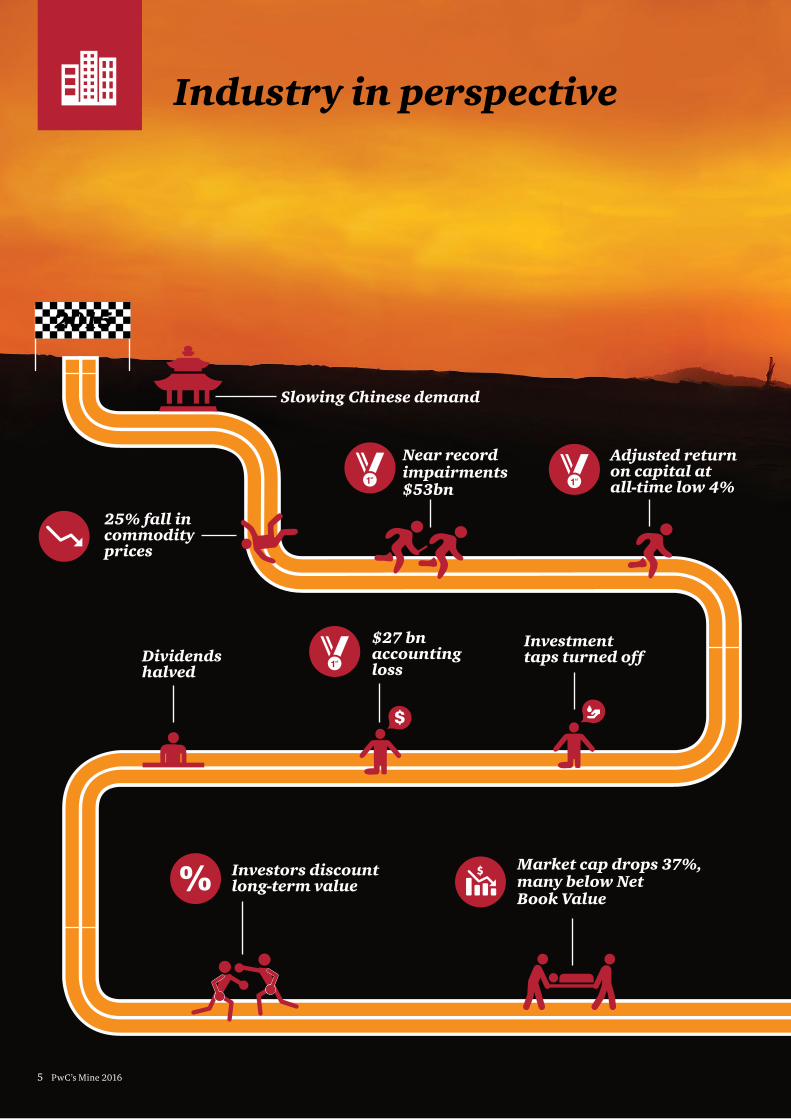
Industry in perspective
Slowing Chinese demand
Near record impairments $53bn
$27 bn accounting loss
25% fall in commodity prices
Dividends halved
Investors discount long-term value
Investment taps turned off
Adjusted return on capital at all-time low 4%
Market cap drops 37%, many below Net Book Value
2015
5 PwC’s Mine 2016

Industry in perspective
Ratings downgrades
The battery revolution
Inroads into cost reduction
Overall debt down but ¼ of the Top 40 net debt to EBITDA above 4
Q1 sharp rebound in commodity prices and market capitalisation off the canvas and up by 29%
Thermal coal facing existential threats
Recent extreme volatility 2016
PwC’s Mine 2016 6
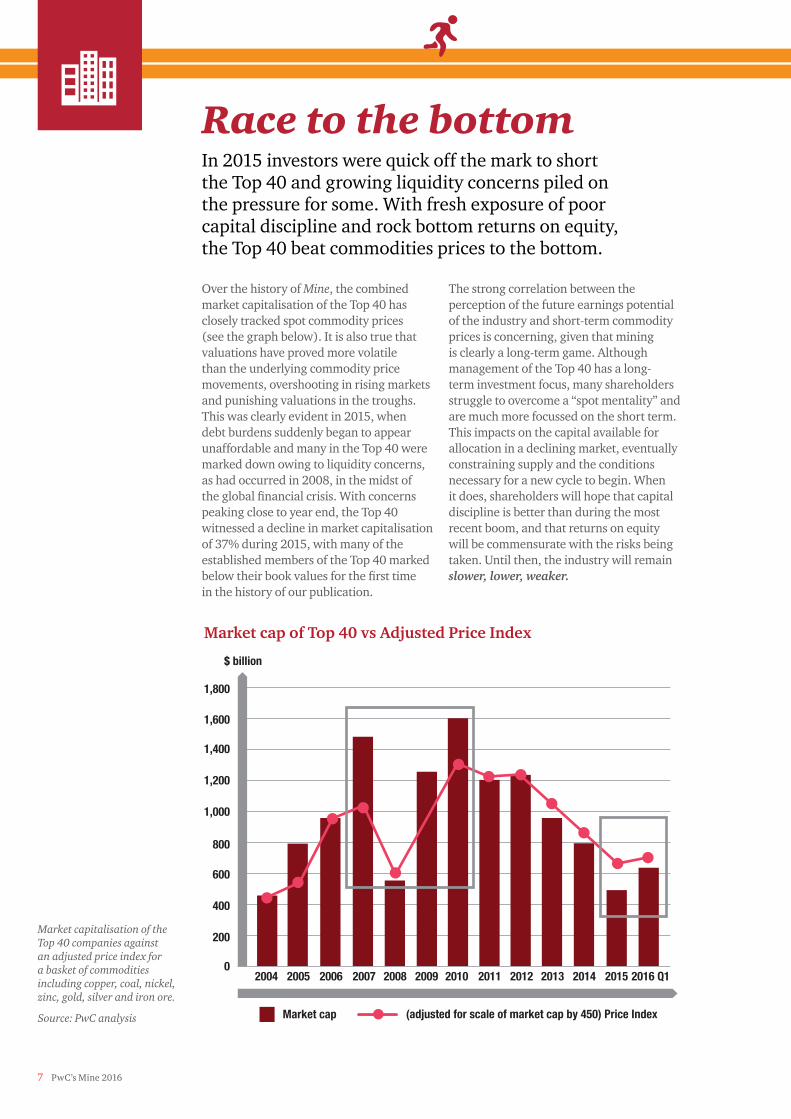
Race to the bottom In 2015 investors were quick off the mark to short the Top 40 and growing liquidity concerns piled on the pressure for some. With fresh exposure of poor capital discipline and rock bottom returns on equity, the Top 40 beat commodities prices to the bottom.
Over the history of Mine, the combined market capitalisation of the Top 40 has closely tracked spot commodity prices (see the graph below). It is also true that valuations have proved more volatile than the underlying commodity price movements, overshooting in rising markets and punishing valuations in the troughs. This was clearly evident in 2015, when debt burdens suddenly began to appear unaffordable and many in the Top 40 were marked down owing to liquidity concerns, as had occurred in 2008, in the midst of the global financial crisis. With concerns peaking close to year end, the Top 40 witnessed a decline in market capitalisation of 37% during 2015, with many of the established members of the Top 40 marked below their book values for the first time in the history of our publication.
The strong correlation between the perception of the future earnings potential of the industry and short-term commodity prices is concerning, given that mining is clearly a long-term game. Although management of the Top 40 has a long-term investment focus, many shareholders struggle to overcome a “spot mentality” and are much more focussed on the short term. This impacts on the capital available for allocation in a declining market, eventually constraining supply and the conditions necessary for a new cycle to begin. When it does, shareholders will hope that capital discipline is better than during the most recent boom, and that returns on equity will be commensurate with the risks being taken. Until then, the industry will remain slower, lower, weaker.
Market capitalisation of the Top 40 companies against an adjusted price index for a basket of commodities including copper, coal, nickel, zinc, gold, silver and iron ore.
Source: PwC analysis
1,800
1,200
1,000
600
400
200
0200620052004 2007 2008 2009 2010 2011 2012 2013 2014 2015 2016 Q1
1,400
1,600
800
Market cap (adjusted for scale of market cap by 450) Price Index
Market cap of Top 40 vs Adjusted Price Index
$ billion
7 PwC’s Mine 2016

Commodities prices down
25%Spot mentality
drives market caps down 37%
Liquidity squeeze
PwC’s Mine 2016 8

More than
40% of global copper demand
12of the Top 40 mining companies’
Nearly
70% of global iron ore demand
China accounts for
9 PwC’s Mine 2016

Slower... Growth is slower and those who await a sequel to “Mine 2005 – Enter the Dragon” will be disappointed.
Over the past decade, global commodities demand and prices were largely driven by unprecedented Chinese growth. In the medium-term, China will continue to be crucial to the prosperity of the mining industry. Representing approximately 40% of global demand, China cannot be ignored.
However, China can no longer be relied on as the sole driver of prosperity in the sector. China’s New Economic Plan highlights the nation’s aspiration to transition from a manufacturing-based economy to a service-based economy. As this transition gains momentum, China’s rampant demand for raw commodities seen during the boom will not be replicated.
Chinese GDP growth is forecast to tail off and hover around 6% annually to 2020; this is a significant decline compared to recent decades. Nevertheless, as can be seen when tracking GDP at constant prices, China continues to grow and will remain a critical part of the mining industry’s story.
There are a few notable growth regions, including the ASEAN nations and the Indian sub-continent, which will assist with future growth. However, even the most bullish observers would agree that there is no new China on the horizon.
GDP Constant Prices GDP Growth Rate %
China GDP at constant prices and GDP growth rate (RMB billion)
2000
2001
2002
2003
2004
2005
2006
2007
2008
2009
2010
2011
2012
2013
2014
2015
2016
2017
2018
2019
2020
2021
RMB billion %
10,000
0
20,000
30,000
40,000
50,000
60,000
70,000
80,000
90,000
0
21
45
3
678910
1213
11
1415
Source: IMF
ASEAN GDP Growth India GDP Growth China GDP Growth
China, India and ASEAN-5* GDP Growth
2000
2001
2002
2003
2004
2005
2006
2007
2008
2009
2010
2011
2012
2013
2014
2015
2016
2017
2018
2019
2020
2021
0123456789
101112131415
%
* The ASEAN-5 comprises Indonesia, Malaysia, the Philippines, Thailand and Vietnam.
Source: IMFPwC’s Mine 2016 10

Impairments of $53 billion in 2015 may not be an absolute record, but at 77% of 2015’s capital expenditure, this is the highest proportion ever recorded. While it is perhaps unfair to focus on the charges incurred this year as price assumptions were adjusted down, a longer-term perspective highlights a lack of capital discipline. In fact, from 2010 to 2015, the Top 40 have impaired the equivalent of a staggering 32% of their capex incurred.
During the mining boom, in an effort to continually increase production, mining companies undertook expansion strategies that included unrestrained capital spending programs and high-priced mergers and acquisitions. Often, a disciplined capital allocation approach was lacking and this exposed many companies to significant write-downs when commodity prices inevitably subsided from their historic highs. Glencore, Vale, Freeport and Anglo-American have arguably been the hardest hit, with impairments totaling nearly $36 billion, or 68% of the total impairment recorded across the Top 40.
Investors will not be surprised by the continued decline in capital expenditure. In fact, they have demanded it. Less welcome is the acceleration in impairments relative to capex. Such value destruction has not gone unnoticed and has contributed to the ongoing negative sentiment.
With a further $53 billion of impairments in 2015, miners have now collectively impaired the equivalent of 32% of their actual capex since 2010, implying that significant value has been destroyed
160
120
100
60
40
20
2011 2013 2014
140
80
Capex vs impairment $ billion
Capex (PP&E + Exploration) Impairment
2010 2015
73
107
138132
104
69
2012
215
4557
27
53
Source: PwC analysis
Top 40 impairments as a percentage of capital expenditure%
80%
90%
50%
40%
20%
10%
0%2011 2013 2014
60%
70%
30%
Impairment - % of Capex
2010 20152012
Source: PwC analysis
11 PwC’s Mine 2016

Capital efficiency hits at an all-time low In 2015, the adjusted return on capital employed (ROCE) halved from 8% to 4% year-on-year, reaching a record low in the history of Mine. This compares to the commonly cited 15% hurdle rate for new projects and the rising costs of capital.
This reduction occurred despite the total capital employed dropping 24% year-on-year in 2015, as companies reduced spending and focused on managing their working capital. While significant sums were still spent on projects, after allowing for depreciation, impairment and disposals, the Top 40 reduced investment on property, plant and equipment from $650 billion to $580 billion. Ultimately, the sharp fall in earnings drove down the returns, even excluding impairments. Without impairments included, the ROCE was negative.
The significant drop off in capex will inevitably slow future growthCapex fell to just $69 billion in 2015 – half of the levels seen in 2012 and 2013.
Cutbacks and capex reductions, in particular, have been a running theme among the Top 40, as decision-makers look to maximise value from current assets. 2015 saw the first wide-scale mothballing of marginal assets. As a result, capital velocity has decreased to 10.6%, with the pursuit of growth consigned to the sidelines for now. Given the spot mentality brought about by lower returns and poor capital deployment in the past, few of the Top 40 have indicated they will sanction major expansion projects in the near future, even if they have the firepower to do so.
Shedding assets to surviveMajor traditional miners began the year attempting to manage debt and shedding non-core assets, as part of a broader streamlining and consolidation effort. This is evident from an examination of assets held for sale, disclosed on companies’ balance sheets. Almost a third of the Top 40 had acknowledged having assets on the block at year end. Many more will be under consideration in 2016 if the current pricing conditions continue.
Weakening commodity prices introduced a sense of urgency with these efforts, pushing companies to monetise assets and shore up their debt-burdened balance sheets. This has continued into 2016 with two recent high profile examples being Freeport McMoRan’s sale of the Tenke copper project for $2.6 billion and Anglo American’s sale of its Brazilian niobium and phosphates business for $1.5 billion.
Top 40 adjusted return on capital employed (ROCE)
25
02006 20082007 2009 2010 2011 2012 2013 2014
20
15
5
10
2015
%
Adjusted ROCE (excluding impairments) Source: PwC analysis
Top 40 capital velocity compared to capital expenditure
Capital Expenditure Capital Velocity
2010 2011 2012
2010 2011 2012 2013 2014 2015
2013 2014 2015
10.5%
14.0%15.6% 15.9%
12.1%10.6%
0
5
10
15
20
0
50
100
150
200
$ billion %
Source: PwC analysis
PwC’s Mine 2016 12

The market capitalisation for the Top 40 was $494 billion by the end of 2015 – a 37% decrease from 2014 and the lowest level seen since 2004. All gains made during the commodity super-cycle were effectively wiped out. The collapse was all the more painful for producers in 2015 because the value destruction was perceived as self-inflicted, whereas during the global financial crisis, by contrast, extraneous market forces drove valuations down across multiple sectors.
The current market capitalisation of the Top 40 is only a third of its value from five years ago, retracing its steps to the position it held prior to the huge spending that occurred to expand supply at a time when demand was slowing.
Only nine of the top 40 companies showed increases in market capitalisation. Of these, four were gold companies, reflecting the stronger performance of gold relative to the other commodities.
Lower... Market capitalisations dive 37% – $297 billion lost and market capitalisations below Global Financial Crisis levels.
Movement in top 40 market capitalisation$ billion
850
700
650
550
500
450
400Ironore
Diversi-fied
31 Dec2014
Coal Copper Gold Rare earth
Other 31 Dec2015
750
800
600
791 (182)
(6) (36)
(29)
(12) 2 (34)
494
Source: PwC analysis NB: 2014 market capitalisation is as reported in Mine 2015
2015 Lost Value
Emerging Companies
The declines in market capitalisation were disproportionately spread between traditional and emerging companies.
Among the emerging companies, there were, some notable gains.
Three Chinese companies:
Sichuan Tianqi Lithium
Tongling non-ferrous metals
Zhongjin Lingnan non-ferrous metals
22%$64bn
13 PwC’s Mine 2016

Commodity prices plunge 2015 saw a year-on-year decline of 25% in our commodities price index. Whilst individual commodity prices fluctuated throughout the year, nickel was the worst performer, dropping by 41%. Iron ore was a close second, falling 40%. Gold dropped by a relatively modest 14% in 2015, and also rallied strongly in Q1 2016.
The gap between miners and the broader market widens The 2014 edition of Mine noted a gap emerging between the HSBC Mining Index and the broader market in late 2014. That trend continued in 2015. Whilst the FTSE 100 was down 4% and the Dow Jones up 1%, the HSBC Global Mining Index was down a staggering 42%. This disparity illustrates the generally pessimistic sentiment currently held towards the industry.
Price indices, selected commodities (January 2015 = 1)
1.1
0.8
0.7
0.5
0.9
1.0
0.6
GoldNickelCopperIron oreCoal
May-15Mar-15Jan-15 Jul-15 Sep-15 Nov-15 Jan-16 Mar-16
Source: The World Bank
Global mining indices (2014=1)
1.2
0.4
Dow JonesFTSE 100
Mine 2015
HSBC Global Mining Index
Jan-
14
Mar
-16
Mine 2014
May
-15
Mar
-15
Jan-
15
Jul-
15
Sep-
15
Nov-
15
Jan-
15
May
-14
Mar
-14
Jul-
14
Sep-
14
Nov-
14
1.1
0.8
0.7
0.5
0.9
1.0
0.6
Source: Bloomberg
Traditional Companies
45%$226bn
60%
Com
bine
d Gains
PwC’s Mine 2016 14

How low can you go? During the depths of the global financial crisis, it was hard to fathom that global sentiment towards the mining industry could ever get worse. However, throughout this period, the HSBC Global Mining Index tracked higher than the FTSE 100 and Dow Jones – a far different scenario than we are currently witnessing, where the reverse has happened. There are a few possible explanations for this counterintuitive scenario. In 2009, the industry was partially insulated by a medium-term view that the inevitability of Chinese growth would support a mining recovery. This perspective proved correct in the short term – mining companies rebounded strongly from 2009-2011. However, since early 2011, the value of mining stocks has slowly eroded in relation to broader market indices.
By 2014, the headroom had completely disappeared between the indices, with mining stocks underperforming in relation to the other indices. Since the peak of May 2008, the HSBC Mining Index has lost nearly 80%. By February 2016, the index reached a new low. More alarmingly, the index has fallen 36% beyond the lowest point reached during the global financial crisis, in February 2009.
Global indices over the life of Mine (December 2003 – April 2016)
3.5
4.0
2.0
1.5
0.0
0.5
201120102009 2012 2013 2014200520042003 2006 2007 2008 2015
2.5
3.0
1.0
Dow JonesFTSE 100HSBC Global Mining Index
Source: Bloomberg
15 PwC’s Mine 2016
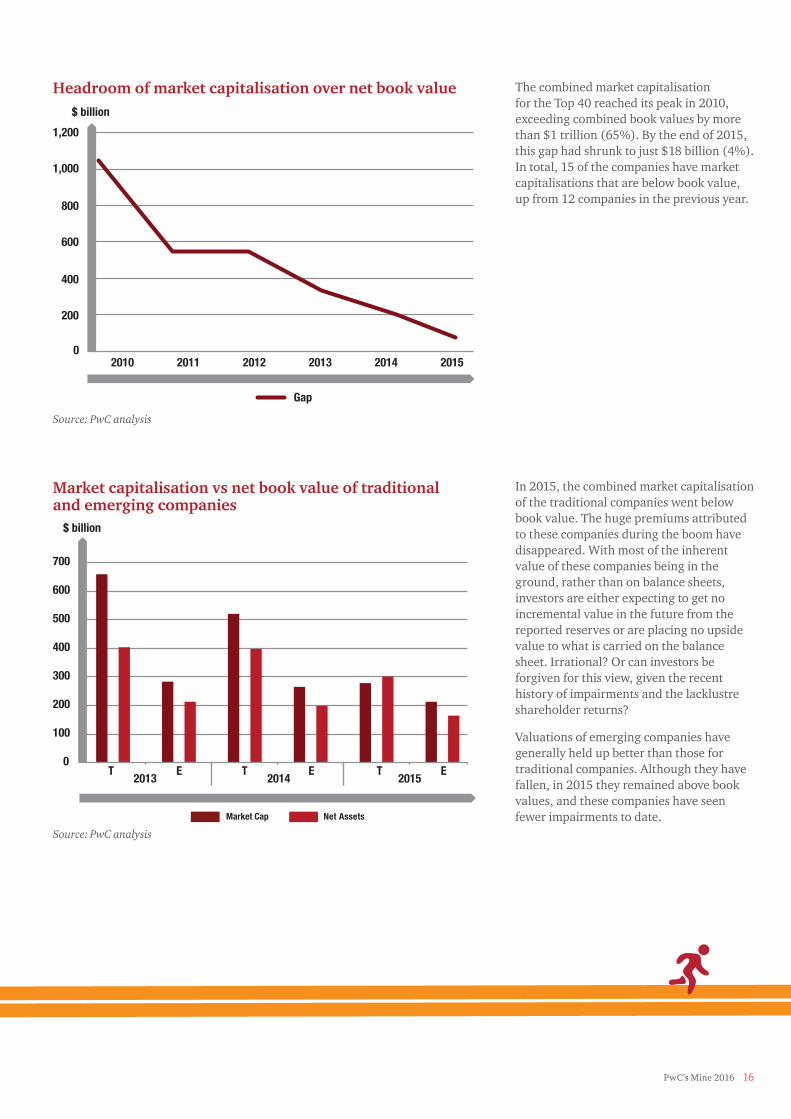
The combined market capitalisation for the Top 40 reached its peak in 2010, exceeding combined book values by more than $1 trillion (65%). By the end of 2015, this gap had shrunk to just $18 billion (4%). In total, 15 of the companies have market capitalisations that are below book value, up from 12 companies in the previous year.
In 2015, the combined market capitalisation of the traditional companies went below book value. The huge premiums attributed to these companies during the boom have disappeared. With most of the inherent value of these companies being in the ground, rather than on balance sheets, investors are either expecting to get no incremental value in the future from the reported reserves or are placing no upside value to what is carried on the balance sheet. Irrational? Or can investors be forgiven for this view, given the recent history of impairments and the lacklustre shareholder returns?
Valuations of emerging companies have generally held up better than those for traditional companies. Although they have fallen, in 2015 they remained above book values, and these companies have seen fewer impairments to date.
Headroom of market capitalisation over net book value
2011 2012 2013 20142010 2015
1,200
1,000
800
600
0
200
400
Gap
$ billion
Source: PwC analysis
Market capitalisation vs net book value of traditionaland emerging companies
700
600
500
300
200
100
0T
2013 2014 2015E T E T E
400
Market Cap Net Assets
$ billion
Source: PwC analysis
PwC’s Mine 2016 16

Investment returns miss the targetUntil recently, increasing dividend yields grabbed the headlines. However, increasing yields were actually more a reflection of the market capitalisation challenge than of the fortunes of mining shareholders. The yields mask a complete u-turn from boom-time dividend policies. More companies have now announced clear percentages of profit distribution policies. The big story today is the abandonment of progressive dividends by the majors, confirming that no miner was immune from a sustained commodity cycle downturn, however diversified their portfolio.
Little from the boom and even less in the bust Shareholders were not fully rewarded for the high commodity prices and huge profits experienced in the boom, as management ploughed cash and profits into bigger and more marginal assets. During those times, production was the main game and shareholders were rewarded through soaring stock prices. However, this investment proposition relied on prices remaining high.
The Top 40 attempted to address poor shareholder returns by continuing to pay dividends in 2014 and 2015, but it was “too little too late”, as the cash dried up, locked into assets that are not able to realise value at the lower prices.
With many Top 40 companies turning off capital expenditure and shedding non-core assets, it appears that management is aware of shareholder discontent with poor investment decisions in the past. However, in a year where the industry reported an overall net loss, dividends will remain a luxury, as companies pay down debt and strengthen balance sheets.
Dividend coverage and yield
6
5
4
3
0
1
201120102009 2012 2013 20142006 2007 2008 2015
2
Yield Cover
%
Source: PwC analysis
17 PwC’s Mine 2016

Price to earnings ratios may indicate further pain ahead Although there are limitations with backward-looking PE ratios, the numbers do indicate a worrying trend. For the first time in the history of Mine, PE ratios in the industry were negative. Surprisingly, when adjusted for impairment, the PE ratio spiked to 31.4, up from 12.7 in the previous year. This is an indication that, based on the adjusted low level of earnings, there is still a valuation premium when compared to the low margins experienced in 2015. This high adjusted PE ratio does little to support the notion that the bottom has been reached.
(30)
(20)
(10)
-
10
20
30
40
50
60
$billion
2011 2012 2013 2014 2015
Top 40 price to earnings ratio
PE ratio PE ratio (excluding impairment)
PwC’s Mine 2016 18
Total debt
but only 3%
$306 billion
Net borrowings stay at
$224 billion
Gearing ratio up from 38% to 46%
Net debt: EBITDA 12 companies above 4
Ratings downgraded
Top 402014
38%Top 40
2015
46%
Top 402014
38%Top 40
2015
46%
Top 402014
38%Top 40
2015
46%
2015
1.52 2.46
2014
BAA2 2014
BAA3 2015
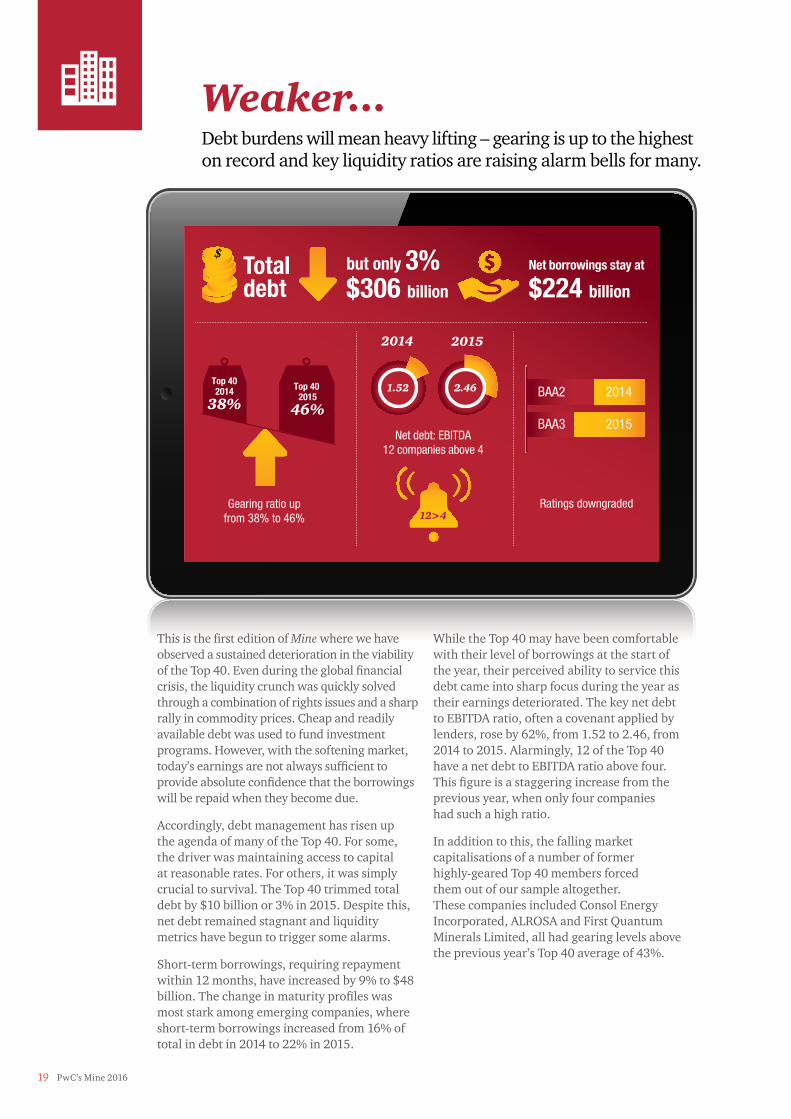
This is the first edition of Mine where we have observed a sustained deterioration in the viability of the Top 40. Even during the global financial crisis, the liquidity crunch was quickly solved through a combination of rights issues and a sharp rally in commodity prices. Cheap and readily available debt was used to fund investment programs. However, with the softening market, today’s earnings are not always sufficient to provide absolute confidence that the borrowings will be repaid when they become due.
Accordingly, debt management has risen up the agenda of many of the Top 40. For some, the driver was maintaining access to capital at reasonable rates. For others, it was simply crucial to survival. The Top 40 trimmed total debt by $10 billion or 3% in 2015. Despite this, net debt remained stagnant and liquidity metrics have begun to trigger some alarms.
Short-term borrowings, requiring repayment within 12 months, have increased by 9% to $48 billion. The change in maturity profiles was most stark among emerging companies, where short-term borrowings increased from 16% of total in debt in 2014 to 22% in 2015.
While the Top 40 may have been comfortable with their level of borrowings at the start of the year, their perceived ability to service this debt came into sharp focus during the year as their earnings deteriorated. The key net debt to EBITDA ratio, often a covenant applied by lenders, rose by 62%, from 1.52 to 2.46, from 2014 to 2015. Alarmingly, 12 of the Top 40 have a net debt to EBITDA ratio above four. This figure is a staggering increase from the previous year, when only four companies had such a high ratio.
In addition to this, the falling market capitalisations of a number of former highly-geared Top 40 members forced them out of our sample altogether. These companies included Consol Energy Incorporated, ALROSA and First Quantum Minerals Limited, all had gearing levels above the previous year’s Top 40 average of 43%.
Weaker... Debt burdens will mean heavy lifting – gearing is up to the highest on record and key liquidity ratios are raising alarm bells for many.
12>4
19 PwC’s Mine 2016

Ratings downgradedIt is perhaps no surprise that credit rating agencies announced a series of credit downgrades in 2015. Some companies, including Anglo American and Vale, were even relegated to below investment grade.
The Top 40’s response has been twofold: even greater focus on cutting expenditure, whether operational or expansionary, and an acceleration in asset sales. Until now, non-core asset sales volumes have been subdued, as buyers and sellers contemplated the value expectations gap. However, the pressing need for miners to monetise assets is changing this dynamic. Combined with speculation that the bottom may have been reached, the scene has been set for a large increase in deals, which we expect will eclipse the $14 billion of disposals realised in 2015. The question remains whether coveted tier 1 assets and/or less marginal assets may change hands. What is clear is that the need to monetise assets now has increased the Top 40’s appetite to consider all options, as evidenced by the recent streaming deal announcements.
Extreme volatility – 2016 has seen a sharp reversal in commodity prices but, with extreme volatility, it is still premature to call 2015 the bottomEarly 2016 saw growth among the Top 40 in terms of market capitalisation, which increased by 30% to the end of April. We attribute these movements to the upswing in commodity prices witnessed since the beginning of the year, along with the execution of debt market management. Diversified and gold companies have benefitted most, as the result of a bounce in gold and iron ore prices. Coal, conversely, has not experienced a resurgence; a reminder of the challenges that this sector faces.
Last year, we identified increased levels of volatility in commodity prices and the need for miners to adopt more flexible strategies. 2015 continued this theme, particularly in the iron ore market, where prices plummeted to levels not seen since the global financial crisis. Volatility (tracked over 10, 30, 50 and 100 days) saw record highs reached in 2015 and it gathered momentum, albeit unexpectedly, in early 2016.
It is unlikely that global demand for iron ore will return to pre-crash levels. China, alone, cannot be relied on for the commodity’s revival. However, demand is only one part of the iron ore volatility picture. Speculative futures trading has also impacted on the commodity’s strength. Recent efforts by the Chinese Government and commodity exchanges to tackle the problem of speculative trading, by reducing trading hours and raising fees, have been publically welcomed by many industry chiefs.
Weaker... Debt burdens will mean heavy lifting – gearing is up to the highest on record and key liquidity ratios are raising alarm bells for many.
%
Three month rolling volatility - 24 months
Iron OreSilverNickelCopperGoldCoal
60
70
30
20
0
40
50
10
May
-14
May
-16
Jul-
14
Sep-
14
Jan-
15
Nov-
14
Mar
-15
May
-15
Jul-
15
Mar
-16
Jan-
16
Nov-
15
Sep-
15
Source: PwC analysis
PwC’s Mine 2016 20

... But not defeated 2016 rebounds strongly, for now…
Cost cutting initiatives widespread and effective
Although it is difficult to isolate and compare data on the quantifiable benefits and relative successes of cost cutting initiatives, our analysis suggests (see page 32 of financial analysis) that management has delivered actual costs savings from their initiatives announced in the preceding years.
The Top 40 appear to have worked smarter and implemented more productive methods to drive greater volume growth from existing plant and equipment at lower unit costs.
A noteworthy example of reported cost reductions in 2015 was BHP Billiton’s reduction in operating cash costs of $2.7 billion and the generation of productivity-led volume efficiencies of $1.2 billion. After reporting $2.9 billion in cost savings in 2015 (due to a combination of internal and external factors), Rio Tinto announced it would further cut cash costs by $1 billion per annum in 2016 and 2017.
The start of 2016 brought some welcome relief. Commodity prices were generally up and the HSBC Global Mining Index rebounded 13% to the end of March 2016. Over the same period, the Top 40 fared even better, experiencing a climb of 29% in their market value. These numbers were especially positive, given that the FTSE 100 and Dow Jones contracted 4% and 1%, respectively, over the same period.
The widening gap between miners and the broader market indices that we have reported since 2014 started to reverse, albeit with much volatility (previously noted above).
Global indices vs Top 40 market capitalisation (Q1 2016)
%
40%
30%
10%
0%
(10%)
20%
29%
13%
(4%)(1%)
HSBC Global Mining IndexFTSE 100Dow Jones Top 40
Source: PwC analysis and Bloomberg
Production increases
Key contributors
2014 OPEX
$502bn2015 OPEX
$419bn
External benefits*
Controlled by management
* See detail on page 32
21 PwC’s Mine 2016
PwC’s Mine 2016 22

Of all commodities, thermal coal has been the most maligned over the past year. One would be hard pressed to find a near-term prognosis of prosperity anywhere within the mining and energy sectors. Although the emerging economies, particularly the Indian sub-Continent and Southeast Asia, may drive future import demand, it is highly unlikely that they will replace the unprecedented demand from China witnessed over the past decade.
Although China’s waning demand has occupied the spotlight, it is one component of a broader social and geopolitical trend that has been referred to by some as a “war on coal”. Some major banks are no longer financing coal-fired power plants, historical stalwarts of the United States coal industry, Peabody Inc. and Arch Coal, both filed for bankruptcy in 2015, coal production in the United States fell 39% from early April 2015 to April 2016, and divestment has become a running theme in the coal narrative just as closure and cleaner technology had been in the power sector.
Coal has also been under pressure owing to technological advancements and the reduced costs of less carbon-intensive energy sources, particularly renewables and LNG. Solar installations and solar adoption have moved at a pace faster than many predicted, as a result of reduced costs and improved battery storage. These developments offer new opportunities and markets for mining companies that can adapt to the changing energy mix.
Nevertheless, in the short – and medium-term, coal remains the most inexpensive energy source we have and there are 1.2 billion people on Earth without access to electricity. Although the movement to “phase-out” coal is real, the commodity will continue to play a critical and significant role in the energy mix of many economies.
The War on Coal
23 PwC’s Mine 2016
Lithium Carbonate
Lithium Carbonate Mid Price Index (Jan 2014 = 1)
Jan-14 Apr-14 Apr-16Jul-14 Oct-14 Jan-15 Apr-15 Jul-15 Oct-15 Jan-16
0.0
0.5
1.0
1.5
2.0
2.5
3.0
3.5
4.0
4.5
Source: Thompson Reuters
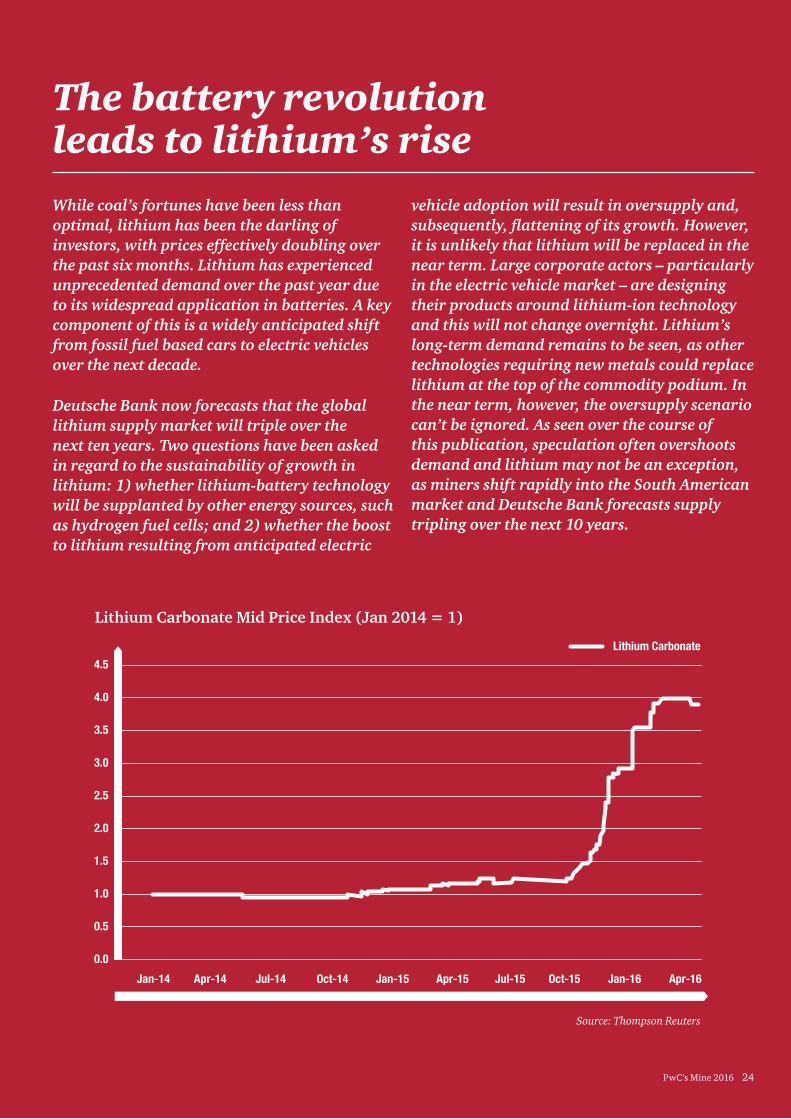
The battery revolution leads to lithium’s riseWhile coal’s fortunes have been less than optimal, lithium has been the darling of investors, with prices effectively doubling over the past six months. Lithium has experienced unprecedented demand over the past year due to its widespread application in batteries. A key component of this is a widely anticipated shift from fossil fuel based cars to electric vehicles over the next decade.
Deutsche Bank now forecasts that the global lithium supply market will triple over the next ten years. Two questions have been asked in regard to the sustainability of growth in lithium: 1) whether lithium-battery technology will be supplanted by other energy sources, such as hydrogen fuel cells; and 2) whether the boost to lithium resulting from anticipated electric
vehicle adoption will result in oversupply and, subsequently, flattening of its growth. However, it is unlikely that lithium will be replaced in the near term. Large corporate actors – particularly in the electric vehicle market – are designing their products around lithium-ion technology and this will not change overnight. Lithium’s long-term demand remains to be seen, as other technologies requiring new metals could replace lithium at the top of the commodity podium. In the near term, however, the oversupply scenario can’t be ignored. As seen over the course of this publication, speculation often overshoots demand and lithium may not be an exception, as miners shift rapidly into the South American market and Deutsche Bank forecasts supply tripling over the next 10 years.
PwC’s Mine 2016 24

The Top 40
Name Country(**) Traditional (T) v
Emerging (E) Year End
2015 Ranking
2014 Ranking
BHP Billiton plc/BHP Billiton Limited UK/Australia T 30-Jun 1 1
Rio Tinto plc/Rio Tinto Limited UK/Australia T 31-Dec 2 2
China Shenhua Energy Company Limited China/Hong Kong E 31-Dec 3 3
Coal India Limited India E 31-Mar 4 6
MMC Norilsk Nickel Russia E 31-Dec 5 11
Glencore plc UK/Australia T 31-Dec 6 4
Grupo México S.A.B. de C.V. Mexico T 31-Dec 7 10
Vale S.A. Brazil E 31-Dec 8 5
Potash Corp. of Saskatchewan, Inc. Canada T 31-Dec 9 7
Saudi Arabian Mining Company (Ma’aden) Saudi Arabia E 31-Dec 10 19
The Mosaic Company United States T 31-Dec 11 12
China Coal Energy Company Limited China/Hong Kong E 31-Dec 12 14
Zijin Mining Group Co. Ltd China/Hong Kong E 31-Dec 13 17
Goldcorp Inc. Canada T 31-Dec 14 13
Newmont Mining Corporation United States T 31-Dec 15 20
Barrick Gold Corporation Canada T 31-Dec 16 15
China Northern Rare Earth (Group) High-Tech Co. Limited *
China/Hong Kong E 31-Dec 17 40
Freeport-McMoRan Copper & Gold Inc. United States T 31-Dec 18 9
Fresnillo plc UK/Mexico T 31-Dec 19 New
Polyus Gold International Limited UK /Russia T 31-Dec 20 22
Shaanxi Coal Industry China/Hong Kong E 31-Dec 21 New
Newcrest Mining Limited Australia T 30-Jun 22 32
Sumitomo Metal Mining Company Japan T 31-Mar 23 25
Uralkali Russia E 31-Dec 24 36
Antofagasta plc UK T 31-Dec 25 16
Jiangxi Copper Company Limited China/Hong Kong E 31-Dec 26 24
Anglo American plc UK T 31-Dec 27 8
Agnico-Eagle Mines Ltd Canada T 31-Dec 28 37
Randgold Resources Limited UK T 31-Dec 29 34
AngloGold Ashanti Ltd South Africa/
United States/Australia
T 31-Dec 30 New
Sichuan Tianqi Lithium China/Hong Kong E 31-Dec 31 New
NMDC Limited India E 31-Mar 32 21
Tongling Non Ferrous Metals Group China/Hong Kong E 31-Dec 33 New
Yanzhou Coal Mining Company Limited China/Hong Kong E 31-Dec 34 26
25 PwC’s Mine 2016
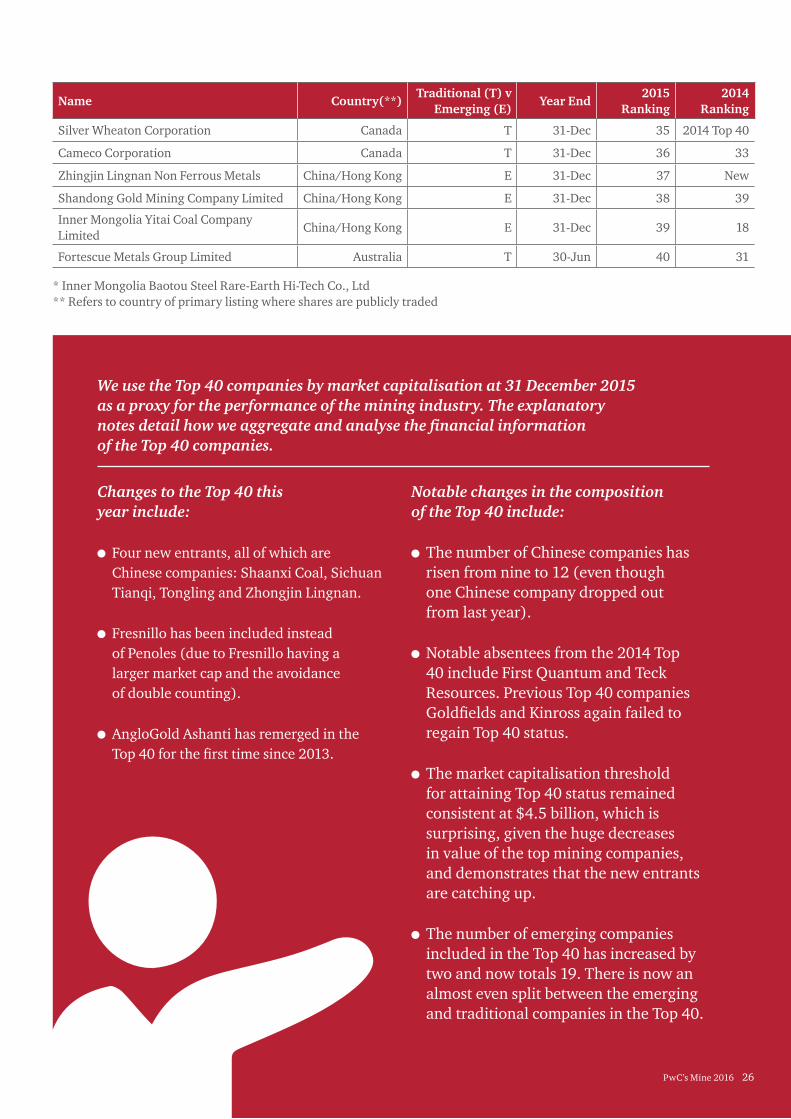
We use the Top 40 companies by market capitalisation at 31 December 2015 as a proxy for the performance of the mining industry. The explanatory notes detail how we aggregate and analyse the financial information of the Top 40 companies.
Changes to the Top 40 this year include:
Four new entrants, all of which are Chinese companies: Shaanxi Coal, Sichuan Tianqi, Tongling and Zhongjin Lingnan.
Fresnillo has been included instead of Penoles (due to Fresnillo having a larger market cap and the avoidance of double counting).
AngloGold Ashanti has remerged in the Top 40 for the first time since 2013.
Notable changes in the composition of the Top 40 include:
The number of Chinese companies has risen from nine to 12 (even though one Chinese company dropped out from last year).
Notable absentees from the 2014 Top 40 include First Quantum and Teck Resources. Previous Top 40 companies Goldfields and Kinross again failed to regain Top 40 status.
The market capitalisation threshold for attaining Top 40 status remained consistent at $4.5 billion, which is surprising, given the huge decreases in value of the top mining companies, and demonstrates that the new entrants are catching up.
The number of emerging companies included in the Top 40 has increased by two and now totals 19. There is now an almost even split between the emerging and traditional companies in the Top 40.
Name Country(**) Traditional (T) v
Emerging (E) Year End
2015 Ranking
2014 Ranking
Silver Wheaton Corporation Canada T 31-Dec 35 2014 Top 40
Cameco Corporation Canada T 31-Dec 36 33
Zhingjin Lingnan Non Ferrous Metals China/Hong Kong E 31-Dec 37 New
Shandong Gold Mining Company Limited China/Hong Kong E 31-Dec 38 39
Inner Mongolia Yitai Coal Company Limited
China/Hong Kong E 31-Dec 39 18
Fortescue Metals Group Limited Australia T 30-Jun 40 31
* Inner Mongolia Baotou Steel Rare-Earth Hi-Tech Co., Ltd ** Refers to country of primary listing where shares are publicly traded
PwC’s Mine 2016 26
27 PwC’s Mine 2016
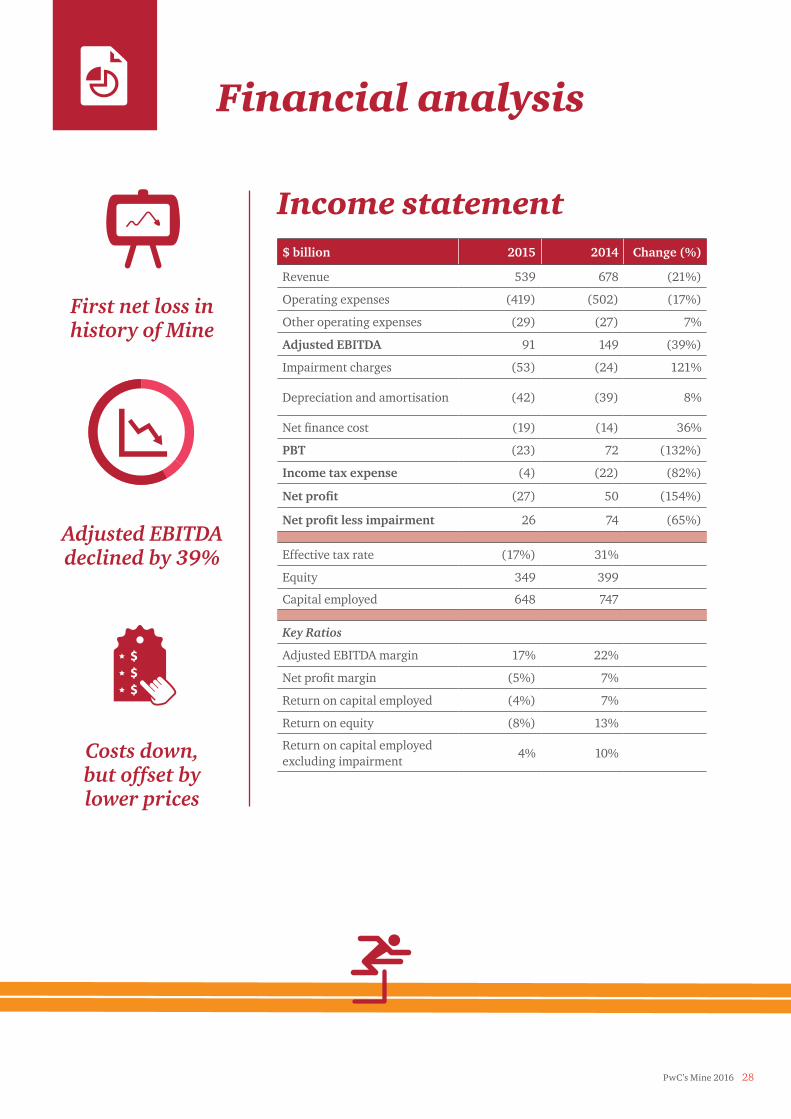
Income statement$ billion 2015 2014 Change (%)
Revenue 539 678 (21%)
Operating expenses (419) (502) (17%)
Other operating expenses (29) (27) 7%
Adjusted EBITDA 91 149 (39%)
Impairment charges (53) (24) 121%
Depreciation and amortisation (42) (39) 8%
Net finance cost (19) (14) 36%
PBT (23) 72 (132%)
Income tax expense (4) (22) (82%)
Net profit (27) 50 (154%)
Net profit less impairment 26 74 (65%)
Effective tax rate (17%) 31%
Equity 349 399
Capital employed 648 747
Key Ratios
Adjusted EBITDA margin 17% 22%
Net profit margin (5%) 7%
Return on capital employed (4%) 7%
Return on equity (8%) 13%
Return on capital employed excluding impairment
4% 10%
Financial analysis
Adjusted EBITDA declined by 39%
Costs down, but offset by lower prices
First net loss in history of Mine
PwC’s Mine 2016 28

Production numbers were generally higher in 2015, the only exceptions being potash (down 2%) and thermal coal (down 4%).
The existence of only three major potash producers means they are uniquely placed to respond to changes in demand. However coal, and in particular thermal coal, faced further pressures as carbon concerns continued to gather momentum (see page 25 for a discussion on the “war on coal”).
The higher production levels seen in 2015 have been driven by the completion of previous expansionary projects rather than being the result of capital expenditures in 2015.
Thermal Coal (in Miln T)
Gold (in Miln oz)
Iron (in Miln T)
Potash (in Miln T)
Copper (in Miln T)
Metallurgical Coal (in Miln T)
Production change from prior year
-4-6 -2 0 2 4 6 8 10 12
11%
-2%
6%
-4%
9%
1%
Source: PwC analysis
%
Revenue misses the mark Despite increased production levels, spiralling commodities prices drove revenues down 20%
The revenues of the Top 40 declined from $678 billion in 2014 to $539 billion in 2015, a significant reduction of $139 billion. This was an acceleration of the downward trend that began in 2012.
Copper, coal, iron ore and gold account for 83% of the Top 40’s revenue. Aside from gold, revenue by commodity was down across the board, with the biggest reductions in iron ore (down 30%) and coal (down 26%).
Revenue by commodity $ billion
- 20
Note: Chart excludes Glencore’s marketing and trading revenues, and certain other companies’ non-mining revenues
40 60 80 100 120 140 160 180 200
2015 2014
Copper
Coal
Iron ore
Gold
Other
Source: PwC analysis
29 PwC’s Mine 2016

US dollar vs key commodity countries’ currencies(Indexed to 1 January 2014)
0.01.00.450.500.550.600.650.700.750.800.850.900.951.001.051.10
%
Australian Dollar Canadian DollarMexican Peso
Brazilian RealRussian Rouble South Africa Rand
Jan-
14Fe
b-14
Mar
-14
May
-14
Jun-
14
Jul-
14Au
g-14
Sep-
14
Oct-
14No
v-14
Dec-
14Ja
n-15
Feb-
15M
ar-1
5Ap
r-15
May
-15
Jun-
15Ju
l-15
Aug-
15Se
p-15
Nov-
15De
c-15
Source: PwC analysis
Clearing the bar on cost savings Cost cutting initiatives widespread and effective
The Top 40 made good progress on reducing costs in 2015, as evidenced by the 17% decrease in operating costs, against a backdrop of higher production volumes and lower input costs.
Traditional companies cut costs by 17.5% and emerging companies cut costs by 14.5%. This is all the more impressive given the production increases in the year.
It will be interesting to observe if these efforts can continue and the subsequent knock on effects. It has already been well documented the impact the downturn has had on mining services companies. The flattening of management layers between the mine and head office, while reducing costs, has taken a generation of experience out of the industry. Whilst management should be congratulated for cost cutting in a difficult period and in particular productivity initiatives and technological advances in areas such as automation, it remains to be seen if costs have been cut so deep that capacity constraints in the future could arise.
Strong US$ and a reduction in key input costs provide a helping hand The strength of the US dollar in 2015 versus other key mining territory currencies assisted the Top 40 with non-US$ – country costs in some circumstances, with savings of between 20% to 30% on input and staff costs for 2015 as compared to 2014.
Miners also benefited from lower energy costs with crude oil down 47% year-on-year. The knock on effect was that shipping, freight and other input costs were down. Vale, for example, reported that lower fuel costs resulted in freight costs being reduced by $1.183 billion.
20
40
60
80
100
120
Jan-14 Apr-14 Jul-14 Oct-14 Jan-15 Apr-15 Jul-15 Oct-15 Jan-16
Crude oil, monthly average
US$/barrel
Source: PwC analysisPwC’s Mine 2016 30

Impairments per commodity 2015
Energy products
17bn
Other metals
5bnIron Ore
6bnGold
5bn
Nickel
9bnCoal
9bnCopper
1bnSource: PwC analysis
The bottom line Adjusted EBITDA declined 39% and near record impairments of $53 billion tipped the Top 40 into a net loss of $27 billion, a first in the history of Mine.
Despite significant cost reductions, the hit to revenues was too great and EBITDA excluding impairment fell to $91 billion (down 39%), a new record low for Mine. Factoring in a near record $53 billion of impairments and a $5 billion increase in financing costs (up 36%), the Top 40 experienced a net loss – another first for Mine.
Energy assets drop the baton too Eight of the Top 40 players contributed 97% of the impairments in 2015, with diversified’s accounting for $29 billion and gold accounting for $9 billion.
It is worth noting that $17 billion of impairments (32% of the total) related to energy assets held by the Top 40 and these are arguably not a reflection of the “mining industry” itself. This number consisted of three majors making significant write-offs of energy assets:
• Freeport McMoRan $13 billion
• BHP Billiton $3 billion
• Glencore $1 billion
Nonetheless, impairments of mining assets (non-oil and gas) were still significant, with gold and nickel having impairments of $9 billion each, followed by iron ore with $6 billion, coal with $5 billion and other metals combined with $6 billion.
Significantly, traditional companies made up 81% of the impairments for 2015. Taking into account the fact that a high concentration of emerging companies in the Top 40 are coal, iron ore and nickel producers, there are likely to be some marginal assets within these emerging companies that are shielded by foreign exchange and that may feel the pain in 2016.
31 PwC’s Mine 2016

Miners still making significant contributions to governments despite no profits
35
30
25
15
10
5
02013 2014 2015
20
Cash tax paid Income tax expense
Tax expense vs tax paid
$ billion
Source: PwC analysis
In our view that points to a “negative tax gap” for the industry. This is before considering additional government contributions that minders make through royalties and other payments.
Governments’ overreliance on profit-based taxes may again ramp up the rhetoric on the mining sector to pay their “fair share”. This would seem at odds with the reality and highlights the particular vulnerability of the mining industry to changes in local tax policy that are introduced long after investment decisions are made and capital committed.
The debate needs to be viewed in the context of the total contribution that mining companies make to governments in the form of other non-profit based imposts, including royalties, levies, indirect taxes and other local community contributions, not just income tax. Viewed in that light, a full and balanced assessment of whether the Top 40 is contributing their “fair share”, particularly compared to other industry sectors, can be made.
Our new website compares mining taxes across different countries and by commodity. Find out more here:
pwc.com/compare-mining-taxes
Unsurprisingly, due to an overall accounting loss before tax, income tax expense was down 81% from $22 billion in 2014 to $4 billion in 2015. Nevertheless, the Top 40 made cash tax payments of $18 billion in 2015.
Negative tax gap for mining companiesVarious governments, the OECD and NGO’s have strongly emphasised that a “tax gap” that exists between contributions that the corporate sector “should” be making, if all taxpayers complied with both the letter and spirit of the law, versus actual revenues collected. Miners have not been immune from criticism in this regard.
Interestingly, notwithstanding the current year accounting loss, the Top 40 contributed US$18bn in income taxes (vs accounting tax expense of US$4bn).
PwC’s Mine 2016 32

Balance sheet$ billion 2015 2014 Change (%)
Current assets
Cash 82 92 -11%
Inventories 65 80 -19%
Accounts receivable 61 75 -19%
Other 33 32 3%
Total current assets 241 279 -14%
Non-current assets
Investment in associates and joint ventures
63 70 -10%
Property, plant and equipment 579 650 -11%
Goodwill and other intangibles 64 90 -29%
Other investments and loans granted 19 20 -5%
Other 81 76 7%
Total non-current assets 806 906 -11%
Total assets 1,047 1,185 -12%
Current liabilities
Accounts payable 88 97 -9%
Borrowings 48 44 9%
Other 35 39 -10%
Total current liabilities 171 180 -5%
Non-current liabilities
Borrowings 258 272 -5%
Other 140 158 -11%
Total non-current liabilities 398 430 -7%
Total equity 478 575 -17%
Total equity & liabilities 1,047 1,185 -12%
Key ratios 2015 2014
Gearing ratio 46% 38% 20%
Current ratio 1.41 1.55 -9%
Quick ratio (times) 1.03 1.11 -7%
Net borrowings (borrowings less cash) 224 224 0%
Net borrowings to EBITDA 2.46 1.52 62%
Cash to cash cycle (days) 28 23 20%
Net working capital 70 99 -29%
Shareholder returns (dividends plus buybacks)
23 25
33 PwC’s Mine 2016

Balance sheet$ billion 2015 2014 Change (%)
Current assets
Cash 82 92 -11%
Inventories 65 80 -19%
Accounts receivable 61 75 -19%
Other 33 32 3%
Total current assets 241 279 -14%
Non-current assets
Investment in associates and joint ventures
63 70 -10%
Property, plant and equipment 579 650 -11%
Goodwill and other intangibles 64 90 -29%
Other investments and loans granted 19 20 -5%
Other 81 76 7%
Total non-current assets 806 906 -11%
Total assets 1,047 1,185 -12%
Current liabilities
Accounts payable 88 97 -9%
Borrowings 48 44 9%
Other 35 39 -10%
Total current liabilities 171 180 -5%
Non-current liabilities
Borrowings 258 272 -5%
Other 140 158 -11%
Total non-current liabilities 398 430 -7%
Total equity 478 575 -17%
Total equity & liabilities 1,047 1,185 -12%
Key ratios 2015 2014
Gearing ratio 46% 38% 20%
Current ratio 1.41 1.55 -9%
Quick ratio (times) 1.03 1.11 -7%
Net borrowings (borrowings less cash) 224 224 0%
Net borrowings to EBITDA 2.46 1.52 62%
Cash to cash cycle (days) 28 23 20%
Net working capital 70 99 -29%
Shareholder returns (dividends plus buybacks)
23 25
Working capital improvements
Debt down by $10 billion, but net debt flat
PwC’s Mine 2016 34

Asset bases reflect commodity pricesAs might be expected, given the market conditions and shift in strategic outlook, total assets for the Top 40 decreased by $138 billion. Almost 50% of this decrease relates to property, plant and equipment, as well as to goodwill and intangible assets, which decreased by $71 billion and $26 billion, respectively, owing to depreciation, impairments and the disposal of assets.
Tightening the belt on working capitalWorking capital decreased year-on-year with the continued tight working capital policies of the Top 40.
FY15 FY14
Accounts receivable ($ billions) 61 75
Day Sales Outstanding (DSO – days) 41 40
Inventory ($ billions) 65 80
Days Inventory Outstanding (DIO – days) 56 58
Accounts payable ($ billions) 88 97
Days Payable Outstanding (DPO – days) 77 70
Net working capital ($ billions) 70 99
Working capital ratio 13% 15%
35 PwC’s Mine 2016

Working capital changes
%400
$billion
100
200
300
0
16
14
13
15
122015
88
65
61
2014
15%
97
80
75
Accounts receivable
Inventory
Accounts payable
Net working capital (%)
13%
The success of the working capital programs is not yet clear. Total current assets and total current liabilities decreased by 14% and 5%, respectively, resulting in a $29 billion reduction in net working capital. However, the reduction may have been the result of external factors. The decrease in accounts receivable can mainly be attributed to lower commodity prices impacting on revenue rather than working capital practices, as evidenced by the minimal movement in DSO. There was more success on the supply side, with DPO
increasing by seven days, highlighting the pressure applied to suppliers.
There is an incentive for companies to actively manage their working capital, as this creates the opportunity to free up more cash, a strong focus in the current environment. A simple one-day improvement in DSO, DIO and DPO has the potential to free up an additional $4 billion in cash, which could be available to fund working capital needs or capital expenditures or to service debt obligations.
PwC’s Mine 2016 36
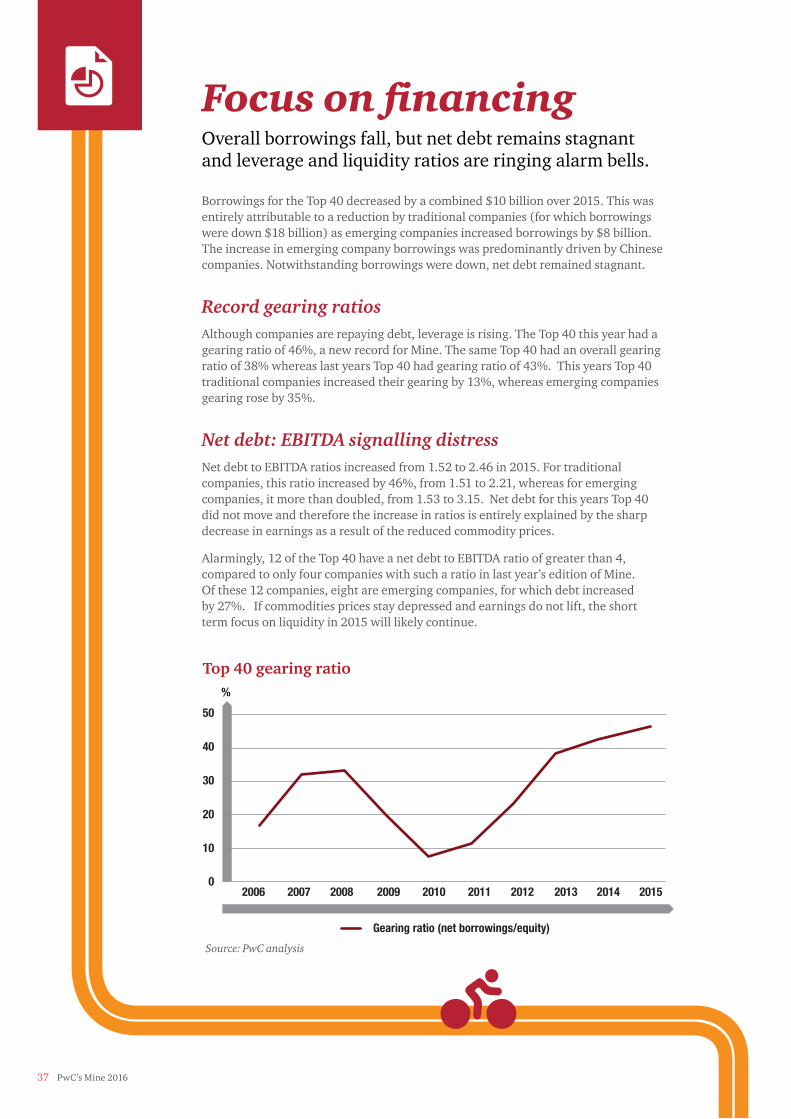
Focus on financing Overall borrowings fall, but net debt remains stagnant and leverage and liquidity ratios are ringing alarm bells.
Borrowings for the Top 40 decreased by a combined $10 billion over 2015. This was entirely attributable to a reduction by traditional companies (for which borrowings were down $18 billion) as emerging companies increased borrowings by $8 billion. The increase in emerging company borrowings was predominantly driven by Chinese companies. Notwithstanding borrowings were down, net debt remained stagnant.
Record gearing ratiosAlthough companies are repaying debt, leverage is rising. The Top 40 this year had a gearing ratio of 46%, a new record for Mine. The same Top 40 had an overall gearing ratio of 38% whereas last years Top 40 had gearing ratio of 43%. This years Top 40 traditional companies increased their gearing by 13%, whereas emerging companies gearing rose by 35%.
Net debt: EBITDA signalling distressNet debt to EBITDA ratios increased from 1.52 to 2.46 in 2015. For traditional companies, this ratio increased by 46%, from 1.51 to 2.21, whereas for emerging companies, it more than doubled, from 1.53 to 3.15. Net debt for this years Top 40 did not move and therefore the increase in ratios is entirely explained by the sharp decrease in earnings as a result of the reduced commodity prices.
Alarmingly, 12 of the Top 40 have a net debt to EBITDA ratio of greater than 4, compared to only four companies with such a ratio in last year’s edition of Mine. Of these 12 companies, eight are emerging companies, for which debt increased by 27%. If commodities prices stay depressed and earnings do not lift, the short term focus on liquidity in 2015 will likely continue.
Top 40 gearing ratio
30
20
40
50
%
10
02012 2013 2014 20152006 2007 2008 2009 2010 2011
Gearing ratio (net borrowings/equity)
Source: PwC analysis
37 PwC’s Mine 2016
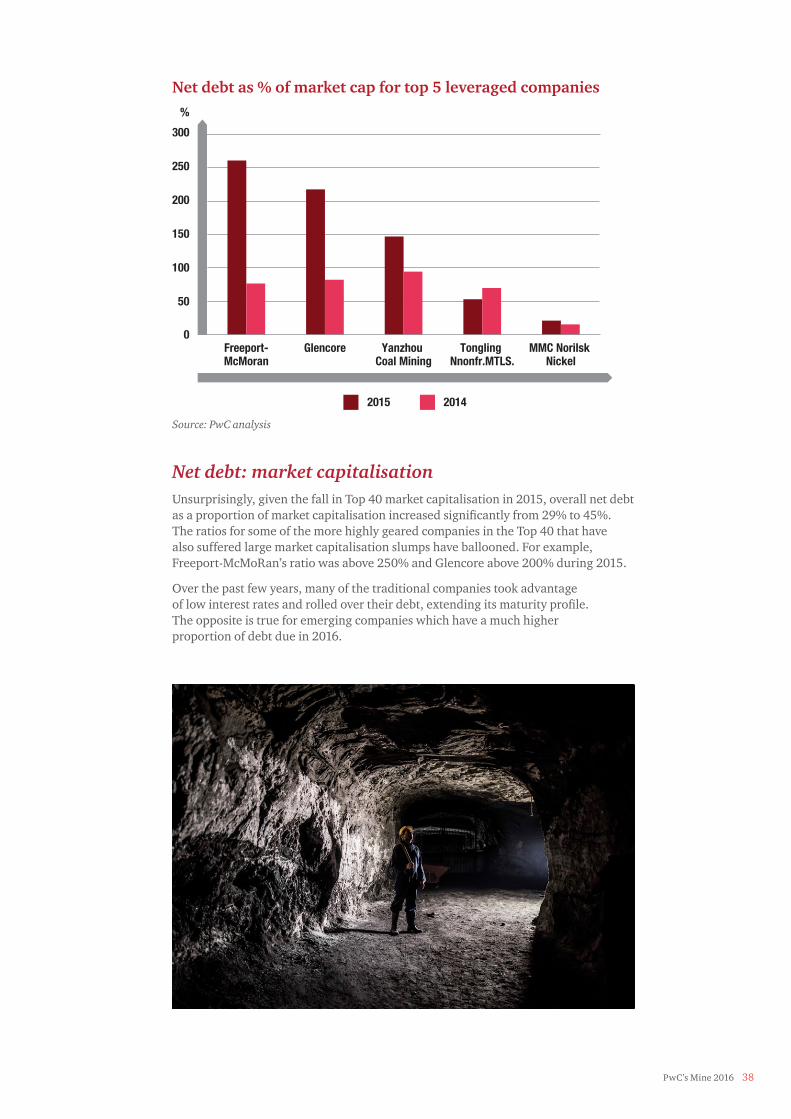
Net debt: market capitalisation Unsurprisingly, given the fall in Top 40 market capitalisation in 2015, overall net debt as a proportion of market capitalisation increased significantly from 29% to 45%. The ratios for some of the more highly geared companies in the Top 40 that have also suffered large market capitalisation slumps have ballooned. For example, Freeport-McMoRan’s ratio was above 250% and Glencore above 200% during 2015.
Over the past few years, many of the traditional companies took advantage of low interest rates and rolled over their debt, extending its maturity profile. The opposite is true for emerging companies which have a much higher proportion of debt due in 2016.
300
%
150
100
200
250
50
0
2015 2014
Freeport-McMoran
Glencore Yanzhou Coal Mining
Tongling Nnonfr.MTLS.
MMC Norilsk Nickel
Net debt as % of market cap for top 5 leveraged companies
Source: PwC analysis
PwC’s Mine 2016 38

Financing costs on the rise Overall, finance costs were higher in 2015, despite the decrease in borrowings. Interest expenses as a percentage of total debt increased from 5% to 7%, which highlights the higher cost of debt for the industry, which can be attributed to the focus on liquidity and subsequent credit ratings downgrades. In fact, the problem may be more severe than it appears for many of the Top 40, given that the (now 12) Chinese companies in the Top 40 may have access to cheaper financing from Chinese banks.
Proceeds from borrowings were 17% lower in the current year, which may also indicate an increased difficulty in raising new debt.
Credit ratings take a knock The industry received broad ratings downgrades from key agencies throughout 2015 and the beginning of 2016 and the Top 40 were not spared. Based on publicly available Moody’s ratings, the Top 40 now average BAA3.
Diversified commodities companies were downgraded two rankings on average. In contrast, precious metals companies on average did not move in rankings. The downgradings reflect concerns over the deterioration in outlook for bulk commodities, particularly in iron ore.
Significant lowlights for 2015 included Anglo American being downgraded to junk status. Glencore, highly dependent on access to working capital facilities for its significant trading activities, was downgraded to just above junk status. For those seeking to raise new debt, the impact of these ratings downgrades mean that the cost of new debt will be more expensive.
Alternative financing brought off the benchIn a market where longer-term potential has been ignored and debt levels reduced, it comes as no surprise that streaming transactions have become a viable alternative financing source for the Top 40.
Top 40 companies that entered into streaming transactions included Barrick Gold, Glencore and Vale. Barrick Gold completed an agreement to the value of $610 million on a portion of their gold and silver production from the Pueblo Viejo mine. Glencore entered a streaming deal to the value of $900 million on its share of the silver production from the Antamina mine. Vale also entered into a streaming deal for $900 million in relation to the gold produced as a by-product at the Salobo copper mine.
Although concerns persist about the cost of such deals, for indebted miners trading at a discount to their implied reserve values, the attractions of streaming are obvious. Portions of an asset can be quickly monetised, instantly reducing net debt. While miners’ costs of capital remain high, streaming is here to stay.
39 PwC’s Mine 2016

$ billion 2015 2014 Change (%)
Cash flow relating to operating activities
Cash generated from operations 113 145 -22%
Income taxes (paid)/refunded (18) (24) -25%
Other (3) (3) 0%
Net operating cash flows 92 118 -22%
Cash flow related to investing activities
Purchases of property, plant and equipment
(69) (90) -23%
Purchase of investments (10) (17) -41%
Exploration expenditure * – (1) -100%
Proceeds from sale of property, plant and equipment
1 7 -86%
Proceeds from sale of investments 13 16 -19%
Other (4) (2) 100%
Net investing cash flows (69) (87) -21%
Cash flow related to financing activities
Dividends paid (28) (34) -18%
Share buy backs (7) (7) 0%
Proceeds from borrowings 77 93 -17%
Repayment of borrowings (76) (84) -10%
Share issuances 7 4 75%
Other (4) 1 -500%
Net financing cash flows (31) (27) 15%
Net movement in cash and cash equivalents
(8) 4 -300%
Cash and cash equivalents at beginning of the year
92 90 2%
Effect of foreign currency exchange rate on cash and cash equivalents
(2) (2) 0%
Cash and cash equivalents at end of the year
82 92 -11%
Free cash flows 23 27 -15%
* Actual exploration expenditure amount is $348 million and $597 million for 2014 and 2015 respectively
Cash Flow
Debt recycled/
reclassified
Cash balances down $10
billion
Free cash flow down
15%
Dividends down
PwC’s Mine 2016 40

As expected, operating cash flows dropped to $92 billion (down by 22%), broadly in line with the reduction in commodities prices and revenues.
The Top 40 reacted by reducing cash outflows relating to property plant and equipment by a similar percentage (down to $69 billion) and, for a second year in a row, exploration expenditure outflows were negligible ($0.4 billion).
In the previous edition of Mine, we noted that the traditional companies appeared to be tightening the belt on capital expenditure at a greater rate than were the emerging companies. In 2015, the emerging companies and traditional companies broadly reduced capital outlays by the same proportions (22%).
Notwithstanding these efforts, free cash flow still suffered, falling 15% to $23 billion.
Debt recycled Debt on the balance sheet of the Top 40 came down by $10 billion, the same amount by which cash balances were reduced. However, cash generated from borrowings ($77 billion) broadly equalled cash used to repay debt ($76 billion), suggesting that debt is being taken off balance sheet or refinanced and classified through equity.
Dividends payments continue to run out of steam Unsustainable dividend practices have started to come to an end, with dividend payments down 18% year-on-year to $28 billion. Emerging companies reduced their dividend payments to $8 billion in 2015 (down 38%), whereas traditional companies reduced dividend payments to $19 billion (down 10%). Given the first net loss in the history of Mine and recent high profile announcements on dividend forecasts, it is expected that dividend payments will remain under pressure in 2016.
Reduction in free cash flow and shareholders sufferCash balances down $10 billion and free cash flow dropped by 15%.
41 PwC’s Mine 2016

15
10
25
30
35
40
45
$billion
5
02012 2013 2014 2015200620052004 2007 2008 2009 2010 2011
Divideds paid
Dividend payment trends
Source: PwC analysis
30
15
10
20
25
5
0
Free cash flow Shareholder return
Top 40 Free cash flow and shareholder returns
$ billion
Source: PwC analysis
Emerging 2014
Traditional 2014
Emerging 2015
Traditional 2015
PwC’s Mine 2016 42

$ billion 2015 2014 2013 2012 2011 2010 2009 2008 2007 2006
Aggregate market capitalisation
494 783 958 1234 1202 1605 1259 563 1481 962
Aggregated income statement
Revenue 402 500 512 525 539 435 325 349 312 249
Operating expenses -390 -359 -350 -340 -311 -246 -217 -208 -176 -141
EBITDA 12 141 162 185 228 189 108 141 136 108
Amortisation, depreciation and impairment
-95 -63 -97 -86 -42 -34 -31 -57 -19 -12
PBIT -83 78 65 99 186 155 77 84 117 96
Net finance cost -19 -14 -15 -6 -6 -7 -6 -6 -5 -3
PBT -102 64 50 93 180 148 71 78 112 93
Income tax expense -4 -22 -30 -25 -48 -38 -22 -21 -32 -27
Net profit -106 42 20 68 132 110 49 57 80 66
Adjusted net profit excl. Impairment
26 74 43 111 147 112 60 88 82 66
Year on year increase/(decrease) in revenue
-20% -2% -2% -3% 24% 34% -7% 12% 25% 12%
Year on year increase/(decrease) in EBITDA
-91% -13% -12% -19% 21% 75% -23% 4% 26% 33%
Year on year increase/(decrease) in net profit
-352% 110% -71% -48% 20% 124% -14% -29% 21% 47%
EBITDA margin 3% 28% 32% 35% 42% 43% 33% 40% 44% 43%
Aggregated cash flow statement
Operating activities 92 118 124 137 174 137 83 104 95 77
Investing activities -69 -87 -125 -169 -142 -79 -74 -102 -126 -67
Financing activities -31 -27 -3 21 -28 -35 10 14 36 4
Free cash flow 23 27 -6 11 76 70 19 38 44 40
Aggregated balance sheet
Property, plant and equipment
579 650 712 701 601 511 467 402 371 262
Other assets 468 535 544 544 538 432 334 274 284 192
Total assets 1,047 1,185 1,256 1,245 1,139 943 801 676 655 454
Total liabilities 569 610 624 563 482 387 354 339 329 217
Total equity 478 575 632 682 657 556 447 337 326 237
Note: All income statement data presented excludes Glencore marketing and trading revenue and costs.
Note: The information included above includes the aggregated results of the Top 40 Mining companies as reported in each respective edition of Mine,except for 2014, which uses the current years’ Top 40’s financial comprative financial results.
10 year trends
43 PwC’s Mine 2016

PwC’s Mine 2016 44
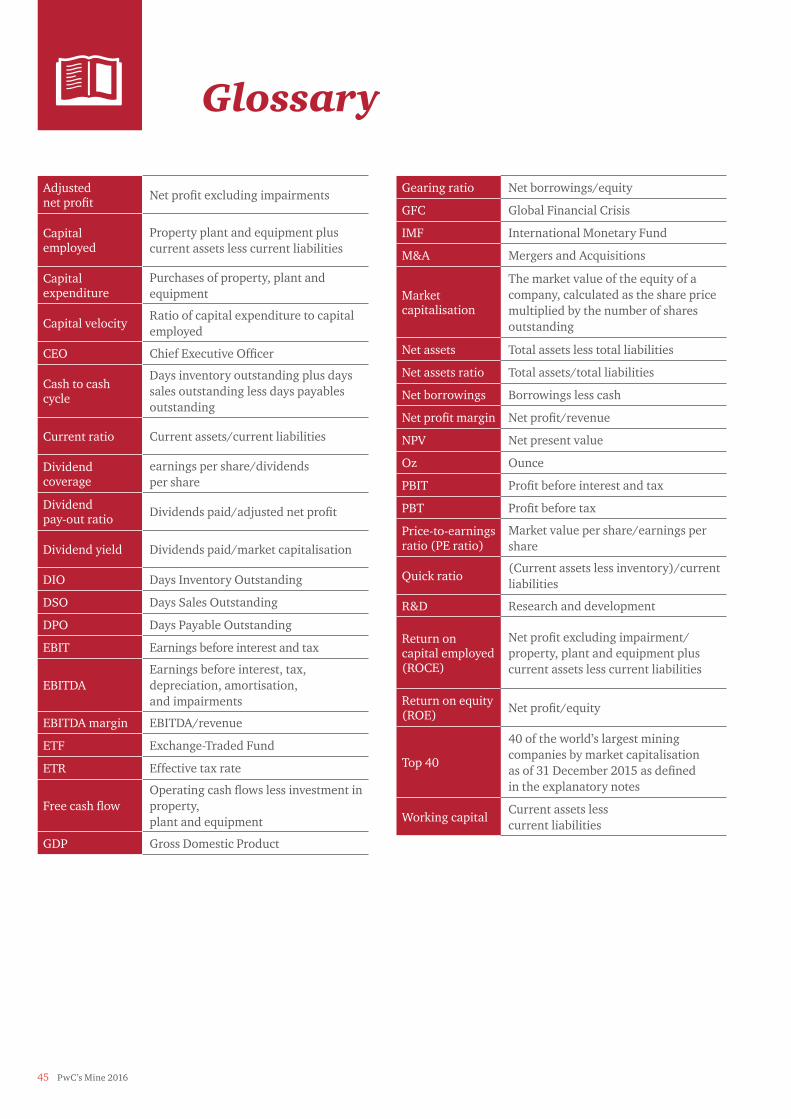
Gearing ratio Net borrowings/equity
GFC Global Financial Crisis
IMF International Monetary Fund
M&A Mergers and Acquisitions
Market capitalisation
The market value of the equity of a company, calculated as the share price multiplied by the number of shares outstanding
Net assets Total assets less total liabilities
Net assets ratio Total assets/total liabilities
Net borrowings Borrowings less cash
Net profit margin Net profit/revenue
NPV Net present value
Oz Ounce
PBIT Profit before interest and tax
PBT Profit before tax
Price-to-earnings ratio (PE ratio)
Market value per share/earnings per share
Quick ratio(Current assets less inventory)/current liabilities
R&D Research and development
Return on capital employed (ROCE)
Net profit excluding impairment/property, plant and equipment plus current assets less current liabilities
Return on equity (ROE) Net profit/equity
Top 40
40 of the world’s largest mining companies by market capitalisation as of 31 December 2015 as defined in the explanatory notes
Working capitalCurrent assets less current liabilities
Adjusted net profit Net profit excluding impairments
Capital employed
Property plant and equipment plus current assets less current liabilities
Capital expenditure
Purchases of property, plant and equipment
Capital velocityRatio of capital expenditure to capital employed
CEO Chief Executive Officer
Cash to cash cycle
Days inventory outstanding plus days sales outstanding less days payables outstanding
Current ratio Current assets/current liabilities
Dividend coverage
earnings per share/dividends per share
Dividend pay-out ratio Dividends paid/adjusted net profit
Dividend yield Dividends paid/market capitalisation
DIO Days Inventory Outstanding
DSO Days Sales Outstanding
DPO Days Payable Outstanding
EBIT Earnings before interest and tax
EBITDAEarnings before interest, tax, depreciation, amortisation, and impairments
EBITDA margin EBITDA/revenue
ETF Exchange-Traded Fund
ETR Effective tax rate
Free cash flowOperating cash flows less investment in property, plant and equipment
GDP Gross Domestic Product
Glossary
45 PwC’s Mine 2016

PwC’s Mine 2016 46
Explanatory notes to the financial analysisWe have analysed 40 of the largest listed mining companies by market capitalisation. Our analysis includes major companies in all parts of the world whose primary business is assessed to be mining. The results aggregated in this report have been sourced from the latest publicly available information, primarily annual reports and financial reports available to shareholders.
Where 2015 information was unavailable at the time of data collation, these companies have been excluded. Companies have different year-ends and report under different accounting regimes, including International Financial Reporting Standards (IFRS), United States Generally Accepted Accounting Principles (US GAAP) and others.
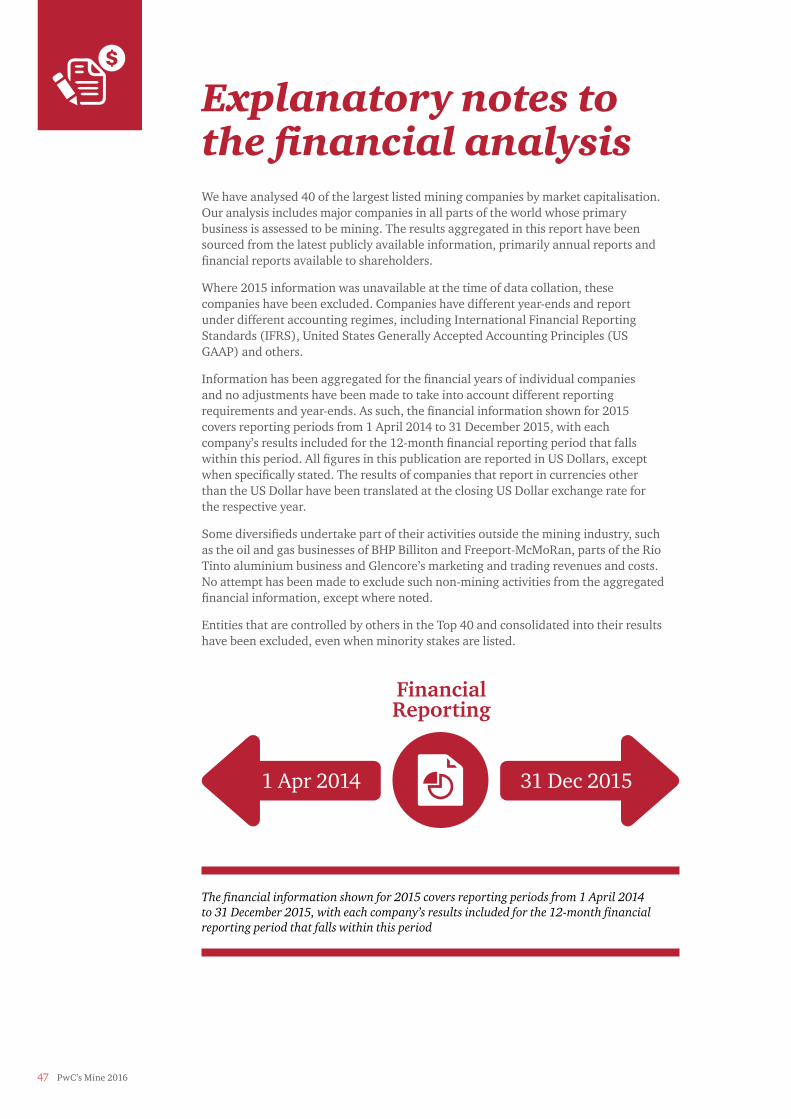
Information has been aggregated for the financial years of individual companies and no adjustments have been made to take into account different reporting requirements and year-ends. As such, the financial information shown for 2015 covers reporting periods from 1 April 2014 to 31 December 2015, with each company’s results included for the 12-month financial reporting period that falls within this period. All figures in this publication are reported in US Dollars, except when specifically stated. The results of companies that report in currencies other than the US Dollar have been translated at the closing US Dollar exchange rate for the respective year.
Some diversifieds undertake part of their activities outside the mining industry, such as the oil and gas businesses of BHP Billiton and Freeport-McMoRan, parts of the Rio Tinto aluminium business and Glencore’s marketing and trading revenues and costs. No attempt has been made to exclude such non-mining activities from the aggregated financial information, except where noted.
Entities that are controlled by others in the Top 40 and consolidated into their results have been excluded, even when minority stakes are listed.
31 Dec 2015
Financial Reporting
The financial information shown for 2015 covers reporting periods from 1 April 2014 to 31 December 2015, with each company’s results included for the 12-month financial reporting period that falls within this period
1 Apr 2014
47 PwC’s Mine 2016

PwC’s Mine 2016 48
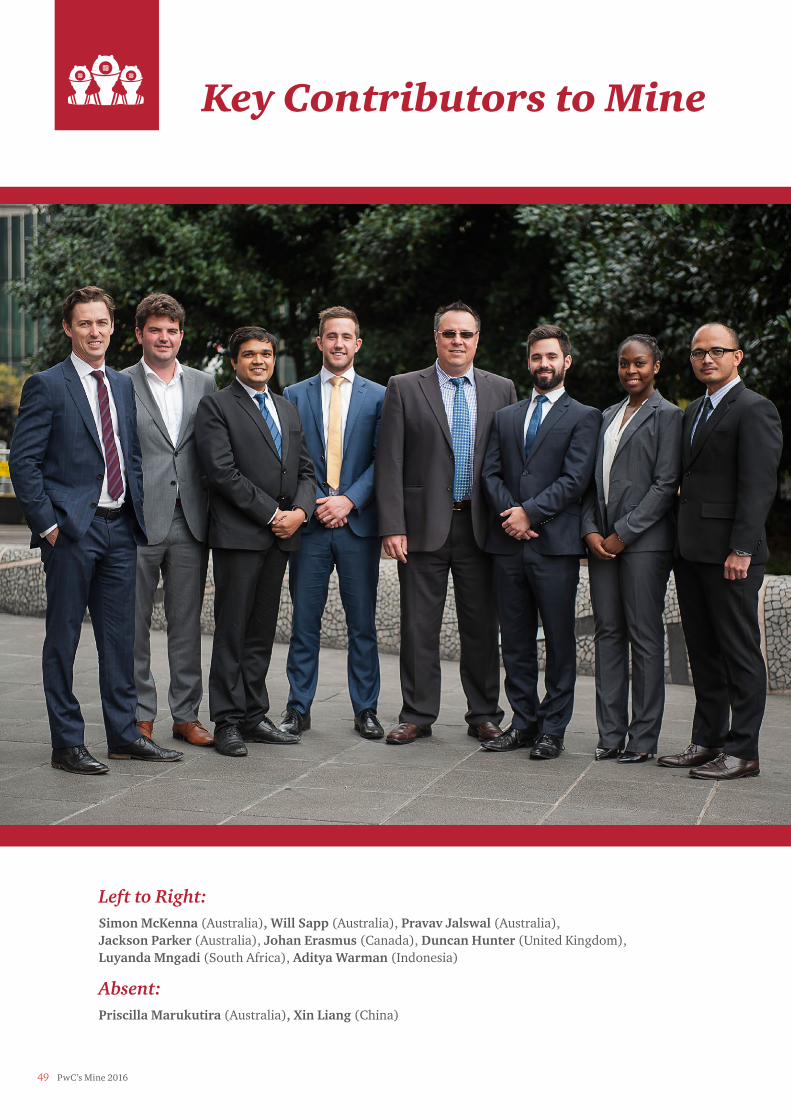
Key Contributors to Mine
Left to Right: Simon McKenna (Australia), Will Sapp (Australia), Pravav Jalswal (Australia), Jackson Parker (Australia), Johan Erasmus (Canada), Duncan Hunter (United Kingdom), Luyanda Mngadi (South Africa), Aditya Warman (Indonesia)
Absent: Priscilla Marukutira (Australia), Xin Liang (China)
49 PwC’s Mine 2016

Contacting PwCFor a deeper discussion please contact one of our regional leaders or your local PwC partner:
Global Mining Leadership Team
Global Mining LeaderJock O’Callaghan, Melbourne+61 (3) 8603 6137 [email protected]
ArgentinaLeo Viglione, Buenos Aires +54 11 4850 4690 [email protected] Australia Chris Dodd, Melbourne +61 3 8603 3130 [email protected] BrazilRonaldo Valino, Rio de Janeiro+55 21 3232 6139 [email protected] Canada Liam Fitzgerald, Toronto+1 416 869 2601 [email protected] Chile Colin Becker, Santiago+56 229400689 [email protected]
China Rita Li, Beijing +86 (10) 6533 2365 [email protected]
India Kameswara (Kami) Rao, Hyderabad+91 (40) 44246688 [email protected]
Indonesia Sacha Winzenried, Jakarta +62 21 5212901 [email protected] Peru Alfredo Remy, Lima+51 (1) 211 6500 [email protected]
Russia and CISEvgeny Orlovskiy, Moscow+7 (495) 223-5176 [email protected] South Africa Michal Kotze, Johannesburg+27 (11) 797 4603 [email protected] United KingdomJason Burkitt, London+44 (0) 20 7213 2515 [email protected] United StatesJim Moraga, Denver+1 720 931 7457 [email protected]
Functional Mining Leadership Team
AssuranceJason Burkitt, London+44 (0) 20 7213 2515 [email protected]
ConsultingCalum Semple, Toronto+1 416 815 5325 [email protected] MarketingJacqui Thurlow, Brisbane +61 7 3257 5311 [email protected]
DealsWim Blom, Brisbane+61 (7) 3257 5236 [email protected]
TaxJames Strong, Melbourne+61 (3) 8603 6599 [email protected]
PwC’s Mine 2016 50

pwc.com/mining
This publication has been prepared for general guidance on matters of interest only, and does not constitute professional advice. You should not act upon the information contained in this publication without obtaining specific professional advice. No representation or warranty (express or implied) is given as to the accuracy or completeness of the information contained in this publication, and, to the extent permitted by law, PwC does not accept or assume any liability, responsibility or duty of care for any consequences of you or anyone else acting, or refraining to act, in reliance on the information contained in this publication or for any decision based on it.
At PwC, our purpose is to build trust in society and solve important problems. We’re a network of firms in 157 countries with more than 208,000 people who are committed to delivering quality in assurance, advisory and tax services. Find out more and tell us what matters to you by visiting us at www.pwc.com.
© 2016 PwC. All rights reserved. “PwC” refers to the PwC network and/or one or more of its member firms, each of which is a separate legal entity. Please see www.pwc.com/structure for further details.