mineral exploration trends simexmin 2014 - adimb mauricio goncalves... · mineral exploration...
TRANSCRIPT

FH
&G
Consu
ltore
s -
Si
mexm
in 2
014
Mineral Exploration Trends
Simexmin 2014
Mauricio Ferreira
May 2014
FH
&G
Consu
ltore
s -
Si
mexm
in 2
014

FH
&G
Consu
ltore
s -
Si
mexm
in 2
014
Price evolution of selected commodities
Last 20 years, april 94=1
Source: Indexmundi

FH
&G
Consu
ltore
s -
Si
mexm
in 2
014
Mining
A confidence crisis
Market explicit concerns
prices volatility
resource nationalism
social license to operate
costs control
capital discipline
risk management
Source: pwc
FH
&G
Consu
ltore
s -
Si
mexm
in 2
014
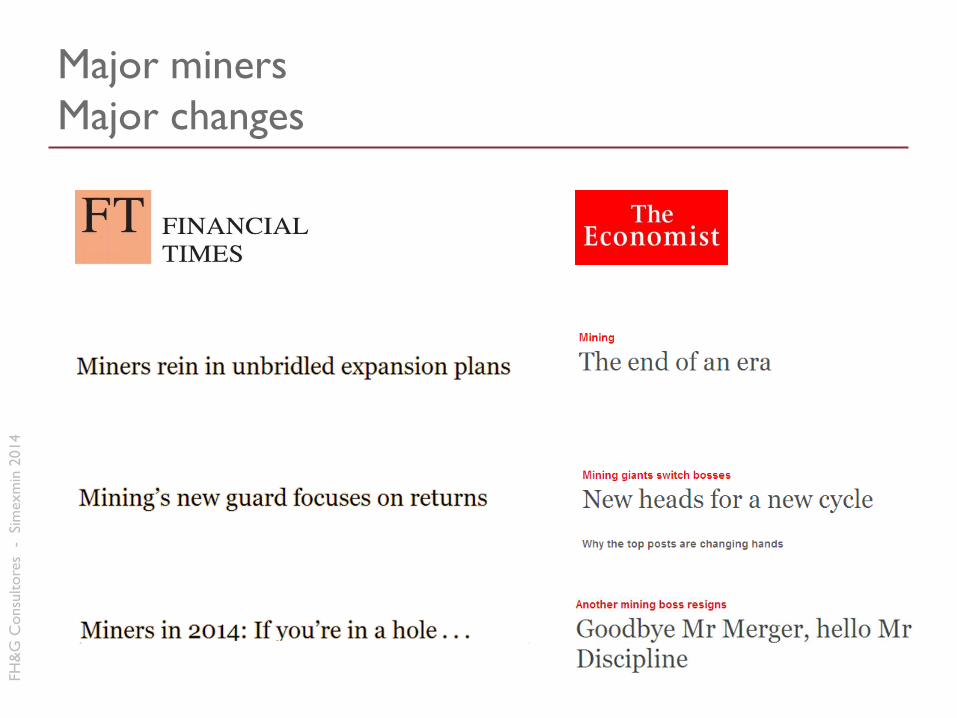
Major miners
Major changes
FH
&G
Consu
ltore
s -
Si
mexm
in 2
014
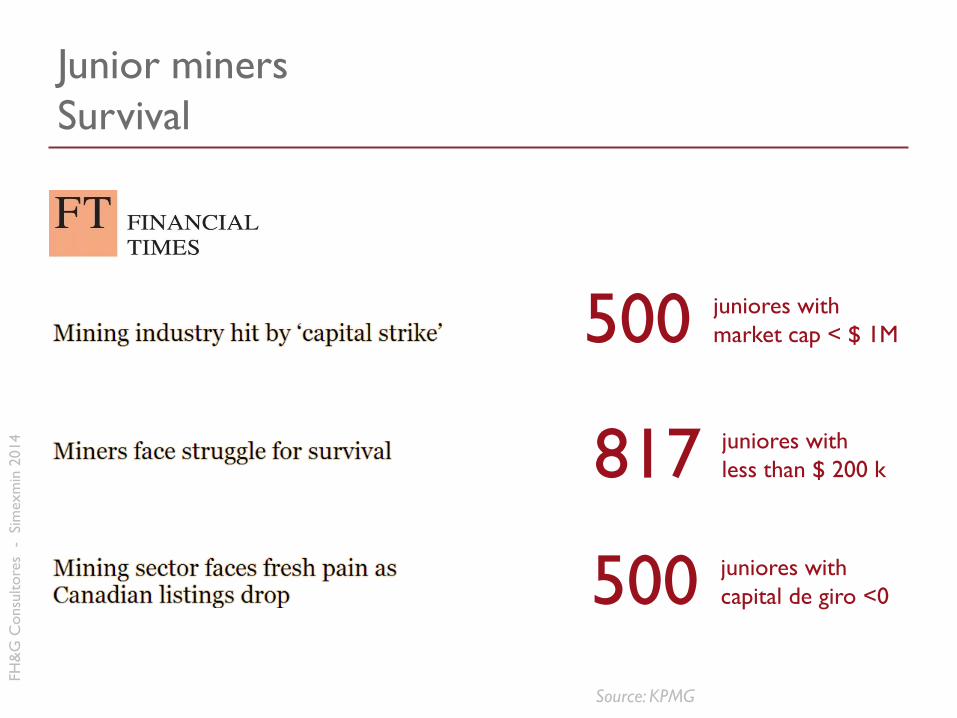
Junior miners
Survival
817 juniores with
less than $ 200 k
500 juniores with
market cap < $ 1M
500 juniores with
capital de giro <0
Source: KPMG

FH
&G
Consu
ltore
s -
Si
mexm
in 2
014
TSX Venture Capital Highlights
Junior Miners
14
23
37
21
11
09 10 11 12 13
Market Cap TSXV Miners, USS$ bi
1287 companies
-70% last 2 years
36
49 52 45
24
09 10 11 12 13
Number of IPO’s
-54% last 2 years
Source: PWC

FH
&G
Consu
ltore
s -
Si
mexm
in 2
014
Sources: SNL & IFC (modified by FH&G)
Global exploration expenditures
Non-ferrous minerals
2
22
15
??
0
1
2
3
4
5
0
5
10
15
20
25
´94 ´95 ´96 ´97 ´98 ´99 ´00 ´01 ´02 ´03 ´04 ´05 ´06 ´07 ´08 ´09 ´10 ´11 ´12 ´13 ´14
IFC
M
eta
ls P
rice
Index, 1
994=
1
Glo
bal
Explo
ration E
xpenditure
s. U
S$ b
illio
n $15 bi
spent in
2013
30% less than
2012

FH
&G
Consu
ltore
s -
Si
mexm
in 2
014
151
20
12
43
76
94-98 99-03 04-08 09-13 Total
Glo
bal
Explo
ration E
xpenditure
s. U
S$ b
illio
n
Source: SNL, (modified by FH&G)
Global exploration expenditures
Non-ferrous minerals
$151 bi
79%
50%
last 10
years
last 5
years
last 20
years
FH
&G
Consu
ltore
s -
Si
mexm
in 2
014
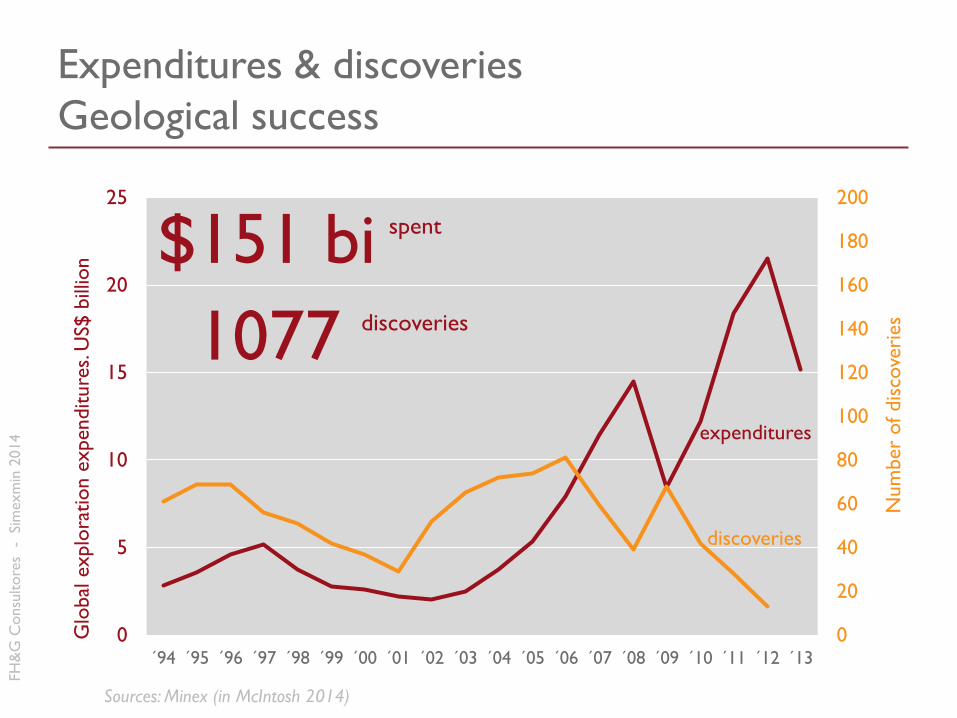
Expenditures & discoveries
Geological success
0
20
40
60
80
100
120
140
160
180
200
0
5
10
15
20
25
´94 ´95 ´96 ´97 ´98 ´99 ´00 ´01 ´02 ´03 ´04 ´05 ´06 ´07 ´08 ´09 ´10 ´11 ´12 ´13
Num
ber
of dis
cove
ries
Glo
bal
explo
ration e
xpenditure
s. U
S$ b
illio
n
Sources: Minex (in McIntosh 2014)
1077 discoveries
$151 bi spent
discoveries
expenditures
FH
&G
Consu
ltore
s -
Si
mexm
in 2
014
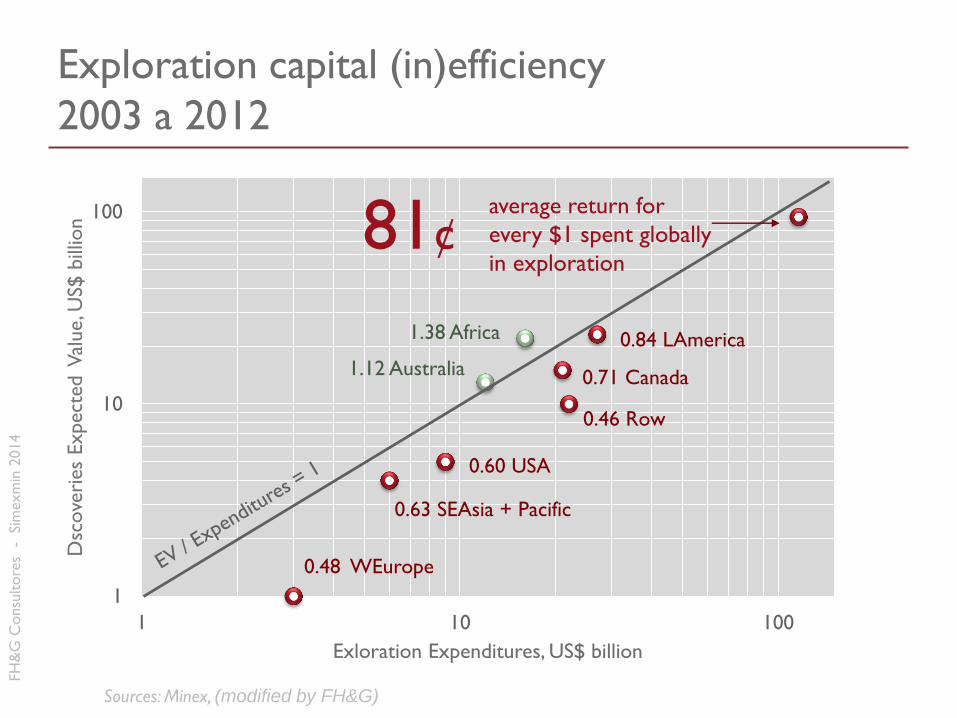
Exploration capital (in)efficiency
2003 a 2012
1
10
100
1 10 100
Dsc
ove
ries
Expect
ed V
alue, U
S$ b
illio
n
Exloration Expenditures, US$ billion
0.46 Row
0.71 Canada
0.60 USA
0.63 SEAsia + Pacific
0.84 LAmerica
1.12 Australia
0.48 WEurope
1.38 Africa
Sources: Minex, (modified by FH&G)
81¢ average return for
every $1 spent globally
in exploration
FH
&G
Consu
ltore
s -
Si
mexm
in 2
014
0
10
20
30
40
50
60
0
5
10
15
20
25
30
1840 2005
Gold
Gra
des, g
/t
Copper
Gra
des, %
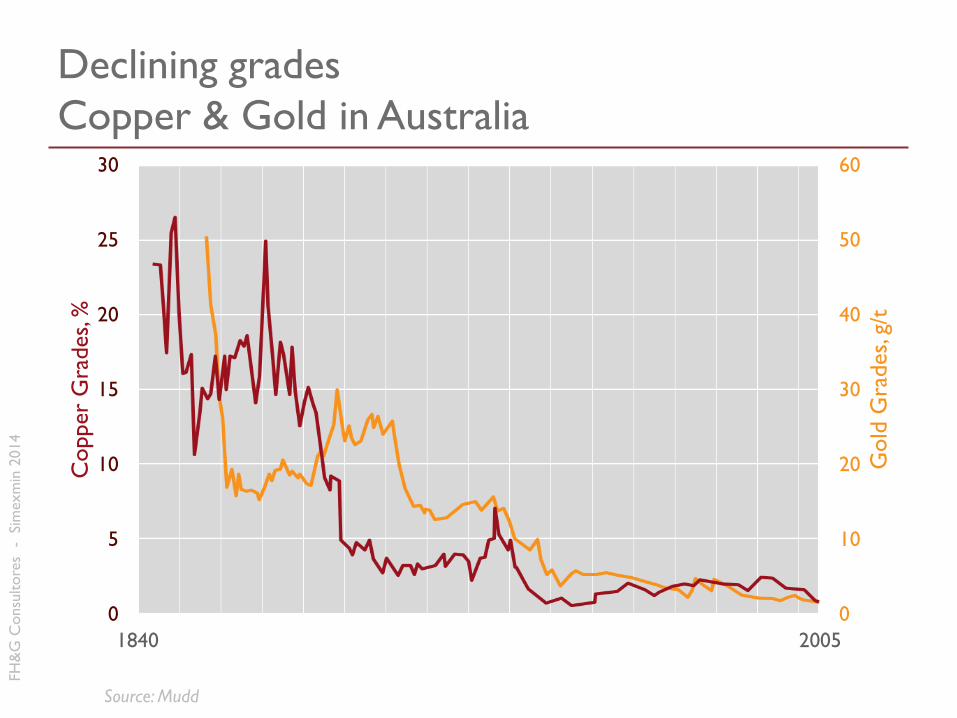
Declining grades
Copper & Gold in Australia
Source: Mudd

FH
&G
Consu
ltore
s -
Si
mexm
in 2
014
Declining grades
Copper
0
2000
4000
6000
8000
10000
0,5
0,6
0,7
0,8
0,9
1,0
93 94 95 96 97 98 99 00 01 02 03 04 05 06 07 08 09 10 11 12
Copper
Pri
ce, U
S$/t
Copper
Head
Gra
des, %
world average head grade
major producers head grade
copper price
Source:s Crowson, SNL & IFC, (modified by FH&G)
30% decrease
01 to 12

FH
&G
Consu
ltore
s -
Si
mexm
in 2
014
Increasing discovery depths
Australia
Source: Minex,
FH
&G
Consu
ltore
s -
Si
mexm
in 2
014
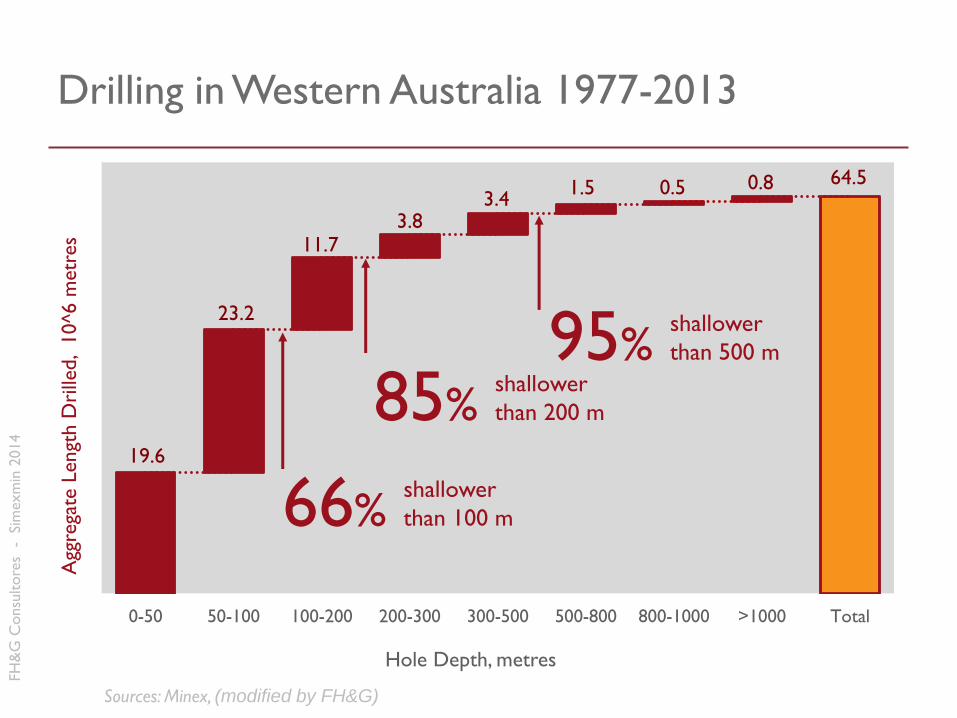
Drilling in Western Australia 1977-2013
19.6
23.2
11.7 3.8
3.4 1.5 0.5 0.8 64.5
0-50 50-100 100-200 200-300 300-500 500-800 800-1000 >1000 Total
Agg
rega
te L
engt
h D
rille
d,
10^6 m
etr
es
Hole Depth, metres
95% shallower
than 500 m
85% shallower
than 200 m
Sources: Minex, (modified by FH&G)
66% shallower
than 100 m

FH
&G
Consu
ltore
s -
Si
mexm
in 2
014
Models & technology
Risk analysis
Province District Camp Deposit

FH
&G
Consu
ltore
s -
Si
mexm
in 2
014

FH
&G
Consu
ltore
s -
Si
mexm
in 2
014
Thank you

FH
&G
Consu
ltore
s -
Si
mexm
in 2
014
Resource nationalism
40 countries considering
increases in government
share of mining revenue
past 3 years
FH
&G
Consu
ltore
s -
Si
mexm
in 2
014
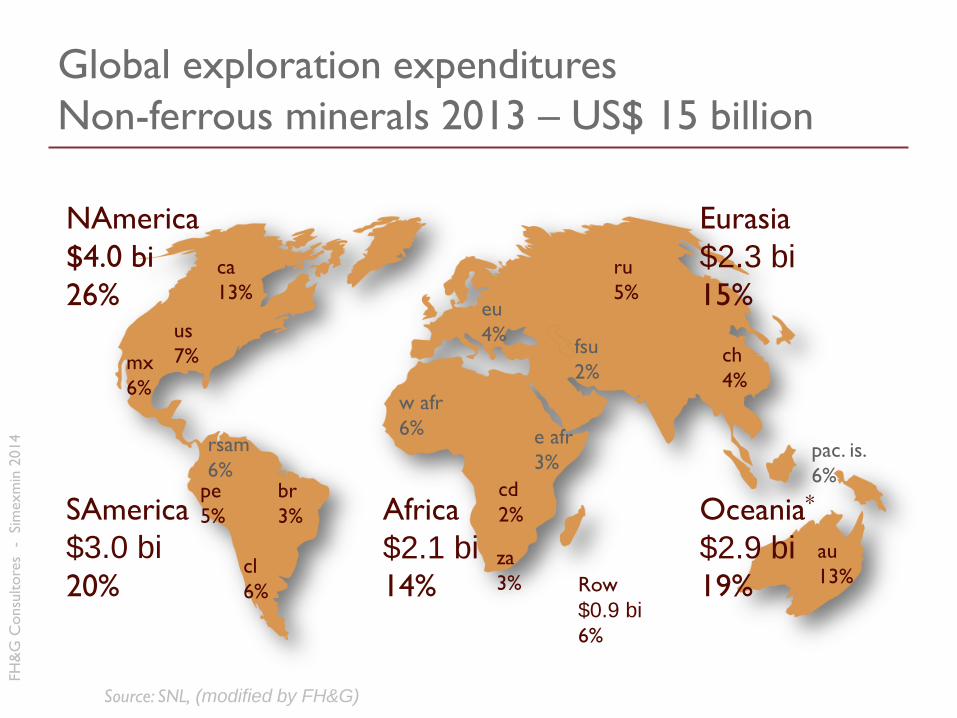
Global exploration expenditures
Non-ferrous minerals 2013 – US$ 15 billion
ca
13%
us
7% mx
6%
br
3%
pe
5%
cl
6%
au
13% za
3%
cd
2%
ru
5%
ch
4%
eu
4%
w afr
6% e afr
3% pac. is.
6%
fsu
2%
NAmerica
$4.0 bi
26%
SAmerica
$3.0 bi
20%
Africa
$2.1 bi
14%
rsam
6%
Oceania*
$2.9 bi
19%
Eurasia
$2.3 bi
15%
Row
$0.9 bi
6%
Source: SNL, (modified by FH&G)

FH
&G
Consu
ltore
s -
Si
mexm
in 2
014
20 km
Thank
you