mineral resource assessment of heavy mineral… · orange to light brown, unconsolidated, heavy...
TRANSCRIPT
Apache Mesa Assessment September 2016
MINERAL RESOURCE ASSESSMENT OF HEAVY MINERAL, BEACH-
PLACER SANDSTONE DEPOSITS AT APACHE MESA, JICARILLA
APACHE RESERVATION, RIO ARRIBA COUNTY, NEW MEXICO
Virginia T. McLemore1, John Asafo-Akowuah2, and Alanna Robison3
1Senior Economic Geologist, Certified Professional Geologist #CPG-7438, New Mexico Bureau
of Geology and Mineral Resources, New Mexico Institute of Mining and Technology, Socorro,
NM 87801 2Department of Mineral Engineering, New Mexico Institute of Mining and Technology, Socorro,
NM 87801 3Department of Earth and Environmental Sciences, New Mexico Institute of Mining and
Technology, Socorro, NM 87801
OPEN-FILE REPORT 587
September 30, 2016
New Mexico Bureau of Geology and Mineral Resources
A division of New Mexico Institute of Mining and Technology
1

Apache Mesa Assessment September 2016
SUMMARY
Several Cretaceous heavy mineral, beach-placer sandstone deposits are found in the Point
Lookout Sandstone on the Jicarilla Apache Reservation, Rio Arriba County, New Mexico.
Beach-placer sandstone deposits are accumulations of heavy, resistant minerals (i.e. high specific
gravity) that form on the upper regions of beaches or in long-shore bars in a marginal-marine
environment. They form by mechanical concentration (i.e. settling) of heavy minerals by the
action of waves, currents, and winds. Modern examples are found along the Atlantic Coast in the
United States, southeastern Australia, and Andhra Pradesh, India, where they are mined for
titanium, zircon, and locally, monazite (a Ce-bearing rare earth elements, REE, mineral). Other
potential commodities include niobium, chromium, thorium, and rare earth elements (REE). The
Apache Mesa beach-placer sandstone deposit is similar in origin, texture, mineralogy, and
chemical composition to beach-placer sandstone deposits elsewhere in the San Juan Basin and in
the world. Although, some individual analyses of samples from Apache Mesa contained high
concentrations of TiO2 (15%), Cr (590 ppm), Nb (260 ppm), Zr (10,000 ppm), Th (258 ppm),
and TREE (2,692 ppm); the Apache Mesa beach-placer sandstone deposit contains only 132,900
short tons (120,564 metric tons) of ore with grades of 3% TiO2, 108 ppm Cr, 46 ppm Nb, 2,187
ppm Zr, 40 ppm Th, and 522 ppm TREE. In conclusion, the Apache Mesa heavy mineral, beach-
placer sandstone deposit is too small and low grade to be economic in today’s market. No further
investigation is recommended at this time.
2

Apache Mesa Assessment September 2016
TABLE OF CONTENTS
SUMMARY .................................................................................................................................... 2
INTRODUCTION .......................................................................................................................... 9
Purpose ...................................................................................................................................... 13
History and previous work ........................................................................................................ 13
PROPERTY DESCRIPTION ....................................................................................................... 14
Location .................................................................................................................................... 14
Access ....................................................................................................................................... 14
Physiography............................................................................................................................. 14
Climate ...................................................................................................................................... 14
Vegetation and Wildlife ............................................................................................................ 16
Infrastructure ............................................................................................................................. 16
ANALYTICAL METHODS ........................................................................................................ 17
Mapping and Sample Collection ............................................................................................... 17
Drilling ...................................................................................................................................... 18
Petrographic Descriptions ......................................................................................................... 21
Chemical Analyses.................................................................................................................... 21
Electron Microprobe Mineralogical Analyses .......................................................................... 22
Specific Gravity Measurements ................................................................................................ 24
Calculation of Ore Resources ................................................................................................... 25
Quality Control Procedures and Sample Security .................................................................... 26
REGIONAL GEOLOGICAL SETTING ...................................................................................... 27
GEOLOGY OF APACHE MESA ................................................................................................ 27
Geologic Setting........................................................................................................................ 27
3

Apache Mesa Assessment September 2016
Structure .................................................................................................................................... 34
Mineralogy and Chemistry of the Apache Mesa Beach-placer Sandstone Deposit ................. 35
Hydrology ................................................................................................................................. 36
Environmental concerns............................................................................................................ 36
DESCRIPTIONS OF OTHER BEACH-PLACER SANDSTONE DEPOSITS .......................... 36
San Juan Basin, New Mexico ................................................................................................... 36
Sanostee deposit, San Juan County ....................................................................................... 36
Standing Rock (Flat Top Hill) deposit, McKinley County ................................................... 39
B.P. Hovey Ranch, Sandoval County ................................................................................... 40
Descriptions of Pliocene beach-placer sandstone deposits, Virginia ........................................ 42
COMPARISON OF MINERALOGY AND CHEMISTRY OF BEACH-PLACER
SANDSTONE DEPOSITS ........................................................................................................... 44
ORIGIN OF BEACH-PLACER SANDSTONE DEPOSITS ....................................................... 48
MINERAL RESOURCE POTENTIAL ....................................................................................... 49
CONCLUSIONS........................................................................................................................... 50
ACKNOWLEDGMENTS ............................................................................................................ 51
REFERENCES ............................................................................................................................. 51
FIGURES
FIGURE 1. Idealized cross-section of formation of heavy mineral, beach-placer sandstone
deposits (Houston and Murphy, 1970, 1977).
FIGURE 2. Location of Late Cretaceous heavy mineral, beach-placer sandstone deposits in the
San Juan Basin, New Mexico. Deposits are described in McLemore (2010) and
McLemore and Robinson (2016).
FIGURE 3. Location of Apache Mesa deposit, Jicarilla Apache Reservation, Rio Arriba County,
New Mexico.
4
Apache Mesa Assessment September 2016
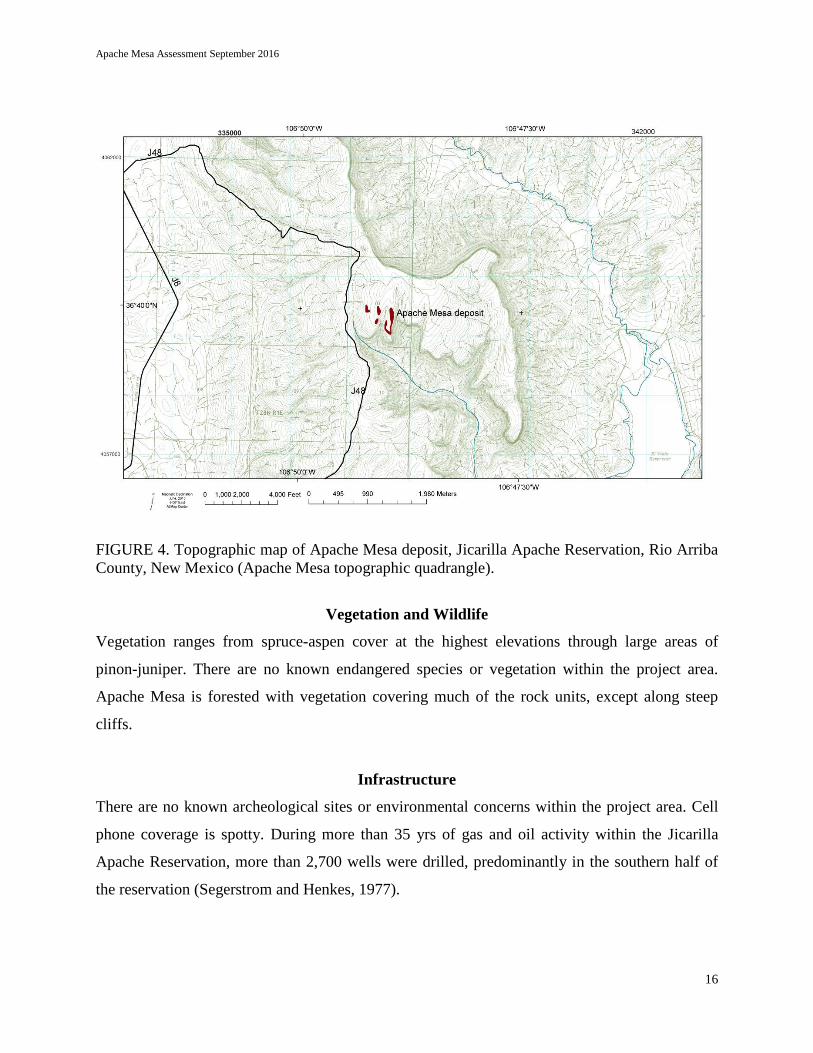
FIGURE 4. Topographic map of Apache Mesa deposit, Jicarilla Apache Reservation, Rio Arriba
County, New Mexico (Apache Mesa topographic quadrangle).
FIGURE 5. Location of stratigraphic section described in Appendix 2.
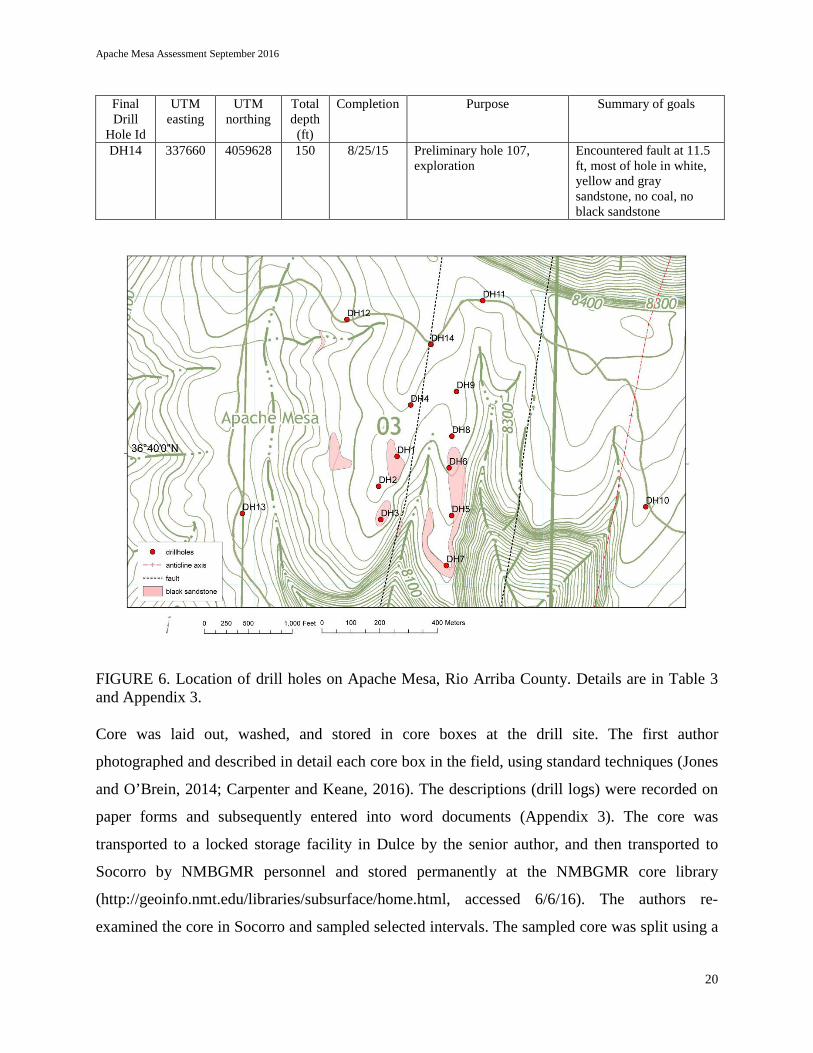
FIGURE 6. Location of drill holes on Apache Mesa, Rio Arriba County. Details are in Table 3
and Appendix 3.
FIGURE 7. Location of surface and drill hole samples for chemical analyses. Details are in
Appendix 6.
FIGURE 8. Location of polygons for calculating the ore reserves at Apache Mesa. Note that two
ore blocks, 19 and 20 are in the subsurface. The two polygons without numbers cannot be
mined because of steep topography.
FIGURE 9. Stratigraphic framework and nomenclature of the Late Cretaceous sedimentary rocks
in the San Juan Basin (simplified from Molenaar, 1989; Craigg et al., 1990). Gray-shaded
sandstone units are hosts of known beach-placer sandstone deposits in the San Juan
Basin.
FIGURE 10. Geologic map of the Apache Mesa area, Rio Arriba County, New Mexico. Cross
sections are below.
FIGURE 11. Point Lookout Sandstone forming cliffs overlying Mancos Shale (covered slopes)
at Apache Mesa (looking east). Photograph by V.T. McLemore.
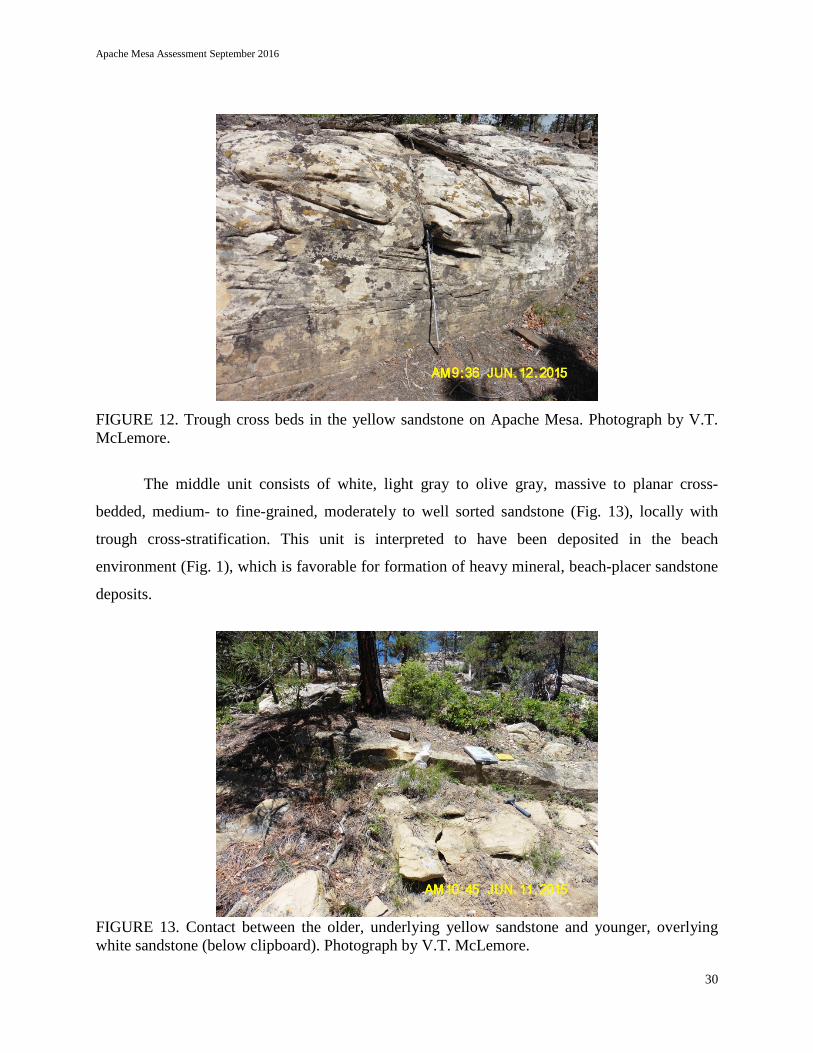
FIGURE 12. Trough cross beds in the yellow sandstone on Apache Mesa. Photograph by V.T.
McLemore.
FIGURE 13. Contact between the older, underlying yellow sandstone and younger, overlying
white sandstone. Photograph by V.T. McLemore.
FIGURE 14. Beach-placer sandstone deposit overlying the white sandstone in the Point Lookout
Sandstone at Apache Mesa. Photograph by V.T. McLemore.
FIGURE 15. Close-up of beach-placer sandstone at Apache Mesa. Photograph by V.T.
McLemore.
FIGURE 16. North-south cross sections across Apache Mesa. Location of cross sections are in
Figure 10.
5
Apache Mesa Assessment September 2016
FIGURE 17. East-west cross section across Apache Mesa.
FIGURE 18. Western fault trending northeast (left of Dan Koning). Photograph by V.T.
McLemore.
FIGURE 19. Electron microprobe picture of sample SL 16 (Apache Mesa). Zircon grains are
labeled in red. Chromite is labeled in blue. Mottled, lighter colored cement is iron oxide
(hematite). Dark grains are mainly quartz. Photograph by A. Robison.
FIGURE 20. Geologic map of the Sanostee beach-placer sandstone deposits, in section 31,
T26N, R19W, McKinley County, New Mexico. Mapping of the deposit was by V.T.
McLemore in 2009, modified from Beaumont (1954), Dow and Batty (1961), Bingler
(1963), and Force (2000).
FIGURE 21. Beach-placer sandstone at Sanostee, McKinley County, New Mexico. Photograph
by V.T. McLemore.
FIGURE 22. Electron microprobe photo showing distribution of zircon, ilmenite and monazite
grains in sample SAN 6 (Sanostee). Zircon grains are labeled in red, ilmenite in blue, and
monazite in yellow. Mottled, lighter colored cement is iron oxide (hematite). Dark grey
grains are mainly quartz. Black areas are pore spaces. Photograph by A. Robison.
FIGURE 23. Geologic map of the Standing Rock beach-placer sandstone deposit in section 35,
T18N, R14W, McKinley County, New Mexico. Mapping of the deposit was by V.T.
McLemore in 2009, sedimentary geology modified from Kirk and Sullivan (1987).
FIGURE 24. Beach-placer sandstone at Standing Rock, McKinley County, New Mexico.
Photograph by V.T. McLemore.
FIGURE 25. Geologic map of the B.P. Hovey beach-placer sandstone deposit, Sandoval County,
New Mexico. Mapping of the deposit was by V.T. McLemore in 1981 and 2015.
Sedimentary geology is modified from Tabet and Frost (1979).
FIGURE 26. Beach-placer sandstone at B.P. Hovey, Sandoval County, New Mexico. Photograph
by V.T. McLemore.
FIGURE 27. Small beach placer sandstone deposit along the James River, Virginia. This deposit
is less than 1 ft thick and several 10s of ft long. It formed in a small cove along the edge
of the river. Photograph by V.T. McLemore.
6

Apache Mesa Assessment September 2016
FIGURE 28. Orange to light brown, unconsolidated, heavy mineral, beach-placer sands mined at
the Concord mine, Virginia. Photograph by V.T. McLemore.
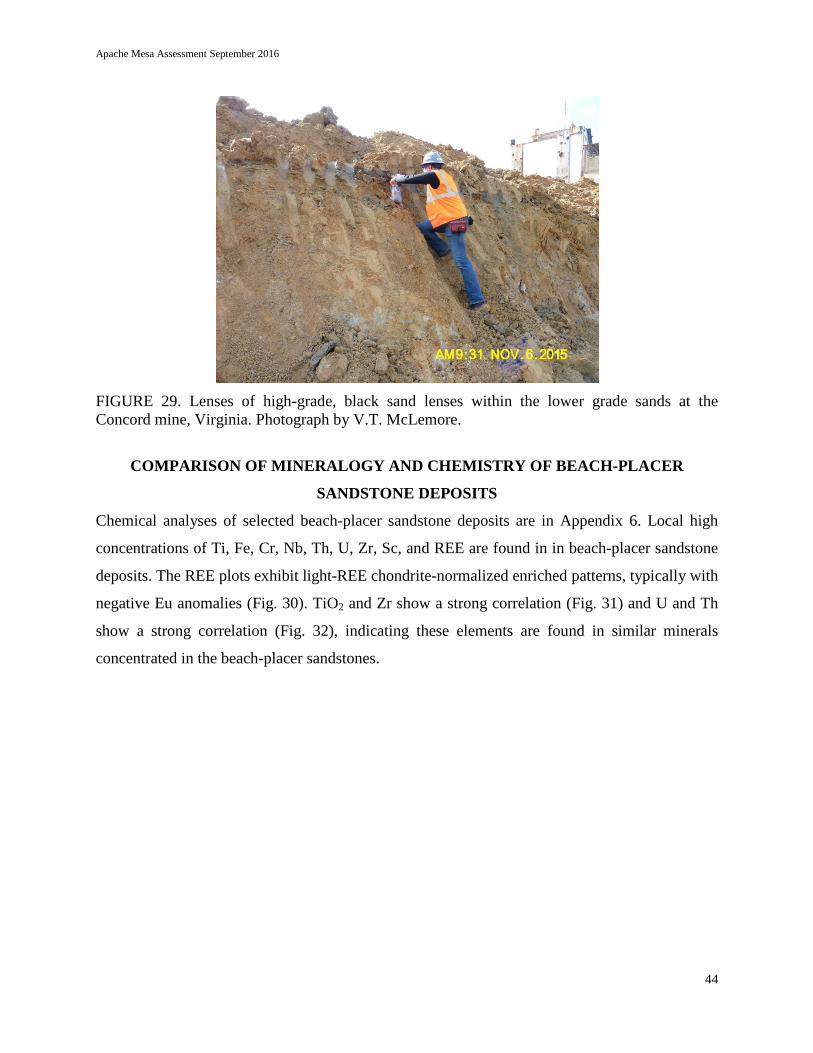
FIGURE 29. Lenses of high-grade, black sand lense at the Concord mine, Virginia. Photograph
by V.T. McLemore.
FIGURE 30. Chondrite-normalized REE plot of selected beach-placer deposits, Apache Mesa
(red), Standing Rock (light blue), Sanostee (dark blue), B.P. Hovey (black), San Juan
Basin, New Mexico and Virginia (green). Chemical analyses are in Appendix 6.
Chondrite values are from Nakamura (1974).
FIGURE 31. Zr-TiO2 plot of selected beach-placer deposits, Apache Mesa (red), Standing Rock
(light blue), Sanostee (dark blue), and B.P. Hovey (black), San Juan Basin, New Mexico
and Virginia (green). Chemical analyses are in Appendix 6.
FIGURE 32. U-Th plot of selected beach-placer deposits, Apache Mesa (red), Standing Rock
(light blue), Sanostee (dark blue), and B.P. Hovey (black), San Juan Basin, New Mexico
and Virginia (green). Chemical analyses are in Appendix 6.
FIGURE 33. Chondrite-normalized REE plot of selected monazites from beach-placer deposits,
Apache Mesa (red), Sanostee (dark blue), San Juan Basin, New Mexico and Virginia
(green). Chemical analyses are in Appendix 9. Chondrite values are from Nakamura
(1974).
FIGURE 34. Th+U+Si verses TREE of selected monazites from beach-placer deposits, Apache
Mesa (red), Sanostee (dark blue), San Juan Basin, New Mexico and Virginia (green).
Chemical analyses are in Appendix 9.
TABLES
TABLE 1. Some uses of selected commodities found in Cretaceous heavy mineral, beach-placer
sandstone deposits in New Mexico. Price from U.S. Geological Survey (2016) for 2015.
TABLE 2. Summary of climate data for Dulce, New Mexico at an elevation of 6,791 ft
http://www.usclimatedata.com/climate/dulce/new-mexico/united-states/usnm0096
(accessed on 6/1/16).
7

Apache Mesa Assessment September 2016
TABLE 3. Completed drill locations, Apache Mesa REE project. UTM coordinates are in
NAD27 and represent final drill hole locations. Drill holes are located in Figure 6 and
final drilling report is in Appendix 3.
TABLE 4. Specific gravity measurements for selected samples. Sample locations and
descriptions are in Appendix 5. Specific areas are described below.
TABLE 5. Required data for calculating the value of a potential mineral deposit.
TABLE 6. Ore reserves for the Apache Mesa beach-placer sandstone deposit, New Mexico. New
Mexico data are in Appendix 9.
TABLE 7. Ore reserves for other heavy mineral beach-placer sandstone deposits in the world.
Iluka ore reserves are from http://www.iluka.com/docs/default-source/3.2-ore-reserves-
mineral-resources/annual-statement-of-reserves-and-resources2014.pdf?sfvrsn=4
(accessed 6/7/2016).
APPENDICES
APPENDIX 1. Glossary
APPENDIX 2. Stratigraphic section
APPENDIX 3. Final drilling report
APPENDIX 4. Drill hole graphic logs
APPENDIX 5. Petrographic descriptions
APPENDIX 6. Chemical analyses
APPENDIX 7. Quality control and quality assurance (QA/QC) report.
APPENDIX 8. Microprobe descriptions.
APPENDIX 9. Monazite compositions from electron microprobe analyses
APPENDIX 10. Ore reserves
PLATE 1. Geologic Map of Apache Mesa, Rio Arriba County, New Mexico
PLATE 2. Cross Sections of Apache Mesa, Rio Arriba County, New Mexico
8
Apache Mesa Assessment September 2016
INTRODUCTION
Several Cretaceous heavy mineral, beach-placer sandstone deposits are found in the Point
Lookout Sandstone on the Jicarilla Apache Reservation in Rio Arriba County. Beach-placer
sandstone deposits are accumulations of heavy, resistant minerals (i.e. high specific gravity) that
form on the upper regions of beaches or in long-shore bars in a marginal-marine environment.
They form by mechanical concentration (i.e. settling) of heavy minerals by the action of waves,
currents, and winds (Fig. 1; Bryan et al., 2007; van Gosen et al., 2014). Modern examples are
found along the Atlantic Coast in the United States (Koch, 1986; Carpenter and Carpenter, 1991;
Pirkel et al., 2009), Oregon (Peterson et al., 1986), southeastern Australia (Roy, 1999; Reid et al.,
2013), west coast of South Africa (Philander and Rozendall, 2015), Tartous, Syria (Kattaa,
2002), and Andhra Pradesh, India (Rao et al., 2008), where they are mined for titanium, zircon,
and locally, monazite (a Ce-bearing rare earth elements mineral). Other potential commodities
include niobium, chromium, thorium, and rare earth elements (REE). Detrital heavy minerals
comprise approximately 50–60% of these sandstones and typically consist of titanite, zircon,
magnetite, ilmenite, monazite, apatite, rutile, xenotime, garnet, and allanite, among other heavy
minerals. Most of these minerals have a high specific gravity exceeding 4 and are dark colored,
giving the sandstones a dark color, resulting in them also being called black sandstones.
Although beach-placer sandstone deposits are found in strata of all ages; the deposits in the San
Juan Basin in New Mexico are restricted to Late Cretaceous rocks belonging to the Gallup,
Dalton, Point Lookout, and Pictured Cliffs Sandstones (Fig. 2; Murphy, 1956; Allen, 1956;
Chenoweth, 1957; Houston and Murphy, 1970, 1977; Brookins, 1977; McLemore, 2010;
McLemore and Robinson, 2016). The beach-placer sandstones in New Mexico are black, dark
gray, to olive-brown, resistant to erosion, and radioactive due to radioactive zircon, monazite,
apatite, and thorium minerals. Anomalously high concentrations of titanium, iron, niobium,
thorium, uranium, zirconium, scandium, yttrium, and REE are characteristic of these deposits.
Similar Upper Cretaceous heavy mineral, beach-placer sandstone deposits are found throughout
Montana, Wyoming, Utah, Arizona, and Colorado (Dow and Batty, 1961; Houston and Murphy,
1970, 1977; Zech et al., 1994).
9

Apache Mesa Assessment September 2016
FIGURE 1. Idealized cross-section of formation of heavy mineral, beach-placer sandstone deposits (Houston and Murphy, 1970, 1977).
The mineral sands industry refers to deposits containing concentrations of heavy minerals
in alluvial (beach or river system) or aeolian (dune sands) environments and consists of two
important products: titanium minerals (rutile, ilmenite, leucoxene) and zircon (Jones, 2009;
Pirkle et al., 2009). Other heavy minerals are found in many mineral sands that can be economic
(Table 1; such as monazite, garnet, staurolite, kyanite) and are mined locally. Only India is
currently mining monazite for REE (http://seekingalpha.com/article/3585086-big-rare-earth-
story-one-talking, accessed 6/1/2016).
Many of the elements potentially found in beach-placer sandstone deposits, especially
titanium and REE (including yttrium and scandium), are increasingly becoming more important
in our technological society and are used in many of our electronic devices, such as cell phones,
computer monitors, televisions, solar panels, wind turbines, etc. (Table 1; Morteani, 1991; Long
et al., 2010; McLemore, 2011). Titanium is a major component of pigment, glazes, and light-
weight metal alloys (Force, 1991, 2000; Jones, 2009). Titanium in pigment is an important
ingredient in paint, plastics, and paper, not only for its white color but also because it has a high
refractive index. Titanium metal has a high strength to weight ratio and is resistant to corrosion.
Zircon is important in the refractory industry (Jones, 2009).
REE include the 15 lanthanide elements (atomic number 57–71), yttrium (Y, atomic
number 39), and scandium (Sc) and are commonly divided into two chemical groups, the light
10

Apache Mesa Assessment September 2016
REE (La through Eu) and the heavy REE (Gd through Lu and Y). REE are lithophile elements
(or elements enriched in the crust) that have similar physical and chemical properties, and,
therefore, occur together in nature. The United States once produced enough REE for United
States consumption, but since 1999 more than 90% of the REE required by United States
industry have been imported from China. However, the projected increase in demand for REE in
China, Japan, India, United States, Europe, and other countries could result in increased
exploration and ultimate production from future deposits in the United States and elsewhere.
Furthermore, specific REE are becoming more economically important, especially the heavy
REE.
FIGURE 2. Location of Late Cretaceous heavy mineral, beach-placer sandstone deposits in the San Juan Basin, New Mexico. Deposits are described in McLemore (2010) and McLemore and Robinson (2016).
11

Apache Mesa Assessment September 2016
TABLE 1. Some uses of selected commodities found in Cretaceous heavy mineral, beach-placer sandstone deposits in New Mexico. Price is from U.S. Geological Survey (2016) for 2015. Na=not available
Commodity Primary Mineral Specific
Gravity Price
($/metric ton)
Selected Uses
Titanium
Rutile (TiO2), leucoxene (TiO2), ilmenite (FeTiO3)
4.2–5.0 110 (ilmenite)-840 (rutile)
white pigment found in toothpaste, paint, paper, glazes, and some plastics, heat exchangers in desalination plants, alloys in aircraft, welding rods
Zirconium
Zircon (ZrSiO4) 4.7 1050 (zircon)
ceramic tiles, bricks used to line steel making furnaces, mold and chill sands, alloying agent in steel, laboratory crucibles
Iron Magnetite (Fe3O4) 5.2 na additive in cement, iron ore, steel
REE Monazite (Ce,La,Y,Th)PO4
4.9–5.3 na catalyst, glass, polishing, re-chargeable batteries, magnets, lasers, glass, TV color phosphors, solar panels, wind turbines
Niobium Trace element in other minerals
na na used in alloys including stainless steel, superconducting magnets for particle accelerators, MRI scanners
Chromium Chromite (FeCr2O4) 4.5–4.8 na Stainless steel
Uranium Monazite (Ce,La,Y,Th)PO4
4.9–5.3 na fuel for nuclear reactors to generate electricity, projectiles, shielding of radioactive materials
Thorium Monazite (Ce,La,Y,Th)PO4
4.9–5.3 na fuel for thorium-reactors
Yttrium Monazite (Ce,La,Y,Th)PO4, xenotime YPO4
4.9–5.3, 4.4–5.1
na additive in alloys to increase strength, microwave filters, lasers, catalyst
Staurolite Staurolite (Fe, Mg, Zn)2Al6O6(SiO4)4(O,OH)2
3.6–3.8 na abrasive
Kyanite Kyanite (Al2SiO5) 3.6–3.7 290 refractory products (bricks, mortars, kilns,
molds), brake shoes, clutch facings, porcelain
Garnet Garnet (Fe,Mn,Ca)3·Al2(SiO4)3
3.4–4.2 na abrasive
As the demand for some of these commodities increases due to increased price and short
supplies, the dollar value per ton of ore rises, enhancing deposit economics. Detailed mapping
and exploration drilling of these deposits are essential to fully evaluate their economic potential
(Bingler, 1968; Segerstrom and Henkes, 1977). Therefore the Jicarilla Tribe decided to examine
the Apache Mesa deposits to determine if they could be economic now or in the future.
12

Apache Mesa Assessment September 2016
Purpose
The purposes of this report are to: 1) describe the heavy mineral, beach-placer sandstone deposits
at Apache Mesa, 2) summarize the formation, tectonic setting, stratigraphy, and origin of these
deposits, 3) compare the Apache Mesa deposits to other known deposits in the San Juan Basin
and economic deposits in Virginia and elsewhere, and 4) summarize the economic mineral
potential of the Apache Mesa deposits. A glossary of terms is in Appendix 1.
History and previous work
Most of the Cretaceous heavy mineral, beach-placer sandstone deposits in New Mexico were
discovered during airborne gamma-ray radiometric surveys in the 1950s by the U.S. Atomic
Energy Commission while exploring for uranium (Murphy, 1956; Chenoweth, 1957), and
originally were simply identified as Airborne Anomaly Number 1, 2, and so forth. The airborne
anomalies were subsequently verified by field examinations that are documented by a series of
Preliminary Reconnaissance Reports (PRR; see McLemore, 1983). Similar beach-placer
sandstone deposits are found in Late Cretaceous rocks throughout the Rocky Mountain region
including Alberta (Canada), Montana, Wyoming, Colorado, Arizona, Utah, and northeastern
Mexico (Houston and Murphy, 1970, 1977; Force, 1991, 2000). Murphy (1956) described some
of the deposits in these states and recommended additional investigation. Chenoweth (1957),
Dow and Batty (1961), Overstreet (1967), Brookins (1977), and McLemore (2010) summarized
the stratigraphy and physical and chemical attributes of the deposits in the San Juan Basin.
Bingler (1963) described the Sanostee beach-placer deposit and Bingler (1968) described the
deposits at Apache Mesa (he named them Stinking Lake). Houston and Murphy (1970, 1977)
described the depositional environment of the deposits. Zech et al. (1994) described the deposits
on the Ute Indian Reservation and included detailed chemistry of most of these deposits
(McLemore, 2010). McLemore et al. (1988a, b) and McLemore (2015) discussed the REE
potential of beach-placer sandstone deposits in New Mexico.
13

Apache Mesa Assessment September 2016
PROPERTY DESCRIPTION
Location
The Apache Mesa deposits (also known as Airborne Anomalies 1–2, Stinking Lake) is in
sections 2 and 3, T28N, R1E (Apache Mesa topographic quadrangle) on the Jicarilla Apache
Reservation in the eastern San Juan Basin, northern New Mexico (Fig. 3). The original naming
of these deposits was Airborne Anomalies 1–2 as designated by the original U.S. Atomic Energy
Commission airborne survey. Bingler (1968) named the deposits Stinking Lake, after a nearby
lake. The name of the deposits was changed from Stinking Lake to Apache Mesa at the request
of some Tribal members.
The Jicarilla Apache Reservation was established in 1887 and expanded several times
since. There are approximately 3,400 tribal members
(http://www.bia.gov/WhoWeAre/RegionalOffices/Southwest/What/index.htm; accessed 6/1/16),
most live in the town of Dulce, north of Apache Mesa (Fig. 3). Dulce is the only town on the
Jicarilla Apache Reservation. Farmington is approximately 84 mi west of Dulce and Pagosa
Springs, Colorado is north of Dulce.
Access
U.S. 64, NM 17 and NM 537, cross the reservation (Fig. 3). Apache Mesa is accessed by
Highway J8 (paved), south out of Dulce. A dirt road, J48, leads from J8, south of Boulder Lake
to Apache Mesa (Fig. 4).
Physiography
The Apache Mesa area in eastern Rio Arriba County is on the edge of the Colorado Plateau and
Southern Rocky Mountain physiographic provinces. Eastern Rio Arriba County consists of
moderately rugged, forested mesas separated by broad bushy valleys. The Continental Divide is
west of Apache Mesa. Apache Mesa consists of rough terrain with steep slopes, narrow canyons
and broad, flat mesas (Fig. 4). Elevations range from 7,000 to 8,000 ft.
Climate
The climate of Apache Mesa is semiarid, with warm summers and cold winters (Table 2).
Monsoon rains in the summer and snow in the winter provide most of the precipitation (Table 2).
14

Apache Mesa Assessment September 2016
TABLE 2. Summary of climate data for Dulce, New Mexico at an elevation of 6,791 ft (http://www.usclimatedata.com/climate/dulce/new-mexico/united-states/usnm0096, accessed on 6/1/16).
January April August November Year Average high temperature °F 43 63 84 53 64.5 Average low temperature °F 8 26 48 19 27.8 Average precipitation in inches 1.42 1.26 2.68 1.46 18.4 Average snowfall in inches 14 3 0 6 58
FIGURE 3. Location of Apache Mesa deposit, Jicarilla Apache Reservation, Rio Arriba County, New Mexico.
15
Apache Mesa Assessment September 2016
FIGURE 4. Topographic map of Apache Mesa deposit, Jicarilla Apache Reservation, Rio Arriba County, New Mexico (Apache Mesa topographic quadrangle).
Vegetation and Wildlife
Vegetation ranges from spruce-aspen cover at the highest elevations through large areas of
pinon-juniper. There are no known endangered species or vegetation within the project area.
Apache Mesa is forested with vegetation covering much of the rock units, except along steep
cliffs.
Infrastructure
There are no known archeological sites or environmental concerns within the project area. Cell
phone coverage is spotty. During more than 35 yrs of gas and oil activity within the Jicarilla
Apache Reservation, more than 2,700 wells were drilled, predominantly in the southern half of
the reservation (Segerstrom and Henkes, 1977).
16

Apache Mesa Assessment September 2016
ANALYTICAL METHODS
Mapping and Sample Collection
Apache Mesa area was mapped according to standard geologic mapping techniques at 1:6,000
scale (Plate 1; Lahee, 1961; Carpenter and Keane, 2016). Each unit was examined and described,
including the dip, strike, and thickness. Surface geologic units were differentiated, described and
sampled as described below. The units were differentiated mostly on the basis of color, particle
size, composition, stratigraphic position, dip, thickness, depositional environment, and other
properties. Color is identified using a Munsell color chart.
Two bags containing 1–2 lbs of fresh rock sample were collected at each location for
chemical analysis, petrographic analyses, and archived. Most samples were composite samples
collected by a rock hammer across the thickness of the sedimentary unit. Samples were sent to
ALS Laboratory Group for whole rock chemical analyses by X-ray fluorescence (XRF) and
Induced Plasma Spectroscopy (ICP).
One stratigraphic section was measured at station SL46, just west of the western fault
(Fig. 5; Appendix 2). A chip tray was collected of each unit and is archived at the New Mexico
Bureau of Geology and Mineral Resources (NMBGMR).
Other areas in the San Juan Basin were examined and sampled in order to compare with
the Apache Mesa deposits. These prospects also are described in the New Mexico Mines
Database (McLemore et al., 2002, 2005a, b) and are identified by a unique mine identification
number (Mine Id), beginning with NMOt (for example NMOt0054). Heavy mineral, beach-
placer sandstone deposits along the James River and the Concord heavy mineral sands mine in
Virginia also were examined and sampled in order to compare with the Apache Mesa deposit
(Appendix 2).
17

Apache Mesa Assessment September 2016
FIGURE 5. Location of stratigraphic section described in Appendix 2.
Drilling
During field investigations June 10–12, 2015, 18 proposed drill hole locations were staked in the
field with wooden stakes and flagged with orange, blue, and pink flagging tape. The GPS
coordinates were measured for each proposed drill site. The final drilling report is in Appendix 3.
Drill hole graphic logs are in Appendix 4. Locations of final drill holes are in Figure 6.
Drilling began on August 18, 2015. A few problems were encountered during drilling and
solved. The equipment was moved onto the site on August 18, 2015 and trenches for water were
dug. The major delay was when the drill rig ceased to function because of fuses. After trouble-
shooting for 1.5 hr, the drillers were able to get the rig going. Drilling on DH1 began on August
19, 2015. Additional difficulties were encountered (loss of circulation, improper core springs)
but resolved. Drilling was completed on August 25, 2015. Table 3 summarizes the final
completed drill holes. An additional hole (DH7) was located and drilled along the road south of
DH5 because DH5 did not encounter much black sandstone. The road was already cleared and
DH7 was on the road with little additional disturbance.
18

Apache Mesa Assessment September 2016
TABLE 3. Completed drill locations, Apache Mesa REE project. UTM coordinates are in NAD27, zone 13 and represent final drill hole locations. Drill holes are located in Figure 6 and final drilling report is in Appendix 3. Graphic logs are in Appendix 4.
Final Drill
Hole Id
UTM easting
UTM northing
Total depth (ft)
Completion Purpose Summary of goals
DH1 337543 4059240 112.3 8/19/2015 Confirmation to determine thickness of middle deposit
Deposit is 1.8 ft thick, Point Lookout Sandstone is 107 ft
DH2 337479 4059136 42.4 8/20/2015 Confirmation to determine thickness of middle deposit
No black sandstone, depositional environment suggests an inlet
DH3 337486 4059021 45 8/20/2015 Confirmation to determine thickness of middle deposit
Deposit is 3.2 ft thick
DH4 337590 4059418 83 8/21/2015 Preliminary hole DH 105, exploration to determine northern extent of middle deposit
No black sandstone deposit, did encounter gray sandstone at 73.8-74.8 ft
DH5 337732 4059035 113 8/21/15 Preliminary hole DH4, confirmation to determine thickness of eastern deposit and thickness of Point Lookout
0.2 ft black sandstone, Point Lookout is 108.6 ft thick
DH6 337723 4059200 53 8/22/15 Preliminary hole DH5, confirmation to determine thickness of eastern deposit
Black sandstone is 1.8 ft thick
DH7 337714 4058862 43 8/22/15 New hole (on road), confirmation to determine thickness of eastern deposit
Black sandstone is 3.5 ft thick
DH8 337733 4059310 53 8/22/15 Confirmation to determine thickness of eastern deposit
Black sandstone is 3.2 ft thick (loss recovery)
DH9 337749 4059465 53 8/22/15 Preliminary DH106, exploration to determine northern extent of eastern deposit
Black sandstone is 3.5 ft thick
DH10 338405 4059065 148 8/23/15 Preliminary hole DH109, wildcat to determine eastern extent, low priority
No black sandstone encountered, drilled through a white beach sandstone at base (either lower Point Lookout or another sandstone in the underlying shale), but no evidence of a black sandstone deposit
DH11 337840 4059780 48 8/24/15 Preliminary hole 111, exploration to determine northern extent
Black sandstone beneath coal
DH12 337369 4059715 27 8/24/15 Preliminary hole 103, exploration to determine northern extent
Encountered yellow sandstone, no black sandstone
DH13 337006 4059042 88 8/25/15 Preliminary hole 101, exploration
Point Lookout, if present here, is thin and underlain Mancos Shale, no black sandstone
19
Apache Mesa Assessment September 2016
Final Drill
Hole Id
UTM easting
UTM northing
Total depth (ft)
Completion Purpose Summary of goals
DH14 337660 4059628 150 8/25/15 Preliminary hole 107, exploration
Encountered fault at 11.5 ft, most of hole in white, yellow and gray sandstone, no coal, no black sandstone
FIGURE 6. Location of drill holes on Apache Mesa, Rio Arriba County. Details are in Table 3 and Appendix 3. Core was laid out, washed, and stored in core boxes at the drill site. The first author
photographed and described in detail each core box in the field, using standard techniques (Jones
and O’Brein, 2014; Carpenter and Keane, 2016). The descriptions (drill logs) were recorded on
paper forms and subsequently entered into word documents (Appendix 3). The core was
transported to a locked storage facility in Dulce by the senior author, and then transported to
Socorro by NMBGMR personnel and stored permanently at the NMBGMR core library
(http://geoinfo.nmt.edu/libraries/subsurface/home.html, accessed 6/6/16). The authors re-
examined the core in Socorro and sampled selected intervals. The sampled core was split using a
20

Apache Mesa Assessment September 2016
core splitter, cleaned after each sample was split. One quarter of the core sampled was bagged
for chemical analysis and selected samples of one quarter of the core were collected for
mineralogical examination and electron microprobe analyses. Samples for chemical analyses
were shipped to ALS Laboratory Group in Reno, Nevada.
Petrographic Descriptions
Petrographic analyses were performed using standard petrographic (Carpenter and Keane, 2016),
microscopy, and electron microprobe techniques. Thin sections were made of selected samples.
Mineral concentrations and phase percentages, grain size, roundness, and sorting were estimated
using standard charts (Carpenter and Keane, 2016). Data are summarized in Appendix 5. Drill
core descriptions are in Appendix 3. Estimates of both primary and secondary minerals were
determined, cementation and alteration described, and mineralogy and lithology described (Folk,
1974; Carpenter and Keane, 2016). Any special features were noted.
Chemical Analyses
Samples were collected at the surface and from the drill core. Surface and core samples were
dried, crushed, split and pulverized according to standard ALS Laboratory Group preparation
methods PREP-31; http://www.alsglobal.com/Our-Services/Minerals/Geochemistry/Downloads,
accessed 6/1/16). Samples were analyzed by ALS Laboratory Group for major and trace
elements by a variety of analytical methods (CCP-PKG03 and Au-ICP21;
http://www.alsglobal.com/Our-Services/Minerals/Geochemistry/Downloads, accessed 6/1/16),
including X-Ray Fluorescence (XRF), inductively coupled plasma atomic emission spectroscopy
(ICP-AES), and inductively coupled plasma mass spectrometry (ICP-MS). This package
combines the whole rock package ME-ICP06 plus carbon and sulfur by combustion furnace
(ME-IR08) to quantify the major elements in a sample. Trace elements, including the full REE
suites, are performed after three digestions with either ICP-AES or ICP-MS finish: 1) a lithium
borate fusion for the resistive elements (ME-MS81), 2) a four acid digestion for the base metals
(ME-4ACD81) and 3) an aqua regia digestion (ME-MS42). Gold was analyzed separately (Au-
ICP21). Chemical analyses are in Appendix 6; locations are in Figure 7.
21

Apache Mesa Assessment September 2016
FIGURE 7. Location of surface and drill hole samples for chemical analyses. Details are in Appendix 6. On-going control samples were submitted with each batch of samples submitted.
Certified standards are commercial standards with certified values as determined by round robin
analyses at numerous certified laboratories. Certified standards are expensive, so on-going
control samples were analyzed instead. The on-going control samples are standards collected by
NMBGMR personnel and analyzed by different methods over several years of analyses by
different laboratories. Duplicate samples were also submitted. A summary of the quality control
and quality assurance (QA/QC) is in Appendix 7 and McLemore and Frey (2009).
Electron Microprobe Mineralogical Analyses
Samples of beach-placer sandstones were examined using a Cameca SX100 electron microprobe
with three wavelength-dispersive spectrometers at New Mexico Institute of Mining and
Technology to characterize compositional, chemical and textural characteristics. Samples chosen
for microprobe analysis were selected based on elevated whole-rock chemical concentrations of
22

Apache Mesa Assessment September 2016
TiO2, Zr, U, Th, and REE. Samples cut to an appropriate size were placed in 1 inch round sample
mounting cups, set in epoxy, and cured overnight at around 80° C. Once cured, samples were
polished using coarse diamond grinding wheels and diamond power suspended in distilled water
for the fine polishing. Polished sample surfaces were then cleaned using petroleum ether and
carbon coated to a 200 angstrom thickness.
Three types of analyses were performed. The initial observations of the samples were
made using backscattered electron imaging (BSE), which allowed observation of sample
textures, and location of high mean atomic number (Z) phases that may contain TiO2, Zr, U, Th,
and REE, and other high Z elements. BSE observations were coupled with acquisition of rapid
X-ray maps and/or qualitative geochemical scans, which allow qualitative assessment of the
elements present in a given mineral phase. Peaks that appeared on the scans were identified using
Cameca software. The elements shown by the peaks and their relative abundance of the
elements, based on peak height, were used to identify the mineral phases. Qualitative scans were
carried out using an accelerating voltage of 15 kV and a probe current of 20 nA. Descriptions of
the microprobe analyses are in Appendix 8.
The third types of analyses, quantitative, of monazites from selected samples were
determined (Appendix 9). The analytical setup for these phases included a total of 14 elements.
A 20 kV accelerating voltage, a 40 nA probe current, and a focused beam were used for these
analyses. Matrix corrections for monazite analyses were carried out using the ZAF method.
Analytical totals for many of the REE-bearing phases were less than 100%, due to the presence
of unanalyzed components in many of the mineral structure. Oxygen was determined
stoichiometrically, using normal oxidation states for all elements (i.e. SO2, TiO2, Cr2O3, Fe2O3).
A summary table of all analyses is shown on the first tabbed page of Appendix 8. The following
pages show the datasets for the two analytical sessions (session 1 and session 2). Summary
datasets are given for both sessions, as well as “Details” pages. The analytical details, including
count times, peak and background count rates, analytical precision, and detection limits are listed
in the “Details” tabbed pages. For more information on the electron microprobe laboratory see
http://geoinfo.nmt.edu/labs/microprobe/home.html (accessed 6/1/16).
23

Apache Mesa Assessment September 2016
Specific Gravity Measurements
Specific gravity of ores is an important parameter that is often under characterized in the
determination of grade and tonnage of deposits. Specific gravity is determined by weighing a
sample in air and in water, and it is reported as a ratio between the density of the sample and the
density of water. A fresh piece of sample, approximately 1 g, is broken off, dried, weighed in air
and weighed when submerged in distilled water. Specific gravity is defined by weight in air
/(weight in air – weight in water). Specific gravity measurements are in Table 4.
TABLE 4. Specific gravity measurements for selected samples. Sample locations and descriptions are in Appendix 5. Specific areas are described below.
Sample Location Weight in Air (g)
Weight in Water (g)
Specific Gravity
DH 1-1 Apache Mesa 13.50 7.50 2.40 DH 3-1 Apache Mesa 3.50 2.50 3.50 DH 3-2 Apache Mesa 2.00 1.00 2.00 DH 3-3 Apache Mesa 9.50 5.50 2.38 DH 5-3 Apache Mesa 6.00 3.50 2.40 DH 5-7 Apache Mesa 6.00 3.50 2.40 DH 7-1 Apache Mesa 4.00 2.50 2.67 SL 16 Apache Mesa 3.00 2.00 3.00 SL 28 Apache Mesa 4.00 2.50 2.60 SL 59 Apache Mesa 2.50 1.50 2.50 SL 60 Apache Mesa 1.50 1.00 3.00 SL 74 Apache Mesa 6.50 4.00 2.60 SL 78 Apache Mesa 4.50 3.00 3.00 FT 2 Standing Rock, San Juan Basin 2.50 1.50 2.50 FT 3 Standing Rock, San Juan Basin 7.00 4.00 2.33
Hovey 1 B.P. Hovey, San Juan Basin 5.00 4.00 5.00 SAN 1 Sanostee, San Juan Basin 2.00 1.00 2.00 SAN 2 Sanostee, San Juan Basin 4.00 2.50 2.60 SAN 3 Sanostee, San Juan Basin 2.50 1.50 2.50 SAN 6 Sanostee, San Juan Basin 2.50 1.50 2.50
VA 7-15 Virginia 4.50 1.00 1.29 VA 3 Virginia 8.50 3.00 1.54
24

Apache Mesa Assessment September 2016
Calculation of Ore Resources
Unlike most types of deposits, mineral sands are generally reported in terms of percentage of
minerals, specifically percent ilmenite, rutile, zircon, and so forth (Kattaa, 2002; Jones and
O’Brien, 2014). However, there was not enough funding or time to determine quantitative
mineral composition, so the chemical analyses were used to calculate ore reserves for this report.
TiO2 is a proxy for the amount of ilmenite, rutile, and leucoxene. Zr is a proxy for the amount of
zircon. TREE is a proxy for the amount of monazite.
Since the Apache Mesa deposit is small and nearly flat lying, the classical polygon
method of calculating ore reserves was used, which is a method of estimating ore reserves where
it is assumed that each drill hole or sample has an area of influence extending approximately
halfway to the neighboring drill hole or sample location (Popoff, 1966). The required data is
summarized in Table 5. The deposit was divided into polygons surrounding either a surface or
drill hole sample location (Fig. 8). Note that two ore blocks, 19 and 20 are in the subsurface. The
area of each polygon was determined using the GIS area calculation tools. The thickness was
determined by the drill-core interval or measured at the surface. The tonnage of each polygon
was determined by:
A x T x SG
where A=area, T=thickness, and SG = specific gravity.
The grade of each sample was determined from chemical analyses (Appendix 6). The tonnage of
each element for each polygon was determined by:
Gp/Tp
where Gp=grade of each polygon and Tp=tonnage of each polygon.
The total tonnage of the deposit is the sum of the tonnage for each polygon and the total grade
for each element is determined by:
Te/T
where Te=tonnage of each element of each polygon and T=total tons of the deposit.
The results are in Appendix 10.
These are simple calculations that do not account for metallurgical considerations or
particle size distributions (Jones and O’Brien, 2014). Tonnage estimates are dry tonnage without
any account of moisture. No cut-off grade was used. No metallurgical or marketing factors were
accounted for. Open pit mining was assumed. These grade and tonnage calculations do not
25

Apache Mesa Assessment September 2016
conform to Canadian 43–101 criteria
(http://web.cim.org/standards/documents/Block484_Doc111.pdf, accessed 6/1/16) and are only
preliminary estimates. Ore reserves for each polygon are in Appendix 10.
TABLE 5. Required data for calculating the value of a potential mineral deposit. Required data Description
Grade The concentration of the mineral or commodity in the ore deposit Area Area of the ore deposit (strike length and width) Thickness Thickness of the ore deposit Specific gravity The density of the ore deposit
FIGURE 8. Location of polygons for calculating the ore reserves at Apache Mesa. Note that two ore blocks, 19 and 20 are in the subsurface. The two polygons without numbers cannot be mined because of steep topography.
Quality Control Procedures and Sample Security
Samples were collected, prepared, and analyzed according to standard methods for each specific
laboratory analysis. Samples were collected in the field and kept under direct control of the
senior author to avoid contamination. Samples are archive at the NMBGMR. Samples collected
are complete, comparable, and representative of the defined population at the defined scale as
26

Apache Mesa Assessment September 2016
documented in Appendix 7. Precision and accuracy are measured differently for each field and
laboratory analysis (parameter), and are explained in the methods section of this report and
Appendices 7 and 9 and McLemore and Frey (2009). Most geochemical laboratory analyses
depend upon certified or on-going reference standards and duplicate analyses (Appendix 7). The
sampling and analysis plans for each segment of the field and drilling program and the control of
accuracy and precision as defined here, provides a large high-quality set of observations and
measurements that are adequate to support the interpretations and conclusions of this report.
Field and laboratory audits by the senior author were performed to ensure that procedures were
followed.
REGIONAL GEOLOGICAL SETTING
During the Late Cretaceous, the present San Juan Basin was on the western edge of the Western
Interior seaway (Robinson-Roberts and Kirschbaum, 1995), which extended from the Gulf of
Mexico to the Arctic Ocean. Complex fluvial systems transported sediments from the volcanic
and metamorphic sources in the Mogollon Highlands and Ancestral Rocky Mountains to the
south and west into the basin. Cyclic transgressions and regressions of the marine seas resulted in
a shift of the paleoshorelines. Most of the heavy mineral, beach-placer sandstone deposits define
local depositional trends of the beaches at the time of deposition. The shoreface sandstone
deposits in the San Juan Basin were formed both during transgression and regression of the
western edge of the Western Interior Seaway (Robinson-Roberts and Kirschbaum, 1995; Fassett,
2000) and are similar to deposits on the Atlantic Coast in the United States (Koch, 1986;
Carpenter and Carpenter, 1991), southeastern Australia (Roy, 1999), and Andhra Pradesh, India
(Rao et al., 2008).
GEOLOGY OF APACHE MESA
Geologic Setting
The Point Lookout Sandstone crops out around the margins of the San Juan Basin, forms cliffs or
caps mesas or resistant dip slopes and hogbacks, is of variable thickness, and is a regressive-
transgressive sandstone (Hollenshead and Pritchard, 1961; Tabet and Frost, 1979; Craigg et al.,
1990; Devine, 1991; Zech et al., 1994). It conformably overlies the Mancos Shale and is overlain
by the Menefee Formation (Fig. 9). The Point Lookout Sandstone was deposited in upper
27

Apache Mesa Assessment September 2016
shoreface, foreshore, washover, and eolian environments as the Cretaceous sea regressed to the
east and north across the San Juan Basin (Landis at al., 1974; Fassett, 1977; Zech, 1982; Zech et
al., 1994). The Point Lookout Sandstone is between 85 and 80 million yrs and accumulation rates
ranged from 26–60 m/m.y. (Cather, 2004).
At Apache Mesa, the Point Lookout Sandstone is 100–150 ft thick, forms cliffs, and
overlies the Mancos Shale (Fig. 10, 11; Plate 1, 2). The older, underlying Mancos Shale typically
forms slopes covered by talus deposits eroded from the Point Lookout cliffs (Fig. 11). Much of
Apache Mesa is forested and the outcrops vary from poor to a few well exposed areas.
Three distinct, informal units within the Point Lookout Sandstone are mapped at Apache
Mesa (Fig. 10): 1) older yellow sandstone, 2) white sandstone, and 3) younger black sandstone.
The older yellow sandstone unit consists of yellow, massive to laminated cross-bedded to high-
angle cross-bedded, subangular to rounded, well to moderate sorted, fine- to medium-grained
sandstones (Fig. 12; Appendix 2, 3). Some beds show evidence of bioturbation and burrows.
This unit is interpreted to have been deposited in off-shore environments, which are unfavorable
for formation of heavy mineral, beach-placer sandstone deposits.
FIGURE 9. Stratigraphic framework and nomenclature of the Late Cretaceous sedimentary rocks in the San Juan Basin (simplified from Molenaar, 1989; Craigg et al., 1990). Gray-shaded sandstone units are hosts of known beach-placer sandstone deposits in the San Juan Basin.
28

Apache Mesa Assessment September 2016
FIGURE 10. Geologic map of the Apache Mesa area, Rio Arriba County, New Mexico (see Plate 1). Cross sections are below and shown in Plate 2.
FIGURE 11. Point Lookout Sandstone forming cliffs overlying Mancos Shale (covered slopes) at Apache Mesa (looking east). Photograph by V.T. McLemore.
29
Apache Mesa Assessment September 2016
FIGURE 12. Trough cross beds in the yellow sandstone on Apache Mesa. Photograph by V.T. McLemore.
The middle unit consists of white, light gray to olive gray, massive to planar cross-
bedded, medium- to fine-grained, moderately to well sorted sandstone (Fig. 13), locally with
trough cross-stratification. This unit is interpreted to have been deposited in the beach
environment (Fig. 1), which is favorable for formation of heavy mineral, beach-placer sandstone
deposits.
FIGURE 13. Contact between the older, underlying yellow sandstone and younger, overlying white sandstone (below clipboard). Photograph by V.T. McLemore.
30
Apache Mesa Assessment September 2016
The younger black sandstone consists of less than 1 ft to 9.9 ft and thickens near DH7
(Appendix 4, 9) and thins to the north and west. It is not exposed on the eastern mesa (Fig. 10,
Plate 1). The Apache Mesa deposits are lenses (Fig. 10, 14) that overlie the white sandstone of
the Point Lookout Sandstone (Fig. 14). The black sandstone is reddish-purple to olive-brown to
grayish red to black red (Fig. 15), moderately to well cemented, medium-grained, and contains
iron oxide minerals, leucoxene, zircon, tourmaline, rutile, magnetite, monazite, chromite,
ilmenite, and gold. Locally, the black sandstone is planar bedded consisting of alternating layers
of millimeter to centimeter thick, gray and red to dusky red sandstone (Fig. 15). The deposit does
extend to the north in DH8 and DH9 (Fig. 8). There is a thin, black sandstone bed found in
DH11, but it does not contain high enough TiO2, Zr, or TREE to be included in the ore reserve
calculations. The black sandstone was not found on the north edge of the cliff. This unit was
deposited along the foreshore of the beach or in the back beach environments, probably during
high tide and storm surges (Fig. 1).
Along the northern rim of Apache Mesa (near DH11; Fig. 10), the uppermost Point
Lookout Sandstone consists of several feet of thin interbeds of brown carbonaceous shale, black
coal to humates, and white to yellow siltstones to fine-grained sandstones overlying the middle
white sandstone unit with large high-angle to trough cross-stratification (Fig. 16, Plate 2). In
DH11, coal overlies a thin black sandstone bed (Appendix 4). These younger units probably
represent the upper portion of the Point Lookout Sandstone as described by Landis et al. (1974)
and were mapped in this report as part of the white sandstone unit of the Point Lookout
Sandstone at Apache Mesa. These units were deposited in nonmarine coastal bay, swamp,
lagoon, and fluvial environments, which are unfavorable for formation of heavy mineral, beach-
placer sandstone deposits.
31

Apache Mesa Assessment September 2016
FIGURE 14. Beach-placer sandstone deposit overlying the white sandstone in the Point Lookout Sandstone at Apache Mesa. Photograph by V.T. McLemore.
FIGURE 15. Close-up of beach-placer sandstone at Apache Mesa. Photograph by V.T. McLemore.
32
Apache Mesa Assessment September 2016
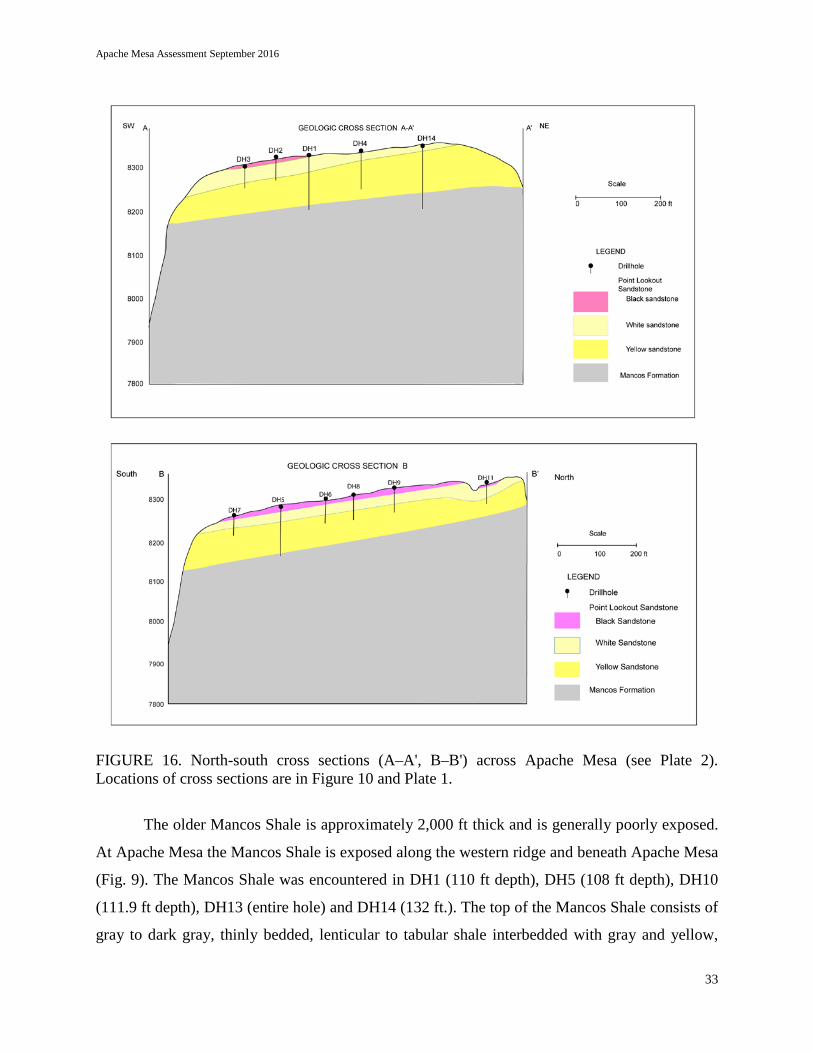
FIGURE 16. North-south cross sections (A–A', B–B') across Apache Mesa (see Plate 2). Locations of cross sections are in Figure 10 and Plate 1.
The older Mancos Shale is approximately 2,000 ft thick and is generally poorly exposed.
At Apache Mesa the Mancos Shale is exposed along the western ridge and beneath Apache Mesa
(Fig. 9). The Mancos Shale was encountered in DH1 (110 ft depth), DH5 (108 ft depth), DH10
(111.9 ft depth), DH13 (entire hole) and DH14 (132 ft.). The top of the Mancos Shale consists of
gray to dark gray, thinly bedded, lenticular to tabular shale interbedded with gray and yellow,
33
Apache Mesa Assessment September 2016
thinly bedded, carbonate-cemented, fine- to very fine-grained sandstone, silty sandstone, and
siltstone. The sandstones exhibit small scale, tabular to hummocky, cross laminations with local
ripple beds and bioturdation. Locally thin beds of coal are interbedded with the shale. Most of
the area surrounding the J8 and J48 roads (Fig. 4) are in Mancos Shale.
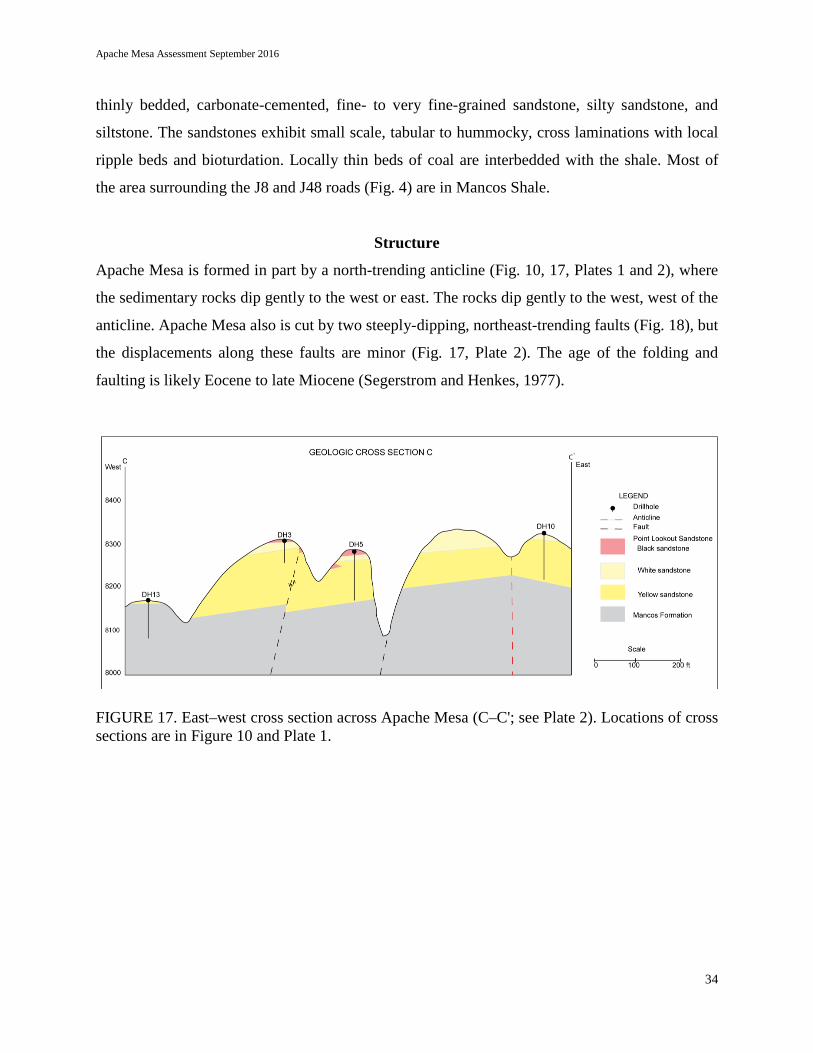
Structure
Apache Mesa is formed in part by a north-trending anticline (Fig. 10, 17, Plates 1 and 2), where
the sedimentary rocks dip gently to the west or east. The rocks dip gently to the west, west of the
anticline. Apache Mesa also is cut by two steeply-dipping, northeast-trending faults (Fig. 18), but
the displacements along these faults are minor (Fig. 17, Plate 2). The age of the folding and
faulting is likely Eocene to late Miocene (Segerstrom and Henkes, 1977).
FIGURE 17. East–west cross section across Apache Mesa (C–C'; see Plate 2). Locations of cross sections are in Figure 10 and Plate 1.
34

Apache Mesa Assessment September 2016
FIGURE 18. Western fault trending northeast (left of Dan Koning). Photograph by V.T. McLemore.
Mineralogy and Chemistry of the Apache Mesa Beach-placer Sandstone Deposit
The majority of the samples are detrital sandstones composed mostly of quartz, some lithic
fragments, feldspar, and heavy minerals. Alteration and weathering of grains appears in these
samples, although the intensity varies. Cementation is composed mostly of iron oxide and some
silica. Petrographic and electron microprobe results confirm the presence of iron oxides,
ilmenite, rutile, zircon, monazite, xenotime, garnet and illite in these beach-placer sandstone
deposits (Fig. 19; Appendix 5, 8). The grains are oblong and rounded and somewhat altered. The
albite grains are blockier and less altered than the more rounded quartz. The zircon grains are
very fractured and blocky. Some of the ilmenite grains are zoned. A few grains of chromite and
one grain of gold with a silver-rich rim also are found in the Apache Mesa deposit. Gold particles
with silver-rich rims are common in placer gold deposits (Luterbach and McLemore, 2016).
Much of the ilmenite is either altered partially to hematite or is in solid solution series with
hematite, typical of many beach-placer sandstone deposits (Van Gosen et al., 2014).
35

Apache Mesa Assessment September 2016
FIGURE 19. Electron microprobe picture of sample SL 16 (Apache Mesa). Zircon grains are labeled in red. Chromite is labeled in blue. Mottled, lighter colored cement is iron oxide (hematite). Dark grains are mainly quartz. Photograph by A. Robison.
Hydrology
The Apache Mesa beach-placer sandstone deposit is above the water table. All drill holes were
dry, so the water table is deeper than 150 ft.
Environmental concerns
There are no environmental concerns at Apache Mesa. Impacts due to drilling were minor.
Photographs of the drill sites before, during and after drilling are in Appendix 3.
DESCRIPTIONS OF OTHER BEACH-PLACER SANDSTONE DEPOSITS
San Juan Basin, New Mexico
Sanostee deposit, San Juan County
The largest exposed beach-placer sandstone deposit in New Mexico is the Sanostee deposit
(NMSJ0088), which lies along the top of a mesa northwest of Sanostee, New Mexico on the
Navajo Indian Reservation (Fig. 1, 20; Bingler, 1963; Force, 2000; McLemore, 2010). The
36
Apache Mesa Assessment September 2016
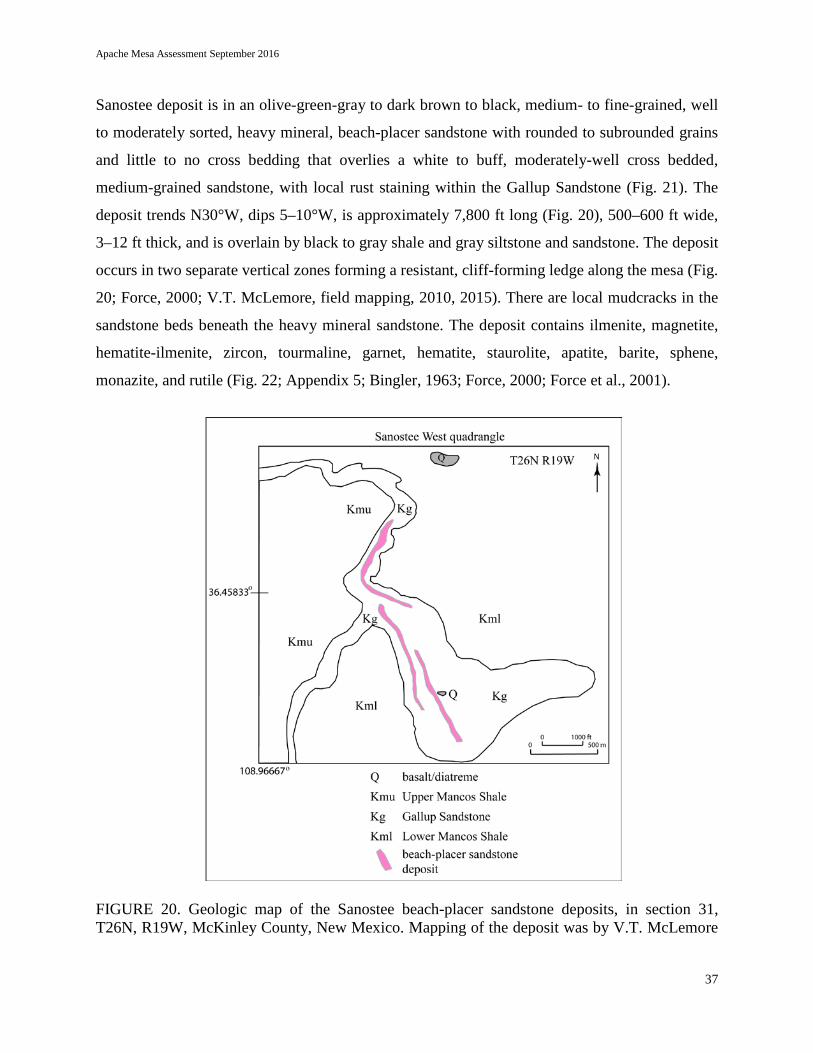
Sanostee deposit is in an olive-green-gray to dark brown to black, medium- to fine-grained, well
to moderately sorted, heavy mineral, beach-placer sandstone with rounded to subrounded grains
and little to no cross bedding that overlies a white to buff, moderately-well cross bedded,
medium-grained sandstone, with local rust staining within the Gallup Sandstone (Fig. 21). The
deposit trends N30°W, dips 5–10°W, is approximately 7,800 ft long (Fig. 20), 500–600 ft wide,
3–12 ft thick, and is overlain by black to gray shale and gray siltstone and sandstone. The deposit
occurs in two separate vertical zones forming a resistant, cliff-forming ledge along the mesa (Fig.
20; Force, 2000; V.T. McLemore, field mapping, 2010, 2015). There are local mudcracks in the
sandstone beds beneath the heavy mineral sandstone. The deposit contains ilmenite, magnetite,
hematite-ilmenite, zircon, tourmaline, garnet, hematite, staurolite, apatite, barite, sphene,
monazite, and rutile (Fig. 22; Appendix 5; Bingler, 1963; Force, 2000; Force et al., 2001).
FIGURE 20. Geologic map of the Sanostee beach-placer sandstone deposits, in section 31, T26N, R19W, McKinley County, New Mexico. Mapping of the deposit was by V.T. McLemore
37

Apache Mesa Assessment September 2016
in 2009, modified from Beaumont (1954), Dow and Batty (1961), Bingler (1963), and Force (2000).
FIGURE 21. Beach-placer sandstone at Sanostee, McKinley County, New Mexico. Photograph by V.T. McLemore.
FIGURE 22. Electron microprobe photo showing distribution of zircon, ilmenite and monazite grains in sample SAN 6 (Sanostee). Zircon grains are labeled in red, ilmenite in blue, and
38
Apache Mesa Assessment September 2016
monazite in yellow. Mottled, lighter colored cement is iron oxide (hematite). Dark gray grains are mainly quartz. Black areas are pore spaces. Photograph by A. Robison. Standing Rock (Flat Top Hill) deposit, McKinley County
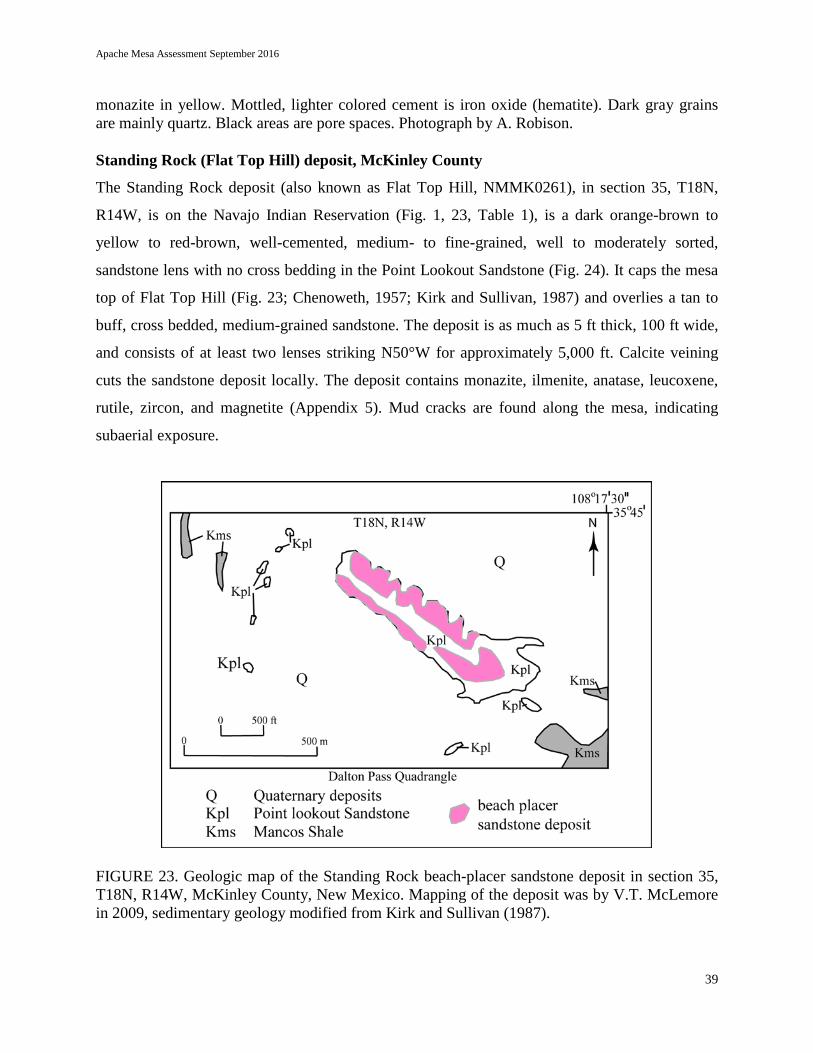
The Standing Rock deposit (also known as Flat Top Hill, NMMK0261), in section 35, T18N,
R14W, is on the Navajo Indian Reservation (Fig. 1, 23, Table 1), is a dark orange-brown to
yellow to red-brown, well-cemented, medium- to fine-grained, well to moderately sorted,
sandstone lens with no cross bedding in the Point Lookout Sandstone (Fig. 24). It caps the mesa
top of Flat Top Hill (Fig. 23; Chenoweth, 1957; Kirk and Sullivan, 1987) and overlies a tan to
buff, cross bedded, medium-grained sandstone. The deposit is as much as 5 ft thick, 100 ft wide,
and consists of at least two lenses striking N50°W for approximately 5,000 ft. Calcite veining
cuts the sandstone deposit locally. The deposit contains monazite, ilmenite, anatase, leucoxene,
rutile, zircon, and magnetite (Appendix 5). Mud cracks are found along the mesa, indicating
subaerial exposure.
FIGURE 23. Geologic map of the Standing Rock beach-placer sandstone deposit in section 35, T18N, R14W, McKinley County, New Mexico. Mapping of the deposit was by V.T. McLemore in 2009, sedimentary geology modified from Kirk and Sullivan (1987).
39

Apache Mesa Assessment September 2016
FIGURE 24. Beach-placer sandstone at Standing Rock, McKinley County, New Mexico. Photograph by V.T. McLemore.
B.P. Hovey Ranch, Sandoval County
The P.B. Hovey Ranch deposit (also known as the Torreon Wash deposit, NMSA0028) is in
section 34, T17W, R4W (Fig. 1, 25, Table 1). The deposit is in brown- to olive-gray, medium
grained, well to moderately sorted sandstone and is approximately 300 ft long and 2–5 ft thick
(Fig. 26). There are two zones of beach-placer deposits at the B.P. Hovey Ranch locality
(McLemore, 1983). Drilling suggests that this deposit continues to the northwest (Chenoweth,
1957).
40

Apache Mesa Assessment September 2016
FIGURE 25. Geologic map of the B.P. Hovey beach-placer sandstone deposit, Sandoval County, New Mexico. Mapping of the deposit was by V.T. McLemore in 1981 and 2015. Sedimentary geology is modified from Tabet and Frost (1979).
41

Apache Mesa Assessment September 2016
FIGURE 26. Beach-placer sandstone at B.P. Hovey, Sandoval County, New Mexico. Photograph by V.T. McLemore.
Descriptions of Pliocene beach-placer sandstone deposits, Virginia
The North American titanium province extends along the Atlantic coast from Labrador to Florida
where heavy minerals are mined mostly for titanium and zircon since 1919 (Carpenter and
Carpenter, 1991; Pirkle et al., 2009; Van Gosen et al., 2014). These deposits contain 40–60%
ilmenite, 2-5% rutile, and 8-15% zircon formed in beach bar, dune and stream sediments along
the coast. Resources were estimated as 25 million short tons containing 60% ilmenite, 2.5%
rutile, 12.5% zircon, 8.5% staurolite, 0.7% tourmaline, 3% kyanite, and 1.3% sillimanite in 19
deposits found along the upper coastal plain of Virginia and North Carolina (not 43–101
reserves; Carpenter and Carpenter, 1991). These beach or dune deposits were formed during the
Pliocene transgressive-regressive event 3–3.5 Ma.
Along the James River in Virginia, heavy mineral, beach-placer sandstone deposits are
forming today (Berquist, 2010, 2012). These deposits are small and localized (Fig. 27) and are
black, thin (less than 1 ft thick), unconsolidated and consist of ilmenite, zircon, monazite, and
quartz (Appendix 5; Berquist, 2010, 2012).
In southeastern Virginia, Iluka Resources recently mined heavy mineral, beach-placer
sands of Pliocene and possible Miocene age from several mines. Iluka Resources Inc. (formerly
RGO USA Inc.) began mining of the Old Hickory beach-placer sandstone deposit in 1997 for
titanium (ilmenite, leucoxene, rutile) and zirconium (zircon). Figures 28 and 29 are typical heavy
42

Apache Mesa Assessment September 2016
mineral, beach-placer sandstones found at the Concord mine in Virginia. These deposits formed
in beach sands and dunes formed during a world-wide Pliocene transgressive-regressive event 3–
3.5 Ma.
FIGURE 27. Small beach placer sandstone deposit along the James River, Virginia. This deposit is less than 1 ft thick and several 10s of ft long. It formed in a small cove along the edge of the river. Photograph by V.T. McLemore.
FIGURE 28. Orange to light brown, unconsolidated, heavy mineral, beach-placer sands mined at the Concord mine, Virginia. Photograph by V.T. McLemore.
43
Apache Mesa Assessment September 2016
FIGURE 29. Lenses of high-grade, black sand lenses within the lower grade sands at the Concord mine, Virginia. Photograph by V.T. McLemore.
COMPARISON OF MINERALOGY AND CHEMISTRY OF BEACH-PLACER
SANDSTONE DEPOSITS
Chemical analyses of selected beach-placer sandstone deposits are in Appendix 6. Local high
concentrations of Ti, Fe, Cr, Nb, Th, U, Zr, Sc, and REE are found in in beach-placer sandstone
deposits. The REE plots exhibit light-REE chondrite-normalized enriched patterns, typically with
negative Eu anomalies (Fig. 30). TiO2 and Zr show a strong correlation (Fig. 31) and U and Th
show a strong correlation (Fig. 32), indicating these elements are found in similar minerals
concentrated in the beach-placer sandstones.
44

Apache Mesa Assessment September 2016
FIGURE 30. Chondrite-normalized REE plot of selected heavy mineral, beach-placer deposits, Apache Mesa (red), Standing Rock (light blue), Sanostee (dark blue), B.P. Hovey (black), San Juan Basin, New Mexico and Virginia (green). Chemical analyses are in Appendix 6. Chondrite values are from Nakamura (1974).
La Pr Pm Eu Tb Ho Tm Lu
Ce Nd Sm Gd Dy Er Yb
110
100
1000
1000
Sam
ple/
RE
E c
hond
rite
La Pr Pm Eu Tb Ho Tm Lu
Ce Nd Sm Gd Dy Er Yb
110
100
1000
1000
Sam
ple/
RE
E c
hond
rite
45

Apache Mesa Assessment September 2016
FIGURE 31. Zr-TiO2 plot of selected heavy mineral, beach-placer deposits, Apache Mesa (red), Standing Rock (light blue), Sanostee (dark blue), and B.P. Hovey (black), San Juan Basin, New Mexico and Virginia (green). Chemical analyses are in Appendix 6.
FIGURE 32. U-Th plot of selected heavy mineral, beach-placer deposits, Apache Mesa (red), Standing Rock (light blue), Sanostee (dark blue), and B.P. Hovey (black), San Juan Basin, New Mexico and Virginia (green). Chemical analyses are in Appendix 6.
0 5 10 15 20 25 30
020
0040
0060
0080
0010
000
TiO2
Zr
0 20 40 60 80 100
020
040
060
080
010
00
U
Th
46

Apache Mesa Assessment September 2016
Chemical analyses of monazite were determined by electron microprobe (Fig. 33;
Appendix 9). These analyses are similar to chemical analyses of monazite from other mineral
sand localities (Dawood and El-Naby, 2007; Van Gosen et al., 2014). Much of the uranium and
thorium found in the heavy mineral, beach-placer sandstone deposits is mostly from monazite
(Fig. 33), although other trace minerals are found in these deposits that also contain uranium and
thorium.
FIGURE 33. Chondrite-normalized REE plot of selected monazites from heavy mineral, beach-placer deposits, Apache Mesa (red), Sanostee (dark blue), San Juan Basin, New Mexico and Virginia (green). Chemical analyses are in Appendix 9. Chondrite values are from Nakamura (1974).
La Pr Pm Eu Tb Ho Tm Lu
Ce Nd Sm Gd Dy Er Yb
0.01
0.1
110
100
Sam
ple/
RE
E c
hond
rite
47

Apache Mesa Assessment September 2016
FIGURE 34. Th+U+Si verses TREE (total REE) of selected monazites from heavy mineral, beach-placer deposits, Apache Mesa (red), Sanostee (dark blue), San Juan Basin, New Mexico and Virginia (green). Chemical analyses are in Appendix 9.
ORIGIN OF BEACH-PLACER SANDSTONE DEPOSITS
The Cretaceous heavy mineral, beach-placer sandstone deposits discussed herein have many
physical and chemical characteristics that are similar to modern heavy mineral, beach-placers,
including host rock, mineralogy, chemistry, and depositional environment (Houston and Murphy,
1970, 1977; Zech et al., 1994; Roy, 1999; Van Gosen et al., 2014). However, the Cretaceous
deposits are moderately to well cemented, whereas the modern deposits are unconsolidated and
can be ripped with dozers without any blasting. The heavy mineral, beach-placer deposits form
by gravitational settling of the heavy minerals during wave action and currents that form beaches
and offshore sand bars (Fig. 1; Houston and Murphy, 1970, 1977; Zech et al., 1994; Roy, 1999).
The waves carry off the lighter minerals leaving behind the heavy minerals. The deposits in
eastern Australia were formed during low rates of clastic supply and long periods of weathering
and abrasion of beach deposits (Roy, 1999). Transgressive and regressive shoreline movements,
such as occurred in Late Cretaceous time in the San Juan Basin area, result in the formation of
extensive shoreface-sandstone deposits covering thousands of square miles. Once the shoreface
0 5 10 15 20
4045
5055
60
ThUSi
TRE
E
48
Apache Mesa Assessment September 2016
sandstone deposits are deposited, they are covered by continental deposits, which preserve them
unless later erosion exposes them. In examination of titanomagnetite placer deposits along the
coast of New Zealand, sorting by size rather than weight appeared to be more important in
concentrating the heavy minerals (Bryan et al., 2007). The heavy minerals tend to concentrate in
the upper 100 ft of the beach, decreasing in concentration seaward. In the seaward region, the
undertow removed the finer and lighter minerals, whereas in the landward region, wind
transported the finer or lighter minerals away. Riptides and undertow currents erode beach
deposits and subsequently remove the lighter minerals, leaving the heavier minerals behind. The
Srikurmam ilmenite placer deposit in Andhra Pradesh area in India is confined between two
major rivers (Rao et al., 2008) and local drainages could have controlled the formation of beach-
placer deposits in New Mexico. Destruction and reworking of older beach-placer deposits can
occur until they are covered by continental deposits.
MINERAL RESOURCE POTENTIAL
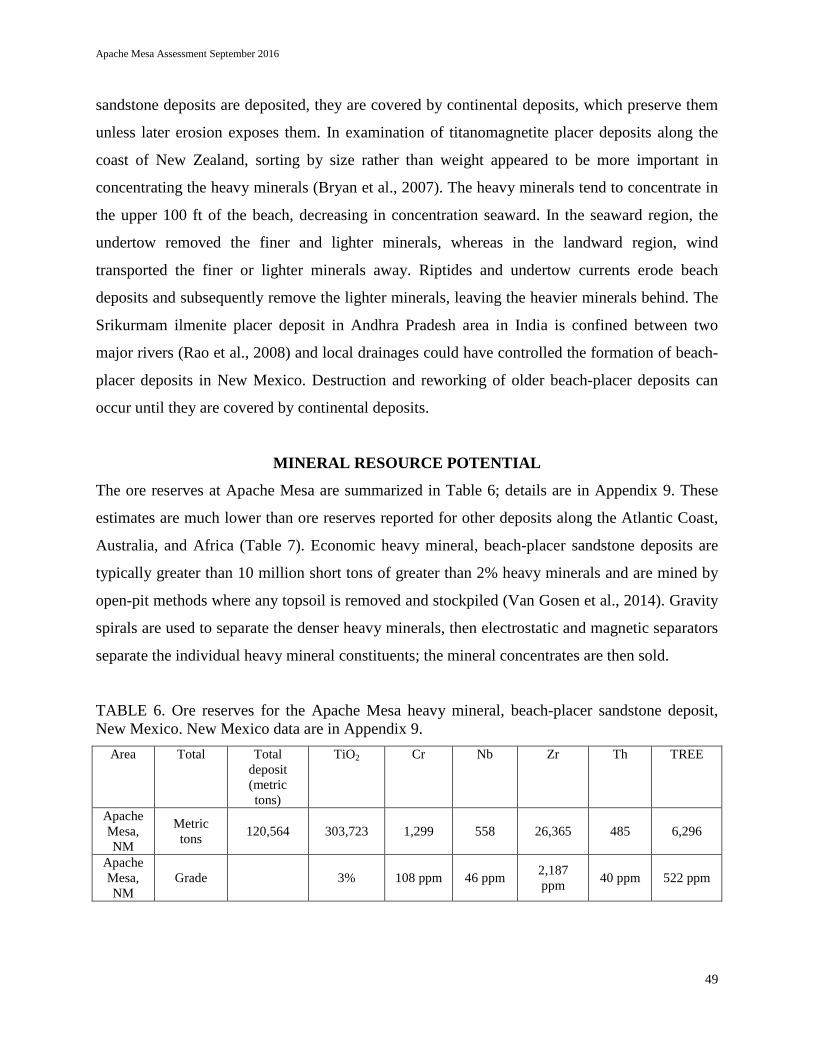
The ore reserves at Apache Mesa are summarized in Table 6; details are in Appendix 9. These
estimates are much lower than ore reserves reported for other deposits along the Atlantic Coast,
Australia, and Africa (Table 7). Economic heavy mineral, beach-placer sandstone deposits are
typically greater than 10 million short tons of greater than 2% heavy minerals and are mined by
open-pit methods where any topsoil is removed and stockpiled (Van Gosen et al., 2014). Gravity
spirals are used to separate the denser heavy minerals, then electrostatic and magnetic separators
separate the individual heavy mineral constituents; the mineral concentrates are then sold.
TABLE 6. Ore reserves for the Apache Mesa heavy mineral, beach-placer sandstone deposit, New Mexico. New Mexico data are in Appendix 9.
Area Total Total deposit (metric tons)
TiO2 Cr Nb Zr Th TREE
Apache Mesa, NM
Metric tons 120,564 303,723 1,299 558 26,365 485 6,296
Apache Mesa, NM
Grade 3% 108 ppm 46 ppm 2,187 ppm 40 ppm 522 ppm
49

Apache Mesa Assessment September 2016
TABLE 7. Ore reserves for other heavy mineral beach-placer sandstone deposits in the world. Iluka ore reserves are from http://www.iluka.com/docs/default-source/3.2-ore-reserves-mineral-resources/annual-statement-of-reserves-and-resources2014.pdf?sfvrsn=4 (accessed 6/7/2016).
Area Total deposit (metric tons)
Year Ilmenite % (FeTiO3)
Rutile % (TiO2)
Leucoxene % (Fe,Mg,Mn,Ti)O3)
Zircon % (ZrSiO4)
Apache Mesa, New
Mexico
120,564 2016 <3 - - <1
Atlantic Seaboard
(Iluka)
19,700,000 2014 60 - - 18
Eucla Basin, Australia (Iluka)
114,600,000 2014 27 4 - 51
Perth Basin, Australia (Iluka)
313,300,000 2014 59 5 - 10
Murray Basin,
Australia (Iluka)
12,000,000 2014 47 19 - 13
Grande Côte, Senegal,
West Africa
1,915,000 2015 - 2.5 3.2 10.7
CONCLUSIONS
The Apache Mesa heavy mineral, beach-placer sandstone deposits are similar in appearance,
texture (Appendix 5), mineralogy (Appendix 5), chemical composition (Appendix 6, 8), specific
gravity (Table 4), and origin to beach-placer sandstone deposits elsewhere in the San Juan Basin
and in Virginia, although the Virginia deposits are unconsolidated and have a lower specific
gravity (Table 4). The Cretaceous beach-placer sandstone deposits are more cemented than the
younger heavy mineral, beach-placer sandstone deposits found in Virginia, Australia, and India.
Although, some individual analyses of samples from Apache Mesa contain high concentrations
of TiO2 (15%), Cr (590 ppm), Nb (260 ppm), Zr (>10,000 ppm), Th (258 ppm), and TREE
(2,692 ppm); the Apache Mesa beach-placer sandstone deposit contains only 132,900 short tons
(120,564 metric tons) of ore with grades of 3% TiO2, 108 ppm Cr, 46 ppm Nb, 2,187 ppm Zr, 40
ppm Th, and 522 ppm TREE. In conclusion, the Apache Mesa heavy mineral, beach-placer
sandstone deposit is too small and low grade to be economic in today’s market. No further
investigation is recommended at this time.
50
Apache Mesa Assessment September 2016
ACKNOWLEDGMENTS
This report is part of on-going studies of mineral resources in New Mexico, supported by the
New Mexico Bureau of Geology and Mineral Resources (NMBGMR), Matthew Rhoades,
Director and State Geologist. Special thanks to Lynn Heizler and Nelia Dunbar of NMGMR for
their assistance with the microprobe analyses. Dan Koning of NMGMR assisted in the field and
his help is appreciated. Mark Mansell set up the GIS project. Leo Gabalon assisted with drafting
some of the figures. Richard Author and Gina D’Ambrosio edited and Shari Kelly, Todd
Osmera, and Tammy Jacobs reviewed this report and their efforts are appreciated. Recent
investigations on the Apache Mesa deposits were funded by a contract with the Jicarilla Apache
Nation through the Division of Energy and Minerals Development, Assistant Secretary Indian
Affairs (Grant A14AP00084). Earlier funding for examining beach-placer sandstone deposits
elsewhere in the San Juan Basin was by the U.S. Department of Energy, U.S. Bureau of Land
Management, U.S. Army Corps of Engineers, and E.I. duPont de Nemours and Co. A special
thanks to Society of Economic Geologists for organizing the post-GSA field trip on Placer
Deposits of the Atlantic Coastal Plain: Stratigraphy, Sedimentology, Mineral Resources, Mining
and Reclamation and to the organizers Anjana K. Shah, Rick Berquist, and Adam Karst.
REFERENCES
Allen, J.E., 1956, Titaniferous Cretaceous beach placer in McKinley County (abstr.), Geological
Society of America Bulletin, v. 67, p. 1789.
Beaumont, E.C., 1954, Geology of the Beautiful Mountain anticline, San Juan County, New
Mexico: U.S. Geological Survey, Oil and Gas Investigations Map OM 147, scale 1:
48000.
Berquist, C.R., 2010, Heavy mineral analyses of four samples, Virginia coastal plain: Virginia
Department of Mines, Minerals and Energy, Division of Geology and Mineral Resources
Minerals Report 10, 36 p.,
https://www.dmme.virginia.gov/DGMR/pdf/MineralsReport10-10.pdf (accessed
5/1/2016).
Berquist, C.R., 2010, Heavy mineral analyses of fifteen samples, Virginia coastal plain: Virginia
Department of Mines, Minerals and Energy, Division of Geology and Mineral Resources
Minerals Report 04–12, 22 p.,
51
Apache Mesa Assessment September 2016
https://www.dmme.virginia.gov/DGMR/pdf/MineralsReport04-12.pdf (accessed
5/1/2016).
Bingler, E.C., 1963, Niobium-bearing Sanostee heavy mineral deposit, San Juan Basin,
northwestern New Mexico: New Mexico Bureau Mines Mineral Resources, Circular 68,
63 p.
Bingler, E.C., 1968, Geology and mineral resources of Rio Arriba County, New Mexico: New
Mexico Bureau of Mines and Mineral Resources, Bulletin 91, 158 p.
Brookins, D.G., 1977, Upper Cretaceous black sand deposits of the San Juan Basin, in Fassett,
J.F. and James, H.L., eds., San Juan Basin III (northwestern New Mexico): New Mexico
Geological Society, 28th Annual Field Conference, Guidebook, p. 31–33.
Bryan, K.R., Robinson, A., and Briggs, R.M., 2007, Spatial and temporal variability of
titanomagnetite placer deposits on a predominantly black sand beach: Marine Geology, v.
236, p. 45–59.
Carpenter, M.B. and Keane, C.M., 2016, The geoscience handbook 2016: Alexandria, Virginia,
American Geosciences Institute (AGI) Data Sheets, 5th edition, 480 p.
Carpenter, R.H. and Carpenter, S.F., 1991, Heavy mineral deposits in the upper coastal plain of
North Carolina and Virginia: Economic Geology, v. 86, p. 1657–1671.
Cather, S.M., 2004, Laramide orogeny in central and northern New Mexico and southern
Colorado, in Mack, G.H. and Giles, K.A., eds., 2004, The Geology of New Mexico—A
Geologic History: New Mexico Geological Society, Special Publication 11, p. 203–248.
Chenoweth, W.L., 1957, Radioactive titaniferous heavy mineral deposits in the San Juan Basin,
New Mexico and Colorado, in Kottlowski, F. E., Baldwin, B., eds., Southwestern San
Juan Mountains (Colorado): New Mexico Geological Society, 8th Annual Field
Conference, Guidebook, p. 212–217,
https://nmgs.nmt.edu/publications/guidebooks/downloads/8/8_p0212_p0217.pdf
(accessed 5/1/2016).
Craigg, S.D., Dam, W.L., Kernodle, J.M., Thorn, C.R., and Levings, G.W., 1990, Hydrogeology
of the Point Lookout Sandstone in the San Juan structural basin, New Mexico, Colorado,
Arizona, and Utah: U.S. Geological Survey, Hydrologic Investigations Atlas HA-720-G,
2 sheets.
52

Apache Mesa Assessment September 2016
Dawood, Y.H. and El-Naby, H.H., 2007, Mineral chemistry of monazite from the black sand
deposits, northern Sinai, Egypt: a provenance perspective: Mineralogical Magazine, v.
71, p. 389–406.
Devine, P.E., 1991, Transgressive origin of channeled estuarine deposits in the Point Lookout
Sandstone, northwestern New Mexico—A model for Upper Cretaceous, cyclic regressive
parasequences of the U.S. western interior: American Association of Petroleum
Geologists, Bulletin, v. 75, p. 1039–1063.
Dow, V.T. and Batty, J.V., 1961, Reconnaissance of titaniferous sandstone deposits of Utah,
Wyoming, New Mexico and Colorado: U.S. Bureau of Mines, Report of Investigations
RI-5860, 52 p.
Fassett, J.E., 1977, Geology of the Point Lookout, Cliff House and Pictured Cliffs Sandstones of
the San Juan Basin, New Mexico and Colorado; in Fassett, J.F. and James, H.L., eds.,
San Juan Basin III: New Mexico Geological Society, 28th Annual Field Conference,
Guidebook, p. 193–197.
Fassett, J.E., 2000, Geology and coal resources of the Upper Cretaceous Fruitland Formation,
San Juan Basin, New Mexico and Colorado, in Kirschbaum, M.A.; Roberts, L.N.R.;
Biewick, L.R.H., ed., Geologic assessment of coal in the Colorado Plateau; Arizona,
Colorado, New Mexico, and Utah: U.S. Geological Survey Professional Paper 1625-B,
Q1–Q132.
Folk, R.L., 1974, Petrology of Sedimentary rocks: Austin, Texas, Hemphill Pub. Co., 182 p.
Force, E.R., 1991, Geology of titanium-mineral deposits: Geological Society of America Special
Paper 259, 112 p.
Force, E.R., 2000, Titanium mineral resources of the western U.S—an update: U.S. Geological
Survey, Open-file Report 00–442, 43 p.
Force, E.R., Butler, R.F., Reynolds, R.L. and Houston, R.S., 2001, Magnetic ilmenite-hematite
detritus in Mesozoic-Tertiary placer and sandstone-hosted uranium deposits of the Rocky
Mountains: Economic Geology, v. 96, no. 6, p. 1445–1453.
Hollenshead, C.T. and Pritchard, R.L., 1961, Geometry of producing Mesaverde sandstone of the
San Juan Basin, in Geometry of sandstone bodies: Association of Petroleum Geologists,
Symposium volume, p. 68–118.
53

Apache Mesa Assessment September 2016
Houston, R.S. and Murphy, J.F., 1970, Fossil beach placers in sandstones of Late Cretaceous age
in Wyoming and other Rocky Mountain states: Wyoming Geological Association, 22nd
Guidebook, p. 241–249.
Houston, R.S. and Murphy, J.F., 1977, Depositional environment of Upper Cretaceous black
sandstones of the western interior: U.S. Geological Survey, Professional Paper 994-A p.
A1–A29.
Jones, G., 2009, Mineral sands—an overview of the industry: 7th International Mining Geology
Conference, Perth, WA, August, p. 213–222.
Jones, G. and O’Brien, V., 2014, Aspects of resource estimation for mineral sands deposits:
Aspects of resource estimation for mineral sands deposits, Applied Earth Science, 123:2,
86-94, doi: 10.1179/1743275814Y.0000000048,
http://www.tandfonline.com/doi/pdf/10.1179/1743275814Y.0000000048 (accessed
6/1/2016).
Kattaa, B., 2002, Heavy mineral survey of the Syrian beach sands, south of Tartous: their nature,
distribution and potential: Exploration Mining Geology, v. 11, p. 31–41.
Kirk, A.R. and Sullivan, M.W., 1987, Geologic map of the Dalton Pass quadrangle, McKinley
County, New Mexico: U.S. Geological Survey, Geologic Quadrangle Map GQ-1593,
scale 1:24,000.
Koch, G.S., 1986, A geochemical atlas of Georgia: Georgia Geologic Survey, Geological Atlas
No. 3, 44 p.
Lahee, F.H., 1961, Field geology: McGraw-Hill Book Company, New York, 926 p.
Landis, E.R., Dane, C.H., and Cobban, W.A., 1974, Cretaceous rocks of the Tierra Amarilla coal
field and adjacent areas, Rio Arriba County, New Mexico, in Siemers, C.T., Woodward,
L.A., and Callender, J.F., eds., Ghost Ranch (Central-Northern New Mexico): New
Mexico Geological Society, 25th Annual Field Conference, Guidebook, p. 231–238.
Luterbach, T. and McLemore, V.T., 2016, Trace element analysis of placer gold samples:
Society for Mining, Metallurgy, and Exploration, 2016 Annual meeting preprint 16-062, 4
p., http://geoinfo.nmt.edu/staff/mclemore/projects/documents/16_062.pdf (accessed
5/1/2016).
Long, K.R., van Gosen, B.S., Foley, N.K. and Cordier, D., 2010, The principle rare earth
elements deposits of the United States—A summary of domestic deposits and a global
54

Apache Mesa Assessment September 2016
perspective: U.S. Geological Survey, Scientific Investigations Report 2010-5220, 104 p.,
http://pubs.usgs.gov/sir/2010/5220/ (accessed 5/1/12).
McLemore, V.T., 1983, Uranium and thorium occurrences in New Mexico—distribution,
geology, production, and resources; with selected bibliography: New Mexico Bureau of
Mines and Mineral Resources, Open file Report 182, 950 p., also; U.S. Department of
Energy Report GJBX11 (83).
McLemore, V.T., 2010, Distribution, Origin, and Mineral Resource Potential of Late Cretaceous
Heavy Mineral, Beach-Placer Sandstone Deposits, San Juan Basin, New Mexico, in
Fassett, J.E., Zeigler, K.E., and Lueth, V.W., eds., Geology of the Four Corners Country:
New Mexico Geological Society, 61st Annual Field Conference, Guidebook, p. 197–212,
https://nmgs.nmt.edu/publications/guidebooks/downloads/61/61_p0197_p0212.pdf
(accessed 5/1/2016).
McLemore, V.T., 2011, Rare earth elements for emerging technologies: New Mexico Earth
Matters, summer, 4 p.,
http://geoinfo.nmt.edu/publications/periodicals/earthmatters/11/EM11n2.pdf (accessed
5/1/2016).
McLemore, V.T., 2015, Rare Earth Elements (REE) Deposits in New Mexico: Update: New
Mexico Geology, v. 37, p. 59–69,
http://geoinfo.nmt.edu/publications/periodicals/nmg/current/home.cfml (accessed
5/1/2016).
McLemore, V.T., Donahue, K., Krueger, C.B., Rowe, A., Ulbricht, L., Jackson, M.J., Breese,
M.R., Jones, G., and Wilks, M., 2002, Database of the uranium mines, prospects,
occurrences, and mills in New Mexico: New Mexico Bureau of Geology and Mineral
Resources, Open file Report, v. 461, CD-ROM,
http://geoinfo.nmt.edu/publications/openfile/details.cfml?Volume=461 (accessed 6/1/16).
McLemore, V.T. and Frey, B.A., 2009, Appendix 8. Quality control and quality assurance report
(Task B1); in McLemore, V.T., Dickens, A., Boakye, K., Campbell, A., Donahue, K.,
Dunbar, N., Gutierrez, L., Heizler, L., Lynn, R., Lueth, V., Osantowski, E., Phillips, E.,
Shannon, H., Smith, M., Tachie-Menson, S., van Dam, R., Viterbo, V.C., Walsh, P., and
Wilson, G.W., Characterization of Goathill North Rock Pile: New Mexico Bureau of
Geology and Mineral Resources, Open-file report 523,
55

Apache Mesa Assessment September 2016
http://geoinfo.nmt.edu/publications/openfile/details.cfml?Volume=523 (accessed
5/1/2016).
McLemore, V. T., Hoffman, G., Smith, M, Mansell, M., and Wilks, M., 2005a, Mining districts
of New Mexico: New Mexico Bureau of Geology and Mineral Resources, Open-file
Report 494, CD-ROM.
McLemore, V. T., Krueger, C. B., Johnson, P., Raugust, J. S., Jones, G. E., Hoffman, G. K. and
Wilks, M., 2005b, New Mexico Mines Database: Society of Mining, Exploration, and
Metallurgy, Mining Engineering, February, p. 42–47.
McLemore, V.T., North, R.M., and Leppert, S., 1988a, Rare-earth elements (REE), niobium and
thorium districts and occurrences in New Mexico: New Mexico Bureau of Mines and
Mineral Resources, Open-file Report OF-324, 28 p.
McLemore, V.T., North, R.M., and Leppert, S., 1988b, Rare-earth elements (REE) in New
Mexico: New Mexico Geology, v. 10, p. 33–38.
McLemore, V.T. and Robison, A., 2016, Exploration of Beach-Placer Heavy Mineral Deposits in
the San Juan Basin in New Mexico: Society for Mining, Metallurgy, and Exploration, 2016
Annual meeting Preprint 16–136, 10 p.,
http://geoinfo.nmt.edu/staff/mclemore/projects/documents/16_136.pdf (accessed 5/1/2016).
Molenaar, C.M., 1989, San Juan Basin stratigraphic correlation chart, in W.I. Finch, A.C.
Huffman, Jr., and J.E. Fassett, eds., Coal, uranium, and oil and gas in Mesozoic rocks of
the San Juan Basin—Anatomy of a giant energy-rich basin: 28th International Geological
Congress, Washington, D.C., Guidebook for Field Trip T120, p. xi.
Morteani, G., 1991, The rare earths: their minerals, production and technical use: European
Journal of Mineralogy, v. 3, p. 641–650.
Murphy, J.F., 1956, Preliminary report on titanium-bearing sandstones in the San Juan Basin and
adjacent areas in Arizona, Colorado, and New Mexico: U.S. Geological Survey, Open-
file Report 56-0086, 8 p.
Nakamura, N., 1974, Determination of REE, Ba, Fe, Mg, Na, and K in carbonaceous and
ordinary chondrites: Geochimica et Cosmochimica Acta, v. 38, p. 757–775.
Peterson, C.D., Komar, P.D., and Scheidegger, K.F., 1986, Distribution, geometry, and origin of
heavy mineral placer deposits on Oregon beaches: Journal of Sedimentary Petrology, v.
56, p. 67–77.
56
Apache Mesa Assessment September 2016
Philander, C. and Rozendall, A., 2015, Geology of the Cenozoic Namakwa Sands heavy mineral
deposit, west coast of South Africa: world-class resource of titanium and zircon:
Economic Geology, v. 110, p. 1577–1623.
Pirkle, F.L., Pirkle, W.A., and Pirkle, E.C., 2009, Heavy mineral sands of the Atlantic and Gulf
coastal plains, USA; Developments in Sedimentology, v. 58, p. 1145–1232.
Popoff, C.C., 1966, Computing reserves of mineral deposits: Principles and conventional
methods: U.S. Bureau of Mines, Information Circular 8283, 122 p.
Overstreet, W.C., 1967, The geologic occurrence of monazite: U.S. Geological Survey,
Professional Paper 530, 327 p.
Rao, M.J., Raj, A. A.J., and Paul, K.J., 2008, Occurrence of zincian ilmenite from Srikurmam
placer sand deposit, Andhra Pradesh, India: Current Science, vol. 95, no. 9, 10, p. 1124–
1127.
Reid, A., Keeling, J., Boyd, D., Belousova, E., and Hou, B., 2013, Source of zircon in world-
class heavy mineral placer seposits of the Cenozoic Basin, southern Australia from LA-
ICPMS U-Pb geochronology: Sedimentary Geology, v. 286–287, p. 1–19.
Robinson-Roberts, L.N.R., and Kirschbaum, M.A., 1995, Paleogeography of the Late Cretaceous
of the Western Interior of Middle North America–Coal distribution and sediment
accumulation: U.S. Geological Survey Professional Paper 1561, 115 p.
Roy, P.S., 1999, Heavy mineral beach placers in southeastern Australia: Their nature and
genesis: Economic Geology, v. 94, p. 567–588.
Segerstrom, K. and Henkes, W.C., 1977, Status of mineral resource information for the Jicarilla
Indian Reservation, New Mexico: U.S. Geological Survey, Adminstrative Report BIA-
25, 22 p.
Tabet, D.E. and Frost, S.J., 1979, Coal geology of Torreon Wash area, southeast San Juan Basin,
New Mexico: New Mexico Bureau of Mines and Mineral Resources, Geologic Map 49, 3
sheets, scale 1:24,000.
U.S. Geological Survey, 2016, Mineral commodity summaries 2016: U.S. Geological Survey,
202 p., http://dx.doi.org/10.3133/70140094 (accessed 5/1/2016).
Van Gosen, B.S., Fey, D.L., Shah, A.K., Verplanck, P.L., and Hoefen, T.M., 2014, Deposit
model for heavy mineral sands in coastal environments: U.S. Geological Survey
57
Apache Mesa Assessment September 2016
Scientific Investigations Report 2010–5070–L, 51 p.,
http://dx.doi.org/10.3133/sir20105070L (accessed 5/1/2016).
Zech, R.S., 1982, Paleoshorelines in the Upper Cretaceous Point Lookout Sandstone, southern
San Juan basin, New Mexico: U.S. Geological Survey, Open-file report 82–135, 25 p.
Zech, R.S., Reynolds, R.L., Rosenbaum, J.G., and Brownfield, I.K., 1994, Heavy mineral placer
deposits of the Ute Mountain Ute Indian Reservation, southwestern Colorado and
northwestern New Mexico: U.S. Geological Survey, Bulletin 2061-B, 39 p.
58

Apache Mesa Assessment September 2016
APPENDIX 1. GLOSSARY OF TERMS
Alteration–any change in the mineralogical composition of a rock brought about by physical or
chemical means; can occur by weathering
Cross beds–layers of sediment inclined at an angle
Fault–a discreet surface separating two rock masses across which one mass has slid past the
other
Formation–a body of rock identified by lithic characteristics and stratigraphic position
Fracture–general term for any surface within a material across which there is no cohesion, e.g. a
crack
Geographic information system (GIS)–A computer program or system that allows storage,
retrieval, and analysis of spatially related information in both graphical and database
formats
Grain size and shape (Fig. A1)
FIGURE A1. Grain size and shape of sedimentary rocks.
Heavy mineral sands–detrital minerals such as rutile, ilmenite, leucoxene, zircon, and monazite
typically occurring as a sand-sized fraction, with a high specific gravity relative to that of
the host sand
Lamination–thinnest layers of sediment in a unit of sedimentary rock
Lithology–the description of rocks on the basis of such characteristics as color, mineralogical
composition (what minerals the rock is composed of), and grain size
59

Apache Mesa Assessment September 2016
Mineral deposit–any occurrence of a valuable commodity or mineral that is of sufficient size and
grade (concentration) for potential economic development under past, present, or future
favorable conditions.
Porosity–measure of void spaces in a material
Ore deposit-a well–defined mineral deposit that has been tested and found to be of sufficient
size, grade, and accessibility to be extracted and processed at a profit over a specific time
Placer deposits–mineral deposit formed by mechanical concentration of heavy mineral particles,
such as gold from weathered debris
Precision–the degree of agreement among repeated measurements of the same characteristic and
monitored by multiple analyses of many sample duplicates and internal standards. It may
be determined by calculating the standard deviation, or relative percent difference, among
samples taken from the same place at the same time.
Quality assurance/quality control (QA/QC)–a system of procedures, checks, audits, and
corrective actions to ensure that all research design and performance, environmental
monitoring and sampling, and other technical and reporting activities are of the highest
achievable quality
Representative sample–a portion of material that is as nearly identical in content and consistency
as possible to that in the larger body of material being sampled
Sorting–refers to how similar grain sizes in a rock are (Fig. A2)
FIGURE A2. Sorting of sedimentary rocks
60
Apache Mesa Assessment September 2016
Texture (massive)–refers to sedimentary rock that is free from laminations and forms a single,
large bed
Texture (planar)–refers to sedimentary rock that has parallel laminations within its beds
Topographic map–a map showing 2-dimensional representation of 3-dimensional changes in
relief by means of contour lines
Trace minerals–minerals containing trace elements, which are elements that make up less than
1% of a mineral
Weathering–process whereby earthy or rocky materials are changed in color, texture,
composition, or form (with little or no transportation) by exposure to the atmosphere
61