minerals council of australia council of australia ... with estimates for 2007-08 and 2008-009, the...
TRANSCRIPT

MINERALS COUNCIL OF AUSTRALIA
SUBMISSION TO THE HOUSE OF REPRESENTATIVES ECONOMICS COMMITTEE
Mineral Resource Rent Tax Bill 2011 and related bills
NOVEMBER 2011

2
EXECUTIVE SUMMARY
The minerals industry is Australia’s most globalised industry and a key pillar of the national economy. It accounts for around 7% of GDP, upwards of 20% of national investment and more than 50% of Australia’s exports of goods and services. The industry is also a large and growing contributor to Federal and State Government revenues in Australia under existing taxation and royalty arrangements.
The product groups covered by the proposed Minerals Resource Rent Tax (MRRT) – coal and iron ore – are the nation’s two largest export earners. Export earnings from both commodities combined in 2010-11 were around $91.7 billion – more than one in every three export dollars earned by Australia, up from around one in 10 a decade ago. Coal and iron ore projects are highly capital-intensive with considerable, high-risk exploration outlays, large upfront capital commitments, long-life assets, sophisticated technologies and long lead times to profitability. A stable, efficient and competitive taxation regime is therefore critical to the international competitiveness of projects and to attracting future investment into these industries.
With certain caveats, the Minerals Council of Australia (MCA) considers that the set of bills presented to the Australian Parliament on 2 November 2011 represents a workable basis for implementation of the MRRT in line with the agreement made by the Australian Government with major mining companies in July 2010, as modified by the recommendations of the Government’s Policy Transition Group (PTG). The caveats are as follows:
i. Though a marked improvement on the proposed Resource Super Profits Tax (RSPT), the MRRT still pushes tax rates on coal and iron ore projects to the upper boundary of globally competitive tax rates (Chart 1).
ii. Both the proposed bills and the explanatory material for the MRRT are very complex and further consultation through the Resource Tax Implementation Group (RTIG) would have helped to improve the legislation and uncover any unintended consequences.
iii. The bills introduce some new concepts and practices and it will be important that companies are afforded appropriate consideration by the Australian Taxation Office (ATO) given the large transition and ongoing compliance costs from the imposition of the MRRT. In some areas, the proposed MRRT legislation remains open to a degree of interpretation that does not aid taxpayer certainty.
iv. The experience of the Petroleum Resource Rent Tax (PRRT) has underlined further that poor tax design and/or a lack of clarity in resource taxation law can result in considerable disputation and litigation. It is important that the weaknesses and administrative irritations that have characterised the PRRT are not replicated in the administration of the MRRT.
Chart1: Effective tax rates under the MRRT
0
10
20
30
40
50%
Iron Ore
0
10
20
30
40
50%
Coal
Source: KPMG

3
The MCA considers that, in the event these MRRT bills become law, early consideration should be given by Treasury to the need for a Consequential Amendments Bill to address any design flaws and unintended consequences. The House of Representatives Economics Committee should make a recommendation to this effect.
Implementation of the MRRT will have a critical bearing on investor confidence and on the future competitiveness of Australia’s minerals sector. The mining of coal and iron ore will be among the highest taxed industries in Australia at the very time when the opportunities for taking advantage of a “once in a century” shift in Australia’s comparative advantage are greatest and when Australia faces growing competition from alternative commodity suppliers. As noted above, benchmarking by KPMG shows the effective tax rate under the MRRT will be higher than producers face in comparable competitor nations – Canada, Brazil and China for iron ore and South Africa, Canada and China for coal. Incidentally, none of these nations has additional imposts on their minerals industries in the form of a carbon tax or an emissions trading scheme.
In terms of the broad mandate of this Committee, the MCA considers that Australia is at a crossroads in meeting the challenges and securing the opportunities of the “mining boom”. If the central focus of policy-makers is simply “spreading the benefits” of the boom through higher taxation on the mining sector, Australia will have lost an historic opportunity to take maximum advantage of our comparative advantage in mineral commodities. The so-called “patchwork economy” narrative with its focus on redistribution rather than on capacity building and maintaining economic flexibility is a flawed prism for viewing the benefits to Australia from this period of mining sector expansion, the opportunities presented for further gains over coming years and the policy framework needed to secure those gains.
Strong growth in revenues from the minerals industry is one important channel by which Australians have benefited from mining industry expansion over the last decade. Mining is already among the highest taxed industries in Australia and minerals resource companies are Australia’s largest taxpayers. Based on estimates by Deloitte Access Economics, the minerals industry is expected to pay a record $23.4 billion in combined company tax and royalties in 2010-11. Over the last decade, direct revenues from Federal company tax and State and Territory royalties generated by the minerals industry have exceeded $110 billion.
Despite claims to the contrary, the revenue contribution from minerals resource companies to Australian Governments (Federal and State) has risen in line with higher commodity prices. Company tax and royalty payments combined have risen four-fold as a share of GDP over the last decade.
The minerals industry has continued to contest claims made during the 2010 mining tax debate about the tax that miners pay. In order to improve the quality and timeliness of data on which resource taxation debates are based, in late 2010 the MCA commissioned Deloitte Access Economics to assist it in collecting its own data on taxes paid by mining companies. Based on this tax collection survey, Deloitte Access Economics calculated “tax-take” ratios broadly comparable with those published by the Government in 2010. While the official measure of the tax base used (unobservable) resource profits (or “rents”) as the denominator in its tax-take ratios, with estimates for 2007-08 and 2008-009, the analysis by Deloitte Access Economics instead used taxable income (or the corporate tax base) before deducting royalties. This provides, as the report notes, a more transparent and widely-accepted measure of corporate profits. The key findings of this work are:
• In the most recent survey year (2009-10), the royalty tax take was 17.5%, while the total tax-take (royalties plus company tax) was 42.2%.
• This was up from a tax ratio of 40.6% in 2008-09. Notably, the 2008-090 figure was well above the estimate of 27% headlined in the official figures in the tax debate last year.
• The tax take from the larger miners has been relatively stable in recent years. The royalty tax-take averaged 16.4% between 2007-08 and 2009-10. The total tax take averaged 41.5%.
Accordingly, Deloitte Access Economics concluded that the mining tax-take:
... has not fallen to the low levels cited by the Government in last year’s mining tax debate. This is particularly the case when a wider view is taken of the mining tax take to include company tax as well as royalties. Rather, the fluctuations over time seem mainly to be cyclical in nature rather than evidence of any persistent trend.
Through the 2010 tax debate – and perhaps in its aftermath – the extent of the industry’s preparedness to engage in meaningful consultation for reform of mineral royalty taxation arrangements became obscured. The principles that formed the basis of MCA advocacy were as follows:

4
• Internationally competitive: the overall tax burden on the industry should be competitive with tax burdens in other countries;
• Prospective: tax changes should not undermine the basis upon which past investments have been made (i.e. no retrospective application);
• Differentiated: reforms should recognise that capital investment and financial return characteristics differ across resources commodities such that different minerals can sustain different tax burdens;
• Resource-based: a resource-based tax should be limited to the value of the resource (not reach into the value added from infrastructure and other activities such as processing and smelting); and
• Equitable and efficient: Reform of taxation and royalty arrangements should promote economic activity and improve the efficiency, simplicity and fairness of the tax system without compromising competitive neutrality.
The foundation agreement for the MRRT was reached based on the design principles outlined above for the development of an internationally competitive mineral resource tax regime that also provides the Australian community with an appropriate return from accessing Australia’s finite mineral resources. Importantly, the MRRT is a marked improvement on the Government’s earlier proposal for a Resource Super Profits Tax and much closer to sound tax reform principles. The Government has itself recognised the design flaws in the RSPT.
Firstly, the MRRT establishes a more internationally competitive tax rate. As Chris Richardson of Deloitte Access Economics has observed, “the RSPT risked sending mining investment overseas – a risk magnified by its 40% (headline) rate”. As designed, under the MRRT profitable coal and iron ore projects should face an effective tax rate of not more than 45%. This is achieved through the interaction of the 30% headline MRRT rate, the 25% extraction allowance, a company tax rate of 29% (effective from 2013-14) and a credit for all current and future State and Territory royalties paid.
Secondly, the MRRT (through the availability of a market value starting base allowance) lessened dramatically the retrospective element of the RSPT. It was the spectre of the government claiming a 40% stake in successful mines without having borne any investment risk which created massive “sovereign risk” concerns and resulted in major projects around Australia being put on hold. With the only deduction allowed to companies based on written down book value of project interests, both the scale and timing of taxes to be paid by the industry marked the RSPT out as a short-term “tax grab” rather than genuine long-term tax reform.
Other improvements of the MRRT over the RSPT include: i) appropriate differentiation between mineral commodities on grounds of international competitiveness; ii) appropriate recognition of commercial returns for downstream operations based on arm’s length principles to ensure the MRRT is levied on the primary resource value only, and not on value added in downstream transport logistics, industrial processing and smelting; iii) the provision of immediate deductibility of capital expenditure to encourage investment into coal and iron ore projects; iv) a more appropriate return to capital invested through a higher MRRT uplift rate; and v) taxpayers with low levels of profitability will not have an MRRT liability. On the basis of these design parameters, the MCA recognises the MRRT is designed to strike an appropriate balance between revenue, equity, economic efficiency and compliance objectives.
Since the announcement of the MRRT, some misconceptions have developed, especially regarding its application to smaller, emerging miners. No provision of the tax discriminates against smaller, emerging Australian miners; indeed, certain features of the MRRT (the low profit threshold and simplified obligations) are designed to lower the overall burden of the tax on smaller miners.
The MRRT effectively operates as a “top-up” tax, never resulting in lower collection of revenue than exists under the status quo of company tax and royalties, but setting a higher rate for more profitable miners. On this basis, the bulk of MRRT liabilities will fall on larger miners with more profitable projects. The Government has stated that the MRRT “applies equally to small and large miners, and large mining companies will pay about 90% of the tax”.

5
CHAPTER 1: LOCKING IN THE BOOM: FROM PRICE TO VOLUME GROWTH
The minerals industry is Australia’s most globalised industry and a key pillar of the national economy. It accounts for around 7% of GDP, upwards of 20% of national investment and more than 50% of Australia’s exports of goods and services. The industry is also a large and growing contributor to Federal and State Government revenues in Australia under existing taxation and royalty arrangements.
Australia is one of only a handful of OECD economies that is a net exporter of minerals and energy, a distinct advantage with the rise of emerging Asia in the global economy. The resources boom that began roughly around 2003-04, punctuated by the Global Financial Crisis (GFC), has delivered significant economy-wide benefits to Australia. It is being driven by a significant increase in demand for key Australian export commodities. Over the past decade, global consumption of coal has increased by about 50%; consumption of iron ore has increased by 80% since 2003.
The product groups covered by the proposed MRRT – coal and iron ore – are the nation’s two largest export earners. Export earnings from both commodities combined in 2010-11 were around $91.7 billion – more than one in every three export dollars earned by Australia, up from around one in 10 a decade ago. Coal and iron ore projects are highly capital-intensive with considerable, high-risk exploration outlays, large upfront capital commitments, long-life assets, sophisticated technologies and long lead times to profitability. A stable, efficient and competitive taxation regime is therefore critical to the international competitiveness of projects and to attracting future investment into these industries.
The MCA considers that Australia is at a crossroads in meeting the challenges and securing the opportunities of further growth in mining sector activity. If the central focus of policy-makers is simply “spreading the benefits” of the boom through higher taxation on the mining sector, Australia will have lost an historic opportunity to take maximum advantage of our comparative advantage in mineral commodities. Indeed, the nation’s future growth prospects would be damaged with adverse consequences for the living standards of all Australians.
Put simply, the Minerals Resource Rent Tax should not be the centre-piece of the nation’s policy response to the mining boom. Australia’s biggest policy challenge is to lock in the mining boom by moving from an era of price growth to one defined by volume growth. This calls for disciplined macroeconomic policy, sustained capacity building and further microeconomic reform to secure prosperity for future generations of Australians.
A policy focus on “distributing the benefits” of the boom across a “patchwork economy”, where mining’s success is seen as coming at the expense of other sectors, is a flawed prism for understanding the opportunities and challenges presented to Australia from continued strong global demand for mineral commodities. To recognise what is at stake requires an understanding of what the mining boom of the last few years has meant to Australian living standards and the opportunities it presents in the future.
The Minerals Sector and Australia’s Economic Performance
The huge lift in global commodity demand over the past decade, and the corresponding surge in commodity prices, has generated the most sustained lift in Australia’s terms of trade on record. An improvement in the terms of trade increases Australia’s national income. According to the Reserve Bank Governor Glenn Stevens, Australia’s nominal GDP is about 15% higher than it would have been if the terms of trade had stayed at its long-term average levels.
The increase in mining exports and revenues has made a significant direct contribution to economic activity and incomes of Australians over recent years. Treasury research of “Mining Boom Mark I” concluded that the benefits of the resources boom “have spread well beyond the sectors and regions most closely linked to the mining sector”. This conclusion accords with other research, including work done for the MCA by Access Economics which found that in recent years roughly two thirds of the benefits generated by the mining boom have washed through the national economy.
The channels by which activity within the mining industry has spilled over into domestic activity include through demand for labour, intermediate inputs and investment, its payment of taxes and royalties, and the boost to Australian incomes through the ownership of mining equities. The conclusion drawn from recent Reserve Bank research is that:
... the impact of the resources sector expansion does get spread around, in more ways than might immediately be apparent. Obviously mining employs only a small share of the workforce directly – less than 2 per cent. But to produce a dollar of revenue, companies spend about 40 cents on acquiring non-labour intermediate inputs, primarily from the

6
domestic sector. Apart from the direct physical inputs, there are effects on utilities, transport, business services such as engineering, accounting, legal, exploration and other industries. It is noteworthy that a number of these areas are growing quickly at present.
Once the costs of producing the output and other factors – such as taxes – are taken into account, the remaining revenue is distributed to shareholders or retained. While a significant proportion of the earnings distributed goes offshore, local shareholders also benefit. In fact, most of us are shareholders in the mining industry through our superannuation schemes. We don’t get this income directly to spend now – it is in our superannuation. Nonetheless, it is genuine income and a genuine increase in wealth.
The flow of benefits to Australia is even larger when account is taken of the degree to which the industry’s retained earnings have been ploughed back as investment into new projects in Australia. In this context, analysis for the MCA in 2009 reported that over the previous decade the sum of taxes paid and investment by mineral resource companies in Australia was 98% of cash flows from Australian operations.
Chart 2: Pre-tax cash flows, tax paid and investment in Australia’s minerals resources industry 1999-2000 to 2008-09, $ Billions
1 Pre-tax profit with depreciation expenses added back in to calculate cash flows Source: Access Economics estimates for the MCA sourced from Commonwealth and State Budget Papers, ABS and ATO Mining and “non-mining” states and regions have shared in the benefits from mining sector expansion. Careful analysis finds that while the effects “were initially identifiable in the resource-rich states of Western Australia and Queensland ... by the end of the decade, the benefits appeared to be flowing more evenly across the country”.
Since the mining boom gathered steam, regional disparities in unemployment have continued to decline in line with aggregate unemployment. While areas of disadvantage remain, as the economy has strengthened off the back of mining growth the regional distribution of unemployment has become more compressed – with a smaller proportion of regions experiencing high unemployment. Compared with the late 1990s when less than 15% of local regions had unemployment rates less than 5%, by September 2010 the figure had risen to around half.
The minerals industry’s successful negotiation of the GFC and its harnessing of the opportunities presented by renewed growth in demand for resources in emerging economies have directly increased Australia’s national income and wealth. The growth in mineral exports in 2009 – with coal and iron ore reaching record volumes – was a major reason Australia did not follow other nations into recession.
Strong growth in industrial production in the mining sector continued throughout the GFC and into the recovery of 2009, even while production in other sectors stagnated or went backwards. Mining sector export income totalled $138 billion in nominal terms during 2008-09, or 11% of GDP. Significantly, both export prices and volumes increased over the period. Mining was the only industrial sector to expand in Australia during the December 2008 quarter when the rest of the economy contracted and most countries slid into recession. Hence analysis by Deloitte concluded that:

7
The rapidly improving strength of Australia’s mining sector during 2008-09 played a key role in shielding Australia from some of the worst consequences of the global financial crisis and the ensuing global recession. ... But for the performance of Australia’s mining sector, the economic downturn in the latter part of 2008 and early 2009 in Australia would likely have been far more severe.
The alternative picture painted of one part of the economy doing well at the expense of other industries and non-mining regions is simply wrong. More seriously, it risks diverting policy attention and scarce resources from critical reform tasks, acting to favour distortionary policies that run counter to Australia’s policy achievements over the so-called “reform era” of the 1980s and 1990s.
The Limits of the “Patchwork Economy” Narrative
Different parts of the Australian economy operate at different speeds and the composition of the economy is constantly changing. This is nothing new. Indeed, it is a sign of a well-functioning, flexible economy which allows capital and labour to flow to where they are used most productively. According to ABS statistics, in a typical year our economy sees around 300,000 firms entering and exiting and roughly half a million workers changing industries .
Describing the effects of sustained growth in mining revenues, the Reserve Bank Governor has observed that the effects:
... even if concentrated initially, will tend to be felt more generally across the economy over time. The way the economy works will naturally tend to help this occur, as will various other policy devices. That is what is supposed to happen in a well-functioning, integrated national economy.
Reserve Bank Deputy Governor Ric Battelino, based on a detailed analysis of past and present mining booms, has made the point similarly that:
... a lot of people talk about two speed economies, but through mining booms it’s usually the case that all parts of the Australian economy benefit. Some benefit more than others, so you have very fast and fast.
A study for the MCA by Deloitte in 2010 put it this way:
In a modern, dynamic and growing economy, there are always sectors that are expanding and contracting as demand and supply conditions change and prices adjust. Australia does not have a ‘two-speed economy’, it has thousands of industries operating at different speeds, with price and resource adjustments taking place constantly.
... Non-uniform rates of expansion and contraction are desirable and in fact necessary for economic progress and are part and parcel of the process of economic growth and sustained improvements in living standards.
The notion of comparative advantage, once described by Paul Samuelson as an idea that is “both universally true and not obvious”, is a good example of how sometimes there is more to an economic concept than meets the eye. Often, however, there is less.
A good example is the catalogue of claims around the “two-speed” or “patchwork economy”, and associated charges about the so-called “Dutch Disease”. This is the notion that a natural resources boom, by resulting in an appreciation of the real exchange rate, hurts other traded goods sectors (particularly manufacturing) to the point that long-term economic growth is impeded. In its more extreme form, this notion has fed into the argument that countries like Australia with considerable natural resources suffer from a so-called “resource curse”.
A good indicator of the confusion in the current debate is the degree to which inherently contradictory claims are made about the mining boom. Hence, the mining sector is charged simultaneously with ripping workers away from other sectors of the economy, but also with not employing enough workers. On the one hand, mining has been charged with overheating Australia’s economy; in the next breadth, it’s alleged that most of the benefits are going overseas.
The Deloitte study noted above found that:
... there is nothing in Dutch disease story which says the mining boom necessarily reduces wages, slows overall economic growth or reduces incomes. Indeed, the increase in minerals prices boosts the nation’s overall income, increases growth and is likely to raise wages.

8
Moreover, it found that contrary to the “two-speed” conventional wisdom surrounding the mining boom there is nothing unusual about regional growth disparities in Australia. Economic growth in Australia has rarely, if ever, been uniform between States and Territories over the last twenty years. Indeed, current disparities are low by historical standards.
In addition, there is nothing particularly unusual about different sectors growing at different rates in Australia. Indeed, this seems to be the rule rather than the exception.
Paul Bloxham of HSBC has looked at the evidence more recently and confirmed that as yet:
... we haven’t seen greater divergence across industries than is historically normal for Australia. Nor have we seen greater divergence across the states than is usual. We also have, as yet, not seen substantial lay-offs in the affected industries or capital stock shrinkage.
This low level of dispersion across industries and states, Bloxham concludes, is further strong evidence that the gains from the mining boom are being spread across the economy.
Other evidence substantiates this research. Although there has been strong employment growth in mining and construction, services sectors (particularly health care and social assistance; professional, scientific and technical services; and education and training) have together accounted for far more of the economy’s employment growth since the beginning of the mining boom than have mining and construction.
Productivity Commission Chairman Gary Banks has sought to counter the biases that tend to be embedded in Dutch Disease arguments as well as the policy conclusions that are drawn. For example, he has observed that:
The secular decline in manufacturing’s share of GDP is mainly due to the expansion of services; not mining. Indeed, the relative decline is in part a statistical artefact, with activities previously categorised as manufacturing now being contracted externally and classed as services.
In terms of policy, Banks concludes that:
Attempts to counter structural pressures by either hobbling the mining sector or (further) assisting manufacturing, could only detract from Australia’s longer term productivity performance and living standards. Indeed, there is a stronger case than ever right now for reducing any government assistance to manufacturing (or other) activities that is not justified by genuine market failures – to free up skills needed in the expanding sectors.
Elsewhere, he has noted:
... implicit in the doomsday scenarios for certain trade-exposed industries (including education and tourism) is the notion that structural adjustment is a one-way street. However if and when the mining boom comes to an end, there will be forces within our economy that will automatically favour other traded activities again. The best possible illustration of this comes from the Netherlands itself, where the decline of the gas reserves that prompted the ‘Dutch Disease’ literature has seen a strong resurgence in manufactured exports. In the meantime, the Dutch benefitted greatly from their ‘disease’! Again, the best way of potentially securing such a reallocation for Australia in the future is by adopting policies now that can further enhance the flexibility of our economy.
In short, claims often made reflexively about the scale of variation in economic performance across parts of the economy and the implications for Australia are based, at best, on a highly selective reading of the evidence.
The Opportunity and the Policy Challenge: From Price to Volume Growth
Australia cannot afford a complacent view of the mining sector as a vehicle for distributing benefits to other parts of the economy. Australia’s biggest policy challenge is to lock in the mining boom by moving from an era of price growth to one defined by volume growth. This calls for disciplined macroeconomic policy, sustained capacity building and further microeconomic reform to secure prosperity for future generations of Australians.
The dimensions of the opportunity are enormous, not just for the mining sector but for the wider economy. The new pattern of global economic growth dominated increasingly by developing Asia has brought with it a profound, and in all likelihood protracted, shift in Australia’s comparative advantage towards minerals and energy resources. This is being driven by the rapid industrialisation and urbanisation of Asia.

9
A recent study by Port Jackson Partners (PJP) for ANZ entitled Earth, Fire, Wind and Water: Economic Opportunities and the Australian Commodities Cycle has identified the enormous prize at stake, the far-reaching benefits than can accrue across the Australian economy and many of the policy challenges that must be met to capture the opportunity.
Chart 3: Drivers of global growth (% of world GDP growth by 5-year period, 2005 $PPP)
* Income levels are not as at 2007 in real 2005 PPP terms; high is >$30,000 per capita (e.g. UK, Canada, Australia); mid is $10,000-30,000 per capita (e.g. Chile); low is <$PPP 10,000 per capita (e.g. Madagascar, India, Brazil). ** China comprises 34% of the GDP growth over the period 2010-2030 inclusive. Source: World Bank; IMF; Global Insight; Penn World Tables; US Department of Agriculture Economic Research Service; PJP analysis. The report finds that the shift of economic growth from the developed to the developing world presents Australia with “one of the greatest opportunities in its economic history” based on growing demand for minerals, energy, food and fibre. With well over five billion people in developing countries still to reach middle class income levels, this is “not the stuff of a routine commodities ‘boom’, but rather a more fundamental global process already underway that will see billions more achieve middle class living – and it has decades to run”. At the same time, the report cautions that “Australia can’t continue to rely on commodity price rises to support growth – rapid volume growth is now critical” .
Among the key conclusions of the report are the following:
• If Australia expands capacity rapidly enough, commodity export revenues could reach $480 billion in real terms by 2030, even with significant price and margin reductions across key sectors (emphasis added).
• Direct and support sector employment could double with at least 750,000 jobs created, and likely many more. • To achieve this level of export growth, investment of around $1.8 trillion is required over the next 20 years. • The value of commodity exports has the potential to stabilise at a level equal to more than 19% of GDP over the next
five years, not including support services. • The domestic sales of specialist commodity service and suppliers could grow to around $200 billion by 2030 as the
cluster export-oriented service providers extends its reach beyond Australia’s natural resources endowment. • At the same time, the rapid growth in resources, energy and agricultural export demand combined with rising Asian
incomes to create a platform for growth in other service industries, such as education and tourism. • Australia faces ferocious competition globally and will need to consider active steps if it is to capture its share of this
opportunity. • High quality resources will not be enough; institutional and policy frameworks will determine the winners.

10
• Australia will need to proactively build the capacity to support growth by adding supply side capacity (skilled labour, growth financing, technology and land for commodity production), while minimising the crowding out of existing economic activity.
Based on the scale and spread of potential benefits from Asian growth and industrialisation, there are some similarities between the PJP report and the Commonwealth Treasury’s view as set out in the 2011-12 Budget Papers (Statement 4) of “an economy in transition”. But in contrast with the somewhat sterile and unconvincing picture painted in the Budget Papers, with its emphasis on “movement towards a service-based knowledge economy”, the PJP report offers a more compelling, empirically rich and resource-driven account of what this commodity cycle could actually mean for Australia.
The anvil of opportunity is undoubtedly the historically large pipeline of mining sector investment. Mining investment (including oil and gas) is has risen to exceed 4% of GDP and is expected to climb even higher to around 7% of GDP over the next few years. The boom in mining investment, together with a lift in general government investment, has been a key driver behind the lift in total investment in Australia. In 2009-10, total investment as a share of GDP rose to match the high levels seen in the 1960s and 1980s. New business investment is expected to grow further and attain 50-year highs as a share of GDP, underpinned by the large pipeline of resources projects (Treasury 2011).
The most recent data from the Bureau of Resources and Energy Economics (BREE) puts the pipeline of planned capital expenditure in minerals and energy projects at around $430 billion, with LNG projects as the largest share followed by investment in coal and iron ore projects. It is important, however, that Australia not underestimate either the scale of the challenge in making the most of the mining boom or the extent of competition our producers face in global markets. As the Minister for Resources and Energy argued recently:
We cannot underestimate the importance of sound government policy in attracting investment and facilitating economic growth. Investment capital is footloose, and Australia is competing globally to attract this capital and investment.
Coal is mined commercially in more than 50 countries, with Australia accounting for less than 9% of global black coal production. Australia faces stiff competition for market share from a range of other low-cost producers in Indonesia (thermal), Columbia (thermal), South Africa (thermal), Mozambique (metallurgical and thermal), Mongolia (metallurgical and thermal) and India (thermal), as well as interior provinces of China (metallurgical and thermal).
High grade iron ore resources remaining in Western Australia are eclipsed by those in the Carajas region in Brazil and there are substantial high-grade resources in other countries. According to the PJP report, Brazil, Guinea in West Africa and also India combined “have more than enough resources to take all of the future growth” in demand.
While Australia has a geographic advantage over Brazil and Guinea, these two producers have significant quality advantages. Brazil, in particular is alleviating its geographic disadvantages with massive new low-cost ships and related port facilities. Indian iron ore producers have the enormous advantage of being adjacent to a large, growing source of demand, with reasonable quality ore.
The primary challenge in locking in the mining boom and converting opportunity into lasting prosperity is one of moving from an era driven by price growth to one defined by volume growth. Most recently, the Reserve Bank’s November 2011 Statement on Monetary Policy observed that while export volumes “should increase significantly as a large pipeline of mining investment comes online, this is expected to be partly offset by an easing in commodity prices as global mining capacity expands”.
Nonetheless, based on forecast growth in emerging economies, especially China and India, the terms of trade are expected to remain elevated over the next decade and stay well above historic long run levels. Even if the terms of trade were to fall by 20% from the average level of 2010, the series would still be more than 30% above the average of the last 50 years. It is now clear that the lift in mining investment in Australia is large relative to previous mining booms. Chart 4 shows real mining investment expenditure and mining export volumes across two mining booms – the current boom (where Year 1 is set equal to 2001-02) and the boom of the late 1970s (where Year 1 is set equal to 1977-78). The chart shows that the lift in mining investment during the current boom has been larger and more sustained compared to the boom of the late 1970s. That said, export volumes have not undergone a corresponding rise, with the increase trailing that seen in the decade following 1977-78.

11
Chart 4: Real mining investment and export volumes, comparison of two booms
Source: Australian Bureau of Statistics, Deloitte Access Economics, Australian Treasury The relatively modest lift in mining export volumes since 2000 is also evident in the following chart. It shows the change in Australia’s market share of commodity supply, measured by Australian production as a share of global consumption. Across the majority of the minerals examined, Australian production has failed to keep pace with the lift in global demand over the past decade.
Chart 5: Change in Australia’s relative global market share, 2000 – 2010
Source: Australian Bureau of Statistics, Deloitte Access Economics
0
50
100
150
200
250
300
350
400
450
500
‐2 ‐1 0 1 2 3 4 5 6 7 8 9 10
Index: Year 0 = 100
Previous boom (dashed line): Year 1 = 1977‐78 Current boom (solid line): Year 1 = 2001‐02
Mining investment
Mining export volumes
-50% -30% -10% 10% 30% 50%
Iron ore
Nickel
Coal
Zinc
Copper
Aluminium
Lead
Relative change in 2000 market share by 2010

12
While there are some important points of achievement – most notably in iron ore – the overall result is disappointing given prevailing market conditions. Although the next decade is expected to see a substantial absolute lift in Australian mining output, forecasts by Deloitte Access Economics should counter any complacency about the country’s overall performance. Australian production of a number of minerals will need to increase well beyond 2010 levels over the next decade. That task is significant. For example, it suggests the need to lift annual coal and iron ore volumes by 343 million tonnes and 300 million tonnes respectively over and above their 2010 levels. That is more than double the lift in coal output achieved over the past decade, and more than 20% larger than the matching increase in iron ore production.
The implications drawn by Deloitte Access Economics from this work are compelling:
Australia has a significant comparative advantage in minerals, but taking full advantage of that – and therefore maximising national income – is difficult. It means being prepared for the infrastructure, workforce, skill and regulatory implications of a continued surge in production. To date, it has been clear that Australia’s preparedness has left a lot to be desired.
Looking ahead, Australia’s public policymakers will need to act to allow the minerals sector to take full advantage of the conditions on offer. That means implementing policies designed to maximise investment, maximise job growth and maximise national income.
Indeed, Australia’s future prosperity requires policies to start adjusting now to help ensure that the supply chains and regulatory frameworks will be in place for Australia to pursue its comparative advantage in minerals production. Further delay may mean missing a remarkable opportunity.
The implication for this submission is clear: If the central focus of policy-makers is simply “spreading the benefits” of the boom through higher taxation on the mining sector, Australia will have lost an historic opportunity to take maximum advantage of our comparative advantage in mineral commodities. A much more comprehensive policy response focused on national capacity building and maintaining economic flexibility is needed to lock in the benefits of the boom.

13
CHAPTER 2: WHAT MINERS PAY: THE TAX-TAKE FROM THE MINERALS INDUSTRY
The minerals industry is a large and growing contributor to Federal and State Government revenues in Australia under existing taxation and royalty arrangements. Minerals resource companies are Australia’s largest taxpayers and, based on estimates by Deloitte Access Economics, the minerals industry is expected to pay a record $23.4 billion in combined company tax and royalties in 2010-11. Over the last decade, direct revenues from Federal company tax and State and Territory royalties generated by the minerals industry have exceeded $110 billion.
Despite claims to the contrary, the revenue contribution from minerals resource companies to Australian Governments (Federal and State) has risen in line with higher commodity prices. Company tax and royalty payments combined have risen four-fold as a share of GDP over the last decade. Minerals sector company tax is expected to reach $14.6 billion in 2010-11, exceeding the previous (2008-09) peak of $13.2 billion and 42% above the average of payments for the previous three years.
Chart 6: Minerals sector revenues and commodity prices
Source: Deloitte Access Economics – e=estimates.
Similarly, royalty payments to State and Territory Governments have risen at an average annual rate of 25% since 2004-05, due overwhelmingly to growth in coal and iron ore royalties. Based on Deloitte Access Economics estimates for 2010-11, royalty payments are expected to reach a new record of $8.8 billion in 2010-11. On these estimates, coal royalty payments will have risen at an average annual rate of 21.8% since 2005-06, while iron ore royalties will have climbed even more rapidly at an average annual rate of 36.9% (Chart 7).
The industry’s indirect tax contribution is also significant. Higher average wages in the industry have resulted in higher average tax rates, higher average tax payments per person and higher tax collections by the Commonwealth. Returns to the Australian community also come via payroll tax, fringe benefits tax, GST and fuel taxes. New taxes – like the MRRT and the Carbon Tax (including reduced fuel tax credits) will further increase the already substantial tax burden on mining relative to other industries.
The mining industry is already among the highest taxed industries in Australia based on official statistics (which include oil and gas). The net corporate tax rate on mining (after refunds and credits) is consistently above the average of total industries. The net corporate tax rate on mining income averaged 28.1% over the decade to 2008-09 (the latest official figures) – 25% higher than the total industries rate of 22.5%. The industry’s share of net company tax paid in Australia rose to 23.8% in 2008-09, roughly three times the share of mining in national output.
0
20
40
60
80
100
120
0
5000
10000
15000
20000
25000
Royalties (LHS) Company tax (LHS) Commodity prices (RHS)$m Index

14
Chart 7: Royalties by commodity
Source: Deloitte Access Economics – e=estimate.
Chart 8: Mining – company tax ratios
Source: Australian Taxation Office. The scale of the mining industry’s contribution to taxation revenues in Australia has been the subject of intense debate in recent times.
Prior to 2010, the return to revenues (Commonwealth in particular) from the mining sector was widely viewed as significant. In 2009, the former Prime Minister Kevin Rudd cited official estimates that the mining sector’s expansion had delivered a $334 billion boost to Commonwealth revenues in the period since 2004-05. In a similar vein, the former Finance Minister Lindsay Tanner observed that: “The truth is that it would be very difficult over the past few years for any government (at the Commonwealth level) to have a deficit because the mining boom has been pumping up revenue spectacularly”. Treasury
0
1000
2000
3000
4000
5000
6000
7000
8000
9000
10000
2005‐06 2006‐07 2007‐08 2008‐09 2009‐10 2010‐11(e)
Royalties by commodity
Other metals
Iron ore
Coal
$m
8.19.9
11.713.9
23.8
0.0
5.0
10.0
15.0
20.0
25.0
30.0
2004 ‐ 05 2005 ‐ 06 2006 ‐07 2007 ‐08 2008 ‐ 09
Mining ‐ net tax rate Total ‐ net tax rate Mining ‐ net tax share
%

15
analysis of the period from 2004-05 to 2008-09 concluded that around a third of the additional national income attributable to the resources boom went to Commonwealth revenues.
Subsequently, in the wake of the Henry Tax Review, a different picture was painted by the Government. Based on Treasury estimates of “resource profits”, the Government claimed that “the amount the Australian community charges mining companies for our non-renewable resources has fallen from one dollar in three of profit for the first half of the decade, down to one dollar in seven today”.
The minerals industry has continued to contest this claim on a number of levels.
Firstly, the reference point for the claims is based on a period which, by its nature, saw royalties reach very high and damaging levels as a share of industry profit. Specifically, the starting point for the Treasury figuring (1999-00 to 2003-04) represents historically low mineral commodity prices. This has been highlighted in recent Reserve Bank research which noted that:
The pick-up in commodity prices over recent years followed a period from the late 1980s to the early 2000s when real prices were unusually low by historical standards. Compared to the average price level in the United States, commodity prices fell noticeably from their peak in 1981, to be well below historical averages in the late 1990s; ... ... real base metals and coal prices were at their lowest levels in at least a century.
The degree to which the “one in three to one in seven” claim was misleading was pointed out at the time by The Australian’s Economics Correspondent, David Uren. He noted that “the change in the past decade depends on the starting point ... resource prices were at record lows so, of course, the share of mining income paid as royalties was very high”.
Secondly, the Government’s estimates excluded company tax, which clearly represents the largest share of direct revenues that minerals resource companies pay. Where royalties paid are estimated to have been $39.5 billion over the decade to 2010-11, company tax payments are estimated at $71.2 billion. By contrast, Reserve Bank research has included both royalties and company income taxes paid in its calculations of the returns to the community from the mining industry. It was noted that as a share of GDP royalties and company income taxes paid by the mining industry have increased from around 0.5% of GDP at the start of the decade to around 2% in 2008-09 – “their highest share of GDP since at least the late 1960s”. The role of company tax is especially important in the context of discussions over resource rent taxation. As was noted by the former senior Treasury official David Parker at the MCA’s 2009 Tax Conference, “the application of company tax to the resources sector has acted as a de facto resource rent tax”.
Thirdly, the Government’s claims depended on Treasury’s estimates of a measure it termed “resource rents” (a proxy for profits) – the denominator in the calculation on which the “one in three to one in seven” claims are based. Particularly notable was Treasury’s estimate of “resource rents” in 2008-09 which jumped suddenly to almost double the tax base used for company profits in 2008-09.
While some commentators accepted this estimate (and the resultant claims) unquestioningly, a number of others drew attention to what appeared to be anomalies. Economics Editor of The Australian, Michael Stutchbury, observed in June 2010 that while the $91.2 billion was “painfully extracted” from Treasury, “it provided scant information on how this could exceed other measures of total mining company profits: $63.6bn, according to the Australian Bureau of Statistics’ estimate of mining pre-tax operating profit, or $74.1bn in EBITDA (earnings before interest tax, depreciation and amortisation)”. Stutchbury cited the analysis of Professor Sinclair Davidson of RMIT University who found that “the Resource Profit/Rent figures are inflated relative to the Henry Review figures and, in the latter years especially, very inflated relative to the actual taxable income that is determined by the ATO”. Davidson concluded, inter alia, that Treasury had not “undertaken sufficient time and effort to explain what it is they are doing”.
In order to improve the quality and timeliness of data on which resource taxation debates are based, in late 2010 the MCA commissioned Deloitte Access Economics to assist it in collecting its own data on taxes paid by mining companies. Focusing on larger mineral resource companies (information was collected from a sample of 21 companies), the survey collected consistent data for the 2007-08, 2008-09 and 2009-10 financial years. It is estimated that the survey sample covered around 75% of annual revenue from the sale of minerals and over 90% of the larger minerals companies.
Based on the tax survey, Deloitte Access Economics calculated “tax-take” ratios broadly comparable with those published by the Government in 2010 (see Attachment A). While the official measure used resource profits (or “rents”) as the denominator in its tax-take ratios, the analysis by Deloitte Access Economics instead used taxable income (or the corporate
16
tax base) before deducting royalties. This provides, as the report notes, “a more transparent and widely-accepted measure of corporate profits”.
Importantly, while these are different concepts, the differences between them have been relatively small over most of the last decade. According to figures released by Treasury for the resources sector as a whole (including oil and gas) over the eight years to 2006-07, annual resource rent estimates totalled $143 billion. Similarly ABS 8155.0 data indicates that annual taxable income before deducting royalties totalled $155 billion.
Deloitte Access Economics concludes that:
On this basis, the substitution here of pre-tax corporate profits (as defined by the ATO) for more problematic estimates of “resource rents” does not tend to overstate the tax-take ratios from a Treasury perspective. Indeed, on average over this period, use of taxable income before royalties as the basis for calculating the mining sector’s tax-take slightly understates the tax-take based on Treasury’s estimate of resource rents.
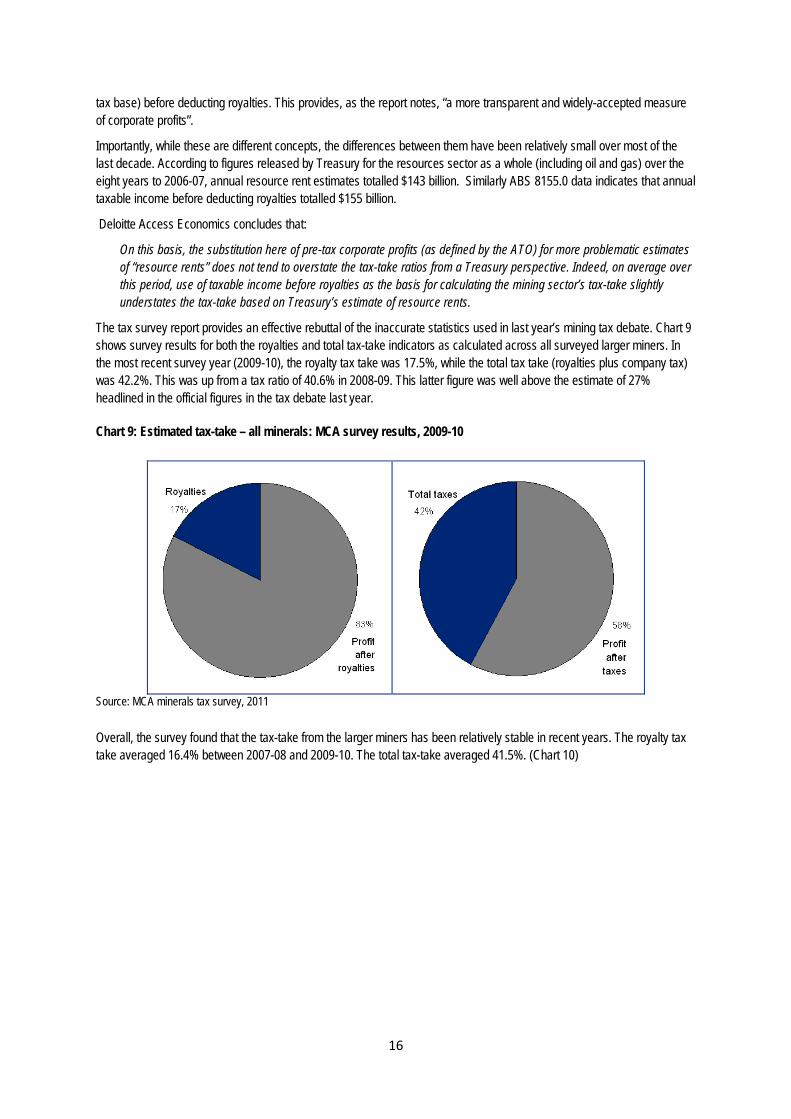
The tax survey report provides an effective rebuttal of the inaccurate statistics used in last year’s mining tax debate. Chart 9 shows survey results for both the royalties and total tax-take indicators as calculated across all surveyed larger miners. In the most recent survey year (2009-10), the royalty tax take was 17.5%, while the total tax take (royalties plus company tax) was 42.2%. This was up from a tax ratio of 40.6% in 2008-09. This latter figure was well above the estimate of 27% headlined in the official figures in the tax debate last year.
Chart 9: Estimated tax-take – all minerals: MCA survey results, 2009-10
Source: MCA minerals tax survey, 2011 Overall, the survey found that the tax-take from the larger miners has been relatively stable in recent years. The royalty tax take averaged 16.4% between 2007-08 and 2009-10. The total tax-take averaged 41.5%. (Chart 10)

17
Chart 10: Estimated tax-take – all minerals: MCA survey results
Source: MCA minerals tax survey, 2011
Accordingly, DAE concluded that the mining tax take:
has not fallen to the low levels cited by the Government in last year’s mining tax debate. This is particularly the case when a wider view is taken of the mining tax take to include company tax as well as royalties. Rather, the fluctuations over time seem mainly to be cyclical in nature rather than evidence of any persistent trend.
0
5
10
15
20
25
30
35
40
45
50
2007‐08 2008‐09 2009‐10
royalties royalties + company tax%

18
CHAPTER 3: MRRT DESIGN ISSUES
From the time the Henry Tax Review was announced, the MCA advocated a principles-based approach to reform of mineral royalty arrangements.
The MCA saw the Henry Tax Review as an opportunity. The Council sought to be involved with taxation reform, while recognising that any move away from existing State and Territory royalty regimes had to be based on detailed consultation (with industry and State Governments) and meet sound tax policy principles. The principles put forward by the MCA prior to and through the tax debate of 2010 were as follows:
• Internationally competitive: the overall tax burden on the industry should be competitive with tax burdens in other countries
• Prospective: tax changes should not undermine the basis upon which past investments have been made (i.e. no retrospective application)
• Differentiated: reforms should recognise that capital investment and financial return characteristics differ across resources commodities such that different minerals can sustain different tax burdens;
• Resource-based: a resource-based tax should be limited to the value of the resource (not reach into the value added from infrastructure and other activities such as processing and smelting); and
• Equitable and efficient: Reform of taxation and royalty arrangements should promote economic activity and improve the efficiency, simplicity and fairness of the tax system without compromising competitive neutrality.
Through the 2010 tax debate – and perhaps in its aftermath – the extent of the industry’s preparedness to engage in meaningful consultation for reform became obscured. Yet it is a matter of public record.
The MRRT: A Marked Improvement on the Resource Super Profits Tax
It is an understatement to say the minerals industry was dismayed with the approach adopted by the Australian Government in announcing, without consultation, the Resource Super Profits Tax on 2 May 2010. It was, as Paul Kelly of The Australian has observed, an “ambush”. Subsequently, senior Government Ministers recognised the profound folly of the Government in not pursuing a reform strategy founded on consultation with industry.
Notwithstanding what some saw as the “elegant” theory, the RSPT dramatically increased perceptions of sovereign risk in Australia and would have severely compromised the competitiveness of Australia’s minerals industry. The Government has itself recognised the design flaws in the RSPT.
Announcing the MRRT, the Prime Minister acknowledged that the RSPT had been a source of “uncertainty and division” and that there was a need for “improved resource tax reforms” to “maintain Australia’s standing as a competitive and attractive destination for investment and strengthen our economy in the future”. The Treasurer has similarly recognised that the flawed design of the RSPT would have discouraged investment. The most important thing, in the words of the Treasurer, “was to get the design of the tax right so it encouraged investment. Yes the design is different and that’s a good thing, it’s a better tax for that.”
The foundation agreement for the MRRT was reached based on the design principles outlined above for the development of an internationally competitive mineral resource tax regime that also provides the Australian community with an appropriate return from accessing Australia’s finite mineral resources. On a number of fronts, the MRRT is a marked improvement on the RSPT and much closer to sound tax reform principles.
Firstly, the MRRT establishes a more internationally competitive tax rate. As designed, under the MRRT profitable coal and iron ore projects should face an effective tax rate of not more than 45%. This is achieved through the interaction of the 30% headline MRRT rate, the 25% extraction allowance, a company tax rate of 29% (effective from 2013-14) and a credit for all current and future State and Territory royalties paid.
By contrast, effective tax rates on Australian projects under the RSPT – ranging from 52% on coal to 57% on iron ore – were simply too high. After the RSPT was announced, Treasury admitted that the headline tax rate of 40% was “arbitrary” and that it had not been benchmarked against Australia’s global competitors.

19
KPMG modelling showed the crippling impact of the RSPT on future investment. It slashed the value of “greenfield” coal and iron ore projects by 57% and 46%, respectively. The impact on copper, nickel and gold projects was such as to make some projects economically unviable (i.e. negative NPV).
Estimates were that the RSPT would have added the equivalent of 7.5% to the cost of mining, pushing Australian projects up the global cost curve and sending investment overseas, with impacts 50 to 100 years into the future. As Chris Richardson of Deloitte Access Economics has observed (see Attachment B), “the RSPT risked sending mining investment overseas – a risk magnified by its 40% (headline) rate”.
The point here is simple. Although minerals aren’t mobile, new investment in them is. As all impacts are felt at the margin for greenfield projects, the cost impact of resource rent taxes at ‘high’ rates would be to send some greenfield developments towards Canada, Indonesia, Brazil and others. ...
By reducing the headline rate and including the extraction allowance, the MRRT proposal got the important part right – a lower rate. That is because, as Deloitte Access Economics has consistently stressed, the effects of any design flaws in a resource rent tax are turbocharged if rates are too high. ...
A higher rate for the MRRT could therefore pose similar risks to those raised by the original RSPT proposal, including (1) capturing part of the reward for miners’ efforts and expertise, and hence (2) pushing Australian mining investment back in the global ‘queue’.
Secondly, the MRRT (through the availability of a market value starting base allowance) lessened dramatically the retrospective element of the RSPT. It was the spectre of the government claiming a 40% stake in successful mines without having borne any investment risk which created massive “sovereign risk” concerns – about government “moving the goalposts” on past investments – and resulted in major projects around Australia being put on hold in mid 2010.
The unprecedented nature of the Government’s proposal – along with the lack of genuine industry consultation that preceded and immediately followed the announcement in May 2010 – showed the Government’s willingness to make substantial and unheralded changes to the tax arrangements for existing operations. Specifically, it was the punitive transition arrangements under the proposed RSPT (a starting base allowance based only on the accounting book value of assets) which caused particular damage to Australia’s investment reputation.
On new projects, the RSPT sought to share the risks with the miner – getting more tax from a successful project, but handing back its share of losses on unsuccessful projects. But for existing projects, which by definition are the successful ones, the RSPT would have simply gathered them into the tax base with the Government creaming off a 40% stake while avoiding its share of past losses. With the only deduction allowed to companies based on written down book value of project interests, both the scale and timing of taxes to be paid by the industry marked the RSPT out as a short-term “tax grab” rather than genuine long-term tax reform.
The transition arrangements of the RSPT were clearly unfair, as Deloitte Access Economics has noted.
Governments were not a ‘silent partner’ risking taxpayer funds in establishing existing mines, but the RSPT implied that they still wanted large returns from them.
That is, the RSPT didn’t share the downside risk, but wanted its share of upside gains. The RSPT automatically cherry picked the winners of history without picking up the costs of the failures.
By virtue of both the very high tax rate and the dragging of existing projects into the tax base without fair recognition, the RSPT created a massive wealth transfer from existing shareholders to government. Notwithstanding denials from senior Treasury officials that there should be any perceived increase in sovereign risk, the point was obvious to many economists, including specialists in resource rent taxation whose work had been cited to justify particular features of the RSPT. Hence, Professor George Fane commented that:
Applied to existing successful projects with no compensation for past investment, it would be equivalent (economically, if not legally) to the nationalisation, without compensation, of 40 per cent equity in the relevant projects. Unless the government proposes to search out all those who have invested in failed projects and refund them 40c per dollar of losses, plus accumulated interest since 1901, or whenever, then a rent tax applied to existing successful projects, with past investments carried forward at the government bond rate, is equivalent to the nationalisation with less than full compensation of part of the equity in the relevant projects (emphasis added).

20
... in the context of a rent tax applied to existing as well as new projects, the ‘cast-iron guarantees’ that the tax rate will never be raised and that tax credits for future projects will be honoured are a joke: it is like being offered a guarantee from someone who has stolen your wallet that they will never steal from you again.
The MRRT is characterised by a number of other improvements over the RSPT. They include:
Appropriate differentiation between mineral commodities on grounds of international competitiveness
Capital investment and financial return characteristics differ across resource commodities, starkly between oil and gas and mineral commodities, but also significantly between mineral commodities. Critical to the design of the MRRT is the principle that any new taxation arrangements must preserve the international competitiveness of Australian mining operations (current and future) across a broad base of commodities in a highly competitive global resource environment. Modelling work by KPMG in the context of the RSPT debate demonstrated the relative scale of the tax’s impact across different mineral commodities (in terms of Net Present Values on “greenfield” investments) to the point where projects in a number of sub-sectors outside of coal and iron ore became no longer viable. It is important to record in this context, as noted by recent Reserve Bank research, that the “mining boom” has not been experienced equally across mineral commodities.
Appropriate targeting of the tax to the value of the resource
The MRRT has been designed to apply only to the value of minerals at the valuation point and not to infrastructure, downstream processing, manufacturing or transport. Ensuring commercial returns for downstream operations based on arm’s length principles has been a fundamental principle advanced by industry in discussions on minerals resource tax reform.
All post 1 July 2012 expenditure (whether capital or operating) will be immediately deductible
The provision of immediate deductibility of capital expenditure ensures that, compared with the RSPT, the MRRT encourages investment into coal and iron ore projects. In effect, taxpayers are able to defer payment of MRRT where they invest or re-invest into projects. This is a more appropriate design feature for a resource rent tax and is consistent with PRRT.
A more appropriate return to capital invested through a higher MRRT uplift rate
Compared with the RSPT, the higher MRRT uplift rate (LTBR+7 percentage points) provides for a more commercially realistic application of the tax taking account of capital costs and risks. The RSPT’s definition of “super profit” – any return above LTBR – was nothing more than a flawed, mechanical proxy for “resource rents”. The lower headline rate, the 25% extraction allowance and the higher uplift rate all act to limit the pitfalls of a “super profits tax” acting as a flawed, simple proxy for resource rents. Under the MRRT, as modified by the PTG recommendations, where project expenditures, losses, royalty credits and book value starting base amounts are not able to be used immediately, they are to be carried forward and uplifted at LTBR+7. Note that starting base losses are uplifted only at CPI.
Taxpayers with low levels of profitability will not have an MRRT liability
Under the MRRT as designed, there will be no MRRT liability for taxpayers with low levels of resource profits (i.e. $50 million). Subsequently, the PTG recommended that a taxpayer’s MRRT liability should be phased-in from $50 million to $100 million to avoid taxpayers facing a very large change in their MRRT tax bill as they cross the $50 million threshold.
Addressing some MRRT fallacies
In the period since the MRRT was announced, a number of fallacies have emerged around both its design and in terms of comparisons with the original RSPT.
a) The RSPT’s phantom revenue
One set of issues surrounds revenue projections ascribed to the RSPT with the claim being that the MRRT has led to a massive revenue shortfall in comparison. This view rests on a number of fallacies – most particularly, that the RSPT was a “perfect tax” that did not distort investment or production. Implicit (and sometimes explicit) in this view is the notion that the tax rate didn’t matter – it could be 70% or 95% and Australian companies would continue investing in mine expansions and new projects.

21
The sort of mining investment in Australia now in prospect would not have occurred under the RSPT, as the Government itself has acknowledged. It is important to recall that, faced with the prospect of the RSPT, around $20 billion worth of projects over a decade were either put on hold or under review just in the period from May to July 2010.
Less investment would have meant lost national income and lost revenue. As the respected financial commentator Ivor Ries noted at the time, Treasury revenue forecasts “failed to take into account all the projects that are going to be put on ice as a result (of the RSPT)”. In terms of Australia’s investment reputation, one indicator of the strength of the reaction to the RSPT was a mid-2010 survey by the Canadian-based Fraser Institute which found the international response to the RSPT to be “extraordinarily negative”. As a result:
• The average score of Australian States declined from 62.9 out of 100 in the 2009-10 survey (conducted in late 2009) to 40.9 in the survey update.
• The average rank of the Australian States fell to 31st out of 51 jurisdictions in the update, from 18th in the 2009-10 survey.
Finally, advocates of the RSPT have conveniently overlooked the views of its principal architect, Dr Ken Henry, when questioned about Treasury’s (now dated) 10-year revenue projections. Dr Henry stated that:
There’s something quite unreasonable about producing 10-year revenue estimates for a tax measure. These numbers are of such poor quality that I myself was very reluctant to see them in the public domain (emphasis added).
b) The MRRT discriminates against small miners
The MRRT is based on the principle of competitive neutrality (i.e. neutral across included resources and different project configurations) with general tax principles applied in a consistent fashion. It has been aligned deliberately with familiar concepts and definitions of Australian tax law. No provision of the tax discriminates against smaller, emerging Australian miners; indeed, certain features of the MRRT (the low profit threshold and simplified obligations) are designed to lower the overall burden of the tax on smaller miners.
Under the MRRT, small miners with relatively low profits will pay little or no MRRT. The bulk of MRRT liabilities will fall on larger miners with more profitable projects. The Government has stated that the MRRT “applies equally to small and large miners, and large mining companies will pay about 90% cent of the tax”.
The MRRT effectively operates as a “top-up” tax, never resulting in lower collection of revenue than exists under the status quo of company tax and royalties, but setting a higher rate for more profitable miners. If small and emerging miners have projects that are not yet profitable they will not pay MRRT. Under the MRRT, the profit a project makes is the value of the resources at the valuation point, less the costs incurred in getting them to that point. Projects mining relatively low value minerals which require significant downstream processing or “beneficiation” (e.g. magnetite ore) are unlikely to have significant (or indeed any) MRRT liabilities.
Claims that small miners will pay a disproportionate share of the MRRT also run counter to what we know about “profits-based” mining taxes in Australia – notably, company tax. Larger miners (with annual income above $1.46 billion a year) make up 0.5% of all mining companies but on the basis of the most recent official statistics pay more than 82% of net company tax from mining in Australia.

22
Chart 11: Who pays profits-based tax on mining in Australia (2008-09)?
Source: Australian Taxation Office
Depending on its design, a profits-based tax like the MRRT (as against royalties) is conceptually the right answer for smaller and riskier mining projects in taking account of capacity to pay and lead times to profitability. Moreover, it is important to record that what most damaged the prospects of smaller, emerging miners under the RSPT proposal was the high tax rate – that is, a headline rate of 40% and an effective tax rate on profitable projects approaching 57%. Compared with the RSPT, the MRRT’s lower headline rate of 30%, plus the 25% extraction allowance, has improved markedly the prospects for future investment by smaller miners.
Also by way of contrast, alternative proposals floated in the context of the 2010 mining debate as a basis for a settlement secured no movement on the RSPT tax rate, calling merely for an “open discussion” but leaving the headline rate of 40% (and effective rates approaching 57%) unchanged. A new tax on top of existing taxes will always make new investment more difficult than it would otherwise be, but that prospect applies to all companies mining coal and iron ore in Australia. The MRRT is less harmful compared with the RSPT and compared with alternative proposals floated in 2010.
c) The MRRT is unfair because past investments are recognised at their market value
A subset of the general claim that the MRRT is unfair to small miners is the specific claim that large miners are unduly favoured by virtue of the provision of a “market value” starting base allowance. The starting base allowance provides a form of compensation to miners for the retrospective features of the MRRT, recognising that mining is highly capital-intensive with considerable, high-risk exploration outlays, large upfront capital commitments, long-life assets, sophisticated technologies and long lead times to profitability.
It is based on the key design principle of “prospectivity” – that new tax arrangements should not unduly penalise past investments. The PRRT was a prospective tax and the minerals resources industry has consistently advanced the principle that changes in taxation and royalties must not undermine the basis upon which long-run investment decisions are made. It was the lack of appropriate “grandfathering” that established the RSPT as a more punitive tax than the PRRT and that, together with the high effective tax rates, severely damaged Australia’s “sovereign risk” reputation.
As Chris Richardson of Deloitte Access Economics has noted:
... absent grandfathering, market valuation is a sensible second best: Short of allowing existing investments to remain subject to the former taxation regime (the approach adopted for the PRRT), allowing the option of market valuation of existing assets (rather than book values, as per the original RSPT approach) is a well-established principle for easing the transition to new tax arrangements. In particular, this change as between the RSPT and the MRRT reduces the ‘asymmetric risk’ seen in the original approach to the transition, whereby the Government would have taxed the winners without reimbursing the losers.
Moreover, there appears to be a basic contradiction in the stance of those seeking to elevate “sovereign risk” as a basis for criticising the MRRT, while simultaneously setting out to undermine the core design feature that addresses the issue.
0
10
20
30
40
50
60
70
80
90
Loss ‐ $500k $500k ‐ 5m $5m ‐ 100m $100m ‐ 1.46b > $1.46b
Income
% mining companies % net tax%

23
Similarly, alternative proposals that were floated in the context of the RSPT debate (for example, double book value for the starting base), would have left the minerals industry lumbered with a highly retrospective and unfair tax without regard to the risks undertaken by companies on existing investments or to the true value of capital already invested in projects. In short, such design ideas would not have been an appropriate proxy for the grandfathering of existing projects.
No tax is perfect, but the MRRT – by allowing a starting base allowance based on the market value of existing assets – at least limits the retrospective element in a way that has allowed a substantial recovery in Australia’s investment reputation and helped to support significant growth in Australia’s mining investment pipeline.
The MRRT and Its Implementation
Following the announcement by the Australian Government of the Heads of Agreement on the MRRT in July 2010, the MCA, together with affiliated industry bodies, engaged constructively in consultation on the proposed MRRT under the processes of the Argus-Ferguson Policy Transition Group. The Government subsequently released the PTG recommendations in the form of two reports on 21 December 2010. At the time, the MCA recognised publicly the integrity of the PTG process, while noting that in some areas the PTG departed from industry expectations and normal tax practice and that further clarification and consultation would be needed on a range of issues.
On 24 March 2011, the Australian Government announced its decision to accept all recommendations of the PTG. One of the recommendations was to establish a Resource Tax Implementation Group to maintain close consultation with the resources industry and, in particular, to support the legislative drafting stage of resource taxation reforms. The MCA welcomed the Government’s decision to accept the PTG recommendations as a “package”, notwithstanding the fact that there were a small number of recommendations that were inconsistent with the July 2010 agreement on the MRRT.
Subsequently, representatives of the MCA participated actively in the RTIG process. Through that process, the MCA affirmed its commitment to effective and efficient implementation of the MRRT in line with the intent of the PTG recommendations with a view to ensuring the recommendations of the PTG were translated into legislation in a manner that:
Provides certainty to taxpayers Minimises administrative complexities and unnecessary compliance burdens on industry and is consistent, as much as
possible, with existing commercial practices; and Limits the potential for future disputes over the interpretation and administration of the tax.
In general, the MCA considers that the set of bills presented to the Australian Parliament on 2 November 2011 represent a workable basis for implementation of the MRRT in line with the agreement made by the Australian Government with major mining companies in July 2010, as modified by the recommendations of the PTG. There are, however, some caveats to this statement which should be noted.
The first is that, as has been outlined elsewhere in this submission, the MRRT still pushes tax rates on coal and iron ore projects to the upper boundary of globally competitive tax rates. A key design principle is the provision of an effective tax rate for profitable iron ore projects of not more than 45%. Recognising this objective, and in line with the key design parameters for the MRRT announced by the Government on 2 July 2010, the PTG recommended that there be full crediting of all current and future State and Territory royalties “so as to provide certainty about the overall tax impost on the coal and iron ore mining industries”. This remains a critical design issue for the MCA.
The PTG stated further that the MRRT should not be used as a mechanism to enable States and Territories to increase royalties on MRRT taxable commodities. Accordingly, it recommended that “the Australian, State and Territory Governments put in place arrangements to ensure that State and Territory governments do not have an incentive to increase royalties on coal and iron ore”. The MCA also supports this recommendation – specifically, the need for further dialogue between Commonwealth and State and Territory governments aimed at limiting the overall tax burden on coal and iron ore mining industries and providing greater taxpayer certainty. This is especially important for smaller miners.
The second caveat to the MCA’s general position reflects the fact that both the proposed bills and the explanatory material for the MRRT are very complex and further consultation through the Resource Tax Implementation Group would have helped to improve the legislation and uncover any unintended consequences. While recognising the valuable contribution made by the RTIG process, the MCA was disappointed that more time was not available to allow the Group to consider the final drafts of the legislation. Indeed, many changes to the final drafts of the Bills and Explanatory Material were made without review and/or consultations with RTIG. These changes are still being reviewed by the MCA.

24
Thirdly, the MRRT bills introduce some new concepts and practices and it will be important that companies are afforded appropriate consideration by the Australian Taxation Office given the large transition costs from the imposition of the MRRT. Again, this is especially important in the case of smaller miners. In some areas, the proposed MRRT legislation remains open to a degree of interpretation that does not aid taxpayer certainty. The nature of administrative interpretations will be especially important in the following areas:
Allocation of costs; Disposal and acquisition of exploration and mining interests; Farm-ins; Dealings with Joint Venture Operators; and The particular circumstances of vertically-integrated transformational operations (e.g. brown coal electricity generators).
Finally, the experience of the Petroleum Resource Rent Tax has underlined that poor tax design and/or a lack of clarity in resource taxation law can result in considerable disputation and litigation. It will be important to ensure as far as possible that administration of the MRRT not replicate weaknesses that have characterised the PRRT. As the PTG noted correctly, the MRRT and the PRRT are different taxes – while “both are profit based, differences in key parameters and the industries to which they apply mean that a strict comparison of the two frameworks should be avoided”. In pointing to “a number of administrative irritations” experienced in relation to the PRRT, the PTG also identified the high importance of implementation of the MRRT in a way that minimises taxpayer uncertainty and compliance costs.