minh duong thesis - using novel data collection methods to
TRANSCRIPT

ABSTRACT
DUONG, MINH DAO. Using Novel Data Collection Methods to Evaluate Thermometer Use. (Under direction of Dr. Benjamin Chapman)
In the United States, an estimated 48 million cases of foodborne illness caused by known
agents occur annually leading to 55,961 hospitalizations, 1,351 deaths, and an economic burden
of $77.7 billion each year. Undercooked and/or poorly handled poultry ranks first for estimated
annual disease burden because of its association with Campylobacter species and Salmonella
enterica. Consumer guidance following foodborne illness outbreaks recommends: washing
hands, kitchen surfaces, and utensils with soap and water and disinfecting after washing; cooking
meat thoroughly to the recommended internal temperature as measured with a food thermometer;
avoiding cross-contamination; and storing food under proper conditions. Incidences of foodborne
illness in the home are difficult to estimate because cases are underreported, sporadic or
dependent upon estimates where data are not available. Much of the information about food
safety in the home comes from two sources: analyses of foodborne illness outbreaks and
consumer-based research studies. In recent years, research on food handling practices in the
home has become a more explored area of food science, but the number of studies is still small.
The purpose of this thesis was to collect thermometer use behaviors utilizing mixed-methods
data collection techniques such as citizen science and observations – two areas where minimal
work has been done in the realm of food safety.
A literature review of quantitative and qualitative methods used to collect food safety
handling practice data was produced. The review showed that most of the studies utilized survey
as a data collection method to determine consumer food safety handling in the home. A mixed-
methods approach was only used in a handful of studies. These studies collected data on all

recommended food handling practices, but focused primarily on cross-contamination and hand-
washing.
A citizen science study was conducted with high school students in Pennsylvania and
North Carolina over Thanksgiving break 2016 looking at thermometer use practices for whole
turkeys. Results showed that most respondents used a thermometer to determine doneness of the
turkey. The majority those using a thermometer preferred a dial thermometer over a digital one
when measuring the internal temperature of a turkey. Citizen science uses a mixed-methods
approach through a text and photograph response, and can help in overcoming potential biases
associated with self-reported behaviors through direct text.
The other study was a comprehensive meal preparation study utilizing survey and
observation techniques in model kitchens with 383 participants. Individuals completed a
questionnaire before and after the cooking process, and were observed using video cameras set
up at various locations throughout the kitchen. Study participants were randomly assigned to a
treatment or control group (182, 201) with the treatment group being exposed to the USDA-
produced intervention video on ““The Importance of Cooking to a Safe Internal Temperature and
How to Use a Food Thermometer”. Data on thermometer usage, temperature achieved using a
thermometer, placement of thermometer during measurement, and flipping of patties were
collected. Results demonstrated the effectiveness of the intervention video in influencing
thermometer use, but many that used the thermometer did so incorrectly.
This research can be used to make recommendations for interventions and messaging that
are tailored toward particular aspects of cooking such as correct thermometer placement, type of
thermometer used, and number of flips of the meat product. Future messages can also be tailored

to be more relatable to particular groups. These studies may also provide insight into what future
research studies may focus on.

© Copyright 2018 Minh Duong
All Rights Reserved

Using Novel Data Collection Methods to Evaluate Thermometer Use
by Minh Dao Duong
A thesis submitted to the Graduate Faculty of North Carolina State University
in partial fulfillment of the requirements for the degree of
Master of Science
Food Science
Raleigh, North Carolina
2018
APPROVED BY:
______________________________ _____________________________ Dr. Benjamin Chapman Dr. Lee-Ann Jaykus Committee Chair ______________________________ _____________________________ Dr. Eric Laber Dr. Anne McLaughlin

ii
DEDICATION
To my Mom and Dad for their love, support, sacrifice, and for always encouraging me to be.
And to my two brothers, Duy and Will, for their support, love, and camaraderie.
iii
BIOGRAPHY
Minh Duong was born in Saigon, Vietnam and immigrated to the United States when he
was two years old. He is the son of Mai Duong and Thanh Thang, and older brother to Duy
Duong and Will Duong. He calls Centreville, Virginia his home. Minh’s first interaction with the
world of food safety came when he was in the 4th grade. He had gotten Salmonellosis, although it
was never diagnosed, from chicken his parents had undercooked and left out. Minh called the
experience as “super fun” at the time because he was able to get out of school and help his
cousin with her wedding weekend. His memories of the picking up catering arrangements,
preparing decorations, and dancing on the dance floor at the wedding were what he remembered
– not the part of being on the toilet non-stop and being dehydrated.
Minh had no clue food safety or even food science was until he met his mentor, best
friend, and sister, Lily Yang. He started his Food Microbiology class with Dr. Williams at
Virginia Tech. He sat there in awe of the stories Dr. Williams told about the foodborne illnesses
they were learning in class. He could see the practicability and applications of the topics they
learned and wanted to learn more. One of his teaching assistants, Lily Yang, was looking for an
undergraduate research assistant, and Minh quickly jumped on this opportunity. Minh assisted
Lily with research on the recovery of Salmonella species on tomatoes. This research experience
was the first of many with Lily, and her principal investigator, Dr. Renee Boyer. Minh continued
to work for Dr. Boyer on other research projects, but the one that helped him discover his love
for food safety education and teaching was a project on consumer perceptions of mechanically
tenderized beef. He graduated from Virginia Tech in 2016 with a B.S. in Biological Sciences
with the Microbiology and Immunology Option, and a minor in Food Science and Technology.
iv
ACKNOWLEDGMENTS
I would like to extend my deepest appreciations to Dr. Benjamin Chapman. I am truly
blessed to have met such an awesome human being that cares so much about how someone is
doing. His mentorship has allowed for me to grow not only as a researcher, but also a person. I
also want to especially thank Dr. Lee-Ann Jaykus for her support, wisdom, and guidance these
past two years. Thank you to my two other committee members, Dr. Eric Laber and Dr. Anne
McLaughlin, as well for their expertise and help throughout my thesis. I would also like to thank
John Luchansky and Anna Porto-Fett for their support, collaboration, and mentorship.
I want to thank all of the members of the Chapman for their friendship, companionship,
and support. Thanks to Chris Rupert for keeping things chill at home and at work. For all the
cubicle chats and gossip, I would like to thank Mary Yavelak and Sarah Cope. Thank you both
for laughter and serious talks we’ve had while listening to “CASH money”. A special thanks to
Sarah Cope for reminding me that there’s more to life than just research – especially when
there’s food involved. Thank you to Katrina Levine for taking care of all the behind-the-scenes
lab things. Thank you to Natalie Seymour for her words of wisdom on graduate school and life.
With the kitchen study project being so big, I could not have done it without the help of
so many individuals. Thank you to Rebecca Goulter and Lisa Shelley for their kindness, her
ability to lead and manage, and funny reactions to consumers not following proper practices.
Thanks to Meg Kirchner who acted as my other half on this project – it was much easier
knowing I had someone with the same problems. Thank you to undergraduate/graduate research
assistants: Lindsey Doring, Savana Everhart, Amy Greene, and Caitlin Smits for their friendship
during the long observation sessions. Thank you to Lydia Goodson for her sarcastic playfulness

v
that always kept day-long observations light. Thank you to all of the temporary employees who
helped out on this kitchen study project.
Thank you to my friends who have stuck with me through the highs and lows of my
thesis. Thanks for listening to me vent/rant, playing games with me, going out with me, and
supporting me. A special thanks to Lily Yang for her constant encouragement, mentorship, and
friendship. Thanks to my girlfriend, Susan Chen, for believing in me and reminding me of the
things in life that aren’t research-related.
Finally, I would like to thank my family. Thanks to my mom and dad for their constant
support and love and teaching me the importance of hard work. Thank you to my brothers for
making everything light-hearted and fun. Thanks to my uncles, aunts, and cousins for making
every holiday gathering hectic. A special thanks to my cousin Linh Duong who has been one of
my biggest supporters from day one.
vi
TABLE OF CONTENTS
LIST OF TABLES........................................................................................................................ vii LIST OF FIGURES...................................................................................................................... vii INTRODUCTION...........................................................................................................................1 References............................................................................................................................4 Chapter 1: Literature Review.......................................................................................................7 References..........................................................................................................................18 Chapter 2: Developing a Citizen Science Method to Collect Whole Turkey Thermometer
Usage Behavior.........................................................................................................25 Abstract..............................................................................................................................25 Introduction........................................................................................................................26 Methods..............................................................................................................................30 Results................................................................................................................................33 Discussion..........................................................................................................................34 References..........................................................................................................................49
Chapter 3: Meal Preparation Experiment Related to Thermometer Use..............................55 Abstract..............................................................................................................................55 Introduction........................................................................................................................56 Methods..............................................................................................................................58 Results................................................................................................................................64 Discussion..........................................................................................................................69 References..........................................................................................................................87 CONCLUSIONS...........................................................................................................................91 APPENDICES...............................................................................................................................94 Appendix A: Screening Questionnaire..............................................................................95 Appendix B: Observation Scripts and Recipes..................................................................99 Appendix C: Informed Consent Forms............................................................................102 Appendix D: List of Equipment Provided in Each Test Kitchen.....................................105 Appendix E: Power Analysis...........................................................................................109

vii
LIST OF TABLES
Table 3.1 Characteristics of Participants................................................................................74
Table 3.2 Prevalence of thermometer use..............................................................................77
Table 3.3 Number of Patties for Which Temperature Was Checked Among Participants Who Use a Food Thermometer..............................................................................78 Table 3.4 Number of Flips per Patty (two patties per participant)........................................79 Table 3.5 Time-Temperature Combinations for Turkey Patties Deemed Safe......................80 Table 3.6 Distribution of Maximum Internal Temperatures for Burgers Cooked by
Participants Using a Food Thermometer...............................................................81
Table 3.7 Methods Used to Determine Doneness of Burgers by Participants Who Did Not Use a Food Thermometer.......................................................................................82
Table 3.8 Other Methods Used to Determine Doneness by Participants Who Used a Food
Thermometer..........................................................................................................83

viii
LIST OF FIGURES
Figure 2.1 Food safety curriculum template...........................................................................40
Figure 2.2 Thermometer usage data collection instrument.....................................................44
Figure 2.3 Sample of pictures provided by data collectors.....................................................45
Figure 2.4 Thermometer type usage by citizen scientists on whole turkey............................46
Figure 2.5 Thermometer recorded internal temperature of whole turkey by citizen scientists.................................................................................................................47
Figure 2.6 Thermometer placement in whole turkey by citizen scientists..............................48
Figure 3.1 Turkey Patty with Heat Maps Showing Thermometer Placement by Group........84
Figure 3.2 Study Procedures for Meal Preparation Experiment on Thermometer Use..........85
Figure 3.3 Thermometer Use Decision Tree...........................................................................86

1
INTRODUCTION
Approximately 600 million foodborne illnesses, 420,000 deaths, and the loss of 18
million disability-adjusted life years occurs annually worldwide (The World Health
Organization, 2015). In the United States, an estimated 48 million cases of foodborne illness
from known sources occur annually, leading to 55,961 hospitalizations, 1,351 deaths, and an
economic burden of $77.7 billion each year (Scharff, 2012, Scallan et al., 2011). Of the possible
pathogen-food combinations ranked by Batz et al. (2012), undercooked and/or poorly handled
poultry ranked first for estimated annual disease burden because of its association with
Campylobacter species and Salmonella enterica, which ranked first and forth respectively.
According to the United States Foodborne Disease Outbreak System data from 1998-2012, 25%
of outbreaks (279 of 1114) were associated with poultry (Chai et al., 2017). The Centers for
Disease Control and Prevention’s (CDC) consumer guidance following outbreaks consists of
advice on: washing hands, kitchen surfaces, and utensils with soap and water and disinfecting
after washing; cooking meat thoroughly to the recommended internal temperature as measured
with a food thermometer; avoiding cross-contamination; and storing food under proper
conditions (CDC, 2013a, CDC, 2013b). An estimated 3.5 million cases of foodborne illness are
caused specifically because of inadequate cooking of animal derived foods or cross-
contamination of these foods (Medeiros et al., 2001). Research shows that consumers (39-78%)
rely on subjective and visual indicators such as color to determine doneness instead of using a
thermometer (Bruhn et al., 2014, Phang and Bruhn, 2011, Kennedy et al.,2011, Maughan et al.,
2015).

2
Much of the information about food safety in the home comes from two sources: analyses
of foodborne illness outbreaks and consumer-based research studies. In recent years, the research
on food handling practices in the home has become a more explored area, but the numbers of
studies are still small (Griffith & Worsfold, 1994, Nesbitt et al., Redmond and Griffith, 2003).
Most of the studies on domestic food handling (n=88) collect data using surveys (questionnaires
and interviews), focus groups, and observations with 75% of them being surveys. The purpose of
this thesis was to collect data on thermometer use behaviors use utilizing mixed-methods data
collection techniques such as citizen science and observation – two areas where minimal work
has been done in the realm of food safety. Self-reported data can be unreliable due to over-
reporting associated with social-desirability bias, which is where consumers have the tendency to
answer based on what they perceive to be correct or acceptable (Crowne and Marlowe, 1964,
Redmond and Griffith, 2003).
This thesis begins with a citizen science study conducted with high school students in
Pennsylvania and North Carolina over Thanksgiving break 2016 looking at thermometer use
practices for whole turkeys (Chapter 2). Citizen science is a data collection method that is used
across a large geographic scale and over a long duration that attempts to conserve resources
(Bonney et al.,2014). Potential biases concerning self-reported behaviors can be overcome by
validation with a photograph (Daviest et al., 2012, Forys and Hevesh, 2017, Suzuki-Ohno et al.,
2017). This study included the usage of photographs in addition to self-reported data, and can be
a methodology worth exploring in the future.
An additional research project presented in this thesis is a comprehensive meal
preparation study done using survey and observation techniques in model kitchens with 383
participants. Individuals completed a questionnaire before and after the cooking process, and

3
were observed using video cameras set up at various locations throughout the kitchen. Study
participants were randomly assigned to a treatment or control group (182,201). The treatment
group watched a USDA-produced intervention video on “The Importance of Cooking to a Safe
Internal Temperature and How to Use a Food Thermometer”. Participants were observed while
cooking turkey burgers and preparing a chef’s salad to determine whether they used a
thermometer on the ground turkey patties, and comparisons between the intervention and control
group were made. Data on thermometer usage, placement of thermometer during measurement,
and flipping of patties provided guidance into developing of future messaging of thermometer
use. Messaging can address consumer perceptions associated with determining doneness.
Consumers using indicators such as touch or color can be provided information on why those
methods do not assure that the food is safe and cooked thoroughly.

4
REFERENCES
1. Batz, M. B., Hoffmann, S., & Morris, J. G. (2012). Ranking the disease burden of 14
pathogens in food sources in the United States using attribution data from outbreak
investigations and expert elicitation. Journal of Food Protection, 75(7), 1278–91.
https://doi.org/10.4315/0362-028X.JFP-11-418
2. Bruhn, C. (2014). Chicken Preparation in the Home: An Observational Study. Food
Protection Trends, 34(5), 318–330. Retrieved from
http://www.foodprotection.org/publications/food-protection-trends/article-archive/2014-
09chicken-preparation-in-the-home-an-observational-study
3. Centers for Disease Control and Prevention. 2013. Multistate outbreak of Campylobacter
jejuni infections associated with undercooked chicken livers – Northeastern United States,
2012. Available at: https://www.cdc.gov/mmwr/preview/mmwrhtml/mm6244a2.htm%0D.
Accessed 21 August, 2017.
4. Centers for Disease Control and Prevention. 2013. Multistate outbreak of Salmonella
Heidelberg infections linked to chicken (Final update). Available at:
https://www.cdc.gov/salmonella/heidelberg-02-13/index.html. Accessed 17 August, 2017.
5. Chai, S. J., D. Cole, A. Nisler, and B. E. Mahon. 2017. Poultry: the most common food in
outbreaks with known pathogens, United States, 1998–2012. Epidemiol. Infect. 145: 316–
325.
6. Crowne, D.P., Marlowe, D. (1964) The approval motive. New York: Wiley.
7. Davies, T. K., Stevens, G., Meekan, M. G., Struve, J., & Rowcliffe, J. M. (2012). Can citizen
science monitor whale-shark aggregations? Investigating bias in mark-recapture modelling
5
using identification photographs sourced from the public. Wildlife Research, 39(8), 696–704.
https://doi.org/10.1071/WR12092
8. Forys, E. A., & Hevesh, A. R. (2017). Investigating Black Skimmer Chick Diets Using
Citizen Science and Digital Photography. Southeastern Naturalist, 16(3), 317–325.
https://doi.org/10.1656/058.016.0301
9. Griffith, C. J., & Worsfold, D. (1994). Application of HACCP to food preparation practices
in domestic kitchens. Food Control, 5(3), 200–204. https://doi.org/10.1016/0956-
7135(94)90084-1
10. Kennedy, J., Gibney, S., Nolan, A., O’Brien, S., McMahon, M. A. S., McDowell, D., …
Wall, P. G. (2011). Identification of critical points during domestic food preparation: an
observational study. British Food Journal, 113(6–7), 766–783.
https://doi.org/10.1108/00070701111140106
11. Maughan, C., Chambers, E., Godwin, S., Chambers, D., Cates, S., Koppel, K. (2016). Food
Handling Behaviors Observed in Consumers When Cooking Poultry and Eggs. Journal of
Food Protection, 79(6), 970–977. https://doi.org/10.4315/0362-028X.JFP-15-311
12. Medeiros, L. C., Hillers, V. N., Kendall, P. A., & Mason, A. (2001). Food Safety Education:
What Should We Be Teaching To Consumers? Journal of Nutrition Education, 33(2), 108–
113. https://doi.org/10.1016/S1499-4046(06)60174-7
13. Nesbitt, A., Thomas, M. K., Marshall, B., Snedeker, K., Meleta, K., Watson, B., & Bienefeld,
M. (2014). Baseline for consumer food safety knowledge and behaviour in Canada. Food
Control, 38(1), 157–173. https://doi.org/10.1016/j.foodcont.2013.10.010

6
14. Phang, H.S., & Bruhn, C. M. (2011). Burger Preparation: What Consumers Say and Do in
the Home. Journal of Food Protection, 74(10), 1708–1716. https://doi.org/10.4315/0362-
028X.JFP-10-417
15. Redmond, E. C., & Griffith, C. J. (2003). Consumer food handling in the home: a review of
food safety studies. Journal of Food Protection, 66(1), 130–61. https://doi.org/10.4315/0362-
028X-66.1.130
16. Scallan, E., Hoekstra, R. M., Angulo, F. J., Tauxe, R. V., Widdowson, M. A., Roy, S. L., …
Griffin, P. M. (2011). Foodborne illness acquired in the United States-Major pathogens.
Emerging Infectious Diseases, 17(1), 7–15. https://doi.org/10.3201/eid1701.P11101
17. Scharff, R. L. (2012). Economic Burden from Health Losses Due to Foodborne Illness in the
United States. Journal of Food Protection, 75(1), 123–131. https://doi.org/10.4315/0362-
028X.JFP-11-058
18. Suzuki-Ohno, Y., Yokoyama, J., Nakashizuka, T., & Kawata, M. (2017). Utilization of
photographs taken by citizens for estimating bumblebee distributions. Scientific Reports,
7(1), 1–11. https://doi.org/10.1038/s41598-017-10581-x
19. World Health Organization. (2015). WHO | WHO estimates of the global burden of
foodborne diseases short. Technical Report, 1–255. https://doi.org/10.1016/j.fm.2014.07.009

7
CHAPTER 1
Literature Review
The World Health Organization estimates foodborne hazards result in 600 million
foodborne illnesses, 420,000 deaths, and the loss of 18 million disability-adjusted life years
annually (WHO, 2015). In the United States, approximately 31 major pathogens cause 9.4
million cases of foodborne illness, 55,961 hospitalizations, and 1,351 deaths, with an economic
cost of $77.7 billion annually (Scharff, 2012, Scallan et al., 2011). The WHO identifies five
factors that contribute to these illnesses: improper cooking procedures, temperature abuse during
storage, lack of hygiene and sanitation by food handlers, cross-contamination between raw and
fresh ready-to-eat foods, and usage of food and water from unsafe sources (WHO, 2006).
Incidences of foodborne illness in the home are difficult to estimate because cases are
underreported, sporadic or dependent upon estimates where data are not available (Jacob et
al.,2009, Lake et al., 2000, Redmond and Griffith, 2003). Surveillance systems are used to
identify sources of foodborne pathogens and provide insight into possible locations of food
preparation and illnesses, but these come with limitations (Centers for Disease Control and
Prevention (CDC), 2015). In 2011, two notable multi-state outbreaks where consumer poultry
handling was a factor occurred: one with human Salmonella enterica subspecies enterica serovar
Hadar linked to turkey burgers and another associated with Salmonella enterica subspecies
enterica serovar Heidelberg in ground poultry (CDC, 2011a, CDC, 2011b). The outbreaks led to
12 and 136 persons becoming ill respectively, with one death occurring from the Heidelberg
outbreak. Much of the information about food safety in the home comes from two sources:
analyses of foodborne illness outbreaks and consumer-based research studies (Griffith &

8
Worsfold, 1994). In recent years, research on food handling practices in the home has become a
more explored area of food science, but the number of studies is still small (Griffith and
Redmond, 2003 and Nesbitt, 2014).
Consumer Attitudes, Perceptions, and Knowledge of food safety
Many behavioral change models use attitudes, perception, motivation, and social norm as
precursors for intentions and behavior. There are theoretical models (e.g., theory of planned
behavior and the health belief model, as examples) developed by cognitive psychologists that
attempt to put each of these factors into relationship constructs (Azjen et al., 1991, Rosenstock et
al., 1988). Attitudes are the variables guiding or influencing behavior (Fishbein and Azjen,
1975). A study by Redmond and Griffith (2004) looked at consumer attitudes and perceptions in
domestic kitchens and found that consumers have more positive than negative attitudes for safe
food preparation, but attitudes expressed were not consistent with safe food-handling behaviors.
Fein et al., (1995) found that consumers misperceived the nature of foodborne illness in homes
and the most likely place where the food causing illness was prepared believing the preparation
factor most responsible for illness was use of leftovers and old food (27%) and only
acknowledged inadequate cooking as a potential factor 10% of the time.
A study by Kennedy and colleagues (2011) in Ireland, in which participants were filmed
preparing a specified recipe accompanied by microbiological testing compared differences in
knowledge and attitude to observed behaviors. The group found that participants attributed a
high level of importance to checking that beef burgers and poultry were sufficiently cooked, as
compared to other food safety practices, but failed to employ the methods they deemed
important. In addition, a large number of samples of the specified meats were undercooked when
analyzed by researchers (Kennedy et al., 2011).

9
Subjective indicators of cooking that are not science-based, including visual cues such as
the color of the meat, are unreliable in gauging doneness (Hague et al., 1994, Hunt et al.,1995,
Røssvoll et al. 2014). Coloration is impacted by factors such as pH, meat source, packaging, and
fat, and meat can be brown before being cooked thoroughly (King and Whyte, 2006). Somewhat
troubling was observational research shows that the majority of consumers (39%-78%) relied on
visual indicators such as color to determine doneness instead of a thermometer (Bruhn et al.,
2014, Phang and Bruhn, 2011, Kennedy et al.,2011, Maughan et al., 2015). Research methods
used to collect consumer food safety data consist of self-completion questionnaires,
interviews/surveys, focus groups, and observational studies. Self-reported data consisting of
questionnaires, interviews, and surveys account for the majority of these (Redmond and Griffith,
2003).
USDA, along with the Partnership for Food Safety Education, the FDA, and the CDC,
have developed campaign called “Be Food Safe” that aims to inform consumers about foodborne
illness and raise consumer understanding of the hazards associated with improper handling and
cooking of food. The campaign emphasizes four basic safe food handling behaviors: “clean”,
“separate”, “cook”, and “chill”. “Clean” includes washing hands correctly and thoroughly,
washing utensils and surfaced after each use, and washing fruits and veggies, but not meat,
poultry, or eggs. “Separate” concerns using separate cutting boards and plates for fresh produce
and raw products such as meat, poultry, seafood and eggs, and keeping raw products separate
from other items during grocery shopping and in the refrigerator. “Cook” behaviors involve
using a food thermometer to safely determine if the food is done, reheating food correctly in the
microwave to prevent cold spots, and bringing sauces, soups, and gravies to a rolling boil upon
heating. “Chill” involves refrigerating perishable foods within two hours, thawing and

10
marinating food correctly, and throwing out foods according to safe storage times provided by
“Be Food Safe”.
Cooking for safety knowledge, perception and messaging
Consumer knowledge of thermometer use and cooking thoroughly has been measured by
researchers with various methodologies including asking consumers about their attitudes and
perceptions, surveying consumer self-reported behaviors, and observing consumer behaviors
(Bruhn and Schutz, 1998, Redmond and Griffith, 2003, Godwin et al., 2005, Kennedy et
al.,2005, Nesbitt et al., 2014). In addition, ownership of thermometers by consumers is often
associated with consumer knowledge of thermometer use or adequate cooking by researchers
(Lando et al., 2012).
The inadequate cooking of animal foods or cross-contamination of these foods is
estimated to be responsible for 3.5 million cases of foodborne illness annually in the United
States (Medeiros et al., 2001). A literature review by Nesbitt and colleagues in Canada looked at
peer-reviewed, published literature, and non-peer-reviewed public opinion research reports, and
evaluated consumer food safety behaviors including “cook” based on the Partnership for
Consumer Food Safety Education’s FightBAC Program (Nesbitt et al., 2014). The study found
that the majority of Canadians (7% - 32%) did not use a food thermometer when cooking and
used visual cues, or time and taste to determine if the food was cooked enough (Nesbitt et al.,
2014). The Redmond and Griffith (2003) review of consumer food handling studies in the home
concluded that 80-93% of the United States and United Kingdom populations lacked knowledge
on correct heating temperatures.
Food handling practices do not contribute equally to food safety problems; rather, a few
practices such as personal hygiene, cooking food adequately, and avoiding cross-contamination
11
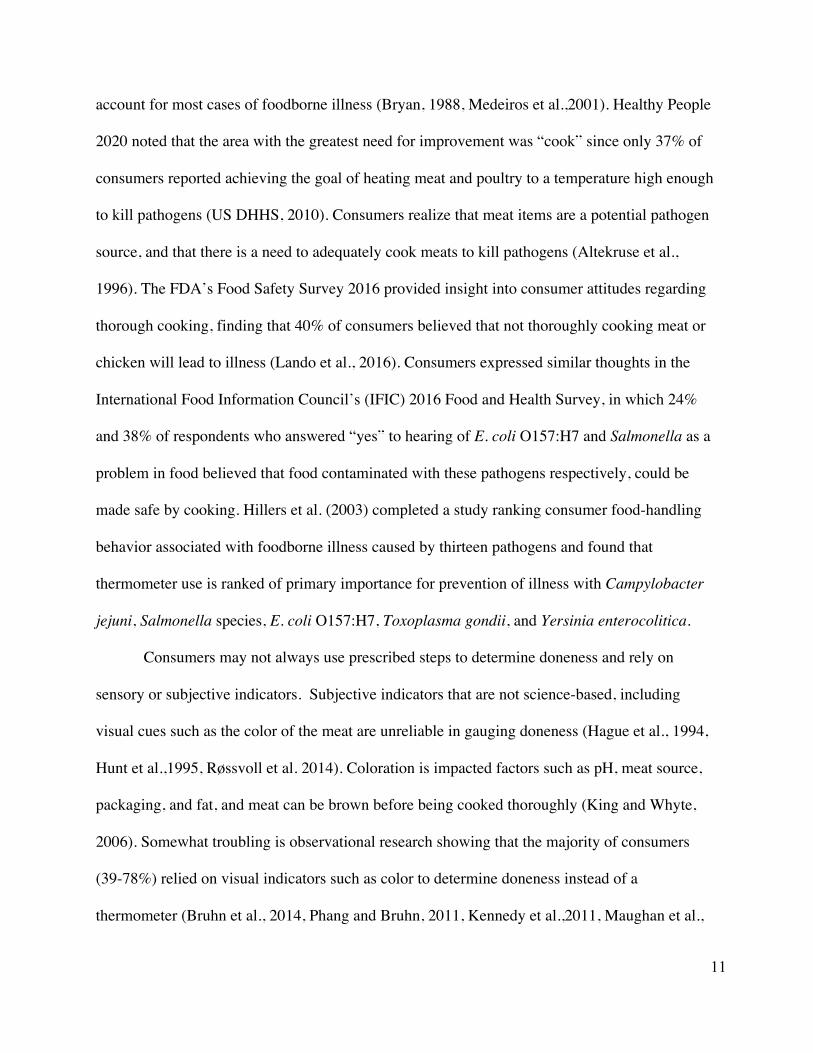
account for most cases of foodborne illness (Bryan, 1988, Medeiros et al.,2001). Healthy People
2020 noted that the area with the greatest need for improvement was “cook” since only 37% of
consumers reported achieving the goal of heating meat and poultry to a temperature high enough
to kill pathogens (US DHHS, 2010). Consumers realize that meat items are a potential pathogen
source, and that there is a need to adequately cook meats to kill pathogens (Altekruse et al.,
1996). The FDA’s Food Safety Survey 2016 provided insight into consumer attitudes regarding
thorough cooking, finding that 40% of consumers believed that not thoroughly cooking meat or
chicken will lead to illness (Lando et al., 2016). Consumers expressed similar thoughts in the
International Food Information Council’s (IFIC) 2016 Food and Health Survey, in which 24%
and 38% of respondents who answered “yes” to hearing of E. coli O157:H7 and Salmonella as a
problem in food believed that food contaminated with these pathogens respectively, could be
made safe by cooking. Hillers et al. (2003) completed a study ranking consumer food-handling
behavior associated with foodborne illness caused by thirteen pathogens and found that
thermometer use is ranked of primary importance for prevention of illness with Campylobacter
jejuni, Salmonella species, E. coli O157:H7, Toxoplasma gondii, and Yersinia enterocolitica.
Consumers may not always use prescribed steps to determine doneness and rely on
sensory or subjective indicators. Subjective indicators that are not science-based, including
visual cues such as the color of the meat are unreliable in gauging doneness (Hague et al., 1994,
Hunt et al.,1995, Røssvoll et al. 2014). Coloration is impacted factors such as pH, meat source,
packaging, and fat, and meat can be brown before being cooked thoroughly (King and Whyte,
2006). Somewhat troubling is observational research showing that the majority of consumers
(39-78%) relied on visual indicators such as color to determine doneness instead of a
thermometer (Bruhn et al., 2014, Phang and Bruhn, 2011, Kennedy et al.,2011, Maughan et al.,

12
2015). Research methods used to collect consumer food safety data consist of self-completion
questionnaires, interviews/surveys, focus groups, and observation studies. Self-reported data
consisting of questionnaires, interviews, and surveys account for the majority of these (Redmond
and Griffith, 2003).
Self-reported studies (Questionnaires, Interviews, and Focus Groups)
Studies done by Nesbitt et al. (2003) and Redmond and Griffith (2003) found that focus
groups were underused in consumer food safety studies, accounting for only 8%-21% of the
literature. Focus groups are used to help researchers understand the behaviors, customs, and
insights of consumers (Lewis-Beck et al., 2004). This methodology is a focused discussion led
by a moderator that engages participants on a topic (Lewis-Beck et al., 2004). Focus groups can
aid in discovering barriers that might impede certain behaviors, understanding perceptions and
attitudes of an idea or behavior, or discovering reasons behind behaviors, but should not be used
as a methodology or test of knowledge or skills (Lewis-Beck et al., 2004).
A study by Redmond and Griffith (2003) found that 75% of existing studies on consumer
food safety collect data using interview and questionnaire surveys. Nesbitt and colleagues (2014)
found similar results with the majority (54%) of consumer food safety studies being telephone
surveys; and 21% were being a combination of telephone surveys and focus groups or online
surveys. Questionnaire are self-administered, meaning that the respondent is completing the
survey. On the other hand, interviews are other-administered meaning the participants are being
asked the questions, usually in-person or through a telephone. Quantitative survey methods can
collect information on consumer knowledge, attitudes, and self-reported practices and provide a
more positive picture of consumer food safety in comparison to observational techniques
(Redmond and Griffith, 2003).

13
The 2016 FDA Food Safety Survey found 67% of respondents reported owning a food
thermometer, but 19% used one when cooking chicken parts and 10% used one for hamburgers
(Lando et al., 2016). The 2016 Food and Health Survey conducted by IFIC showed that
consumers use a food thermometer 30% of the time to check doneness of meat and poultry items,
but only cook to the required temperature for their meat 66% of the time. Kosa and colleagues
(2014) conducted a national survey on raw poultry handling practices and found that 62% of the
consumers that reported owning a food thermometer used it to check the doneness of larger cuts
of poultry (56.7%-73.2%) in comparison to smaller cuts (12%-26%). IFIC’s Food and Health
Survey (2016) surveyed individuals asking, what would encourage them to use a thermometer.
Fifty-one percent of respondents said they would use one if given a free thermometer (IFIC,
2016). A national telephone survey by Jay and researchers in Australia asked respondents to
comment on how they preferred their hamburgers and ground meat cooked on a scale from
“raw”, “rare”, “medium”, “well done”, or “burned”. A total of 23.5% of survey participants
preferred “raw”, “rare”, or “medium” for hamburgers, and 21.3% for ground meat (Jay et al.,
1999).
Questionnaires are advantageous because of their lower cost in comparison to other data
collection methods, and their ability to collect complete and truthful information on sensitive
topics (Lewis-Beck et al., 2004). A concern with conducting surveys is social-desirability bias
where participants tend to over-report behaviors they perceive to be acceptable or correct
(Crowne and Marlowe, 1964, Redmond and Griffith, 2003). This bias is more likely to occur
with questionnaires and telephone interviews in comparison to face-to-face interviews Two
approaches to minimizing social desirability bias are designing instruments and methods that
reduce its impact on assessment and assessing social desirability independent of other variables

14
(Lewis-Beck et al.,2004). The first method for minimizing bias was utilized by Kosa et al. (2004)
by asking questions about the last time a respondent prepared the product rather than asking
them to report how they would prepare the product.
Citizen science
Citizen science involves the use of volunteers to collect and/or analyze data as part of a
scientific inquiry to where the participants are gaining valuable insight into the process
(Silvertown,2009). The methodology has been used widely in ecology and environmental
science where over 600 Web of Science categories exist for these two fields (Kullenberg and
Kasperowski, 2016). Although not trained as scientists, citizen scientists gather data quickly and
efficiently that cannot otherwise be obtained, particularly if resources are limited (Bonney et
al.,2014). Citizen science provides a platform to collect data that can be expanded on a large
geographic scale and over a long duration, while conserving resources (Bonney et al.,2014). For
example, researchers have collected data on shark behavior, black skimmer chicks, and
bumblebees using photographs taken by citizen scientists (Daviest et al., 2012, Forys and
Hevesh, 2017, Suzuki-Ohno et al., 2017). Although limited research has been done using
pictures to verify self-reported data, studies in ecology show that utilizing of photographs may
correct mistakes associated with the identification of particular related species that may look
similar (Silvertown et al., 2009, Gardiner et al. 2012). One of the ways that citizen science
overcomes the potential biases associated with self-reporting of data is validation using pictures.
Mixed-methods studies
Observation is a methodology for understanding complex behavioral situations accurately
and is not dependent on second-hand reported accounts of behavior from the respondents who
may put their own interpretation on events (Bowling, 2000, Saunders and Thornhill, 2000).

15
Observational data are tested for reliability by assessing the intra- and inter-observer reliability
of the observation by obtaining the same results when measuring the same action/behavior on
different occasions for the former, and correlating the records from one observer to another for
the latter. Observer biases and the Hawthorne Effect, defined as the alteration of behavior by a
participant in a study due to an awareness of being watched, can limit the reliability of the
observation technique. The observer’s perception can influence which practices are recorded or
not recorded (Bowling, 2002). The observer may influence participant behavior by virtue of the
fact that participants are aware they are being observed. Potential biases associated with
reliability can be overcome by employing practices such as not fully revealing to participants
what practices are being observed or posing as staff members (Chapman et al., 2010, Anderson
et al., 2004, Clayton et al., 2004).
To overcome problems of interpretation and verification in self-reported data, direct
observation has been used to collect data on food safety behaviors of consumers (Worsfold,
1994). Several researchers have used direct observation to evaluate the food safety practices of
consumers and have compared their results with those obtained by self-report questionnaire
(Worsfold and Griffith, 1997, Jay et al., 1999, Anderson et al., 2004, Phang and Bruhn, 2011,
Bruhn, 2014). Phang and Bruhn (2011) found that 53% of study participants reported owning a
meat thermometer and 33% said they used a thermometer to determine doneness for ground beef
burgers, however, only 4% of consumers used a thermometer when observed. Another study
discovered that 48% of participants owned a thermometer, but only 5% used one when observed
whole chicken or chicken parts (Bruhn, 2014). Anderson and colleagues observed similar results;
where only 5% of participants used a food thermometer to determine doneness, with the majority
16
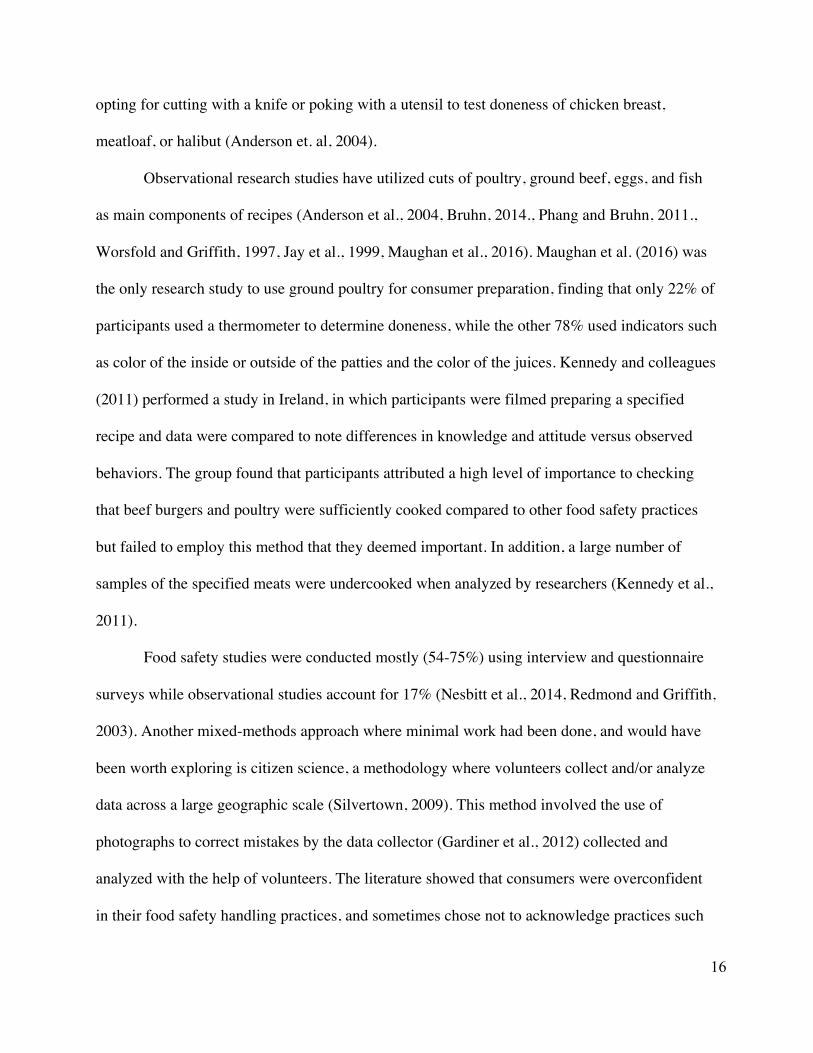
opting for cutting with a knife or poking with a utensil to test doneness of chicken breast,
meatloaf, or halibut (Anderson et. al, 2004).
Observational research studies have utilized cuts of poultry, ground beef, eggs, and fish
as main components of recipes (Anderson et al., 2004, Bruhn, 2014., Phang and Bruhn, 2011.,
Worsfold and Griffith, 1997, Jay et al., 1999, Maughan et al., 2016). Maughan et al. (2016) was
the only research study to use ground poultry for consumer preparation, finding that only 22% of
participants used a thermometer to determine doneness, while the other 78% used indicators such
as color of the inside or outside of the patties and the color of the juices. Kennedy and colleagues
(2011) performed a study in Ireland, in which participants were filmed preparing a specified
recipe and data were compared to note differences in knowledge and attitude versus observed
behaviors. The group found that participants attributed a high level of importance to checking
that beef burgers and poultry were sufficiently cooked compared to other food safety practices
but failed to employ this method that they deemed important. In addition, a large number of
samples of the specified meats were undercooked when analyzed by researchers (Kennedy et al.,
2011).
Food safety studies were conducted mostly (54-75%) using interview and questionnaire
surveys while observational studies account for 17% (Nesbitt et al., 2014, Redmond and Griffith,
2003). Another mixed-methods approach where minimal work had been done, and would have
been worth exploring is citizen science, a methodology where volunteers collect and/or analyze
data across a large geographic scale (Silvertown, 2009). This method involved the use of
photographs to correct mistakes by the data collector (Gardiner et al., 2012) collected and
analyzed with the help of volunteers. The literature showed that consumers were overconfident
in their food safety handling practices, and sometimes chose not to acknowledge practices such

17
as the adequate cooking of food while relying on subjective indicators to determine doneness
instead of a thermometer (Bruhn et al., 2014, Fein et al., 1995, Kennedy et al.,2011, Maughan et
al., 2015, Phang and Bruhn, 2011, Redmond and Griffith, 2003). Current observational studies
have utilized cuts of poultry, ground beef, eggs, and fish as main components (Anderson et al.,
2004, Bruhn, 2014., Phang and Bruhn, 2011., Worsfold and Griffith, 1997, Jay et al., 1999,
Maughan et al., 2016). Only one research study (Maughan et al., 2016) used ground poultry in its
study finding that 78% of participants preferred subjective indicators over use of a thermometer.
Areas of study in the future should look to incorporate the gaps discussed in this review of
utilizing observations as a methodology, incorporating the mixed-methods components from
citizen science, and conducting studies with commodities where minimal work had been done.

18
REFERENCES
1. Ajzen, I. (1991). The theory of planned behavior. Orgnizational Behavior and Human
Decision Processes, 50, 179–211. https://doi.org/10.1016/0749-5978(91)90020-T
2. Altekruse, S. F., Street, D. A., Fein, S. B., & Levy, A. S. (1995). Consumer Knowledge of
Foodborne Microbial Hazards and Food-Handling Practices. Journal of Food Protection,
59(3), 287–294. https://doi.org/10.4315/0362-028X-59.3.287
3. Anderson, J. B., Shuster, T. A., Hansen, K. E., Levy, A. S., & Volk, A. (2004). A Camera’s
view of consumer food-handling behaviors. Journal of the American Dietetic Association,
104(2), 186–191. https://doi.org/10.1016/j.jada.2003.11.010
4. Bonney, R., Shirk, J. L., Phillips, T. B., Wiggins, A., Ballard, H. L., Miller-Rushing, A. J., &
Parrish, J. K. (2014). Citizen science: Next steps for citizen science. Science, 343(6178),
1436–1437. https://doi.org/10.1126/science.1251554
5. Bowling, A. (2002). IN HEALTH Investigating health and health services. Health San
Francisco, 171–172.
6. Bruhn, C. (2014). Chicken Preparation in the Home: An Observational Study. Food
Protection Trends, 34(5), 318–330. Retrieved from
http://www.foodprotection.org/publications/food-protection-trends/article-archive/2014-
09chicken-preparation-in-the-home-an-observational-study/
7. Bryan, F. L. (1988). Risks of Practices, Procedures and Processes that Lead to Outbreaks of
Foodborne Diseases. Journal of Food Protection, 51(8), 663–673.
https://doi.org/10.4315/0362-028X-51.8.663
19
8. Centers for Disease Control and Prevention. (2011). Multistate Outbreak of Human
Salmonella Heidelberg Infections Linked to Ground Turkey (Final Update). Retrieved from
https://www.cdc.gov/salmonella/2011/ground-turkey-11-10-2011.html
9. Centers for Disease Control and Prevention. (2011). Multistate Outbreak of Human
Salmonella Hadar Infections Associated with Turkey Burgers (Final Update). Retrieved from
https://www.cdc.gov/salmonella/2011/turkey-burger-4-4-2011.html
10. Centers for Disease Control and Prevention. (2017). Surveillance for foodborne disease
outbreaks United States, 2015: Annual Report, 1–24.
11. Chapman, B. J., Maclaurin, T., & Powell, D. A. (2013). Video observation and data goding
methods to assess food handling practices at food service. Food Protection Trends, 33(3),
146–156.
12. Cody, M., & Hogue, M. A. (2003). Results of the Home Food Safety--it ’ s in Your Hands
2002 Survey : ... Journal of the American Dietetic Association;
13. Cressey, P., & Lake, R. (2011). Estimated incidence of foodborne illness in New Zealand :
Application of overseas models and multipliers. Retrieved from
https://scholar.google.co.nz/scholar?q=Estimated+incidence+of+foodborne+illness+in+New
+Zealand:+Application+of+overseas+models+and+multipliers&hl=en&as_sdt=0&as_vis=1
&oi=scholart&sa=X&ved=0ahUKEwiSubKm3fzJAhXEMKYKHXZcAyoQgQMIGTAA
14. Crowne, D.P., Marlowe, D. (1964) The approval motive. New York: Wiley.
15. Davies, T. K., Stevens, G., Meekan, M. G., Struve, J., & Rowcliffe, J. M. (2012). Can citizen
science monitor whale-shark aggregations? Investigating bias in mark-recapture modelling
using identification photographs sourced from the public. Wildlife Research, 39(8), 696–704.
https://doi.org/10.1071/WR12092

20
16. Fein, S. B., Lin, C. J., & Levyl, A. S. (1995). Foodborne Illness: Perceptions , Experience ,
and Preventive Behaviors in the United Foodborne Illness : Perceptions , Experience , and
Preventive Behaviors in the United States. Journal of Food Protection, 58(12), 1405–1411.
17. Fishbein, M., & Ajze, I. (1975). Belief, Attitude, Intention, Behavior: An Introduction to
Theory and Research.
18. Forys, E. A., & Hevesh, A. R. (2017). Investigating Black Skimmer Chick Diets Using
Citizen Science and Digital Photography. Southeastern Naturalist, 16(3), 317–325.
https://doi.org/10.1656/058.016.0301
19. Gardiner, M. M., Allee, L. L., Brown, P. M. J., Losey, J. E., Roy, H. E., & Smyth, R. R.
(2012). Lessons from lady beetles: Accuracy of monitoring data from US and UK citizen
science programs. Frontiers in Ecology and the Environment, 10(9), 471–476.
https://doi.org/10.1890/110185
20. Griffith, C. J., & Worsfold, D. (1994). Application of HACCP to food preparation practices
in domestic kitchens. Food Control, 5(3), 200–204. https://doi.org/10.1016/0956-
7135(94)90084-1
21. Hague, M. A., Warren, K. E., Hunt, M.C., Kropf, D. H., Kastner, C. L., Stroda, S. L.,
Johnson, D. E. (1994). Endpoint Temperature, Internal Cooked Color, and Expressible Juice
Color Relationships in Ground Beef Patties. Journal of Food Science, 59(3), 465–470.
https://doi.org/10.1111/j.1365-2621.1994.tb05539.x
22. Hillers, Virginia Nfile:///Users/minhduong/Dropbox/M.S. Thesis Work/Unsorted
Articles/Color and Heat Denaturation of Myoglobin Forms in Ground Beef (Hunt et al.,
1999).pdf, Medeiros, L., Kendall, P., Chen, G., & DiMascola, S. (2003). Consumer food-
21
handling behaviors associated with prevention of 13 foodborne illnesses. Journal of Food
Protection, 66(10), 1893–9. https://doi.org/10.4315/0362-028X-66.10.1893
23. Hunt, M. C., Sørhelm, O., & Slinde, E. (1999). Color and heat denaturation of myoglobin
forms in ground beef. Journal of Food Science, 64(5), 847–851.
https://doi.org/10.1111/j.1365-2621.1999.tb15925.x
24. International Food Information Council. (2016). 2016 Food and Health Survey. Retrieved
from http://www.foodinsight.org/sites/default/files/2016-Food-and-Health-Survey-
Report_FINAL1.pdf
25. Jacob, C. J., & Powell, D. A. (2009). Where Does Foodborne Illness Happen—in the Home,
at Foodservice, or Elsewhere—and Does It Matter? Foodborne Pathogens and Disease, 6(9),
1121–1123. https://doi.org/10.1089/fpd.2008.0256
26. Jay, L. S., Comar, D., & Govenlock, L. D. (1999). A national Australian food safety
telephone survey. Journal of Food Protection, 62(8), 921–928.
27. Kendall, P. a, Elsbernd, A., Sinclair, K., Schroeder, M., Chen, G., Bergmann, V., …
Medeiros, L. C. (2004). Observation versus self-report: Validation of a consumer food
behavior questionnaire. Journal of Food Protection, 67(11), 2578–86. Retrieved from
http://www.ncbi.nlm.nih.gov/pubmed/15553645
28. Kennedy, J., Gibney, S., Nolan, A., O’Brien, S., McMahon, M. A. S., McDowell, D., …
Wall, P. G. (2011). Identification of critical points during domestic food preparation: an
observational study. British Food Journal, 113(6–7), 766–783.
https://doi.org/10.1108/00070701111140106
29. Kennedy, J., Jackson, V., Blair, I. S., McDowell, D. a, Cowan, C., & Bolton, D. J. (2005).
Food safety knowledge of consumers and the microbiological and temperature status of their

22
refrigerators. Journal of Food Protection, 68(7), 1421–30. https://doi.org/10.4315/0362-
028X-68.7.1421
30. King, N. J., & Whyte, R. (2006). Does it look cooked? A review of factors that influence
cooked meat color. Journal of Food Science, 71(4). https://doi.org/10.1111/j.1750-
3841.2006.00029.x
31. KOSA, K. M., CATES, S. C., BRADLEY, S., CHAMBERS, E., & GODWIN, S. (2015).
Consumer-Reported Handling of Raw Poultry Products at Home: Results from a National
Survey. Journal of Food Protection, 78(1), 180–186. https://doi.org/10.4315/0362-
028X.JFP-14-231
32. Kullenberg, C., & Kasperowski, D. (2016). What is citizen science? - A scientometric meta-
analysis. PLoS ONE, 11(1), 1–16. https://doi.org/10.1371/journal.pone.0147152
33. Lando, A., Verrill, L., Liu, S., & Smith, E. (2016). 2016 FDA Food Safety Survey.
34. Lewis-Beck, M., Bryman, A., & Liao, T. (2006). The SAGE Encyclopedia of Social Science
Research Methods. Data Collection and Analysis.
https://doi.org/http://dx.doi.org/10.4135/9781412950589
35. Maughan, C., Chambers, E., Godwin, S., Chambers, D., Cates, S., Koppel, K. (2016). Food
Handling Behaviors Observed in Consumers When Cooking Poultry and Eggs. Journal of
Food Protection, 79(6), 970–977. https://doi.org/10.4315/0362-028X.JFP-15-311
36. McCurdy, S. M., Takeuchi, M. T., Edwards, Z. M., Edlefsen, M., Kang, D., Elaine Mayes,
V., & Hillers, V. N. (2006). Food safety education initiative to increase consumer use of food
thermometers in the United States. British Food Journal, 108(9), 775–794.
https://doi.org/10.1108/00070700610688403

23
37. Medeiros, L. C., Hillers, V. N., Kendall, P. A., & Mason, A. (2001). Food Safety Education:
What Should We Be Teaching To Consumers? Journal of Nutrition Education, 33(2), 108–
113. https://doi.org/10.1016/S1499-4046(06)60174-7
38. Nesbitt, A., Thomas, M. K., Marshall, B., Snedeker, K., Meleta, K., Watson, B., & Bienefeld,
M. (2014). Baseline for consumer food safety knowledge and behaviour in Canada. Food
Control, 38(1), 157–173. https://doi.org/10.1016/j.foodcont.2013.10.010
39. Phang, H.S., & Bruhn, C. M. (2011). Burger Preparation: What Consumers Say and Do in
the Home. Journal of Food Protection, 74(10), 1708–1716. https://doi.org/10.4315/0362-
028X.JFP-10-417
40. Redmond, E. C., & Griffith, C. J. (2003). Consumer food handling in the home: a review of
food safety studies. Journal of Food Protection, 66(1), 130–61. https://doi.org/10.4315/0362-
028X-66.1.130
41. Redmond, E. C., & Griffith, C. J. (2003). A comparison and evaluation of research methods
used in consumer food safety studies. International Journal of Consumer Studies, 27(1), 17–
33. https://doi.org/10.1046/j.1470-6431.2003.00283.x
42. Redmond, E. C., & Griffith, C. J. (2004). Consumer Attitudes and Perceptions Towards
Microbial Food Safety in the Domestic Kitchen. Journal of Food Safety, 24(3), 169–194.
https://doi.org/10.1111/j.1745-4565.2004.tb00383.x
43. Røssvoll, E., Sørheim, O., Heir, E., Møretrø, T., Olsen, N. V., & Langsrud, S. (2014).
Consumer preferences, internal color and reduction of shigatoxigenic Escherichia coli in
cooked hamburgers. Meat Science, 96(1), 695–703.
https://doi.org/10.1016/j.meatsci.2013.09.009

24
44. Scallan, E., Hoekstra, R. M., Angulo, F. J., Tauxe, R. V., Widdowson, M. A., Roy, S. L., …
Griffin, P. M. (2011). Foodborne illness acquired in the United States-Major pathogens.
Emerging Infectious Diseases, 17(1), 7–15. https://doi.org/10.3201/eid1701.P11101
45. Scharff, R. L. (2012). Economic Burden from Health Losses Due to Foodborne Illness in the
United States. Journal of Food Protection, 75(1), 123–131. https://doi.org/10.4315/0362-
028X.JFP-11-058
46. Suzuki-Ohno, Y., Yokoyama, J., Nakashizuka, T., & Kawata, M. (2017). Utilization of
photographs taken by citizens for estimating bumblebee distributions. Scientific Reports,
7(1), 1–11. https://doi.org/10.1038/s41598-017-10581-x
47. United States Department of Health and Human Services. (2010). Healthy People 2020.
Retrieved from https://www.healthypeople.gov
48. United States Food and Drug Administration. (2013). Food Code 2013. Drugs.
https://doi.org/10.1016/j.parint.2011.08.011
49. World Health Organization. (2015). WHO | WHO estimates of the global burden of
foodborne diseases short. Technical Report, 1–255. https://doi.org/10.1016/j.fm.2014.07.009
50. World Health Organization. (2006). Five Keys to Safer Food Manual. Five Keys to Safer
Food Manual, 30. https://doi.org/10.3390/ijerph6112833
51. Worsfold, D., & Griffith, C. J. (1997). Assessment of the Standard of Consumer Food Safety
Behavior. Journal of Food Protection, 60(4), 399–406. https://doi.org/10.4315/0362-028X-
60.4.399

25
CHAPTER 2
Developing a Citizen Science Method to Collect Whole Turkey Thermometer Usage Behaviors
ABSTRACT
Citizen science is a unique data collection method where non-scientists gather and
interpret data in collaboration with professional scientists. The purpose of this study was to
identify thermometer usage behaviors through a different process for data collection. A food
safety lesson on minimum internal temperature and correct thermometer usage distributed to
high school Biology in Pennsylvania and Family and Consumer Sciences in both North Carolina
and Pennsylvania just prior to Thanksgiving break 2016. As homework, students inputted data
into a web-based form on thermometer usage and endpoint cooking temperatures for whole
turkeys. Students were asked for picture evidence of how/where the temperature of the turkey
was taken. If a photo was not provided, students were asked how they knew that the turkey was
“done”. Results were coded, interpreted, and compared to a broader population from the
International Food Information Council’s (IFIC) 2016 Food and Health Survey. 78.9% (45 of 57)
respondents used a thermometer for their turkey. Four types of thermometers were used: dial
(n=22), pop-up (n=13), digital (n=11), and liquid (n=1), and some were undetermined (n=2.) Of
respondents, 31.5% (18 of 57) reported an internal temperature when done of 165°F, 7.01%
(n=4) reported endpoint temperatures of less than 165°F, 21.1% (12 of 57) reported endpoint
temperatures between 165-180°F, and 21.1% (12 of 57) were undetermined. Respondents
submitted photos showing different thermometer placements, with 53.1% (17 of 32) placing the
thermometer in the breast, 35.3% (12 of 34) in the thigh, and 14.7% (5 of 34) undetermined.
There is a high usage of thermometer use herein (78.9%) compared to IFIC’s data on
26
thermometer usage (30%). Our data confirms that citizen science is a viable method to collect
unbiased data by providing participants with tools to collect information from a primary and a
photographically substantiated source of information rather than relying on self-reported data
alone.
INTRODUCTION
Of the possible pathogen-food combinations, undercooked and/or poorly handled poultry
ranks first for estimated annual disease burden because of its association with Campylobacter
spp. and Salmonella enterica (Batz et al., 2012). In an investigation of poultry-linked outbreaks,
Chai and colleagues (2016) identified food handling errors and inadequate cooking as the most
common behaviors leading to poultry-associated foodborne illness. Using the United States’
Foodborne Disease Outbreak System data from 1998 to 2012, 25% of outbreaks (279 of 1114)
were associated with poultry (Chai et al., 2017).
Turkey remains a significant public health problem, associated with numerous outbreaks.
A 1963 outbreak of Salmonella in Kentucky was traced to undercooking of creamed turkey,
where 229 of 441 convention attendees became ill (Kelsay, 1970). Bryan et al. (1971) also
identified preparation practices as a factor in a turkey-linked outbreak leading to multiple
illnesses at a school event. Outbreaks of Salmonella Heidelberg occurred in 2011 and 2013 in
ground turkey and chicken leading to 136 and 134 persons being infected respectively (CDC,
2013a, CDC, 2013b). Campylobacteriosis, salmonellosis and other foodborne illnesses can be
prevented by washing hands and surfaces exposed to raw meat or poultry products, not cross-
contaminating, cooking to the correct internal temperature, and refrigerating promptly (USDA,

27
2015). Lastly, historic and anecdotal data on consumer preparation of holiday meals in the U.S.,
have resulted in seasonal-specific messages from the U.S. Centers for Disease Control and
Prevention and the U.S. Department of Agriculture targeting turkey handling and cooking, as
well as promoting thermometer use to determine doneness (CDC, 2016, USDA, 2015). The
National Turkey Federation (NTF) (2017) estimates that 88% of Americans consume turkey at
Thanksgiving, accounting for some 46 million turkeys.
Prevalence of Campylobacter and Salmonella in poultry. Campylobacter has a high
prevalence in poultry products. A study conducted at two turkey processing plants over a one
year period found that Campylobacter spp. were highly prevalent in carcasses at 34.9% (841 of
2412), while a survey by the Minnesota Department of Health found that 88% (80 of 91) of retail
chicken products harbored Campylobacter spp. (Logue et al., 2002, Smith, 1999). Another study
reported a recovery rate of Campylobacter jejuni at 98% (49 of 50) in retail grocer broiler
carcasses (Stern and Line, 1992). Zhao and colleagues (2001) assessed the prevalence of
Campylobacter spp. and Salmonella serovars in retail meat and poultry products and recovered
Campylobacter from 91% (84 of 92) of the samples while Salmonella was present in 3% (3 of
92) of retail samples. Mazengia et al. (2014) conducted a year-long market survey in Seattle,
Washington and found that 11.3% (150 of 1,322) of chicken and turkey products were
contaminated with Salmonella serovars. Yang et al. (2011) reported that the prevalence of
Salmonella in raw poultry at the retail level in six provinces and two national cities was 52.2%
for the 1,152 chicken carcass samples tested.
Consumer poultry handling practices. A survey published in 2008 reported that 47%
of the number of consumers polled believed that the food they eat is very safe (Brewer et al.,

28
2008) However, only 36.9% of 4000 consumers surveyed circa 2006 cooked foods to a
temperature sufficient to kill harmful microorganisms (USDA, 2017). A U.S. national survey by
Kosa and colleagues (2015) found that 62% of 1,504 consumers reported owning a food
thermometer, and that participants were more likely to use a thermometer on larger cuts of meat
like whole turkeys, rather than smaller ones like ground turkey. Moreover, preparers of poultry
reportedly believed that they are unlikely to become sick from eating chicken prepared within
their home, believing instead that they are more likely to get sick from eating at a restaurant
(Bruhn, 2014). A self-reported survey conducted by Redmond and Griffith (2003, 2004) asked
consumers how much control they believed to have during food preparation with regards to food
safety compared to someone else preparing their food; Respondents believed they had more
control when preparing their own versus others preparing it. Consumers also underestimate the
likelihood that the unsafe food-handling behaviors are associated with elevated foodborne
disease risk (Redmond and Griffith, 2003, 2004). Less than 5% of 120 poultry preparers
surveyed used a thermometer to record the temperature of chicken and 40% of the ones that did,
used a thermometer but cook poultry products to less than the minimum internal temperature of
165°F (Bruhn, 2014). The 2016 IFIC survey on “Food and Health” provided self-reported
consumer data on food thermometer usage and safe endpoint cooking temperatures for meat and
poultry products. The survey showed an increase from 49% (494 of 1,007) to 66% (662 of 1,003)
between 2015 and 2016 in consumers cooking food to safe endpoint temperatures (IFIC, 2016)
Much of what is known about food handling in the home relies on self-reported data
(Anderson et al., 2004 , Bruhn, 2014, Jay et al., 1999) 2, 6, 18). Self-reported data can be
unreliable because of social desirability bias, which is the tendency of respondents to answer
with what they perceive to be socially desirable or acceptable behavior/responses instead of

29
socially undesirable ones (Kosa et al., 2015, Zerbe eand Paulhus, 1987). Consumers’ self-
reported practices are different when compared to their observed behavior (Anderson et al.,
2004, Jay et al., 1999). Anderson and colleagues (2004) observed participants in their homes
preparing an entrée and salad followed by a food handling survey and discovered that consumers
demonstrated knowledge of food safety, but it did not correspond to their behaviors when
preparing food. Jay and colleagues (1999) investigated practices in home kitchens in Melbourne,
Australia, wherein participants’ food handling practices were monitored and compared to a food
safety questionnaire they completed prior to being observed; significant variations were noted
between stated and observed food handling practices. Due to the limitations of self-reported data,
food researchers have increasingly sought alternative data collection methods, including
ethnography and observation, to provide a more accurate and robust data set (Chapman et al.,
2010, Chapman et al., 2013, DeDonder et al., 2009)
Purpose of citizen science study. Citizen science can be used to collect data across a
large geographic scale and over a long duration while conserving resources (Bonney et al.,
2004). The goal of this study was to investigate the applicability of a citizen science approach to
data collection for consumer food safety practices. Study objectives included piloting a data
collection instrument, recruiting citizen scientists through high school Biology and Family and
Consumer Sciences classes in Pennsylvania and North Carolina, and Biology classes in
Pennsylvania, and evaluating the utility of the resulting data.
MATERIALS AND METHODS
Citizen science data collection instrument development This study was piloted with
thermometer usage for whole turkeys as a novel method to collect data related to endpoint

30
cooking temperatures and thermometer placement information practiced by consumers without
the limitations of self-reported approaches. Citizen scientists for this study were high school
students grades 9-12 in Pennsylvania and North Carolina. The survey questions (Fig. 1) asked
were developed using information and recommendations in the USDA-FSIS’ Food Safety
Information Sheet on Kitchen Thermometers (USDA, 2015). The resulting web-based survey
was designed to be used over Thanksgiving break as a way for students to collect data on behalf
of their families and the primary meal-preparers in their homes. Data were collected through the
end of December 2016.
Fifty-seven high school students volunteered to complete the above-mentioned survey on
thermometer usage behaviors for whole turkeys over Thanksgiving break. Volunteers for this
experiment were recruited through Biology and Family and Consumer Sciences (FCS) classes at
Souderton Area High School, Souderton, Pennsylvania; and Family and Consumer Sciences
classes in North Carolina. FCS classes in North Carolina were e-mailed the curriculum outlined
in Fig 2. containing the survey through the FCS listserv, an application that allows for
distribution of messages to subscribers on a mailing list. Souderton Area High School was
recruited through partnerships and connections through previous work together. Approximately
400 students from PA and 1000 from NC were able to participate. The lesson was distributed to
teachers the first week of October. The fifty-seven participants of this study make up a
convenience sample. A five-question survey was created using SurveyMonkey (San Mateo, CA)
focusing on the food safety topics of thermometer usage, minimal internal endpoint cooking
temperature, and indicators of doneness for whole turkeys (Fig. 1). Teachers were provided the
survey as part of the lesson plan. The survey was distributed to students as a homework
assignment over Thanksgiving break as a way for them to reflect on what they learned from the

31
classroom lesson. North Carolina State University’s Institutional Review Board (IRB)
determined that the survey and lesson plan were exempt from being human subject research (IRB
#9491).
Recruiting citizen scientists through a high school food safety lesson. A food safety
class lesson was developed using North Carolina State University’s Family and Consumer
Sciences lesson template that focused on cross-contamination, the minimal internal temperature
of meats, and correct thermometer usage. The template consisted of the following components:
the topic; the goals and objectives; the materials needed, the grade level of the target student
volunteers; the time the lesson needed to be completed by; and the activities to be completed
during the lesson (Fig 1). The objectives of the lesson were for students to: i) apply previous
knowledge on sanitation to new food safety principles like cross-contamination and cooking; ii)
understand how and why cross-contamination can lead to foodborne illness; iii) undestand safe
handling of foods through learning about the importance of thorough cooking; and iv)
differentiate between safely and unsafely cooked foods. The anticipatory set, or the “warm up
activity”, included a YouTube video of a Food Network chef; students were asked to list and
describe all occurrences of cross-contamination portrayed in the video. Teachers and students
discussed the instances of cross-contamination and temperature abuse, as well as the surfaces
that needed to be sanitized by the chef as seen in the video. Emphasis was placed on washing of
hands after touching raw meat; the concept of avoiding cross-contamination; and proper usage of
a thermometer. Students performed a writing exercise after the warm-up activity answering the
question, “Have you ever been affected by foodborne illness?”, and shared their answers with
their classmates and teacher as part of a discussion on foodborne illness. Probing questions about
the type of symptoms experienced, the potential origin of the foodborne illness, and the future

32
prevention of the foodborne illness were provided to teachers to promote further discussion in
class. A lecture was developed with content from USDA-FSIS’ food safety information on
kitchen thermometers (USDA, 2015a). Concepts taught to students were thorough cooking to a
minimum internal temperature for pathogen destruction, color as a poor indicator of doneness,
and how to correctly use a thermometer.
Analyses and evaluation of data. Data collected on thermometer use through Survey
Monkey was obtained as a text response, as well as a pictorial response if students stated they
used a thermometer. Analyses of the survey responses were performed via Microsoft Excel
Office 365 (Redmond, WA). Responses were downloaded from Survey Monkey and each one
was reviewed to remove unnecessary information like survey response times and IP addresses.
Responses were coded using both the text and pictures provided by participants. Some data were
only obtainable through text, like indicators of doneness if a thermometer was not used, whereas
other data were only obtainable through pictures, like thermometer placement in the turkey.
Thermometer-type data were collected through picture, but not text. For pictures showing two
thermometers in a single turkey, each thermometer was coded separately (Fig 3D). Thermometer
usage and internal temperature data were obtained through text responses and verified pictures.
Thermometer placement was coded for dial, digital, and glass thermometers, but not for pop-up
thermometers.
RESULTS
Thermometer type used by citizen scientists. A total of fifty-seven high school students
participated in this citizen science project from the possible 1400 (400 Pennsylvania and 1,000
North Carolina). Of those participating, 78.9% (n=45) reported their family used a thermometer
to determine turkey doneness. The majority of students’ families, 48.9% (22 of 45), used a dial

33
thermometer. Dial thermometers were defined as having a dial display and containing a probe
that expands when heated up due to coils of two different metals being present (USDA, 2015a).
Pop-up thermometers were used by 29% (13 of 45) of participants, sometimes in conjunction
with other thermometers. Pop-up thermometers were defined as a single-use, disposable cooking
device made of food grade nylon that has an inside with a stainless-steel spring and organic
firing material that will spring, or “pop-up”, at a specific predetermined temperature (USDA,
2015a). No survey questions were asked on if the pop-up thermometer was inserted by the
manufacturer or by the participant themselves. Some respondents answered “yes” to
thermometer use but did not provide a temperature instead providing a picture of a pop-up
thermometer rather than a dial, digital, or liquid. Only pictorial responses of pop-up
thermometers were coded. Digital thermometers were used by 24% (11 of 45) of meal preparers.
Digital thermometers were defined as having a digital display and are thermistors, meaning it has
a resistor within a temperature-sensitive tip (USDA, 2015a). One participant reported using both
a digital and pop-up thermometer in their turkey, while two other participants reported using
both a dial and pop-up thermometer. One participant preferred a liquid thermometer (Fig 2D),
which was defined as having metal or glass stems that were filled with a colored liquid (USDA,
2015a). Thermometer type data was recorded as “undetermined” when pictures were not
accessible/attached or if a thermometer was not present in the picture.
Endpoint temperatures reached by citizen scientists. A safe internal temperature was
defined as 165°F, that being the recommended minimum internal temperature for turkey
provided by USDA-FSIS (USDA, 2015). Of participants using a thermometer, only 9% (4 of 46)
undercooked their turkey to an internal temperature of less than 165°F. More than half (65%; 30
of 45) of all participants cooked their whole turkey to an internal temperature of 165°F or higher.

34
Results were recorded as “undetermined” for the internal temperature of the turkey if: i.) the text
response provided an oven temperature instead of the internal temperature of the bird, or ii.) if
the picture provided was inaccessible or the temperature could not be determined by looking at
the picture.
Thermometer placement in whole turkeys by citizen scientists. Participants preferred
either the breast region (53%, 17 of 32) or thigh region (38%, 12 of 32) when checking the
internal temperature of their turkey. No participants measured the temperature with a
thermometer in the drumstick or wing region. Five samples were undetermined due to an
inability to establish thermometer placement, inaccessibility of the picture or use of a pop-up
thermometer solely. Fig 3. shows examples of raw data types from pictures uploaded.
DISCUSSION
Training of citizen scientists. Although citizen science has appreciable merits, it can
benefit from improvements to the data collection instrument and related to the recruitment and
training of citizen scientists. Improvements in the survey (i.e., data collection instrument) and in
the training of citizen scientists will, in turn, increase the utility of the attendant data. Source
(2008) stated that specific protocols easily understood by and for citizen scientists must be
developed and then tested for reliability. In addition, training participants on equipment before
use will help citizen scientists collect actual numbers rather than ranges of numbers. By
evaluating the results in comparison to someone that’s “pair-trained,” that being an individual
who will assist in checking result accuracy, the results can be tested for reliability. Students in
the study were trained by being taught correct thermometer placement and the minimal internal
temperature; however, the lesson was used at varying degrees in the classroom where some
teachers used the lecture on correct thermometer usage and placement while others did not so not

35
all citizen scientists received equal training. Training was not provided on the data collection
instrument of the survey so certain responses to questions were unusable due to the wrong
information being provided. For example, when asking for the internal temperature of the turkey,
students provided oven temperatures rather than that of the bird. Training could also benefit from
clarification and specifying specific details of the question such as participants should only
provide a picture of their turkey if they used a thermometer or participants should provide
internal temperatures of turkeys only if it is associated with a thermometer and a picture.
Comparison of citizen scientist thermometer usage behaviors versus existing self-
reported data. Participants’ thermometer usage behaviors for the citizen scientists was higher
compared to studies with self-reported data (IFIC, 2016, Kosa et al., 2015). In the present study,
78.9% (n=45) of participants reported using a food thermometer through text or pictorial
response. In comparison, 30% (n=1,003) of respondents reported thermometer use to check
doneness of meat and poultry items in IFIC’s 2016 Food and Health Survey, while 73.2% (1,101
of 1,504) of consumers self-reported using a thermometer for whole turkey in a study by Kosa
and colleagues (2015). A dial thermometer was the preferred thermometer choice among 48.8%
(n=22) of participants. Compared to digital thermometers, dial thermometers can provide less
accurate and lower measurements of the internal temperature of hot food because the tip and
stem must be inserted to the immersion point on the stem; yet consumers think that only the
thermometer tip must be inserted into the food (Snyder, 2004). More specifically, insertion of the
thermometer about 1/2 inch into a food gave a temperature reading that was 10 to 48°F below the
temperature of the center portion of the food (Snyder, 2004). Calibration is sometimes required
for dial thermometers to ensure that they are accurate (USDA, 2011).
36
Thirty-four participants provided a usable temperature value through text or picture,
while twelve participants provided unusable data that was categorized as “undetermined.” Of
these thirty-four participants, 66.7% (n=30) cooked their turkey to the required internal
temperature of 165°F or higher. This percentage is lower compared to IFIC’s data, in which 66%
(n=1,003) of consumers cooked their meat and poultry items to the required temperature of
165°F (IFIC, 2016). Most participants correctly placed thermometers in their turkey. Only four
participants (8.9%) undercooked their turkey.
Citizen scientist exposure to materials. Citizen science participants were exposed to
educational materials on the importance of thermometer use; of cooking turkey to a safe internal
temperature; and on correctly placing a thermometer in food. Results could be influenced by
exposure to educational materials. The Theory of Planned Behavior (TPB) contains three
variables: perceived behavioral control (PBC), attitudes, and subjective norms (Azjen, 1991).
PBC is a person’s perception of ease or difficulty when performing an intended behavior;
attitudes are a person’s favorable or unfavorable evaluation of the behavior; and subjective norm
is the perceived social pressure from the expectation of others (Azjen, 1991). Exposure to the
food safety lesson provided may have influenced students’ thermometer use during
Thanksgiving. Students could develop positive or negative attitudes associated with usage from
the lesson and/or be influenced by their peers’ or parent’s attitudes on thermometer use. This
could have affected whether students used a thermometer or not and whether they completed the
survey.
Study limitations. The “undetermined” category for recorded internal temperature of
turkeys was high accounting for 26% (n=12) of the samples in the data set. Poor quality data is a
potential weakness of citizen science, since data are dependent on the training, knowledge, and

37
expertise of the contributor (Foster-Smith and Evans, 2003), although, in this study, knowledge
and expertise were not specifically measured. Ratnieks and colleagues (2016) quantified the
effectiveness of training methods during their data collection seeking to identify insects and
flowers, and found that training method has a significant effect on accuracy of citizen science
results. A limitation in our study was a lack of direct teacher training or citizen science
instruction. Levels of information taught from the curriculum and training done was not
contrasted between participants that were exposed to food safety material and those who were
not. Some teachers used the material fully, some used it partially, and some did not use it at all.
For instance, Souderton Area High School, Family and Consumer Science classes only utilized
the survey and Biology classes used the lesson varyingly dependent on if a lesson on food safety
was taught earlier in the year. Some teachers have a school, county or state curriculum they need
to follow to prepare students for standardized tests, and this may have affected their ability to
fully use the lesson as intended. The food safety lesson is heavily science-based and may fit
better in a Biology class curriculum or teaching schedule rather than a Family and Consumer
Sciences class.
The quality of data collected by citizen scientists is dependent on how well the data fits
its purpose. Wiggins and colleagues (2011) describe this as a “multifaceted evaluation of states
such as completeness, validity, consistency, precision, and accuracy”. In this study, everything
from recruitment through data collection and evaluation was important to ensure that data was
accurate, and the lack of complete implementation may have altered the study outcomes. Council
and Horvath (2016) offer suggestions to promote citizen science recruitment such as like
community partnerships through local science museums or libraries, social media like Twitter
and Facebook, or through classroom engagement. Future recruitment of potential teachers and

38
students as citizen scientists could include social media components to gain a wider geographic
range or through local partnerships that promote science communication.
Engagement with citizen science. Classroom engagement in this project involved 57
participants but may increase with a tool Council and Horvath (2016) used, where scientists
researching particular topics related to the citizen science project were invited into classrooms
and could directly interact with students. The importance of engagement of partnerships was
noticeable when comparing participation from Souderton Area High School (45 of 57
participants) and North Carolina (12 of 57 participants). Teachers at SAHS were distributed the
food safety curriculum with the help of individuals who had previous involvement with NC
State’s researchers on a previous project while teachers from NC were distributed the lesson
through a listserv of two-hundred plus classes where no follow-up was done.
Response Rates and Comparison of Data. The recruitment process allowed for over
1,400 high school students to be reached in both PA and NC; however, the study only had 57
participants. Although the citizen science and existing data on thermometer use are discussed
above, the low response rate and the potential exposure to a lesson plan on food safety makes it
difficult to make direct comparisons.
Future work. Further studies are needed to more comprehensively develop, refine, and
pilot test classroom information and exercises related to proper thermometer use in the cooking
of poultry, and to expand the demographic and geographic components of the collection of data
by citizen scientists within homes. Citizen science provides a viable way triangulate self-reported
data from various sources. Collected survey data was analyzed through two forms, text and
picture, allowing for verification of results. Although the current study focused on whole turkey,
citizen science can be applied to other poultry and meat products of interest (e.g., thermometer

39
placement of mechanically tenderized steaks). The method could also be used at a grocery store
to gather data on a store’s food safety practices and potential consumer perception of these risks,
or on an airplane with sampling swabs to look for norovirus.
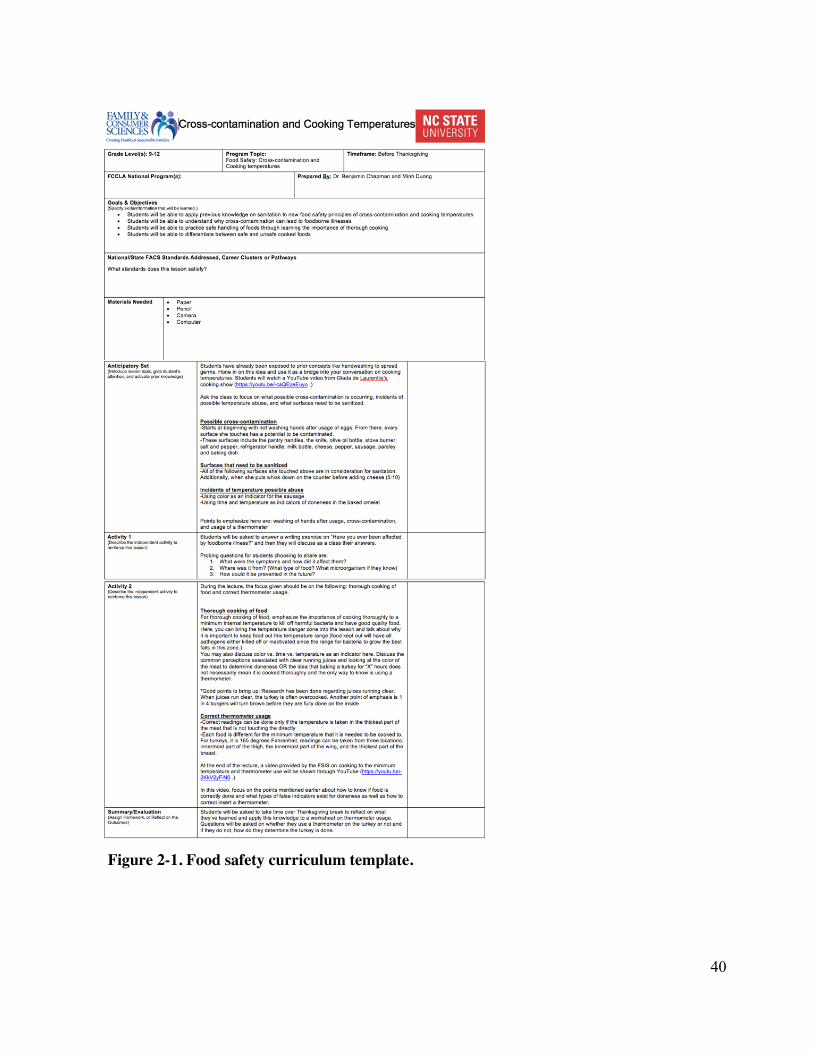
40
Figure 2-1. Food safety curriculum template.
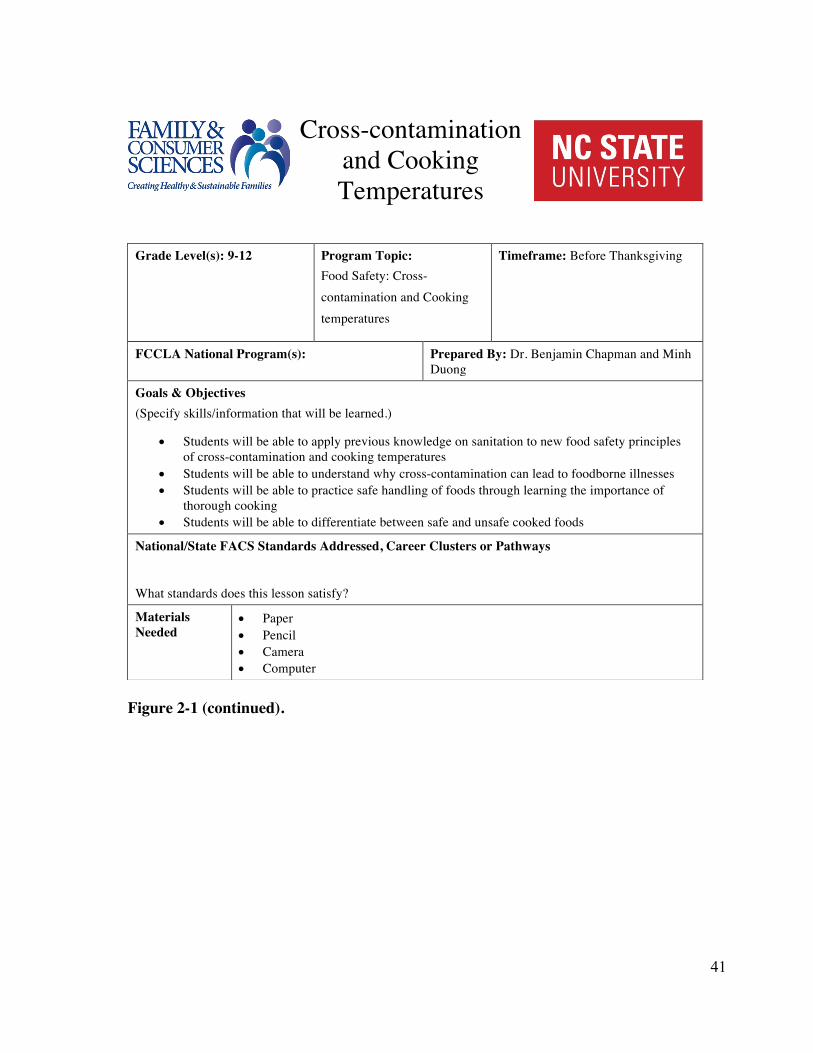
41
Cross-contamination and Cooking Temperatures
Figure 2-1 (continued).
Grade Level(s): 9-12 Program Topic: Food Safety: Cross-contamination and Cooking temperatures
Timeframe: Before Thanksgiving
FCCLA National Program(s): Prepared By: Dr. Benjamin Chapman and Minh Duong
Goals & Objectives (Specify skills/information that will be learned.)
• Students will be able to apply previous knowledge on sanitation to new food safety principles of cross-contamination and cooking temperatures
• Students will be able to understand why cross-contamination can lead to foodborne illnesses • Students will be able to practice safe handling of foods through learning the importance of
thorough cooking • Students will be able to differentiate between safe and unsafe cooked foods
National/State FACS Standards Addressed, Career Clusters or Pathways
What standards does this lesson satisfy?
Materials Needed
• Paper • Pencil • Camera • Computer

42
Figure 2-1 (continued).
Anticipatory Set (Introduce lesson topic, grab student’s attention, and activate prior knowledge)
Students have already been exposed to prior concepts like handwashing to spread germs. Hone in on this idea and use it as a bridge into your conversation on cooking temperatures. Students will watch a YouTube video from Giada de Laurentiis’s cooking show (https://youtu.be/-caQEzeEuyo .) Ask the class to focus on what possible cross-contamination is occurring, incidents of possible temperature abuse, and what surfaces need to be sanitized. Possible cross-contamination -Starts at beginning with not washing hands after usage of eggs. From there, every surface she touches has a potential to be contaminated. -These surfaces include the pantry handles, the knife, olive oil bottle, stove burner, salt and pepper, refrigerator handle, milk bottle, cheese, pepper, sausage, parsley and baking dish Surfaces that need to be sanitized -All of the following surfaces she touched above are in consideration for sanitation. Additionally, when she puts whisk down on the counter before adding cheese (5:10) Incidents of temperature possible abuse -Using color as an indicator for the sausage -Using time and temperature as indicators of doneness in the baked omelet Points to emphasize here are: washing of hands after usage, cross-contamination, and usage of a thermometer
Activity 1 (Describe the independent activity to reinforce this lesson)
Students will be asked to answer a writing exercise on “Have you ever been affected by foodborne illness?” and then they will discuss as a class their answers. Probing questions for students choosing to share are:
1. What were the symptoms and how did it affect them? 2. Where was it from? (What type of food? What microorganism if
they know) 3. How could it be prevented in the future?

43
Activity 2 (Describe the independent activity to reinforce this lesson)
During the lecture, the focus given should be on the following: thorough cooking of food and correct thermometer usage. Thorough cooking of food For thorough cooking of food, emphasize the importance of cooking thoroughly to a minimum internal temperature to kill off harmful bacteria and have good quality food. Here, you can bring the temperature danger zone into the lesson and talk about why it is important to keep food out this temperature range (food kept out will have all pathogens either killed off or inactivated since the range for bacteria to grow the best falls in this zone.) You may also discuss color vs. time vs. temperature as an indicator here. Discuss the common perceptions associated with clear running juices and looking at the color of the meat to determine doneness OR the idea that baking a turkey for “X” hours does not necessarily mean it is cooked thoroughly and the only way to know is using a thermometer. *Good points to bring up: Research has been done regarding juices running clear. When juices run clear, the turkey is often overcooked. Another point of emphasis is 1 in 4 burgers will turn brown before they are fully done on the inside Correct thermometer usage -Correct readings can be done only if the temperature is taken in the thickest part of the meat that is not touching the directly -Each food is different for the minimum temperature that it is needed to be cooked to. For turkeys, it is 165 degrees Fahrenheit; readings can be taken from three locations: innermost part of the thigh, the innermost part of the wing, and the thickest part of the breast. At the end of the lecture, a video provided by the FSIS on cooking to the minimum temperature and thermometer use will be shown through YouTube (https://youtu.be/-2KkV2yFiN0 .) In this video, focus on the points mentioned earlier about how to know if food is correctly done and what types of false indicators exist for doneness as well as how to correct insert a thermometer.
Summary/Evaluation (Assign Homework, or Reflect on the Outcomes)
Students will be asked to take time over Thanksgiving break to reflect on what they’ve learned and apply this knowledge to a worksheet on thermometer usage. Questions will be asked on whether they use a thermometer on the turkey or not and if they do not, how do they determine the turkey is done.
Source/Other Resources (If Applicable then required to cite any published or copyrighted materials used in this lesson plan)
Images were used from https://www.fsis.usda.gov/ Videos used were from “The Food Network” and FSIS’s YouTube channel https://youtu.be/-caQEzeEuyo (Food Network) https://youtu.be/-2KkV2yFiN0 (FSIS)
Figure 2-1 (continued).

44
Figure 2.2. Thermometer usage data collection instrument.

45
Figure 2-3. Representative pictures provided by data collectors.
(A) is a dial thermometer that measured the specific temperature of the turkey at the breast
region. (B) is an example of a digital thermometer that measured a specific temperature;
however, the specific measurement region here was not discernable. (C) is an example of two
thermometers being used in the same turkey. (D) is an example of a liquid thermometer.

46
Figure 2.4. Thermometer type usage by citizen scientists on whole turkey.
2 (4%)
1 (2%)
13 (27%)
11 (22%)
22 (45%)
0 5 10 15 20 25
Undetermined
Liquid
Pop-up
Digital
Dial
Numberofparticipantsusing
Type
ofthe
rmom
eter
Thermometertypeusagebycitizenscientistsonwholeturkey(n=49)
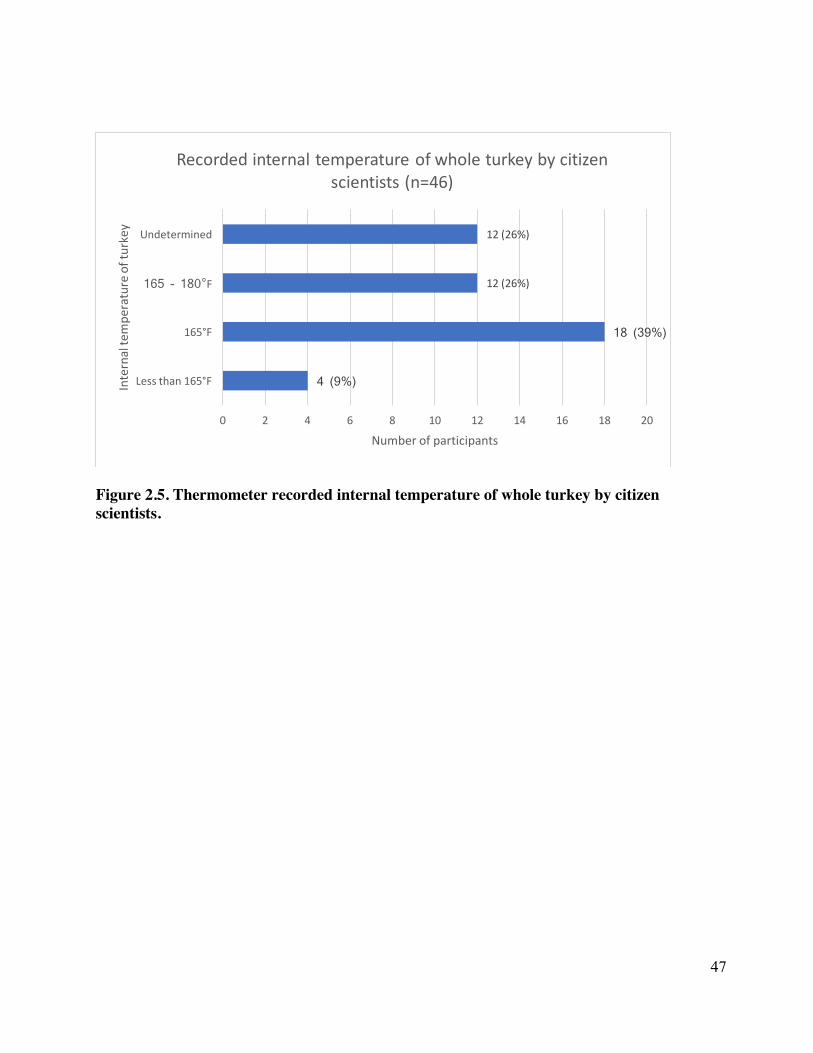
47
Figure 2.5. Thermometer recorded internal temperature of whole turkey by citizen scientists.
4 (9%)
18 (39%)
12 (26%)
12(26%)
0 2 4 6 8 10 12 14 16 18 20
Lessthan165°F
165°F
165 - 180°F
Undetermined
Numberofparticipants
Internaltempe
ratureofturkey
Recordedinternaltemperatureofwholeturkeybycitizenscientists(n=46)
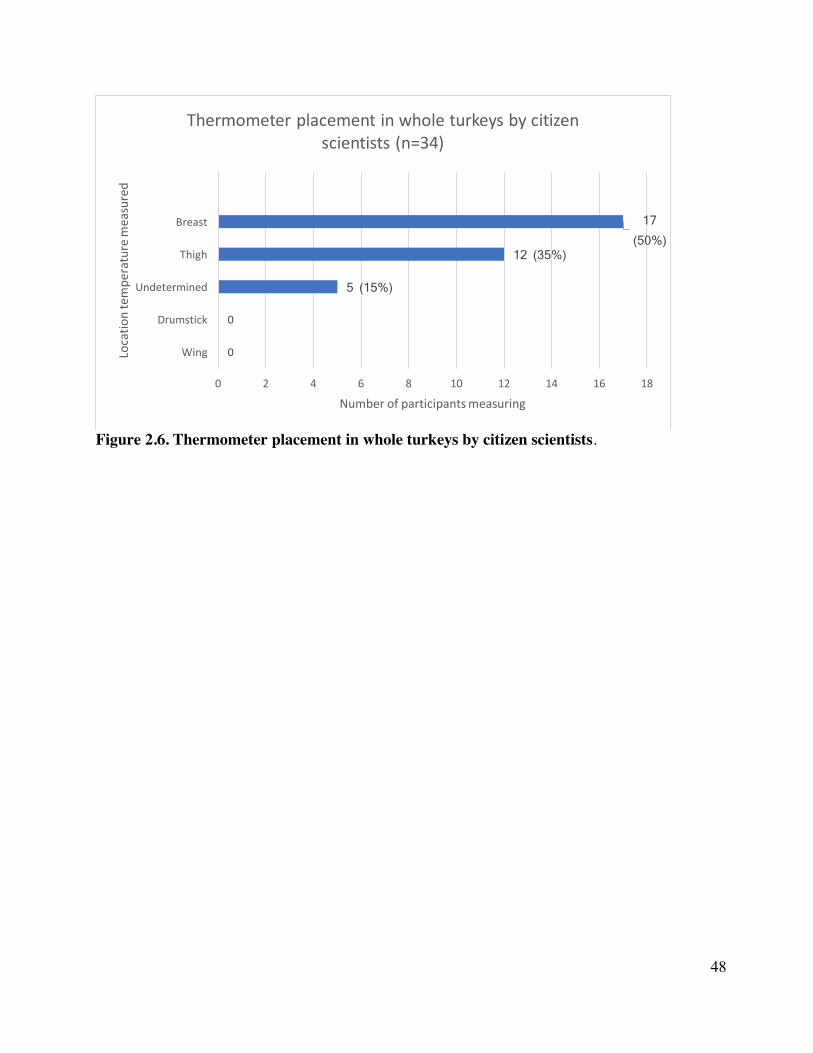
48
Figure 2.6. Thermometer placement in whole turkeys by citizen scientists.
0
0
5 (15%)
12 (35%)
17 (50%)
0 2 4 6 8 10 12 14 16 18
Wing
Drumstick
Undetermined
Thigh
Breast
Numberofparticipantsmeasuring
Locatio
ntempe
raturemeasured
Thermometerplacementinwholeturkeysbycitizenscientists(n=34)
49
REFERENCES
1. Ajzen, I. 1991. The theory of planned behavior. Organ. Behav. Hum. Decis. Process 50:179-
211.
2. Anderson, J. B., T. A. Shuster, K. E. Hansen, A. S. Levy, and A. Volk. 2004. A camera’s
view of consumer food-handling behaviors. J. Am. Diet. Assoc. 104:186–191.
3. Batz, M. B., S. Hoffmann, and J. G. Morris. 2012. Ranking the disease burden of 14
pathogens in food sources in the United States using attribution data from outbreak
investigations and expert elicitation. J. Food Prot. 75:1278-1291.
4. Bonney, R., J. L. Shirk, T. B. Phillips, A. Wiggins, H. L. Ballard, A. J. Miller-Rushing, and
J. K. Parrish. 2014. Citizen science: next steps for citizen science. Sci. 343:1436–1437.
5. Brewer, M. S., and M. Rojas. 2008. Consumer attitudes toward issues in food safety. J. Food
Saf. 28:1-22.
6. Bryan, F. L., McKinley, T., & Mixon, B. (1971). Use of Time-Temperature Evaluations in
Detecting the Responsible Vehicle and Contributing Factors of. Milk and Food Technology,
34(12), 576–582.
7. Bruhn, C. 2014. Chicken preparation in the home: an observational study. Food Prot. Trends
34:318–330. Available at: http://www.foodprotection.org/files/food-protection-trends/Sep-
Oct-14-Bruhn.pdf. Accessed 13 September, 2017.
8. Centers for Disease Control and Prevention. 2013. Multistate outbreak of Campylobacter
jejuni infections associated with undercooked chicken livers – Northeastern United States,
2012. Available at: https://www.cdc.gov/mmwr/preview/mmwrhtml/mm6244a2.htm%0D.
Accessed 21 August, 2017.
50
9. Centers for Disease Control and Prevention. 2013. Multistate outbreak of Salmonella
Heidelberg infections linked to chicken (Final update). Available at:
https://www.cdc.gov/salmonella/heidelberg-02-13/index.html. Accessed 17 August, 2017.
10. Centers for Disease Control and Prevention. 2016. Food safety tips for your holiday turkey.
Available at: https://www.cdc.gov/features/turkeytime/index.html. Accessed 12 August,
2017.
11. Chai, S. J., D. Cole, A. Nisler, and B. E. Mahon. 2017. Poultry: the most common food in
outbreaks with known pathogens, United States, 1998–2012. Epidemiol. Infect. 145: 316–
325.
12. Chapman, B., T. Eversley, K. Fillion, T. Maclaurin, and D. Powell. 2010. Assessment of
food safety practices of food service food handlers (risk assessment data): testing a
communication intervention (evaluation of tools). J. Food Prot. 73:1101–1107.
13. Chapman, B. J., T. MacLaurin, and D. A. Powell. 2013. Video observation and data coding
methods to assess food handling practices at food service. Food Prot. Trends 33:146–156.
14. Council, S. E., and J. E. Horvath. 2016. Scientific Citizenship. J. Microbiol. Biol. Edu.
17:38-40.
15. DeDonder, S., C. J. Jacob, B. V. Surgeoner, B. Chapman, R. Phebus, and D. A. Powell.
2009. Self-reported and observed behavior of primary meal preparers and adolescents during
preparation of frozen, uncooked, breaded chicken products. Brit. Food J. 111:915–929.
16. Foster-Smith, J., and S. M. Evans. 2003. The value of marine ecological data collected by
volunteers. Biol. Cons.113:199–213.
51
17. International Food Information Council. 2016. 2016 Food and Health Survey. Available at:
http://www.foodinsight.org/sites/default/files/2016-Food-and-Health-Survey-
Report_FINAL1.pdf. Accessed 13 September 2017.
18. Jay, L. S., D. Comar, and L. D. Govenlock. 1999. A video study of Australian domestic food-
handling practices. J. Food Prot. 62:1285-1296.
19. Kelsay, R. C. 1970. Food poisoning outbreak in Kentucky traced to creamed turkey.
Available at:
https://www.ncbi.nlm.nih.gov/pmc/articles/PMC2031814/pdf/pubhealthreporig01060-
0073.pdf. Accessed 13 September 2017.
20. Kosa, K. M., Cates, S. C., Bradley, S., Godwin, S., & Chambers, D. (2015). Consumer Shell
Egg Consumption and Handling Practices: Results from a National Survey. Journal of Food
Protection, 78(7), 1312–1319. https://doi.org/10.4315/0362-028X.JFP-14-574
21. Logue, C. M., J. S. Sherwood, L. M. Elijah, P. A. Olah, and M. R. Dockter. 2003. The
incidence of Campylobacter spp. on processed turkey from processing plants in the
midwestern United States. J. Appl. Microbiol. 95:234–241.
22. Mazengia, E., M. Samadpour, H. W. Hill, K. Greeson, K. Tenney, G. Liao, X. Huang, and J.
S. Meschke. 2014. Prevalence, concentrations, and antibiotic sensitivities of Salmonella
serovars in poultry from retail establishments in Seattle, Washington. J. Food Prot. 77:885-
893.
23. National Turkey Federation. 2017. Turkey History & Trivia. Available at:
http://eatturkey.com/why-turkey/history%0D. Accessed 27 August 2017.
24. Norkrans, G., and Å. Svedhem. 1982. Epidemiological aspects of Campylobacter jejuni
enteritis. J. Hyg. 89:163-170.

52
25. Ratnieks, F. L. W., F. Schrell, R. C. Sheppard, E. Brown, O. E. Bristow, and M. Garbuzov.
2016. Data reliability in citizen science: learning curve and the effects of training method,
volunteer background and experience on identification accuracy of insects visiting ivy
flowers. Methods Ecol. Evol. 7:1226–1235.
26. Redmond, E. C., and C. J. Griffith. 2003. Consumer food handling in the home: a review of
food safety studies. J. Food Prot. 66:130-161.
27. Redmond, E. C., and C. J. Griffith. 2004. Consumer perceptions of food safety risk, control
and responsibility. Appetite 43:309-313.
28. Silvertown, J. 2009. A new dawn for citizen science. Trends Ecol. Evol. 24:467-471.
29. Smith, A. M., S. Lynn, M. Sullivan, C. J. Lintott, P. E. Nugent, J. Botyanszki, M.
Kasliwal, R. Quimby, S. P. Bamford, L. F. Fortson, K. Schawinski, I. Hook, S. Blake, P.
Podsiadlowski, J. Jönsson, A. Gal-Yam, I. Arcavi, D. A. Howell, J. S. Bloom, J. Jacobsen, S.
R. Kulkarni, N. M. Law, E. O. Ofek, and R. Walters. 2011. Galaxy Zoo Supernovae. Mon.
Not. R. Astron. Soc. 412:1309-1319.
30. Snyder, O. P. 2004. Inaccuracy of food temperature measurement with the bimetallic coil
(dial) thermometer. Available at: www.hi-tm.com/Documents2004/bitherm-cook.pdf%0A.
Accessed 13 September 2017.
31. Source, J. P. C. 2008. Citizen Science: can volunteers do real research? BioSci. 58:192-197.
32. Stern, N. J., and J. E. Line. 1992. Comparison of three methods for recovery of
Campylobacter spp. from broiler carcasses. J. Food Prot. 55:663-666.
33. United States Department of Agriculture Food Safety and Inspection Service. 2011. Food
safety information: kitchen thermometers. Available at:
https://www.fsis.usda.gov/wps/wcm/connect/d8151061-bb50-46db-b87e-

53
%0Da3b9022c0c56/Kitchen_Thermometers.pdf? MOD=AJPERES.%0D. Accessed 8 August
2017.
34. United States Department of Agriculture Food Safety and Inspection Service. 2015. Basics
for handling food safely. Available at: https://www.fsis.usda.gov/wps/portal/fsis/topics/food-
safety-education/get-answers/food-safety-fact-sheets/safe-food-handling/basics-for-handling-
food-safely/ct_index. Accessed 7 August 2017.
35. United States Department of Agriculture Food Safety and Inspection Service. 2015. Let’s
talk turkey - a consumer guide to safely roasting a turkey. Available at:
https://www.fsis.usda.gov/wps/portal/fsis/topics/food-safety-education/get-answers/food-
safety-fact-sheets/poultry-preparation/lets-talk-turkey/CT_Index%0D. Accessed 9 August
2017.
36. United States Department of Health and Human Services. 2017. Healthy people 2020 food
safety objectives. Available at: https://www.healthypeople.gov/2020/topics-
objectives/topic/food-safety/objectives. Accessed 23 August 2017.
37. Wiggins, A., G. Newman, R. D. Stevenson, and K. Crowston. 2011. Mechanisms for data
quality and validation in citizen science. Proceedings 7th IEEE International Conference on
E-Science Workshops, eScienceW 2011, 14–19. https://doi.org/10.1109/eScienceW.2011.27
Accessed 21 July 2017
38. Yang, B., M. Xi, X. Wang, S. Cui, T. Yue, H. Hao, H., Y. Wang, Y. Cui, W. Q. Alali, J.
Meng, I. Walls, D. M. Wong, and M. P. Doyle. 2011. Prevalence of Salmonella on raw
poultry at retail markets in China. J. Food Prot. 74:1724-1728.
39. Zerbe, W. J., and D. L. Paulhus. 1987. Socially desirable responding in organizational
behavior: a reconception. Acad Manage. Rev. 12:250–264.

54
40. Zhao, C., B. Ge, J. De Villena, R. Sudler, E. Yeh, S. Zhao, D. G. White, D. Wagner, and J.
Meng. 2001. Escherichia coli and Salmonella Serovars in retail chicken, turkey, pork, and
beef from the Greater Washington, D.C. Area. Appl. Microbiol. 67:5431–5436.

55
CHAPTER 3
Meal Preparation Experiment Related to Thermometer Use
ABSTRACT
Observational studies are a mixed-methods approach to overcome problems of
interpretation and verification in self-reported data. The purpose of this study was to conduct an
observational study to evaluate consumer adherence to thermometer use and thorough cooking,
and to determine whether food safety messaging focused on thermometer use affected food
safety handling practices. Participants were recruited using social media and posters throughout
urban and rural North Carolina communities, were screened for eligibility, and scheduled for
appointments at one of the six model kitchens. Participants were randomly assigned to a control
or treatment group upon being scheduled. The treatment group was shown the USDA video on
the importance of thermometer use before starting. Individuals were asked to prepare a salad and
turkey burger the way they do so at home. Participants monitored and recorded throughout the
process using cameras. Results were coded and interpreted using Microsoft Office 365. Most
participants (206 of 383, 54%, 137 treatment, 69 control, p<0.001) used a thermometer to
measure at least one of the ground turkey patties. Of the total 490 thermometer placement
attempts, 42% (206 of 490, 168 treatment, 38 control, p<0.001) were correctly inserted into the
side of the patty. There was higher thermometer use herein (54%) compared to existing data for
hamburger use (10%) and poultry use (30%). Previous studies have not focused on thermometer
placement so no direct comparisons can be made. Our data confirms the effectiveness of the
USDA video in changing behavior short term.

56
INTRODUCTION
In the United States, an estimated 48 million cases of foodborne illness from known
sources occur annually, leading to 55,961 hospitalizations, 1,351 deaths, and an economic
burden of $77.7 billion each year (Scharff, 2012, Scallan et al., 2011). Of the possible pathogen-
food combinations ranked by Batz et al. (2012), undercooked and/or poorly handled poultry
ranked first for estimated annual disease burden because of its association with Campylobacter
species and Salmonella enterica, which ranked first and forth respectively. In 2011, two notable
multi-state outbreaks where consumer poultry handling was a factor occurred: one with human
Salmonella enterica subspecies enterica serovar Hadar linked to turkey burgers and another
associated with Salmonella enterica subspecies enterica serovar Heidelberg in ground poultry
(CDC, 2011a, CDC, 2011b). The outbreaks led to 12 and 136 persons becoming ill respectively,
with one death occurring from the Heidelberg outbreak.
USDA along with the Partnership for Food Safety Education, the FDA, and the CDC
have developed campaign called “Be Food Safe” that hopes to inform consumers about
foodborne illness and raise consumer understanding of the hazards associated with improper
handling and cooking of food. The campaign emphasizes four basic safe food handling
behaviors: “clean”, “separate”, “cook”, and “chill”. “Clean” includes washing hands correctly
and thoroughly, washing utensils and surfaced after each use, and washing. “Separate” concerns
using separate cutting boards and plates for produce and raw products such as meat, poultry,
seafood and eggs and keeping raw products separate from other items during grocery shopping
and in the refrigerator. “Cook” behaviors involve using a food thermometer to safely determine
if the food is done, reheating food correctly in the microwave to prevent cold spots, and bringing
sauces, soups, and gravies to a rolling boil upon heating. “Chill” involves refrigerating perishable

57
foods within two hours, thawing and marinating food correctly, and throwing out foods when
needed.
The Redmond and Griffith (2003) review of consumer food handling studies in the home
concluded that 80-93% of the United States and United Kingdom populations lacked knowledge
on correct heating temperatures. The inadequate cooking of animal foods or cross-contamination
of these foods is estimated to be responsible for 3.5 million cases of foodborne illness annually
in the United States (Medeiros et al., 2001). The 2016 FDA Food Safety Survey found 67% of
respondents reported owning a food thermometer, but 19% used one when cooking chicken parts
and 10% used one for hamburgers (Lando et al., 2016). The 2016 Food and Health Survey
conducted by IFIC showed that consumers use a food thermometer 30% of the time to check
doneness of meat and poultry items, but only cook to the required temperature for their meat
66% of the time
Observation is a methodology for understanding complex behavioral situations accurately
and is not dependent on second-hand reported accounts of behavior from the respondents who
may put their own interpretation on events (Bowling, 2000, Saunders and Thornhill, 2000).
Observational data are tested for reliability by assessing the intra- and inter-observer reliability
of the observation by obtaining the same results when measuring the same action/behavior on
different occasions for the former, and correlating the records from one observer to another for
the latter. Observer biases and the Hawthorne Effect, defined as the alteration of behavior by a
participant in a study due to an awareness of being watched, can limit the reliability of the
observation technique. The observer’s perception can influence which practices are recorded or
not recorded (Bowling, 2002). The observer may influence participant behavior by virtue of the
fact that participants are aware they are being observed. Potential biases associated with

58
reliability can be overcome by employing practices such as not fully revealing to participants
what practices are being observed or posing as staff members (Chapman et al., 2010, Anderson
et al., 2004, Clayton et al., 2004). To overcome problems of interpretation and verification in
self-reported data, direct observation has been used to collect data on food safety behaviors of
consumers (Worsfold, 1994). Several researchers have used direct observation to evaluate the
food safety practices of consumers and have compared their results with those obtained by self-
report questionnaire (Worsfold and Griffith, 1997, Jay et al., 1999, Anderson et al., 2004, Phang
and Bruhn, 2011, Bruhn, 2014). The purpose of this study was to conduct an observational study
to evaluate consumer adherence to thermometer use and thorough cooking, and to determine
whether food safety messaging focused on thermometer use affected food safety handling
practices.
MATERIALS AND METHODS
Research Design. The meal preparation experiment focused on the food safety behavior
of cook, specifically whether participants used a food thermometer to check doneness of turkey
patties and whether the patties were cooked to the recommended temperature of 165°F.
Participants were randomly assigned to a control group that experienced no prior exposure to
food safety messaging or an intervention group that did.
Sample size. Sample size was calculated to determine the minimum number of
participants needed to provide a level of confidence stating that meal preparation was sufficiently
powered meaning that the change of anticipated size or greater would be interpreted as occurring
beyond chance (i.e., statistically significant). A power analysis was calculated using a review of
current literature suggesting that approximately 5% of the population uses a thermometer to
ensure proper cooking temperature when observed cooking (Anderson et al., 2004, Phang &

59
Bruhn, 2011; Bruhn, 2014, Mazengia et al., 2015). With this starting base rate, a large change
was required to observe change that was meaningful and statistically significant. Sample size
estimates were designed to identify statistically significant relative increases of 50%, 75%, and
100%. The sample size calculation took into consideration the anticipated base rate for
thermometer use and the anticipated distributional characteristics of a dichotomous outcome and
the research design that is feasible given the logistical constraints of conducting test kitchen
observations in one location. It was determined that sample size was 400 with 200 per group to
provide 80% statistical power and a 95% level of confidence was reasonable in comparison to a
sample size of 560 and effect size of 0.28 (Appendix E).
Institutional Review Board. An application to conduct this research study was
submitted to the North Carolina State Institutional Review Board (IRB) for the Use of Human
Subjects in Research. Information was provided to IRB on potential participant risks, and the
study’s protocol. The study was approved (IRB #9483) and consent forms were created and
made available participants before the study started informing them of their risks. The consent
form contained a short introduction explaining the participant’s rights, the purpose, procedure,
and duration of the study, potential risks or discomforts, participant benefits and payment for
study completion, and confidentiality of participant information.
Recruitment of participants. Convenience sampling was used to ensure that study
participants reflected demographic characteristics of the U.S. population based on the most
recent census data. Participants were recruited using social media outlets such as Facebook,
Craigslist, and Instagram, by sending e-mails to Expanded Food and Nutrition Education
Program (EFNEP) participants to reach low-income consumers, and by posting and distributing
flyers about the study in approximately 150 locations within driving distances of test kitchens
60
located in Raleigh, North Carolina, and Smithfield, North Carolina. Flyers were posted and
distributed in locations where low-income and older adults may congregate such as churches,
community centers, libraries, and food pantries.
Challenges were faced recruiting people with high school education or less, adults 55
years or older, and Hispanic people; thus, additional recruiting was conducted in Spanish. A
local market research firm was used to contact individuals with the desired demographic
characteristics, and to screen individuals for eligibility. Recruitment materials were translated
and posted in Spanish on social media sites. Outreach efforts were conducted at locations in
which Hispanic people may congregate such as Hispanic grocery stores, churches, and
community organizations such as the Hispanic Family Center.
Screening process. Recruitment materials directed prospective participants to call or
email the study team to be screened for eligibility or to click on a web link that hosted the
screening questionnaire (Appendix A). Participants screened by phone were invited to participate
in the study and schedule an appointment during the screening call if eligible. Participants who
completed the web-based screener and were considered eligible were contacted by phone, invited
to participate, and scheduled for an appointment. Participants were told that the study
participation involved preparation of several recipes and participating in a short interview.
Appointments were scheduled during work hours, evenings, and weekends to allow for a broader
participant pool. A confirmation email or letter was sent, and a reminder call was given one or
two days prior to the appointment.
Study Procedures. Studies were conducted in six test kitchen facilities located in the
Raleigh-Durham area of North Carolina (Wake County), and Smithfield, North Carolina
(Johnston County), a rural location. The test kitchen had four to six cameras that recorded

61
participants’ actions at various locations throughout the kitchen during the meal preparation from
beginning to end. Five different kitchen locations were used during this study : Wake County test
kitchen, Johnston County test kitchen, and three kitchens at NC State on-campus apartments.
Observers monitored the cameras through the process to identify methods used by participant to
determine doneness of the turkey burgers. Scheduled participants were greeted by a study team
member upon arrival at the test kitchen where they were instructed to read and sign an informed
consent form (Appendix B). Participants in the treatment and control groups were given iPads by
a study team member upon entering the observation waiting area and were asked to view the
expectation video. Treatment group participants were asked to view an additional video by the
USDA on thermometer use.
Initially, all participants were told the purpose of the study was recipe testing. Consistent
with the approach used in other observational studies, participants were informed of the real
purpose of the study following the meal preparation and why it was important from a scientific
perspective to inform them after the study was complete (Chapman, Eversley, Fillion,
MacLaurin, & Powell, 2010; DeDonder et al., 2009). Participants had the opportunity to opt out
of the study after being informed of the study’s true purpose. Data was to be destroyed if the
participant opted out.
Participants were given a double-sided laminated recipe card with a chef’s salad recipe
on one side and a turkey burger recipe with a lettuce and tomato garnish on the other side, and
instructed to prepare the foods as they would at home (Appendix B) Participants were not told
which item to prepare first (burger vs. salad). A study team member pointed out that cabinets
containing utensils, dishes, pans, and a George Foreman grill were labeled accordingly. A

62
complete list of equipment provided in each test kitchen and a photo of one such kitchen is
provided in Appendix D.
Treatment Group USDA Video: The Importance of Cooking to a Safe Internal
Temperature. Treatment group participants were asked to watch the USDA Food Safety video
“The Importance of Cooking to a Safe Internal Temperature and How to Use a Food
Thermometer” (https://www.youtube.com/watch?v=-2KkV2yFiN0) upon arrival at the model
kitchen. The video focused on the following messages: visual cues are not sufficient to assess
safety; a proper internal temperature is needed to determine doneness; the only way to ensure
safety is to use a food thermometer; and the food thermometer must be cleaned with soap and
water when finished. The hamburger patty portion of the video showed flipping of the burgers.
Inserting the thermometer from the side was demonstrated, and a message was provided
instructing them to measure the temperature of each patty.
Coding rubrics. A coding rubric was developed to characterize thermometer use
behaviors. Observers, defined as those watching the participants during the study and gathering
data on what they see, followed the rubric to indicate level of adherence to recommended
behaviors while observing participants. The rubric also included a list of trigger behaviors that
prompted additional questions during the post-observation interview and which items to be
sampled to collect data on potential cross-contamination events. Coders were trained by
reviewing the coding rubric and using practice food safety handling scenarios to compare inter-
and intracoding reliability. Incorrect and inconsistent coding situations were discussed amongst
coders to ensure that proper and consistent training occurred.
Coding of observation and analysis. A decision tree was developed to compare the food
safety practices of primary meal preparers using definitions from the U.S. Centers for Disease
63
Control and Prevention’s contributing factors for foodborne illness, coupled with the World
Health Organization’s (WHO’s) factors leading to foodborne illness (Bean, Goulding, Lao, &
Angulo, 1996; WHO, 2014). These definitions were supported by scientific literature that
focused on risky food safety practices (Anderson et al., 2004; Clayton & Griffith 2004; Green et
al., 2006; Redmond et al., 2004). Definitions of food safety practices from the literature coupled
with foodservice inspection criteria (FDA, 2013) led to the decision to focus the video
observation methodology on capturing and cataloguing handwashing and cross-contamination
incidents.
Notational analysis was used to assess recorded actions and their frequencies. Notational
analysis is a tool used to collect observed events and place them in an ordered sequence (Huges
and Franks, 1997); it has been used to track food safety behaviors because it enables the
recording of specific details about events in the order in which they occur by associating a time
stamp with actions (Clayton and Griffith, 2004). A time-stamp is especially useful when looking
at sanitation steps limiting the likelihood of cross-contamination or the use of common food
contact surfaces and equipment. Notational analysis has been used in both nonparticipant and
participant consumer food safety behavior observational studies, as well as participant
foodservice observation (Chapman et al., 2010; Clayton & Griffith, 2004; Green et al., 2006;
Redmond et al., 2004). An action decision tree was developed for thermometer use (Figure 2).
Thermometer data and analysis. A trained observer viewed each video to assess
thermometer usage frequency, correct placement, and specific temperatures. A heat map was
created to show the approximate placement of the thermometer into each patty and the angle of
insertion (whether from the top, directly from overhead, or from the side). A unique instrument
was constructed for this project: a data logger (HOBO UX100 Series) placed inside the housing

64
of a thermometer constructed to look like a commercially available thermometer for consumer
use. When participants used the thermometer/data logger, the logger recorded the temperature of
the probe tip every second. Results were imported using onset HOBOware software (Onset
Computer Corporation, Bourne, MA), and were analyzed and coded for temperatures measured
during the observation. In addition to the placement and temperature, observers also recorded
whether the thermometer was used on one or two patties (because often the temperature varies
between patties). Supplemental to the thermometer use, observers also recorded the number of
flips per patty, because flipping can lead to more even heating of the product (Luchansky et al.,
2013, Yang et al., 2017). Results were coded using decision trees, a flow-chart providing
guidance on whether the participant performed or did not perform a behavior. For example,
participants are expected to use a thermometer when cooking their burgers. If they do so, the
action will be coded and other actions will be looked at such as thermometer placement. The
thermometer and coding results were analyzed with Microsoft Excel 365 (Redmond, WA).
RESULTS
Ownership and Usage of Thermometer. Sixty-one percent of control group (123 of
201) and 63% (115 of 182) of treatment group participants reported owning a food thermometer
at the time of recruitment (Table 3-2). Of the total 383 participants, 206 (54%) used a
thermometer to measure the temperature of at least one of the ground turkey patties, 157 (41%)
did not use a thermometer, and 20 (5%) were undeterminable. Videos considered undeterminable
were either corrupted or missing from the hardware. Control group participants used a
thermometer 34% (n=69) of the time while participants who were exposed to the USDA video
used a thermometer to check doneness 75% (n=137) of the time (significant at p<0.001).

65
Thermometer placement. Of 383 participants using a thermometer, 42% (206 of 490
attempts) who used a thermometer placed it in the correct location of the patty meaning that the
thermometer was inserted into the side of the turkey patty to reach the center to seek the coldest
spot. An attempt was defined as the participant inserting the thermometer probe into the burger
patty to measure the temperature. Figure 1 shows a heat map diagram of a turkey patty
indicating thermometer placement for the control and treatment group participants. The red-
shaded portions within the patty indicate where most participants placed the thermometer, while
the blue-shaded portions indicate where fewer participants placed the thermometer.
Number of patties checked with thermometer. Participants using a food thermometer
in this study checked the temperature of one patty 21% (39 of 206) of the time and the
temperature of two patties 79% (149 of 206) of the time. A patty checked with the thermometer
was defined as insertion of the probe into the patty for at least one second. Of the participants
that checked only one patty, 16 participants were from the control group, and 23 were from the
treatment group. Of those that checked two patties, 44 participants and 105 participants from the
control and treatment groups, respectively. There was a significant difference between the
control and treatment group for participants checking two patties (p<0.001), but not for those
checking one patty (p=0.067).
Number of Flips per Patty. Two patties were given to each participant in the study to
cook. There was a total of 594 patties (n=297 participants) used for analysis, where 334 patties
were from the control group and 260 from the treatment group. A flip for a burger patty was
defined as inverting the patty that was touching the pan to the opposite side. Forty-two patties
(7%, 42 of 594) were not flipped, at all with 36 patties being from the control group and six
patties being from the treatment. There was a significant difference (p<0.001) between the two

66
groups. Ninety-eight patties were flipped only once by participants throughout the cooking. Of
those, 35 patties that were flipped only once by the control group, and the treatment group
performed one flip 45 times. There was no significant difference between the two groups
(p=0.394). For the 123 patties that were flipped twice, 57 patties from the control and 66 patties
from the treatment groups (p=.118). The control group participants had 178 patties that were
flipped three times or more during the cooking process while the treatment group participants
had 137. Turkey patties that were cooked in the George Foreman grill or baked in the oven were
not added into the flip counts. A total of thirteen patties were cooked using the George Foreman
(8 control, 5 treatment). Only three patties were baked in the oven (2 control, 1 treatment).
Endpoint Temperatures Reached. Safe endpoint time-temperature combinations were
determined using USDA FSIS’s Appendix A: time for given temperature and fat level of turkey
needed to obtain 7-log lethality of Salmonella (USDA FSIS, 2017). Of participants who used a
thermometer and for whom temperature data was available, 67% (44 control, 66 treatment) of the
observations had patties reaching the instant temperature of 165°F. There was a significant
difference between the control and treatment group (p=.008). No patties refached a temperature
for the other time-temperature combinations.
Table 3-6 provides the distribution of end-point temperatures for participants who used a
food thermometer. A total of ninety participants (44 control, 66 treatment) measured their patties
to a temperature of 165°F or greater. Of those who had an endpoint temperature between 160-
164.99°F, five were from the control group and three from the treatment. There were five
participants (2 control, 3 treatment) whose patties reached an endpoint temperature between 150-
154.9°F. Some participants (27 of 137) recorded a temperature below 150°F for their endpoint

67
value. The lowest temperature recorded during the study fell into the 65-70°F range (1 control, 2
treatment).
Methods to determine doneness. A total of 46% (n = 177) of participants used an
alternative method to determine doneness instead using a thermometer. Among these
participants, 46% (56 of 122) of participants in the control group and 30% (9 of 30) of
participants in the treatment group relied on the firmness/texture of the patty to determine if the
patty was done (see Table 3-7). Twenty-six percent of participants (32 of 122) in the control
group and 43% (13 of 30) of participants in the treatment group were observed using more than
one method—firmness and color of the patty—to determine doneness.
Among participants who used a food thermometer (n = 206), 32% (18 of 35) of participants
in the control group and 42% (52 of 123) in the treatment group relied solely on the food
thermometer (Table 3-8). When comparing self-reported behavior versus observed behavior, the
self-reported rates from the screener for thermometer use as the sole method were considerably
lower (6% for the control group and 5% for the treatment group). One possible explanation for
this is the use of turkey burgers. The most commonly observed methods to determine doneness
among thermometer users using multiple methods were thermometer use and the
firmness/texture of the patty (70%, 26 of 55 control and 81%, 57 of 123 treatment).
Self-reported practices to determine doneness by participants who did not use a
food thermometer. Table 3-7 displays data on the methods used by participants to determine
doneness if they did not use a thermometer. Color was defined as the consumer cutting open the
burger patty, and was used by ten participants (5 control, 5 treatment, p=0.88). When asked
about their practices through the screener, forty participants (33 treatment, 7 treatment) reported
using the inside color of a patty to determine doneness while three (all from the treatment group)

68
reported using outside color. Many participants (n=65, 56 control, 9 treatment, p=0.11) relied on
“touch", the firmness or texture of the patty, to determine doneness. Self-reported practices
indicated that nine participants (7 control, 2 treatment, p=.98) self-reported that they used
“touch” as a method for determining doneness. Methods of both color and touch were used by
forty-five participants (32 control, 13 treatment, p=0.09). The majority of participants (n=122, 93
control, 29 treatment, p=0.92) reported using more than one method to determine burger
doneness. Methods such as cooking time were considered “unobservable” during the study.
Some participants (n=32, 29 control, 3 treatment, p=0.16) did not use any method be it a
thermometer, or one of the following: color, touch, or a combination of both, to determine
doneness
Self-reported practices to determine doneness by participants who used a food
thermometer. Study participants reported only using a thermometer to determine burger
doneness 6% of the time (4 control, 7 treatment, p=0.87). Participants were observed using only
a thermometer 39% (70 of 178) of the time (18 control, 52 treatment, p=0.28). Of these 70
participants, only eleven (4 control, 7 treatment) reported using one in the screener. The majority
of participants, 61% (37 control, 71 treatment) used another method in addition to a thermometer
to determine doneness. Of these 108 participants, 83 (77%, 26 control, 57 treatment, p=0.93)
relied on color and thermometer use. Only four participants (4%, 1 control, 3 treatment, p=0.53)
relied on touch and thermometer use. Twelve percent (21 of 178, 10 control, 11 treatment,
p=0.13) of participants relying on a combination of the three methods for doneness
69
DISCUSSION
Thermometer Ownership and Use by Treatment and Control Group Participants.
Of the 383 participants, 62% (n=238) reported owning a food thermometer. These results are
higher than those reported by Bruhn (2014) and Anderson et al. (2004) who both reported 48%
ownership, but similar to that reported by Kosa et al. (2015) and Lando et al. (2016) who
reported 62% and 67% ownership, respectively. The majority of participants (54%, n=206) were
observed using a thermometer to measure the temperature of at least one ground turkey patty.
Individuals exposed to the video on thermometer use (75%, n=137) were more than two times
likely to use a thermometer when cooking ground turkey patties than individuals who were not
shown the video (34%, n=69). The control group’s thermometer usage was higher than the 2016
Food Safety Survey (Lando et al., 2016) self-reported behaviors—10% for hamburgers and 19%
for chicken parts—but in line with the International Food Information Council’s Food & Health
Survey 2016 in which more than 30% of consumers reported always using a food thermometer
when cooking poultry.
Thermometer Use Attempts by Participants. Attempts to use a food thermometer were
further analyzed to demonstrate that 42% of participants (23% control, 52% treatment,
significant at p < 0.001) who used a thermometer placed it in the correct location in the patty;
that is, the thermometer was inserted into the side of the turkey patty to reach the center to locate
the coldest spot. Comparing the two heat maps indicates the treatment group participants were
more likely than the control group participants to insert the thermometer into the side of the
patty, which is the recommended practice. Previous studies have mainly focused on recording
just thermometer attempts (not placement), and, in some cases, the final cook temperature was
70
measured after some elapsed time (Phang & Bruhn, 2011); in those cases, temperature values
cannot be compared directly to correct thermometer use of previous work. Earlier studies have
not determined if a food thermometer was used to measure the temperature of all patties being
cooked. In our study, the treatment group participants were significantly more likely than control
group participants to check the temperature of both patties (82 vs. 73%, p <0 .001), which is the
recommended practice (see Table 3-3).
Patty Flipping Behavior by Participants. Two factors may influence even heating: the
state of the product before cooking (e.g., frozen, refrigerated, or room temperature), and the
number of times the product is turned over during the cooking process (i.e., flipped) (Berry and
Bigner-George (2001); Gill et al., 2013, Luchansky et al., 2013). The majority of participants
(90%, 536 of 594) flipped their burger at least once while cooking. More than half of the
participants (53%, 315 of 594, 137 control, 178 treatment, p=.089) flipped the burger patties
three or more times. Studies by Yang et al. (2017) and Luchansky et al. (2017) demonstrated the
impact of flipping meat while cooking, showing that more than three flips with non-intact beef
resulted in the highest reduction of E. coli O157:H7. About a fifth of participants (20%, 123 of
594, 57 control, 66 treatment, p=0.118) flipped their burgers two times. The majority of the
study participants flipped their burgers more compared to other studies. Phang and Bruhn (2011)
was the only observational study to look at burger flipping, and they found that their study
volunteers flipped burgers an average of 2.5 times during cooking. In our study, participants
were more likely to flip the burgers flipping an average of 3.7 times. Some participants, 7% (42
of 594, 36 control, 6 treatment, p<.001) did not flip the burgers at all during cooking. There were
a higher number of participants that had no flips during cook when compared to Phang and
Bruhn’s (2011) study which only had 2% (n=5) of participants not flip their burgers at all. When

71
the control and intervention groups were compared to one another for flipping behavior, there
was a significant difference (5%, 36 control, 6 intervention, p=0.001). Lower numbers associated
with the intervention group could be attributed to the USDA video on thermometer use shows a
hamburger being flipped.
Mixed-Methods Approach. This study had some limitations. The study used a
combination of survey and observation methodology. Surveys rely on self-reported behaviors,
which may overstate actual behaviors due to social desirability bias in which respondents report
behaviors they perceive to be “acceptable” or “correct” (Crowne and Marlowe, 1964, Redmond
and Griffith, 2003). In addition, survey respondents may be more likely to report their usual
behavior rather than their actual behavior (Jobe, 1993, Smith et al., 1991). Some of the
limitations associated with surveys can be overcome with observations, however, this method too
has limitations. Redmond and Griffith (2003) discuss two prominent biases in their study:
observer bias and the Hawthorne Effect. The observer’s perception can influence which practices
are recorded or not recorded (Bowling, 2002). The Hawthorne Effect is where the observer can
influence participant behavior because the participants are aware they are being observed
(Bowling, 2002). The Hawthorne Effect and potential biases can be overcome by employing
practices such as not fully revealing to participants what practices are being observed or posing
as staff members (Chapman et al., 2010, Anderson et al., 2004, Clayton et al., 2004). In this
study, we utilized methods based on Chapman et al. (2010), Anderson et al. (2004), and Clayton
et al. (2004) to prevent biases that can occur due to the participant’s perception or intentions.
Participants may be more or less likely to perform a particular task if they know the real study
objective. Some participants were shown the USDA food safety video “The Importance of
Cooking to a Safe Internal Temperature and How to Use a Food Thermometer” before cooking.

72
The video may have influenced consumers to use a thermometer even if they do not use one
during meal preparation at home. The unfamiliarity may explain improper thermometer
placements when measuring; although, it is encouraging that participants are using a
thermometer to start out with (Figure 2-1).
Ground Turkey Product Familiarity. The participants may undercook or overcook the
turkey burgers because of inexperience with preparing the product previously. Participants may
treat the turkey like beef. A review by Fonti-i-Furnols and Guerrero (2014) found that meat
flavor, in-mouth texture, and visual appearance among other sensory properties between beef and
poultry affect consumer behavior, preferences, and perceptions of meat. Some consumers (18%,
n=8,543) of ground beef may prefer to consume burgers with a pink color inside (Taylor et al.,
2011). Some of our study participants may have chosen to treat the turkey like other chicken due
to a lack of cooking experience with turkey. A study by Yeung and Morris (2001) reported that
some of their survey respondents suggested a need to overcook chicken to reduce the risk of
bacteria. Individuals with similar beliefs may choose to handle their turkey similarly.
Future Messaging. The USDA Food Safety video “The Importance of Cooking to a Safe
Internal Temperature and How to Use a Food Thermometer” provided messaging on subjective
indicators to determine doneness, thermometer values and placements for specific meats, and
instructions to cleaning a thermometer. The messaging for burgers showed multiple patties being
measured; however, the narrator did not inform the viewer of the importance of measuring the
patty in multiple spots and measuring multiple due to uneven heating. Burger flipping was an
important characteristic to prevent cold spots, and messaging should look to incorporate it. As
mentioned previously, poultry and beef parameters for doneness differed due to sensory

73
characteristics preferred by consumers. Future messaging should look to address the differences
between determining doneness for beef and poultry products.
Future work. This study has shown that recruited participants that are exposed to the
USDA video on thermometer use were more likely to use a thermometer. Due to the constraints
of placing the participant in an artificial environment, it would be valuable to evaluate the
messaging in the long-term to see if the messaging really did have an impact. Future studies may
also consider exploring other foods in which a mixed-methods approach has not been done yet
such as mechanically tenderized beef products.

74
TABLES
Table 3-1. Characteristics of the Participants
Characteristic
All Participants
(n = 383) Control (n = 201)
Treatment (n = 182) p valuea
Race .05 Caucasian or White 66% (253) 71% (142) 61% (111) Black or African American
30% (117) 26% (54) 35% (63)
Other raceb 3% (13) 3% (5) 4% (8) Ethnicity .97
Not Hispanic or Latino 86% (330) 86% (173) 86% (157) Hispanic or Latino
Age .78
18–34 35% (134) 36% (71) 34% (61) 35–54 40% (154) 37% (73) 44% (81) 55 or older 25% (95) 28% (55) 22% (40) Education .49 Less than high school or high school diploma/GEDc
24% (93) 25% (49) 24% (44)
Some college 26% (99) 23% (47) 29% (52) Bachelor’s degree 31% (119) 33% (65) 30% (54) Graduate or professional degree
19% (72) 20% (40) 17% (32)
Have child 17 or younger living in household
46% (176) 46% (91) 46% (85) .98
Have at-risk individual living in householdd
34% (130) 40% (80) 27% (50) .04
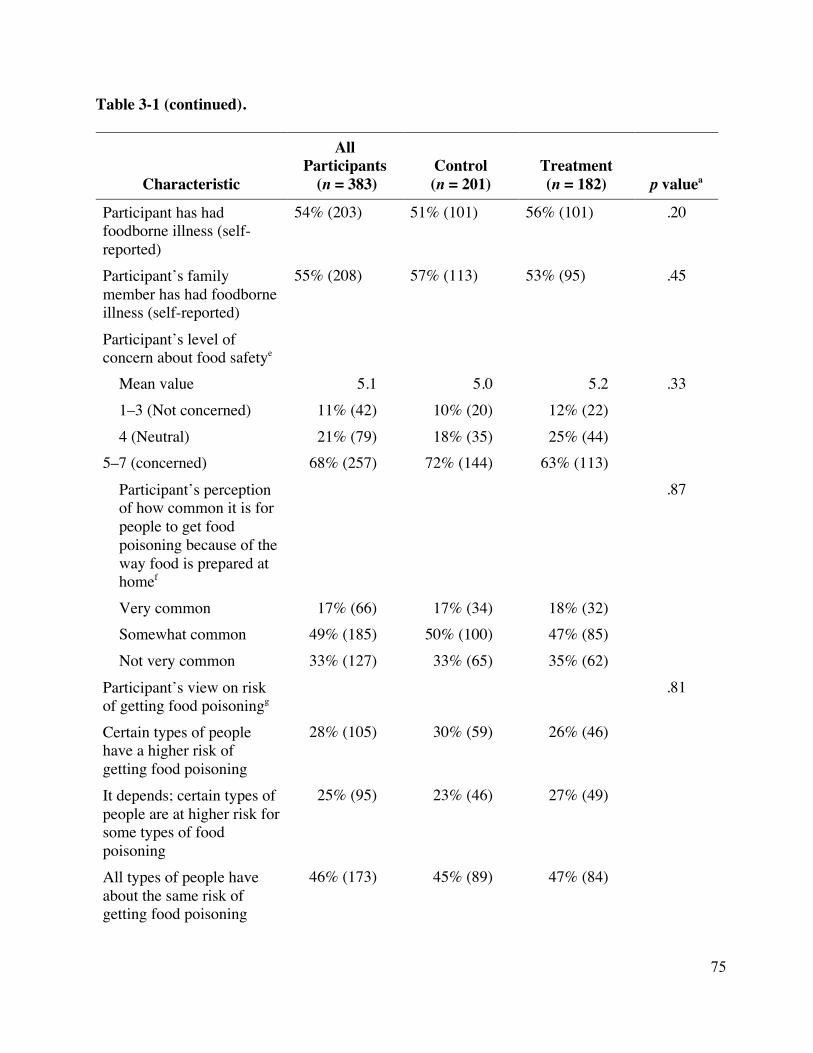
75
Table 3-1 (continued).
Characteristic
All Participants
(n = 383) Control (n = 201)
Treatment (n = 182) p valuea
Participant has had foodborne illness (self-reported)
54% (203) 51% (101) 56% (101) .20
Participant’s family member has had foodborne illness (self-reported)
55% (208) 57% (113) 53% (95) .45
Participant’s level of concern about food safetye
Mean value 5.1 5.0 5.2 .33 1–3 (Not concerned) 11% (42) 10% (20) 12% (22) 4 (Neutral) 21% (79) 18% (35) 25% (44)
5–7 (concerned) 68% (257) 72% (144) 63% (113) Participant’s perception of how common it is for people to get food poisoning because of the way food is prepared at homef
.87
Very common 17% (66) 17% (34) 18% (32) Somewhat common 49% (185) 50% (100) 47% (85) Not very common 33% (127) 33% (65) 35% (62)
Participant’s view on risk of getting food poisoningg
.81
Certain types of people have a higher risk of getting food poisoning
28% (105) 30% (59) 26% (46)
It depends; certain types of people are at higher risk for some types of food poisoning
25% (95) 23% (46) 27% (49)
All types of people have about the same risk of getting food poisoning
46% (173) 45% (89) 47% (84)

76
Table 3-1 (continued).
a We calculated p value significance testing using a t-test for dichotomous variables and repeated measures of analysis of variance (i.e., ANOVA) for continuous variables for the difference between the control and treatment groups for each characteristic.
b Other race includes American Indian or Alaska Native, Asian, Native Hawaiian or Other Pacific Islander, and two or more races.
c Toward the end of data collection, we revised the screening questionnaire to include people with technical or vocational training in this category.
d At-risk populations are people who are 60 years of age or older, children 5 years of age or younger, pregnant women, people diagnosed with diabetes or kidney disease, and people diagnosed with a condition that weakens the immune system.
e Participants were asked the following question in the post-observation interview: “How concerned are you about bacteria or viruses on or inside the food you cook?”
f Participants were asked the following question in the post-observation interview: “How common do you think it is for people in the United States to get food poisoning because of the way food is prepared in their home?”
g Participants were asked the following question in the post-observation interview: “Of the following three statements, which one is closer to your view ...?”
Sources: 2017 meal preparation experiment—data are from the screening questionnaire or post-observation interview (as noted in footnotes). For the post-observation interviews, data are not available for 5 participants because video-recording data are needed to confirm correct participant information (n = 201 control and 182 treatment). The responses for these participants will be included in the final report.

77
Table 3-2. Prevalence of Thermometer Use
Control
(n = 201) Treatment (n = 182) p valuea
Self-reported thermometer ownership
61.2% (123) 63.2% (115) .57
Participants using a thermometer 34.3% (69) 75.3% (137) <.001 Number of total attempts (multiple attempts per observation allowed)b
168 322 <.001
Correct placement (inserted in the side of the patty, to the center)c
22.6% (38) 52.2% (168) <.001
a We calculated p value significance testing using a t-test for dichotomous variables and repeated
measures of analysis of variance (i.e., ANOVA) for continuous variables for the difference between the control and treatment groups for each outcome.
b “Attempt” is defined as a participant using a food thermometer to check the doneness of one or both turkey patties.
c “Correct placement” is defined as a participant inserting the thermometer into the side of the turkey patty to reach the center and held for at least 5 seconds before the temperature is determined. If doneness was checked for both patties, then placement was required to be correct for both patties.
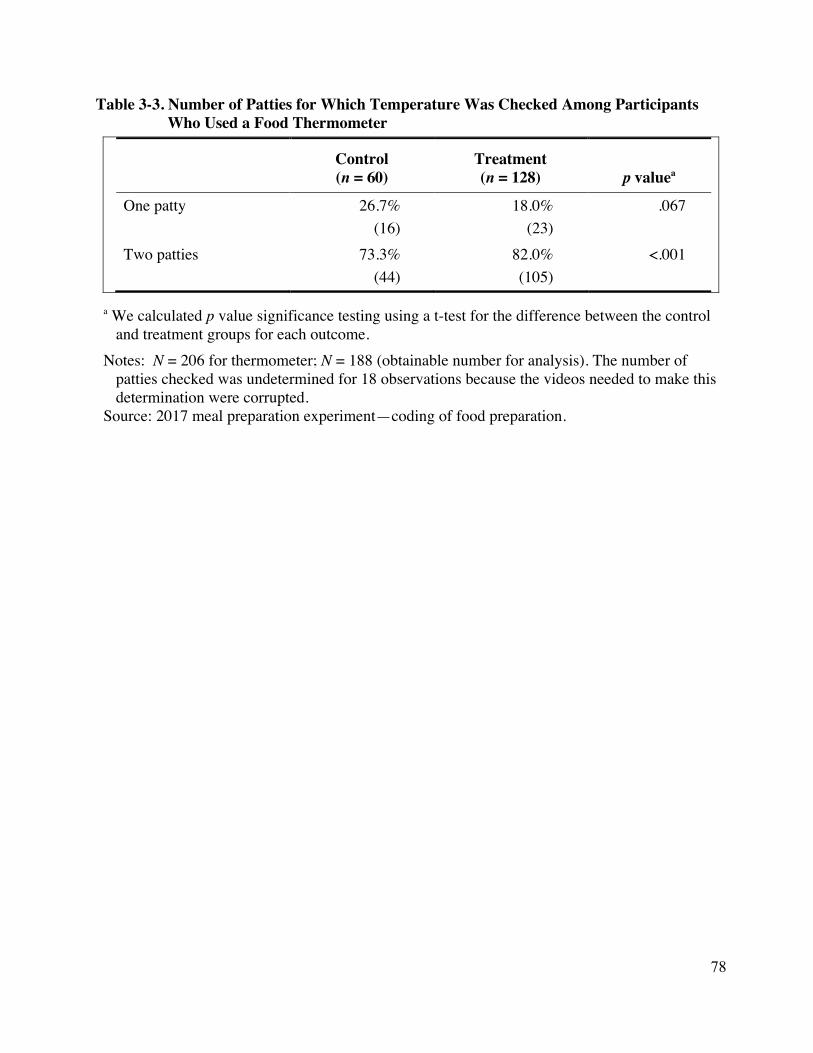
78
Table 3-3. Number of Patties for Which Temperature Was Checked Among Participants Who Used a Food Thermometer
Control (n = 60)
Treatment (n = 128) p valuea
One patty 26.7% (16)
18.0% (23)
.067
Two patties 73.3% (44)
82.0% (105)
<.001
a We calculated p value significance testing using a t-test for the difference between the control and treatment groups for each outcome.
Notes: N = 206 for thermometer; N = 188 (obtainable number for analysis). The number of patties checked was undetermined for 18 observations because the videos needed to make this determination were corrupted.
Source: 2017 meal preparation experiment—coding of food preparation.

79
Table 3-4. Number of Flips per Patty (two patties per participant)
Control
(n = 334 patties) Treatment
(n = 260 patties) p valuea
No flips 10.8% (36) 2.3% (6) <.001
One flip 15.9% (53) 17.3% (45) .394
Two flips 17.1% (57) 25.4% (66) .118 Three or more flips 53.3% (178) 52.8% (137) .089
Used clamshell grill/Foreman grill)
2.4% (8) 1.9% (5)
Baked in oven 0.6% (2) 0.4% (1)
Total 100.0% 100.0%
a We calculated p value significance testing using a t-test for the difference between the control and treatment groups for each outcome.
N = 594 patties (obtainable number for analysis). Source: 2017 meal preparation experiment—coding of food preparation.

80
Table 3-5. Time–Temperature Combinations for Turkey Patties Deemed Safe
Control (n = 44)
Treatment (n = 91) p valuea
Instant 165 °F 54% (24) 73% (66) .008 Time–temperature combinationb
164 °F for 11.2 seconds 0 0 — 163°F for 13.8 seconds 0 0 — 162 °F for 17 seconds 0 0 — 161 °F for 21 seconds 0 0 — 160 °F for 25.8 seconds 0 0 — 155 °F for 72 seconds 0 0 —
a We calculated p value significance testing using a t-test for the difference between the control and treatment groups.
b Time–temperature combinations are from USDA FSIS, Appendix A: Times for given temperature and fat level of turkey needed to obtain 7-log lethality of Salmonella (USDA, FSIS, 2017). Notes: N = 206 for thermometer use; N = 135 (obtainable number). Data are not available for 71 participants because participants submerged the data logger (25 control and 46 treatment recordings unrecoverable). Source: 2017 meal preparation experiment—data logger.

81
Table 3-6. Distribution of the Maximum Internal Temperatures for Burgers Cooked by Participants Using a Food Thermometer
Degrees Control (n = 44) Treatment (n = 91)
165+ 54% (24) 73% (66) 160–164.9 11% (5) 3% (3) 155–159.9 2% (1) 4% (4) 150–154.9 4% (2) 3% (3) 145–149.9 7% (3) 1% (1) 140–144.9 0 0 135–140 0 0 130–135 2% (1) 1% (1) 125–130 2% (1) 2% (2) 120–125 0 0 115–120 0 1% (1) 110–115 0 0 105–110 0 0 100–105 0 0 95–100 0 0 90–95 2% (1) 1% (1) 85–90 0 0 80–85 2% (1) 2% (2) 75–80 4% (2)
2% (2)
70–75 5% (2) 3% (3) 65–70 2% (1) 2% (2) 60–65 0 0 Total 100% (44) 100% (91)
Notes: N = 206 for thermometer use, N = 135 (obtainable number). Data are not available for 71 participants because participants submerged the data logger (25 control and 46 treatment recordings unrecoverable).
Source: 2017 meal preparation experiment—data logger.

82
Table 3-7. Methods Used to Determine Doneness of Burgers Cooked by Participants Who Did Not Use a Food Thermometer
Method Source
Control (n = 122)
Treatment (n = 30)
p valuea
Only used color Self-reported: inside color 25% (33) 16% (7) .27 Self-reported: outside color
0% (0) 7% (3)
Observations 4% (5) 17% (5) .88
Only used touch (firmness or texture of burger)
Self-reported 5% (7) 5% (2) .92 Observations 46% (56) 30% (9) .11
Used more than one method (color and touch)
Self-reported 70% (93) 71% (29) .92
Observations 26% (32) 43% (13) .09
Unobservable method (e.g., cooking time)
Observations 24% (29) 10% (3) .16
Total Self-reported/observations 100% 100% a We calculated p value significance testing using a t-test for the difference between the control
and treatment groups for each method. Notes: N = 177; N = 135 (obtainable number); data are not available for 42 participants. The
unobservable methods include participants who relied on cooking time and those who might have looked at the outside color (without touching the patty).
Sources: 2017 meal preparation experiment—coding of food preparation (observed) and screening questionnaire data (self-reported usual behavior).

83
Table 3-8. Other Methods Used to Determine Doneness by Participants Who Used a Food Thermometer
Method Source Control (n = 55)
Treatment
(n = 123) p
valuea
Only used thermometer Self-reported 6% (4) 5% (7) .87 Observations 32% (18) 42% (52) .28
Only used color Self-reported: inside color 19% (13) 26% (36) .30 Self-reported: outside color
0% (0) 0% (0)
Observations 0% (0) 0% (0)
Only used touch (firmness or texture of burger)
Self-reported 1% (1) 1% (2) .97 Observations 0% (0) 0% (0)
Used more than one method Self-reported 30% (50) 68% (97) .38 Observations 66% (37) 58% (71)
Method used, if more than one method used (from observations)
Used therm. & color 70% (26) 81% (57) .93
Use therm. & touch 3% (1) 4% (3) .53 Use therm., touch, &
color 27% (10) 15% (11) .13
Total Self-reported/observations 100% 100%
a We calculated p value significance testing using a t-test for the difference between the control and treatment groups for each method.
Notes: N = 206; N = 178 (obtainable number); data are not available for 28 participants. Sources: 2017 meal preparation experiment—coding of food preparation

84
FIGURES
Figure 3-1. Turkey Patty with Heat Maps Showing Thermometer Placement by Group
Note: “North” is the part of the pan that is farthest from the participant. The red-shaded portions within the patty indicate where most participants placed the thermometer, while the blue-shaded portions indicate where fewer participants placed the thermometer in the patty. Number of participants who used a food thermometer = 69 control group and 137 treatment group. Source: 2017 meal preparation experiment—coding of food preparation.
North
East
South
West
Control
North
East
South
West
Treatment

85
Figure 3-2. Study Procedures for Meal Preparation Study on Thermometer Use

86
Figure 3-3. Thermometer Use Decision Tree

87
REFERENCES
1. Anderson, J. B., Gee, E., Mendenhall, V. T., Shuster, T. A., Hansen, K., & Volk, A. (2004).
A camera’s view of consumer food handling and preparation practices. Journal of the
American Dietetic Association, 104, 186–191.
2. Batz, M. B., Hoffmann, S., & Morris, J. G. (2012). Ranking the disease burden of 14
pathogens in food sources in the United States using attribution data from outbreak
investigations and expert elicitation. Journal of Food Protection, 75(7), 1278–91.
https://doi.org/10.4315/0362-028X.JFP-11-418
3. Bean, N. H., Goulding, J. S., Lao, C., & Angulo, F. J. (1996). Surveillance for foodborne-
disease outbreaks — United States, 1988–1992. Morbidity and Mortality Weekly Report,
45(SS-55), 1–66.
4. Bruhn, C. 2014. Chicken preparation in the home: an observational study. Food Prot. Trends
34:318–330. Available at: http://www.foodprotection.org/files/food-protection-trends/Sep-
Oct-14-Bruhn.pdf. Accessed 13 September, 2017.
5. Chapman, B., Eversley, T., Fillion, K., MacLaurin, T., & Powell, D. (2010). Assessment of
food safety practices of food service food handlers (risk assessment data): Resting a
communication intervention (evaluation of tools). Journal of Food Protection, 73, 1101–
1107
6. Clayton, D. A., & Griffith, C. J. (2004). Observation of food safety practices in catering
using notational analysis. British Food Journal, 106(3), 211–227.
7. Crowne, D.P., Marlowe, D. (1964) The approval motive. New York: Wiley.
88
8. DeDonder, S., Jacob, C. J., Surgeoner, B. V., Chapman, B., Phebus, R., & Powell, D. A.
(2009). Self-reported and observed behavior of primary meal preparers and adolescents
during preparation of frozen, uncooked, breaded chicken products. British Food Journal, 11,
915–929.
9. Font-i-Furnols, M., & Guerrero, L., Consumer preference, behavior, and perception about
meat and meat products: An overview Retrieved from
http://dx.doi.org/10.1016/j.meatsci.2014.06.025
10. Green, L. R., Selman, C. A., Radke, V., Ripley, D., Mack, J. C., Reimann, D. W., Stigger, T.,
… Bushnell, L. (2006). Food worker hand washing practices: An observation study. Journal
of Food Protection, 69, 2417–2423.
11. Hughes, M., & Franks, I. (1997). Notational analysis of sport. London: E. & F. N. Spon.
12. International Food Information Council. (2016). 2016 Food and Health Survey. Retrieved
from http://www.foodinsight.org/sites/default/files/2016-Food-and-Health-Survey-
Report_FINAL1.pdf
13. Jobe, J. B., R. Tourangeau, and A. F. Smith. 1993. Contributions of survey research to the
understanding of memory. Appl. Cogn. Psychol. 7:567–584.
14. Lando, A., Verrill, L., Liu, S., & Smith, E. (2016). 2016 FDA Food Safety Survey. Retrieved
from
https://www.fda.gov/downloads/Food/FoodScienceResearch/ConsumerBehaviorResearch/U
CM529453.pdf
89
15. Luchansky, J. B., Porto-Fett, A. C. S., Shoyer, B. A., Phillips, J., Chen, V., Eblen, D.R.,
Cook, V., … Bauer, N. (2013). Fate of shiga toxin-producing O157:H7 and non-O157:H7
Escherichia coli cells within refrigerated, frozen, or frozen then thawed ground beef patties
cooked on a commercial open-flame gas or a clamshell electric grill. Journal of Food
Protection, 76(9), 1500–1512.
16. Redmond, E. C., & Griffith, C. J. (2003). Consumer food handling in the home: A review of
food safety studies. Journal of Food Protection, 66(1), 130–161.
17. Redmond, E. C., Griffith, C. J., Slader, J., & Humphrey, T. J. (2004). Microbiological and
observational analysis of cross contamination risks during domestic food preparation. British
Food Journal, 106(8), 581–97.
18. Taylor, E. V., Holt, K. G., Mahon, B. E., Ayers, T., Norton, D., & Gould, L. H. (2012).
Ground Beef Consumption Patterns in the United States, FoodNet, 2006 through 2007.
Journal of Food Protection, 75(2), 341–346. https://doi.org/10.4315/0362-028X.JFP-11-333
19. U.S. Food and Drug Administration (FDA). (2013). Food code. Retrieved from
http://www.fda.gov/downloads/Food/GuidanceRegulation/RetailFoodProtection/
FoodCode/UCM374510.pdf
20. World Health Organization. (2014). Food safety: Microbiological risks. Retrieved from
http://www.who.int/entity/foodsafety/areas_work/microbiological-risks/en/index.html
21. Yang, X., Devos, J., & Klassen, M. D. (2017). Inactivation of Escherichia coli O157:H7 in
minute steaks cooked under selected conditions. Journal of Food Protection, 80(10), 1641–
1647.

90
22. Yeung, R. M. W., & Morris, J. (2001). Consumer perception of food risk in chicken meat.
Nutrition & Food Science, 31, 270–279. https://doi.org/10.1108/00346650110409092

91
CONCLUSIONS
The current literature for consumer food safety studies is mostly survey (questionnaire
and interview) data. The research focuses in on the recommended consumer handling practices
of “clean”, “cook”, “separate”, and “chill”. Although surveys may ask questions on the “cook”
aspect, the majority focus on “clean” and “separate”. With survey data, there is a limitation of
respondents’ self-reported practices. Participants may be more likely to report an answer they
deem to be “acceptable” or “correct” rather than what they truly do at home when cooking.
These limitations can be overcome with a mixed-methods approach. Citizen science has utilized
pictures in order to generate data in addition to what is being self-reported. Researchers have
started observing consumer practices in addition to asking about them. Observations address
issues associated with self-reporting, but limited research has been conducted with observations
looking consumer food handling practices in the home. Similar to the survey studies on
consumer food handling, many focus on the recommended practices of “clean” and “separate”.
Most of the observations conducted are of smaller sample size while the meal preparation study
related to thermometer use has a sample size of n=383 participants.
The studies that are outlined in this thesis use a mixed-methods data collection methods
to gather consumer thermometer usage behaviors. The citizen science study shows that
consumers prefer to use a dial thermometer over a digital one when determining turkey doneness
(Chapter 2). Studies have shown inaccuracies with using a dial thermometer due to the need for
calibration and to insert the stem further in since the temperature-sensitive point is not the tip.
Research should explore ownership of thermometer types in the future. Additionally, an
emphasis on the type of thermometer being used should be considered by those developing
messaging.

92
The meal preparation study results show how thermometer use can be impacted by an
intervention video. Consumers are using this messaging in the short-term, but no follow-up is
done to see if there is actual behavior change. Future research should explore the long-term
impact of interventions like the consumer messaging videos.
Consumers are using food thermometers, but may incorrectly place the thermometer or
severely undercook or overcook their meat products. Consumers attempt to use a thermometer
but fail to correctly place the thermometer during measurements. Most consumers measuring
their whole turkeys or ground turkey burgers are going above the recommended internal
temperature of 165°F, with many hitting 180°F or higher. Somewhat concerning is the small
percentage of participants who are drastically undercooking their meat when using a
thermometer. Consumers are aware of thorough cooking with using a thermometer. The future
messaging should be tailored towards proper thermometer usage incorporating messages of
correct proper thermometer insertion/placement in foods and emphasis of temperature values.
Current studies and messaging have looked at and emphasized thermometer use and why
subjective indicators should not be used. Educational materials on thermometer use should
continue to emphasize that subjective indicators of doneness are not reliable, and using a food
thermometer is the only way to ensure foods are cooked to a safe internal temperature. Limited
studies have been conducted looking at burger flipping (Chapter 3). Information is not readily
available on flipping for thorough heating even though there is literature suggesting it may play a
role in pathogen reduction. Future messaging should incorporate messages on flipping
frequently.
Very few studies have been conducted with ground poultry as the primary product of
focus. The food safety consumer literature currently focuses on whole cuts of poultry, ready-to-
93
eat poultry products, or ground beef hamburgers. Current messaging such as the USDA Food
Safety video “The Importance of Cooking to a Safe Internal Temperature and How to Use a
Food Thermometer”, provides adequate messaging on determining burger doneness for beef
burgers by addressing subjective indicators such as color and touch, and the usage of a
thermometer to at least 160°F; however, poultry burgers have different doneness parameter such
as being needed to be cooked to 165°F and the differences in meat color before and after
cooking.
Providing general information about the risks associated with not using a thermometer is
not enough. Consumers practice safe food behavior only when they perceive a direct risk to
themselves. Consumer knowledge and awareness of foodborne illness and pathogens does not
always lead to a positive change in food handling behavior. Some consumers may continue to
improperly use a thermometer, or not use one at all even after being exposed to interventions.
Food safety messaging should be risk-focused instead of generalized to be more relatable to
individuals. The USDA intervention video does an excellent job of using a narrative, storytelling
format to connect consumers this scientific information. The intervention’s focus on a nuclear
family can be relatable for meal preparers, but might distant some who are unable to relate to
characteristics that the family has. Future messaging should look to explore other narratives and
scenarios. Additionally, future research studies done in the future should learn more about
consumer attitudes and behaviors to create awareness of safe food handling practices, to promote
public trust and credible source information, to encourage food safety education, to create
familiarity, and to incorporate everyday context into food safety communication.

94
APPENDICES

95
Appendix A
Screening Questionnaire
Hello. My name is _______________. Thank you for your interest in our research study, which is funded by the U.S. Department of Agriculture and conducted by researchers from North Carolina State University and RTI International. If you are eligible for the study, you will be asked to prepare two recipes while being videotaped and participate in an interview at a day and time convenient for you. The study will last no more than 2 hours, and you will receive $75 and a small gift for taking part in the study. To determine whether you are eligible, I need to ask you a few questions. These questions will take less than 10 minutes to complete. Your participation in this study is completely voluntary. All of your answers and your contact information will be kept private. May I please ask you a few questions to determine whether you are eligible to participate in our study?
☐ Yes ☐ No → Refusal. Terminate.
1. Great! Let’s get started then. When it comes to grocery shopping in your household, would you say…? (Read list. Select one.) ☐ You do all of it. ☐ You do most of it. ☐ You do about half of it. →Ineligible. Terminate. ☐ Someone else does most of it; you do some of it. →Ineligible. Terminate. ☐ Someone else does all of it. →Ineligible. Terminate.
2. Have you ever received any type of food safety training, such as ServSafe? (Select one.) ☐ Yes → Ineligible. Terminate. ☐ No
3. Have you ever cooked or worked professionally in a food preparation setting? (Select one.) ☐ Yes →Ineligible. Terminate. ☐ No
4. Are you a vegetarian or vegan? (Select one.) ☐ Yes → Ineligible. Terminate. ☐ No
5. How many times per week do you prepare a meal at home? (Read list. Select one.) ☐ Never →Ineligible. Terminate. ☐ 1 to 3 times per week → Ineligible. Terminate. ☐ 4 or more times per week

96
6. In the past three months, have you, yourself, prepared and cooked a meal using any of the following foods? (Read list. Select all that apply.) ☐ Raw turkey or chicken ☐ Raw beef ☐ Raw pork ☐ None of the above (DO NOT READ) → Ineligible. Terminate.
7. When following a recipe for the first time, do you…? (Read list. Select one.) ☐ Read the whole recipe before you start cooking ☐ Read the recipe while you are cooking
8. Which of the following items do you have in your kitchen? (Read list. Select all that apply.) ☐ Chef’s knife ☐ Garlic press ☐ Citrus zester ☐ Food thermometer to check the doneness of meat/poultry ☐ Manual can opener ☐ Can puncher ☐ Cheese grater ☐ Wine opener ☐ Corkscrew ☐ None of the above (DO NOT READ)
9. Imagine you are cooking hamburgers at home for dinner. How do you determine whether the burgers are done and ready to eat? Do you…? (Read list. Select all that apply.) ☐ Rely on cooking time ☐ Insert a knife, toothpick, or other utensil into one of the burgers, and check to see that it
comes out clean ☐ Use a food thermometer ☐ Cut one of the burgers and check that it is no longer pink or red in the middle ☐ Check that the outside of the burger is the right brownness ☐ Touch one of the burgers with your finger to see if it is firm ☐ Taste one of the burgers
10. Which of the following categories best describes your age? (Read list. Select one.) ☐ Under 18 →Ineligible. Terminate. ☐ 18 to 34 [RECRUIT 28%] ☐ 35 to 54 [RECRUIT 36%] ☐ 55 or older [RECRUIT 36%]
11. Are you Hispanic or Latino? (Select one.) ☐ Yes [RECRUIT 17%] ☐ No [RECRUIT 83%]

97
12. What is your race? (Read list. Select all that apply.) ☐ American Indian or Alaska Native ☐ Asian ☐ Black or African American ☐ Native Hawaiian or Other Pacific Islander ☐ White [RECRUIT ≤74%]
13. What is the highest level of education that you have completed? (Read list. Select one.)1 ☐ Less than high school or high school graduate or GED [RECRUIT 42%] ☐ Some college or 2-year degree [RECRUIT 29%] ☐ College degree [RECRUIT 18%] ☐ Post-graduate degree [RECRUIT 11%]
14. Do you have any children living in your household who are less than 18 years of age? (Select one.) ☐ Yes [RECRUIT 66%] ☐ No [RECRUIT 34%]
15. Are you or any members of your household …? (Read list. Select all that apply.) ☐ 60 years of age or older ☐ 5 years of age or younger ☐ Pregnant ☐ Breastfeeding ☐ Diagnosed with an allergy to any food or food ingredient ☐ Diagnosed with diabetes or kidney disease ☐ Diagnosed with a condition that weakens the immune system, such as cancer, HIV, or
AIDS; a recipient of a transplant; or receiving treatments, such as chemotherapy, radiation, or special drugs or medications to treat these conditions
☐ None of the above (DO NOT READ)
16. Where did you hear about this study? (DO NOT READ. Select all that apply.) ☐ Post on social media Specify: __________________________ ☐ Email from the Expanded Food and Nutrition Education Program ☐ Sign in grocery store ☐ Don’t know
17. Great! You qualify for the study. Would you like to participate in the study? ☐ Yes ☐ No → Terminate.
1 Toward the end of data collection, we revised the screening criteria to include people with a technical or vocational training in the “Less than high school or high school graduate or GED” category.

98
Great! We are conducting the interviews the week of [DATE]. The interviews will be held each day between [TIME] and [TIME]. The study will last no more than 2 hours, and you will receive $75 and a small gift for taking part in the study. What day and time is convenient for you to participate?
[SCHEDULE DAY AND TIME]
I have you scheduled for [DATE] at [TIME]. Your interview will last 2 hours and will be held on NC State’s campus. May I please have your name, telephone number, and email address so we can send you a confirmation email with directions?
[ENTER NAME]
[ENTER TELEPHONE NUMBER] [ENTER EMAIL ADDRESS].
☐ No Email [If no email] May I please have your mailing address? [ENTER STREET ADDRESS, CITY, NC, ZIP]
Thank you for your time.
If you have any questions about the study or need to reschedule or cancel, you may contact [NAME] at [PHONE NUMBER]. If you have concerns about how participants are being treated in the study, you may contact North Carolina State University’s Office of Research Protection at 919-515-4514.
Ineligible/Terminate Screen Thank you for your time. Unfortunately you are not eligible to take part in our study. Have a great day. According to the Paperwork Reduction Act of 1995, an agency may not conduct or sponsor, and a person is not required to respond to, a collection of information unless it displays a valid OMB control number. The valid OMB control number for this information collection is 0583-0169 and the expiration date is 06/30/2018. The time required to complete this information collection is estimated to average 8 minutes per response, including the time for reviewing instructions, searching existing data sources, gathering and maintaining the data needed, and completing and reviewing the collection of information.

99
Appendix B: Observation Script and Recipes
Check-in Script
Welcome! My name is , and I’ll be walking you through what you’ll be doing as part of our study today. Today you will be preparing two recipes: a salad and turkey burgers, and we will interview you after you finish cooking. The cooking and interview will last no more than 2 hours total. Before we start, I need you to read and sign the consent form. Please let me know if you have any questions or concerns. You will receive a copy of the form to take home. We have a few more items to prepare before you begin. While you wait, please watch this video (provide iPad, video depends on random number assignment for participant).
Observation Script Hello, my name is _______, and I’ll be walking you through what you’ll be doing as part of our study today. Today you will be preparing two recipes to test a new product formulation: a salad and turkey burgers. The recipes are provided on this card, one recipe is on the front and one is on the back. Prepare the foods in the order that you would usually do so at home. After preparing the recipes, please clean up the kitchen as you normally would at home. We will interview you after you are finished cooking. The cooking and interview will last no more than 2 hours total. This is the area where you will be cooking. All the available utensils and dishes are in these drawers/cabinets (indicate). Feel free to use whatever you need. Please make yourself at home, you are welcome to use your phone to listen to music, or whatever you usually do when cooking at home.
Restrooms are located ______, and in case of an emergency, the exits are ______. The fire extinguisher is located ________ , and the first aid kit is located _________________. Before you begin, do you have any questions?
If you have any questions or concerns while you’re cooking, I will be in the office next door. Before you eat anything, please let us know when you are finished cooking by pushing this button.

100
[after cooking] Now that you have finished the cooking portion of the study, we are ready to begin the interview. It should take no more than 20 minutes to complete. Do you need a break before we begin that portion?

101
Turkey Burger Recipe [Note: The two recipes were printed front-and-back on a laminated card.]
Ingredients For the patties: ● 2 turkey burger patties ● Salt ● Pepper ● Garlic powder ● Onion powder
For serving: ● Hamburger buns ● Sliced tomato ● Sliced onion
Directions
1. Season the burger patties with salt, pepper, garlic powder and onion powder on both sides.
2. Cook the burgers at medium-high heat to your desired level of doneness. 3. Assemble cooked burgers with sliced tomato and sliced onion
Chef’s Salad
Salad Ingredients ● 2 stalks romaine lettuce ● Salt and pepper ● 1 cup dressing (recipe below) ● 3/4 cup shredded Swiss cheese ● 3/4 cup ham ● 1 hot house tomato
Dressing Ingredients ● 1/2 cup olive oil ● 1/4 cup balsamic vinegar ● 1 teaspoon honey ● 1 teaspoon Dijon mustard ● 1 shallot, minced ● 1 clove garlic, minced ● Salt and ground pepper to taste
Directions
1. Cut lettuce into bite-size pieces 2. Cut ham into matchstick-sized pieces 3. Dice tomato 4. Mix all ingredients together 5. Serve with dressing on the side

102
Appendix C. Informed Consent
North Carolina State University INFORMED CONSENT FORM for RESEARCH Study title: Food preparation in the home Principal Investigator: Dr. Ben Chapman, [email protected], 919-515-8099
Introduction
You are being asked to take part in a research study. Your participation in this study is voluntary. You have the right to be a part of this study, to choose not to participate or to stop participating at any time without penalty. The purpose of research studies is to gain a better understanding of a certain topic or issue. You are not guaranteed any personal benefits from being in a study. Research studies also may pose risks to those that participate. In this consent form you will find specific details about the research in which you are being asked to participate. If you do not understand something in this form it is your right to ask the researcher for clarification or more information. A copy of this consent form will be provided to you. If at any time you have questions about your participation, do not hesitate to contact the researcher(s) named above.
Purpose
This research study is being conducted by RTI International and North Carolina State University (NCSU), with funding from the U.S. Department of Agriculture’s (USDA’s) Food Safety and Inspection Service (FSIS). The purpose of the study is to test several recipes. You are one of approximately 400 adults who will participate in this study.
Procedures
If you agree to participate, you will be asked to prepare two recipes while being video recorded. These recipes may include frying, grilling, baking, microwaving, cutting, slicing and preparing meats and vegetables. You will also be asked to take part in a short interview after preparing the recipes. The interview will ask about your food preparation practices. We will use the recordings and interview findings to prepare a summary report; however, your identity will not be associated with your behaviors in any reports.
Study Duration
Your participation in this study, including preparing the recipes and being interviewed, will take no more than 2 hours.
Possible Risks or Discomforts
There are minimal psychological, social, or legal risks to participating in this study. You will be asked to prepare two recipes in a kitchen and complete a short interview. Your participation is voluntary, and you can choose to remove yourself from the study at any time. There are minimal risks to you as a preparer of food as there are heat sources (stove, oven, counter top grill) and sharp objects that may result in cuts
OMB Control Number: 0583-XXXX Expiration date: XX/XX/XXXX
103
(knives, forks, slicers). The items and appliances are common home kitchen equipment; we anticipate that the risk of injury is the same as the risk if you were preparing food in your own home. Each study kitchen is equipped with a first aid kit and fire extinguisher. Researchers will be available just outside of the kitchen to assist in case of injury by providing the first aid kits and alerting medical staff if needed. There is no provision for free medical care for you if you are injured as a result of this study.
Benefits
There are no direct benefits to you from participating in this study. Knowledge may be gained that can help others.
Payment for Participation
You will receive $75 for your participation and a free gift.
Confidentiality
Video information will be shared with the RTI and NCSU study team. Because videos include visual information about participants, they are not considered to be de-identified. However, your name will not be connected to the recording of your recipe preparation or your interview responses. All data will be identified by a unique identification number and stored securely. At the completion of this study, the recordings will be destroyed.
The Institutional Review Board (IRB) at NCSU has reviewed this research. An IRB is a group of people who help make sure that research is compliant with federal laws and that participants’ rights are not violated and protected. The IRB may review the records of your participation in this research to ensure that proper procedures were followed. A representative of the IRB may contact you for information about your experience with this research. This representative will be given your name but will not be given any of your confidential study data. If you wish, you may refuse to answer any questions this person may ask.
Future Contacts
We will not contact you in the future.
Your Rights
Your decision to take part in this research study is completely voluntary. You can stop participating at any time, and you can refuse to answer any question. If you decide to participate and later change your mind, you will not be contacted again or asked for further information.
Your Questions
If you have any questions about the study, you may call Benjamin Chapman of NCSU at 919-515-8099. if you have any questions regarding your rights as a research participant, please contact Deb Paxton NCSU’s IRB Office at 919-515-4514.

104
YOU WILL BE GIVEN A COPY OF THIS CONSENT FORM TO KEEP.
Your signature below indicates that you have read the information provided above, have received answers to any questions you may have, and have freely decided to participate in this research. By agreeing to participate in this research, you are not giving up any of your legal rights.
_______________________________________ Date Signature of Participant
_______________________________________ Printed Name of Participant I certify that the nature and purpose, the potential benefits, and possible risks associated with participating in this research have been explained to the above-named individual.
______________________________________ Date Signature of Person Obtaining Consent
_______________________________________ Printed Name of Person Obtaining Consent
According to the Paperwork Reduction Act of 1995, an agency may not conduct or sponsor, and a person is not required to respond to, a collection of information unless it displays a valid OMB control number. The valid OMB control number for this information collection is 0583-XXXX and the expiration date is XX/XX/201X. The time required to complete this information collection is estimated to average 1 minute per response, including the time for reviewing instructions, searching existing data sources, gathering and maintaining the data needed, and completing and reviewing the collection of information.

105
Appendix D: List of Equipment Provided in Each Test Kitchen
The picture below shows one of the test kitchens used for the meal preparation experiment. The equipment provided in each test kitchen is listed below.
Kitchenware Grill ❏ George Foreman grill
Skillet ❏ Medium sized skillet (9-12 inch)
Frying pans (store frying pans in the cabinets) ❏ Small (8 inch) non-stick ❏ Medium or large (10-12 inch)
Sauce pans ❏ Small (2-3 quarts)

106
❏ Medium or large (4-5 quarts) Knives ❏ Chef’s knife ❏ Paring knife/fruit knife
Baking dishes ❏ 9x13 baking dish (rectangular) ❏ Smaller square, rectangular, or oval baking dish
Utensils ❏ Wooden or plastic stirring spoons (1-2) ❏ Heat-resistant plastic or silicone spatula ❏ Slotted spoon ❏ Ladle ❏ Flat spatula (for flipping burgers) ❏ Cooking tongs ❏ Digital tip-sensitive instant read thermometer ❏ Dry measuring cups ❏ Liquid measuring cup (1 cup) ❏ Measuring spoons ❏ Can opener ❏ Liquid measuring cup (2 cup) ❏ Whisk ❏ Rolling pin ❏ Peeler ❏ Zester/grater ❏ Large cutting boards ❏ Splatter guard ❏ Serving bowl ❏ Serving utensils (serving fork, spoon, and tongs) ❏ Salt and pepper shaker (must be glass) ❏ Garlic and onion powder ❏ Utensil holder
Other essential tools ❏ Small, medium, and large mixing bowls ❏ Colander ❏ Salad spinner
Silverware/Dinnerware ❏ Set of spoons, knives and forks

107
❏ Dinner plates ❏ Salad plates ❏ Bowls
Cleaning/dishwashing supplies ❏ Kitchen towels ❏ Dish cloths ❏ Hand soap ❏ Dish drain board/dish rack ❏ Paper towels ❏ Sponge ❏ Sponge caddy ❏ Paper towel holder ❏ Apron ❏ Oven mitts ❏ Pot holders ❏ Dishwashing detergent
Cleaning stuff for under sink
● Bucket ● Windex ● Simple green cleaner ● Clorox bleach ● 409 cleaner ● Lysol spray
Leftover kit supplies ❏ Ziploc bags (gallon and quart sizes) ❏ Plastic wrap ❏ Plastic containers with lids
Note: Containers must be sanitized between observation events. Ziploc bags and plastic wrap must be taken out of retail packaging and placed in kitchen drawers. Housekeeping items ❏ Trash can for kitchen (13 gallon, with a cover but no step to open feature). Note: position
the trash can near the cooking area. ❏ Trash bags (13 gallon) ❏ First-Aid Kit ❏ Label maker ❏ Toolbox

108
Electronics ❏ Tool boxes ❏ Gaffer tape ❏ Blue painter’s tape ❏ Super glue ❏ Scissors ❏ HDMI cable (25 feet, 2x) ❏ HDMI female-to-female adapter ❏ Zip ties (11 inch) ❏ Surge protector (2x) ❏ Gallon Ziplocs ❏ AAA batteries (batteries for label maker) ❏ AA batteries (batteries for mouse)
Paperwork ❏ Gift cards ❏ Thermometers
Cameras ❏ Tripods
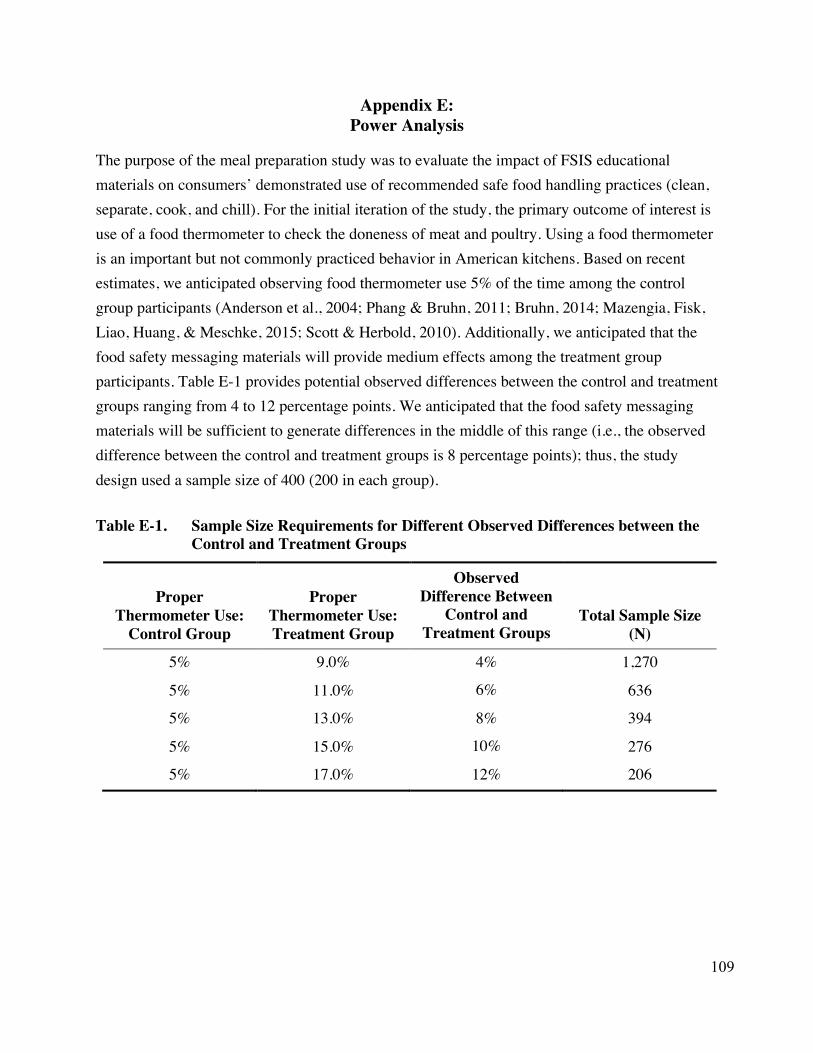
109
Appendix E: Power Analysis
The purpose of the meal preparation study was to evaluate the impact of FSIS educational materials on consumers’ demonstrated use of recommended safe food handling practices (clean, separate, cook, and chill). For the initial iteration of the study, the primary outcome of interest is use of a food thermometer to check the doneness of meat and poultry. Using a food thermometer is an important but not commonly practiced behavior in American kitchens. Based on recent estimates, we anticipated observing food thermometer use 5% of the time among the control group participants (Anderson et al., 2004; Phang & Bruhn, 2011; Bruhn, 2014; Mazengia, Fisk, Liao, Huang, & Meschke, 2015; Scott & Herbold, 2010). Additionally, we anticipated that the food safety messaging materials will provide medium effects among the treatment group participants. Table E-1 provides potential observed differences between the control and treatment groups ranging from 4 to 12 percentage points. We anticipated that the food safety messaging materials will be sufficient to generate differences in the middle of this range (i.e., the observed difference between the control and treatment groups is 8 percentage points); thus, the study design used a sample size of 400 (200 in each group).
Table E-1. Sample Size Requirements for Different Observed Differences between the Control and Treatment Groups
Proper Thermometer Use:
Control Group
Proper Thermometer Use: Treatment Group
Observed Difference Between
Control and Treatment Groups
Total Sample Size (N)
5% 9.0% 4% 1,270
5% 11.0% 6% 636
5% 13.0% 8% 394
5% 15.0% 10% 276
5% 17.0% 12% 206