mini high temperature test unit final design report
TRANSCRIPT

Prepared for: Erik Brown
(Lawrence Livermore National Laboratory)
Prepared by:
Team Daedalus June 15, 2017
Kevin Liu Pablo Castillo
[email protected] [email protected]
Instructor:
Dr. Peter Schuster
Mechanical Engineering Department California Polytechnic State University
San Luis Obispo
Mini High Temperature Test Unit
Final Design Report

[1]
TABLE OF CONTENTS STATEMENT OF DISCLAIMER ................................................... 3
EXECUTIVE SUMMARY .............................................................. 4
1. INTRODUCTION ................................................................... 5
2. BACKGROUND .................................................................... 9
2.1. HISTORY OF HEPA FILTERS ............................................................................................................ 9 2.2. SCIENTIFIC LITERATURE AND TRADE PUBLICATIONS .......................................................................... 9 2.2.1. HEPA Filters and Filter Testing ............................................................................................. 9 2.2.2. Air Filtration at High Temperatures ....................................................................................... 9 2.2.3. Current Technology ............................................................................................................. 10 2.2.4. Team Phoenix: MHTTU ...................................................................................................... 10 2.2.5. Cellular Materials International Inc.: Overhead Thermal Testing Rig (OTTR) .................... 11 2.2.6. Mississippi State Institute for Clean Energy Technology: Generic Filter Test Stand .......... 12 2.2.7. Advanced Thermal Solutions: CLWT-115 Closed Loop Wind Tunnel ................................ 13 2.3. DEPARTMENT OF ENERGY STANDARDS FOR HEPA FILTERS ........................................................... 13 2.4. CUSTOM HEATER .......................................................................................................................... 14 2.5. CONTROLS SYSTEMS ..................................................................................................................... 14 2.6. INSULATION ................................................................................................................................... 15
3. DESIGN DEVELOPMENT ................................................... 16
3.1. DISCUSSION OF CONCEPTUAL DESIGNS .......................................................................................... 16 3.2. DESIGN ITERATION PROCESS ......................................................................................................... 17 3.3. DECISION MATRIX DEVELOPMENT .................................................................................................. 21 3.4. SAFETY REVIEW AND OPERATING PROCEDURE ............................................................................... 25
4. DESCRIPTION OF FINAL DESIGN .................................... 26
4.1. OVERALL DESIGN DESCRIPTION ..................................................................................................... 26 4.1.2. Geometry Modifications ...................................................................................................... 27 4.1.3. Controls ............................................................................................................................... 28 4.2. MATERIAL, GEOMETRY AND COMPONENT SELECTION ...................................................................... 32 4.2.1. Refractory Cement .............................................................................................................. 32 4.2.2. Cost Analysis ....................................................................................................................... 33
5. PRODUCT REALIZATION .................................................. 34
5.1. VIEWPORT MODIFICATIONS ............................................................................................................ 35 5.2. MANUFACTURING OF MODIFIED INLET TEST CHAMBER .................................................................... 36 5.2.5. DATA RECORDING DEVICES ........................................................................................................... 39 5.3. ASSEMBLY OF CONTROL SYSTEM ................................................................................................... 40 5.4. HARDWARE CHANGES TO REALIZED PROTOTYPE VS. FINAL DESIGN ................................................ 41 5.5. CONTROL SYSTEM CHANGES TO REALIZED PROTOTYPE VS. FINAL DESIGN ...................................... 41
6. DESIGN VERIFICATION ..................................................... 41
6.1. MAXIMUM TEMPERATURE AND WARM-UP TIME TEST OF MAIN HEATER ONLY ................................... 42 6.2. MAXIMUM TEMPERATURE AND WARM-UP TIME TEST OF MAIN HEATER AND BAND HEATER ............... 43 6.3. UNCERTAINTY AND ERROR PROPAGATION ...................................................................................... 44 6.4. DESIGN VERIFICATION PLAN AND REPORT ...................................................................................... 44

[2]
7. CONCLUSIONS AND RECOMMENDATIONS ................... 45
WORKS CITED ........................................................................... 46
APPENDICES ............................................................................. 48
APPENDIX A – IDEA SELECTION PROCESS AND MATRICES .......................................................................... 48 QUALITY FUNCTION DEPLOYMENT ............................................................................................................. 48 PUGH MATRICES ....................................................................................................................................... 49 Airflow Control ......................................................................................................................................... 49 Heating Air 50 Heater Controls ....................................................................................................................................... 51 APPENDIX B –DETAILED DRAWINGS .......................................................................................................... 52 Bill of Materials ........................................................................................................................................ 52 CAD assembly ........................................................................................................................................ 53 CAD of Redesigned Inlet and Outlet Testing Chamber .......................................................................... 55 CAD of Modified Peepsight ..................................................................................................................... 57 CAD OF MODIFIED TESTING SECTION CHAMBER ........................................................................................ 59 SHORT CLAM FOR ATTACHMENT ................................................................................................................ 60 LONG CLAMP FOR ATTACHMENT ................................................................................................................ 61 MODIFIED CHAMBER ASSEMBLY ................................................................................................................ 62 APPENDIX C – POWER SYSTEM DOCUMENTATION ...................................................................................... 63 Murray GHN321N General Duty Switch ................................................................................................. 63 Ferraz Shawmut 63133 Power Distribution Block................................................................................... 63 ABL Susrum 2C10UL Circuit Breakers ................................................................................................... 63 ABL Susrum 2D2UL Circuit Breaker ....................................................................................................... 63 Omega SSR 330DC25 Solid State Relays ............................................................................................. 64 Altech Corp PS-S4023 Power Supply ..................................................................................................... 64 Altech Corp PS-S2012 Power Supply ..................................................................................................... 64 APPENDIX D – POWER SYSTEM CIRCUIT DIAGRAM ...................................................................................... 65 APPENDIX E – DESIRED POWER SYSTEM BLOCK DIAGRAM .......................................................................... 66 APPENDIX F – MANUFACTURE SPECIFICATION SHEETS ............................................................................... 67 ETI VLC 10 Fuse Disconnectors ............................................................................................................. 72 APPENDIX G – DETAILED SUPPORTING ANALYSIS ....................................................................................... 73 APPENDIX H – OPERATORS MANUAL AND TESTING PROCEDURES................................................................ 76

[3]
Statement of Disclaimer Since this project is a result of a class assignment, it has been graded and accepted as fulfillment of the course requirements. Acceptance does not imply technical accuracy or reliability. Any use of information in this report is done at the risk of the user. These risks may include catastrophic failure of the device or infringement of patent or copyright laws. California Polytechnic State University at San Luis Obispo and its staff cannot be held liable for any use or misuse of the project.

[4]
Executive Summary Lawrence Livermore National Laboratory has invested considerable effort to develop new standard for nuclear grade HEPA filters that can withstand high temperatures along with methods to optimally test not only the experimental filter media, but also new frame seals and media binders. Therefore, LLNL in collaboration with Cal Poly has designed and built a Mini High Temperature Testing Unit (MHTTU) to recreate conditions observed during a fire and to test different materials in an effective, inexpensive, regulated and reliable method. The existing prototype was unable to achieve the ideal testing conditions of 1000°F air at the low flow rates of 1.25-12 ACFM; therefore, this project looks to optimize previous efforts on building a portable and reliable MHTTU to collect more information and perform different tests in various materials utilized in the construction of ceramic HEPA filters. Based on previous teams’ inputs, our team performed a heat transfer analysis to determine critical heat loss points and to optimize the design of the MHTTU. After several idea generation sessions, it was decided to modified the geometry of the testing chamber and the insulation of the system. The MHTTU also lacks a robust control system and a user interface; therefore, a more reliable interface and more versatility during the tests were implemented in the system. With the current design, we were able to improve the maximum temperature of the system to 837°F; however, we were not able to fulfill heat up time of 15 minutes. After carefully recording the temperature of the surrounding material during testing, we believe that the immersion heater is not powerful enough to have an effective heat transfer to air. After testing was completed, it was confirmed that the heater coils cannot reach 1000°F in less than 15 minutes of heat up. Therefore, a more powerful heater is needed to achieve testing parameters.

[5]
1. Introduction Over the years, Lawrence Livermore National Laboratory (LLNL) has been developing a new standard for nuclear grade HEPA filters that can withstand high temperatures along with methods to optimally test not only the experimental filter media, but also new frame seals and media binders. In conjunction with California Polytechnic State University, San Luis Obispo (Cal Poly), LLNL has developed a High Temperature Testing Unit (HTTU) capable of testing full sized filters. LLNL wanted a smaller, mobile system so that students and researchers at Cal Poly can perform tests similar to those that the full-sized system is capable of. Thus, a Mini High Temperature Testing Unit (MHTTU) was desired to test smaller sample sizes. The MHTTU was specified to achieve specific parameters such as high air temperatures and low range of flow rates range to simulate fire conditions, and collect to help analyze the behavior of different materials. Team Daedalus, consisting of Kevin Liu (CPE), Nathan Bernards (ME), Sam Macy (MATE), and Pablo Castillo (ME), was the next effort to recondition and optimize the MHTTU. Previous teams, Teams Phoenix and MicroFire, built a fully functional MHTTU that is portable and complies with the power requirements; however, they came short in achieving the ideal temperature of 1000°F in the testing area. The MHTTU also lacked a robust control system and a user interface. As such, Daedalus was tasked with modifying the system to primarily achieve the desired specifications outlined in the next section. However, though the build process, it was discovered that prior teams did not get campus electrician approval for the power system they had developed and came short on the safety of the power box. This large, unexpected task lead to major delays in all phases of the development of this iteration of the mHTTU which ultimately lead to us not achieving the desired specifications. Specifications and Developments Team Daedalus’ goal in this project is to deliver a functional miniaturized High Temperature Testing Unit that meets or exceeds the requirements laid out by LLNL. To help achieve these specifications, Team Daedalus completed a Quality Function Deployment (QFD) exercise, making use of the House of Quality technique. This tool helps to take the needs of a customer and convert them into engineering specifications. In the case of the MHTTU project, many precise specifications were already provided by LLNL, and thus some of the inputs to Team Daedalus’ House of Quality did not exactly fit the usual mold of QFD. That said, there were several customer needs that the team could identify that were not explicitly mentioned in the customer requirements provided. Customer Requirements
• Flowrate of 0.5-12 AFCM • Reach temperatures of 1000 °F in test chamber • Less than 15 minutes of warm up time • Compatible with a maximum of 240 VAC • Up to 12" H2O back pressure • Portable and fit through standard door
[6]
• Reliable and well commented code • Can alter routine mid test • Export data to excel • Good easy to use interface • GUI control system • Fit 2"x6"x12" HEPA media in test chamber • Safe to operate • Accurate documentation • Total cost less than $3000 • Laminar flow
One such need is proper documentation of the computer code used to operate the control system. An ongoing issue identified with the previous system is the lack of proper commenting procedure, along with other kinds of documentation problems. If Team Daedalus developed an operating manual for the device along with clear comments in the code, it would make operating the device simpler for users. Clear instructions regarding operation could translate to an increase in the number of people who can operate it, and proper commenting would allow future expansion of the control system by other programmers. Another need that was determined was the capability for the MHTTU to change the parameters of the testing routine dynamically. This would allow users to change temperature and flow rates during testing without having to restart the entire process. The QFD process also gave Team Daedalus a better look at the interrelations between many of the specifications of the project. For example, changes in flow rate directly affect heat transfer and thus the temperature of the testing chamber. Each of these will also have an impact on the amount of power the heater requires, the test chamber temperature rise time, and the back pressure. Along with the previous parameters, total unit size and user friendly controls will directly affect cost. Explicit details about the exact nature of these relationships can be found in the printed spreadsheet of the House of Quality in Appendix A. These specifications are also listed below in table 1.

[7]
Table 1. Specifications, ranges, tolerances, risk of failure to complete, and method of testing
Engineering Specifications # Specification Target or Range Tolerance Risk Compliance 1 Flowrate 0.5-12 ACFM MIN LOW A,T
2 Min Test Chamber Temperature 1100 °F MIN MEDIUM A,T
3 Temperature Rise Time 15 minutes MIN HIGH A,T
4 Power Supply Voltage 240 VAC MIN LOW I
5 Back pressure 12 In. H2O MAX MEDIUM A,T
6 Size Fits through standard door MIN LOW I,S
7 Usability Reliable and easy to use MAX LOW T,I
8 Test Routine Features
Vary testing dynamically MAX LOW T,I
9 Safety Meets Cal Poly safety requirements MAX MEDIUM I,S
10 Cost Under $3000 MIN MEDIUM A,T
11 Interface GUI Basic
Interface Acceptable
MEDIUM I
• Flowrate: This specification refers to the amount of air circulating the system at any given
moment in time. Since it is a closed system, conservation of mass can be applied and used to calculate the flowrate of the system, even when the system changes in geometry in each section. A more accurate method to calculate flowrate is to include two pressure transducers to measure the pressure difference between two sections of the system and calculate the flowrate. Also, the risk indicated in this parameters refers to the difficulty to achieve the specified range of 0.5 to 12 actual cubic feet per minute, and it is at low because the input pressure will be controlled by a control valve, and the pitot-tubes are available to use.
• Min Test Chamber Temperature: This parameter sets the minimum temperature desired in the test chamber to 1100 °F. This temperature will be recorded by means of two different thermocouples one located in the chamber inlet section and other located in the test chamber section. These thermocouples will be connected to the control system, Arduino, to be logged in spreadsheets for further analysis. The risk is set to medium because there are several heat loss points and previous efforts have been short to reach desired temperature.
• Temperature Rise Time: This specification refers to the desired time to reach minimum temperature. This parameter will be recorded along with the minimum temperature and simply with a stopwatch. This specification is at high risk because previous tests indicate that the maximum temperature reached over the span of thirty minutes was 750 °F.
• Power Supply Voltage: This is the maximum voltage that can be supply to the system. Due to safety purposes, this parameter will be measure by simply connected to power outlets rated at 240V. This is at low risk because Cal Poly has several building that run in 240V, and it has been arrange to conduct testing in such buildings.
[8]
• Back Pressure: Back pressure refers to the maximum pressure the system will experience. This variable is related to airflow and volume of the system. Since airflow is very low and volume big, the system will not see a high pressure. Because of these reasons, this specification is at low risk. Also, this variable will be measure with the pressure transducers used to calculate airflow rate.
• Size: Size refers to the overall dimension of the system. Since the focus of the team is to improve heat losses and test chamber geometry, the overall dimension of the system will not change and will still comply this requirement; therefore, the risk is at low.
• Usability: This parameter is hard to specify since it comprehends several factors; however, when defining this specification, it was done thinking in the user been able to perform continuous and accurate tests. The goal is to build an accurate and precise system that ensure repeatability in testing. This specification will be measure by the spread of the test results and the quality of such results. The chosen materials are design to withstand such temperature, pressures, and flowrate; therefore, the risk is at low.
• Test Routine Features: This specification deals with the ability to specify different parameters to be measure in each test. This will be controlled by the implementation of a robust program that will handle temperature, pressure, and airflow rate, as well as the ability to change parameters once the test has started. It has a low risk due to readily available programs that can be implemented to the system.
• Safety: Since the Mini HTTU will be running with a high voltage system, it is crucial to have a safe system that satisfy industry and Cal Poly regulations; therefore, the electric system of the unit will be design and specified by the team, but it will be assemble by a contractor working in conjunction with Cal Poly. This is a low risk parameter because of the guarantee ensured by the contractor.
• Cost: the goal of the team is to rebuild and optimize the system with a maximum budget of $3000. This includes new insulation, new test chambers, heat analysis, flow analysis, and heaters. Since prices of these features are unknown, the risk is set to medium.
• Interface: The interface of the system will be the medium that communicates between the hardware collecting all the different parameters and the program displaying all previous parameters. It has been specified that a GUI is desired because it represents a more common interface that other options available in the market. The risk is set to medium because it will require fine tuning and debugging to have a reliable and safe program.
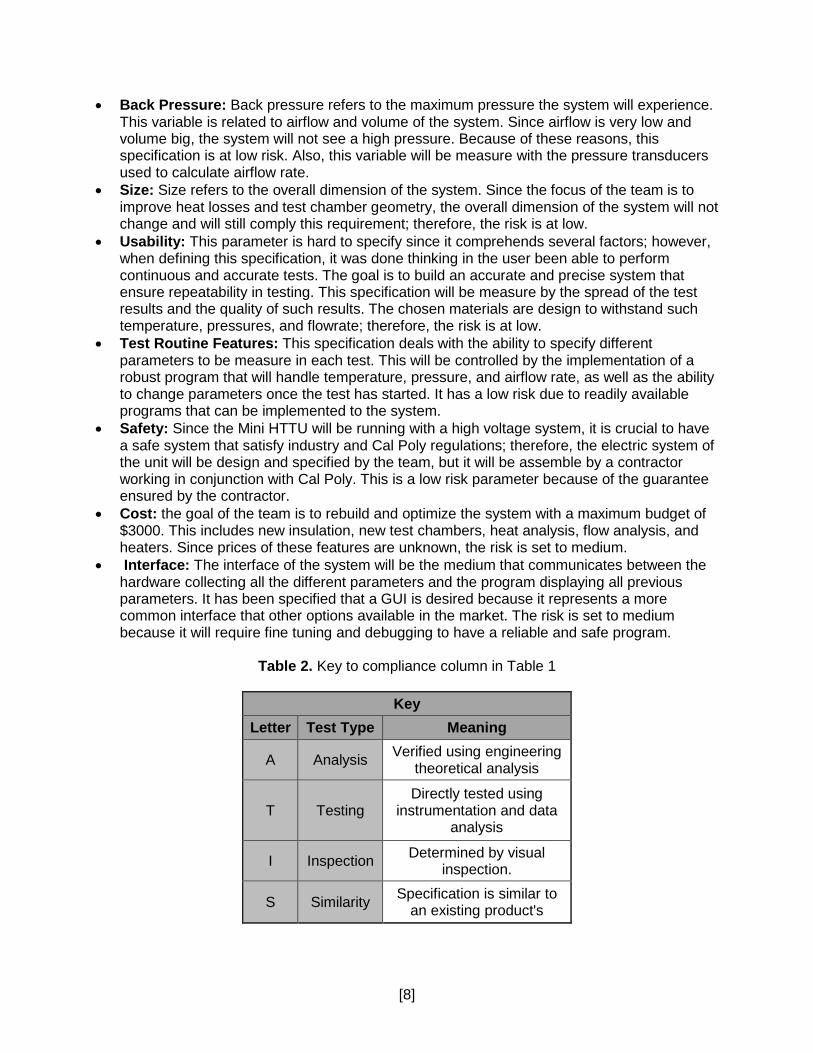
Table 2. Key to compliance column in Table 1
Key
Letter Test Type Meaning
A Analysis Verified using engineering theoretical analysis
T Testing Directly tested using
instrumentation and data analysis
I Inspection Determined by visual inspection.
S Similarity Specification is similar to an existing product's

[9]
2. Background The results of the background research performed by Team Daedalus largely mirrored that of Team Phoenix, who designed the heating, power and flow control aspects of the current version of the MHTTU [1]. This similarity is because no product exists on the marketplace that meets all of the requirements of LLNL. Additionally, the fact that high temperature testing units for HEPA filters are not common meant that online and journal searches for information regarding these types of appliances led Team Daedalus to find many of the same articles as Team Phoenix. The problem that needs to be solved has already been well defined by previous teams and by LLNL, and while designs with similar functions were found, none of them operated at the requirements laid out by LLNL. In addition to examining similar testing machines, Team Daedalus also researched methods for testing HEPA filters in various environments.
2.1. History of HEPA Filters High Efficiency Particulate Air (HEPA) filters were developed as a part of the Manhattan project, to protect facilities and people from the effects of radioactive particles. Since then, their uses have grown and HEPA filtered systems can be found in surgical theaters, clean rooms for electronics manufacturing, and even in some homes. There are many classifications of HEPA filters, but the most general requirement is that the filter can remove 99.7% of particulate matter 0.3 microns in diameter or larger [2]. Many advancements in filter media have been made since the initial development of HEPA filtration, and now Lawrence Livermore National Laboratory seeks to develop new materials to be used in high temperature HEPA filtration systems. These new filter materials will require testing in a high temperature environment, and so Cal Poly has been enlisted to build and test a portable testing apparatus.
2.2. Scientific Literature and Trade Publications
2.2.1. HEPA Filters and Filter Testing Flanders Precisionaire manufactures and tests high quality filters, including HEPA filters. The trade article HEPA Filters and Filter Testing: A Comparison of Factory Tests and In-Service Tests provided useful information about the history of HEPA filters and the appropriate types of filters for various environments [3]. The article also detailed existing methods for testing these filters. LLNL is seeking to develop a new kind of filter media, so while this article was helpful for understanding various mechanisms by which filters can be tested for several qualities, it did not provide specific information about testing environments at temperatures near the goal of this project.
2.2.2. Air Filtration at High Temperatures Myers’ and Melgaard’s article Air Filtration at High Temperatures in Controlled Environments Magazine provided Team Daedalus with a detailed analysis of the challenges associated with designing and testing HEPA filters for use in high temperature environments [4]. This information will be of more use to project partner Sam Macy as he designs specialized gel seals for the HEPA filters that Team Daedalus will be building a testing rig for.

[10]
2.2.3. Current Technology There are no products on the market that precisely fit the requirements laid out by LLNL, and so the only device featured below that would seem to be relevant for comparison to the goals of this project is the previous MHTTU built. Despite the dearth of comparable devices, the following section attempts to compare several commercial HEPA filter testing solutions with the design requirements of this project. A comparison is also made between the Team Daedalus’ goals and the performance of the original MHTTU.
2.2.4. Team Phoenix: MHTTU The original MHTTU, on which Team Daedalus’ project is based, was built in 2014 for LLNL by ME428 group Team Phoenix. The MHTTU can be connected to a canister of compressed air containing whatever contaminants LLNL wants to use to test their filters. The air entering the unit is first heated by a 2 kW Watlow immersion heater, before passing through a 2kW Hot Air Tool [1]. The reason for having two heaters was to help with heating air at low and high flowrates. Team Phoenix found however, that the second inline heater was more detrimental than helpful in achieving the desired temperatures. After flowing through the heaters, the air continues through insulated round piping until it reaches the testing chamber, which has a rectangular cross section. Inside the test chamber is the fixture for holding samples, and is followed by the exhaust pipe. There are thermocouples and pressure transducers before and after the test section, for verifying design parameters during testing. There is also an anemometer for measuring air flowrates. The MHTTU will need a redesign to meet the design specifications, the method of approach for which is outline further on in this document.
Figure 1. CAD Model of Team Phoenix’s mHTTU [1]

[11]
Specification Summary [1]
• Reaches specified air flow rates, but unable to maintain high temperatures at low flow rates.
• Meets power consumption requirements. • Cannot reach 1300 °F, but does come close at higher flowrates (approximately 1100 °F).
2.2.5. Cellular Materials International Inc.: Overhead Thermal Testing Rig
(OTTR) The CMI OTTR is designed primarily to test joint sealants, but features high temperature air flow as the method of testing [5], meaning it is reasonable to compare to the design specifications from LLNL. Unfortunately, the high temperature aspect of the OTTR is the only verifiable similarity to this project's goal. The OTTR can reach temperatures of up to 1100 °F, but CMI provides no information regarding the range of the air flowrates it is capable of. The OTTR also runs on two 16 kW heaters, meaning it likely requires more than 240 VAC for its power supply. The facts that the maximum temperature of the rig is below Daedalus' desired air temperature, no flowrate data is provided by CMI, and that the overall power requirements are too high make the OTTR a bad fit for the goals of this project.
Figure 2. CMI Overhead Thermal Testing Rig [5]
Specification Summary [5]
• Can reach temperatures of 1100 °F. • Tests fatigue of joint sealants, not filter media.

[12]
• No information available about air flowrates. 2.2.6. Mississippi State Institute for Clean Energy Technology: Generic
Filter Test Stand The ICET was designed at Mississippi State to perform lifecycle testing of HEPA filters, including nuclear grade filters like the ones that LLNL will be testing with the MHTTU. Unlike the MHTTU however, the ICET is built to test flowrates between 500 and 4000CFM [6], far exceeding even the maximum desired flowrate desired by Team Daedalus. The ICET is also built to be a low temperature testing apparatus, with air temperatures ranging between 60 and 140 °F [6], which also does not match the specifications for the MHTTU. The ICET is also a very large, stationary device. Overall, the ICET is similar to the MHTTU, but the purpose of each device is very different. The MHTTU will be for testing filter media at high temperatures but low air flowrates, while the ICET achieves the opposite goal.
Figure 3. ICET Generic Test Stand [6]
Specification Summary [6]
• Capable flow rates of 500-4000 CFM. • Supplies 50.23 in H2O filter differential pressure. • Reaches temperatures of 60-140 °F.

[13]
2.2.7. Advanced Thermal Solutions: CLWT-115 Closed Loop Wind Tunnel
The ATS CLWT-115 is a stationary, closed loop wind tunnel for testing printed circuit boards and other electronic components [7]. The specified range of flowrates for the CLWT-115 includes the desired range for the MHTTU, but also greatly exceeds it at the high end. This may mean that the ability of the system to finely tune the flowrate near the bottom of its range is limited. The CWLT-115 also does not come close to reaching the required temperature of 1300°F, and is not mobile. Despite these inconsistencies with the specifications of the MHTTU, the air recirculation aspect of the CLWT-115 is a feature that would be attractive on the MHTTU. Air diverted from the exhaust, perhaps feeding a heat exchanger interacting with inlet air, would help keep temperatures high and improve total system efficiency.
Figure 4. ATS CWLT-155 [7]
Specification Summary [7]
• Capable of flow rates of 0 to 797.4 CFM. • Reaches temperatures between 0°F and 185°F. • Runs on 220 VAC.
2.3. Department of Energy Standards for HEPA Filters
These standards are provided by the DoE to manufacturers of HEPA filters and provide specifications for use in the design of nuclear grade HEPA filters. They also provide directions for the manufacturing of HEPA filters and the safe handling of materials. They may not all apply to this project, but they have been included out of caution.

[14]
• ASME AG-1, Code on Nuclear Air and Gas Treatment. • ASME NQA -1, Quality Assurance Program Requirements for Nuclear Facilities. • ASTM D 92, Standard Test Method for Flash and Fire Points by Cleveland Open Cup
Tester. • MIL-STD-282, Filter Units, Protective Clothing, Gas Mask Components and Related
Products: Performance Test Method. • MIL-F-51079, Filter Medium, Fire Resistant, High Efficiency. • ASME AG-1, Code, Section FC, HEPA Filters.
2.4. Custom Heater
NiChrome wire is an alloy made from Nickel (Ni) and Chromium (Cr) in two main configurations: NiChrome A Ni (80%) and Cr (20%), or NiChrome C Ni (60%), Cr (15%) and Fe (25%). The main difference between these two configurations is that NiChrome C has a slightly higher resistance per foot, but NiChrome A has a higher tensile strength [8]. NiChrome wire is widely used in electrical appliances as a heating source because of its relatively low cost, high conductivity, corrosion resistance and high melting temperature. Furthermore, only a few specifications are needed to calculate the required power input for the heater; wire diameter, wire length and desired temperature. However, further analysis of this application would be required before implementing it in the MHTTU. Some recommended calculations would be power requirement for the desired temperature of 1300°, power efficiency, and ease of implementation. Nonetheless, it is a good option to consider if other modifications to the current system fail to produce the required results.
2.5. Controls Systems Currently the MHTTU control system is run off an Arduino micro-controller. This system is currently lacking an interface, the ability to change testing routines mid run, and does not save data in a useful fashion [9]. Past efforts by others to create custom printed circuit boards and software did not prove successful. The designer responsible did not complete the work necessary and issues were encountered trying to continue the work where it was halted, due to poor documentation and the custom nature of the system. Thus, it was discovered that easy-to-use and popular platforms would be better for this application. Comprehensible code is also important so as to allow future engineers to expand the system. A custom solution would thus be less optimal for this use, as it would be fundamentally more complicated and harder to expand upon than an off-the-shelf controller. To this end, the Arduino is still a good choice due to its ubiquity in the tech world, which makes it likely that future programmers will have had experience in using it. It also benefits from the high reliability most micro-controllers have over general purpose processors. The Arduino is also capable of Microsoft Excel integration with the proper programing. With further research, Gobetwino has shown promise as an easy way to export data to Excel. Gobetwino is a PC program that uses the native serial output of the Arduino to read commands and integrate PC side programs. Using this, the data can be easily formatted into a viewable file [10]. The interface can also be easily developed for an Arduino, due to the variety of software already developed for interfacing with Arduino’s. One example is MakerPlot, which is a commercial solution which integrates data collection and a programmable GUI control system. Other solutions are also available and a custom solution is also an option.

[15]
2.6. Insulation The current system utilize mineral wool as means of insulation and it is made from molten glass, stone or slag that is spun into a fiber-like structure. Inorganic rock or slag are the main components (typically 98%) of stone wool. The remaining 2% organic content is generally a thermosetting resin binder and a little oil [11]. The relationship between temperature and thermal conductivity is indicated in the diagram below:
Figure 5. Performance of Mineral Wool Insulation [11].
After a more detail research, ceramic wool insulation has proven to perform better than mineral wool for the specific application of this system. The different parameters considered to compare both insulations were: thermal conductivity coefficient, maximum temperature of application, ease of application, and cost. The results of this comparison using 1000 °F as a reference temperature can be seen in Table 3 below.
Table 3. Comparison between Ceramic Wool and Mineral Wool Insulation
Property Ceramic Wool Insulation Mineral Wool Insulation Thermal Conductivity Coefficient 0.74 BTU*in/hr*ft2 1.52 BTU*in/hr*ft2
Maximum Temperature 2500 °F 1800 °F Ease of Application Blanket Blanket
Cost $40-120 $50-100 Team Daedalus has decided to purchase Ceramic Fiber Blanket from the supplier Ceramic Fiber Online. This vendor was chosen because their website offered a great deal of information about the fiber, as well as competitive pricing. The exact material chosen was 8lb/in3 Zirconia Grade Fiber Spun Blanket, because it offers the best thermal properties for its price.

[16]
3. Design Development
3.1. Discussion of Conceptual Designs
Team Daedalus has determined that the best way to complete this project successfully is to start by analyzing the system as it currently exists before making any concrete design decisions. Since Team Phoenix’s MHTTU was operational and just did not meet the design specifications, the first goal is to reconnect the control system and perform tests to determine the exact performance specifications of the MHTTU. Once hard data has been collected, deliberation about the issues with the current design and possible solutions can begin. Some examples of design techniques to be utilized in this phase are Brainstorming, Brainwriting and the SCAMPER method. Although preliminary testing to the MHTTU has not been possible due to the lack of proper documentation from previous teams, Team Daedalus began the design process with Brainwriting. In this early design process, the whole system was broken down into its most basic functions such as heating, airflow, control system and data collection. Then, writing down all possible ideas for each system in periods of five minutes, Team Daedalus collected several options for each function. At this point of the design process, feasibility, quality or efficiency were not a concern because it was more important to collect as many options as possible to later refine them. An example of the Brainwriting is shown in Figure 5 below.
Figure 6. Example of first design process session, Brainwriting, showing ideas generated for control system.
After Brainwriting, Team Daedalus decided to have a Brainsketching session. During Brainsketching all ideas for the different systems were recorded, but every three minutes the team members had to rotate the logbooks that ideas were being recorded in, so other members could build upon the previous teammate ideas. This method was not limited to writing down the ideas, but it included sketching ideas if so desired. Likewise, the objective of this methodology

[17]
was to generate as many ideas as possible for the different function, so there were no bad or wrong ideas. Figure 6 below exemplifies the outcomes of this method.
Figure 7. Example of Brainsketching for heating function
3.2. Design Iteration Process Concept modeling was a third attempt to generate more feasible ideas. In this session, each team member took previous ideas for each function and tried to build a quick prototype with a few materials including FoamCore, plastic straws, rubber bands, rope, dowels, popsicle sticks, tape and hot glue. This method was useful for combining previous ideas with an examination of the practicality of implementing them in the current system. Different prototypes developed in this session are described below.
3.2.1. Heat Exchanger An option that was investigated for viability, effectiveness and cost was implementing a heat exchanger to divert the waste heat coming out of the exhaust to preheat the low temperature air entering the heater. Preheating the air entering the heater would decrease the heater power demand and increase the overall efficiency of the system. Although it is acknowledged that perfect exchange of heat is impossible, a heat exchanger may prove to improve efficiency when paired with a proper system [11]. The model of the heat exchanger is depicted in Figure 8.

[18]
Figure 8. Heat exchanger prototype
3.2.2. Increasing Surface Area of Immersion Heater Another idea to increase the effectiveness of the system was to increase the surface area of the heating element in the immersion heater. The purpose of increasing the surface area of the heating element is to maximize the area where heat exchange takes place. Similar to a fin/fan system, increasing the surface area available for heat dissipation will result in more heat convection from the heater into the air flowing over it. The current heater installed in the MHTTU is capable of reaching a maximum temperature of 1600°F, so this option looks to maximize the heating ability by adding fins made of a highly thermally conductivity material. Several aspects of this idea that would limit the feasibility include finding a material that can be welded onto the sheath metal of the heater, the possibility that the heat from welding the fins onto the heater would damage it, the geometries of the pipe and heater. A model of this option is depicted in Figure 9.
Figure 9. Increasing surface area of immersion heater by adding thin sheet metal strips to heating rod.

[19]
3.2.3. Custom Heater Other option considered during ideation was to build a custom heater by wrapping NiChrome wire around an insulating support structure. Running current through the wire causes it to heat up to very high temperatures. Air flowing over the wire would be heated by convection. The amount of surface area for convection that can be achieved with this design is much higher than with the current immersion heater. An example of the custom heater prototype is shown in Figure 10.
3.2.4. Electric Band Heater One of the known problems with the current MHTTU is that the testing chamber only reaches about 700°F, even though the immersion heater is capable of reaching up to 1600°F. Team Microfire suggested implementing an electric band heater around the testing chamber to increase the temperature inside the chamber. Further analysis and confirmation from electricians confirms that it will be possible to run the band heater in parallel with the immersion heater. Team Daedalus is working on the approval to get the current unit started up to run more physical tests. In order for Cal Poly to authorize starting the MHTTU, a risk analysis document, a power system diagram and a circuit diagram are required, documents that were not provided by previous teams. During the process of laying down the power system diagram, a few wires were found that didn’t seem to lead to any known components. Following those wires, Team Daedalus found that Team MicroFire installed electrical band heaters around the testing chamber but failed to document this on their report. Additionally, their static testing results do not reflect the addition of the band heaters. Therefore, Team Daedalus has chosen to initially disregard Team MicroFire’s efforts to include the band heaters, and if necessary, further testing will be performed to determine the effectiveness of band heater. Figure 11 depicts a prototype of the addition of electrical band heaters to the testing chamber.
Figure10. Prototype of custom built heater with NiChrome wire as a heating resistance

[20]
Figure 11. Prototype of the addition of electrical band heater to the testing chamber
3.2.5. Cylindrical Testing Chamber
Again, one of the main concerns for Team Daedalus is the fact that the air flowing through the current testing chamber cannot reach the required temperature. One potential factor identified was deficiencies with the current geometry. An early theory points to an inadequate interconnection between the outlet of the heater and the inlet of the testing chamber, causing heat leaks. Therefore, a cylindrical testing chamber is being considered, for which half of the cylinder can be detached for easy access to the sample fixture. Another possible fix is a sliding sample fixture that can be easily inserted or removed from the testing chamber. A complete redesign of the testing chamber poses its own problems, however. The chamber and the heating system represent the efforts of two entire ME Senior Project teams, and effecting major changes to both systems may be too great a task for 9 months. It is more important that the testing chamber reach the desired temperature than it is to improve the ease with which samples are inserted and removed. A total change to the chamber geometry would also necessitate repeating any thermal analysis done by Team Phoenix and Team MicroFire to determine the air flow and heat transfer characteristics of new geometries. FEA and CFD models, along with conventional analytical examination, will provide objective evidence for the ultimate decision regarding the chamber geometry. A prototype of the cylindrical testing chamber with its respective detachable sample fixture can be found in Figure 12.
Figure 12. Prototype of a) cylindrical testing chamber with its respective b) detachable sample fixture
a b
[21]
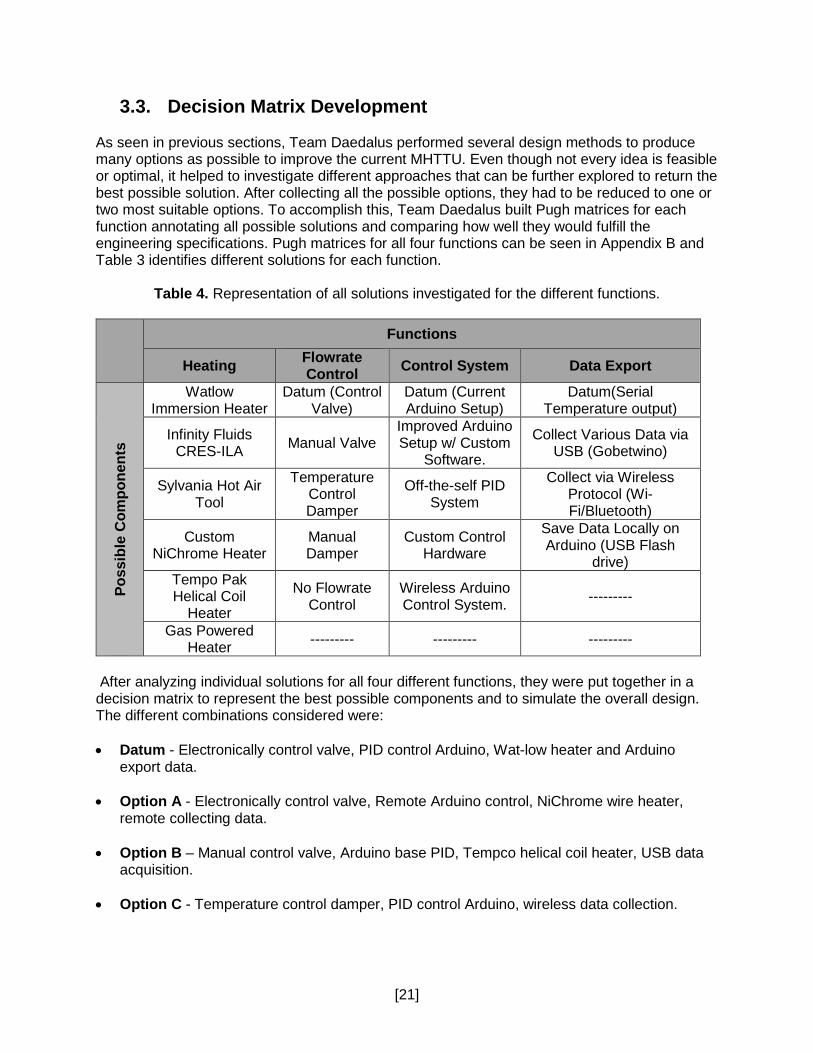
3.3. Decision Matrix Development As seen in previous sections, Team Daedalus performed several design methods to produce many options as possible to improve the current MHTTU. Even though not every idea is feasible or optimal, it helped to investigate different approaches that can be further explored to return the best possible solution. After collecting all the possible options, they had to be reduced to one or two most suitable options. To accomplish this, Team Daedalus built Pugh matrices for each function annotating all possible solutions and comparing how well they would fulfill the engineering specifications. Pugh matrices for all four functions can be seen in Appendix B and Table 3 identifies different solutions for each function.
Table 4. Representation of all solutions investigated for the different functions.
Functions
Heating Flowrate Control Control System Data Export
Poss
ible
Com
pone
nts
Watlow Immersion Heater
Datum (Control Valve)
Datum (Current Arduino Setup)
Datum(Serial Temperature output)
Infinity Fluids CRES-ILA Manual Valve
Improved Arduino Setup w/ Custom
Software.
Collect Various Data via USB (Gobetwino)
Sylvania Hot Air Tool
Temperature Control Damper
Off-the-self PID System
Collect via Wireless Protocol (Wi-Fi/Bluetooth)
Custom NiChrome Heater
Manual Damper
Custom Control Hardware
Save Data Locally on Arduino (USB Flash
drive) Tempo Pak Helical Coil
Heater
No Flowrate Control
Wireless Arduino Control System. ---------
Gas Powered Heater --------- --------- ---------
After analyzing individual solutions for all four different functions, they were put together in a decision matrix to represent the best possible components and to simulate the overall design. The different combinations considered were: • Datum - Electronically control valve, PID control Arduino, Wat-low heater and Arduino
export data.
• Option A - Electronically control valve, Remote Arduino control, NiChrome wire heater, remote collecting data.
• Option B – Manual control valve, Arduino base PID, Tempco helical coil heater, USB data acquisition.
• Option C - Temperature control damper, PID control Arduino, wireless data collection.
[22]
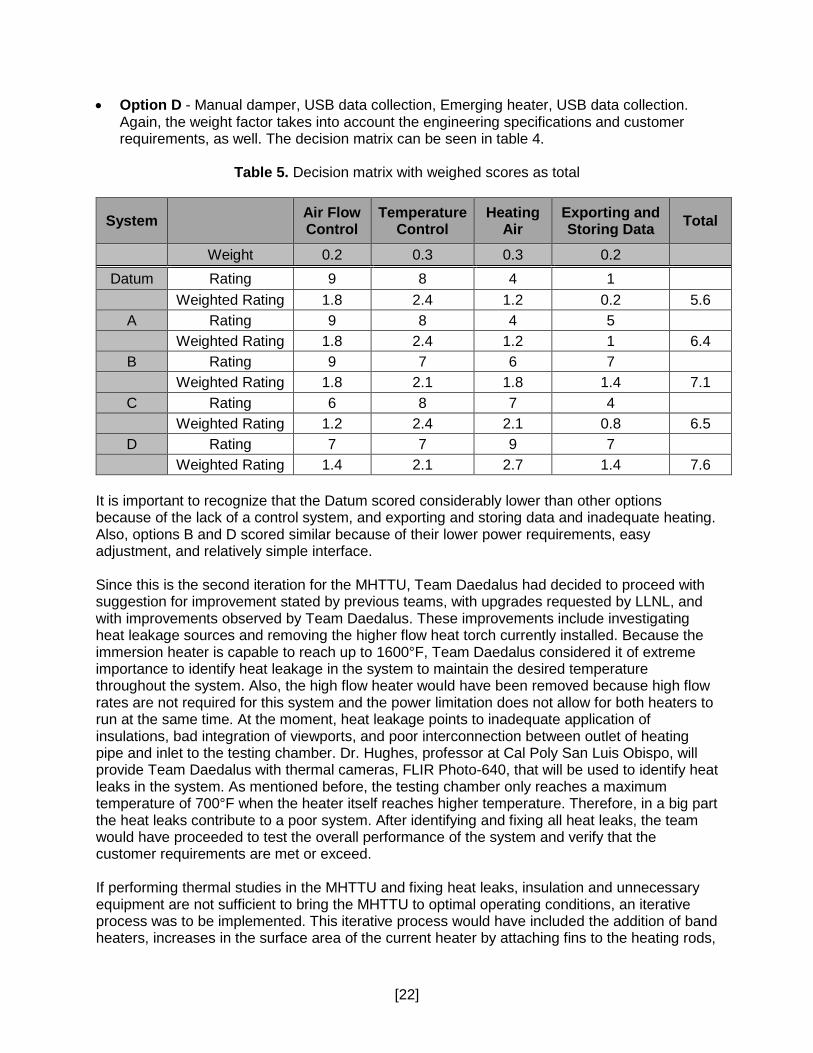
• Option D - Manual damper, USB data collection, Emerging heater, USB data collection. Again, the weight factor takes into account the engineering specifications and customer requirements, as well. The decision matrix can be seen in table 4.
Table 5. Decision matrix with weighed scores as total
System Air Flow Control
Temperature Control
Heating Air
Exporting and Storing Data Total
Weight 0.2 0.3 0.3 0.2 Datum Rating 9 8 4 1
Weighted Rating 1.8 2.4 1.2 0.2 5.6 A Rating 9 8 4 5 Weighted Rating 1.8 2.4 1.2 1 6.4 B Rating 9 7 6 7 Weighted Rating 1.8 2.1 1.8 1.4 7.1 C Rating 6 8 7 4 Weighted Rating 1.2 2.4 2.1 0.8 6.5 D Rating 7 7 9 7 Weighted Rating 1.4 2.1 2.7 1.4 7.6
It is important to recognize that the Datum scored considerably lower than other options because of the lack of a control system, and exporting and storing data and inadequate heating. Also, options B and D scored similar because of their lower power requirements, easy adjustment, and relatively simple interface. Since this is the second iteration for the MHTTU, Team Daedalus had decided to proceed with suggestion for improvement stated by previous teams, with upgrades requested by LLNL, and with improvements observed by Team Daedalus. These improvements include investigating heat leakage sources and removing the higher flow heat torch currently installed. Because the immersion heater is capable to reach up to 1600°F, Team Daedalus considered it of extreme importance to identify heat leakage in the system to maintain the desired temperature throughout the system. Also, the high flow heater would have been removed because high flow rates are not required for this system and the power limitation does not allow for both heaters to run at the same time. At the moment, heat leakage points to inadequate application of insulations, bad integration of viewports, and poor interconnection between outlet of heating pipe and inlet to the testing chamber. Dr. Hughes, professor at Cal Poly San Luis Obispo, will provide Team Daedalus with thermal cameras, FLIR Photo-640, that will be used to identify heat leaks in the system. As mentioned before, the testing chamber only reaches a maximum temperature of 700°F when the heater itself reaches higher temperature. Therefore, in a big part the heat leaks contribute to a poor system. After identifying and fixing all heat leaks, the team would have proceeded to test the overall performance of the system and verify that the customer requirements are met or exceed. If performing thermal studies in the MHTTU and fixing heat leaks, insulation and unnecessary equipment are not sufficient to bring the MHTTU to optimal operating conditions, an iterative process was to be implemented. This iterative process would have included the addition of band heaters, increases in the surface area of the current heater by attaching fins to the heating rods,

[23]
implementing a new heater, include a heat exchanger, and possibly extensive modifications to the testing chamber. The addition of band heaters to the testing chamber will be the next improvement because of its relative low cost, potential high benefits, and simple implementation. This option follows the fact that the testing chamber cannot reach the desired temperature, even though the emerging heater is capable to output more than 1300°F. It was estimated that including band heaters will reduce the temperature gradient between the heater and the testing chamber. It can also be used as a pre-heating mechanism, and in return it will minimize the heat up time helping to accomplish a customer requirement. Thermal analysis would have then validated the final decision to incorporate band heater in the system. A third step improving performance of the MHTTU would have been to increase the surface area of the heating rods. This increment in surface area would have been accomplished by attaching thin plates of highly conductive material to the heating rods of the heater. The objective of the thin plates would be to simulate fins helping with the heat transfer from the heater to the fluid, air. It is still necessary to investigate if it is possible to weld any material to the rods, or a holding mechanism will be implemented to keep the fins in place. A further implementation to the system, if the previous upgrades did not prove to be sufficient, would have been to replace the immersion heater with a more adequate heater for this application. As team Phoenix mentioned on their report, immersion heater’s main application is to heat up static fluids. A more careful investigation on different heaters determined that there are non-expensive, more specific for the application heaters. One option would have been the Daisy Wound Heating Element. This heater is specific for low flow rates, high temperatures applications, and low power input. This was an option within the budget, but this idea was not approved by the sponsor. Also, implementation of the control system with an Arduino micro-controller would have been a priority in early stages of the process. An Arduino micro-controller was selected for this application because it is capable of being inexpensively expanded to include extra features such as wireless communication, touchscreen/controller integration and graphics output. It is also capable of Microsoft Excel integration with the proper program. Having this flexibility would have aided in getting the control system to a level that satisfies our specifications. Also, it was recognized that a well-documented control system is desired for this application.

Figure 13. Flow diagram of upgrades to implement in MHTTU
Are customer specifications
met?
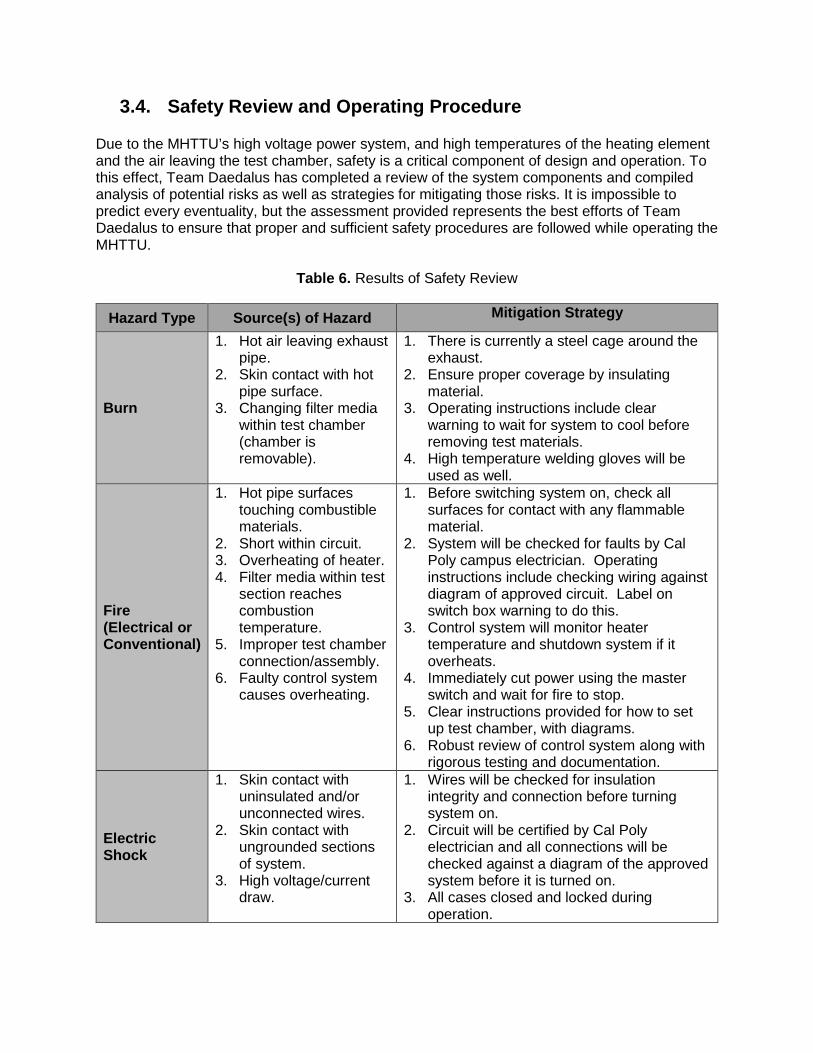
3.4. Safety Review and Operating Procedure Due to the MHTTU’s high voltage power system, and high temperatures of the heating element and the air leaving the test chamber, safety is a critical component of design and operation. To this effect, Team Daedalus has completed a review of the system components and compiled analysis of potential risks as well as strategies for mitigating those risks. It is impossible to predict every eventuality, but the assessment provided represents the best efforts of Team Daedalus to ensure that proper and sufficient safety procedures are followed while operating the MHTTU.
Table 6. Results of Safety Review
Hazard Type Source(s) of Hazard Mitigation Strategy
Burn
1. Hot air leaving exhaust pipe.
2. Skin contact with hot pipe surface.
3. Changing filter media within test chamber (chamber is removable).
1. There is currently a steel cage around the exhaust.
2. Ensure proper coverage by insulating material.
3. Operating instructions include clear warning to wait for system to cool before removing test materials.
4. High temperature welding gloves will be used as well.
Fire (Electrical or Conventional)
1. Hot pipe surfaces touching combustible materials.
2. Short within circuit. 3. Overheating of heater. 4. Filter media within test
section reaches combustion temperature.
5. Improper test chamber connection/assembly.
6. Faulty control system causes overheating.
1. Before switching system on, check all surfaces for contact with any flammable material.
2. System will be checked for faults by Cal Poly campus electrician. Operating instructions include checking wiring against diagram of approved circuit. Label on switch box warning to do this.
3. Control system will monitor heater temperature and shutdown system if it overheats.
4. Immediately cut power using the master switch and wait for fire to stop.
5. Clear instructions provided for how to set up test chamber, with diagrams.
6. Robust review of control system along with rigorous testing and documentation.
Electric Shock
1. Skin contact with uninsulated and/or unconnected wires.
2. Skin contact with ungrounded sections of system.
3. High voltage/current draw.
1. Wires will be checked for insulation integrity and connection before turning system on.
2. Circuit will be certified by Cal Poly electrician and all connections will be checked against a diagram of the approved system before it is turned on.
3. All cases closed and locked during operation.

[26]
4. Description of Final Design 4.1. Overall Design Description
After investigating possible modifications to the existing MHTTU and discussing them with our sponsor, it was concluded that the best path forward was to work toward the mitigation of heat loss from the testing chamber. To minimize heat losses, new methods of insulation on the cold side of the MHTTU were investigated, along with modifying the inside surface of the testing chamber to decrease the ability of the stainless steel to absorb heat meant for the test section. Additionally, geometric modifications were investigated, including removing as much mass as possible from the test chamber and test section, to decrease the ability of the assembly to absorb heat from the process air, and dissipate it to the ambient air.
Figure 14. CAD model of current MHTTU
Heater
Insulation
Testing Chamber
Testing Section
Exhaust
Power System Enclosure
Controls System Enclosure
Heater Fuse Enclosure
[27]
4.1.1. Power System Due to concerns on the part of Cal Poly staff regarding safety issues in the current system, the decision was made by staff that it would be necessary to have a contractor to building the power systems of the MHTTU. The primary concern of the staff at Cal Poly was that the existing system has no built in protections against the immersion heater faulting to ground. Another issue in the way of Team Daedalus redesigning the power system themselves is a safety regulation on campus that states that any wiring meant to carry over 50 V must be done by a certified electrician. Because any power system designed and implemented by undergraduate students would likely need multiple revisions, it was determined that hiring an electrician to come to campus multiple times would be cost prohibitive. To solve this issue, Cal Poly and Team Daedalus are working with Aaron Peri of Sierra Pacific Automation, a local contractor in Paso Robles, CA. The specifications for the power system can be found in Appendices C and D. It is meant to operate essentially as a black box from the point of view of Team Daedalus and the eventual end user. The power system will plug into 240V AC outlets at Cal Poly and handle a maximum of 20 Amps of current. It will contain 240 V female plugs as outputs, so that the heater(s) may be swapped in and out at will. It will also feature center positive 2.1 mm female DC plugs, to power the Arduino based control system, as well as the sensors used for control.
4.1.2. Geometry Modifications 4.1.2.1. Viewport Modification
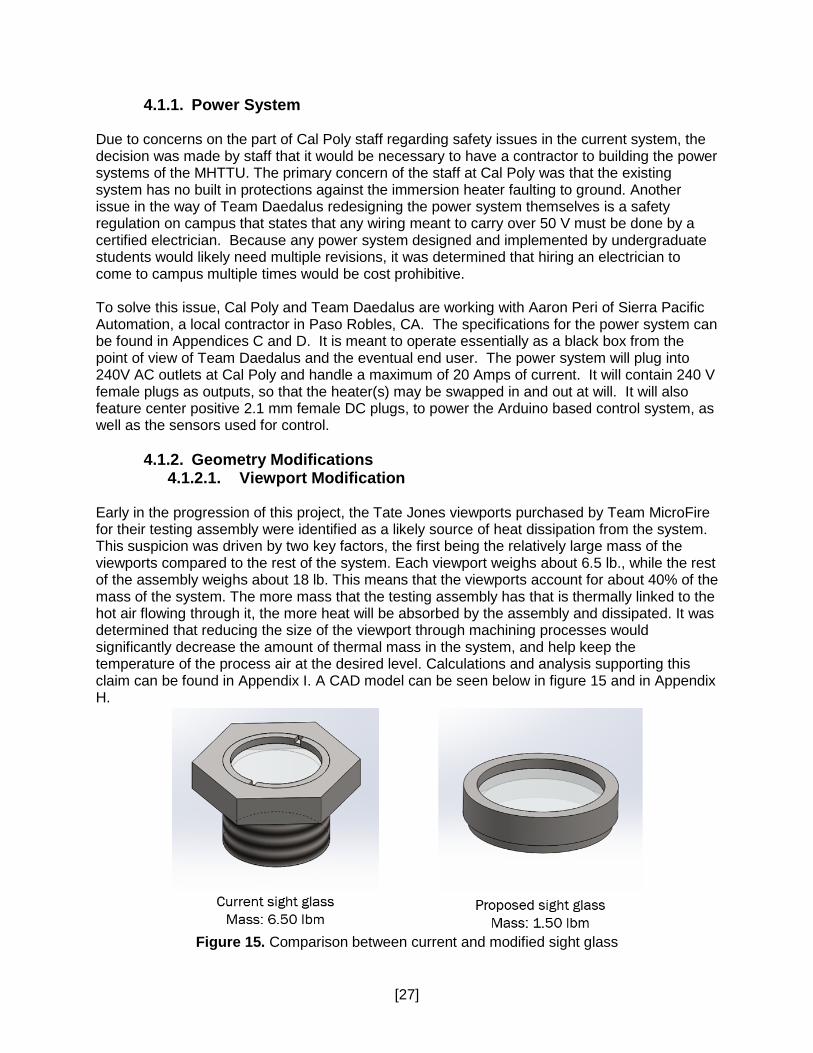
Early in the progression of this project, the Tate Jones viewports purchased by Team MicroFire for their testing assembly were identified as a likely source of heat dissipation from the system. This suspicion was driven by two key factors, the first being the relatively large mass of the viewports compared to the rest of the system. Each viewport weighs about 6.5 lb., while the rest of the assembly weighs about 18 lb. This means that the viewports account for about 40% of the mass of the system. The more mass that the testing assembly has that is thermally linked to the hot air flowing through it, the more heat will be absorbed by the assembly and dissipated. It was determined that reducing the size of the viewport through machining processes would significantly decrease the amount of thermal mass in the system, and help keep the temperature of the process air at the desired level. Calculations and analysis supporting this claim can be found in Appendix I. A CAD model can be seen below in figure 15 and in Appendix H.
Figure 15. Comparison between current and modified sight glass

[28]
4.1.2.2. Test Chamber Modifications It was also determined that the test chamber would need modification. Based on the thermal analysis performed in the system, see Appendix I for detail, it was found that the test chamber leading into the test section was another likely source of heat loss. This thermal analysis consisted in comparing the viewport threads to a fin in the system acting as a heatsink. Also, the overall thermal mass of the system was accounted to demonstrate the heat capacity of the system. With these calculations, it was found that the system was capable to dissipate 1500 BTU/hr., and the overall heat input to the system was 3300 BTU/hr. MicroFire found that the temperature in the test section dropped below the temperature of the air leaving the heater pipe. Because the first thermocouple used to determine the temperature drop across the test chambers and section is about halfway through the inlet test chamber, Team Daedalus concluded that the test chamber deserved investigation. The results of the analysis mentioned above led us to decide on a partial re-design of the inlet test chamber. Because the viewport for the inlet test chamber was being drastically reduced in cross sectional area, the new test chamber could be smaller than the current one. It could also be shorter. This would mean there is less mass in the test assembly, and therefore less heat capacity. Technical drawings of the new inlet test chamber can be seen below in figure 16 and in Appendix H.
Figure 16. Comparison between current and modified test chamber inlet
4.1.3. Controls The control system will primarily consist of an Arduino Uno R3 microcontroller board and a laptop connected by a serial USB connection. The Arduino handles all sensor and relay I/O in the testing unit, while the laptop renders a GUI for the user to interact with, sends commands to the Arduino and receives sensor data back. The laptop is necessary for the Arduino does not have sufficient capabilities to render a GUI that satisfies all the requirements.

[29]
In order to implement this control protocol, both the Laptop and Arduino will need to run their own individual program. On the Laptop side, the control program is known as Instrumentino and on the Arduino, the control program is known as Controlino.
Figure 17. Control system overview.
Another program, “Gobetwino”, was initially considered for the control system as mentioned in the preliminary report. Gobetwino implements a general-purpose protocol, which can interface an Arduino with a variety of software, including Excel. However, this path was abandoned because Gobetwino lacks the functionality to construct a custom GUI, make test routines and save/load test routines. Another concern was with the quality of the software, because it has never received an update past the initial beta release, staying stagnant since 2011. The testing done on it is also thin, having not been tested on newer versions of Windows or for extended periods of time. [21] This greatly increases the likelihood of a hard to find and difficult to fix bug.
4.1.3.1. Instrumentino
Three chemistry department members of the University of Basel developed Instrumentino as a modular framework for the implementation of custom GUIs for Arduino based experimental instruments. Written in Python, the project is open source, licensed under GPL, and has been in development for 2 years. The developers have been publishing periodic updates, with the most recent published Jun 21, 2016 and a version 2 is under development as well. It has been utilized for many applications by the developers, including as a four channel MFC control box, and by other higher educational institutions. [22]
[30]
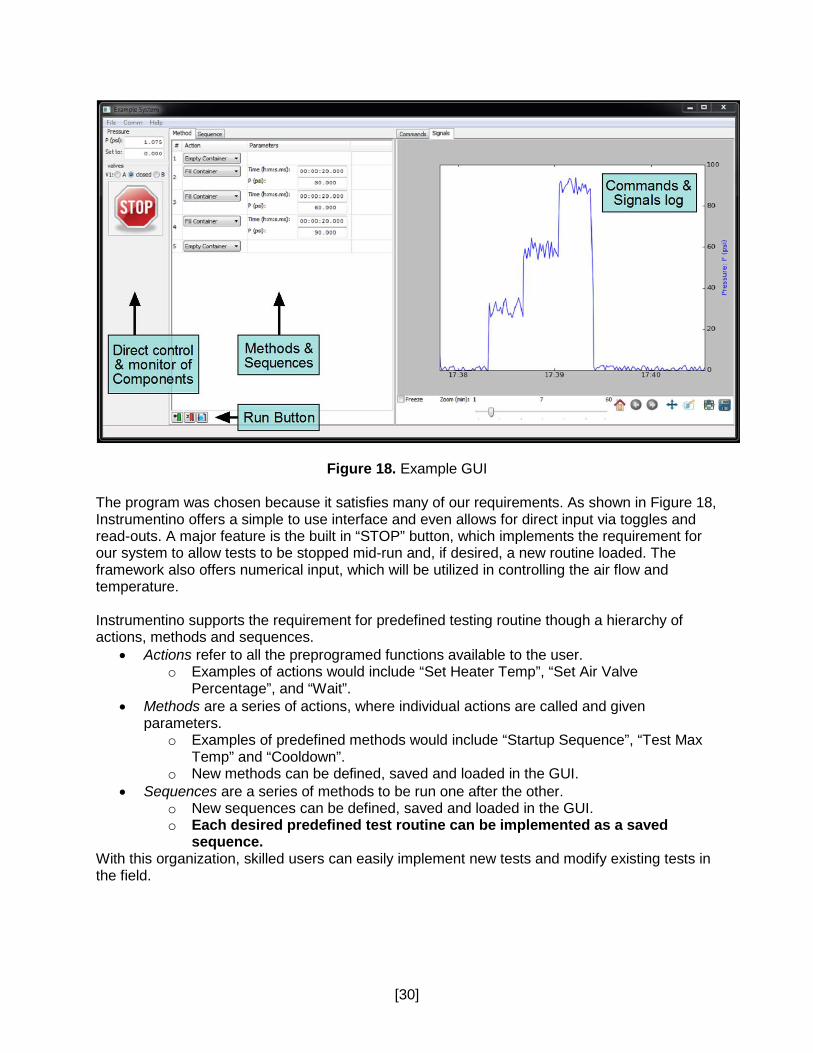
Figure 18. Example GUI
The program was chosen because it satisfies many of our requirements. As shown in Figure 18, Instrumentino offers a simple to use interface and even allows for direct input via toggles and read-outs. A major feature is the built in “STOP” button, which implements the requirement for our system to allow tests to be stopped mid-run and, if desired, a new routine loaded. The framework also offers numerical input, which will be utilized in controlling the air flow and temperature. Instrumentino supports the requirement for predefined testing routine though a hierarchy of actions, methods and sequences.
• Actions refer to all the preprogramed functions available to the user. o Examples of actions would include “Set Heater Temp”, “Set Air Valve
Percentage”, and “Wait”. • Methods are a series of actions, where individual actions are called and given
parameters. o Examples of predefined methods would include “Startup Sequence”, “Test Max
Temp” and “Cooldown”. o New methods can be defined, saved and loaded in the GUI.
• Sequences are a series of methods to be run one after the other. o New sequences can be defined, saved and loaded in the GUI. o Each desired predefined test routine can be implemented as a saved
sequence. With this organization, skilled users can easily implement new tests and modify existing tests in the field.

[31]
4.1.3.2. Excel Output The system is required to support data exportation via Excel. Instrumentino handles this natively for the program keeps an Excel log file of data readings and peripheral’s statuses.
Figure 19. Sample Excel Output.
4.1.3.3. Controlino Controlino is the Arduino side control program, which was developed to integrate with Instrumentino. Written in C, it was also developed by the same team from Basel. It primarily receives messages sent to it over the USB serial connection and calls the appropriate function. Features:
• Parses the serial connection for text commands and parameters • Pre-integrated PID Libraries • Includes prewritten functions for basic actions • Supports the addition of libraries to control new peripherals
4.1.3.4. Custom Communications Test
In order to confirm that Controlino was a sufficient choice, initial work was done to integrate the MAX31855 thermocouple board’s functions into the Controlino protocol. Integrating one function would be sufficient evidence for the functionality of the program, for all additional functions are added in a similar manner. This also test also seeks to confirm the functionality of the chip with our thermocouples, which was a concern. The program consists of primarily of a single file, “Controlino.ino”. As a credit to the developers, the code can immediately be seen as well commented and organized. Since the MAX31855 has C library support, its functions can be utilized by Controlino. To do this, #include the header file “Adafruit_MAX31855.h” into the Controlino code.
time 'Pressure: 'valves: V159:54.9 0 'closed'59:55.2 0.391007 'closed'59:55.4 0.195503 'closed'59:55.7 0 'closed'59:55.9 0 'closed'59:56.2 0.293255 'closed'59:56.5 0 'closed'59:56.7 0 'closed'59:57.0 0.488759 'closed'59:57.2 0 'closed'59:57.5 0.488759 'closed'59:57.8 0.391007 'closed'59:58.0 0.488759 'closed'

[32]
Then, a custom function must be declared. This function will later be called once the serial command relating to it is sent. The function should handle whatever task is asked from it within its body and send any return values over serial.
• For example : void cmdTempRead(int argC, char **argV) { double Temp; if(strcasecmp("C",argV[1]) == 0){ Temp = Thermocouple1.readCelsius(); } else if(strcasecmp("F",argV[1]) == 0){ Temp = Thermocouple1.readFarenheit(); } else { Serial.println("Invalid argument. Usage : TempRead [C/F]"); return; } Serial.println(Temp); return; }
Next, the program checks if the serial port has a message waiting and if so, compares the passed in text with a series of predefined commands. To implement a new function, the if-else if block must have a new strcasecmp case, where strcasecmp compares argV[0] to the desired function command text. The else-if case must then call the desired function and pass any needed variables.
• For example : else if (strcasecmp(argV[0], "TempRead") == 0) { cmdTempRead(argC, argV); }
The given example above was implemented along with the needed electrical components. The serial command “TempRead F” and “TempRead C” were given to the Arduino. The system successfully returned the room temp in both F and C and showed a related increase in temp once the thermocouple was held. Due to the success of this fundamental test, we have high confidence in our ability to deliver a GUI and control scheme that meets the project requirements.
4.2. Material, Geometry and Component Selection
4.2.1. Refractory Cement
The team has not yet chosen a vendor for refractory cement, as it has been difficult to track down accurate numbers for heat transfer co-efficient values. In the budget, CRSCOTE 3000 WET was selected as a placeholder product, because it comes from the same vendor as the ceramic fiber blanket will, which would make logistics a bit easier to manage. Once the team determines the best brand of refractory cement to purchase, both from a price perspective and a material properties perspective, the line item budget will be updated to reflect this.

[33]
4.2.2. Cost Analysis As of the writing of this document, a full budget cannot be compiled because the team has not received a quote for the cost of the power system. Despite that, a list of currently anticipated costs can be found in table 7 below. The largest cost is expected to be the power system, but efforts have been made to defray as much of that cost as possible. Mr. Peri has been asked to use as many of the original components as he can, and the team has offered to drop off and pick up the system, to avoid being charged for transportation. In addition to the unknown cost of Mr. Peri’s services, the team has made room in the budget to hire a Cal Poly Shop Tech to assist with welding the test chamber assembly. Welding stainless steel is difficult in the best of scenarios, and the geometry of the test chamber may make the task too difficult. Cal Poly Shop Techs hire out for $28 per hour, and the team has set aside money to cover 6 hours of Tech time. It is not expected that the welding job will take 6 hours for an experienced welder, but the team felt it was important to err on the side of caution. Also, considering that the current costs are well below the total budget, the extra cost is more than bearable.
Table 7. Line Item Budget as of 6/10/17
Line Item Budget
Source Product # or Name Description Units
Price Per Unit
Before Tax Shipping Total Ordered /
Received
Amazon 2ICMB
2" Ceramic Insulation Blanket 8 Pound #
2400 Degrees 24" x 24" x 2"
2 60 0 120 Both
Sponsor CRSCOTE 3000 WET Refractory Mortar 0 0 0 0 Both
The Home Depot
Model #10312 Plaster of Paris 3 15.98 0 47.94 Both
The Home Depot
Model #801427 Steel Sheet Mesh 2 19.97 0 39.94 Both
Adafruit MAX31855 Thermocouple Board 3 14.95 4.47 49.32 Both
Amazon Graphite
Sheet Gasket
Graphite Sheet Gasket 2 23 0 46 Both
Gentry Welding
Welding Service Welding Assembly 1 150 0 150 Both
The Home Depot HUV33MTS Specialty Tools 1 150 0 150 Both
Total Cost 603.2

[34]
5. Product Realization Because the main focus of team Daedalus was to renovate and improve previous attempts to build the MHTTU, the manufacturing of the system was tailored to new test chamber, new chamber inlet and outlet, and modification of the viewport glass. The manufacturing plan for the MHTTU can be seen in figure 21 below.
Viewport Mod
Turn down hex face to
specified diameter
Face the threaded tube
to specified diameter on
lathe
New Testing Chamber Inlet
Plasma cut appropriate flat pieces of sheet
Bend required
sheet
Fillet joints
Waterjet cutprecision sheet
Break Sharp Edges
Cut Holes
Braise Pipe
Connect Instrument Adapters
Attach Modified Viewport
Female Pipe Connector
Remove pipe from old test
chamber
Shear appropriate sized sheet stock
Figure 21. Manufacturing Flow Chart for Viewport and Inlet Test Chamber

[35]
5.1. Viewport Modifications
The test chamber design from Team Microfire contained a custom size Tate Jones Peepsight for a viewport. It was determined to be necessary as part of the redesign of the test chamber to modify the viewport by removing as much material as possible. In the current system, the viewport is threaded into a modified pipe flange, which is welded onto the front face of the assembly. The mass of the peepsight and the flange it is fitted into represent a large fraction of the mass of the overall system. According to the thermal analysis performed in the system, removing as much mass from the peepsight, and changing the way that it is affixed to the assembly will decrease the ability of the test chamber inlet to act as a heat sink. With the help of professor Georgeou from the IME department, the hexagonal face of the first viewport, which represents a large portion of the mass of the viewport itself, was turned down to a smaller diameter using a CNC lathe. This operation took approximately one hour and thirty minutes. In order to turn down that face, the quartz viewing lens was removed from the viewport, so that it is not damaged by machining operations. The hexagonal face of the second viewport was turned down using the manual lathe in the Mustang ’60 Machine Shop and the Aero Hangar. This is due to the lack of CNC certification to operate the HAAS machines available in both shops. The total machining time to turn down the hexagonal face of the second viewport was approximately two and a half hours. The cutting speed of the manual lathe was 200 RPM and a feed rate of 0.030 IPM. Coolant and a carbide turning tool were used during this operation because of the hardness of the steel viewport material. The modified viewport can be seen in Figure 22.
Figure 22. Modified viewport To complete the changes in the viewport, the threaded pipe portion of the first viewport was faced down using a CNC lathe and the second viewport was faced down using the manual lathe. The main complication to face down the threads was the material of the viewports. Since it is stainless steel, the feed rate was 0.030 IPM and the cutting speed was 200 RPM. These rates were selected to prevent damage to the tool, as well as chatter, and ensuring a proper surface finish. This operation alone took one hour of machining. Because the peepsight glass can be accessed by unthreading the external ring, the viewport was permanently attached to the

[36]
test chamber, and it will still be accessible for possible maintenance of the quartz glass. As previously discussed, the threads of the viewport were compared to the effect of fins inside the test chamber acting as a heat sink. Also, the pipe fitting welded to the testing chamber was completely removed from the modified testing chamber, decreasing the thermal mass of the system by a 52%.
5.2. Manufacturing of Modified Inlet Test Chamber
5.2.1. Waterjet Cut Outlines of Sheet Parts
Team Daedalus had a large piece of 12 gage sheet steel, approximately 4’ by 6’, left behind by a previous MHTTU team. This leftover stock was used to construct the modified inlet and outlet test chambers, and the testing section. After the CAD’s drawings were completed, a PDX file was created to upload in the ITE’s water jet cutter. Then, the sheet metal was placed in the water jet cutter bed, and the program was loaded and initialized. The water jet cutter process was fully automated, and it took approximately 45 minutes.
Figure 23. Water jet cutter process Figure 23 is a picture of the water jet cutter on campus, located in building 21-136, used to cut out the outlines of the pieces of the inlet and outlet testing chamber, and the testing section to be welded together. The outline pieces of the assembly were cut so that when welded, edges welding will have to be use to attach them together.
5.2.2. Bend the Sheet for the Central Body Portion of the Inlet Test Chamber
The thickness of the sheet metal is 0.060 in., and the maximum thickness allowed in the pan brake tables located in the ME shops is 0.060 in; therefore, the bending process of the sheet metal was performed in the hangar shop. To prepare the parts to be bent, the pieces of sheet previously cut with the water jet cutter were measured with a ruler and marked with a sharpie for

[37]
easy identification during the bending process. The pieces of sheet metal were cut thinking to minimize the amount of bents needed to achieve the final assembly; therefore, only four different pieces were needed to bent. Two pieces were the bottom and side walls of the test chambers, and the other two pieces were the walls of the test section that needed to be bent 90 degrees.
5.2.3. Welding Procedure Due to the difficulty of welding thin sheets of stainless steel, Team Daedalus arranged for a Cal Poly welding instructor, Kevin Todd Williams, to complete the welding for the inlet and outlet test chambers, and the test sections; however, there were several setbacks during manufacturing that reduced the time to complete the system. Since Mr. Williams was donating his personal time to complete the welding, it was going to take more time than it was possible. Therefore, the welding was outsourced to Gentry Welding shop, where Chris Gentry completed the welding process. The welding included: edge welding of all the sheet metal pieces for the inlet test chamber, outlet test chamber and the test section. It also included inlet and outlet tubing to connect the chambers to the rest of the system, the tabs used to clamp the system together, and viewports. The finished inlet chamber with all of its components can be seen in Figure 24.
Figure 24. Modified Inlet Test Chamber

[38]
5.2.4. Application of Insulation After research of the benefits of high temperature refractory cement and ceramic wool insulation, it was decided to include these two methods of insulation in the system. Once the welding process was completed and the chambers were accessible, the high temperature refractory cement was applied to the interior of the inlet test chamber, test section and outlet test chamber. The main objective of the refractory cement is to decrease the conductivity coefficient to minimize heat dissipation by conduction. Also, it decreases the losses by radiation to the chambers. To apply the refractory cement, the directions included by the manufacturer were followed, and it was left to cure for 48 hours before any heat cycle, see Figure 25 for an illustration of the process.
Figure 25. Application of High Temperature Refractory Cement Once the refractory cement was completely cured, the ceramic wool insulation was applied. The application started by cutting the ceramic wool blanket to specified dimensions of the chambers and heater tubing. Then, the insulation was held in place by tying it with tie wire of 18 gauge. Finally, the insulation was covered with a layer of adhesive mesh drywall joint tape and cover by three layers of plaster. This method was used to accomplish a finish that would allow future modification, but at the same time provided consistency, support, and coverage for the insulation. The application process for the ceramic insulation can be seen below in figure 26.

[39]
( a ) ( b )
( c ) ( d )
Figure 26. Application process of (a) ceramic wool insulation, (b) insulation tied up with tie wire, (c) insulation covered with adhesive mesh drywall joint tape, and (d) insulation covered in plaster
5.2.5. Data Recording Devices
The final step of the assembly process was to install the measurement devices that consist of three thermocouples and two pitot-tubes. The three thermocouples used to monitor the temperature during testing are located one in the heater coils, the second in the inlet test chamber and the third in the test section chamber. The two pitot-tubes used to calculate the pressure differential of the system are located one in the inlet test chamber and the other in the outlet test chamber.

[40]
5.3. Assembly of Control System There were no parts for the control system that needed manufacturing, and at most consisted of simple soldering of pins or wires. Figure 27 shows the initial, hand drawn wiring diagram for the system.
Figure 27. Initial wiring diagram
This wiring diagram is primarily useful to illustrate how components other than the Arduino are to be connected to power sources. The Arduino connections were changed due to only certain pins being able to output a PWM signal and to utilize the default SPI pins (Digital pins 13, 12 and 11). These new connections are illustrated in Figure 28.
Figure 28. Updated Arduino Board Connections

[41]
The wiring was also planned to be soldered on to a protoboard so as to ensure security of the connections. This was not realized for we never got to tuning and finalizing the electrical system, and were under an immense time crunch to get some testing in. To this end, the wiring was done with breadboards for its speed of construction and modification. Breadboard construction does not lead to very high quality or secure wiring. However, it was decided that some data and testing was better than none. For future teams, it is highly recommended that they finalize the control wiring, by soldering to a protoboard, once they have verified and tuned it.
5.4. Hardware Changes to Realized Prototype vs. Final Design During the critical design report the inlet test chamber and outlet test chamber were to be modified by removing material from non-critical areas as are the corners of the chambers; however, after the presentation to sponsor, Erik Brown, it was concluded that the orientation of the test sampler was not a limitation. Therefore, the test section chamber was modified changing the orientation to a vertical position. By changing the orientation of the test section, the inlet and outlet test chamber could be modified to remove the sloped area leading to the test section. Since the slop was removed, the extra material could be removed further decreasing the thermal mass of the system. This final modification reduced the weight of the inlet and outlet test chamber by 52%. Also, further conversation with Sam Macy led the team to modified the test section chamber dimension to accommodate sample material.
5.5. Control System Changes to Realized Prototype vs. Final Design The control system was not able to be realized to the final design. The fundamental issue was a matter of timing, where due to delays on the power system, little time was available to construct, tune and test the controls. The GUI is operational but its communication protocol with the Arduino either has a bug or our utilization of it is faulty. Due to this, no testing or tuning was possible with the originally developed GUI control system. As a workaround, an Arduino program was developed in order to allow us to test the maximum temperature and heat up time. Unlike the GUI, the testing program is run though a serial terminal and only accepts the runtime and which heaters to use. It then runs the selected heaters at maximum power for the time specified and prints the temperature of the test chamber air and the heater coil every minute. Mass air flow and pressure differential data could potentially be collected, for they are simply a voltage to be read by an Arduino analog pin. However, due to a lack of time, we were unable to calibrate the sensors. Therefore, any voltage reading would be meaningless for we do not know how the voltages map to real world conditions. Because of this, these sensor readings were not collected. 6. Design Verification Due to the problems that were encounter with the controls system, only the maximum temperature and heat-up time tests were able to be run. There was useful data collected however.

[42]
6.1. Maximum Temperature and Warm-Up Time Test of Main Heater Only
The purpose of this test was to determine the time needed to reach 1000°F and the maximum reachable temperature of the system, given any amount of time, using only the main immersion heater. This was achieved by manually setting the flow and running the main heater at maximum power, while polling the temperatures of the heater coils and test chamber every minute.
6.1.1. Test Results Because of the inability to accurately measure the air flow rate during the test, the air pressure had to be manually adjusted with the pressure valve. Although previous calculations indicated that 12 ACFM correspond to 1.5 psi, the pressure valve was manually set to 10 psi to obtain a baseline test. This pressure was selected due to the equipment limitations and maximum resolution. The pressure valve has a resolution of ±2.5 psi, and the air cleaner/dryer has a minimum operating pressure of approximately 2.5 psi. Therefore, the air pressure in the first test was set to 10 psi and the heater was operated at full load at all times. During this test the temperatures at the heater coils and the inlet test chamber were recorded until it reached a steady temperature of 900 °F and 480 °F, respectively. This test was performed for 12 minutes. After the system reached a steady state, the air pressure was reduced to 5 psi to observe the new maximum temperature. The maximum temperatures under these conditions were recorded to be 1200 °F in the heater coils and 660 °F in the inlet test chamber after 10 minutes of air flow. Lastly, the air pressure was dropped to its minimum pressure allowed by the equipment of approximately 2.5 psi. With this air pressure, the maximum temperature measured at the heater coils was 1540 °F, and the maximum recorded temperature in the inlet test chamber was 835°F. these temperatures were recorded after 45 minutes of testing, and the data collected can be observed bellow in figure 29.
Figure 29. Graph of Temperature vs Time of Test One (Embedded Data)
0
200
400
600
800
1000
1200
1400
1600
1800
0 5 10 15 20 25 30 35 40
Tem
pera
ture
, T [
°F ]
time, t [ m ]
Heater Temp vs Time
Chamber Temp vs Time
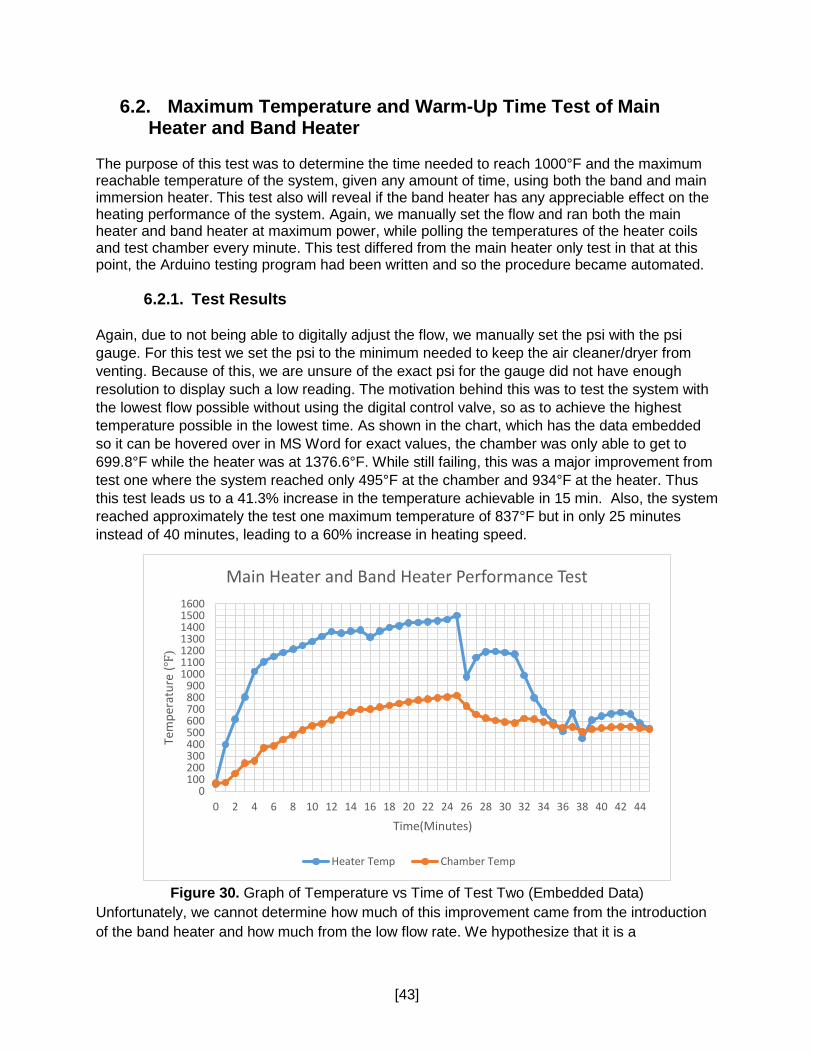
[43]
6.2. Maximum Temperature and Warm-Up Time Test of Main Heater and Band Heater
The purpose of this test was to determine the time needed to reach 1000°F and the maximum reachable temperature of the system, given any amount of time, using both the band and main immersion heater. This test also will reveal if the band heater has any appreciable effect on the heating performance of the system. Again, we manually set the flow and ran both the main heater and band heater at maximum power, while polling the temperatures of the heater coils and test chamber every minute. This test differed from the main heater only test in that at this point, the Arduino testing program had been written and so the procedure became automated.
6.2.1. Test Results Again, due to not being able to digitally adjust the flow, we manually set the psi with the psi gauge. For this test we set the psi to the minimum needed to keep the air cleaner/dryer from venting. Because of this, we are unsure of the exact psi for the gauge did not have enough resolution to display such a low reading. The motivation behind this was to test the system with the lowest flow possible without using the digital control valve, so as to achieve the highest temperature possible in the lowest time. As shown in the chart, which has the data embedded so it can be hovered over in MS Word for exact values, the chamber was only able to get to 699.8°F while the heater was at 1376.6°F. While still failing, this was a major improvement from test one where the system reached only 495°F at the chamber and 934°F at the heater. Thus this test leads us to a 41.3% increase in the temperature achievable in 15 min. Also, the system reached approximately the test one maximum temperature of 837°F but in only 25 minutes instead of 40 minutes, leading to a 60% increase in heating speed.
Figure 30. Graph of Temperature vs Time of Test Two (Embedded Data)
Unfortunately, we cannot determine how much of this improvement came from the introduction of the band heater and how much from the low flow rate. We hypothesize that it is a
0100200300400500600700800900
1000110012001300140015001600
0 2 4 6 8 10 12 14 16 18 20 22 24 26 28 30 32 34 36 38 40 42 44
Tem
pera
ture
(℉)
Time(Minutes)
Main Heater and Band Heater Performance Test
Heater Temp Chamber Temp

[44]
combination of both and that low or no flow conditions with the band heater should be the next set of tests to be done.
6.3. Uncertainty and Error Propagation Since the two previous tests only have one source of data, without any calculations done on them, the uncertainty is equal to the uncertainty of the thermocouple which is ±0.75% of the value reported. This was based on data provided by the manufacturer, Omega. Again, since there is only one variable and no functions they are being used in, there is no error propagation and the error of the whole system is equal to the error of the thermocouple stated above of ±0.75%.
6.4. Design Verification Plan and Report The DVP&R below provides a quick overview of our design specifications, tests and test results.
Report Date 6/14/2017 Sponsor LLNL Component/Assembly mHTTU Team Daedalus
Quantity Type Start date Finish date Test Result Quantity Pass Quantity Fail
1
Flowrate Max/Min Flowrate Testing 0.5-12 ACFM PC PV 2 C 6/2/2017 6/7/2017 N/A Unable to test it due to data collection problems. Should not have changed from prior team.
2 Test Chamber Temperature
Warmup Cycle Testing (15 Min) 1000 °F KL PV 2 C 6/2/2017 6/7/2017 699.8 °F 2
3 Temperature Rise Time
Warmup Cycle Testing (Max Temperature)
15 minutes KL PV 2 C 6/2/2017 6/7/2017 25 min 2
4 Power Supply Voltage Verification 240 VAC N/A PV 1 C 5/22/2017 5/29/2017 240 VAC 1
5
Back pressure Pressure Measurements 12 In. H2O PC PV 2 C 6/2/2017 6/7/2017 N/A Unable to test it due to data collectiona and calibration problems.
6 Size Visual Inspection Fits through standard door
N/A PV 1 C 6/2/2017 6/7/2017 Pass 1
7
Usability End User Usability Testing Reliable and easy to use
KL PV 2 C 6/2/2017 6/7/2017 Pass 2 System is simple to run but cannot change its test routine and has no GUI.
8
Test Routine Features Functionality Inspection Vary testing dynamically
KL PV 2 C 6/2/2017 6/7/2017 Pass 1 GUI has all functionality in place to vary testing parameters and to develop custom routines, but does not interface with the system due to communication bugs.
9Safety Safety Inspection (Cal Poly) Meets Cal Poly
safety requirementsN/A PV 1 C 6/2/2017 6/7/2017 Pass 1 System approved for
power on campus.
10 Cost Budget Analysis Under $3000 N/A PV 1 C 6/2/2017 6/7/2017 Pass (w/o Aaron)
1
11
Flow Characteristics Drag Analysis Reynolds number in laminar range
PC PV C 6/2/2017 6/7/2017 N/A Unable to test due to sensors not being calibrated and no method had been developed to determine pass/fail.
12
Interface Functionality Inspection GUI (Basic Interface Acceptable)
KL PV 2 C 6/2/2017 6/7/2017 Fail 2 Interface has a bug its its communications protocol. Other sensors not calibrated.
NOTES
ME428 DVP&R
TEST PLAN TEST REPORTItemNo
Specification or Clause Reference Test Description Acceptance Criteria Test
ResponsiTest Stage SAMPLES TIMING TEST RESULTS

[45]
7. Conclusions and Recommendations Unfortunately, Team Daedalus was not successful in accomplishing a system that meets the specifications of Lawrence Livermore. The primary catalyst for the failure was the 2 quarter long delay in getting a working power system that was safety approved for on campus power-up. The control system remains incomplete as of the end of senior project, so our primary suggestion is to complete the debugging of the code. We suggest future teams start with figuring out how to get the Arduino to return a value to Instrumentino though serial. Then we suggest modifying the PID library to accept an integer rather than poll a voltage. From the testing that was done, we hypothesize that our modifications, while they did improve the thermal capabilities of the system, did not address every heat leak in the system. Little heat was felt leaving though the insulated parts, though there were a few areas that did feel hotter than others. These places could do with more insulation to prevent heat losses, but the effect would probably be minimal. We would suggest for future teams to perform FLIR or other thermal camera testing to see where heat leaks are.
In our testing though, major amounts of heat were found to be leaving the system though the brackets that join each section together, so one recommendation we make to future teams is to explore the possibility of either welding the inlet test section to the heater section to remove the need for the brace, or simply insulating the brace. Team Daedalus also was investigating alternative heaters that were more specialized at heating air. The idea behind that was since the immersion heater is designed for stagnant liquids, that flowing air would not be able to fully utilize the heaters energy due to a small surface area. Should further insulate improvements still not produce the desired results, we strongly recommend that future teams look into alternative heaters. This was hypothesized by team Daedalus, but due to lack of evidence and a high cost we were not able to get sponsor approval to buy a new heater.
[46]
Works Cited [1]. Trinchero M., Nagengast, J., Wood A., “Mini-High Temperature HEPA Filter Test Unit, Final
Design Report,” Cal Poly Team Phoenix, San Luis Obispo, CA, June 2015. [2]. “HEPA Air Filter History and Facts,” 2013, July 19. October 22, 2016, from
https://aircleaners.com/hepahistory/ [3]. “HEPA Filters and Filter Testing: A Comparison of Factory Tests and In-Service Tests,”
(Tech. No. PB2007-0504). (2007). October 22, 2016. from http://www.flanderscorp.com/files/FlandersFFI_literature/Filter Testing Guide_18pgs.pdf
[4]. Myers, T. E., & Melgaard, H. L. (2001, September 1). “Air Filtration at High Temperature”.
Cemag.com. October 22, 2016. http://www.cemag.us/article/2002/09/air-filtration-high-temperatures [5]. Thermal Testing Systems [Advertisement]. (n.d.). Cellular Materials. October 22, 2016,
from http://www.cellularmaterials.net/thermal-testing.html [6]. Paxton K. and Parsons, Michael S. and Unz, Ronald J. and Waggoner, Charles A. “Large-
scale generic test stand for testing of multiple configurations of air filters utilizing a range of particle size distributions”., Review of Scientific Instruments, 83, 055105 (2012), DOI: http://dx.doi.org/10.1063/1.4717671
[7]. “Closed Loop Wind Tunnel | CLWT-115,” (n.d.). October 22, 2016. from
http://www.qats.com/Products/Wind-Tunnels/Closed-Loop-Wind-Tunnels/CLWT-115 [8]. Fakheri, Ahmad, Heat Exchanger Efficiency. Journal of Heat Transfer. Sep 2007. From
www.researchgate.net/publication/237144382_Heat_Exchanger_Efficiency [9]. Mitchell, M. A., Brown, E., & Haslam, J. (2013, October 31). E-reports-ext.llnl.gov (United
States, Laurence Livermore National Laboratory). October 22, 2016, from https://e-reports-ext.llnl.gov/pdf/765150.pdf
[10]. “Gobetwino : Arduino talking to Excel” Web, October, 2016. From
https://boolscott.wordpress.com/2009/12/24/gobetwino-arduino-talking-to-excel/ [11]. “Mineral Wool Conductivity” Web, Febuary, 2017 http://www.engineeringtoolbox.com/mineral-wool-insulation-k-values-d_815.html [12]. Murray Electric Systems Murray, Disconnect Switch, GHN321N [Product Webpage].
https://www.mrsupply.com/murray-disconnect-switch-ghn321n.html [13]. Ferraz Shawmut Ferraz Shawmut 63000 Series (Aluminum Connector) [Product
Webpage] Retrieved from http://www.ferrazshawmutsales.com/63000_series_aluminum.htm
[14]. ABL Susrum 2C10UL [Product Webpage]. From https://midanelec.com/index.php?main_page=product_info&cPath=61&products_id=270

[47]
[15]. ABL Susrum 2D2UL [Product Webpage]. From https://midanelec.com/index.php?main_page=product_info&products_id=277
[16]. OMEGA Solid State Relays for Vdc and Vac Input/ Vac Output [Product Webpage].
http://www.omega.com/pptst/SSR330_660.html [17]. Altech Corporation PS-240 Series [Product Webpage]. From
http://www.altechcorp.com/power/PDFs/PS-S40.pdf [18]. Altech Corporation DIN Rail Power Supplies [Product Catalog]. From
http://www.altechcorp.com/power/PDFs/PowerSupplies.pdf [19]. ETI Fuse Disconnector VLC 10 [Product Catalog]. From
http://www.predpazitel.com/pdf/VLC10_14_22.pdf [21]. “Gobetwino” Web, February, 2017. From
http://mikmo.dk/gobetwinodownload.html [22]. “Instrumentino: An Open-Source Software for Scientific Instruments”
Web, February, 2017 From https://github.com/yoelk/instrumentino/blob/master/documents/2%20article%20in%20CHIMIA.pdf

[48]
Appendices Appendix A – Idea Selection Process and Matrices Quality Function Deployment
Figure 30. Quality Function Deployment

[49]
Pugh Matrices Airflow Control
Function: Controlling Airflow Datum Solution Alternatives
Key Criteria Impo
rtan
ce R
atin
g
Con
trol v
alve
Man
ual V
alve
Fan
No
valv
e
Man
ual d
ampe
r
Aut
omat
ic d
ampe
r
Adjustability 10
- - - - S
Cost 6 + - + - +
Reliability 9 - - - - S
Size 3 S - + + -
Ease of use 5 - + + + S
Power consumption 8 + S + + S
Ease of maintenance 3 S + + + S
Sum of Positives 2 2 5 4 1
Sum of Negatives 3 4 2 3 1
Sum of Sames 2 1 0 0 5
Weighted Sum of Positives 14 8 25 19 6
Weighted Sum of Negatives 24 28 19 25 3
TOTALS -10 -20 6 -6 3
Concept Selection Legend
Better + Same S Worse -

[50]
Heating Air
Function: Heating Air Datum Solution Alternatives
Key Criteria Impo
rtan
ce R
atin
g
Wat
low
Imm
ersi
on
Hea
ter
Infin
ity F
luid
s C
RE
S-
ILA
Syl
vani
a H
eat T
ool
Bes
poke
Nic
hrom
e W
ire H
eate
r
Tem
pco
Pak
Hel
ical
C
oil H
eate
r
Gas
Hea
ter
Heater Can Reach 1300F 8
- + + + S
Electronically Controllable 6 S S S S -
Runs on 240V AC 7 S S S S -
Operation Safety 7 S S - S -
Convection Potential 6 - S S + S
Durability 4 S - - S +
Cost 7 S - + + +
Meets Flowrate Requirements 8 S S S S S
Works with Heat Exchanger 4 S S S S S
Sum of Positives 0 1 2 3 2
Sum of Negatives 2 2 2 0 3
Sum of Sames 7 6 5 6 4
Weighted Sum of Positives 0 8 15 21 11
Weighted Sum of Negatives 14 11 11 0 20
TOTALS -14 -3 4 21 -9
Concept Selection Legend Better + Same S Worse -

[51]
Heater Controls
Heater Controls
Concepts 1 (Datum) 2 3 4 5
Criteria
.5-12 AFCM Flowrate S S S S
1300F in Test Chamber S S S S
Less than 15 Min Warm Up Time S S S S
220V AC Compatible S S S S
Up to 12" H2O Back Pressure S S S S
Portable, Fit Through Standard Door + + + S
Reliable, Commented Code S - - S
Can Alter Routine Mid Test S S S +
Export Data to Excel + + + +
Basic Interface - - - S
GUI - + - S
Fit 2"x6"x12" HEPA Media In Chamber S S S S
Safe to Operate + + + S
Accurate Documentation - - - S
Total Cost <$3000 + - - S
Laminar Flow S S S S
Total + 4 4 3 2
Total - 2 4 5 0
Total S 9 8 8 14
Sum 2 0 -2
2

Appendix B –Detailed Drawings Bill of Materials
Assy Level Part Number Matl Vendor Qty Cost Ttl CostLvl 0 Lvl 1 Lvl 2 Lvl3
0 100000 Mini High Temperature Machine1 100101 Cart Stainless Steel 1 - -1 100102 Wood fixture Wood 1 - -1 100103 Mounting rail Stainless Steel 1 - -2 100201 Immersion Heater Watlow Incoloy Watlow 1 - -2 100202 Duct Stainless Steel 1 - -2 100203 Insulation Ceramic Insulation McMaster - -3 100301 Testing chamber Stainless Steel McMaster 2 - -3 100302 Viewport Nickel-plated Steel Tate-Jones Inc 2 - -3 100303 Thermocouples Omega 2 - -3 100304 Static tubes Dwyer 2 - -
C-clamp McMaster 23 100305 Toggle clamp McMaster 83 100305 Insulation Ceramic Insulation McMaster - -3 100306 Testing section Stainless Steel 1 - -3 100307 Thermocouples Omega 1 - -3 100308 Static tubes Dwyer 1 - -3 100309 Insulation Ceramic Insulation McMaster - -4 100401 Exhaust Stainless Steel 1 - -4 100402 Safety guard Stainless Steel 1 - -5 100501 Air flow control - -5 100502 Pressure Transducer Omega 1 - -5 100503 3-way valve Swagelok 1 - -5 100504 pipe Stainles Steel - -5 100505 Rotometer 1 - -5 100506 Anemometer 1 - -5 100507 Pressure gage Plastic 1 - -
Control valve Cole-Parmer5 100508 Pipe fittings Bronze 10 - -6 100601 Control system - -6 100602 Arduino - Lawrence Livermore National Lab 1 - -7 100701 Power system 1 - -
- -
Indented Bill of MaterialMini High Temperature Machine
Description
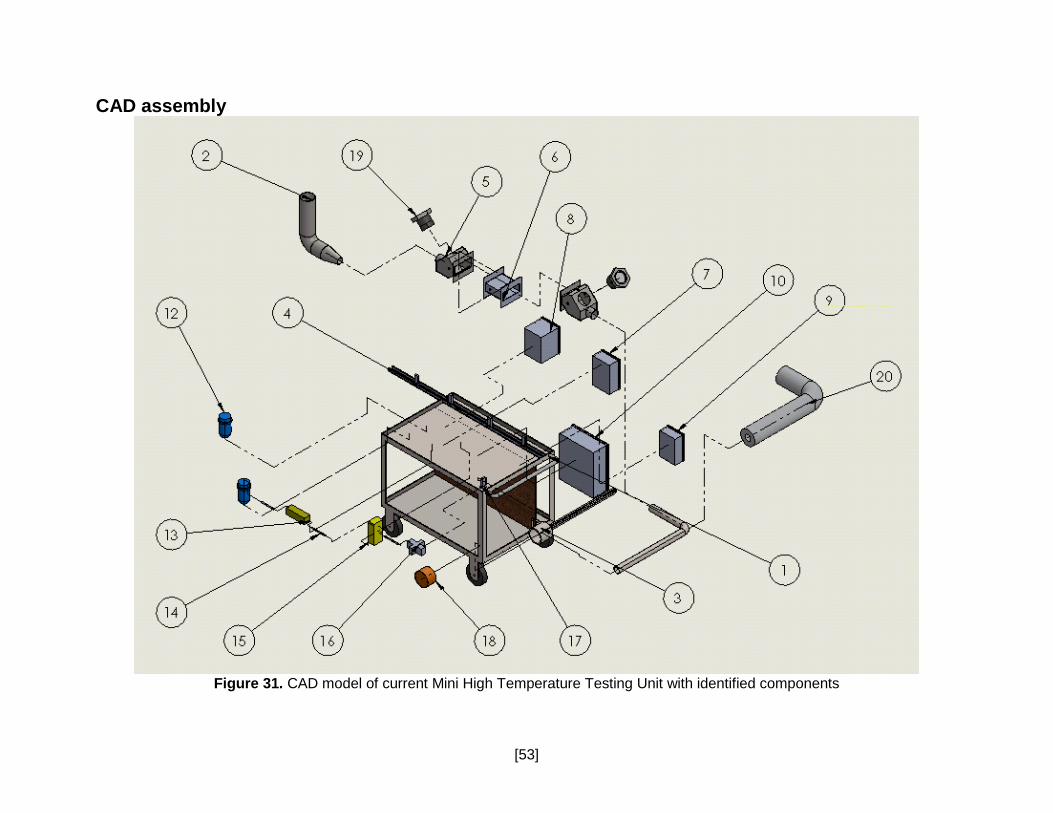
[53]
CAD assembly
Figure 31. CAD model of current Mini High Temperature Testing Unit with identified components

Table 8. List of Mini High Temperature Testing Unit components
Component Number Component Description
1 Cart 2 Exhaust 3 In-line emerging heater 4 Rail 5 Testing chamber 6 Testing section 7 Control system enclosure 8 Control system enclosure 9 Power system enclosure
10 Power system enclosure 12 Air flow meter 13 Anemometer 14 Air flow pipe 15 Control valve 16 3-way valve 17 Holder 19 Hi-Temp peep glass 20 Insulation of heater

CAD of Redesigned Inlet and Outlet Testing Chamber

[56]
Figure 32. Modified Inlet and Outlet Testing Chamber
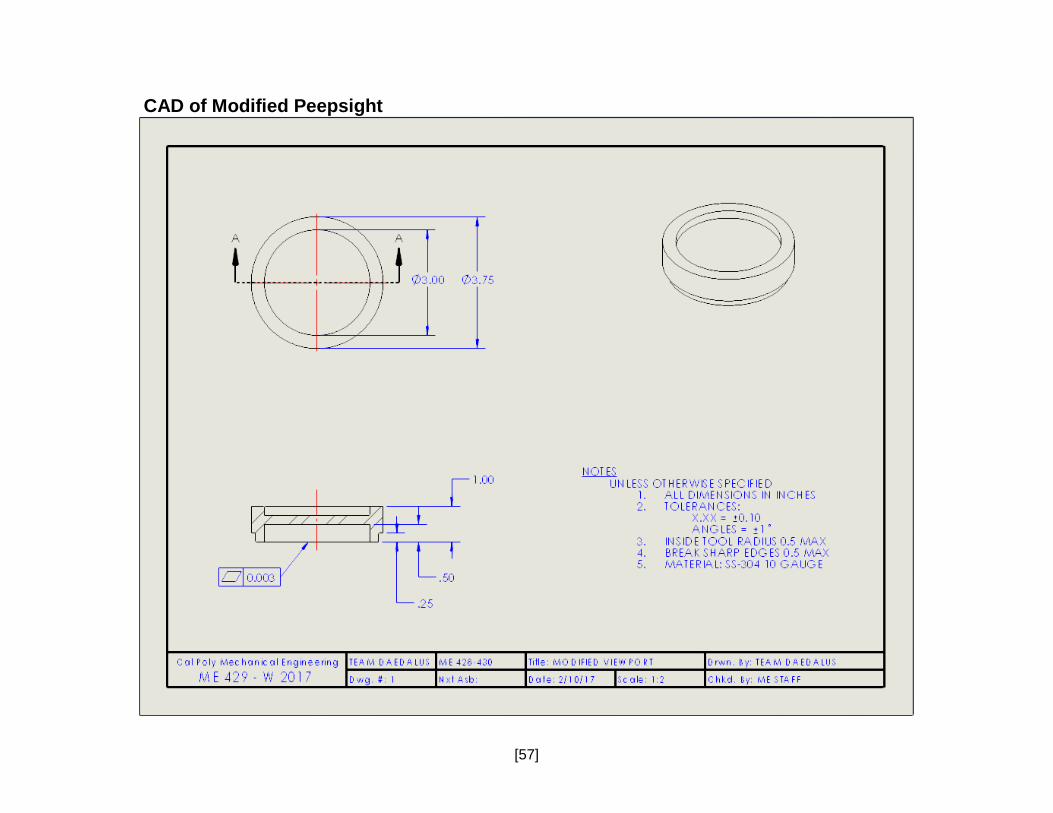
[57]
CAD of Modified Peepsight

[58]
Figure 33. Modified Viewport Glass

[59]
CAD of Modified Testing Section Chamber

[60]
Short Clam for Attachment

[61]
Long Clamp for Attachment

[62]
Modified Chamber Assembly

Appendix C – Power System Documentation Murray GHN321N General Duty Switch Description [13]
The Murray GHN321N is a general purpose, manually thrown, electric switch. In the MHTTU, it is wired directly to the 240VAC socket plug. Specifications
• Rated for a maximum of 240V AC and 600A. • Lockable enclosure. • 2 poles. • Features 2 fuses in line with both the hot and neutral power supply lines.
Ferraz Shawmut 63133 Power Distribution Block Description [14] The FS 63133 is used to split the primary input power line to the MHTTU into three sets of two wires, one hot and one neutral. The ground wire is run in parallel with the power lines. Specifications
• Modular design allows for more adder poles. • Rated for 95-240A and 600V. • Works with aluminum or copper wiring.
ABL Susrum 2C10UL Circuit Breakers Description [15] The FS 63133 is used to split the primary input power line to the MHTTU into three sets of two wires, one hot and one neutral. The ground wire is run in parallel with the power lines. Specifications
• Modular design allows for more adder poles. • Rated for 95-240A and 600V. • Work with aluminum or copper wiring.
ABL Susrum 2D2UL Circuit Breaker Description [16] The MHTTU has one 2D2UL breaker after the power distribution block, and further connected to the control board. The purpose of this breaker is likely to protect the vulnerable Arduino board from power surges.
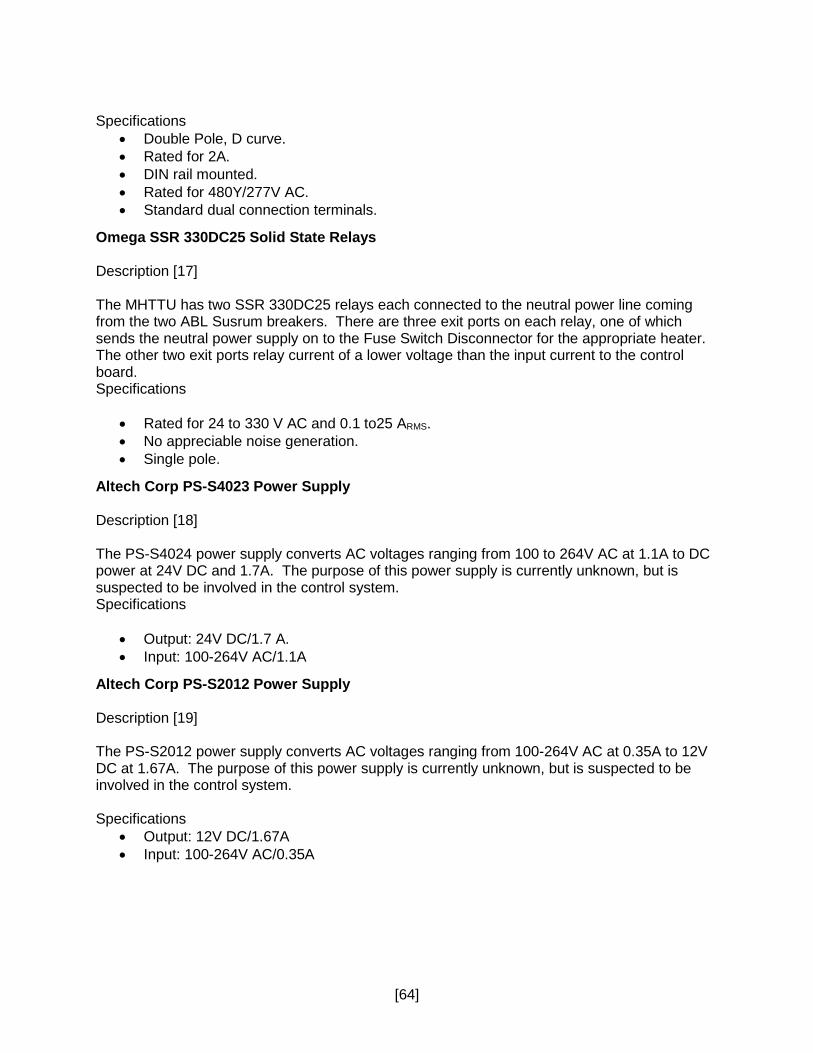
[64]
Specifications
• Double Pole, D curve. • Rated for 2A. • DIN rail mounted. • Rated for 480Y/277V AC. • Standard dual connection terminals.
Omega SSR 330DC25 Solid State Relays Description [17] The MHTTU has two SSR 330DC25 relays each connected to the neutral power line coming from the two ABL Susrum breakers. There are three exit ports on each relay, one of which sends the neutral power supply on to the Fuse Switch Disconnector for the appropriate heater. The other two exit ports relay current of a lower voltage than the input current to the control board. Specifications
• Rated for 24 to 330 V AC and 0.1 to25 ARMS. • No appreciable noise generation. • Single pole.
Altech Corp PS-S4023 Power Supply Description [18] The PS-S4024 power supply converts AC voltages ranging from 100 to 264V AC at 1.1A to DC power at 24V DC and 1.7A. The purpose of this power supply is currently unknown, but is suspected to be involved in the control system. Specifications
• Output: 24V DC/1.7 A. • Input: 100-264V AC/1.1A
Altech Corp PS-S2012 Power Supply Description [19] The PS-S2012 power supply converts AC voltages ranging from 100-264V AC at 0.35A to 12V DC at 1.67A. The purpose of this power supply is currently unknown, but is suspected to be involved in the control system. Specifications
• Output: 12V DC/1.67A • Input: 100-264V AC/0.35A

[65]
Appendix D – Power System Circuit Diagram

[66]
Appendix E – Desired Power System Block Diagram

[67]
Appendix F – Manufacture Specification Sheets

[68]

[69]

[70]

[71]

ETI VLC 10 Fuse Disconnectors Description [20] The VLC 10 Fuse Disconnectors serve as another check on the machine’s power system. In the event of a power spike, the fuses within the disconnectors will blow and electricity will stop flowing to the heating system. Specifications
• 2 pole input/output. • Input: Max 32A, 690V AC.

[73]
Appendix G – Detailed Supporting Analysis

[74]
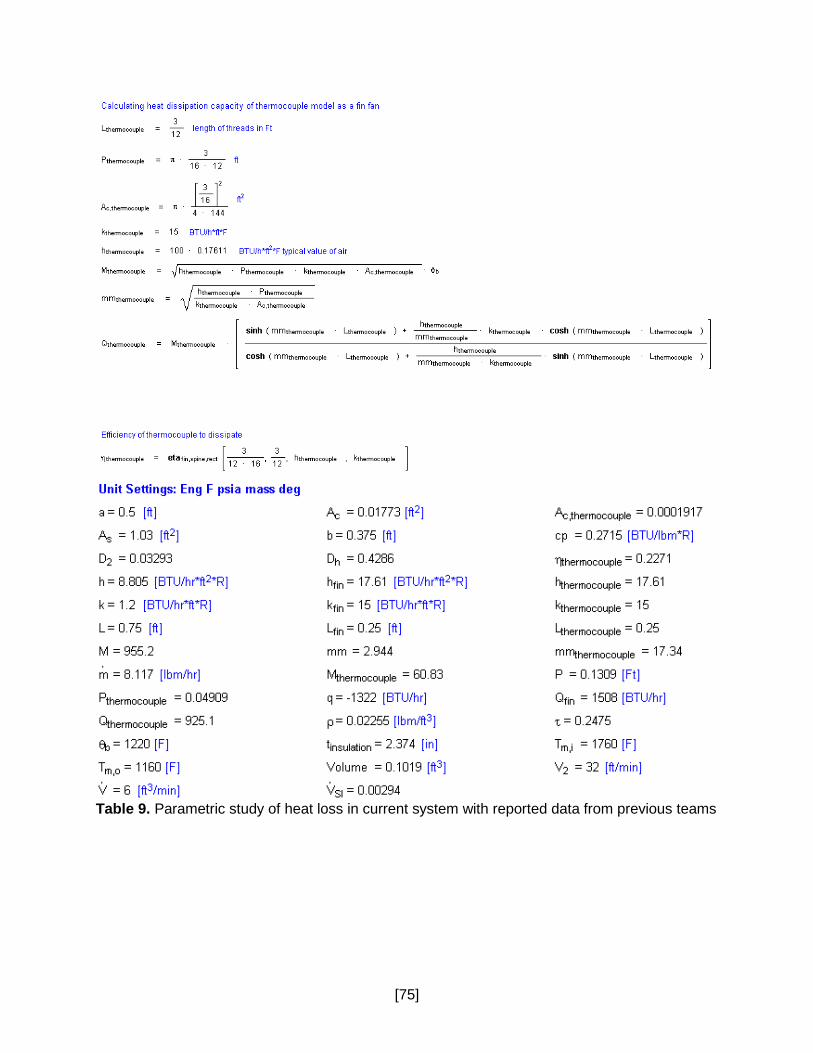
[75]
Table 9. Parametric study of heat loss in current system with reported data from previous teams

[76]
Table 8 is a parametric study as a function of the different volumetric flow rates required by the sponsor, where “q” represents the calculated heat loss of the current system
Appendix H – Operators Manual and Testing Procedures Document begins on next page.
[77]
Prepared for: Erik Brown
(Lawrence Livermore National Laboratory)
Prepared by:
Team Daedalus June 16, 2017
Kevin Liu Pablo Castillo
[email protected] [email protected]
Instructor:
Dr. Peter Schuster
Mechanical Engineering Department California Polytechnic State University
San Luis Obispo
Mini-High Temperature HEPA Filter Test Unit
Operators Manual and Testing Procedures

[78]
Pre-Power Up Check List
� Protective gear is available and in good condition � Welding Gloves � Safety Googles � Dust Mask
� Check temperature of system with non-contact thermometer � Test section clamps temperature < 50°C 1 � Test section metal temperature < 60°C 1 � Test section glass temperature < 85°C 1
� Insulation is in good condition (No holes, rips, tears, etc.) � Safety cage is placed around exhaust � Warning labels are visible
� On exhaust cage � On inlet viewport � On outlet viewport
� Graphite gaskets are in good condition o Between inlet and test section o Between test section and outlet
� Over-heat temperature sensors are secured � Sensor 1 – By air inlet � Sensor 2 – By test section
� Arduino USB connection to laptop is secured � Control program is loaded and running on a laptop

[79]
Preliminary System Testing (Max Temp and Heat-up Time)
The preliminary system does not have an integrated control system. The system is pre-configured to run at max heater output, with a manually adjusted flow and manually swapped temperature testing location.
Caution: Do not turn on power to the system until shop air is connected and flowing. 1) Complete the pre-power up checklist. Report any failures and cease operation if any failures found. 2) Don all protective gear (Gloves, Googles and Mask) . 3) Attach shop-air and 240v power inputs. 4) Start a small flow. 5) Manually adjust shop air via PSI gauge near input to desired PSI 6) Turn the testing unit’s power switch to on. 7) Apply 5v to the positive control wire and GDN to the common of the desired heater/heaters and
begin timing. 8) Use an Arduino serial monitor to monitor temperature, polling every minute and ensuring the
desired location is attached to thermocouple port 1. a) Attach the test chamber thermocouple to port 1. b) Issue serial commands "TempRead F 1" or 'TempRead C 1" to return temperature of the test
chamber. c) Attach the immersion heater coil thermocouple. d) Issue serial commands "TempRead F 1" or 'TempRead C 1" to return temperature of the
immersion heater coil. e) Repeat every minute for 15 Min to see if heat-up time is meet. f) Continue until 1000°F is reached, record time. g) Continue until test chamber no long increases in temperature, record time and temperature.
9) Once testing is done, remove the 5v signals and open the psi gauge to max and cool the system for at least 45 min.
Arduino Automated System Testing (Max Temp and Heat-up Time) The test is functionally equivalent to the preliminary testing instructions, except that the process has been automated by the Arduino program.
Caution: Do not turn on power to the system until shop air is connected and flowing. 1) Complete the pre-power up checklist. Report any failures and cease operation if any failures found. 2) Don all protective gear (Gloves, Googles and Mask) . 3) Attach shop-air and 240v power inputs. 4) Start a small flow. 5) Turn the testing unit’s power switch to on. 6) Manually adjust shop air via PSI gauge near input to desired PSI. 7) Use an Arduino serial monitor to issue the serial command “RunTest [Main/Band/Both] <time>”,
where the second argument tells the system what heaters to use and <time> is an amount of time in minutes. The Arduino will now turn on the heaters and poll both thermocouples every minute and print the results to serial, formatted with the time. a) Test for 15 minutes to determine if heat-up time is meet. b) Test for an arbitrary amount of time until the test chamber is 1000°F. c) Test for an arbitrary amount of time till the test chamber no longer raises in temperature.
8) Once testing is done, open the psi gauge to max and cool the system for at least 45 min.
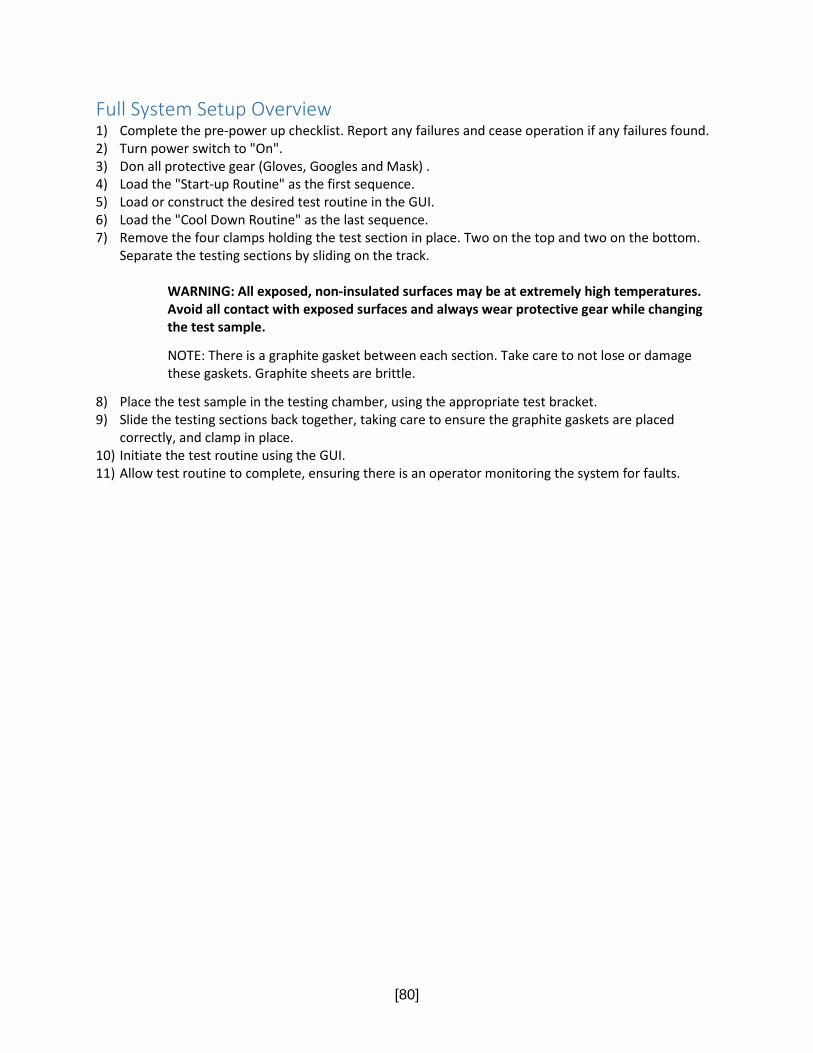
[80]
Full System Setup Overview
1) Complete the pre-power up checklist. Report any failures and cease operation if any failures found. 2) Turn power switch to "On". 3) Don all protective gear (Gloves, Googles and Mask) . 4) Load the "Start-up Routine" as the first sequence. 5) Load or construct the desired test routine in the GUI. 6) Load the "Cool Down Routine" as the last sequence. 7) Remove the four clamps holding the test section in place. Two on the top and two on the bottom.
Separate the testing sections by sliding on the track.
WARNING: All exposed, non-insulated surfaces may be at extremely high temperatures. Avoid all contact with exposed surfaces and always wear protective gear while changing the test sample.
NOTE: There is a graphite gasket between each section. Take care to not lose or damage these gaskets. Graphite sheets are brittle.
8) Place the test sample in the testing chamber, using the appropriate test bracket. 9) Slide the testing sections back together, taking care to ensure the graphite gaskets are placed
correctly, and clamp in place. 10) Initiate the test routine using the GUI. 11) Allow test routine to complete, ensuring there is an operator monitoring the system for faults.