miniaturization technologies for cost-effective ampliseq library … · 1 miniaturization...
TRANSCRIPT
1
Miniaturization technologies for cost-effective AmpliSeq library preparation for next generation sequencing
Eri Ogiso-Tanaka†, Akito Kaga, and Makita Hajika Institute of Crop Science (NICS), NARO (National Agriculture and Food Research Organization),
2-1-2 Kannondai, Tsukuba, Ibaraki 305-8602, Japan
†Corresponding author: Eri Ogiso-Tanaka, Tel: +81-29-838-7452; E-mail: [email protected]
Abstract Purpose: AmpliSeq technology, the target enrichment method of next generation sequencing (NGS),
enables quick and easy detection of the genomic "hot spot" region frequently mutated in species. Since the cost of next-generation sequencing has decreased, library preparation cost accounts for a more significant proportion of the total cost. If AmpliSeq library can be prepared at a lower cost,
large-scale precision oncology can be more easily carried out. Furthermore, this technology can be widely applied not only to medical research, but also to polymorphism detection in biology. This study aimed to reduce the cost of AmpliSeq library preparation by adopting miniaturization technology.
Methods: We used approximately 10 ng of genomic DNA for ultra-multiplex PCR of 384, 768, 1152,
1920, and 3072 amplicons. Multiplex PCR was performed in a total volume of 1.6, 2.0, and 2.4 µL, using a nano-litre liquid handler, for library preparation.
Results: The success rate of library construction decreased with decrease in total multiplex PCR
reaction volume. Using 1.6-, 2.0-, and 2.4-µL reactions, success rate of ultra-multiplex PCR was 25 %, 95 %, and 100 %. We could stably create libraries of the correct amplicon size, with the
amplicon number of approximately 1500 or less. As a result of NGS, uniformity of PCR amplification and read length of quality-checked libraries were hardly affected by the number of amplicons.
Conclusion: Here, we present that minimum volume for a stable reaction was 2.4 µL, and maximum amplicons obtained were approximately 1500. The protocol saved 86.8 % in reagents, and reduced handling time by 85 %, compared to that in the manual protocol. Therefore, miniaturization technologies could reduce the cost of AmpliSeq library preparation through minimization of reagents.
2
Introduction Genotyping by sequencing (GBS), using next-generation sequencing (NGS), is becoming an increasingly useful technique in the fields of biology and agronomy [1-3]. In recent years, the cost of
sequencing per base has drastically reduced, although the library preparation and time involved still remain high. AmpliSeq technology (Thermo Fisher Scientific, Waltham, MA) is a GBS method that is often used in
cancer research [4,5]. Although the AmpliSeq library kit is very expensive (about 64 USD or 9,500 JPY/sample), highly multiplexed PCR (of approximately 6000 primer pairs) is possible with it. AmpliSeq technology is beginning to be used in other fields as well, and is sold as AgriSeq in the fields
of biology and agronomy [5-7]. In the field of agronomy, especially in crop breeding sites, genotyping of thousands of large samples is
carried out often. But GBS is still expensive and required time and labor for analysis. Therefore, it is difficult to use easily in practical crop breeding, and is mainly used in research or project. To decrease the cost of GBS, a quick way is to decrease library preparation cost. The simplest way for that is to
reduce the reaction volume. In manual library preparation, volume reduction by more than half to one quarter is not realistic. Quality deterioration of the library is highly probable with reduction in the amount of reaction volume in case of manual preparation. Therefore, in order to sufficiently reduce the
cost, it is necessary to have a robot, capable of transferring minute quantities of liquid that cannot otherwise be handled by human.
Till date, only few protocols for miniaturized library preparation in GBS have been reported. To reduce the cost and time limitations of current library preparation techniques, we tried to adapt our AmpliSeq, one such GBS method that follows a miniaturized reagent protocol, using Mosquito HTS (TTP
Labtech, Royston, UK), which is a positive displacement pipetting instrument. Mosquito HTS offers
highly accurate and precise multichannel pipetting (8 or 16 channels) from 25 nL to 1.2 µL. Mosquito HTS was originally used for protein crystallization [8]. Recently, Mosquito HTS and another model
Mosquito HV have been used for single-cell RNASeq analysis [9-15]. Mosquito HV being a
high-volume model (500 nL to 5 µL), does not save enough reagent and does not minimize cost of AmpliSeq library prep. Here, we describe AmpliSeq library preparation that provides miniaturized,
automated, cost- and time-efficient 384-well library preparation with its quality and performance.
Materials DNA preparation DNA was extracted from young leaf of four soybean cultivars (cv. Aso Masari, cv. Suzuotome, cv.
Tachiyutaka, and cv. Toyoshirome) using bead-based method (chemagic DNA plant kits, PerkinElmer, Waltham, MA) with BioSprint 96 DNA plant kit on robotic workstation (Qiagen, Hilden, Germany). Extracted DNA quality was evaluated based on DIN value (DNA Integrity Number), which is an index
showing the fragmentation extent of DNA using TapeStation 4200 (Agilent Technologies, Santa Clara,
3
CA). DNA concentration was measured with the Qubit Fluorometer (Thermo Fisher Scientific, Waltham, MA) by exciting at 485 nm and measuring the fluorescence intensity at 520 nm. The instrument was calibrated with the Quant-iT Qubit dsDNA BR and HS Assay kit (Thermo Fisher
Scientific, Waltham, MA), following the manufacturer’s instructions.
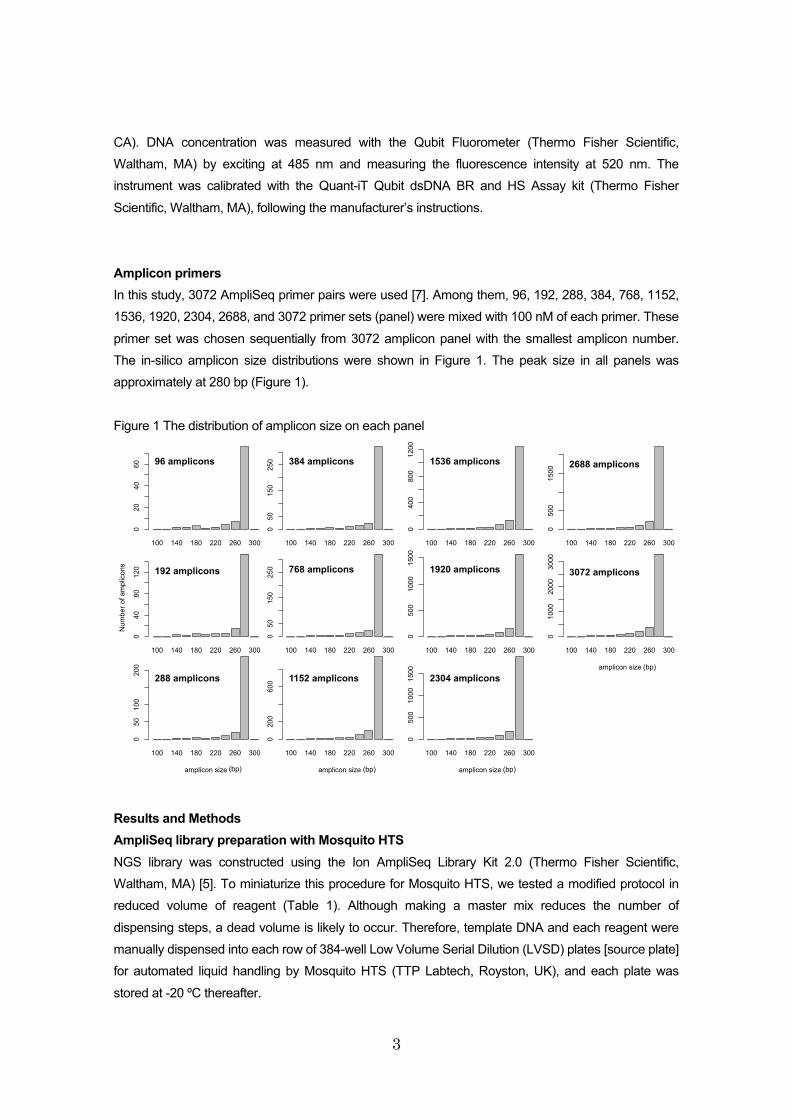
Amplicon primers In this study, 3072 AmpliSeq primer pairs were used [7]. Among them, 96, 192, 288, 384, 768, 1152, 1536, 1920, 2304, 2688, and 3072 primer sets (panel) were mixed with 100 nM of each primer. These
primer set was chosen sequentially from 3072 amplicon panel with the smallest amplicon number. The in-silico amplicon size distributions were shown in Figure 1. The peak size in all panels was approximately at 280 bp (Figure 1).
Figure 1 The distribution of amplicon size on each panel
Results and Methods AmpliSeq library preparation with Mosquito HTS NGS library was constructed using the Ion AmpliSeq Library Kit 2.0 (Thermo Fisher Scientific, Waltham, MA) [5]. To miniaturize this procedure for Mosquito HTS, we tested a modified protocol in reduced volume of reagent (Table 1). Although making a master mix reduces the number of
dispensing steps, a dead volume is likely to occur. Therefore, template DNA and each reagent were manually dispensed into each row of 384-well Low Volume Serial Dilution (LVSD) plates [source plate] for automated liquid handling by Mosquito HTS (TTP Labtech, Royston, UK), and each plate was
stored at -20 ºC thereafter.
100 140 180 220 260 300
amplicon size
020
4060
100 140 180 220 260 300
amplicon size
040
80120
100 140 180 220 260 300
amplicon size
050
100
200
100 140 180 220 260 300
amplicon size
050
150
250
100 140 180 220 260 300
amplicon size
050
150
250
100 140 180 220 260 300
amplicon size
0200
600
100 140 180 220 260 300
amplicon size
0400
800
1200
100 140 180 220 260 300
amplicon size
0500
1000
1500
100 140 180 220 260 300
amplicon size
0500
1000
1500
100 140 180 220 260 300
amplicon size0
500
1500
100 140 180 220 260 300
amplicon size
01000
2000
3000
(bp)�
(bp)�(bp)�(bp)�
96 amplicons�
192 amplicons�
288 amplicons� 1152 amplicons�
768 amplicons�
384 amplicons�
2304 amplicons�
1920 amplicons�
1536 amplicons�
3072 amplicons�
2688 amplicons�
Num
ber o
f am
plic
ons�
4
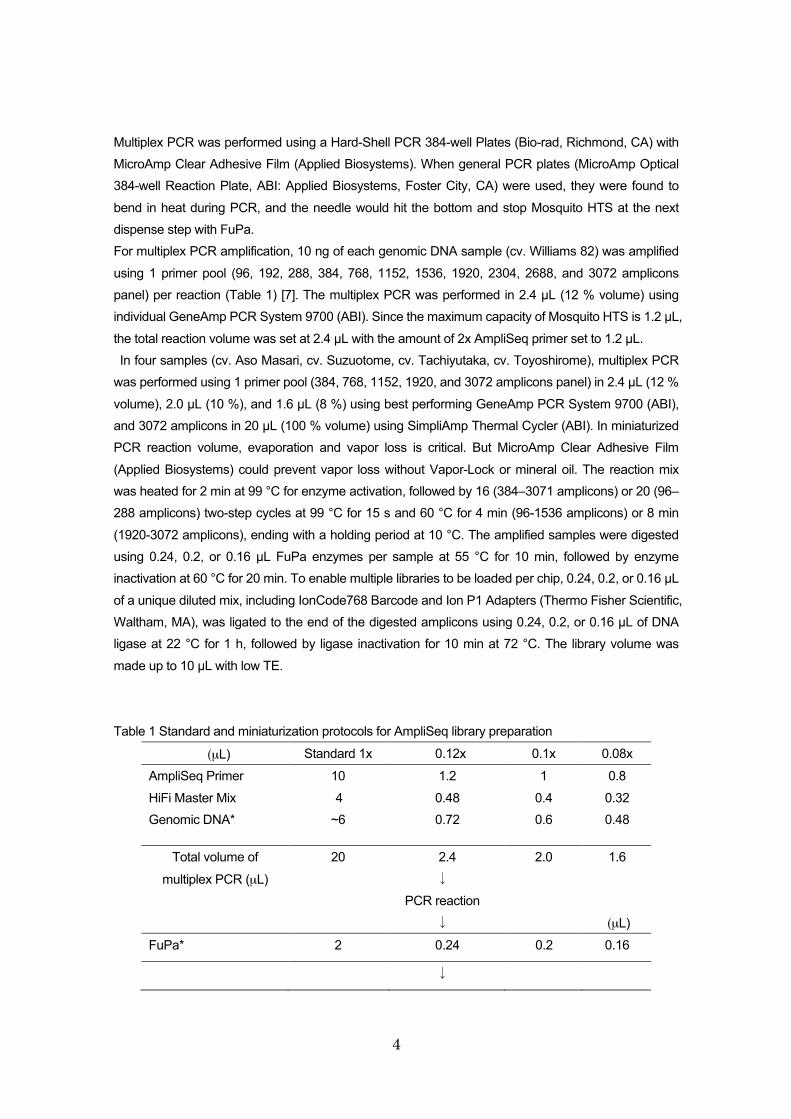
Multiplex PCR was performed using a Hard-Shell PCR 384-well Plates (Bio-rad, Richmond, CA) with MicroAmp Clear Adhesive Film (Applied Biosystems). When general PCR plates (MicroAmp Optical 384-well Reaction Plate, ABI: Applied Biosystems, Foster City, CA) were used, they were found to
bend in heat during PCR, and the needle would hit the bottom and stop Mosquito HTS at the next dispense step with FuPa. For multiplex PCR amplification, 10 ng of each genomic DNA sample (cv. Williams 82) was amplified
using 1 primer pool (96, 192, 288, 384, 768, 1152, 1536, 1920, 2304, 2688, and 3072 amplicons panel) per reaction (Table 1) [7]. The multiplex PCR was performed in 2.4 µL (12 % volume) using individual GeneAmp PCR System 9700 (ABI). Since the maximum capacity of Mosquito HTS is 1.2 µL,
the total reaction volume was set at 2.4 µL with the amount of 2x AmpliSeq primer set to 1.2 µL. In four samples (cv. Aso Masari, cv. Suzuotome, cv. Tachiyutaka, cv. Toyoshirome), multiplex PCR was performed using 1 primer pool (384, 768, 1152, 1920, and 3072 amplicons panel) in 2.4 µL (12 %
volume), 2.0 µL (10 %), and 1.6 µL (8 %) using best performing GeneAmp PCR System 9700 (ABI), and 3072 amplicons in 20 µL (100 % volume) using SimpliAmp Thermal Cycler (ABI). In miniaturized PCR reaction volume, evaporation and vapor loss is critical. But MicroAmp Clear Adhesive Film
(Applied Biosystems) could prevent vapor loss without Vapor-Lock or mineral oil. The reaction mix was heated for 2 min at 99 °C for enzyme activation, followed by 16 (384–3071 amplicons) or 20 (96–288 amplicons) two-step cycles at 99 °C for 15 s and 60 °C for 4 min (96-1536 amplicons) or 8 min
(1920-3072 amplicons), ending with a holding period at 10 °C. The amplified samples were digested using 0.24, 0.2, or 0.16 µL FuPa enzymes per sample at 55 °C for 10 min, followed by enzyme inactivation at 60 °C for 20 min. To enable multiple libraries to be loaded per chip, 0.24, 0.2, or 0.16 µL
of a unique diluted mix, including IonCode768 Barcode and Ion P1 Adapters (Thermo Fisher Scientific, Waltham, MA), was ligated to the end of the digested amplicons using 0.24, 0.2, or 0.16 µL of DNA ligase at 22 °C for 1 h, followed by ligase inactivation for 10 min at 72 °C. The library volume was
made up to 10 µL with low TE.
Table 1 Standard and miniaturization protocols for AmpliSeq library preparation
(µL) Standard 1x 0.12x 0.1x 0.08x
AmpliSeq Primer
HiFi Master Mix Genomic DNA*
10
4 ~6
1.2
0.48 0.72
1
0.4 0.6
0.8
0.32 0.48
Total volume of
multiplex PCR (µL)
20
2.4 ↓
PCR reaction ↓
2.0 1.6
(µL)
FuPa* 2 0.24 0.2 0.16
↓
5
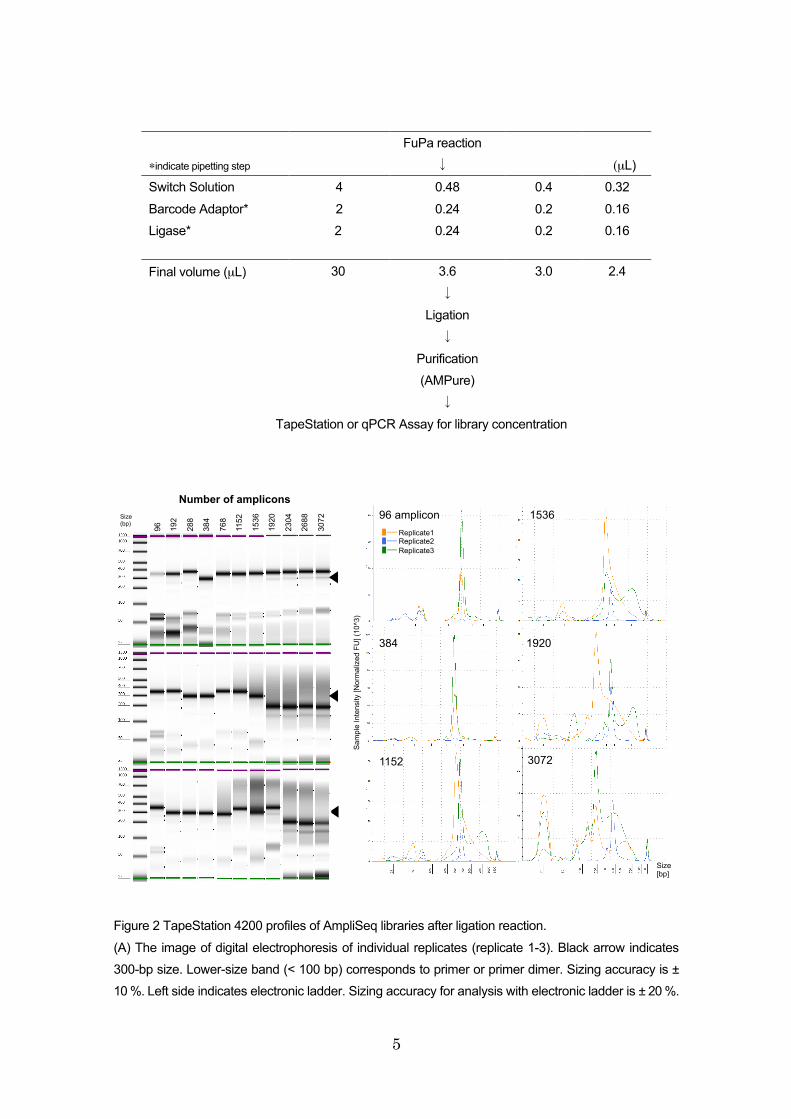
∗indicate pipetting step
FuPa reaction ↓
(µL) Switch Solution
Barcode Adaptor* Ligase*
4
2 2
0.48
0.24 0.24
0.4
0.2 0.2
0.32
0.16 0.16
Final volume (µL)
30 3.6
↓ Ligation ↓
Purification (AMPure) ↓
3.0 2.4
TapeStation or qPCR Assay for library concentration
Figure 2 TapeStation 4200 profiles of AmpliSeq libraries after ligation reaction.
(A) The image of digital electrophoresis of individual replicates (replicate 1-3). Black arrow indicates 300-bp size. Lower-size band (< 100 bp) corresponds to primer or primer dimer. Sizing accuracy is ± 10 %. Left side indicates electronic ladder. Sizing accuracy for analysis with electronic ladder is ± 20 %.
Size [bp]�
Sam
ple
Inte
nsity
[Nor
mal
ized
FU
] (10
^3)�
96 amplicon�
384�
1152�
1536�
1920�
3072�
Replicate1 Replicate2 Replicate3
Filename: 2018-04-24 - 11.03.58.D1000
Gel Images
Default image (Contrast 50%), Image is Scaled to Sample, Image is Scaled to view larger Molecular Weight range
Default image (Contrast 50%), Image is Scaled to Sample, Image is Scaled to view larger Molecular Weight range
Default image (Contrast 50%), Image is Scaled to Sample, Image is Scaled to view larger Molecular Weight range
D1000 ScreenTape® Page 1 of 51
TapeStation Analysis Software A.02.01 SR1 © Agilent Technologies, Inc. 2016 Generated: 24-Apr-2018
96
192
288
384
768
1152
1536
1920
2304
2688
3072�
Number of amplicons�
Size (bp)�
Filename: 2018-04-24 - 10.19.19.D1000
Gel Images
Default image (Contrast 50%), Image is Scaled to Sample, Image is Scaled to view larger Molecular Weight range
Sample Info
Well Conc. [ng/µl] Sample Description Alert Observations
EL1 20.3 Electronic Ladder Ladder
B1 93.2 Enrei-Leaf-x20-96ampliconsCaution! Expired ScreenTapedevice
C1 93.1 Enrei-Leaf-x20-192ampliconsCaution! Expired ScreenTapedevice
D1 102 Enrei-Leaf-x20-288ampliconsCaution! Expired ScreenTapedevice
E1 153 Enrei-Leaf-x20-384ampliconsCaution! Expired ScreenTapedevice
F1 301 Enrei-Leaf-x20-768ampliconsCaution! Expired ScreenTapedevice
G1 302 Enrei-Leaf-x20-1152ampliconsCaution! Expired ScreenTapedevice
H1 249 Enrei-Leaf-x20-1536ampliconsCaution! Expired ScreenTapedevice
A2 197 Enrei-Leaf-x20-1920ampliconsCaution! Expired ScreenTapedevice
B2 190 Enrei-Leaf-x20-2304ampliconsCaution! Expired ScreenTapedevice
C2 171 Enrei-Leaf-x20-2688ampliconsCaution! Expired ScreenTapedevice
D2 218 Enrei-Leaf-x20-3072ampliconsCaution! Expired ScreenTapedevice
D1000 ScreenTape® Page 1 of 13
TapeStation Analysis Software A.02.01 SR1 © Agilent Technologies, Inc. 2016 Generated: 24-Apr-2018
Filename: 2018-04-24 - 11.03.58.D1000
Gel Images
Default image (Contrast 50%), Image is Scaled to Sample, Image is Scaled to view larger Molecular Weight range
Default image (Contrast 50%), Image is Scaled to Sample, Image is Scaled to view larger Molecular Weight range
Default image (Contrast 50%), Image is Scaled to Sample, Image is Scaled to view larger Molecular Weight range
D1000 ScreenTape® Page 1 of 51
TapeStation Analysis Software A.02.01 SR1 © Agilent Technologies, Inc. 2016 Generated: 24-Apr-2018
Number of amplicons�Filename: 2018-04-24 - 11.03.58.D1000
Gel Images
Default image (Contrast 50%), Image is Scaled to Sample, Image is Scaled to view larger Molecular Weight range
Default image (Contrast 50%), Image is Scaled to Sample, Image is Scaled to view larger Molecular Weight range
Default image (Contrast 50%), Image is Scaled to Sample, Image is Scaled to view larger Molecular Weight range
D1000 ScreenTape® Page 1 of 51
TapeStation Analysis Software A.02.01 SR1 © Agilent Technologies, Inc. 2016 Generated: 24-Apr-2018

6
(B) The graphic shows the library’s size distribution for PCR products of 96, 384, 1152, 1536, 1920, and 3072 amplicon panels in replicates 1-3 (A). These multiplex PCR were performed in different PCR thermal cyclers (GeneAmp PCR System 9700, ABI). Barcoded libraries from Williams 82 were confirmed by D1000 ScreenTape with Agilent 4200
TapeStation (Agilent Technologies, Santa Clara, CA) according to the manufacturer’s instruction. All
2.4-µL multiplex PCR reactions with 96–3072 amplicon panels succeeded, but the library size did not stabilize when the number of amplicons exceeded 1920 (Figure 2).
Although all dispensing steps utilized Mosquito HTS nano-litre handling in this protocol, Mosquito HTS and HV could not be utilized in magnetic bead-cleaning steps. Therefore, we performed bead cleaning
and size selection using Agencourt AMPure XP beads (Beckman Coulter, Brea, CA) by manual
approach. We used 1.2x (12 µL) of AMPure XP beads for bead-cleaning, followed by the addition of 40 µL freshly prepared 70 % ethanol to each miniaturized library. We usually used 1.5x of AMPure XP
in standard protocol (20 µL library volume) or half volume (10 µL) for AmpliSeq library prep [5], but primer and small-sized product (< 100 bp) remained in the miniaturized protocol. A SPRIPlate 384 Magnet Plate (Beckman Coulter) was used to minimize library elution volume. We repeated the
washing step twice, completely removed the ethanol, and air-dried the beads for 3 to 5 min (may be judged by alcoholic smell) while the plate is on the magnetic rack. The library was eluted from the beads with 12-µL low TE, and 10 µL of the supernatant was transferred to a clean plate.
To check the concentration of libraries prepared by the miniaturized protocol, barcoded libraries were quantified by qPCR using the Ion Library Quantitation Kit. This was performed using 2.4 µL of 2x
TaqMan MasterMix, 0.24 µL of 20x Ion TaqMan Assay and diluted libraries. The libraries were diluted 500- and 1000-fold (200- and 100-nL libraries in 100 µL low TE), and 2.16 µL of diluted libraries was transferred to 384-well PCR plate (MicroAmp Optical 384-Well Reaction Plate with Barcode, ABI) in
preparation for TaqMan qPCR. These reagents were also dispensed by the Mosquito HTS (each library and TaqMan MasterMix was dispensed twice, since the upper-limit volume of Mosquito HTS was 1.2 µL). Five dilutions of an E. coli DH10B Ion Control Library, of known concentration, were run in
the same plate in triplicate, as a standard. Following qPCR, the concentration of each library was calculated using their Ct values in a linear regression of Ct vs LOC, generated using the standards. Thereafter, each library was mixed at equal concentration according to the library concentration and
number of amplicons. The mixed adapter-ligated libraries were purified using 1.5-fold volume of AMPure XP Reagent, followed by the addition of 150 µL freshly prepared 70 % ethanol to each library. The washing step
was repeated twice, the ethanol was completely removed, and beads were air-dried for 3 to 5 min while the plate was on the magnetic rack. The library was eluted from the beads with 23 µL low TE; 20 µL of the supernatant was transferred to a clean tube.
The concentration and size of amplicons were determined using D1000 ScreenTape with Agilent 4200

7
TapeStation (Agilent Technologies, Santa Clara, CA) according to the manufacturer’s instruction. After quantification, mixed library was diluted to a concentration of 100 pM prior to template preparation.
Next, the barcoded libraries of four samples with 384, 768, 1152, 1920 and 3072 amplicons panel in
2.4 (12% volume), 2.0 (10%), and 1.6 (8%) µL reaction volume were finally made up to 10 µL by adding low TE and purified libraries by AMpure XP were confirmed by qPCR. Although, the
concentration of libraries were 7 to 174 nM, 16 libraries (one in 2.0 µL reaction volume and 15 in 1.6 µL reaction volume) were 0 nM (Table 2). The success rate of library constraction was 100%(20/20) in
2.4 µL reaction volume in the same manner as 20 µL full volume, but was 95%(19/20) and 25 %(5/20) in 2.0 µL and 1.6 µL reaction volume, respectively. The failure of library prep occurred independently of the number of amplicons and DNA samples (Table 2). This indicated that the reason why the
libraries could not be created was not the quality of DNA or the number of amplicons. In failure samples, PCR products were not detected by TapeStation 4200 system (data not shown). This result
indicated that multiplex PCR did not work well in miniaturized PCR reaction of 2 µL or less. This did not recover even if the number of mix of reagent by pipetting was increased (data not shown).
The quality checked libraries were pooled the appropriate concentration and mixed library was diluted to a concentration of 100 pM prior to template preparation as described above.
Table 2 The concentration of library by qPCR-based library quantitation (nM).
Sample name Number ofamplicons 20 µL 2.4 µL 2.0 µL 1.6 µL
Tachiyutaka 382 - 68 7 n.d.768 - 27 20 n.d.1152 - 57 18 n.d.1920 - 95 35 n.d.3072 202 54 40 n.d.
Asomasari 382 - 17 8 7768 - 13 n.d. n.d.1152 - 16 21 n.d.1920 - 56 34 n.d.3072 176 52 48 n.d.
Toyoshirome 382 - 8 6 n.d.768 - 50 174 n.d.1152 - 11 62 n.d.1920 - 35 39 143072 236 49 39 n.d.
Suzuotome 382 - 15 12 8768 - 53 148 151152 - 45 14 n.d.1920 - 74 29 183072 132 43 28 n.d.
(4/4)100%
(20/20)100%
(19/20)95%
(5/20)25%
n.d. : Not detected
The success rate of libraryconstruction

8
Sequencing and coverage analysis Final libraries were sequenced on the IonTorrent S5 system (Thermo Fisher Scientific, Waltham, MA). Template preparation consisting of emulsion PCR, enrichment of beads containing the template, and
chip loading, were performed with the Ion Chef instrument and Ion S5 Kit-Chef according to the manufacturer’s instruction (Thermo Fisher Scientific, Waltham, MA). After the preparation of ion sphere particles (ISPs), sequencing for 500 cycles was performed with an Ion Torrent Ion S5 system
using Ion 520 and 540 Chip (Thermo Fisher Scientific, Waltham, MA) according to the manufacturer’s instruction. The sequence data was mapped to the soybean genome reference version 2.0 (Gmax275:
http://genome.jgi.doe.gov/pages/dynamicOrganismDownload.jsf?organism=Phytozome#, downloaded on May 15, 2015) by Ion Torrent Suite v5.8.0 software. The software was optimized for Ion Torrent raw data analysis—alignment of Torrent Mapping Alignment Program (TMAP) v5.8.17 and
coverage analysis v5.8.0.8 plugin. We obtained average depth coverage of 875 (a total of 18.8 M reads) in Williams 82 with 96, 192, 288, 384, 768, 1152, 1536, 1920, 2304, 2688, and 3072 amplicons panel. On target rate ranged from
56.13 % (1152 amplicon panel) to 85.84 % (384 amplicon panel), and uniformity of coverage from 51.09 % (1152 amplicon panel) to 93.59 % (768 amplicon panel) (Figure 3). Although there was almost no difference in mean read length between amplicon panels, the on-target rate was low at
1152 and 1536 amplicon panels. Uniformity tended to be lower with amplicons over 1152 (Figure 3). Among a total of 19,442,437 reads obtained, 18,792,850 (96.7 %) were mapped to reference genome using TMAP (Figure 3). On-target rate represents the percentage of reads mapped to any targeted
region relative to all reads mapped to the reference. Uniformity represents the percentage of bases in all targeted regions covered by at least 0.2x the average base read depth.
Figure 3 Sequence result of Williams 82 in each amplicon panels. (A) On target rate, (B) Mean depth,
and (C) Uniformity.
0
50
100
150
200
250
96 192 288 384 768 1152 1536 1920 2304 2688 3072
Mea
n re
ad le
ngth
Number of amplicons
0
500
1,000
1,500
2,000
2,500
96 192 288 384 768 1152 1536 1920 2304 2688 3072
Mea
n de
pth
Number of amplicons
0%
20%
40%
60%
80%
100%
96 192 288 384 768 1152 1536 1920 2304 2688 3072
Uni
form
ity
Number of amplicons
0%
20%
40%
60%
80%
100%
96 192 288 384 768 1152 1536 1920 2304 2688 3072
On
Targ
et ra
te
Number of amplicons
A�
B�
C�
D�

9
We obtained average depth coverage of 672 (a total of 65.9 M reads) in four samples with 384, 768, 1152, 1920, and 3072 amplicons panel. Similar trend was observed for low % of on-target rate and
uniformity in 1152 amplicon panel. These results indicated that the differences in on-target rate and uniform PCR amplification are panel-dependent, and miniaturized volumes of reagents do not affect on-target rate or uniformity. Compared to the standard 20-µL volume, mean read length, on-target rate,
and uniformity of miniaturized protocol were not different (Figure 3).
Figure 3 Sequence results of four samples in 384, 768, 1152, 1920, and 3072 amplicons panel. (A) Mean read length (B) On target rate (C) Uniformity. Red, blue, and black circles indicate 2 µL, 2.4 µL,
and 20 µL reaction volumes. A sequencing run and library construction of 20-µL samples were different from those of 2-µL and 2.4-µL samples.
0 1 2 3 4 5 6
020
60100
Number of amplicons
On
targ
et ra
te
0 1 2 3 4 5 6
020
60100 0 1 2 3 4 5 6
100
140
180
220
Number of amplicons
Mea
n re
ad le
ngth
0 1 2 3 4 5 6
100
140
180
220
0 1 2 3 4 5 6
020
60100
Number of amplicons
Uniformity
0 1 2 3 4 5 6
020
60100
384�
(%)�
(%)�
(bp)�
1152� 1920� 3072�768�
0 1 2 3 4 5 6
020
60100
Number of amplicons
On
targ
et ra
te
0 1 2 3 4 5 6
020
60100 0 1 2 3 4 5 6
100
140
180
220
Number of amplicons
Mea
n re
ad le
ngth
0 1 2 3 4 5 6
100
140
180
220
0 1 2 3 4 5 6
020
60100
Number of amplicons
Uniformity
0 1 2 3 4 5 6
020
60100
384�
(%)�
(%)�
(bp)�
1152� 1920� 3072�768�
A�
B�
C� 0 1 2 3 4 5 6
020
60100
Number of amplicons
On
targ
et ra
te
0 1 2 3 4 5 6
020
60100
0 1 2 3 4 5 6
020
60100
Number of amplicons
Uniformity
0 1 2 3 4 5 6
020
60100 0 1 2 3 4 5 6
020
60100
Number of amplicons
On
targ
et ra
te
0 1 2 3 4 5 6
020
60100 0 1 2 3 4 5 6
100
140
180
220
Number of amplicons
Mea
n re
ad le
ngth
0 1 2 3 4 5 6
100
140
180
220
0 1 2 3 4 5 6
020
60100
Number of amplicons
Uniformity
0 1 2 3 4 5 6
020
60100
384�
(%)�
(%)�
(bp)�
1152� 1920� 3072�768�
0 1 2 3 4 5 6
020
60100
Number of amplicons
On
targ
et ra
te
0 1 2 3 4 5 6
020
60100 0 1 2 3 4 5 6
100
140
180
220
Number of amplicons
Mea
n re
ad le
ngth
0 1 2 3 4 5 6
100
140
180
220
0 1 2 3 4 5 6
020
60100
Number of amplicons
Uniformity
0 1 2 3 4 5 6
020
60100
384�
(%)�
(%)�
(bp)�
1152� 1920� 3072�768�
A�
B�
C� 0 1 2 3 4 5 6
020
60100
Number of amplicons
On
targ
et ra
te
0 1 2 3 4 5 6
020
60100
0 1 2 3 4 5 6
020
60100
Number of amplicons
Uniformity
0 1 2 3 4 5 6
020
60100
0 1 2 3 4 5 6
100
140
180
220
0 1 2 3 4 5 6
020
60100
0 1 2 3 4 5 6
020
60100
2.0 µL 2.4 µL 20.0 µL�

10
Comparison of cost and time This miniaturized protocol reduces the cost and time in AmpliSeq library preparation. The cost of materials for each library, using the manual protocol, including consumables such as reagents, tips,
plates, and seal, was 9,602 JPY (about 3,687,284 JPY for 384 samples), whereas the cost per sample dropped to about 1,261 JPY using this miniaturized protocol (approximately 484,325 JPY for 384 samples), thereby resulting in cost saving by about 86.8 % (Table 3).
Similarly, the automated system of library preparation resulted in saving time. Making libraries of 384 samples by hand, at one time, with manual protocol, would take about 66 min. Although Mosquito HTS would take almost similar time (approximately 44 min) to make 384 libraries, we do not need
much labor in the automated system. Since it takes time to mix by pipetting, followed by individual reagent transfer (no master mix), it is difficult to shorten the library preparation time, but handling time is greatly reduced by capable of pipetting automatically. Mosquito HTS has two models, 2-way and
5-way (2 or 5 plates can be set at once). Using Mosquito HTS 5-way model, labor can be further minimized by capable of setting some plate at once and processed continuously. Alternatively, although dead volume may be generated when a master mix is prepared, dispensing time is
shortened. Dead volume has little effect on cast of library prep when dealing with sample sizes of 1000 or more.
Table 3 Cost comparison between standard and miniaturized protocols for 384 samples
Standard protocol Miniaturized protocol Manual Mosquito HTS
yen [JPY] 20 µL (100 %) 10 µL (50 %) 2.4 µL (12 %)
Reagent 3,640,000 1,820,000 436,800
Tip 7,188 7,188 30,933
AMPure 38,592 19,296 12,864
Plates/Tubes 1,504 1,504 2,000
Source Plate N/A N/A 1,728
Total 3,687,284 1,847,988 484,325

11
Table 4 Comparison of time between manual full-volume protocol and miniaturized protocol (Mosquito HTS 2-way model) for 384 samples
Standard protocol
Miniaturized automated protocol
Step
min
Manual (min)
Working time (min)
Handling time (min)
Master mix preparation 10 - -
Dispensing each reagents to source plate - 5 5
Dispensing master mix or reagent 20 11 1
Multiplex PCR reaction 74 - - -
Dispensing FuPa solution 10 8.2 1
FuPa reaction 41 - - -
Dispensing Switch solution 10 8.2 1
Dispensing Barcode adaptor 10 3.7 1
Dispensing Ligase 10 8.2 2
Ligation reaction 72 - - -
Total 187 66 min (100%)
44.3 (67.1 %)
12 (18.2 %)
Discussion In this study, we present a miniaturization protocol for AmpliSeq library preparation. Compared to the standard protocol, our protocol is inexpensive and not labor-intensive. Empirically, stable results were
obtained when the reaction volume was 2.4 µL and the number of amplicons was 1500 or less. Difference in uniformity and amplicon size of multiplex PCR was greater than the influence of the type of thermo-cycler used and reaction volume. Miniaturization seemed to make it easier to be influenced by environmental factors.
This is the first application of the Mosquito for AmpliSeq ultra-multiplex PCR protocol, and adds to other existing protocols for NGS library preparation [9-15]. The Mosquito HTS, used in this miniaturized and automated library preparation, enables rapid processing of large number of samples
in units of 8 (tips at 9.0-mm pitch) or 16 (4.5-mm) samples at a time. It results in remarkable cost and time saving, and allows quick completion of large-scale genotyping. However, there are two limitations of this Mosquito protocol. First, Mosquito HTS should be set in a
cold room, whereas in this study, we used it at room temperature and always used freshly prepared reagent in this study. The reagent was dispensed in advance into 384-well plate (source plate) before use, and the residual reagent was stored at -20 ºC to be used in the next experiment. As the number
of times of use and time lapse increased, quality of the library declined in other experiment (lower uniformity, data not shown). This could be prevented by using the Mosquito in a cold room. Second, Mosquito could not be used for bead clean-up. Therefore, it is necessary to use another conventional

12
dispensing robot. As an alternative method, two-step process was used to optimize the pooling of the samples. First, all the libraries were mixed equally and sequence skimmed; then, concentration from the first sequence result was adjusted and sequenced again. Finally, the initial cost of purchasing the
robot is huge. However, these robots are very useful and greatly reduce the experiment cost if housed in core labs, core facilities, or is shared equipment.
In conclusion, we present a protocol to prepare sequencing libraries in miniaturized volume using AmpliSeq library kit (Thermo Fisher Scientific, Waltham, MA). With this protocol, it is possible to prepare 384 libraries with just 12 % of the standard reagent volume, at less than 13.1 % of the cost,
and in less than 18.2 % of the time required in the standard manual protocol. This should help the advancement of not only clinical genomics, but also large-scale genotyping in agronomic field and projects like AgriSeq.
13
Acknowledgements The author would like to thank Ayaka Take, Anne Hammerstein (TTP Labtech, Royston, UK), Masaya Asano, Keishi Nakayama, Masahiro Matsushita, and Naoto Momoda (AS ONE, Osaka, Japan) for
their technical supports in using the Mosquito HTS and HV. This work was supported by grant from NARO, and the special scheme project on advanced research and development for next generation technology.
Conflict of interest The authors declare that they have no conflict of interest.
References 1. Chung, Y.S., Choi, S.C., Jun, TH. et al. (2017) Genotyping-by-sequencing: a promising tool for
plant genetics research and breeding. Hortic. Environ. Biotechnol. 58: 425-431.
2. Rowan B.A., Seymour D.K., Chae E., Lundberg D.S., Weigel D. (2017) Methods for Genotyping-by-Sequencing. In: White S., Cantsilieris S. (eds) Genotyping. Methods in Molecular Biology, 1492. Humana Press, New York, NY
3. Rasheed, A., Y. Hao, X. Xia, A. Khan, Y. Xu, R.K. Varshney, and Z. He. (2017) Crop breeding chips and genotyping platforms: progress, challenges and perspectives. Mol. Plant. 10(8): 1047-1064.
4. Schütte M., Ogilvie L.A., Rieke D.T., Lange B.M.H., Yaspo M.-L., Lehrach H. (2017) Cancer Precision Medicine: Why More Is More and DNA Is Not Enough Public Health Genomics 20: 70-80
5. AmpliSeq Library preparation protocol https://assets.thermofisher.com/TFS-Assets/LSG/manuals/MAN0013432_Ion_AmpliSeq_Library_Prep_on_Ion_Chef_UG.pdf
6. AgriSeq Targeted Genotyping By Sequencing https://www.thermofisher.com/jp/ja/home/life-science/agricultural-biotechnology/agrigenomics/agriseq-targeted-genotyping-sequencing.html
7. Ogiso-Tanaka E., Taguchi-Shiobara F., Hirata K., Kaga A., Hajika M., Ishimoto M. (2017). Construction of highly flexible soybean breeding panel integrating whole genome sequence and QTL information using AmpliSeq technology. Consortium of Biological Sciences (ConBio)
Program: 3P-1299 8. Gaisford W., Schertler G. and Edwards P. (2011) mosquito LCP: Making membrane protein
crystallization accessible to the research scientist. Nature Methods 8: 520
9. Mora-Castilla S, To C, Vaezeslami S, Morey R, Srinivasan S, Dumdie JN, Cook-Andersen H, Jenkins J, Laurent LC. (2016) Miniaturization Technologies for Efficient Single-Cell Library Preparation for Next-Generation Sequencing. J Lab Autom 21(4): 557-67.

14
10. Mora-Castilla S., To C., Vaezeslami S., Morey R., Srinivasan S, Dumdie J.N., et al. (2016) Miniaturization Technologies for Efficient Single-Cell Library Preparation for Next-Generation Sequencing. SLAS Technol. Aug; 21(4): 557–567.
11. Herrtwich L., Nanda I., Evangelou K., Nikolova T., Horn V., Sagar et. al. (2016) DNA Damage Signaling Instructs Polyploid Macrophage Fate in Granulomas. Cell 167(5): 1264 - 1280.
12. Wimmers, F., Subedi N., van Buuringen N., Heister D., Vivié J., Beeren-Reinieren I., et. al. (2018)
Single-cell analysis reveals that stochasticity and paracrine signaling control interferon-alpha production by plasmacytoid dendritic cells. Nature Communications 9(1): 3317.
13. Herman J.S., Sagar, Grün D. (2018) FateID infers cell fate bias in multipotent progenitors from
single-cell RNA-seq data. Nature methods 15(5): 379-386. 14. Sagar, Herman J.S., Pospisilik J.A., Grün D. (2018) High-Throughput Single-Cell RNA
Sequencing and Data Analysis. Methods in Molecular Biology 1766: 257-283.
15. Zanini F., Pu S., Bekerman E., Einav S., Quake S. R. (2018) Single-cell transcriptional dynamics of flavivirus infection. eLIFE 7:e32942.