minimal testcase generation for object- oriented software ... · minimal testcase generation for...
TRANSCRIPT
Minimal TestCase Generation for Object-Oriented
Software with State Charts
Ranjita Kumari Swain1, Prafulla Kumar Behera
2 and Durga Prasad Mohapatra
3
1Rourkela Institute of Mgt. Studies, Rourkela
[email protected] 2Dept. of Comp. Sc., Utkal University, Bhubaneswar
[email protected] 3Dept. of Comp. Sc. and Engg., National Institute of Technology, Rourkela
ABSTRACT
Today statecharts are a de facto standard in industry for modeling system behavior. Test data generation
is one of the key issues in software testing. This paper proposes an reduction approach to test data
generation for the state-based software testing. In this paper, first state transition graph is derived from
state chart diagram. Then, all the required information are extracted from the state chart diagram. Then,
test cases are generated. Lastly, a set of test cases are minimized by calculating the node coverage for
each test case. It is also determined that which test cases are covered by other test cases. The advantage
of our test generation technique is that it optimizes test coverage by minimizing time and cost. The
present test data generation scheme generates test cases which satisfy transition path coverage criteria,
path coverage criteria and action coverage criteria. A case study on Railway Ticket Vending Machine
(RTVM) has been presented to illustrate our approach.
Keywords Test generation technique, Test sequence generation, State chart diagram / State charts, Test Case
Generation, Test Coverage, Test Optimization.
1. INTRODUCTION
With continually increasing system sizes, the issue of automatic design of system test cases is
assuming prime importance [28]. A properly generated test suite may not only locate the errors in a software system, but also help in reducing the high cost associated with software testing
[17]. Many present day software solutions are state based. In such systems, the system behavior
is determined by its state. In other words, a system can respond differently to the same event in different states. Therefore, unless a system is made to assume all its possible states and tested, it
would not be possible to uncover state-based bugs. Adequate system testing of such software
requires satisfactory coverage of system states and transitions. Generation of test specifications
to meet these coverage criteria can be accomplished by using the state model of a system. However, it is a non-trivial task to manually construct the state model of a system. The state
model of an actual system is usually extremely complex and comprises of a large number of
states and transitions. Possibly for this reason, state models of complete systems are rarely constructed by system developers [28].
Testing of object-oriented software is a traditional activity that is part of the process of
software quality assurance. Model-based testing technique has grown its importance. The models used represent the relevant features of the system under tests (SUT), and can also be
used as a basis for generating test cases. The time and required effort to do sufficient testing

grow, as the size and complexity of the software grows. Typical models that are used for
representing system behavior are for instance the unified modeling language, finite state
machines and state charts. Testing can be carried out earlier in the development process so that the developer will be able to find the inconsistencies and ambiguities in the specification. Hence
it will be able to improve the specification before the program is written [12]. Testing activities
consist of designing test cases that are sequences of inputs, executing the program with test
cases, and examining the results produced by this execution. Unified modeling language (UML) has emerged as the de facto standard for modeling software systems and has received significant
attention from researchers as well as practitioners.
UML models are popular not only for designing and documenting systems, the importance of UML models in designing test cases has also been well recognized. Even though
UML models are intended to help reduce the complexity of a problem, with the increase in
product sizes and complexities, the UML models themselves become large and complex
involving thousands of interactions across hundreds of objects [16]. The important part of quality control in the software life-cycle is testing. As the complexity and size of software
increase, the time and effort required to do sufficient testing grow. Manual testing is time-
consuming and error-prone. So, there is a pressing to automate the testing process. The testing process can be divided into three parts: test case generation, test execution, and test evaluation.
The latter two parts are relatively easy to automate provided that the criteria for passing the tests
are available. However, to determine which tests are required to achieve a certain level of confidence is not trivial [18]. Model-based testing [6] has grown in importance. Models are
specified to represent the relevant, desirable features of the system under consideration (SUC).
These models are used as a basis for (automatically) generating test cases to be applied to the
SUC. Typical models that are used for representing system behavior are unified modeling language, finite state machines, statecharts etc.[4]. It is often desired that test data in the form
of test sequences within a test suite can be automatically generated to achieve required test
coverage. It helps mankind to save on time, money and helps in handling better situations in real time.
With this motivation, we aim our work at deriving the test sequence from state
transition diagram and maximizing state or node coverage. Also our method minimizes the size of test, time and cost, while preserving test coverage. The rest of the paper is structured as
follows: A brief discussion on UML diagrams, which are relevant to our paper is described in
the Section 2. Then, we discuss some testing coverage criteria in Section 3. Section 4 represents
some concepts, notations and definitions of state chart diagram. In Section 5, we explain the overview of our proposed method for construction of state-transition graph, generation of test
sequence using state charts and how node coverage is calculated for each test case. Section 6
provides the working of our methodology with the RTVM (Railway Ticket Vending Machine) case study and implementation of our example. Section 7 discusses some comparison with
related work. Finally, Section 8 presents the conclusion and future work of this paper.
2. AN OVERVIEW OF RELEVANT UML 2.0 DIAGRAMS
In this section, we discuss an overview of the UML diagrams, which will be used subsequently
in our paper. UML is a modeling language using text and graphical notation and used for documenting
specification, analysis, design, and implementation. It is a de- facto standard in industrial
software development UML, Unified Modelling Language is a visual language that has been developed to support the design of complex object-oriented systems. Since its introduction in
the late 90s, it has undergone several revisions. The latest release being UML version 2.0, which
adds several new capabilities to UML 1.x. In this section, we restrict our review to only those
developments that are directly relevant to our work. A typical software procedure incorporates
all the three aspects: It uses data structure (class model), it sequences operations in time (state
model), and it passes data and control among objects (interaction model). The three kinds of
models separate a system into different views. The different models are not completely independent but a system is more than a collection of these independent parts. UML
specification defines two major kinds of UML diagram: structural diagrams and behavioral
diagrams. The elements in a structural diagram represent the meaningful concepts of a system,
and may include abstract, real world and implementation concepts. Behavioral diagrams show the dynamic behavior of the objects in a system, which can be described as a series of changes
to the system over time.
2.1. UML state chart diagram
In this section, we explain the few fundamentals on state chart diagram. The name of the diagram itself clarifies the purpose of the diagram and other details. It describes different
states of a component in a system. The states are specific to a component or object of a system.
A statechart diagram describes a state machine. Now to clarify it state machine can be defined
as a machine which defines different states of an object and these states are controlled by external or internal events. Statechart diagram is one of the five UML diagrams used to model
dynamic nature of a system. They define different states of an object during its lifetime. And
these states are changed by events. So, Statechart diagrams are useful to model reactive systems. Reactive systems can be defined as systems that respond to external or internal events.
Statechart diagram describes the flow of control from one state to another state. States are
defined as a condition in which an object exists and it changes when some event is triggered. So, the most important purpose of Statechart diagram is to model life time of an object from
creation to termination. Statechart diagrams are also used for forward and reverse engineering of
a system. But the main purpose is to model reactive system.
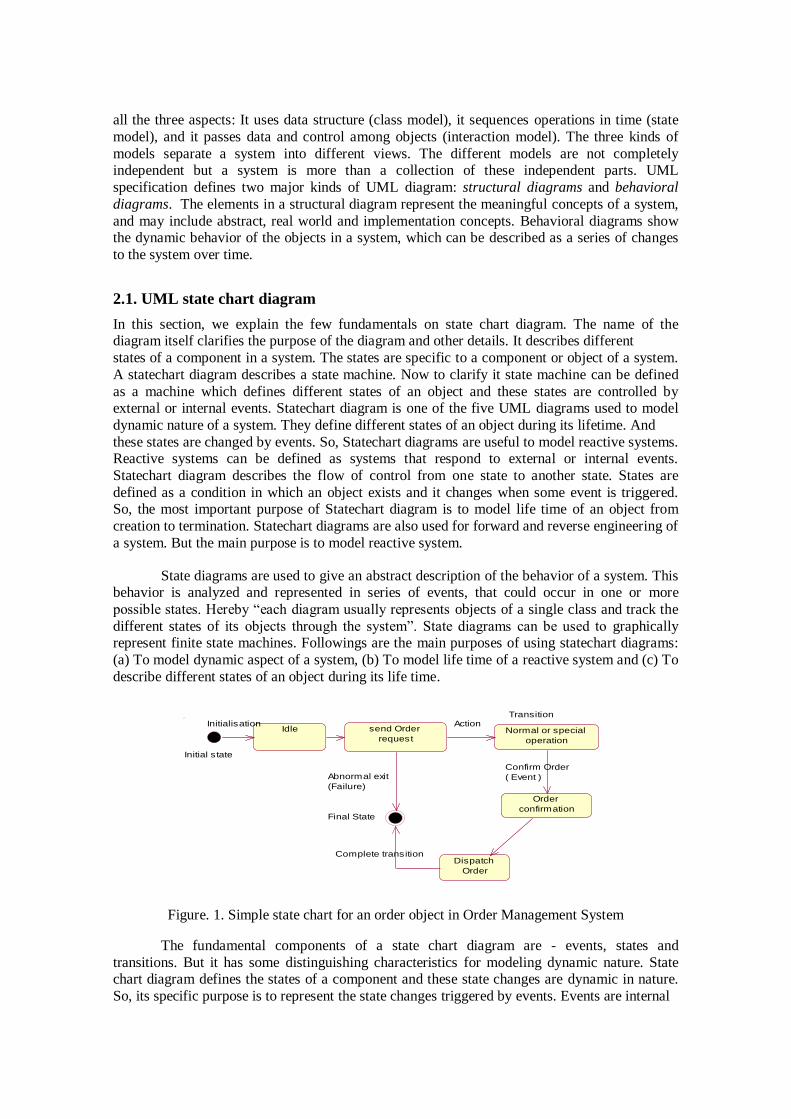
State diagrams are used to give an abstract description of the behavior of a system. This behavior is analyzed and represented in series of events, that could occur in one or more
possible states. Hereby “each diagram usually represents objects of a single class and track the
different states of its objects through the system”. State diagrams can be used to graphically represent finite state machines. Followings are the main purposes of using statechart diagrams:
(a) To model dynamic aspect of a system, (b) To model life time of a reactive system and (c) To
describe different states of an object during its life time.
Idle send Order
requestNormal or special
operation
Dispatch
Order
Order
confirmation
Initialisation
Confirm Order
( Event )
ActionTransition
Complete transition
Final State
Abnormal exit
(Failure)
Initial state
Figure. 1. Simple state chart for an order object in Order Management System
The fundamental components of a state chart diagram are - events, states and
transitions. But it has some distinguishing characteristics for modeling dynamic nature. State chart diagram defines the states of a component and these state changes are dynamic in nature.
So, its specific purpose is to represent the state changes triggered by events. Events are internal
or external factors influencing the system. If we look into the practical implementation of
Statechart diagram then it is mainly used to analyze the object states influenced by events.
This analysis is helpful to understand the system behavior during its execution. The following are the basic notational elements that can be used to make up a diagram:
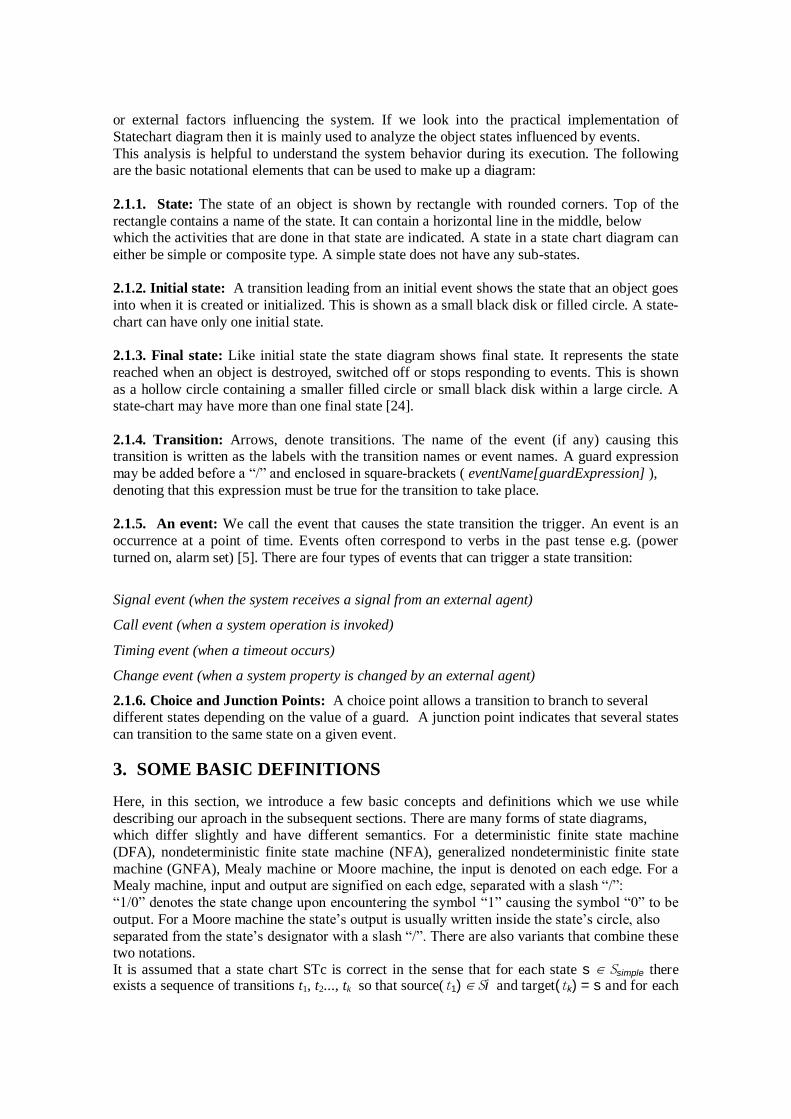
2.1.1. State: The state of an object is shown by rectangle with rounded corners. Top of the
rectangle contains a name of the state. It can contain a horizontal line in the middle, below which the activities that are done in that state are indicated. A state in a state chart diagram can
either be simple or composite type. A simple state does not have any sub-states.
2.1.2. Initial state: A transition leading from an initial event shows the state that an object goes
into when it is created or initialized. This is shown as a small black disk or filled circle. A state-
chart can have only one initial state.
2.1.3. Final state: Like initial state the state diagram shows final state. It represents the state
reached when an object is destroyed, switched off or stops responding to events. This is shown
as a hollow circle containing a smaller filled circle or small black disk within a large circle. A state-chart may have more than one final state [24].
2.1.4. Transition: Arrows, denote transitions. The name of the event (if any) causing this transition is written as the labels with the transition names or event names. A guard expression
may be added before a “/” and enclosed in square-brackets ( eventName[guardExpression] ),
denoting that this expression must be true for the transition to take place.
2.1.5. An event: We call the event that causes the state transition the trigger. An event is an
occurrence at a point of time. Events often correspond to verbs in the past tense e.g. (power
turned on, alarm set) [5]. There are four types of events that can trigger a state transition:
Signal event (when the system receives a signal from an external agent)
Call event (when a system operation is invoked)
Timing event (when a timeout occurs)
Change event (when a system property is changed by an external agent)
2.1.6. Choice and Junction Points: A choice point allows a transition to branch to several different states depending on the value of a guard. A junction point indicates that several states
can transition to the same state on a given event.
3. SOME BASIC DEFINITIONS
Here, in this section, we introduce a few basic concepts and definitions which we use while
describing our aproach in the subsequent sections. There are many forms of state diagrams, which differ slightly and have different semantics. For a deterministic finite state machine
(DFA), nondeterministic finite state machine (NFA), generalized nondeterministic finite state
machine (GNFA), Mealy machine or Moore machine, the input is denoted on each edge. For a Mealy machine, input and output are signified on each edge, separated with a slash “/”:
“1/0” denotes the state change upon encountering the symbol “1” causing the symbol “0” to be
output. For a Moore machine the state‟s output is usually written inside the state‟s circle, also
separated from the state‟s designator with a slash “/”. There are also variants that combine these two notations. It is assumed that a state chart STc is correct in the sense that for each state s ∈ Ssimple there exists a sequence of transitions t1, t2..., tk so that source(t1) ∈ Si and target(tk) = s and for each
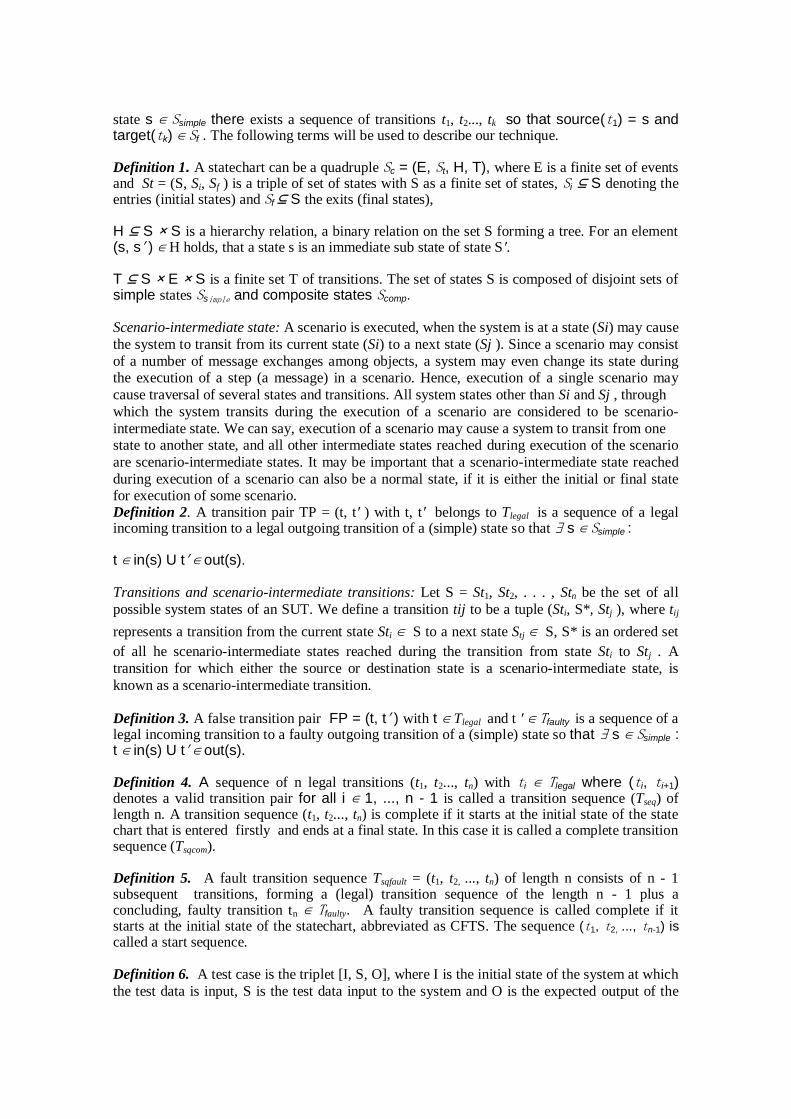
state s ∈ Ssimple there exists a sequence of transitions t1, t2..., tk so that source(t1) = s and target(tk) ∈ Sf . The following terms will be used to describe our technique.
Definition 1. A statechart can be a quadruple Sc = (E, St, H, T), where E is a finite set of events and St = (S, Si, Sf ) is a triple of set of states with S as a finite set of states, Si ⊆ S denoting the entries (initial states) and Sf ⊆ S the exits (final states),
H ⊆ S × S is a hierarchy relation, a binary relation on the set S forming a tree. For an element (s, s′ ) ∈ H holds, that a state s is an immediate sub state of state S′.
T ⊆ S × E × S is a finite set T of transitions. The set of states S is composed of disjoint sets of simple states Ssimple and composite states Scomp.
Scenario-intermediate state: A scenario is executed, when the system is at a state (Si) may cause
the system to transit from its current state (Si) to a next state (Sj ). Since a scenario may consist
of a number of message exchanges among objects, a system may even change its state during the execution of a step (a message) in a scenario. Hence, execution of a single scenario may
cause traversal of several states and transitions. All system states other than Si and Sj , through
which the system transits during the execution of a scenario are considered to be scenario-
intermediate state. We can say, execution of a scenario may cause a system to transit from one state to another state, and all other intermediate states reached during execution of the scenario
are scenario-intermediate states. It may be important that a scenario-intermediate state reached
during execution of a scenario can also be a normal state, if it is either the initial or final state for execution of some scenario. Definition 2. A transition pair TP = (t, t′ ) with t, t′ belongs to Tlegal is a sequence of a legal incoming transition to a legal outgoing transition of a (simple) state so that ∃ s ∈ Ssimple :
t ∈ in(s) U t′ ∈ out(s).
Transitions and scenario-intermediate transitions: Let S = St1, St2, . . . , Stn be the set of all
possible system states of an SUT. We define a transition tij to be a tuple (Sti, S*, Stj ), where tij
represents a transition from the current state Sti ∈ S to a next state Stj ∈ S, S* is an ordered set
of all he scenario-intermediate states reached during the transition from state Sti to Stj . A
transition for which either the source or destination state is a scenario-intermediate state, is
known as a scenario-intermediate transition. Definition 3. A false transition pair FP = (t, t′ ) with t ∈ Tlegal and t ′ ∈ Tfaulty is a sequence of a legal incoming transition to a faulty outgoing transition of a (simple) state so that ∃ s ∈ Ssimple : t ∈ in(s) U t′ ∈ out(s).
Definition 4. A sequence of n legal transitions (t1, t2..., tn) with ti ∈ Tlegal where (ti, ti+1) denotes a valid transition pair for all i ∈ 1, ..., n - 1 is called a transition sequence (Tseq) of length n. A transition sequence (t1, t2..., tn) is complete if it starts at the initial state of the state chart that is entered firstly and ends at a final state. In this case it is called a complete transition sequence (Tsqcom).
Definition 5. A fault transition sequence Tsqfault = (t1, t2, ..., tn) of length n consists of n - 1 subsequent transitions, forming a (legal) transition sequence of the length n - 1 plus a concluding, faulty transition tn ∈ Tfaulty. A faulty transition sequence is called complete if it starts at the initial state of the statechart, abbreviated as CFTS. The sequence (t1, t2, ..., tn-1) is
called a start sequence.
Definition 6. A test case is the triplet [I, S, O], where I is the initial state of the system at which
the test data is input, S is the test data input to the system and O is the expected output of the

system [18], [19]. The output produced by the execution of the software with a particular test
case provides a specification of the actual software behavior. A test case is also characterized by
an ordered pair of an input and an expected output of the SUC.
Definition 7. A test suite is a set of test cases. A single test case in most cases may satisfy more
than one test obligation. For instance, a test case used to cover a certain state of interest may
also cover other states during its execution. This then provides for a way to reduce the size of
the final test suite by choosing a subset of test cases that preserves the coverage obtained by the full test suite [9].
Definition 8. k-transition coverage (k-TC) generates complete transition sequences that
sequentially conduct all legal transition sequences of length k ∈ N.
Definition 9. A single test case in most cases may satisfy more than one test obligation. For
instance, a test case used to cover a certain state of interest may also cover other states
during its execution. This then provides for a way to reduce the size of the final test suite by choosing a subset of test cases that preserves the coverage obtained by the full test suite [10].
A test suite is a set of test cases.
Definition 8 guarantees that all possible (legal) transition sequences of length k will be tested. A test suite consisting of all transition sequences of a fixed length k does not necessarily cover a
set of all sequences of length i ∈ 1, ... , k-1 as there may exist sequences of length i that cannot
be expanded to length k. Typically, state based test generation methods focus on some form of coverage, for instance on covering transitions [19], [20] or on transition coverage and state
identification [6], [14]. Our approach creates all transition sequences of length k including all
shorter sequences of length 1, ..., k -1 that cannot be found in longer sequences.
4. TEST ADEQUECY CRITERIA
Typically, state based test generation methods focus on some form of coverage, for instance on
covering transitions [20], [21] or on transition coverage and state identification [7], [15]. Our
approach creates all transition sequences of length k including all shorter sequences of length 1, ..., k -1 that cannot be found in longer sequences. Testing coverage/adequacy criterion specifies
the requirement of a particular testing and can be used as an objective measurement of the test
case. In traditional software code testing, the definition of testing adequacy is defined as a measurement function. The case of UML state chart diagrams is different because it is in the
form of model instead of code. Especially the coverage of state chart diagram is little bit
complex. In our paper, we propose different types of coverage metrics as follows:
State Coverage Criterion : The value of state coverage is the ratio between the covered
states and all the states in the statechart diagram. It requires that all the state nodes in a
state chart graph to be covered at least once.
Action Coverage: To generate test cases with respect to action coverage we construct as
many marked specifications as there are actions within the specification.
Transition Coverage : Given a graph and a test suite TS, s is said to achieve transition
coverage, if it causes each transition t of the state graph to be exercised at least once.
The value of transition coverage is the ratio between the checked transitions and all the
transitions in the statechart graph.
Transition Path Coverage: Given a graph and a test suite TS, s is said to achieve
transition path coverage, if it causes each elementary transition path p of the state graph
to be exercised at least once. The value of path coverage is the ratio between the
traversed paths and all the paths in the graph.
Condition coverage. A single condition is covered, if it evaluates to both true and false
at some point during test execution. Decision coverage has also been called branch
coverage or predicate coverage. This means that 100% condition/decision coverage is
achieved if all conditions evaluate to true and to false and if every decision also
evaluates to true and to false during the test execution. A decision consists of conditions separated by logical operators (e.g. and, or).
5. TEGEMIOOSC–OUR PROPOSED APPROACH TO GENERATE
AND MINIMIZE TEST SEQUENCE WITH STATECHARTS
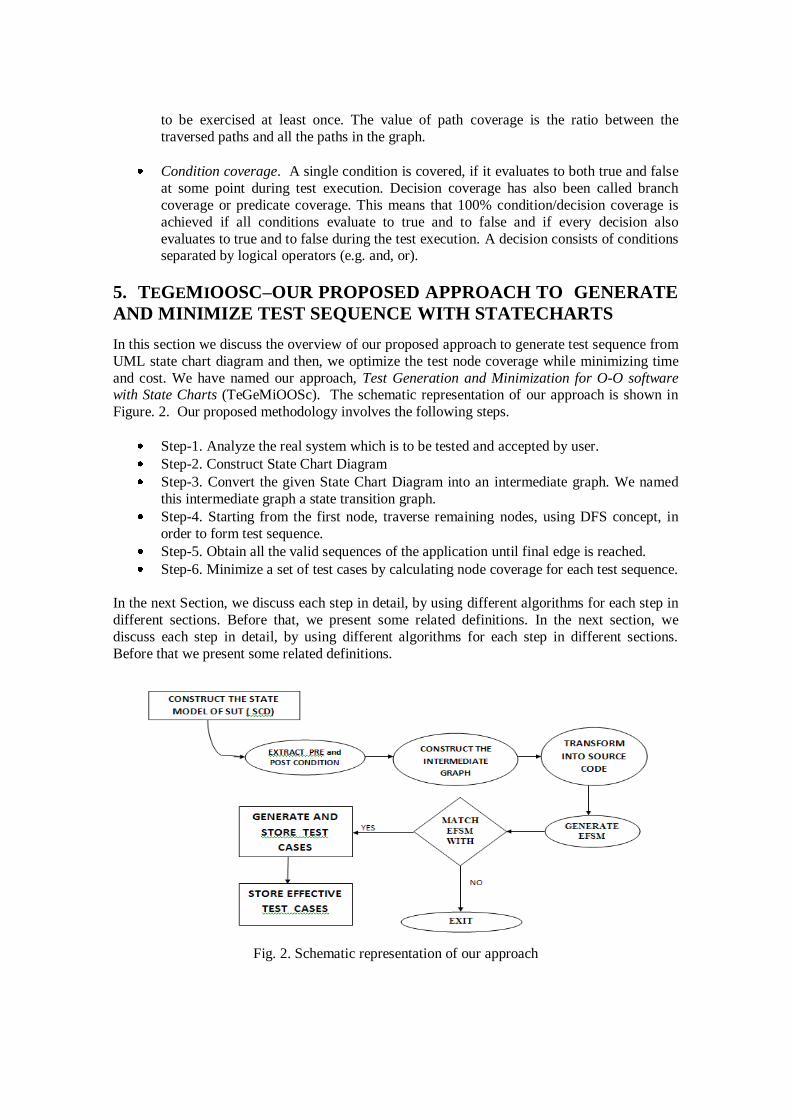
In this section we discuss the overview of our proposed approach to generate test sequence from
UML state chart diagram and then, we optimize the test node coverage while minimizing time
and cost. We have named our approach, Test Generation and Minimization for O-O software with State Charts (TeGeMiOOSc). The schematic representation of our approach is shown in
Figure. 2. Our proposed methodology involves the following steps.
Step-1. Analyze the real system which is to be tested and accepted by user.
Step-2. Construct State Chart Diagram
Step-3. Convert the given State Chart Diagram into an intermediate graph. We named
this intermediate graph a state transition graph.
Step-4. Starting from the first node, traverse remaining nodes, using DFS concept, in
order to form test sequence.
Step-5. Obtain all the valid sequences of the application until final edge is reached.
Step-6. Minimize a set of test cases by calculating node coverage for each test sequence.
In the next Section, we discuss each step in detail, by using different algorithms for each step in
different sections. Before that, we present some related definitions. In the next section, we
discuss each step in detail, by using different algorithms for each step in different sections.
Before that we present some related definitions.
Fig. 2. Schematic representation of our approach
5.1. Analyze the real system which is to be tested
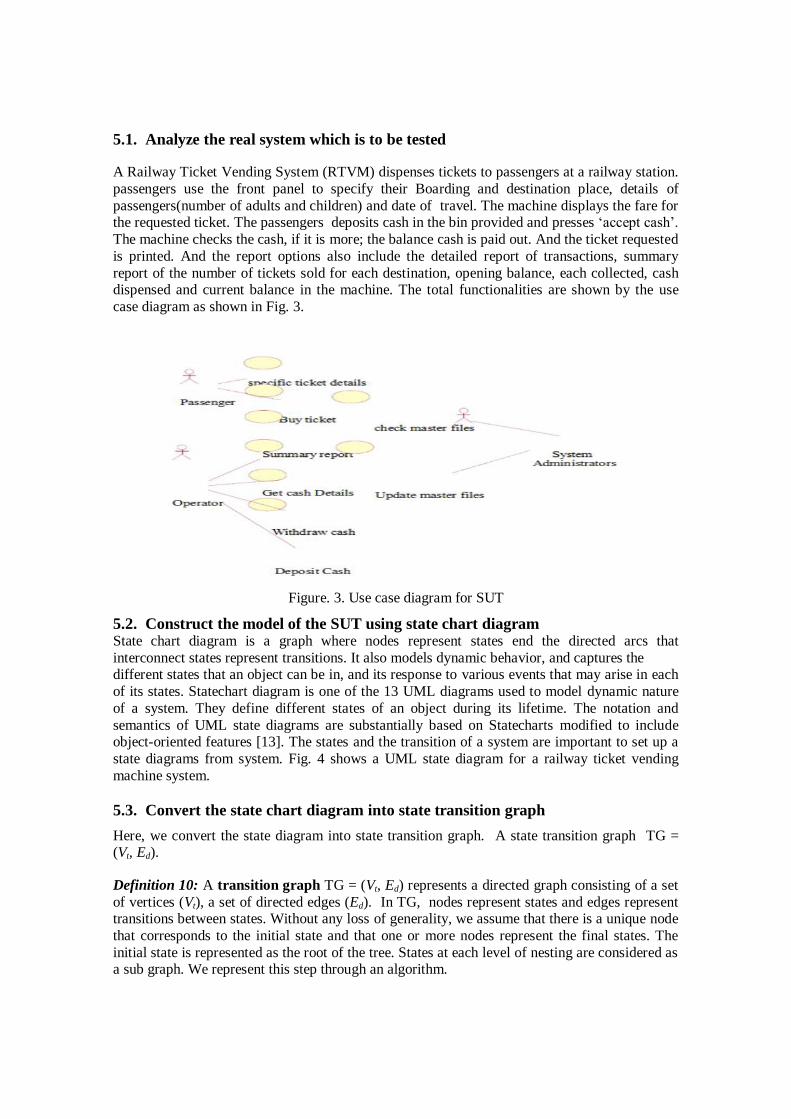
A Railway Ticket Vending System (RTVM) dispenses tickets to passengers at a railway station.
passengers use the front panel to specify their Boarding and destination place, details of
passengers(number of adults and children) and date of travel. The machine displays the fare for the requested ticket. The passengers deposits cash in the bin provided and presses „accept cash‟.
The machine checks the cash, if it is more; the balance cash is paid out. And the ticket requested
is printed. And the report options also include the detailed report of transactions, summary
report of the number of tickets sold for each destination, opening balance, each collected, cash dispensed and current balance in the machine. The total functionalities are shown by the use
case diagram as shown in Fig. 3.
Figure. 3. Use case diagram for SUT
5.2. Construct the model of the SUT using state chart diagram State chart diagram is a graph where nodes represent states end the directed arcs that
interconnect states represent transitions. It also models dynamic behavior, and captures the different states that an object can be in, and its response to various events that may arise in each
of its states. Statechart diagram is one of the 13 UML diagrams used to model dynamic nature
of a system. They define different states of an object during its lifetime. The notation and
semantics of UML state diagrams are substantially based on Statecharts modified to include object-oriented features [13]. The states and the transition of a system are important to set up a
state diagrams from system. Fig. 4 shows a UML state diagram for a railway ticket vending
machine system.
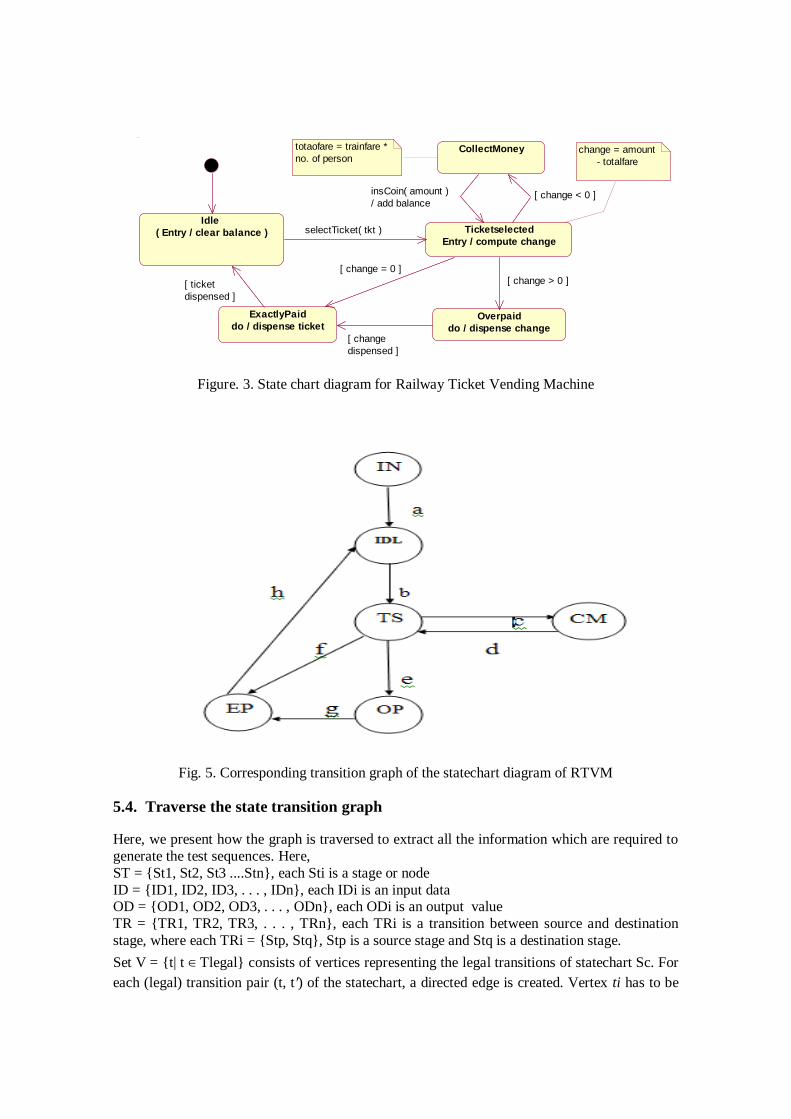
5.3. Convert the state chart diagram into state transition graph
Here, we convert the state diagram into state transition graph. A state transition graph TG = (Vt, Ed).
Definition 10: A transition graph TG = (Vt, Ed) represents a directed graph consisting of a set
of vertices (Vt), a set of directed edges (Ed). In TG, nodes represent states and edges represent transitions between states. Without any loss of generality, we assume that there is a unique node
that corresponds to the initial state and that one or more nodes represent the final states. The
initial state is represented as the root of the tree. States at each level of nesting are considered as a sub graph. We represent this step through an algorithm.
Idle
( Entry / clear balance )
Overpaid
do / dispense change
Ticketselected
Entry / compute change
CollectMoney
ExactlyPaid
do / dispense ticket
[ change < 0 ]insCoin( amount )
/ add balance
selectTicket( tkt )
[ change > 0 ]
[ change = 0 ]
[ ticket
dispensed ]
[ change
dispensed ]
change = amount
- totalfare
totaofare = trainfare *
no. of person
Figure. 3. State chart diagram for Railway Ticket Vending Machine
Fig. 5. Corresponding transition graph of the statechart diagram of RTVM
5.4. Traverse the state transition graph
Here, we present how the graph is traversed to extract all the information which are required to
generate the test sequences. Here,
ST = {St1, St2, St3 ....Stn}, each Sti is a stage or node
ID = {ID1, ID2, ID3, . . . , IDn}, each IDi is an input data OD = {OD1, OD2, OD3, . . . , ODn}, each ODi is an output value
TR = {TR1, TR2, TR3, . . . , TRn}, each TRi is a transition between source and destination
stage, where each TRi = {Stp, Stq}, Stp is a source stage and Stq is a destination stage.
Set V = {t| t ∈ Tlegal} consists of vertices representing the legal transitions of statechart Sc. For
each (legal) transition pair (t, t′) of the statechart, a directed edge is created. Vertex ti has to be
connected with all transitions that may be triggered from the state belonging to the initial
configuration. Transitions leading into a final state have to be connected with vertex tj . A
simple transition coverage may be reached by visiting all vertices of the graph, based on a transition graph at least once by starting in vertex ti and ending in vertex tj . The problem of
computing a route for visiting all vertices of a graph by minimizing the length of the route is
well known as the traveling salesman problem (TSP). If visiting vertices and traversing edges
more than once is allowed, it is called the graphical traveling salesman problem (GTSP) [25]. Also, by computing all complete transition sequences whose length is smaller than k and that
cannot be expanded to longer sequences, a minimal test case set fulfilling k-transition coverage
for all k ∈ 1, . . . , n is achieved. This procedure is described in Algorithm-1, in the next section.
5.4. Generating test cases
After, a transition graph is constructed based on a state chart Sc. If n = l, the graphical traveling
salesman problem can be applied directly. If n is greater than 1 the transition graph has to be transformed k - 1 times. The resulting graph represents all possible sequences of transitions of
length k. Additionally, all sequences of length k-1 are computed that cannot be expanded to
longer sequences. These sequences are characterized by the fact that the corresponding vertex representing that sequence is solely connected with vertices ti and tj. The functions indeg(v) :=
v′,(v′, v) ∈ A and outdeg(v) := v′(v, v′) ∈ A are used to compute these vertices. As these
sequences are already complete, they can be added to the set TS.
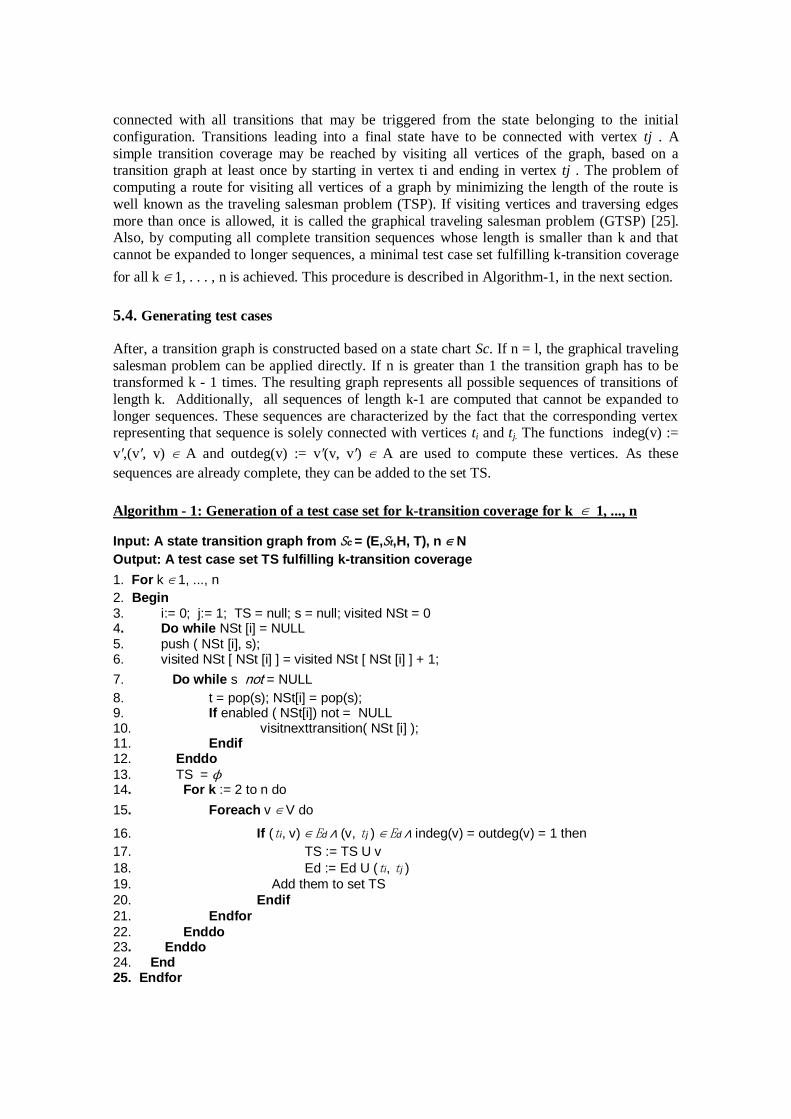
Algorithm - 1: Generation of a test case set for k-transition coverage for k ∈ 1, ..., n
Input: A state transition graph from Sc = (E,St,H, T), n ∈ N
Output: A test case set TS fulfilling k-transition coverage
1. For k ∈ 1, ..., n
2. Begin 3. i:= 0; j:= 1; TS = null; s = null; visited NSt = 0 4. Do while NSt [i] = NULL 5. push ( NSt [i], s); 6. visited NSt [ NSt [i] ] = visited NSt [ NSt [i] ] + 1;
7. Do while s not = NULL
8. t = pop(s); NSt[i] = pop(s); 9. If enabled ( NSt[i]) not = NULL 10. visitnexttransition( NSt [i] ); 11. Endif 12. Enddo
13. TS = ϕ 14. For k := 2 to n do
15. Foreach v ∈ V do
16. If (ti, v) ∈ Ed ∧ (v, tj ) ∈ Ed ∧ indeg(v) = outdeg(v) = 1 then
17. TS := TS U v
18. Ed := Ed U (ti, tj )
19. Add them to set TS
20. Endif
21. Endfor
22. Enddo 23. Enddo 24. End 25. Endfor
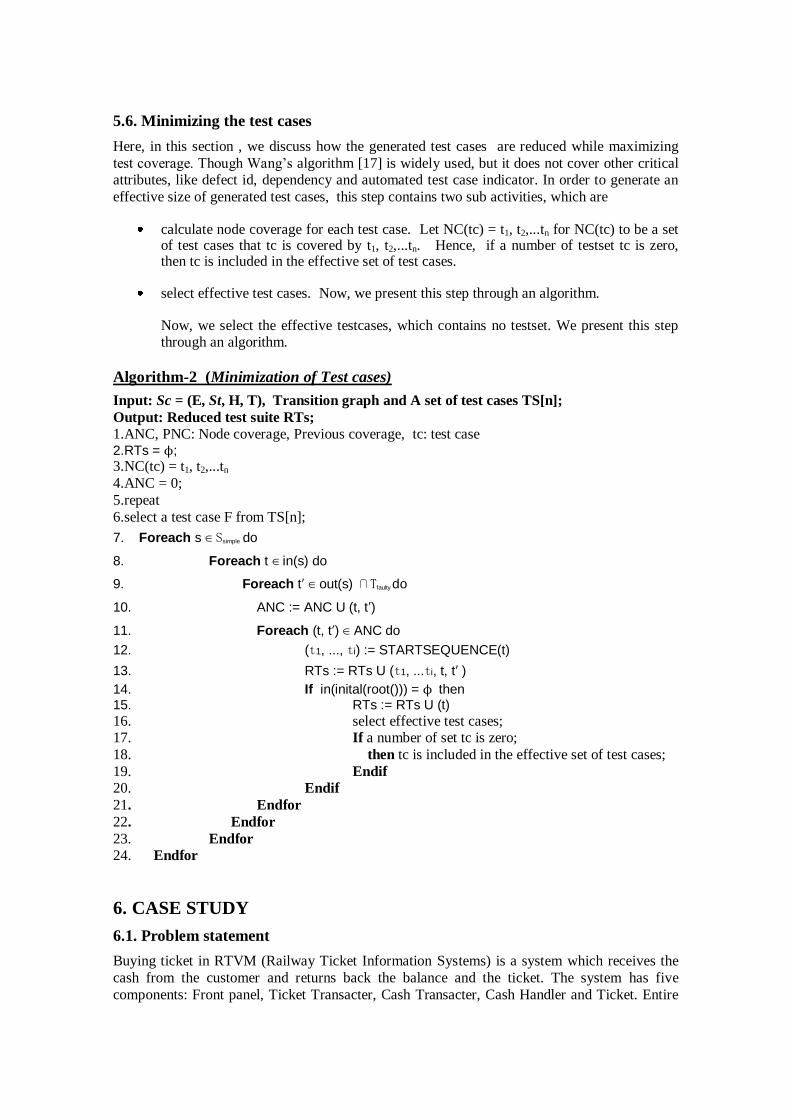
5.6. Minimizing the test cases
Here, in this section , we discuss how the generated test cases are reduced while maximizing
test coverage. Though Wang‟s algorithm [17] is widely used, but it does not cover other critical attributes, like defect id, dependency and automated test case indicator. In order to generate an
effective size of generated test cases, this step contains two sub activities, which are
calculate node coverage for each test case. Let NC(tc) = t1, t2,...tn for NC(tc) to be a set of test cases that tc is covered by t1, t2,...tn. Hence, if a number of testset tc is zero, then tc is included in the effective set of test cases.
select effective test cases. Now, we present this step through an algorithm.
Now, we select the effective testcases, which contains no testset. We present this step through an algorithm.
Algorithm-2 (Minimization of Test cases)
Input: Sc = (E, St, H, T), Transition graph and A set of test cases TS[n];
Output: Reduced test suite RTs;
1.ANC, PNC: Node coverage, Previous coverage, tc: test case 2.RTs = ϕ;
3.NC(tc) = t1, t2,...tn
4.ANC = 0;
5.repeat
6.select a test case F from TS[n];
7. Foreach s ∈ Ssimple do
8. Foreach t ∈ in(s) do
9. Foreach t′ ∈ out(s) ∩Tfaulty do
10. ANC := ANC U (t, t′)
11. Foreach (t, t′) ∈ ANC do
12. (t1, ..., ti) := STARTSEQUENCE(t)
13. RTs := RTs U (t1, ...ti, t, t′ )
14. If in(inital(root())) = ϕ then 15. RTs := RTs U (t)
16. select effective test cases; 17. If a number of set tc is zero;
18. then tc is included in the effective set of test cases;
19. Endif
20. Endif
21. Endfor
22. Endfor
23. Endfor
24. Endfor
6. CASE STUDY
6.1. Problem statement
Buying ticket in RTVM (Railway Ticket Information Systems) is a system which receives the
cash from the customer and returns back the balance and the ticket. The system has five
components: Front panel, Ticket Transacter, Cash Transacter, Cash Handler and Ticket. Entire
functions of the system are represented in the form of a usecase diagram. The customer deposits
the cash. The system then passes the cash deposit intimation to ticket transacter. The ticket
transacter then accepts cash and passes it to cash transacter and the cash transacter then transacts the cash to the cash handler. After receiving the cash, the cash handler sends an
acknowledgment to the cash transacter. The cash transacter gives cash confirmation
acknowledgement to the ticket transacter and also gives the balance amount to cash transacter.
The cash transacter sends the acknowledgment for the cash received to the ticket transacter. Finally the ticket transacter prints the ticket with the help of ticket component and issues the
ticket to the customer. The state diagram for the buy ticket in RTVM system is shown in Fig.
4. Here, the object enters into idle state, when the power switch is on. Once the user selects a
tickettype button in the menu, the object enters the ticketselected state. The user can select the
destination, ticket type and the number of persons (n) to travel. The condition n ≤ 6 is inserted
for the event tickettypeselected, as the ticket machine is not expected to issue a ticket for more than 6 persons in one transaction. Once the ticket type and number of persons required are
selected, the object enters the collectmoney state. In this state, the object collects the amount of
money (totalfair) the user has to enter into the ticket machine. Note that totalfair = ticket fare × number of persons. As the user inserts money (amount) into the machine, the machine object
changes its state to busy. In the busy state, it calculates how much balance or change (chng) has
to be returned to the user if any, where chng = (amount - totalfair). If the change balance is less than zero, the machine object changes its state again from busy to collectmoney as the money
inserted is insufficient. If the change balance is equal to zero, the machine object goes to
exactlypaid state and dispenses the ticket for requested number of persons. If the change balance
is more than zero, then the machine object changes its state to overpaid state and then dispenses ticket as well as dispenses change. After constructing state chart diagram, we construct
transition graph as shown in Fig 5.
In next step, we traverse the graph and extract all required information from the state transition graph as described below.
6.2. Working Of the proposed Algorithm
The state model application saved as .mdl file is provided as input to the parser. The
parser analyses and collects all the information about object states, actions / guards and
transitions, which are represented as nodes and edges in a directed graph as shown in
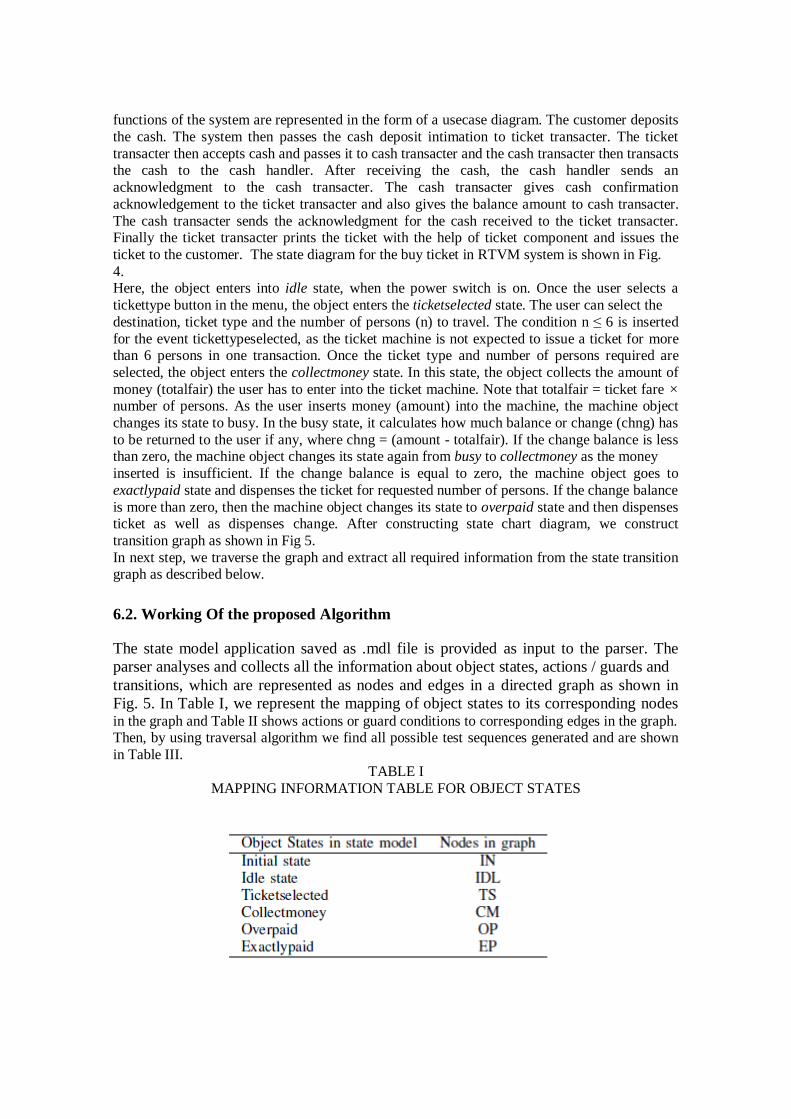
Fig. 5. In Table I, we represent the mapping of object states to its corresponding nodes in the graph and Table II shows actions or guard conditions to corresponding edges in the graph. Then, by using traversal algorithm we find all possible test sequences generated and are shown
in Table III.
TABLE I
MAPPING INFORMATION TABLE FOR OBJECT STATES
Hence, the set of states are ST = {IN, IDL, TS, CM, OP, EP}, each STi is a state or node
ID = {ID1, ID2, ID3, ID4, ID5, ID6}, each IDi is an input data OD = {OD1, OD2, OD3, OD4,
OD5, OD6}, each ODi is an output value TR = {TR1, TR2, TR3, TR4, TR5, TR6, TR7}, each TRi is a transition between source and
destination state, where each TRi = {STp, STq}, STp is a source state and STq is a destination
state. Hence, each transition can be extracted as follows:
TR1 = { IN, IDL }
TR2 = { IDL, TS }
TR3 = { TS, CM } TR4 = { CM, TS }
TR5 = { TS, OP }
TR6 = { TS, EP }
TR7 = { OP, EP } TR8 = { EP, IDL }
This step is to verify the completion of extracted information, derived from the diagram.
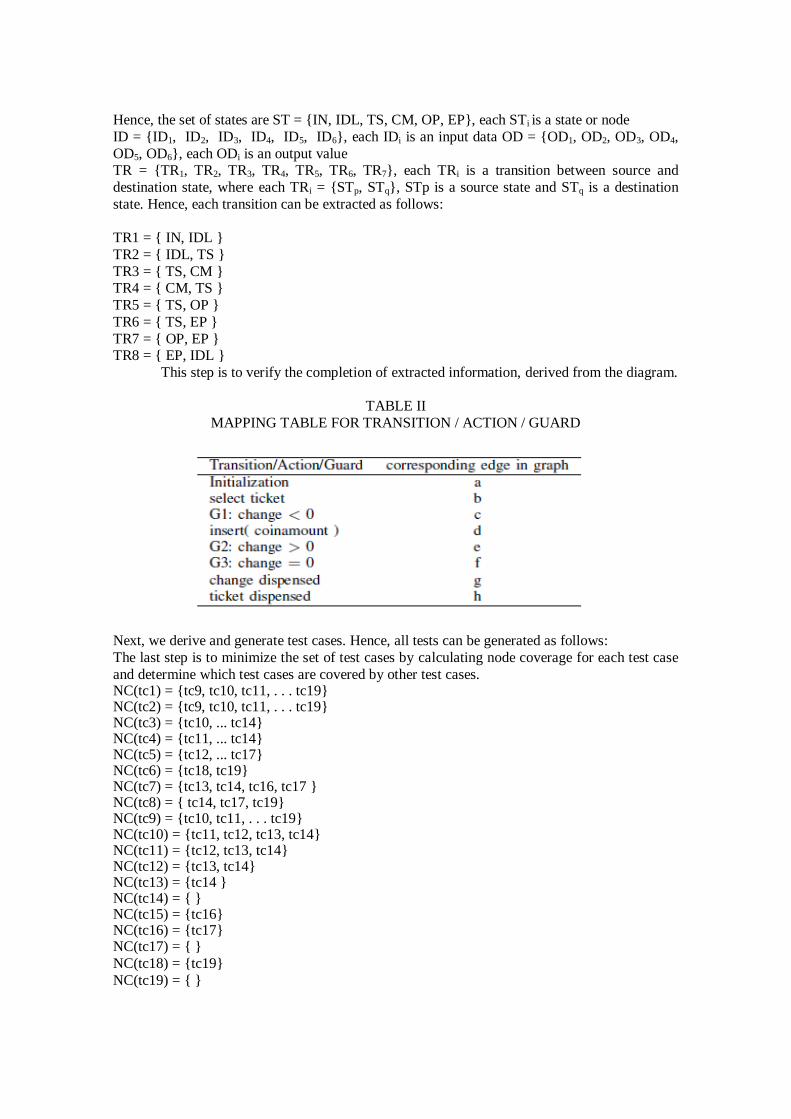
TABLE II
MAPPING TABLE FOR TRANSITION / ACTION / GUARD
Next, we derive and generate test cases. Hence, all tests can be generated as follows:
The last step is to minimize the set of test cases by calculating node coverage for each test case
and determine which test cases are covered by other test cases. NC(tc1) = {tc9, tc10, tc11, . . . tc19} NC(tc2) = {tc9, tc10, tc11, . . . tc19} NC(tc3) = {tc10, ... tc14} NC(tc4) = {tc11, ... tc14} NC(tc5) = {tc12, ... tc17} NC(tc6) = {tc18, tc19} NC(tc7) = {tc13, tc14, tc16, tc17 } NC(tc8) = { tc14, tc17, tc19} NC(tc9) = {tc10, tc11, . . . tc19} NC(tc10) = {tc11, tc12, tc13, tc14} NC(tc11) = {tc12, tc13, tc14} NC(tc12) = {tc13, tc14} NC(tc13) = {tc14 } NC(tc14) = { } NC(tc15) = {tc16}
NC(tc16) = {tc17} NC(tc17) = { }
NC(tc18) = {tc19}
NC(tc19) = { }
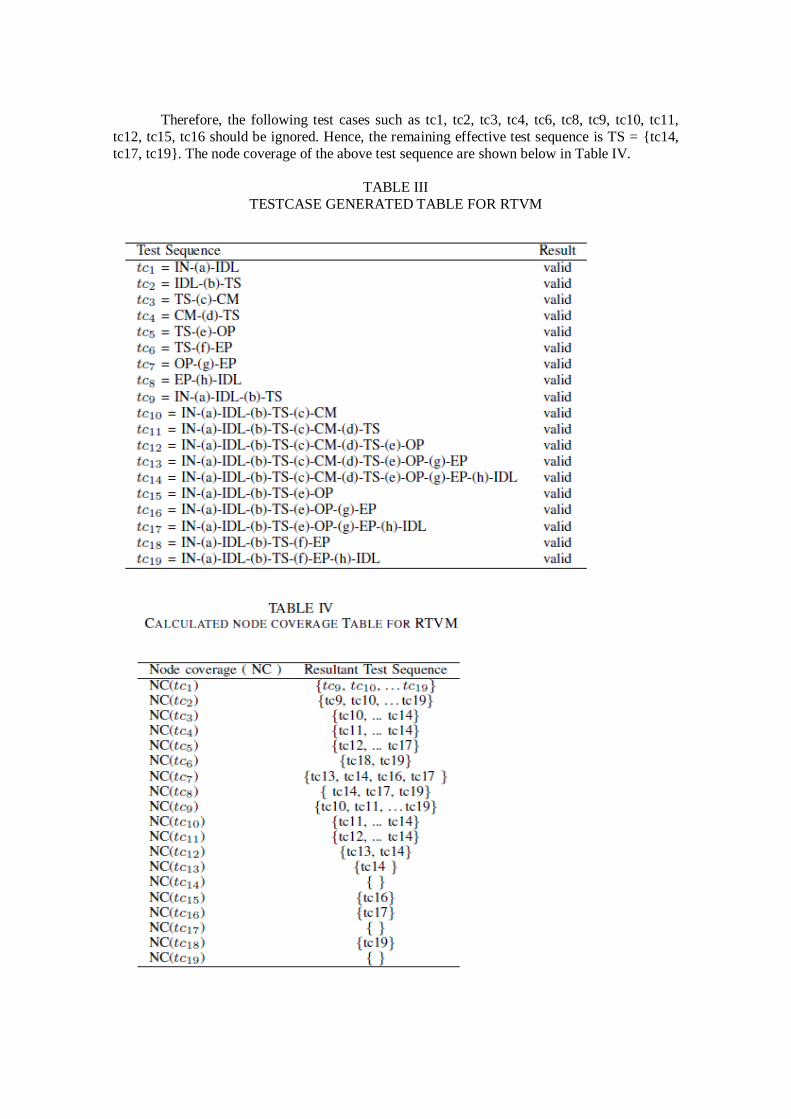
Therefore, the following test cases such as tc1, tc2, tc3, tc4, tc6, tc8, tc9, tc10, tc11,
tc12, tc15, tc16 should be ignored. Hence, the remaining effective test sequence is TS = {tc14,
tc17, tc19}. The node coverage of the above test sequence are shown below in Table IV.
TABLE III
TESTCASE GENERATED TABLE FOR RTVM
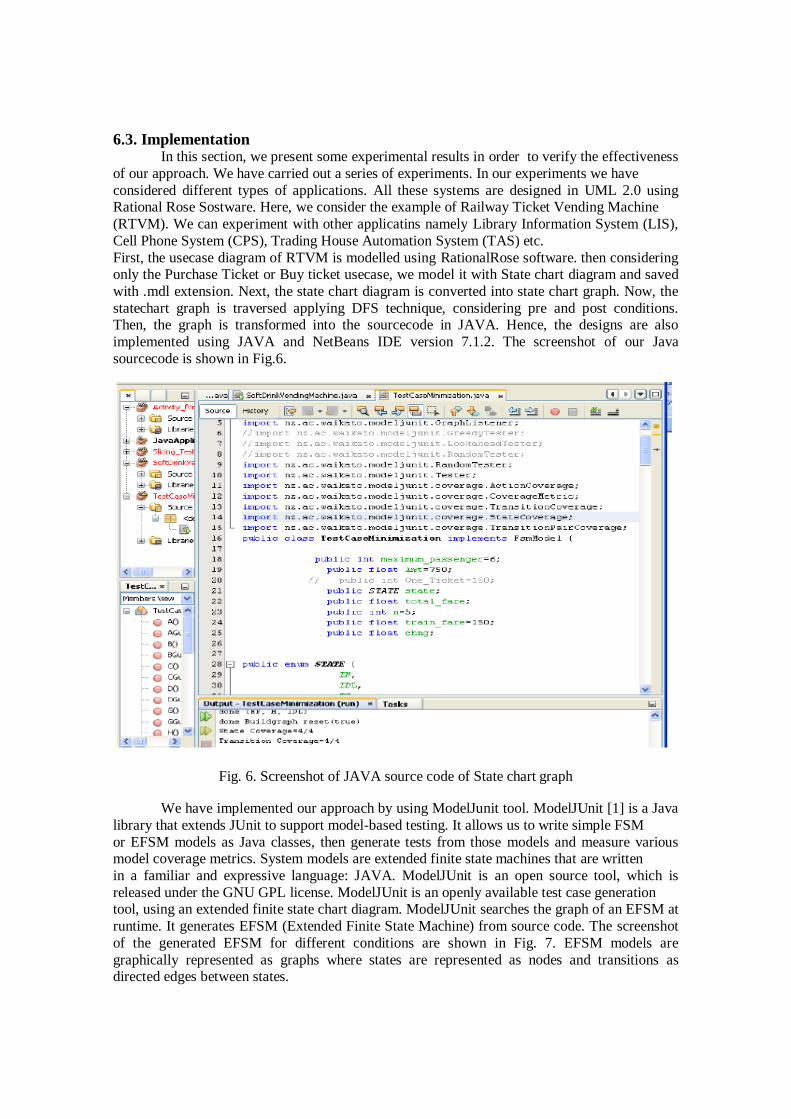
6.3. Implementation In this section, we present some experimental results in order to verify the effectiveness
of our approach. We have carried out a series of experiments. In our experiments we have
considered different types of applications. All these systems are designed in UML 2.0 using Rational Rose Sostware. Here, we consider the example of Railway Ticket Vending Machine
(RTVM). We can experiment with other applicatins namely Library Information System (LIS),
Cell Phone System (CPS), Trading House Automation System (TAS) etc.
First, the usecase diagram of RTVM is modelled using RationalRose software. then considering only the Purchase Ticket or Buy ticket usecase, we model it with State chart diagram and saved
with .mdl extension. Next, the state chart diagram is converted into state chart graph. Now, the
statechart graph is traversed applying DFS technique, considering pre and post conditions. Then, the graph is transformed into the sourcecode in JAVA. Hence, the designs are also
implemented using JAVA and NetBeans IDE version 7.1.2. The screenshot of our Java
sourcecode is shown in Fig.6.
Fig. 6. Screenshot of JAVA source code of State chart graph
We have implemented our approach by using ModelJunit tool. ModelJUnit [1] is a Java
library that extends JUnit to support model-based testing. It allows us to write simple FSM
or EFSM models as Java classes, then generate tests from those models and measure various model coverage metrics. System models are extended finite state machines that are written
in a familiar and expressive language: JAVA. ModelJUnit is an open source tool, which is
released under the GNU GPL license. ModelJUnit is an openly available test case generation tool, using an extended finite state chart diagram. ModelJUnit searches the graph of an EFSM at
runtime. It generates EFSM (Extended Finite State Machine) from source code. The screenshot
of the generated EFSM for different conditions are shown in Fig. 7. EFSM models are
graphically represented as graphs where states are represented as nodes and transitions as directed edges between states.
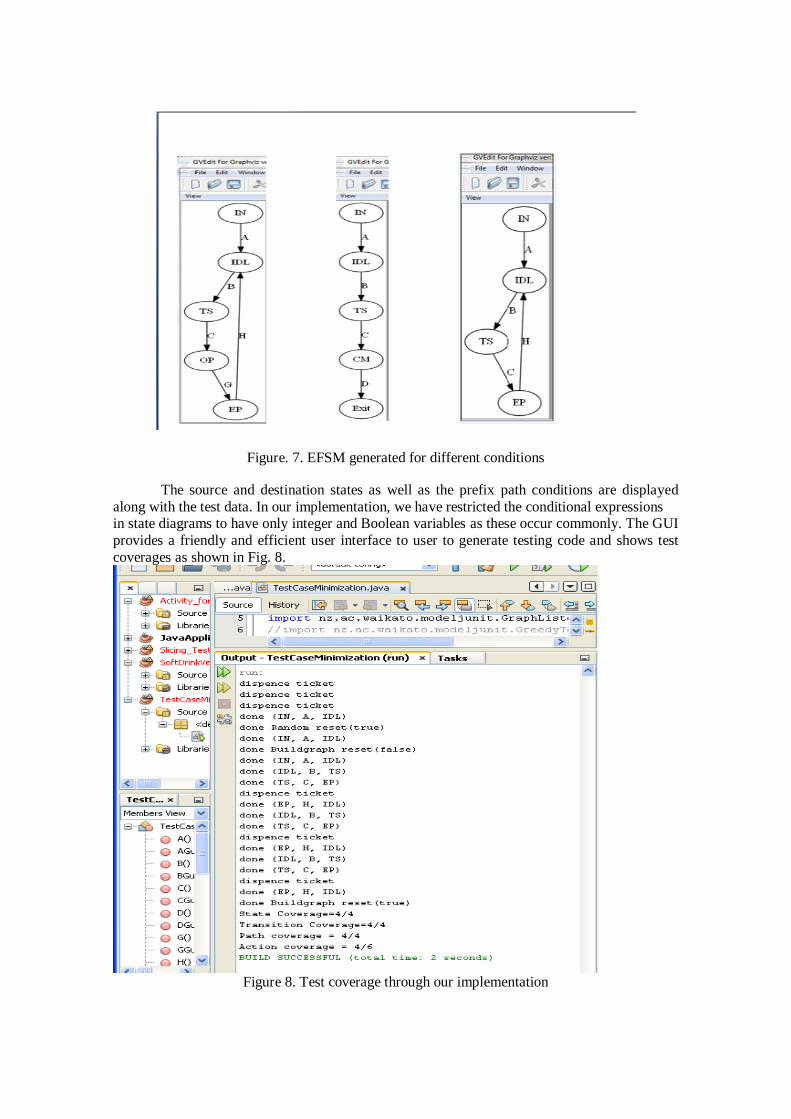
Figure. 7. EFSM generated for different conditions
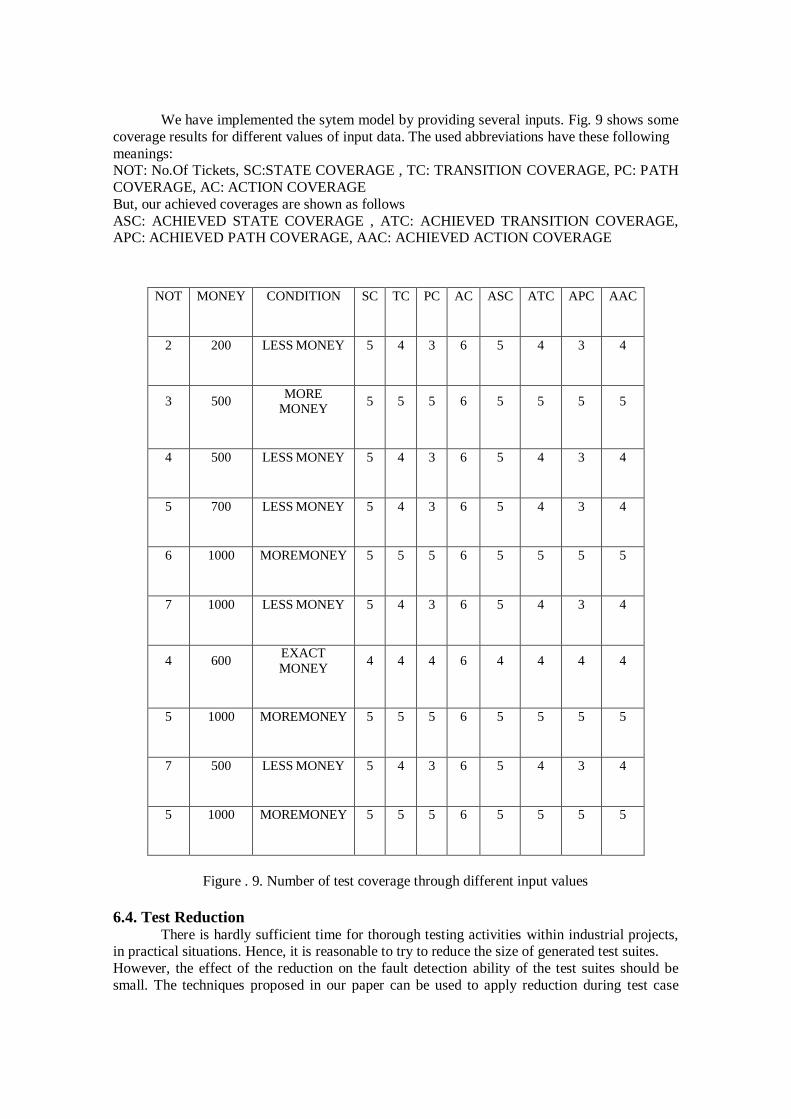
The source and destination states as well as the prefix path conditions are displayed
along with the test data. In our implementation, we have restricted the conditional expressions in state diagrams to have only integer and Boolean variables as these occur commonly. The GUI
provides a friendly and efficient user interface to user to generate testing code and shows test
coverages as shown in Fig. 8.
Figure 8. Test coverage through our implementation
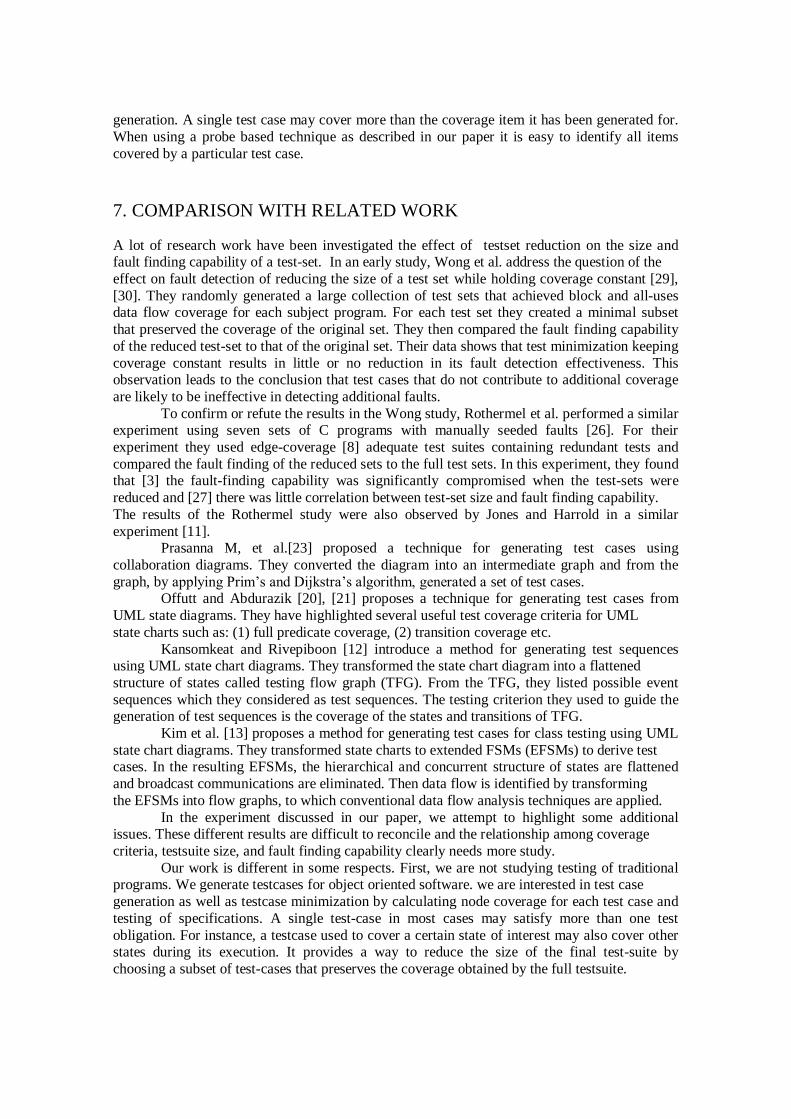
We have implemented the sytem model by providing several inputs. Fig. 9 shows some
coverage results for different values of input data. The used abbreviations have these following
meanings: NOT: No.Of Tickets, SC:STATE COVERAGE , TC: TRANSITION COVERAGE, PC: PATH
COVERAGE, AC: ACTION COVERAGE
But, our achieved coverages are shown as follows
ASC: ACHIEVED STATE COVERAGE , ATC: ACHIEVED TRANSITION COVERAGE, APC: ACHIEVED PATH COVERAGE, AAC: ACHIEVED ACTION COVERAGE
NOT MONEY CONDITION SC TC PC AC ASC ATC APC AAC
2 200 LESS MONEY 5 4 3 6 5 4 3 4
3 500 MORE
MONEY 5 5 5 6 5 5 5 5
4 500 LESS MONEY 5 4 3 6 5 4 3 4
5 700 LESS MONEY 5 4 3 6 5 4 3 4
6 1000 MOREMONEY 5 5 5 6 5 5 5 5
7 1000 LESS MONEY 5 4 3 6 5 4 3 4
4 600 EXACT
MONEY 4 4 4 6 4 4 4 4
5 1000 MOREMONEY 5 5 5 6 5 5 5 5
7 500 LESS MONEY 5 4 3 6 5 4 3 4
5 1000 MOREMONEY 5 5 5 6 5 5 5 5
Figure . 9. Number of test coverage through different input values
6.4. Test Reduction There is hardly sufficient time for thorough testing activities within industrial projects,
in practical situations. Hence, it is reasonable to try to reduce the size of generated test suites.
However, the effect of the reduction on the fault detection ability of the test suites should be
small. The techniques proposed in our paper can be used to apply reduction during test case
generation. A single test case may cover more than the coverage item it has been generated for.
When using a probe based technique as described in our paper it is easy to identify all items
covered by a particular test case.
7. COMPARISON WITH RELATED WORK
A lot of research work have been investigated the effect of testset reduction on the size and fault finding capability of a test-set. In an early study, Wong et al. address the question of the
effect on fault detection of reducing the size of a test set while holding coverage constant [29],
[30]. They randomly generated a large collection of test sets that achieved block and all-uses data flow coverage for each subject program. For each test set they created a minimal subset
that preserved the coverage of the original set. They then compared the fault finding capability
of the reduced test-set to that of the original set. Their data shows that test minimization keeping
coverage constant results in little or no reduction in its fault detection effectiveness. This observation leads to the conclusion that test cases that do not contribute to additional coverage
are likely to be ineffective in detecting additional faults.
To confirm or refute the results in the Wong study, Rothermel et al. performed a similar experiment using seven sets of C programs with manually seeded faults [26]. For their
experiment they used edge-coverage [8] adequate test suites containing redundant tests and
compared the fault finding of the reduced sets to the full test sets. In this experiment, they found that [3] the fault-finding capability was significantly compromised when the test-sets were
reduced and [27] there was little correlation between test-set size and fault finding capability.
The results of the Rothermel study were also observed by Jones and Harrold in a similar
experiment [11]. Prasanna M, et al.[23] proposed a technique for generating test cases using
collaboration diagrams. They converted the diagram into an intermediate graph and from the
graph, by applying Prim‟s and Dijkstra‟s algorithm, generated a set of test cases. Offutt and Abdurazik [20], [21] proposes a technique for generating test cases from
UML state diagrams. They have highlighted several useful test coverage criteria for UML
state charts such as: (1) full predicate coverage, (2) transition coverage etc.
Kansomkeat and Rivepiboon [12] introduce a method for generating test sequences using UML state chart diagrams. They transformed the state chart diagram into a flattened
structure of states called testing flow graph (TFG). From the TFG, they listed possible event
sequences which they considered as test sequences. The testing criterion they used to guide the generation of test sequences is the coverage of the states and transitions of TFG.
Kim et al. [13] proposes a method for generating test cases for class testing using UML
state chart diagrams. They transformed state charts to extended FSMs (EFSMs) to derive test cases. In the resulting EFSMs, the hierarchical and concurrent structure of states are flattened
and broadcast communications are eliminated. Then data flow is identified by transforming
the EFSMs into flow graphs, to which conventional data flow analysis techniques are applied.
In the experiment discussed in our paper, we attempt to highlight some additional issues. These different results are difficult to reconcile and the relationship among coverage
criteria, testsuite size, and fault finding capability clearly needs more study.
Our work is different in some respects. First, we are not studying testing of traditional programs. We generate testcases for object oriented software. we are interested in test case
generation as well as testcase minimization by calculating node coverage for each test case and
testing of specifications. A single test-case in most cases may satisfy more than one test
obligation. For instance, a testcase used to cover a certain state of interest may also cover other states during its execution. It provides a way to reduce the size of the final test-suite by
choosing a subset of test-cases that preserves the coverage obtained by the full testsuite.
8. CONCLUSSION AND FUTURE WORK
In our approach, first, we built a state chart model of our system under test. Next, we derived
state transition graph from state chart diagram. Then, all required information are extracted from
the graph. Next, the test cases are generated by our algorithm. Lastly, a set of test cases are
minimized by calculating node coverage for each test case. It is determined that which test cases are covered by other test cases. In this way, our paper introduces an
efficient test generation approach to optimize the test coverage by minimizing time and cost. In
our opinion, there is almost no degradation in terms of testsuite quality. Further, we plan into testcase generation techniques by using any other UML diagram
such as activity diagram. Experimental studies required to determine if such techniques
can more reliably reduce the burden of the testing effort.
REFERENCES
[[1] http://www.cs.waikato.ac.nz/ marku/mbt/modeljunit.
[2] OMG. Unified Modeling Language specification, version 2.0, object management group,
www.omg.org, August 2005.
[3] M. Archer, C. Heitmeyer, and S. Sims. TAME: A PVS interface to simplify proofs for automata
models, In User Interfaces for Theorem Provers, 1998.
[4] Fevzi Belli and Axel Hollmann. Test generation and minimization with basic statecharts. ACM,
SAC-08, March 2008, pages 718 – 723.
[5] Michel R. Blaha and James R. Rumbaugh. Object-Oriented Modeling and Design with UML.
Pearson, second edition.
[6] M. Broy. Model-based testing of reactive systems. Advanced Lectures, Springer., June 2005.
[7] T. S. Chow. Testing software design modeled by finite-state machines. IEEE TSE, 4(3): 1978,
pages 178 – 187.
[8] P. Frankl and S. N. Weiss. An experimental comparison of the effectiveness of the all-uses and
all-edges adequacy criteria. In Proceedings of the symposium on Testing, analysis, and
verification, 1991.
[9] D. Harel. Statecharts: A visual formulation for complex systems. Sci. Comp. Prog., 8: 1987,
pages 231 – 274.
[10] Mats P. E. Heimdahl and Devaraj George. Test-suite reduction for model based tests: Effects on
test quality and implications for testing.
[11] J. A. Jones and M. J. Harrold. Test-suite reduction and prioritization for modified
condition/decision coverage. IEEE Transactions on Software Emgineering, 29(3): March 2003,
pages 195 – 209.
[12] S. Kansomkeat and W. Rivepiboon. Automated-generating test case using UML statechart diagrams. In Proc. SAICSIT 2003,ACM, 2003, pages 296 – 300.
[13] Y. G. Kim, H. S. Hong, D. H. Bae, and S. D. Cha et al. Test cases generation from UML state
diagram, Software Testing Verification and Reliability, 1999, pages 187 – 192.
[14] N. Kosindrecha and J. Daengdej. A test generation method based on state diagram. journal of
Theoritical and Applied Information Technology, 2005 – 2010, pages 28 – 44.
[15] R. Lai. A survey of communication protocol testing. Journal of Systems and Software, 62(1):
2002, pages 21 – 46.
[16] J. T. Lallchandani and R. Mall. Integrated state-based dynamic slicing technique for UML
models. In IET Software, Vol. 4, Iss. 1, 2010, pages 55 – 78.
[17] H. Li and L. C. Peng. Software test data generation using ant colony optimization. In
Proceedings of World Academy of Science, Engineeing and Technology, January 2005.
[18] Wang Linzhang, Yuan Jiesong, Yu Xiaofeng, Hu Ju, Li Xuandong, and Zheng Guoliang.
Generating test cases from UML activity diagram based on gray-box method. Proceedings of the
11th Asia-Pacific Software Engineering Conference (APSEC04).
[19] R. Mall. Fundamentals of Software Engineering. Prentice Hall, 3rd edition, 2009.
[20] J. Offutt and A. Abdurazik. Generating tests from uml specifications. In Proceedings of 2nd
International Conference. UML, Lecture Notes in Computer Science, 1999, pages 416 – 429.
[21] J. Offutt, S. Liu, A. Abdurazik, and P. Ammann et al. Generating test data from state-based
specifications. Software Testing Verification Reliability., 13: 2003, pages 25 – 53.
[22] D. Pilone and N. Pitman. UML 2.0 in a Nutshell. NY. O‟Reilly, USA, 2005.
[23] M. Prasanna, K. R. Chandran, and K. Thiruvenkadam. Automatic testcase generation for UML
collaboration diagram. IETE Journal of Research, 57(1): Jan-Feb 2011, pages 77 – 81.
[24] M. Priestley. Practical Object-Oriented Design with UML. Tata McGraw-Hill, second edition.
[25] G. Reinelt. In the traveling salesman: Computational solutions for tsp applications. Springer
Berlin / Heidelberg, 1994, pages 840.
[26] G. Rothermel, M. Harrold, J. Ostrin, and C. Hong. An empirical study of the effects of
minimization on the fault detection capabilities of test suites. In Proceedings of the International
Conference on Software Maintenance, November 1998, pages 34 – 43.
[27] C. Parent-Vigouroux S. Bensalem, P. Caspi and C. Dumas. A methodology for proving control
systems with lustre and pvs. In In Proceedings of the Seventh Working Conference on
Dependable Computing for Critical Applications (DCCA 7), 1999.
[28] M. Sharma and R. Mall. Automatic generation of test specifications for coverage of system state
transitions. Information and SoftwareTechnology, (51): 2009, pages 418 – 432.
[29] W. Wong, J. Horgan, S. London, and A. Mathur. Effect of test set minimization on fault
detection effectiveness. Software Practice and Experience, 28(4): April 1998, pages 347 – 369.
[30] W. Wong, J. Horgan, A. Mathur, and A. Pasquini. Test set size minimization and fault detection
effectiveness: A case study in a space application. In Proceedings of the 21st Annual
International Computer Software and Applications Conference, August 1997, pages 522 – 528.
Authors
.
Prafulla Ku. Behera has received his Ph.D
degree from Utkal University, Vani vihar,
Bhubaneswar, India. He is currently working as
a reader at Dept. of Computer Science &
Application, in Utkal University, Vani vihar,
Bhubaneswar, India. His special fields of
interest include Mobile Computing, Software
Engineering, He is a member of CSI.
Durga Prasad Mohapatra received his Ph. D.
from Indian Institute of Technology Kharagpur
and M. E. from Regional Engineering College
(now NIT), Rourkela. He joined the faculty of
the Department of Computer Science and
Engineering at the National Institute of
Technology, Rourkela in 1996, where he is now
Associate Professor. His research interests
include software engineering, real-time systems, discrete mathematics and distributed computing
and published more than forty papers in these
fields. He has received many awards including
Young Scientist Award for the year 2006 by
Orissa Bigyan Academy, Prof. K. Arumugam
award for innovative research for the year 2009
and Maharasthra State National Award for
outstanding research for the year 2010 by ISTE,
NewDelhi. He has also received three research
projects from DST and UGC. Currently, he is a
member of IEEE. Dr. Mohapatra has co-
authored the book Elements of Discrete Mathematics: A computer Oriented Approach
published by Tata Mc-Graw Hill.
Ranjita Ku. Swain completed her MCA from
College of Engg.And Technology, OUAT,
Bhubaneswar, India. She is pursuing her Ph.D
degree from Utkal University, Vani vihar,
Bhubaneswar, India. She is currently working as
Senior Lecturer in Computer Science Dept.,
Rourkela Institute of Management Studies,
Rourkela, India. She has 11years of teaching experience and her fields of interest are Software
Engg., Discrete Mathematical Structure and
Numerical Methods.