minimum wages and enforcement in india: inverted u-shaped
TRANSCRIPT
1
Minimum wages and enforcement in India: Inverted U-shaped employment effects
Vidhya Soundararajan†
March 31 2013
† PhD student, Charles H. Dyson School of Applied Economics and Management, Cornell University.
418, Warren Hall, Cornell University, Ithaca, NY 14853. [email protected].
I gratefully acknowledge the extensive feedback provided by my doctoral committee members, Ravi
Kanbur, Nancy Chau, and Victoria Prowse. I also thank Matthew Freedman for his discussions and
useful comments in the earlier version of this paper. All errors are my own.
2
ABSTRACT
The minimum wage literature on both developed and developing countries ignores the
imperfect nature of enforcement. In an attempt to fill this gap, this paper estimates an interactive
effect of minimum wage and enforcement on wages and employment, among low wage
construction workers in India, using flexible parametric and semi-parametric spline regressions.
Results indicate that wage elasticities are positive for all ranges of minimum wages and increase
with enforcement intensity. Employment elasticities are positive in the lowest 25% of the
minimum wage distribution and negative beyond that range indicating an inverted U-shaped
relationship, consistent with a monopsonistic labor market model. Further, employment elasticity
decreases with the intensity of enforcement. These results imply that, for an appropriately set and
enforced minimum wage, both wages and employment increase, improving overall welfare.
Key words
Minimum wage, enforcement, employment, labor markets, monospony, construction, India

3
1. INTRODUCTION
The effects of minimum wages on employment and wages are widely debated in the labor
economics literature. The efficacy of such regulations in achieving their intended welfare
consequences is less straightforward and depends on characteristics such as, income and health
of institutions of the country or state in question (Blanchard, 2004). Enforcement intensity is one
such institution that is important, but often neglected in the evaluation in empirical labor market
studies. This paper argues that the extensive literature on the evaluation of the minimum wage
policy does not acknowledge the poor standards of enforcement, despite the growing evidence on
the latter. The imperfect nature of enforcement and the effects of spatial and time varying
enforcement intensities on wages, employment, firm size, productivity, and informality have
been studied in a number of papers on developing countries. However, studies that estimate the
joint impact of minimum wages and enforcement are starkly missing. This paper attempts to fill
this gap in the literature by estimating an interactive effect of minimum wages and enforcement
among low wage construction workers in India using six repeated cross-section datasets from the
employment-unemployment survey conducted by the National Sample Survey Organization of
India.
As Hamermesh (2002) notes, developing countries act as a good workroom for policy
evaluation, because they provide quasi-experimental research designs. India provides such a
platform with minimum wages and enforcement varying exogenously across states and time.
Both parametric reduced-form and semi-parametric regression (using splines) results are
reported. These findings would not only lend themselves to the understanding the role of

4
minimum wage, but the direction of estimated effects indicate the nature of the underlying labor
markets. Theories predict a uniform negative effect of minimum wages on employment in
competitive labor markets, and an inverted U-shape relationship in monosponistic and
oligospnistic models (Stigler, 1946). Further, varying levels of enforcement could potentially
interact with varying minimum wages to produce interesting outcomes. For instance, Basu, Chau
and Kanbur (2010) develop an incentive compatible equilibrium model and define several
thresholds, to show that the response of employment to a minimum wage rise can be positive,
negative or subdued depending on the level of minimum wage and enforcement.
Typically, minimum wages are instituted to empower workers in the lower end of the
wage distribution. A well enforced minimum wage could increase productivity (through the
efficiency wage argument) and the purchasing power of workers (Levin-Waldman, 1997).
According to the efficiency wages argument, wages higher than the marginal revenue product of
labor potentially raises productivity either from improved nutrition or human development of
workers, assuming higher income translates to better nutritional outcomes. In addition,
employers may provide on the job training to increase the productivity of workers, given that the
higher minimum wage will now force them to pay higher wages. A minimum wage could also
increase the purchasing power of workers, which in turn benefits the economy by stimulating
aggregate demand. The argument against the minimum wage policy is centered on its effects on
employment.
Critics of the policy argue that in a perfectly competitive labor market, where workers are
paid their marginal revenue product, a minimum wage policy causes employment to fall. This is
5
however not true if the labor market is monosponistic or oligosponisitic, where introducing a
perfectly enforced minimum wage increases employment for a range of minimum wages
(Stigler, 1946). Stigler’s model predicts an inverted U-shape relationship between employment
and minimum wages, rather than a uniform negative effect, as predicted by the competitive
model. In other words, with perfect enforcement and monosponistic labor markets, employment
increases with an increase in minimum wages until a threshold; beyond this threshold,
employment decreases with higher minimum wages. For subsequent minimum wage models
based on monopsony, see Bhaskar, Manning and To (2002), Basu, Chau and Kanbur (2010), and
Ashenfelter, Farber and Ransom (2010).
There is a large empirical literature on the evaluation of the minimum wage policy but
the enforcement is visibly absent there, despite many studies that model the role of enforcement
in a firm’s decision to comply. Ashenfelter and Smith (1979) report that a firm’s compliance
with minimum wage law in the United States was 65% in 1973 and 55% in 1975. Their expected
profit maximizing model, using a fixed penalty for violation, predicts that a firm’s incentive to
comply is lower, lower the market wage is below the minimum wage and larger the absolute
value of elasticity of demand for labor. Grenier (1982) employs a similar model but assumed that
penalty is proportional to the depth of violation and find that the incentive to comply is lower,
closer the minimum wage to the market wage and smaller the elasticity of demand for labor, a
finding exactly opposite to Ashenfelter and Smith (1979). Chang and Ehrlich (1985) put forward
that the penalty structure is not important for the decision to comply. They find that no matter the
penalty structure, a firm’s incentive to comply is lower, lower the market wage below the
minimum wage. Yaniv (2001) allows for the fact that employers might find it worthwhile to pay
6
subminimum wages to just a fraction of their employed workers, and not all. This “portfolio
choice” model predicts that in presence of minimum wages, employment falls below the
competitive level and law gives rise to a full compliance employment effect even if there is only
partial compliance. Basu, Chau and Kanbur (2010) develop an incentive compatible equilibrium
model and predict that the response of employment to minimum wage rise can be positive,
negative or subdued, depending on the level of minimum wage and enforcement.
Despite these theories, the empirical literature on the evaluation of minimum wages is
silent on the interactive effect of minimum wages and enforcement. This paper attempts to
bridge this gap between the theory and the empirical literature. Moreover, studies in the
minimum wage literature are typically based on parametric regression methods that restrict the
functional form of the relationship between minimum wages and outcomes. However, this paper,
in addition to the standard parametric methods, motivated by the non-linear theoretical
predictions, assumes away any functional form on the minimum wage variable and estimates a
set of semi-parametric regressions using splines.
The construction industry is chosen because it is the second largest employer in India,
after agriculture, employing 32 million workers. It is a dynamic industry that contributed to 8%
of the country’s Gross Domestic Product in 2011-12 and grew at 14.58% on average between
2000-01 and 2011-12. Despite the growth and employment generation in the construction
industry, the majority of workers are unskilled, have little job security, and receive wage
7
payments below the minimum wage1. In 2009-10, 52% of the construction workers nationwide
received wages below the minimum; state specific noncompliance varied from as low as 4% to
as high as 90%. Low wage unskilled workers are usually not employed directly by construction
companies, but through contractors and middlemen who exert considerable monospony power in
hiring2. These are low wage workers for whom minimum wages are relevant and binding, and an
evaluation of minimum wage policy essential. For these workers, the direction of relationship
between minimum wages and employment is a direct test of labor market monospony and the
effectiveness of minimum wage as a welfare enhancing tool.
Results indicate that wage elasticity estimates are piecewise nonlinear, but positive for all
ranges of minimum wages. Employment elasticity estimates are positive at the lowest 20% or
25% of the minimum wages, and negative beyond that range, indicating an inverted U-shaped
relationship between employment and minimum wages. Wages and employment elasticity
estimates are robust to the additional of the enforcement intensity variable. Wage elasticity
increase with enforcement intensity. Employment elasticity estimates at the lowest 25% of the
minimum wage distribution decrease with enforcement intensity. These results imply that a
minimum wage has the potential to increase the wage levels, and more effectively so with better
enforcement. Moreover, when set at an appropriate level, a legally set minimum wage increases
1 Semi-skilled and unskilled workers are defined based on the occupational classification as reported by
the workers in the National Sample Survey. In this paper, occupational categories, 712, 714 and 931,
under India’s National Occupational Classification, 2004 are classified as unskilled and semi-skilled. 2 Self-Employed Women’s Association (2005) reports from a worker survey in Ahmedabad, that more
than 87% of workers receive work through contractors. They further state that the “prevalent practice is
that the owner employs contractors who undertake the task of supplying both labour and materials, and
also of supervising the building. In larger works, the main contractor hires specialised “labour
contractors” who are generally themselves skilled construction workers, often masons, but whose task is
to supply, supervise and pay the labour at a construction site.”contractors” who are generally themselves
skilled construction workers, often masons, but whose task is to supply, supervise and pay the labour at a
construction site.”

8
the level of employment at the intensive margin. Further, these findings empirically corroborate
the monosponistic nature of markets in India, and establish the effectiveness of an appropriately
set minimum wages as a welfare enhancing tool.
The rest of the paper is organized as follows. Section 2 presents an overview of the
literature without attempting to be exhaustive. Section 3 provides institutional details that help
clarifying the identifying assumptions. Section 4 describes the data, section 5 presents the
methodology. Section 6presents the results. Section 6 concludes the paper and discusses the
implications.
2. EXISITNG EVIDENCE ON THE IMPACT OF MINIMUM WAGES AND
ENFORCEMENT
The “new minimum wage” literature that began in the early 1990s could be categorized
along two important dimensions. The first division is based on methodology, the two primary
types being the case studies approach and the traditional panel approach. While the former
focuses on a particular event of a change in minimum wage, the latter approach exploits the state
and time variation of minimum wages in the study period. One could also divide the literature
into studies based on developed countries on the one hand and studies on developing countries
on the other. Wage effects are found to be strongly positive in most studies, and are less a matter
of debate than employment effects, for which the results are mixed. For obvious reasons,
employment effects are the focus of this review. In the developed country literature,
employment effects are usually found to be positive or none in the case studies, but are negative
9
in the traditional panel studies. Studies on developing countries mainly employ the panel data
approach and most of them find negative effects on employment.
(a) Studies based on developed countries
Traditional national-level studies use all the cross-state variation in minimum wages over
time. A standard model looks like this:
Yit = αMWit + Ritβ + εit
In the above equation, Yit is the outcome in state ‘i’ at time ‘t’, and is typically wages or
employment; MWit is the minimum wage; Rit is the vector of control variables which usually
includes state and time fixed effects (Neumark and Wascher, 2007).
Neumark & Wascher (1992) were the first to use such a panel approach. They used
panel data on state minimum wages and other economic conditions in the period 1973 to 1989,
and report that a 10% increase in minimum wages causes a 1-2% decline in employment for
teenagers and 1.5-2% decline for young adults. Neumark & Wascher (2007) employ the panel
approach and study the interactive effects of minimum wages and EITC on employment. They
find a negative effect on teen employment but mixed results for other groups. Dickens, Machin
and Manning (1999) estimate a traditional panel specification and use council-level panel data
between 1975 and 1992 in eighteen industries covered by wage councils in Britain. They
empirically show that minimum wages significantly compress the distribution of earnings and
does not have a negative impact on employment.

10
Case studies typically compare adjoining local areas with different minimum wages around
the time of a policy change. Card and Krueger (1994) conclude that New Jersey’s 1992
minimum wage increase did not result in the fall in fast food employment and may even have
resulted in an increase in New Jersey’s employment relative to Pennsylvania. Neumark and
Wascher (2000) estimate the effect of the same New Jersey minimum wage increase, employing
the same methodology as Card and Krueger (1994), but use payroll data from Unemployment
Insurance (ES202) records, instead of the survey data from telephone interviews as by Card and
Krueger (1994 and find negative effects on employment. Card and Krueger (2000) correct for
reporting time bias and point out inconsistencies in Neumark and Wascher (2000)’s compilation
of the payroll data and estimate the effects of the same New Jersey minimum wage increase and
find no significant effects on employment.
Dube et al. (2007) evaluate the effects of San Francisco’s adoption of an indexed minimum
wage, set at $8.50 in 2004 (from an earlier $6.75). They conclude that the increase in minimum
wage policy, augmented wages, compressed the wage inequality, and resulted in no significant
employment loss in affected restaurants. Dube et al (2010) use county level data from the
Quarterly Census of Employment and Wages (QCEW) between 1990 and 2006 in the United
States and exploit minimum wage differentials across states in the border counties. They
construct a unique dataset - the Contiguous border county pairs dataset - to estimate the within
county-pair minimum wage effects. In doing so, they claim to address spatial heterogeneity in
employment growth that plague traditional panel studies. They find positive and significant
effect on wages but positive and insignificant effects on employment. Dube et al. (2011),
motivated by job search theory, estimate reduced form equations using the same data set and

11
methodology. They find positive effects on wages and employment, but negative effects on hires,
separations and turnover rates.
(b) Developing country studies
Studies on developing countries mainly employ the panel data approach and most of
them find negative effects on employment. Bell (1997) uses yearly data on wages and
employment, estimates a time series model separately for Mexico and Columbia, and finds a
positive effect on wages (0.17 for Mexico and 0.44 for Columbia) but finds negative effects on
employment in both countries (-0.18 for Mexico and -0.33 for Columbia). She also estimates a
standard panel data regression using firm data employing firm fixed effects; the estimated
elasticity of employment ranges from -0.03 to 0.03 for unskilled workers and -0.01 to 0.05 for
skilled workers in Mexico (all estimates are insignificant). For Columbia, the estimated
employment effects are negative in all specifications, ranging between -0.15 to -0.33 for
unskilled workers and -0.03 and -0.24 for skilled workers. Feliciano (1998) uses firm level panel
data on the years 1970, 1980, and 1990, and employs a traditional standard specification. She
finds no minimum wage effects on employment for men, but significant disemployment effects
for women with elasticities ranging from -0.41 to -0.76. Maloney and Nuñez (2004) use a
rotating household panel data set with matched individual data and find negative employment
effects (elasticity of -0.15) in Colombia.
A few studies combine individual level outcomes with aggregate policy variables, and
estimate a model similar to the traditional panel model. Montenegro and Pagés (2004) use
repeated cross-section data on Santiago from 1960 to 1998, and employ a model, controlling for
12
individual demographic characteristics, and an interaction of demographic terms and minimum
wage indices. They find disemployment effects for young and unskilled workers, but find
positive employment effects for women. Gindling and Terrel (2004) exploit the variation created
by the consolidation in the number of minimum wages (for each occupation and skills
categories) in Costa Rica to study their effects on employment. They use pooled time series and
cross section data between 1988 and 2000 and show significant positive wage effects in the
covered sector (with an elasticity of 0.10) but no effect on wages of workers in the uncovered
sector. A 10% increase in minimum wages lowers employment in the covered sector by 1.09%
and decreases the average number of hours worked of those who remain in the covered sector by
about 0.6%.
Jones (1997) uses both time series data and firm level panel data to estimate the
employment elasticity in Ghana between 1970 and 1991. The time series methods use national
data and estimate an elasticitiy of -0.12 using the public sector minimum wage and -0.17 using
the private sector minimum wage. In the second part of analysis, she uses two waves of firm
level panel data of 200 manufacturing firms; the first wave of data corresponds to the period just
before the introduction of the minimum wage in August 1991 and the second wave data
correspond to the period immediately after that. Controlling for firm characteristics, region
dummies, and capital intensity, employment elasticities with respect to real minimum wages
(deflated by unskilled wage) are found to be -6%. When a GAP measure of minimum wage (=0
if wages of workers in firm i exceeded the minimum in wave 1; if not it takes the value of (MW-
Wi)/Wi)) is used using the same set of controls, she finds positive employment effects;
employment increases by 0.25 per firm after the minimum wage change. It is useful to note here
13
that the firm level effects measured by Jones are similar to the case study approach seen in the
US studies, since a single case (although across the country) is considered. Lemos (2004) uses
monthly Brazilian household survey data from 1982 to 2000 to estimate a panel model at the
regional level. A 10% increase in the nominal minimum wage is associated with an increase in
total employment (mean hours of the entire population) by 0.09% (0.1%) in the formal
(informal) sector; this can be decomposed into 0.12% (0.24%) increase in the number of hours
worked for those working and 0.04% (0.15%) decrease in the number of jobs. After two years of
adjustments though, total employment increases by 0.06% (0.04%); hours increase by 0.10 %
(0.21%) and jobs decrease by 0.04% (0.17%) in the formal sector (informal).
(c) Documentation of imperfect enforcement and its effects on firm and labor market
outcomes
These above studies on minimum wages overlook the imperfect nature of enforcement. In
developing countries, and to an extent in developed countries, there is high non-compliance with
labor laws, and the de facto level of regulation is lower than the de jure level of regulation
(Ronconi, 2005). Ashenfelter and Smith (1979) found that compliance with the minimum wage
law during the early 1970s in the United States was just 64%. Ronconi (2010) found that
compliance with employment regulations in Argentina between 1995 and 2002 was merely
48.26%. Other studies find imperfect compliance in Brazil (Lemos, 2004, 2006), Costa Rica
(Gindling and Terrell, 1995), Honduras (Gindling and Terrell, 2006), Indonesia (Harrison and
Scorse, 2004), Mexico (Bell, 1994), Peru (Baanante, 2005), Trinidad and Tobago (Strobl and
Walsh, 2001), and a selection of Latin American countries (Maloney and Nunez, 2004). The
introductory section of this paper established the presence of a rich theoretical literature on the

14
interactive effects of enforcement on labor market outcomes. Below is a review of the literature
(focusing on Latin American countries) on the effects on imperfect and varying enforcement
intensities on a number of intra country outcomes such as informal/formal employment, firm
size, and productivity.
Almeida and Carneiro (2005) use Brazil’s firm level data and administrative data on
enforcement of regulations at the city level to show firms employ a smaller amount of informal
employment in areas where law enforcement is stricter. Almeida and Cameiro (2007) study the
effect of enforcement of labor regulations on unemployment and inequality using city level data
from Brazil. They find that stricter enforcement leads to higher unemployment, less income
inequality, a higher proportion of formal employment and a lower formal wage premium.
Almeida and Carneiro (2009) use firm level data to investigate how enforcement of labor
regulations affects firm characteristics in Brazil. They account for endogeneity in enforcement,
using the distance between firms and neighboring labor enforcement offices, as an instrument.
They show that stricter enforcement of labor regulation constrains firm size and leads to higher
unemployment. Ulyssea (2010) use numerical methods and find that increasing enforcement of
labor regulations effectively reduces the size of the informal sector, but it also significantly
increases unemployment and leads to substantial welfare losses.
More recently, Ronconi (2010) found that higher enforcement decreased non-compliance
under all regulations such as minimum wages, hours worked, paid vacation time and health
insurance in Argentina. Almeida and Carneiro (2011) use the municipal level variations in labor
inspections in Brazil to find that as a result of an increase in labor inspections, formal
15
employment rises, informal employment declines, unemployment rises, wages in the top of the
formal wage distribution declines, and informal sector wages rises. Almeida and Susanli (2011)
use firm level data from 63 countries and exploit the within country variation in the enforcement
of firing regulations. They find that firms facing stricter enforcement and higher firing costs are
smaller on average.
To summarize, there are two parallel strands of that beg to be bridged. On the one hand,
there is a large and growing literature on minimum wage that does not account for imperfect
enforcement. On the other hand, there is ample evidence on imperfect enforcement of labor
regulations and their effects on informal employment and firm characteristics. It is essential to
study the interactive effects of both minimum wage and enforcement, as pointed out in theories.
3. INSTITUTIONS
(a) The minimum wage legislation in India
The Minimum Wages Act 1948 of India legally grants a minimum wages for workers in
many industries. The act periodically fixes minimum wages for workers employed in
employments listed under the “employment schedule” of the concerned government. The
concerned government is either the state government or the central government depending on the
industry and sector of work. In India’s federal constitutional setup, the labor ministry’s programs
are in the concurrent list– this means that both the center and state governments pass, implement,
and share responsibilities within the same law. Government owned enterprises and firms in the
mining and railway sector belongs to the central sphere; rest of the firms fall under the state

16
sphere. Lists of scheduled employments for which the minimum wages are defined along with
their associated minimum wages are maintained by the appropriate government. Employments
other than those listed are not covered under the law. New sectors or occupations that cross a
minimum threshold level of employment (at least be 1000 workers engaged in that activity in
that state) should be added to the list of scheduled employments and assigned a minimum wage.
This law is applicable to both informal and formal sectors, as long as the industry they fall into is
on the list.3 India’s system of minimum wages is complicated; there exists a large number of
minimum wages for different employments in each state. Besler and Rani (2011) find that the
central government sets 48 minimum wages for different categories including mining, agriculture
and oil extraction, or any corporation under its ownership. State governments altogether set
minimum wages for 1,123 job categories making a grand total of about 1,171 different minimum
wage rates in India.
The statute requires that minimum wages typically be updated once in at most five years.
The text of the law is vague about whether the revision of the ‘cost of living’ component is
mandatory, and this brings in arbitrariness in setting of minimum wage.4 Further, many scholars
observe that in practice minimum wages are infrequently revised by states (Bhagat 1997;
3 It is important to note here that in India the definition of formal and informal sector is not defined on the
basis of coverage of labor laws, unlike in many countries. Many labor laws in fact are designed
specifically for informal sector workers like the contract labor Act 1970 and the Interstate Migrant Labor
Act 1979. 4 To quote verbatim from the law, “Any minimum rate of wages fixed or revised by the appropriate
Government in respect of scheduled employments under section 3 may consist of (a) a basic rate of
wages and a special allowance at a rate to be adjusted, at such intervals and in such manner as the
appropriate Government may direct, to accord as nearly as practicable with the variation in the cost of
living index number applicable to such workers (hereinafter referred to as the "cost of living
allowance");or (b) a basic rate of wages with or without the cost of living allowance, and the cash value
of the concessions in respect of supplies of essential commodities at concession rates, or; (c) an all-
inclusive rate allowing for the basic rate, the cost of living allowance and the cash value of the
concessions, if any.“ (Labor Bureau, 2010)

17
Jhabvala 1998) and that some states have linked cost of living to minimum wages, while others
have not. In 2007, 2008 and 2010, 20 states5 did not report “Dearness Allowance” (DA) as a
separate component of their minimum wages. The report on the working of The Minimum
Wages Act, 1948 for the year 2010 reports that only 5 States, 3 U.T. and the CLC (Central) have
linked wages to periodic revision of D.A. The same report published in 2009 mentions that only
2 States, 1 U.T. and the CLC (Central) have linked wages to periodic revision of DA. Similarly
in 2008, only 6 States, 1 U.T. and the CLC (Central) have linked wages to periodic revision of
DA. In 2007, only 6 states and the CLC (Central) have linked wages to periodic revision of DA
(Labor Bureau, 2010). The arbitrariness arising out of these inconsistencies across time and
states provides a useful identification strategy.
Since 90% of the construction industry’s work occurs as casual work in the private
sector, minimum wages defined by states for construction activities in the private sector are
considered. Minimum wages are defined on per day basis. Figure 1 presents the changes in
nominal minimum wages over time in different states. Minimum wages in the construction
industry changed a number of times in the period of study, between 1999-00 and 2009-10 (more
than three times for many states), but there was no change at all for a few states.
(b) The enforcement machinery in India
The profusion of minimum wages, especially across sectors and states, makes
enforcement cumbersome, even in theory. Enforcement is weak due to poor human resource
capacity and low availability of funds in the state labor departments. Labor laws are designed
5 Assam, Arunachal Pradesh, Bihar, Goa, Haryana, Himachal Pradesh, Jammu & Kashmir, Madhya
Pradesh, Manipur, Meghalaya, Nagaland, Orissa, Puducherry, Punjab, Rajasthan, Sikkim, Tripura, West
Bengal, Chandigarh, Delhi

18
such that every officer, inspector, or a commissioner working under the state or central sphere
are responsible for enforcing multiple laws. There are 45 central government labor regulations
(on which states can make further amendments) and in addition, hundreds of state laws (see
Debroy (2005) and Anant et al. (2006))6. Consequently, there is a gap between the number of
available officers and their demand in enforcing these innumerable acts which, if not anything,
definitely reduces the effectiveness of and the pressure on the existing staff. Legally, the
enforcement of The Minimum wages Act 1948 is shared between the central and state
governments. There is usually a chief labor commissioner and deputy chief labor commissioner,
and many regional labor commissioners, assistant labor commissioners, and labor inspectors in
every state labor department. There are separate divisions such as those concerning factories,
boilers, and shops and establishments, and officers (both commissioners and inspectors) within
each division share responsibilities in implementing a number of laws7. Some states have
separate divisions for administrative convenience8 and enacting special laws.
Enforcement intensity, measured in terms of human capacity - number of officers per
ten thousand workers - has been reducing unambiguously under the minimum wage law (and all
the labor laws in India), for the reasons described above. Mean number of officers under the
minimum wage law per ten thousand workers across states, which was already low at 6.51 in
6 In the concurrent labor department system and the multiplicity of its systems, enforcement of a central
law is carried out either by the state government or central government depending on the law and whether
the firm is under the central or state sphere. 7 Interactions with the Chennai labor commissioners during my field work revealed that commissioners
and inspectors take responsibilities for multiple laws. 8 Bihar has a separate directorate of agriculture to ensure proper enforcement of minimum wages Act in
the agricultural sector (http://labour.bih.nic.in/Labour.htm). Gujarat has separate labor commission for
rural and urban areas (http://labourandemployment.gov.in/)) (Pais, 2007). Maharashtra has a separate
Development commissioner for implementing laws related to the unorganized sector
(http://www.mahashramm.gov.in/dcl/index_dcl.html).

19
1999-00, declined to 4.17 in 2009-10 (Figure 2)9. The mean for all years taken together is 4.52,
indicating that nationwide, there are only 4.5 inspectors for every ten thousand workers. This
resource squeeze is associated with an overall decline in the number and the quality of
inspections. For evidence on this, see Shyam Sundar (2007) for Maharashtra, Sharma and
Kalpana (2007) for Uttar Pradesh and Reddy (2007) for Andhra Pradesh. This phenomenon is
possibly associated with declining budget allocation to the enforcement wing in state labor
departments. A qualitative study by (Madheswaran, Rajasekhar, & Gayathri Devi, 2005) reveals
that labor officers and inspectors have a good knowledge of firms and their activities in their
jurisdiction, but find it difficult to conduct inspections due to lack of transport facilities, shortage
of time and paucity of funds. Further and importantly, labor inspections are not rigorous, but
mostly an occasion for money to pass hands. Many a times, there are collusive agreements
between employers and inspectors with the latter turning a blind eye to the non-compliance of
laws (Basu, Chau, & Kanbur, 2010).
Until about the beginning of the last decade, inspections of firms were out carried out
both in response to complaints and as random checks, universally across all industries. Inspectors
were expected to initiate prosecutions against erring employers and establishments. However
since the beginning of the last decade, many states started making institutional changes to curtail
the power of their labor inspection systems; certain types of firms were exempted from
inspections (such as firms in nonhazardous industries, small scale industries and special
economic zones etc.), and are also allowed to self-certify compliance. Some states have made
inspections less random and compliant based, in certain industries. A possible hypothesis for this
9 Although this paper does not focus on the manufacturing sector, a simple statistics on inspectors under
the Factories Act also reveals a similar picture. The ratio of number of working inspectors to sanctioned
inspectors under the Factories Act declined from 90% in 2001 to 65% in 2009.
20
behavior is that there are inter-state strategic interactions to attract business investment (Shyam
Sundar, 2010). Remarkably corroborating this theory is the manner in which the above changes
in the enforcement system are being implemented. Legal notifications are issued as a part of
“new industrial policies”, offering concessions to potential investors by the state commerce and
industry departments, rather than through state labor departments. States offer concessions on
labor enforcement and other areas such as taxes, duties and environmental standards10
. In effect,
this paper argues that enforcement intensities are driven mainly by the state’s quest for
investment, and are exogenous to wages and employment levels.
4. DATA DESCRIPTION
The primary data source for this study are six rounds of the National Sample Surveys
(NSS) administered in 1999-2000, 2003-04, 2004-05, 2005-06, 2007-08, and 2009-10. These are
cross section surveys conducted at the household level, inquiring on characteristics of the
household, the demographic particulars of individuals, their employment status and
characteristics. Among other things, every wage earning member of the household is asked to
report up to four “activities” they did in the last seven days, which can include looking for work
(unemployed), not looking for work (not in the labor force), or working (employed), and if
employed, the industry and occupation of the industry they were employed in. Household
10
Kanta (2011), Schneider (2004) and Venkatesan (2000) also note that a number of large tax and
other fiscal incentives are offered by states within India to attract investment. Vadlamannati (2011),
employsspatial econometrics techniques and uses business investment data from 32 states in India
between 1991 and 2009 to show that there are game theoretic interactions between states and that the
inflow of investment proposals in one state positively affects the investment proposal inflows into other
states. They also provide an explanation to state competition. During the early reform period (early
1990s), states with advantages such as, large markets, better infrastructure, skilled labor force, and a large
investor base started to benefit, in comparison to less well-endowed states. This in turn puts more
pressure on less developed states, and all states for that matter, to increase their competitiveness in order
to gain investment.

21
members also report the number of half days11
they spend and the total earnings they received on
each of these four activities in the last week12
. Daily wage of workers for an activity is obtained
by dividing total earnings on that activity by total days spent on that activity. The final data set
consists of unskilled construction workers (classified based on the National Industrial
Classification and National Classification of Occupation as defined in foot note 1), and who are
educated below middle school, or illiterates. There are 22, 045 observations for all years and
states altogether13
.
Minimum wage and enforcement intensity corresponding to the labor force survey years
are obtained from the reports on the working of the minimum wage law published by the Labor
Bureau, Ministry of Labor & Employment of the Government of India. These reports provide
state specific information on minimum wages set in different industries and on the enforcement
machinery of the minimum wage legislation for all years14
. Minimum wages for construction
workers defined for each state and year were mapped to workers, accordingly. Enforcement
intensity is defined for every state-year pair and not available at the industry level. This data
were also mapped into the worker dataset.
11
Employment is recorded as number of half days, rather than number of hours. If the person works for 1
hour or more but less than 4 hour on an activity, he/ she is considered 'working' for half-day on that
activity. A person is considered 'working' (employed) for the entire day (or two half days) if he/ she had
worked for 4 hours or more during the day. 12
Household members also report labor force information during the reference period of 365 days
preceding the date of the survey, but they do not report earnings from this recall and consequently not
used for the purpose of this paper. 13
Number of observations in different regression specification varied based on the missing values in
minimum wage and enforcement variables in different states in different years. 14
The former data are available in table 3 and the latter are available in annexure II of the report.
22
The descriptive statistics in Table 1 indicate that the vast majority of those employed in
the construction industry are men, although the proportion of females has been increasing
slowly. Due to breakthroughs in technology, the construction industry is increasingly using
sophisticated, skill intensive methods that are more suited to men than women. The average age
of the workers in the construction sector increased marginally from 32 to 35 between 1999-00
and 2009-10. Other backward caste represents the majority social group among construction
workers, closely followed by scheduled caste in all the sample years. There are more
construction workers in rural, compared to urban areas. This is an interesting conundrum,
because it is expected that there is more construction activity happening in the urban areas, than
rural areas. But these statistics can be reconciled from the fact that the NSS surveys are based on
the place of residence (households), and not the place of work. For migrants, who dominate the
construction industry, the place of residence is typically in rural areas, while their work site is in
urban areas. The NSS captures such short term migratory flows, in the place of residence, the
rural areas, which explains the conundrum. On an average across all years, 51% of the
construction workers are not literates.
Wages, both real and nominal, have risen in the study period. Table 1 indicates that
average nominal daily wages increased from Rs. 58.5 in 1999-00 to Rs. 123.41 in 2009-10. Not
only have average real wages risen, but the distribution of real wages has shifted. An overlaid
cumulative distribution plot of log real wages in different years indicates that wages in the later
years stochastically dominate the wages in the earlier years (Figure 3). The rise in real wages
parallels the rise in log real minimum wages; while the former increased from 3.9 to 4.21
between 1999-2000 and 2009-10, the latter rose from 4.01 to 4.21 in the same period (Figure 4).

23
The scatter plot of log real daily wages and log real minimum wages (varying at the state-year
pair) in Figure 5 show a positive correlation between the two. The non-parametric lowess
smoother estimator, overlaid on the scatter plot, estimates a positively correlated, albeit nonlinear
relationship between log real wages and log minimum wages.
Employment is measured in half days in the seven days preceding the date of the
survey. Table 1 indicates that the mean half days of employment rose from 12.09 in 1999-00 to
12.67 in 2009-10. A histogram of this variable, presented in Figure 6, indicates that work
typically is done for even half days (full days) rather than odd half days. This is expected
because construction work is usually performed for very long hours, typically 12 hours. There is
right censoring at 14 half days, because the recall period is 7 days preceding the survey. The
relationship between employment and log minimum wages is unclear from the scatter plot in
Figure 7. But a lowess smoother non-parametric estimation in the same graph indicates an
inverted U-shaped relationship. This graph provides the first crucial hint towards a
monosponistic labor market model, which is encouraging given the narratives about the
construction industry and contractors’ market power.
5. ECONOMETRIC MODEL AND MAIN FINDINGS
(a) Empirical specification
Higher order flexible parametric regressions and semi-parametric spline regressions are
considered, because of the flexibility envisaged by theoretical studies, and the nonlinear lowess
smoothing curves obtained in Figures 5 and 7. For monosponistic labor markets, theory predicts
24
an inverted U-shaped relationship between minimum wage and employment. A particular
motivation comes from Basu, Chau and Kanbur (2010), who consider four wage thresholds and
predict a piecewise relationship between minimum wages interacted with enforcement
intensities, and employment and wages. The thresholds include the monospony wage level,
competitive wage level, the endogenously determined wage level based on enforcement
intensity, equilibrium marginal revenue product in the increasing order. These four thresholds
define five ranges of minimum wages. The theoretical model predicts that the interactive effect
of minimum wage and enforcement depends on the level of the minimum wages, particularly
based on what range (defined based on the above thresholds), the minimum wages falls into. A
minimum wage increase can have a positive, negative or no effect based on the intensity of
enforcement, and the level of minimum wage. This piecewise relationship motivated by these
theoretical thresholds, call for a flexible functional form.
A flexible model can be generically specified as follows.
Yist = f (MWst , MWst * Est) + β5 *PWGDP + β6*Xist + Ds + Dt + Dg * t + εist
--- (1)
Yist represents the individual level outcome for worker `i’ working in state ‘s’ at time ‘t’ and
could be either (1) log daily wage of a worker, conditional on working in the construction
industry, or (2) half days employed in the construction industry in the preceding week,
conditional on working in the construction industry. f() is a generic function of minimum wage,
MWst (the real minimum wage in state s in time t in 1999-2000 prices) and enforcement
intensity at state ‘s’ at time ‘t’, Est, measured by the number of inspectors per ten thousand

25
workers. Owing to high measurement error in the enforcement variable, the intensity it simply
categorized as a dummy variable in the regressions, taking a low or high value based on whether
intensity is below or above the median value, respectively. The median value of enforcement
intensity is 4.52. The base category in the regressions is low enforcement.
The function f () are additive functions of minimum wages, enforcement, and their
interaction. Minimum wages appear either as additive higher order terms (up to the fourth power
of minimum wage are considered), or splines representing different ranges of minimum wage.
Splines or the higher order terms are interacted with the enforcement dummy and these
interaction terms enter additively.
A linear spline is a piecewise linear function or a series of linear line segments spliced
together to form a continuous function. Splines are created for desired intervals of the original
variable. For instance, a variable X can be transformed in to ‘n’ linear splines based on n-1 pre-
specified knots, or simply as n-1 equally spaced knots or percentiles of data. Splines are
constructed such that when used in regression estimations, the coefficients of each of the spline
represent the slope measure for that interval15
. Basic specifications employ (a) 4 splines, created
using 3 knot positions at 25th
percentile, 50th
percentile and 75th
percentile positions of the log
real minimum wage variable. These positions correspond to 3.987, 4.186 and 4.364 in the data.;
(b) 5 splines, created using 4 knot positions at 20th
percentile, 40th
percentile, 60th
percentile, and
80th
percentile positions of the log real minimum wage variable. These positions correspond to
3.94, 4.12, 4.27, and 4.43 in the data. Figure 8 and 9 presents the kernel density estimate of log
15
Splines could also be constructed so that, when used in regression estimations, the coefficients
represent the change in the slope from the preceding interval.

26
real minimum wages with the knot positions using four and five splines respectively, marked as
red reference lines.
PWGDPst is log per worker construction GDP in state ‘s’ at time ‘t’ and controls for
local labor market conditions. Xist represents individual demographic characteristics such as, age,
square of age, sex, social group, sector, and education. Base category for gender is females.
Social groups are coded as binary variables, and the base category is scheduled tribes. Education
is also a dummy variable and base category is illiterates. The model also controls for state fixed
effects (Ds), time fixed effects (Dt) and state group specific time-trend (Dg * t) to control for
common trends in the outcome variable. Five state groups are defined based on geography –
northern states, southern states, central states, north east states, and union territories. The
standard errors are clustered at the state level.
(b) Main findings
(i) Wage and employment effects without enforcement
The results of Ordinary Least Square regression of log real minimum wages on log real
daily wages (columns 1 and 2) and Tobit regression of log half days employment on log
minimum wages (column 3, 4, and 5) are presented in Table 2. Besides minimum wage
variables, all regressions include individual characteristics such as, age, age squared, sex, social
group, sector, education and state-time varying labor market characteristics such as, log per
worker construction sector GDP. Also included, are time fixed effects, state fixed effects and
group-specific time trends.

27
Results in column 1 indicate that minimum wages have a positive and significant effect
on log daily wages. With a quadratic term in column 2, the coefficient on the linear term is
positive but higher compared to column 1, and the coefficient on the quadratic term is negative.
All effects are significant. Elasticity of minimum wages, at its mean value in both column 1 and
2, are 0.27 and 0.29 respectively. Elasticities at different points in the distribution (10%, 25%,
50%, 75% and 90%) are estimated. Elasticity is positive for all values of the minimum wages in
the data, but declines from tenth percentile in moving towards the ninetieth percentile, indicating
that maximum benefits from raising minimum wages are obtained at lower levels of minimum
wages.
Regression results on the employment variable, censored at the highest value (log (14)),
are reported in columns 3, 4, 5, and 6. Column 1 indicates a negative relationship between
employment and minimum wages, albeit an insignificant one. A brief glance at coefficients in
columns 4, 5, and 6 reveal that results are not robust to functional form specification. This is
partly, the motivation for estimating more flexible spline regressions. Column 4 in Table 2
indicates a positive linear term and a negative quadratic term, but both coefficients are
insignificant. Column 5 results estimates a positive and significant linear term, negative and
significant quadratic term, and positive and significant cubic term. In column 6, the signs
reverse: a negative linear term, positive squared term, negative cubic term, and positive fourth
order term. The elasticity of employment is negative at the mean level of minimum wages in all
specifications, but only significantly so, in models with cubic (-0.11) and fourth order terms (-
0.11). A striking point is that, elasticity at the tenth percentile is positive (but not significant), in
models in columns 5 and 6, decreases, and becomes more and more negative beyond the quartile
value of minimum wage.
28
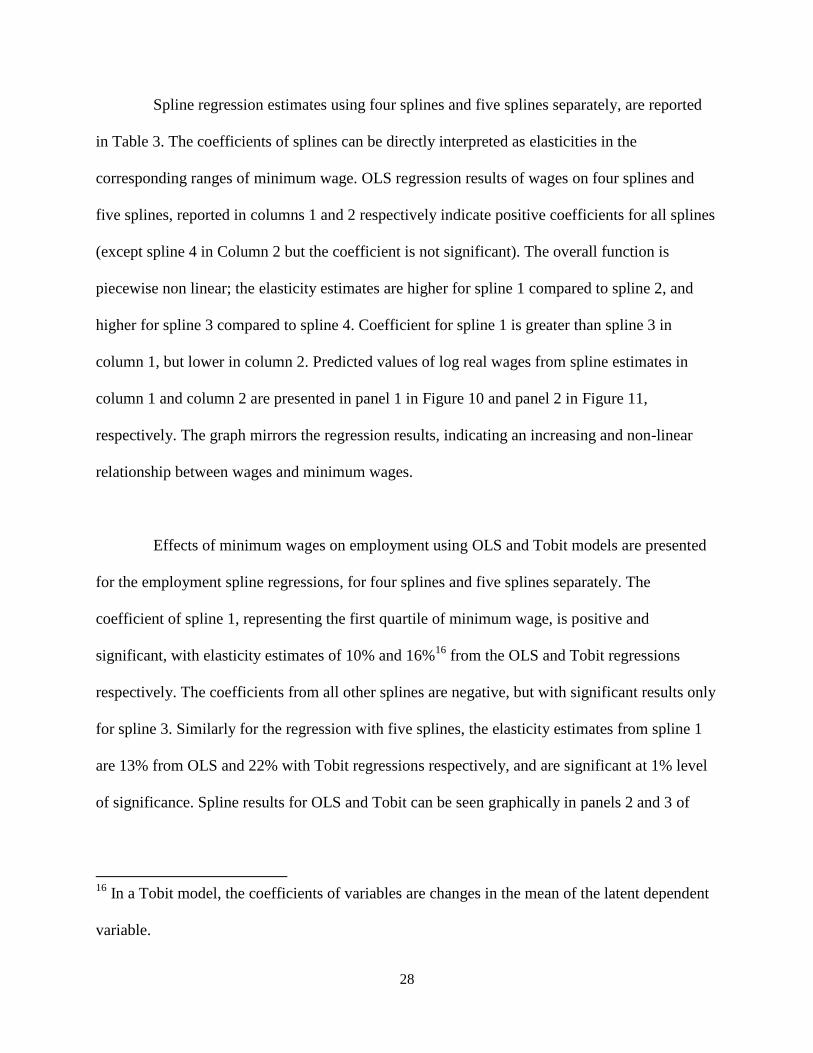
Spline regression estimates using four splines and five splines separately, are reported
in Table 3. The coefficients of splines can be directly interpreted as elasticities in the
corresponding ranges of minimum wage. OLS regression results of wages on four splines and
five splines, reported in columns 1 and 2 respectively indicate positive coefficients for all splines
(except spline 4 in Column 2 but the coefficient is not significant). The overall function is
piecewise non linear; the elasticity estimates are higher for spline 1 compared to spline 2, and
higher for spline 3 compared to spline 4. Coefficient for spline 1 is greater than spline 3 in
column 1, but lower in column 2. Predicted values of log real wages from spline estimates in
column 1 and column 2 are presented in panel 1 in Figure 10 and panel 2 in Figure 11,
respectively. The graph mirrors the regression results, indicating an increasing and non-linear
relationship between wages and minimum wages.
Effects of minimum wages on employment using OLS and Tobit models are presented
for the employment spline regressions, for four splines and five splines separately. The
coefficient of spline 1, representing the first quartile of minimum wage, is positive and
significant, with elasticity estimates of 10% and 16%16
from the OLS and Tobit regressions
respectively. The coefficients from all other splines are negative, but with significant results only
for spline 3. Similarly for the regression with five splines, the elasticity estimates from spline 1
are 13% from OLS and 22% with Tobit regressions respectively, and are significant at 1% level
of significance. Spline results for OLS and Tobit can be seen graphically in panels 2 and 3 of
16
In a Tobit model, the coefficients of variables are changes in the mean of the latent dependent
variable.

29
Figures 10 and 11, respectively. These fitted values indicate an inverted U-shape relationship
between employment and minimum wages.
(ii) Wage and employment effects with enforcement
Introducing enforcement in the regressions does not change the nature of relationship
between wage and minimum wage and employment and minimum wages, as obtained in both
parametric and spline regressions without enforcement in Tables 2 and 3. The results with
enforcement are presented in Table 4 and Table 5. Enforcement dummy takes the value low and
high, based on whether inspectors for every ten thousand workers are below or above its median
level. In Table 4, Columns 1 presents the results of the OLS regression with a linear minimum
wage term, enforcement dummy and an interaction of both. The coefficient on minimum wage
terms and its interaction with the enforcement dummy are positive, but the latter is not
significant. Coefficient on the first order enforcement dummy itself is negative and insignificant.
In column 2, the first order minimum wage term is found to be positive, and the quadratic term is
negative, and both coefficients are insignificant. High level of enforcement itself has a negative
effect on wages, but the interaction effect of high enforcement and the linear minimum wage
term is positive, with the quadratic term is negative. The second panel of Table 4 shows
elasticity estimates for low and high enforcement separately. Positive and significant elasticities
are obtained in both columns 1 and 2 through the distribution of minimum wages (10%, 25%,
50%, mean, 75%), except the 90% level for column 2.
Employment regressions with parametric minimum wage terms are presented in
columns 3, 4, 5, and 6. Column 3 indicates a negative relationship between employment and

30
minimum wages, albeit an insignificant one. But in columns 4, 5, and 6, the coefficient of the
linear minimum wage term is positive, the quadratic term is negative, the cubic term is positive,
and the fourth order term is negative. These results are significant, though, only for the
regression with the cubic term in column 5. Enforcement dummy in column 3 is negative, but the
interaction term is positive, albeit insignificant. In columns 4, 5, and 6, enforcement term is
positive, the first order interaction term is negative and the second order interaction term is
positive. The elasticity estimates are presented in panel 2, for low and high enforcement
separately. Elasticity is negative throughout the minimum wage distribution, for both low and
high enforcement, but are significant only in Column 517
.
Spline regression estimates for enforcement are presented in Table 5. Column 1 and 2
presents results of log wage on minimum wage splines using four and five splines respectively.
Minimum wage effects on wages, after adding enforcement, are positive across all splines,
except spline 4 in both column 1 and 2, although the coefficients are not significant. The
coefficient of the enforcement dummy is negative, although it is not significant. The interaction
of splines and the enforcement dummy produces interesting results – it is positive for splines 1
and 2 in both specifications in column 1 and 2, negative for splines 3 and 4 in both column 1 and
column 2, and positive for spline 5 in column 2.Predicted values of log real wages from spline
estimates in column 1 and column 2 are presented in panel 1 in Figure 12 and 13.
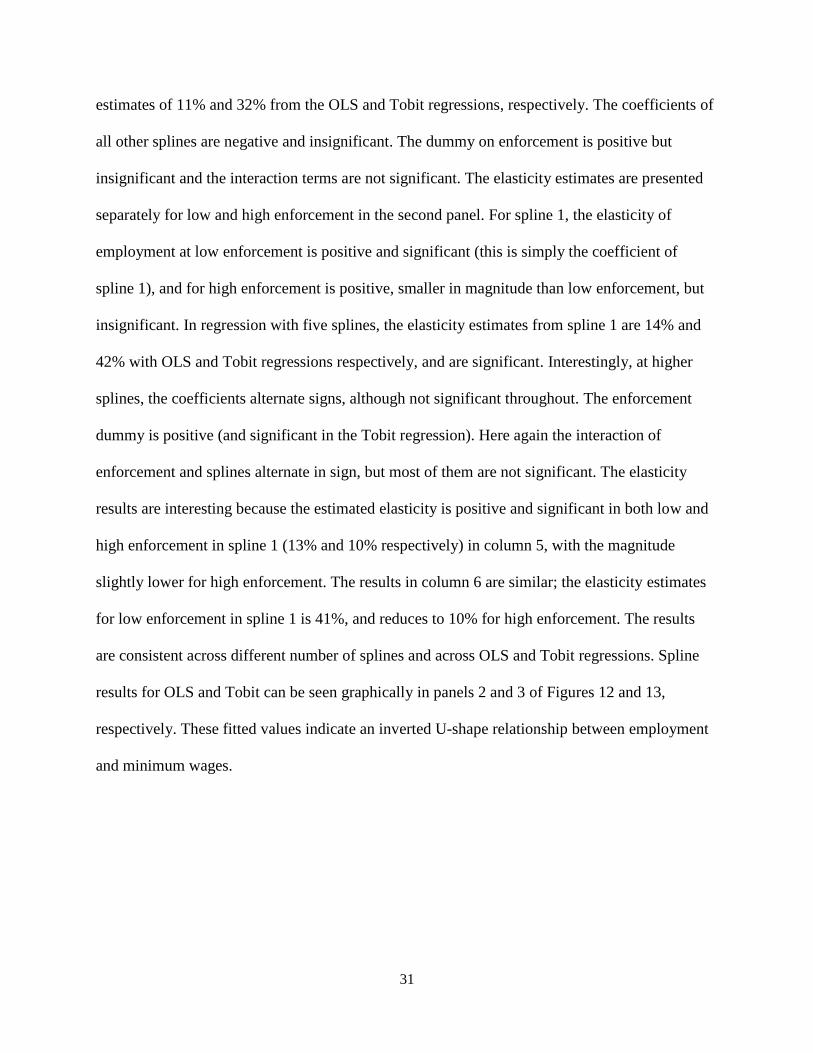
Spline regressions of the employment variable are presented in columns 3, 4, 5, and 6.
In columns 3 and 4, the coefficients of spline 1 are positive and significant, with elasticity
17
In Column 6, marginal effects could not be estimated in stata due to higher collinear covariance
variance matrices obtained in the regression with the fourth order term.
31
estimates of 11% and 32% from the OLS and Tobit regressions, respectively. The coefficients of
all other splines are negative and insignificant. The dummy on enforcement is positive but
insignificant and the interaction terms are not significant. The elasticity estimates are presented
separately for low and high enforcement in the second panel. For spline 1, the elasticity of
employment at low enforcement is positive and significant (this is simply the coefficient of
spline 1), and for high enforcement is positive, smaller in magnitude than low enforcement, but
insignificant. In regression with five splines, the elasticity estimates from spline 1 are 14% and
42% with OLS and Tobit regressions respectively, and are significant. Interestingly, at higher
splines, the coefficients alternate signs, although not significant throughout. The enforcement
dummy is positive (and significant in the Tobit regression). Here again the interaction of
enforcement and splines alternate in sign, but most of them are not significant. The elasticity
results are interesting because the estimated elasticity is positive and significant in both low and
high enforcement in spline 1 (13% and 10% respectively) in column 5, with the magnitude
slightly lower for high enforcement. The results in column 6 are similar; the elasticity estimates
for low enforcement in spline 1 is 41%, and reduces to 10% for high enforcement. The results
are consistent across different number of splines and across OLS and Tobit regressions. Spline
results for OLS and Tobit can be seen graphically in panels 2 and 3 of Figures 12 and 13,
respectively. These fitted values indicate an inverted U-shape relationship between employment
and minimum wages.

32
(c) Discussion of the results
Minimum wages on wages are positive, significant, and nonlinear. The wage elasticity
at the mean value of minimum wage is 27% (column 2 in Table 2). Positive elasticity and
nonlinearity are also obtained in the spline regressions. Elasticity of wages in the lowest 25% of
minimum wages (spline 1) is 49%, for a model with four splines, and the elasticity for the lowest
20% of minimum wages (spline 2) is 52% for a model with five splines (Table 3). When the
enforcement dummy is introduced, the minimum wage elasticity remains robust with similar
magnitudes. Elasticity of wages (from the quadratic parametric equations in column 2 in Table 5)
at the mean value of minimum wages, are 22% for low enforcement, and are higher (26%) for
high enforcement. This is intuitive because with stricter enforcement, it is expected that the
wages raises further with an increase in minimum wages. Spline regression results, from models
using four and five splines (Table 5), estimates an elasticity of 30%, for the lowest 25% and 20%
minimum wages respectively. When there is high enforcement, the elasticity is higher at 55%.
These results are similar to the parametric results, in that both models predict that higher
enforcement increases the elasticity of wage.
In the employment regressions, elasticity estimates are positive at the lower ranges of
minimum wages and negative at the higher range of minimum wages. This is an indication of an
inverted U-shaped relationship between employment and minimum wages at the intensive
margin. These results are again consistent over both parametric and spline regressions, but the
results are more pronounced and statistically significant for spline regressions. Table 1 indicates
that the elasticity is positive (6% and 9%),though not statistically significant, at the tenth

33
percentile of minimum wage, in the flexible functional form specifications of columns 5 and 6.
The elasticity however is negative and significant at higher levels of minimum wage. In spline
regressions, elasticity estimates at the lowest 25% or 20% of the minimum wages are 10%, 16%
13% and 22%, in different specifications, and also significant unlike in the parametric
specification. When enforcement is introduced in the parametric model, the elasticity estimates
are not robust to the model without enforcement. Further, the elasticity estimates at the tenth
percentile, for both low and high enforcement are negative. Spline regression estimates though,
are robust to introduction of the enforcement dummy variable. The elasticity estimates at the
lowest 25% obtained from the model with four splines are statistically significant at11% and
32% for OLS and Tobit regressions respectively; for models using five splines, elasticity
estimates obtained at the lowest 20%, are 14% and 42% for OLS and Tobit regressions
respectively. At high enforcement, elasticity estimates are 7%, 4%, 10%, and 10.9%,
respectively for the above four specifications.
6. CONCLUSION AND POLICY IMPLICATIONS
In this paper, employment and wage elasticity estimates are reported for low wage
construction workers in India, using flexible parametric and semi-parametric spline regressions.
Wage elasticity estimates are piecewise nonlinear, but positive for all ranges of minimum wage.
Employment elasticity estimates are positive at the lowest 25% of the minimum wages, and
negative beyond that range, indicating an inverted U-shaped relationship between employment
and minimum wages. Results on wages and employment elasticity are robust to the addition of
the enforcement dummy variable. Wage elasticity estimates increase with the level of

34
enforcement. However, employment elasticity estimates at the lowest 20% and 25% of the
minimum wage distribution decrease with the level of enforcement. These contrastive effects of
enforcement on wage and employment elasticities need to be reconciled, by examining the
theory more closely.
Some key weaknesses of the current state of this study are identified. These are hoped
to be fixed in subsequent revisions to this paper. First, the results on employment elasticity are
reported only for the intensive margin, and not for the extensive margin due to data limitations. It
is expected that for an industry like construction, there is considerable movement in the
extensive margin since work is casual in nature, and job contracts are flexible and short-lived.
Consequently, as a next step, the estimations of elasticity at the extensive margin are considered.
Second, in subsequent revisions of this paper, estimations based on other semi-parametric
estimation methods like quadratic and cubic splines would be considered. Third, my field
interactions with construction workers, and certain key policy players in Delhi revealed that
minimum wages are more effective in public sector construction works and in huge construction
sites that have a lot of workers compared to private construction work and smaller sites with
fewer workers. Therefore, I plan to revise my regression models using these two additional
variables. Lastly, the results need to be tied to the theory, more effectively.
These results in this paper indicate that a minimum wage policy plays an important role
in improving welfare of construction workers. It has the potential to increase the wage levels,
and more effectively so, with stricter enforcement. Moreover, when set at an appropriate level, a
legally set minimum wage increases the level of employment at the intensive margin. This effect

35
on employment is muted at higher levels of enforcement, but nevertheless positive. For the
minimum wage literature itself, the implications are twofold. This is the first paper to estimate
the interaction effect of enforcement and minimum wages on wages and employment. Further,
while most papers in this literature employ a non flexible parametric regression models, this is
the first paper to successfully test theories on the effects of minimum wages using flexible semi-
parametric methods.
36
References
Almeida, Rita and Pedro Carneiro, 2005.Enforcement of Regulation, Informal Labor and Firm
Performance. Discussion Paper No. 1759. September 2005
Almeida, Rita and Pedro Carneiro, 2007.Inequality and Employment in a Dual Economy:
Enforcement of Labor Regulation in Brazil. Discussion Paper No. 3094. September 2007
Almeida, Rita and Pedro Carneiro, 2009. Enforcement of Labor Regulation and Firm
Performance . Journal of Comparative Economics.
Almeida, Rita and Pedro Carneiro, 2011.Enforcement of Labor Regulation and
Informality.Discussion Paper No. 5902. August 2011
Almeida, Rita and Z. Bilgen Susanlı. 2011. Firing Regulations and Firm Size
in the Developing World: Evidence from Differential Enforcement.IZA DP No. 6006.
Ashenfelter, Orley, and Robert Smith. 1979. “Compliance with the Minimum Wage Law.”
Journal of Political Economy, Vol. 87, No. 2, 333–50
Ashenfelter, Orley & Farber, Henry & Ransom, Michael R., 2010. "Modern Models of
Monopsony in Labor Markets: A Brief Survey," IZA Discussion Papers 4915, Institute for the
Study of Labor (IZA).

37
Basu, Arnab K., Chau, Nancy H. and Kanbur, Ravi, Turning a Blind Eye: Costly Enforcement,
Credible Commitment and Minimum Wage Laws (2009-06-29). The Economic Journal, Vol.
120, Issue 543, pp. 244-269, March 2010.
Bell, L. (1997), ‘The impact of minimum wages in Mexico and Colombia’. Journal of Labor
Economics 15(3, Part 2), S102–S135.
Belser, Patrik, and Uma Rani.2010.Extending the coverage of minimum wages in India:
Simulations from household data. Conditions of work and employment series no 26.
Bell, L. (1997). `The impact of minimum wages in Mexico and Columbia', Journal of Labor
Economics vol. 15(3), pp. S102-S135.
Baanante, M. J. (2005). `Minimum wage effects under endogenous compliance. Evidence from
Peru', available at
http://www.grade.org.pe/download/docs/Minimum%20wages%20in%20Peru%20M.%20Jaramil
lo.pdf.
Bhagat, M. 1997. “Poverty and Minimum Wages”, The Indian Journal of Labour Economics,
40(4): 721-30.
Blanchard (2004). Designing labor market institutions. Available online at
http://economics.mit.edu/files/687. last seen on January 21, 2013.

38
V. Bhaskar, Alan Manning and Ted To. 2002. Oligopsony and Monopsonistic Competition in
Labor Markets. Journal of Economic Perspectives—Volume 16, Number 2—Spring 2002—
Pages 155–174.
Card, David, and Alan Krueger, ‘‘Minimum Wages and Employment: A Case Study of the New
Jersey and Pennsylvania Fast Food Industries,’’ American Economic Review 84:4 (1994), 772–
793.
Card, David, and Alan Krueger, ‘‘Minimum Wages and Employment: A Case Study of the Fast-
Food Industry in New Jersey and Pennsylvania: Reply,’’ American Economic Review 90:5
(2000), 1397–1420.
Chang, Yang-Ming, and Ehrlich, Isaac. “On the Economics of Compliance with the Minimum
Wage Law.” Journal of Political Economy 93 (February 1985): 84–91.
Dickens, Richard, Stephen Machin and Alan Manning. 1999. The Effects of Minimum Wages on
Employment: Theory and Evidence from Britain. Journal of Labor Economics, Vol. 17, No. 1
(January 1999), pp. 1-22.
Dube, Arindrajit, Suresh Naidu, and Michael Reich. 2007. “The Economic Effects of a Citywide
Minimum Wage,’’ Industrial and Labor Relations Review 60:4 (2007), 522–543.

39
Dube, Arindrajit, William Lester, and Michael Reich. 2010. Minimum wage effects across state
borders: estimates using contiguous counties. The Review of Economics and Statistics,
November 2010, 92(4): 945–964
Dube, Arindrajit, William Lester, and Michael Reich. 2011. Do Frictions Matter in the Labor
Market? Accessions, Separations and Minimum Wage Effects. IZA DP No. 5811. June 2011
Feliciano, Z. M. (1998), ‘Does the minimum wage affect employment in
Mexico?’. Eastern Economic Journal 24(2), 165–180.
Gindling, T. and Terrell, K. (1995). `The nature of minimum wages and their effectiveness as a
wage floor in Costa Rica, 1976-1991', World Development, vol. 23, pp. 1439-58.
Gindling, T. and Terrell, K. (2004). `Legal minimum wages and wages of formal and informal
sector workers in Costa Rica'. William Davidson Institute Working Paper Number 647
February 2004.
Gindling, T. and Terrell, K. (2006). `Minimum wages, globalization and poverty in Honduras',
IZA Discussion Paper: 2497.
Grenier, Gilles. "On Compliance with the Minimum Wage Law." Journal of Political Economy.
90 (February 1982): 184-87.
40
Hamermesh, D. (2002) “International Labor Economics,” Journal of Labor Economics
Harrison, A. and Scorse, J. (2004). `The impact of globalization on compliance with labor
standards: a plant- level study', in (S. Collins and D. Rodrik eds.) Brookings Trade
Forum 2003, Washington D.C.: Brookings Institution Press.
Jhabvala, R. 1998. “Minimum Wages Based on Worker’s Needs”, Economic and Political
Weekly, 33(10): 500-502.
Jones, Patricia. 1997. The Impact of Minimum Wage Legislation in Developing Countries where
Coverage is Incomplete. Working paper series/ 98-2.Centre for the Study of African Economies.
Institute of Economics and Statistics. University of Oxford. December 1997
Kanta, Murali (2011) Economic Liberalization, Electoral Coalitions and Private Investment in
India, paper presented in Politics of FDI Conference, Niehaus Center for Globalization and
Governance, September 23-24.
Labor Bureau, 2010. Report on the working of The Minimum Wages Act, 1948 for the year
2010” . Government of India. Labor Bureau. Ministry of Labor and Employment.
Chandigarh/Shimla.
Lemos, S. (2006). `Minimum wage effects in a developing country', mimeo, University of
Leicester.
41
Lemos, Sara. 2004. “MinimumWagePolicyand
EmploymentEffects:EvidencefromBrazil.”Economia.Vol. 5, No. 1(Fall), pp. 219-66.
Levin-waldman (1997). Linking the minimum wage to productivity. Levy Economics Institute
Working Paper No. 219 December 1997.
Maloney, W. F. and J. Nu˜nez Mendez (2004), ‘Measuring the impact of minimum wages:
Evidence from Latin America’. In: J. Heckman and C. Pag´es (eds.): Law and Employment:
Lessons from Latin America and the Caribbean. Chicago: University of Chicago Press, pp. 109–
130.
Madheswaran, S., Rajasekhar, D., & Gayathri Devi, K. G. (2005). A comprehensive study of
status of beedi industry in Karnataka. Bangalore: Institute of Social and Economic Change.
Montenegro, Claudio E., and Carmen Pagés. 2004. “Who Benefits from Labor Market
Regulations? Chile, 1960-1998. In James Heckman and Carmen Pagés, eds., Law and
Employment: Lessons from Latin America and the Caribbean, pp. 401-34. Chicago: University
of Chicago Press.
Neumark, David and William Wascher (1992). Employment effects of minimum wages and
subminimum wages: panel data on state minimum wage laws. Industrial and Labor Relations
Review. Vol 46. No 1. October 1992.
42
Neumark, David and William Wascher (2000). Minimum wages and Employment: A case study
of Fast-Food Industry in New Jersey and Pennsylvania: comment” American Economic Review
90:5 (2000), 1362–1396. October 1992.
Neumark, David and William Wascher (2007). Minimum Wages, the Earned Income Tax Credit,
and Employment: Evidence from the Post-Welfare Reform Era. IZA Discussion Paper No. 2610.
February 2007
Pais, Jesim. 2007. Effectiveness of labor regulations in Indian industry. Labor regulation in
Indian industries. No 4. , Institute for studies in Industrial development, New Delhi.
Ronconi, Lucas (2010) "Enforcement and Compliance with Labor Regulations," Industrial &
Labor Relations Review, Vol. 63, No. 4, article 9. Available at:
http://digitalcommons.ilr.cornell.edu/ilrreview/vol63/iss4/9
Strobl, E. and Walsh, F. (2001). `Minimum wage and compliance: the case of Trinidad
and Tobago', Economic Development and Cultural Change, vol. 51(2), 427-50.
Sharma, Alakh and Kalpana V(2007). Labor regulations and Industrial development in Uttar
Pradesh: some recent trends. Labor regulation in Indian industries. No 7. Institute for studies in
Industrial development, New Delhi.
43
Reddy, Narasimha (2007). Labour regulations, industrial growth and employment: A study of
recent trends in Andhra Pradesh. Labor regulation in Indian industries. No 5. Institute for studies
in Industrial development, New Delhi.
Schneider, Aaron (2004) Accountability and Capacity in Developing Country Federalism:
Empowered States, Competitive Federalism, Forum for Development Studies, 31(1), 33-56
Stigler, George J. "The Optimum Enforcement of Laws." J.P.E. 78, no. 3 (May/June 1970): 526-
36.
Shyam Sundar. 2007.Impact of Labour Regulations on Industrial Development and Employment:
A Study of Maharashtra. Labor regulation in Indian industries. No 6. Institute for studies in
Industrial development, New Delhi.
Shyam Sundar (2010). Labour Reforms and Decent Work in India: A Study of Labour Inspection
in India. Bookwell publishing house.
Shyam Sundar, 2010. Evaluation of labor inspections reforms in India. Indian Journal of Labor
economics. Vol. 53. No.3, 2010.
Self Employed Women's Association (2005). “At the kadiyanaka: challenges faced by
construction workers in Ahmedabad”. Purushottam vankar and research team SEWA academy.
Available at http://www.sewaresearch.org/eng-researches.htm, last accessed on March 1, 2013.
44
Ulyssea, Gabriel, 2010. “Regulation of Entry, Labor Market Institutions and the Informal
Sector,” Journal of Development Economics, Vol. 91, Issue 1, pp. 87–99
Venkatesan, R. (2000) Study on Policy Competition among States in India for Attracting Direct
Investment. New Delhi, India: National Council of Applied Economic Research.
Vadlamannati, Krishna Chaitanya. 2011. A Race to Compete for Investment among Indian
States? An Empirical Investigation. Available at http://www.uni-
heidelberg.de/md/awi/professuren/intwipol/regional.pdf, last accessed on March 1. 2013.
Yaniv, G. 2001. Minimum wage noncompliance and the employment decision. Journal of Labor
Economics 19 (3): 596-603.

45
Figure 1: Changes in minimum wages of the construction industry over time in different states
30
65
020
40
60
min
imum
wage
1999-00 2003-04
JAMMU & KASHMIR
45.7560 65 70
100
020
40
60
80100
min
imum
wage
1999-00 2003-04 2004-05 2007-08 2009-10
HIMACHAL PRADESH
63.11
82.65 85.5 90.4498.61
020
40
60
80100
min
imum
wage
1999-00 2003-04 2004-05 2007-08 2009-10
PUNJAB
81.82
98.08110.24
050
100
min
imum
wage
2004-05 2007-08 2009-10
UTTARANCHAL
66.5182.31 84.53
95.55
140.96
050
100
150
min
imum
wage
1999-00 2003-04 2004-05 2007-08 2009-10
HARYANA
44
60 6073
100
020
40
60
80100
min
imum
wage
1999-00 2003-04 2004-05 2007-08 2009-10
RAJASTHAN
70.7977.97 83.65
91.83
020
40
60
80100
min
imum
wage
1999-00 2003-04 2004-05 2007-08
UTTAR PRADESH
39.87
55
020
40
60
min
imum
wage
2004-05 2009-10
ARUNACHAL PRADESH
91103
020
40
60
80100
min
imum
wage
2007-08 2009-10
MIZORAM
36
53 5361
020
40
60
min
imum
wage
1999-00 2004-05 2007-08 2009-10
TRIPURA
70 70 70
020
40
60
80
min
imum
wage
2004-05 2007-08 2009-10
MEGHALAYA
54.52
81.3389.86
103.37
020
40
60
80100
min
imum
wage
1999-00 2003-04 2007-08 2009-10
WEST BENGAL
73
020
40
60
80
min
imum
wage
2007-08
JHARKHAND
32.5
50 50 55
70
020
40
60
80
min
imum
wage
1999-00 2003-04 2004-05 2007-08 2009-10
ORISSA100.08
020
40
60
80100
min
imum
wage
2009-10
CHATTISGARH
65.1
82.790.3
111.2
050
100
min
imum
wage
1999-00 2003-04 2007-08 2009-10
GUJARAT
96.1117.4
197.653
050
100150200
min
imum
wage
1999-00 2003-04 2009-10
MAHARASTRA
43.27
86.0495.77
106.3
150
050
100
150
min
imum
wage
1999-00 2003-04 2004-05 2007-08 2009-10
ANDHRA PRADESH
58.7470.8
79.887.13
105.7
020
40
60
801
00
min
imum
wage
1999-00 2003-04 2004-05 2007-08 2009-10
KARNATAKA103
020
40
60
80100
min
imum
wage
2009-10
GOA
75.46 84.52
151.5165.66
188.14
050
100150200
min
imum
wage
1999-00 2003-04 2004-05 2007-08 2009-10
KERALA
67.37
104.09 109.55
050
100
min
imum
wage
1999-00 2003-04 2004-05
TAMIL NADU
Note: Minimum wage is defined in Rupees/day
Changes in minimum wages over time in different states
Source: Ministry of labor and employment (2001, 2005, 2006, 2007, 2009, 2010)
Figure 2: Number of inspectors per ten thousand workers
6.51
5.71 5.6
5.23
4.17
02
46
8
Insp
ecto
rs p
er th
ousa
nd w
orke
rs
1999-00 2003-04 2004-05 2007-08 2009-10
Source: Ministry of labor and employment, 2010

46
Figure 3: cumulative distribution of log real daily wages across years
0.2
.4.6
.81
prob
abili
ty
2 4 6 8 10Log real daily wage in 1999-00 prices
199900 200304
200405 200506
200708 200910
Figure 4: Mean of log real minimum wage (blue) and log real daily wage (red)
4.013.91
4.32
4.08
4.29
4.08
4.31
4.114.16 4.15
4.21 4.21
01
23
4
Log
wag
es
1999-00 2003-04 2004-05 2005-06 2007-08 2009-10

47
Figure 5: A simple scatter plot of log daily wage on log minimum wage across all years
shows a positive, albeit nonlinear relationship. A lowess smoother fit is superimposed.
24
68
10
lnrd
wage
3.5 4 4.5 5rlnminwage
bandwidth = .8
Lowess smoother
Figure 6: Histogram of half days of employment in the construction sector
01
23
Den
sity
4 6 8 10 12 14Half days employed

48
Figure 7: A simple scatter plot of log daily wage on log minimum wage for all workers
shows a positive, albeit nonlinear relationship. A lowess smoother fit is superimposed.
1.6
1.8
22.
22.
42.
6
ltotd
ays
3.5 4 4.5 5Log real minimum wage in 1999-2000 prices
bandwidth = .8
Lowess smoother
Figure 8: Kernel density estimate of log real minimum wages with knot positions – 4 splines
0.5
11.
52
Den
sity
3 3.5 4 4.5 5Log real minimum wage in 1999-2000 prices
kernel = epanechnikov, bandwidth = 0.0345
Kernel density estimate
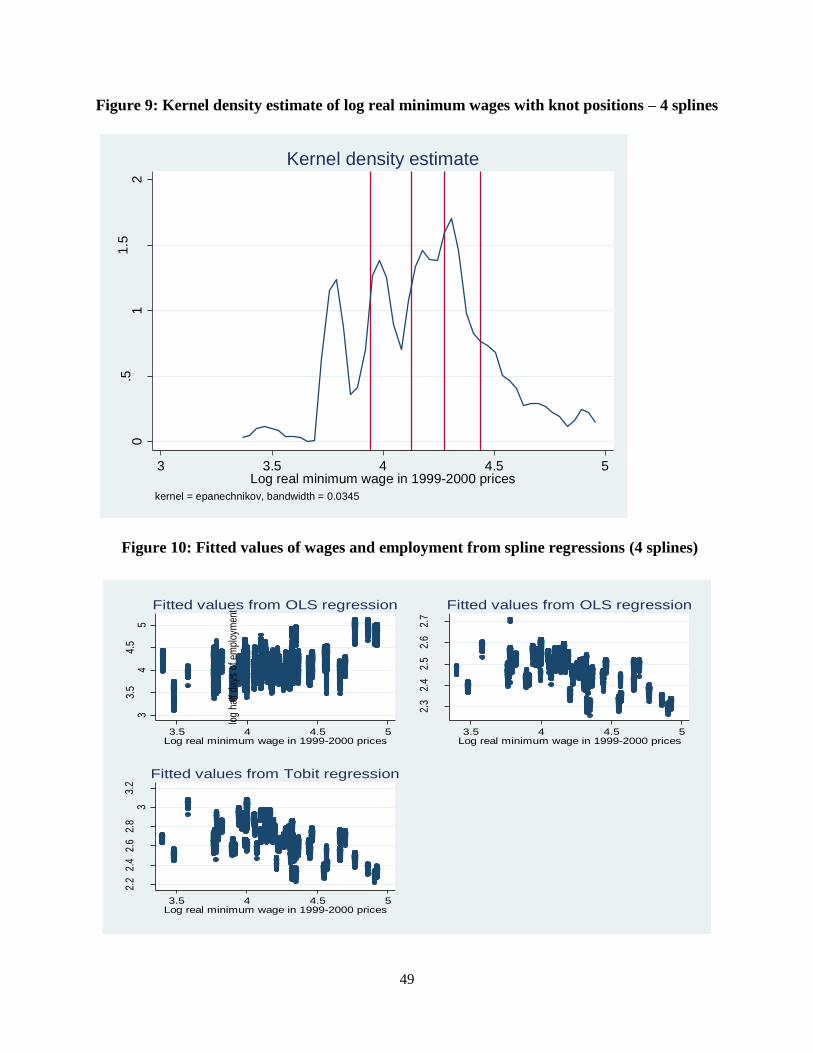
49
Figure 9: Kernel density estimate of log real minimum wages with knot positions – 4 splines
0.5
11.5
2
De
nsity
3 3.5 4 4.5 5Log real minimum wage in 1999-2000 prices
kernel = epanechnikov, bandwidth = 0.0345
Kernel density estimate
Figure 10: Fitted values of wages and employment from spline regressions (4 splines)
33.
54
4.5
5
log
real
wag
es
3.5 4 4.5 5Log real minimum wage in 1999-2000 prices
Fitted values from OLS regression
2.3
2.4
2.5
2.6
2.7
log
half
days
of e
mpl
oym
ent
3.5 4 4.5 5Log real minimum wage in 1999-2000 prices
Fitted values from OLS regression
2.2
2.4
2.6
2.8
33.
2
log
half
days
of e
mpl
oym
ent
3.5 4 4.5 5Log real minimum wage in 1999-2000 prices
Fitted values from Tobit regression

50
Figure 11: Fitted values of wages and employment from spline regressions (5 splines)
33.5
44.5
5
log r
eal w
ages
3.5 4 4.5 5Log real minimum wage in 1999-2000 prices
Fitted values from OLS regression
2.2
2.3
2.4
2.5
2.6
2.7
log h
alf
days
of
em
plo
yment
3.5 4 4.5 5Log real minimum wage in 1999-2000 prices
Fitted values from OLS regression
2.2
2.4
2.6
2.8
33.2
log h
alf
days
of
em
plo
yment
3.5 4 4.5 5Log real minimum wage in 1999-2000 prices
Fitted values from Tobit regression
Figure 12: Fitted values of wages and employment from spline regressions with
enforcement (4 splines)
33.5
44.5
5
Fitt
ed
valu
es
3.5 4 4.5 5Log real minimum wage in 1999-2000 prices
2.3
2.4
2.5
2.6
2.7
Fitt
ed
valu
es
3.5 4 4.5 5Log real minimum wage in 1999-2000 prices
2.2
2.4
2.6
2.8
33.2
Lin
ea
r pre
dic
tion
3.5 4 4.5 5Log real minimum wage in 1999-2000 prices
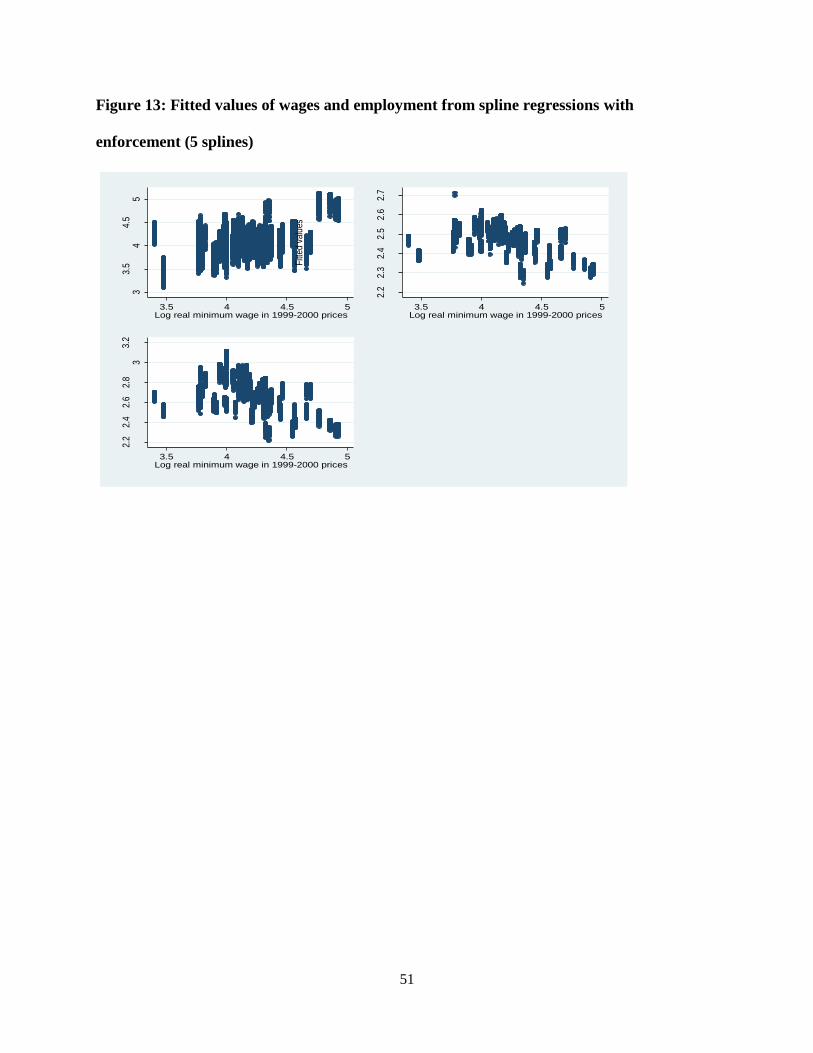
51
Figure 13: Fitted values of wages and employment from spline regressions with
enforcement (5 splines) 3
3.5
44.
55
Fitt
ed v
alu
es
3.5 4 4.5 5Log real minimum wage in 1999-2000 prices
2.2
2.3
2.4
2.5
2.6
2.7
Fitt
ed v
alu
es3.5 4 4.5 5
Log real minimum wage in 1999-2000 prices
2.2
2.4
2.6
2.8
33.
2
Lin
ear
pred
ictio
n
3.5 4 4.5 5Log real minimum wage in 1999-2000 prices

52
Table 1: Descriptive statistics
1999-00 2003-04 2004-05 2005-06 2007-08 2009-10
Sex
Male (sex=1) 85.15 84.25 86.99 88.31 84.93 81.84
Female (sex=0) 14.85 15.75 13.01 11.69 15.07 18.16
Average age 31.49 32.25 32.32 31.64 33.65 34.37
Social group
scheduled tribe 14.33 18.67 10.81 11.47 18.41 15.60
scheduled caste 30.48 34.58 38.61 44.93 31.11 30.31
other backward classes 35.16 33.08 39.45 34.77 35.18 38.40
Others 20.03 13.67 11.13 8.82 15.29 15.68
Sector
Rural 66.06 72.00 76.54 77.60 78.27 76.49
Urban 33.94 28.00 23.46 22.40 21.73 23.51
Education
Not literate 51.94 66.55 49.07 44.28 56.42 40.08
Literate: below primary 14.76 24.11 11.96 11.97 0.46 15.45
Primary 17.30 7.21 19.64 22.46 17.17 21.41
Middle 16.00 2.13 19.33 21.29 25.95 23.07
Half days employment 12.09 11.78 11.89 12.03 12.20 12.67
Average nominal daily wage 58.51 73.02 72.71 76.17 88.43 123.41
Average nominal minimum wage 60.02 82.38 84.43 88.24 88.70 117.94

53
Table 2: Parametric estimations of log real wage and log employment on log minimum wage
OLS - log real wages TOBIT - Log half days of employment
(1) (2) (3) (4) (5) (6)
log real minimum
wage
0.29***
(0.08)
2.009**
(0.70)
-.06
(0.05)
0.47
(1.11)
23.7***
(5.82)
-44.45
(72.32)
Quadratic term of
log real minimum
wage
-0.20**
(0.08)
-0.06
(.13)
-5.62***
(1.38)
19.13
(26.51)
Cubic term of log
real minimum
wage
0.44***
(0.10)
-3.53
(4.28)
Fourth order term
of log real
minimum wage
0.238
(0.25)
Elasticity
Elasticity at mean
log real MW
(4.18)
0.29***
(0.08)
.27***
(.068)
-.06
(0.05)
-0.07
(0.06)
-0.11***
(0.031)
-0.11***
(0.03)
Elasticity at tenth
percentile of log
real MW (3.78)
0.44***
(0.11)
-.01
(0.11)
0.06
(0.07)
0.09
(0.11)
Elasticity at
quartile MW
(3.98)
0.35***
(0.08)
-.04
(0.07)
-0.13***
(0.05)
-.10
(0.08)
Elasticity at
median MW
(4.1868)
0.27***
(.068)
-0.07
(0.06)
-0.22***
(0.05)
-.24***
(0.05)
Elasticity at
seventy fifth
percentile of MW
(4.364)
0.20***
(0.06)
-0.09
(0.08)
-0.21***
(0.04)
-.27***
(0.07)
Elasticity at
ninetieth
percentile of MW
(4.56)
0.11
(0.07)
-0.12
(0.12)
-0.10***
(0.04)
-0.16*
(0.08)
Note: Robust standard errors clustered at the state level in parentheses; All regressions control
for covariates such as, age, age squared, sex, education, social group, state and time fixed effects
and state group specific time trend. The Tobit regression is censored at the top at log(14). *** - p
value is less than -0.01; ** - p value is between 0.05 and 0.01; ** - p value is between 0.1 and
0.05.

54
Table 3: Spline regressions of log minimum wage
Log real wages Log half days employment
OLS OLS OLS TOBIT OLS TOBIT
(1) (2) (3) (4) (5) (6)
Spline 1
0.49*** 0.52*** 0.10** 0.16** 0.13*** 0.22***
(0.10)
(0.12) (0.04) (0.08) (0.04) (0.08)
Spline 2
0.14 0.06 -0.07 -0.13 -0.07 -0.17
(0.18)
(0.24) (0.07) (0.17) (0.06) (0.16)
Spline 3
0.44** 0.81** -0.18* -0.40* 0.03 0.12
(0.17)
(0.31) (0.10) (0.21) (0.09) (0.23)
Spline 4
0.07 -0.23 -0.02 -0.04 -0.42*** -0.91***
(0.06)
(0.39) (0.04) (0.07) (0.08) (0.16)
Spline 5
0.19** 0.09** 0.18***
(0.07) (0.04) (0.07)
Constant 1.90*** 1.82*** 2.11*** 2.14*** 2.02*** 1.94***
(0.33) (0.42) (0.15) (0.31) (0.14) (0.30)
Observatio
ns
20,092 20,092 20,093 20,093 20,093 20,093
R-squared 0.42 0.10 0.10
Note: Robust standard errors clustered at the state level in parentheses; All regressions control
for covariates such as, age, age squared, sex, education, social group, state and time fixed effects
and state group specific time trend). The tobit regression is censored at the top at log(14). *** -
p value is less than -0.01; ** - p value is between 0.05 and 0.01; ** - p value is between 0.1 and
0.05.coefficients of splines represent marginal effect of log minimum wages on outcomes in that
interval where the spline is defined.
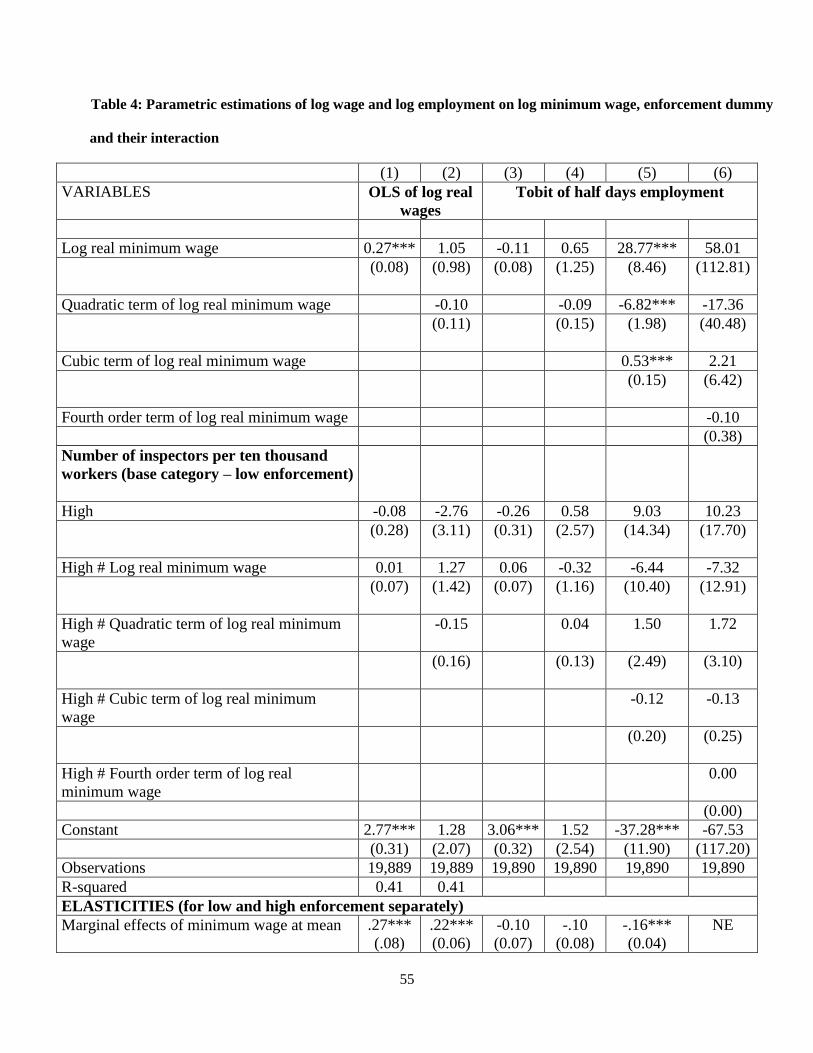
55
Table 4: Parametric estimations of log wage and log employment on log minimum wage, enforcement dummy
and their interaction
(1) (2) (3) (4) (5) (6)
VARIABLES OLS of log real
wages
Tobit of half days employment
Log real minimum wage 0.27*** 1.05 -0.11 0.65 28.77*** 58.01
(0.08) (0.98) (0.08) (1.25) (8.46)
(112.81)
Quadratic term of log real minimum wage -0.10 -0.09 -6.82*** -17.36
(0.11) (0.15) (1.98)
(40.48)
Cubic term of log real minimum wage 0.53*** 2.21
(0.15)
(6.42)
Fourth order term of log real minimum wage -0.10
(0.38)
Number of inspectors per ten thousand
workers (base category – low enforcement)
High -0.08 -2.76 -0.26 0.58 9.03 10.23
(0.28) (3.11) (0.31) (2.57) (14.34)
(17.70)
High # Log real minimum wage 0.01 1.27 0.06 -0.32 -6.44 -7.32
(0.07) (1.42) (0.07) (1.16) (10.40)
(12.91)
High # Quadratic term of log real minimum
wage
-0.15 0.04 1.50 1.72
(0.16) (0.13) (2.49)
(3.10)
High # Cubic term of log real minimum
wage
-0.12 -0.13
(0.20)
(0.25)
High # Fourth order term of log real
minimum wage
0.00
(0.00)
Constant 2.77*** 1.28 3.06*** 1.52 -37.28*** -67.53
(0.31) (2.07) (0.32) (2.54) (11.90) (117.20)
Observations 19,889 19,889 19,890 19,890 19,890 19,890
R-squared 0.41 0.41
ELASTICITIES (for low and high enforcement separately)
Marginal effects of minimum wage at mean .27***
(.08)
.22***
(0.06)
-0.10
(0.07)
-.10
(0.08)
-.16***
(0.04)
NE
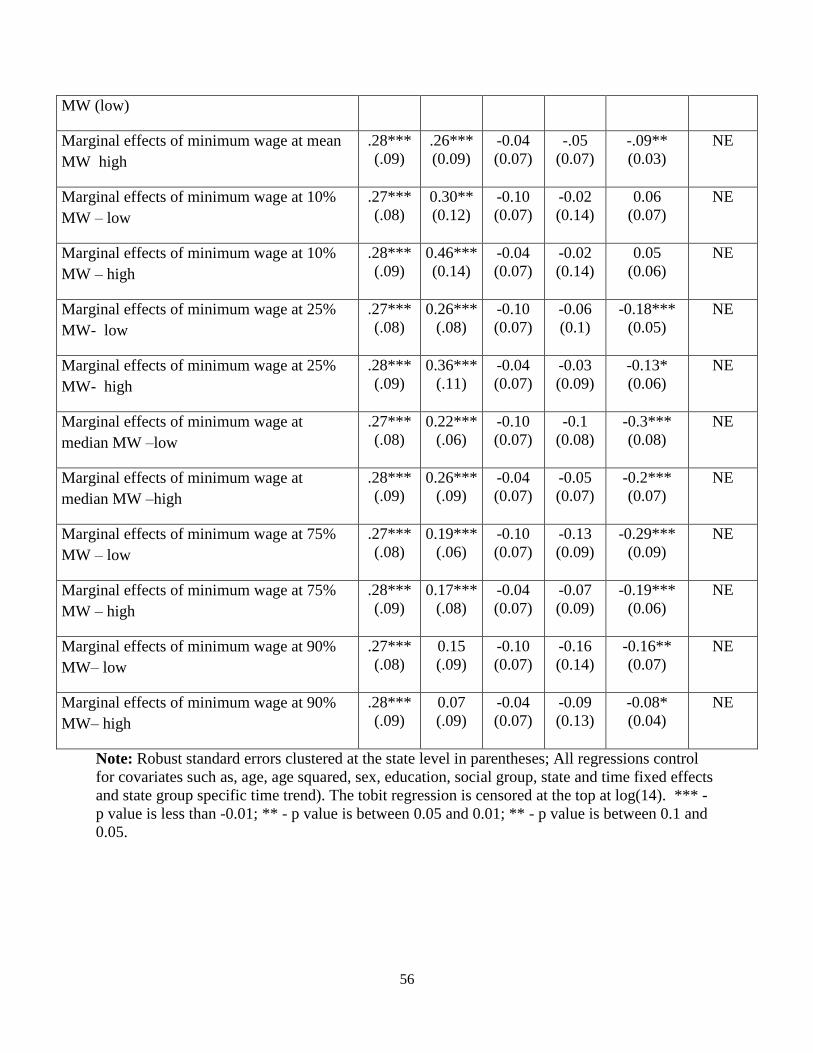
56
MW (low)
Marginal effects of minimum wage at mean
MW high
.28***
(.09)
.26***
(0.09)
-0.04
(0.07)
-.05
(0.07)
-.09**
(0.03)
NE
Marginal effects of minimum wage at 10%
MW – low
.27***
(.08)
0.30**
(0.12)
-0.10
(0.07)
-0.02
(0.14)
0.06
(0.07)
NE
Marginal effects of minimum wage at 10%
MW – high
.28***
(.09)
0.46***
(0.14)
-0.04
(0.07)
-0.02
(0.14)
0.05
(0.06)
NE
Marginal effects of minimum wage at 25%
MW- low
.27***
(.08)
0.26***
(.08)
-0.10
(0.07)
-0.06
(0.1)
-0.18***
(0.05)
NE
Marginal effects of minimum wage at 25%
MW- high
.28***
(.09)
0.36***
(.11)
-0.04
(0.07)
-0.03
(0.09)
-0.13*
(0.06)
NE
Marginal effects of minimum wage at
median MW –low
.27***
(.08)
0.22***
(.06)
-0.10
(0.07)
-0.1
(0.08)
-0.3***
(0.08)
NE
Marginal effects of minimum wage at
median MW –high
.28***
(.09)
0.26***
(.09)
-0.04
(0.07)
-0.05
(0.07)
-0.2***
(0.07)
NE
Marginal effects of minimum wage at 75%
MW – low
.27***
(.08)
0.19***
(.06)
-0.10
(0.07)
-0.13
(0.09)
-0.29***
(0.09)
NE
Marginal effects of minimum wage at 75%
MW – high
.28***
(.09)
0.17***
(.08)
-0.04
(0.07)
-0.07
(0.09)
-0.19***
(0.06)
NE
Marginal effects of minimum wage at 90%
MW– low
.27***
(.08)
0.15
(.09)
-0.10
(0.07)
-0.16
(0.14)
-0.16**
(0.07)
NE
Marginal effects of minimum wage at 90%
MW– high
.28***
(.09)
0.07
(.09)
-0.04
(0.07)
-0.09
(0.13)
-0.08*
(0.04)
NE
Note: Robust standard errors clustered at the state level in parentheses; All regressions control
for covariates such as, age, age squared, sex, education, social group, state and time fixed effects
and state group specific time trend). The tobit regression is censored at the top at log(14). *** -
p value is less than -0.01; ** - p value is between 0.05 and 0.01; ** - p value is between 0.1 and
0.05.
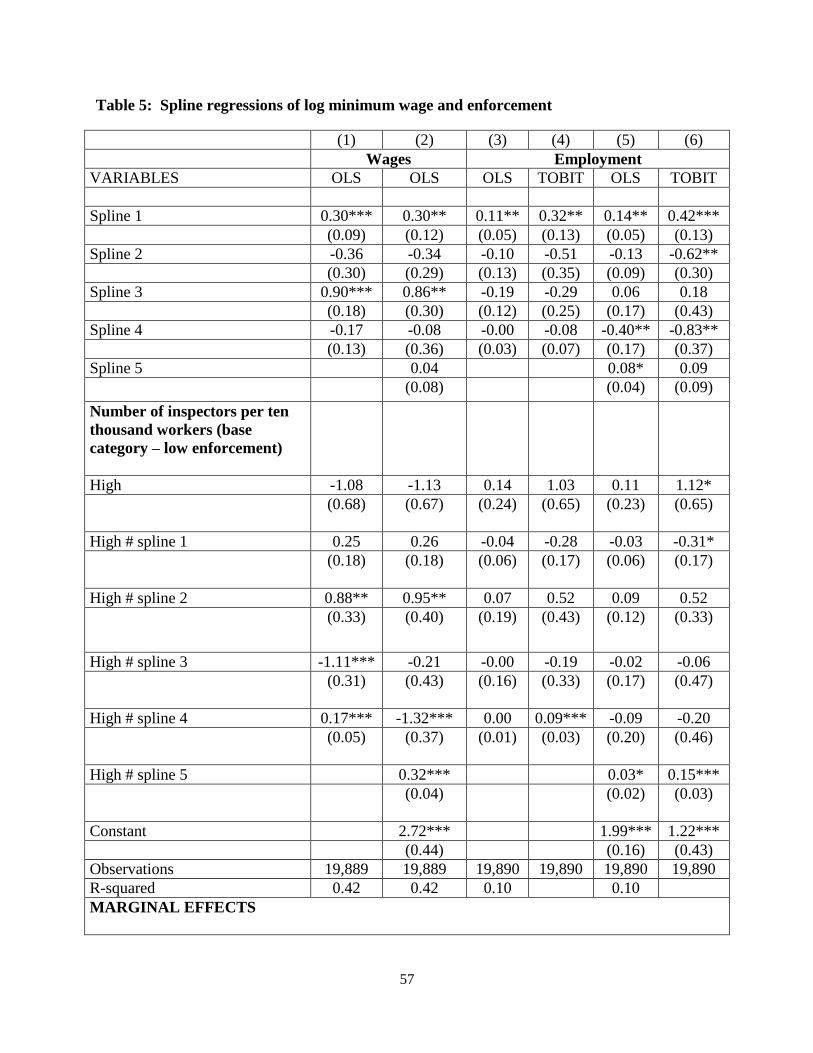
57
Table 5: Spline regressions of log minimum wage and enforcement
(1) (2) (3) (4) (5) (6)
Wages Employment
VARIABLES OLS OLS OLS TOBIT OLS TOBIT
Spline 1 0.30*** 0.30** 0.11** 0.32** 0.14** 0.42***
(0.09) (0.12) (0.05) (0.13) (0.05) (0.13)
Spline 2 -0.36 -0.34 -0.10 -0.51 -0.13 -0.62**
(0.30) (0.29) (0.13) (0.35) (0.09) (0.30)
Spline 3 0.90*** 0.86** -0.19 -0.29 0.06 0.18
(0.18) (0.30) (0.12) (0.25) (0.17) (0.43)
Spline 4 -0.17 -0.08 -0.00 -0.08 -0.40** -0.83**
(0.13) (0.36) (0.03) (0.07) (0.17) (0.37)
Spline 5 0.04 0.08* 0.09
(0.08) (0.04) (0.09)
Number of inspectors per ten
thousand workers (base
category – low enforcement)
High -1.08 -1.13 0.14 1.03 0.11 1.12*
(0.68) (0.67) (0.24) (0.65) (0.23)
(0.65)
High # spline 1 0.25 0.26 -0.04 -0.28 -0.03 -0.31*
(0.18) (0.18) (0.06) (0.17) (0.06)
(0.17)
High # spline 2 0.88** 0.95** 0.07 0.52 0.09 0.52
(0.33) (0.40) (0.19) (0.43) (0.12)
(0.33)
High # spline 3 -1.11*** -0.21 -0.00 -0.19 -0.02 -0.06
(0.31) (0.43) (0.16) (0.33) (0.17)
(0.47)
High # spline 4 0.17*** -1.32*** 0.00 0.09*** -0.09 -0.20
(0.05) (0.37) (0.01) (0.03) (0.20)
(0.46)
High # spline 5 0.32*** 0.03* 0.15***
(0.04) (0.02)
(0.03)
Constant 2.72*** 1.99*** 1.22***
(0.44) (0.16) (0.43)
Observations 19,889 19,889 19,890 19,890 19,890 19,890
R-squared 0.42 0.42 0.10 0.10
MARGINAL EFFECTS

58
Marginal effects of minimum
wage (spline 1 - rlnmw1) – low
enforcement
.30***
(0.09)
0.30**
(0.12)
0.11**
(0.04)
.32**
(0.13)
0.13**
(0.04)
0.41***
(0.13)
Marginal effects of minimum
wage (spline 1 – rlnmw1) – high
enforcement
0.55***
(0.12)
.55***
(0.13)
0.07
(0.05)
0.04
(0.14)
0.10**
(0.05)
0.109
(0.12)
Marginal effects of minimum
wage (spline 2 – rlnmw2) – low
enforcement
-0.35
(0.3)
-.33
(0.287)
-0.09
(0.12)
-0.5
(0.34)
-0.12
(0.08)
-.61**
(0.30)
Marginal effects of minimum
wage (spline 2 – rlnmw2) – high
enforcement
0.51**
(0.2)
.61**
(0.28)
-0.02
(0.09)
0.01
(0.19)
-0.03
(0.06)
-.10
(0.18)
Marginal effects of minimum
wage (spline 3 - rlnmw3) – low
enforcement
0.9***
(0.17)
0.85**
(0.29)
-0.18
(0.12)
-0.29
(0.24)
.05
(0.16)
.18
(0.42)
Marginal effects of minimum
wage (spline 3 – rlnmw3) – high
enforcement
-0.2
(0.24)
.64*
(0.30)
-0.19**
(0.08)
-0.48
(0.2)
0.03
(0.08)
0.11
(0.24)
Marginal effects of minimum
wage (spline 4 – rlnmw4) – low
enforcement
-0.16
(0.12)
-.07
(0.35)
-.002
(0.03)
-0.07
(0.07)
-.40**
(0.17)
-0.83**
(0.36)
Marginal effects of minimum
wage (spline 4 – rlnmw4) – high
enforcement
0.0009
(0.12)
-1.39***
(0.384)
0.00001
(0.03)
0.01
(0.07)
-
0.49***
(0.08)
-1.02***
(0.21)
Marginal effects of minimum
wage (spline 5 – rlnmw5) – low
enforcement
.04
(0.07)
0.07*
(0.04)
0.09
(0.09)
Marginal effects of minimum
wage (spline 5 – rlnmw5) – high
enforcement
0.36
(0.07)
0.11
(0.03)
0.24***
(0.07)
Note: Robust standard errors clustered at the state level in parentheses; All regressions control for covariates such
as, age, age squared, sex, education, social group, state and time fixed effects and state group specific time trend).
The tobit regression is censored at the top at log(14). *** - p value is less than -0.01; ** - p value is between 0.05
and 0.01; ** - p value is between 0.1 and 0.05. Coefficients of splines represent marginal effect of log minimum
wages on outcomes in that interval where the spline is defined.