mining matters for india cover
TRANSCRIPT


I – MINING SECTOR OVERVIEW
Mining has been an important component of human existence and development, since prehistoric times. The history of civilization is a record of how mankind has progressively acquired knowledge to use materials, particularly metals, to meet its security, food and shelter needs, and transform its surroundings for comfort. Today there is no alternative to ensuring that the extraction and management of minerals is well integrated into the overall strategy of the country’s overall development. Kautilya in Arthashastra has aptly observed: “Mines are the source of wealth; from wealth comes the power of the State”
(Arthashastra, 2.12.37; 7.14.25) 1.2 Mining sector, being one of the essential sectors of the economy, provides basic raw materials to industries like thermal power generation, iron and steel, cement, fertilizers, precious and semi-precious metals/stones, electrical and electronics equipment, glass and ceramics etc. India produces as many as 95 minerals which include 4 fuel, 3 atomic, 10 metallic and 23 non-metallic minerals and 55 minor minerals (including building and other materials). There continues to be a huge demand for minerals in view of the rapid urbanization and growth in the manufacturing sector in India. India occupies a dominant position in the production of many minerals across the globe. The multiplier effect of minerals processed into metals on downstream industrialization is a phenomenon that cannot be over emphasized. On the other hand, India’s strategic location enables convenient exports. The geological setup of India is akin in many ways to that of resource rich countries like Australia, South Africa, etc. Out of a total land area of 3.2875 million sq. km, Geological Survey of India (GSI) has identified 0.571 million sq. km. as Obvious Geological Potential (OGP) area for minerals in India. 1.3 Despite being rich in mineral resources and possessing favorable geological environment for mineral production and exports, the performance of the mining sector presently is limited by challenges faced in the form of legislative framework, administrative procedures, high taxation, inadequate infrastructure facilities, low exploration expenditure, etc.
Printed at : Nutan Printers F-89/12, Okhla Industrial Area, Phase-1, New Delhi - 110020
FOREWORD
Next, to agriculture, mining is the most important economic activity in the life of a nation. Apart from generating economic activity in areas where the minerals occur, mining also provides employment in the remote and tribal areas. Mining thus provides backward and forward linkages in the economy more than any other sector in making raw materials available for a vast spectrum of industries. Fortunately, India is known to be a repository of a wide variety of mineral resources. 2. However, the performance of the mining sector is hamstrung by a number of factors such as legislative framework, administrative procedures, highest taxation in the world, inadequate infrastructure facilities, etc. 3. Mining Matters for India is an attempt to highlight these and other impediments coming in the way of realizing the full growth potential of the mining industry and suggestions to overcome these obstacles. I am sure; the publication will be of interest to those who are concerned with inclusive growth and economic development of the country. I hope the publication will also be of use to those who are involved in policy making so that they are able to evolve appropriate strategies for the growth of the resource sector.
(SUNIL DUGGAL) PRESIDENT
New Delhi 7 June, 2019

S. NO. TABLE OF CONTENTS PAGE NO.
I MINING SECTOR OVERVIEW 1-5
II MINING MATTERS FOR INDIA
A. Employment – Direct and Indirect B. Energy sector C. Manufacturing sector D. Transport sector E. Communities F. Skill and Technology G. Exports H. Government revenue and contribution to GDP I. Consumers J. Make in India and Smart cities K. Linkages and Job Multiplier
7-23
9-11 11-12 13-15 16-16 17-17 17-17 18-18 18-19 19-20 20-20 20-23
III
MINING INDUSTRY AT CROSS ROADS – NEEDS REVIVAL
A. An overview of mineral policy B. High incidence of taxes and levies C. Repercussions of expiry of non-captive mining
leases on 31st March, 2020 D. Immediate repercussions : high cost of raw
materials to affect mine development
25-37
25-27 27-33
34-35
35-37
IV
HOW TO REVIVE MINING IN INDIA?
A. Regulatory regime in resource-rich countries B. Suggestions for India C. Mining to be considered as an ‘Independent Activity’ D. Minimum area of mining leases E. Inordinate delays in grant of statutory clearances
like Environment Clearance (EC) / Forest Clearance (FC) and Land acquisition
F. Level playing field for both private (captive and non-captive) and Government companies
G. Increase the production and export from the mining sector
H. Increase per unit of labour productivity I. Technology upgradation in mining J. Increase FDI K. Research and Development
39-50
39-42 42-43 43-43 44-44
45-45
45-46
46-48 48-49 49-49 49-50 50-50
V PROMOTE MINING: PROMOTE GROWTH 51-53

S. NO. TABLE OF CONTENTS PAGE NO.
I MINING SECTOR OVERVIEW 1-5
II MINING MATTERS FOR INDIA
A. Employment – Direct and Indirect B. Energy sector C. Manufacturing sector D. Transport sector E. Communities F. Skill and Technology G. Exports H. Government revenue and contribution to GDP I. Consumers J. Make in India and Smart cities K. Linkages and Job Multiplier
7-23
9-11 11-12 13-15 16-16 17-17 17-17 18-18 18-19 19-20 20-20 20-23
III
MINING INDUSTRY AT CROSS ROADS – NEEDS REVIVAL
A. An overview of mineral policy B. High incidence of taxes and levies C. Repercussions of expiry of non-captive mining
leases on 31st March, 2020 D. Immediate repercussions : high cost of raw
materials to affect mine development
25-37
25-27 27-33
34-35
35-37
IV
HOW TO REVIVE MINING IN INDIA?
A. Regulatory regime in resource-rich countries B. Suggestions for India C. Mining to be considered as an ‘Independent Activity’ D. Minimum area of mining leases E. Inordinate delays in grant of statutory clearances
like Environment Clearance (EC) and Forest Clearance (FC) and Land acquisition
F. Level playing field for both private (captive and non-captive) and Government companies
G. Increase the production and export from the mining sector
H. Increase per unit of labour productivity I. Technology upgradation in mining J. Increase FDI K. Research and Development
39-50
39-42 42-43 43-43 44-44
45-45
45-46
46-48 48-49 49-49 49-50 50-50
V PROMOTE MINING: PROMOTE GROWTH 51-53

S. NO. TABLE OF CONTENTS PAGE NO.
I MINING SECTOR OVERVIEW 1-5
II MINING MATTERS FOR INDIA
A. Employment – Direct and Indirect B. Energy sector C. Manufacturing sector D. Transport sector E. Communities F. Skill and Technology G. Exports H. Government revenue and contribution to GDP I. Consumers J. Make in India and Smart cities K. Linkages and Job Multiplier
7-23
9-11 11-12 13-15 16-16 17-17 17-17 18-18 18-19 19-20 20-20 20-23
III
MINING INDUSTRY AT CROSS ROADS – NEEDS REVIVAL
A. An overview of mineral policy B. High incidence of taxes and levies C. Repercussions of expiry of non-captive mining
leases on 31st March, 2020 D. Immediate repercussions : high cost of raw
materials to affect mine development
25-37
25-27 27-33
34-35
35-37
IV
HOW TO REVIVE MINING IN INDIA?
A. Regulatory regime in resource-rich countries B. Suggestions for India C. Mining to be considered as an ‘Independent Activity’ D. Minimum area of mining leases E. Inordinate delays in grant of statutory clearances
like Environment Clearance (EC) / Forest Clearance (FC) and Land acquisition
F. Level playing field for both private (captive and non-captive) and Government companies
G. Increase the production and export from the mining sector
H. Increase per unit of labour productivity I. Technology upgradation in mining J. Increase FDI K. Research and Development
39-50
39-42 42-43 43-43 44-44
45-45
45-46
46-48 48-49 49-49 49-50 50-50
V PROMOTE MINING: PROMOTE GROWTH 51-53

1
Mining Matters for India
I – MINING SECTOR OVERVIEW
Mining has been an important component of human existence and development, since prehistoric times. The history of civilization is a record of how mankind has progressively acquired knowledge to use materials, particularly metals, to meet its security, food and shelter needs, and transform its surroundings for comfort. Today there is no alternative to ensuring that the extraction and management of minerals is well integrated into the overall strategy of the country’s overall development. Kautilya in Arthashastra has aptly observed: “Mines are the source of wealth; from wealth comes the power of the State”
(Arthashastra, 2.12.37; 7.14.25) 1.2 Mining sector, being one of the essential sectors of the economy, provides basic raw materials to industries like thermal power generation, iron and steel, cement, fertilizers, precious and semi-precious metals/stones, electrical and electronics equipment, glass and ceramics etc. India produces as many as 95 minerals which include 4 fuel, 3 atomic, 10 metallic and 23 non-metallic minerals and 55 minor minerals (including building and other materials). There continues to be a huge demand for minerals in view of the rapid urbanization and growth in the manufacturing sector in India. India occupies a dominant position in the production of many minerals across the globe. The multiplier effect of minerals processed into metals on downstream industrialization is a phenomenon that cannot be over emphasized. On the other hand, India’s strategic location enables convenient exports. The geological setup of India is akin in many ways to that of resource rich countries like Australia, South Africa, etc. Out of a total land area of 3.2875 million sq. km, Geological Survey of India (GSI) has identified 0.571 million sq. km. as Obvious Geological Potential (OGP) area for minerals in India. 1.3 Despite being rich in mineral resources and possessing favorable geological environment for mineral production and exports, the performance of the mining sector presently is limited by challenges faced in the form of legislative framework, administrative procedures, high taxation, inadequate infrastructure facilities, low exploration expenditure, etc.

2
Mining Matters for India
GDP at Market Prices Constant Prices (base year 2011-12) (Amount in Rs. crore)
Items / Year 2011-12 2012-13 2013-14 2014-15 2015-16 2016-17 2017-18 Country GDP# 8736329 9213017 9801370 10527674 11386145 12196006 13010843
Major Minerals - 50631.9 (0.55%)
49906 (0.51%)
44405 (0.42%)
41194 (0.36%)
47789 (0.39%)
58638 (0.45)
Minor Minerals - 46685
(0.51%) 40976
(0.42%) 52810
(0.50%) 52810
(0.46%) 52810
(0.43%) 52810
(0.41%)
Coal and Lignite* - 80230
(0.87%) 88502
(0.90%) 97450
(0.93%) 101117 (0.89%)
87737 (0.72%)
87737 (0.67%)
All Minerals (Excluding Petroleum and NG) -
177547 (1.93%)
179385 (1.83%)
194665 (1.85%)
195121 (1.71%)
188336 (1.54%)
199185 (1.53%)
Note: 1. Coal and lignite: *Due to the unavailability of ex-mine price for coal and lignite in 2017-18, figures have been updated for the previous year (2016-17); 2. Figure brackets: % share of GDP Source: Ministry of Mine's Annual Report (2016-17 and 2017-18) for value of minerals (ex-mine price, including Tax), i.e. we can consider the value of ex mine price as the GDP of minerals. #: Country’s GDP from Central Statistics Office (CSO)
Source: Reserve Bank of India (RBI); Central Statistics Office (CSO); Ministry of Mines; Indian Bureau of Mines (IBM)
1.93% 1.83% 1.85% 1.71% 1.54% 1.53%
0
2000000
4000000
6000000
8000000
10000000
12000000
14000000
0.00
0.50
1.00
1.50
2.00
2.50
2012-13 2013-14 2014-15 2015-16 2016-17 2017-18
Val
ue R
s. in
Cro
res.
in %
All minerals % share of GDP (excluding natural gas and petroleum) Country GDP
Chart – I (a)
Contribution of minerals sector to country’s GDP (excluding petroleum and natural gas)
Table – I
Mineral sector % share of GDP (excluding petroleum and natural gas)
`
(a) GDP contribution 1.4 Compared to other mineral rich countries, contribution of mineral sector to country’s GDP is quite low. In 2017-18, mineral sector’s (excluding petroleum and natural gas) contribution (at constant price) to GDP accounted for only 1.53 % (0.45% for major minerals, 0.41% for minor minerals and 0.67% for coal and lignite). On the other hand, the contribution of the mineral sector (excluding petroleum and natural gas) in case of South Africa, Australia and Brazil are, 7.50 %, 6.99 %, and 2.00% respectively:
Source: India: Indian Bureau of Mines (IBM); Ministry of Mines; Central Statistical Office (CSO); World Bank; Australia: Australian Bureau of Statistics; South Africa: Minerals Council South Africa; Brazil: IBRAM (Brazilian Mining Association)
1.5 In addition to low GDP contribution of mining in India, the sector’s contribution to country's GDP has also been declining over the years. The value of minerals production increased from Rs. 1,77,546.51 crores in 2012-13 to Rs. 1,99,184.85 crores in 2017-18 while the country’s GDP growth has increased from 5% in 2012-13 to 7% in 2017-18, however, the mineral sector (excluding petroleum and natural gas) contribution to GDP has decreased from 1.93 % in 2012-13 to 1.53 % in 2017-18. It indicates that the contribution of the mining sector to the country’s GDP is declining.
Chart – I
Contribution of minerals to country’s GDP (2017-18)
India vs. mineral-rich countries (excludes petroleum and natural gas)
Challenges faced by the mining industry in India

3
Mining Matters for India
GDP at Market Prices Constant Prices (base year 2011-12) (Amount in Rs. crore)
Items / Year 2011-12 2012-13 2013-14 2014-15 2015-16 2016-17 2017-18 Country GDP# 8736329 9213017 9801370 10527674 11386145 12196006 13010843
Major Minerals - 50631.9 (0.55%)
49906 (0.51%)
44405 (0.42%)
41194 (0.36%)
47789 (0.39%)
58638 (0.45)
Minor Minerals - 46685
(0.51%) 40976
(0.42%) 52810
(0.50%) 52810
(0.46%) 52810
(0.43%) 52810
(0.41%)
Coal and Lignite* - 80230
(0.87%) 88502
(0.90%) 97450
(0.93%) 101117 (0.89%)
87737 (0.72%)
87737 (0.67%)
All Minerals (Excluding Petroleum and NG) -
177547 (1.93%)
179385 (1.83%)
194665 (1.85%)
195121 (1.71%)
188336 (1.54%)
199185 (1.53%)
Note: 1. Coal and lignite: *Due to the unavailability of ex-mine price for coal and lignite in 2017-18, figures have been updated for the previous year (2016-17); 2. Figure brackets: % share of GDP Source: Ministry of Mine's Annual Report (2016-17 and 2017-18) for value of minerals (ex-mine price, including Tax), i.e. we can consider the value of ex mine price as the GDP of minerals. #: Country’s GDP from Central Statistics Office (CSO)
Source: Reserve Bank of India (RBI); Central Statistics Office (CSO); Ministry of Mines; Indian Bureau of Mines (IBM)
1.93% 1.83% 1.85% 1.71% 1.54% 1.53%
0
2000000
4000000
6000000
8000000
10000000
12000000
14000000
0.00
0.50
1.00
1.50
2.00
2.50
2012-13 2013-14 2014-15 2015-16 2016-17 2017-18
Val
ue R
s. in
Cro
res.
in %
All minerals % share of GDP (excluding natural gas and petroleum) Country GDP
Chart – I (a)
Contribution of minerals sector to country’s GDP (excluding petroleum and natural gas)
Table – I
Mineral sector % share of GDP (excluding petroleum and natural gas)
`
(a) GDP contribution 1.4 Compared to other mineral rich countries, contribution of mineral sector to country’s GDP is quite low. In 2017-18, mineral sector’s (excluding petroleum and natural gas) contribution (at constant price) to GDP accounted for only 1.53 % (0.45% for major minerals, 0.41% for minor minerals and 0.67% for coal and lignite). On the other hand, the contribution of the mineral sector (excluding petroleum and natural gas) in case of South Africa, Australia and Brazil are, 7.50 %, 6.99 %, and 2.00% respectively:
Source: India: Indian Bureau of Mines (IBM); Ministry of Mines; Central Statistical Office (CSO); World Bank; Australia: Australian Bureau of Statistics; South Africa: Minerals Council South Africa; Brazil: IBRAM (Brazilian Mining Association)
1.5 In addition to low GDP contribution of mining in India, the sector’s contribution to country's GDP has also been declining over the years. The value of minerals production increased from Rs. 1,77,546.51 crores in 2012-13 to Rs. 1,99,184.85 crores in 2017-18 while the country’s GDP growth has increased from 5% in 2012-13 to 7% in 2017-18, however, the mineral sector (excluding petroleum and natural gas) contribution to GDP has decreased from 1.93 % in 2012-13 to 1.53 % in 2017-18. It indicates that the contribution of the mining sector to the country’s GDP is declining.
Chart – I
Contribution of minerals to country’s GDP (2017-18)
India vs. mineral-rich countries (excludes petroleum and natural gas)
Challenges faced by the mining industry in India

4
Mining Matters for India
44405 41193.74 47788.8 58637.7
366841.72346169.63 332449.37
434925.46
0
50000
100000
150000
200000
250000
300000
350000
400000
450000
500000
2014-15 2015-16 2016-17 2017-18
Val
ue in
Rs.
cro
res
Years
Domestic production of major minerals (excl. coal, lignite, and minor minerals)
Import of vital Minerals / Metals (Copper, diamond, nickel, Pb/Zn, gold and PGM
Source: Indian Bureau of Mines (IBM) for domestic production of major minerals; Ministry of Commerce and Industry for imports of minerals / metals
1.7 However, if properly tapped, the mining industry could help to propel growth for the country over the next decade. In fact, the performance of mining sector will be an important factor for India to achieve 8% plus GDP growth. Out of the eight core sectors of the Indian economy, five of them viz. coal, steel, cement, electricity and fertilizers are primarily dependent on raw material supply from mines. Without growth of mining sector in the country, these core sectors as well as the Indian economy will not be able to sustain or grow. As per the National Steel Policy (NSP) 2017, the country would be requiring 437 million tonnes of iron ore besides 11 million tonnes of manganese ore and 161 million tonnes of coking coal for a projected production of crude steel capacity of 300 million tonnes by the year 2030-31.
________
Chart – I (b) Mineral imports approximately seven
times higher than domestic production
Table – I (a) Domestic production of major minerals
(excluding coal, lignite and minor minerals)
(b) Heavily dependent on imports 1.6 India’s mineral sector is heavily dependent on imports. In 2017-18, the value of domestic production of all major minerals (excluding coal, lignite and minor minerals) was Rs. 58,638 crores, whereas the import value of few vital minerals / metals was Rs. 4,34,925 crores which works out to almost seven times higher than domestic production causing serious Current Account Deficit.
(Value in Rs. Crore) Minerals 2013-2014 2014-2015 2015-2016 2016-2017 2017-2018
Bauxite 999.69 1192.24 1543.77 1486.55 1502.06 Iron ore 31649.18 27663.68 22320.66 25229.18 34262.89 Limestone 5133.2 5800.04 6867.4 7387.84 7440.74
Sub-Total 33782.07 34655.96 30731.83 34103.57 43205.69 All Major Mineral Total 49906 44405 41193.74 47788.80 58637.70 Source: Indian Bureau of Mines (IBM)
(Value in Rs. Crore) Minerals / Metals
Unit
2014–2015 2015-2016 2016-2017 2017-2018 Qty. Val. Qty. Val. Qty. Val. Qty. Val.
Copper ores and conc.
million tonnes
1.70 28502.82 1.89 26296.53 1.14 18298.69 1.48 27834.47
Diamond ‘000 cart 151359 125214 151535 110378 159421 129595 201143 190004
Nickel ores and conc.
million tonnes
0.0041 384.24 0.0032 245.38 0.00106 81.80 - -
Lead ores and conc.
million tonnes
0.0334 388.09 0.0394 384.68 0.0053 26.47 0.0022 14.93
Zinc ores and conc.
million tonnes
0.035 169.38 0.00038 1.87 0.0017 8.66 - -
Gold tonnes 915 210658.40 968 207487.49 778 184438.75 955 217072.06 Platinum Group of Metals
Kg 7818 1524.79 8460 1375.68 - - - -
Total of vital Minerals / Metals 366841.72 346169.63 332449.37 434925.46
Source: Ministry of Commerce and Industry
Table – I (b) Imports of vital minerals / metals

5
Mining Matters for India
44405 41193.74 47788.8 58637.7
366841.72346169.63 332449.37
434925.46
0
50000
100000
150000
200000
250000
300000
350000
400000
450000
500000
2014-15 2015-16 2016-17 2017-18
Val
ue in
Rs.
cro
res
Years
Domestic production of major minerals (excl. coal, lignite, and minor minerals)
Import of vital Minerals / Metals (Copper, diamond, nickel, Pb/Zn, gold and PGM
Source: Indian Bureau of Mines (IBM) for domestic production of major minerals; Ministry of Commerce and Industry for imports of minerals / metals
1.7 However, if properly tapped, the mining industry could help to propel growth for the country over the next decade. In fact, the performance of mining sector will be an important factor for India to achieve 8% plus GDP growth. Out of the eight core sectors of the Indian economy, five of them viz. coal, steel, cement, electricity and fertilizers are primarily dependent on raw material supply from mines. Without growth of mining sector in the country, these core sectors as well as the Indian economy will not be able to sustain or grow. As per the National Steel Policy (NSP) 2017, the country would be requiring 437 million tonnes of iron ore besides 11 million tonnes of manganese ore and 161 million tonnes of coking coal for a projected production of crude steel capacity of 300 million tonnes by the year 2030-31.
________
Chart – I (b) Mineral imports approximately seven
times higher than domestic production
Table – I (a) Domestic production of major minerals
(excluding coal, lignite and minor minerals)
(b) Heavily dependent on imports 1.6 India’s mineral sector is heavily dependent on imports. In 2017-18, the value of domestic production of all major minerals (excluding coal, lignite and minor minerals) was Rs. 58,638 crores, whereas the import value of few vital minerals / metals was Rs. 4,34,925 crores which works out to almost seven times higher than domestic production causing serious Current Account Deficit.
(Value in Rs. Crore) Minerals 2013-2014 2014-2015 2015-2016 2016-2017 2017-2018
Bauxite 999.69 1192.24 1543.77 1486.55 1502.06 Iron ore 31649.18 27663.68 22320.66 25229.18 34262.89 Limestone 5133.2 5800.04 6867.4 7387.84 7440.74
Sub-Total 33782.07 34655.96 30731.83 34103.57 43205.69 All Major Mineral Total 49906 44405 41193.74 47788.80 58637.70 Source: Indian Bureau of Mines (IBM)
(Value in Rs. Crore) Minerals / Metals
Unit
2014–2015 2015-2016 2016-2017 2017-2018 Qty. Val. Qty. Val. Qty. Val. Qty. Val.
Copper ores and conc.
million tonnes
1.70 28502.82 1.89 26296.53 1.14 18298.69 1.48 27834.47
Diamond ‘000 cart 151359 125214 151535 110378 159421 129595 201143 190004
Nickel ores and conc.
million tonnes
0.0041 384.24 0.0032 245.38 0.00106 81.80 - -
Lead ores and conc.
million tonnes
0.0334 388.09 0.0394 384.68 0.0053 26.47 0.0022 14.93
Zinc ores and conc.
million tonnes
0.035 169.38 0.00038 1.87 0.0017 8.66 - -
Gold tonnes 915 210658.40 968 207487.49 778 184438.75 955 217072.06 Platinum Group of Metals
Kg 7818 1524.79 8460 1375.68 - - - -
Total of vital Minerals / Metals 366841.72 346169.63 332449.37 434925.46
Source: Ministry of Commerce and Industry
Table – I (b) Imports of vital minerals / metals

II – MINING MATTERS FOR INDIA
Mining supports economic growth
Rapid socio-economic development in India necessitates a large number of minerals and metals to build infrastructure and create material values. Mining supports economic growth in the country as it is a major supplier of inputs to the industrial sector notwithstanding its small share in GDP.
Sector-wise contribution to GDP (in %) GVA at basic prices from
2011-12 2012-13 2013-14 2014-15 2015-16 2016-17 2017-18
Agriculture, forestry and fishing
17.2% 16.5% 16.4% 15.3% 14.2% 14.1% 13.6%
All Minerals % share of GDP (excluding natural gas and petroleum)
1.93% 1.83% 1.85% 1.71% 1.54% 1.53%
Manufacturing 16.1% 16.1% 15.9% 16.0% 16.7% 16.8% 16.6% Electricity, gas, water supply and other utility services
2.1% 2.1% 2.0% 2.0% 2.0% 2.0% 2.0%
Construction 8.9% 8.5% 8.2% 7.9% 7.6% 7.2% 7.1% Trade, hotels, transport, communication and services related to broadcasting
16.2% 16.8% 16.9% 17.2% 17.5% 17.5% 17.7%
Financial, real estate and prof serves
17.5% 18.2% 19.1% 19.7% 20.2% 20.0% 20.0%
GDP (at constant prices, Rs. In Crores) ( 2011-12 series) (including taxes)
87,36,329 92,13,017 98,01,370 105,27,674 113,86,145 121,96,006 130,10,843
Source : Central Statistics Office (CSO), Ministry of Statistics and Programme Implementation (MOSPI)
Table – II Contribution of mining vs. other industrial sectors
to the India’s GDP

7
Mining Matters for India
II – MINING MATTERS FOR INDIA
Mining supports economic growth
Rapid socio-economic development in India necessitates a large number of minerals and metals to build infrastructure and create material values. Mining supports economic growth in the country as it is a major supplier of inputs to the industrial sector notwithstanding its small share in GDP.
Sector-wise contribution to GDP (in %) GVA at basic prices from
2011-12 2012-13 2013-14 2014-15 2015-16 2016-17 2017-18
Agriculture, forestry and fishing
17.2% 16.5% 16.4% 15.3% 14.2% 14.1% 13.6%
All Minerals % share of GDP (excluding natural gas and petroleum)
1.93% 1.83% 1.85% 1.71% 1.54% 1.53%
Manufacturing 16.1% 16.1% 15.9% 16.0% 16.7% 16.8% 16.6% Electricity, gas, water supply and other utility services
2.1% 2.1% 2.0% 2.0% 2.0% 2.0% 2.0%
Construction 8.9% 8.5% 8.2% 7.9% 7.6% 7.2% 7.1% Trade, hotels, transport, communication and services related to broadcasting
16.2% 16.8% 16.9% 17.2% 17.5% 17.5% 17.7%
Financial, real estate and prof serves
17.5% 18.2% 19.1% 19.7% 20.2% 20.0% 20.0%
GDP (at constant prices, Rs. In Crores) ( 2011-12 series) (including taxes)
87,36,329 92,13,017 98,01,370 105,27,674 113,86,145 121,96,006 130,10,843
Source : Central Statistics Office (CSO), Ministry of Statistics and Programme Implementation (MOSPI)
Table – II Contribution of mining vs. other industrial sectors
to the India’s GDP

8
Mining Matters for India
2.2 The above table shows the strong correlation between the contribution of mining to GDP and that of the other industrial sectors. It also shows that, as the mining sector’s contribution to the country’s GDP decreases, the other sectors’ contribution to the country’s GDP also decreases. Almost 30% of the input supply to the manufacturing, construction, and electricity sectors comes from mining only.
Chart – II Mining supports economic growth
2.3 As an emerging economy, we are fortunate to enjoy many benefits from the availability of coal, lignite, metallic, non-metallic minerals. These benefits include low-cost, reliable electricity, and the materials necessary to build our schools, homes, hospitals, highways, roads, bridges, airports etc. and essential services necessary for a healthy and prosperous life.
A. Employment (Direct and indirect) B. Energy sector C. Manufacturing sector D. Transport sector E. Communities F. Skill and Technology G. Exports H. Government revenue and contribution to GDP I. Consumers J. Make in India and Smart cities K. Linkages and Job Multiplier
2.4 Direct employment : As per the report based on “Human Resource and Skill requirements study for Indian mining sector over the period 2014-17 and 2017-22” by Skill Council for Mining Sector (SCMS) promoted by Federation of Indian Mineral Industries (FIMI), in association with Deloitte Touché Tohmatsu India LLP1, Indian mining sector employed approximately 23.23 lakh people in 2011-12 across the organized and unorganized sectors and accounted for around 0.5% of India’s total workforce. In 2011-12 mineral extraction sub-sector was the highest employer in mining sector accounting for ~89.3% of mining workforce engaged in core mining operations followed by 8.7% in associated services, 1.3% in prospecting and exploration and <1% in mineral processing and beneficiation. Under mineral extraction, the majority of the workforce (~66%) was engaged in extraction activities of dimensional stone, sand, clay and other minor minerals followed by fuel minerals (27%), metallic minerals (4%) and non-metallic (3%). 1 Human Resource and Skill Requirement Study for Indian Mining Sector (May, 2016) prepared by Skill Council for Mining Sector (SCMS) promoted by FIMI in association with Deloitte Touche Tohmatsu India LLP
WHO BENEFITS FROM THE MINING
A – Employment in the Indian mining sector

9
Mining Matters for India
2.2 The above table shows the strong correlation between the contribution of mining to GDP and that of the other industrial sectors. It also shows that, as the mining sector’s contribution to the country’s GDP decreases, the other sectors’ contribution to the country’s GDP also decreases. Almost 30% of the input supply to the manufacturing, construction, and electricity sectors comes from mining only.
Chart – II Mining supports economic growth
2.3 As an emerging economy, we are fortunate to enjoy many benefits from the availability of coal, lignite, metallic, non-metallic minerals. These benefits include low-cost, reliable electricity, and the materials necessary to build our schools, homes, hospitals, highways, roads, bridges, airports etc. and essential services necessary for a healthy and prosperous life.
A. Employment (Direct and indirect) B. Energy sector C. Manufacturing sector D. Transport sector E. Communities F. Skill and Technology G. Exports H. Government revenue and contribution to GDP I. Consumers J. Make in India and Smart cities K. Linkages and Job Multiplier
2.4 Direct employment : As per the report based on “Human Resource and Skill requirements study for Indian mining sector over the period 2014-17 and 2017-22” by Skill Council for Mining Sector (SCMS) promoted by Federation of Indian Mineral Industries (FIMI), in association with Deloitte Touché Tohmatsu India LLP1, Indian mining sector employed approximately 23.23 lakh people in 2011-12 across the organized and unorganized sectors and accounted for around 0.5% of India’s total workforce. In 2011-12 mineral extraction sub-sector was the highest employer in mining sector accounting for ~89.3% of mining workforce engaged in core mining operations followed by 8.7% in associated services, 1.3% in prospecting and exploration and <1% in mineral processing and beneficiation. Under mineral extraction, the majority of the workforce (~66%) was engaged in extraction activities of dimensional stone, sand, clay and other minor minerals followed by fuel minerals (27%), metallic minerals (4%) and non-metallic (3%). 1 Human Resource and Skill Requirement Study for Indian Mining Sector (May, 2016) prepared by Skill Council for Mining Sector (SCMS) promoted by FIMI in association with Deloitte Touche Tohmatsu India LLP
WHO BENEFITS FROM THE MINING
A – Employment in the Indian mining sector

10
Mining Matters for India
S. No.
Sub-sector Occupation matrix Employment (in lakh)
1 Prospecting and exploration Natural resource management 0.29 2 Mineral extraction Core mining operations 20.77
2.1 Fuel minerals Coal and lignite mining (excluding petroleum and natural gas)
5.60
2.2 Metallic minerals Non-coal mining (opencast and underground)
0.85 2.3 Non-metallic minerals 0.55 2.4 Minor minerals/
Dimensional stones Dimensional stones/Quarrying of sand, clay and other minor minerals
13.76
3 Associated services Environment, health and safety, engineering and allied services, etc.
2.03
4 Mineral processing and beneficiation
Primary ore processing, instrumentation and control systems
0.14
Total 23.23 Source: National Sample Survey Organisation (NSSO) report 68th round, Directorate General of Mines and Safety (DGMS), Indian Bureau of Mines, Expert interviews and Deloitte analysis
2.5 Share of States in total mining employment: A large proportion of mining in India is concentrated in relatively backward states with low per capita income than national averages such as Jharkhand, Rajasthan, Odisha, Chhattisgarh and Madhya Pradesh which constitutes ~54% of India’s mining sector GDP (2011-12) and ~37% of sectoral employment (2011-12). The states of Gujarat, Telangana, Andhra Pradesh, and Maharashtra, which have higher per capita than the national average constitute ~25% of India’s mining sector GDP (2011-12) and ~22% of sectoral employment (2011-12). According to Directorate General of Mines Safety (DGMS) in 2011-12, the prominent geographical distribution of employees by mineral category is as follows:
Fuel Minerals (Coal and Lignite): 80% of employment is engaged across the states of Jharkhand (25.9%), Andhra Pradesh (17.9%), West Bengal (15.4%), Madhya Pradesh (12.4) and Chhattisgarh (8.9%).
Metallic Minerals: 88% of employment is engaged across the states of Odisha (42.2%), Karnataka (16.5%), Jharkhand (12.8%), Goa (9.5%) and Chhattisgarh (6.8%).
Non-Metallic Minerals: 65% of employment is engaged across the states of Rajasthan (30.5%), Madhya Pradesh (13.7%), Odisha (10.7%) and Andhra Pradesh (9.4%).
Table – II (a) Employment in the mining industry and its prominent sub-sectors (2011-2012)
2.6 Indirect employment and dependence: The Indian mining sector employed approximately 23.23 lakh people in 2011-12 across the organized and unorganized sectors. In India, the practice of hiring “casual” labourers rather than permanent employees is widespread. The ratio of direct to indirect employment in the mining sector is 1:102, i.e., for every job created in the mining sector, another 10 jobs (indirect jobs) are generated along the supply chain. Therefore, as per the multiplier effect additional 2.3 crores jobs through indirect employment opportunities were created in other sectors.
2.7 Power generation remains the primary user of coal and coal products. India is the second largest coal consuming country for energy generation in 2017, next only to South Africa in terms of its dependency on coal for power generation
Country Oil Natural gas Coal Nuclear
energy Hydroelectric
Renewables Other Total
Coal consumption
% share of total power
generation in the country
Rank
South Africa - 1.9 223.8 15.8 0.9 8.7 4.1 255.1 87.7 1st India 10.30 75.5 1141.4 37.4 135.6 96.4 0.3 1497.0 76.2 2nd China 14.90 196.2 4360.9 248.3 1155.8 472.0 47.4 6495.1 67.1 3rd USA 22.70 1368.7 1314.0 847.3 296.5 419.0 13.6 4281.8 30.7 6th Australia 6.30 54.9 159.1 - 13.7 25.2 0.2 259.4 61.3 4th Indonesia 23.50 53.2 152.3 - 18.4 13.0 - 260.4 58.5 5th Canada 4.30 73.4 76.1 96.7 396.9 45.6 0.5 693.4 11.0 7th Mexico 40.80 181.1 31.0 10.9 31.7 19.6 - 315.0 9.8 8th Brazil 17.20 65.4 25.2 15.8 369.5 97.9 - 590.9 4.3 9th Argentina 11.10 82.8 1.7 6.3 41.6 3.0 0.5 147.0 1.2 10th Total World 883 5915.0 9723.0 2636.0 4060.0 2152.0 183.0 25551.0 38.1 - Source: BP Statistical Review of World Energy, 2018
2 Mining, Society and a Sustainable World (2009) Springer
B – Energy sector
Table – II (b)
Electricity generation by fuel (Terawatt–hours) 2017 (cross country analysis)

11
Mining Matters for India
S. No.
Sub-sector Occupation matrix Employment (in lakh)
1 Prospecting and exploration Natural resource management 0.29 2 Mineral extraction Core mining operations 20.77
2.1 Fuel minerals Coal and lignite mining (excluding petroleum and natural gas)
5.60
2.2 Metallic minerals Non-coal mining (opencast and underground)
0.85 2.3 Non-metallic minerals 0.55 2.4 Minor minerals/
Dimensional stones Dimensional stones/Quarrying of sand, clay and other minor minerals
13.76
3 Associated services Environment, health and safety, engineering and allied services, etc.
2.03
4 Mineral processing and beneficiation
Primary ore processing, instrumentation and control systems
0.14
Total 23.23 Source: National Sample Survey Organisation (NSSO) report 68th round, Directorate General of Mines and Safety (DGMS), Indian Bureau of Mines, Expert interviews and Deloitte analysis
2.5 Share of States in total mining employment: A large proportion of mining in India is concentrated in relatively backward states with low per capita income than national averages such as Jharkhand, Rajasthan, Odisha, Chhattisgarh and Madhya Pradesh which constitutes ~54% of India’s mining sector GDP (2011-12) and ~37% of sectoral employment (2011-12). The states of Gujarat, Telangana, Andhra Pradesh, and Maharashtra, which have higher per capita than the national average constitute ~25% of India’s mining sector GDP (2011-12) and ~22% of sectoral employment (2011-12). According to Directorate General of Mines Safety (DGMS) in 2011-12, the prominent geographical distribution of employees by mineral category is as follows:
Fuel Minerals (Coal and Lignite): 80% of employment is engaged across the states of Jharkhand (25.9%), Andhra Pradesh (17.9%), West Bengal (15.4%), Madhya Pradesh (12.4) and Chhattisgarh (8.9%).
Metallic Minerals: 88% of employment is engaged across the states of Odisha (42.2%), Karnataka (16.5%), Jharkhand (12.8%), Goa (9.5%) and Chhattisgarh (6.8%).
Non-Metallic Minerals: 65% of employment is engaged across the states of Rajasthan (30.5%), Madhya Pradesh (13.7%), Odisha (10.7%) and Andhra Pradesh (9.4%).
Table – II (a) Employment in the mining industry and its prominent sub-sectors (2011-2012)
2.6 Indirect employment and dependence: The Indian mining sector employed approximately 23.23 lakh people in 2011-12 across the organized and unorganized sectors. In India, the practice of hiring “casual” labourers rather than permanent employees is widespread. The ratio of direct to indirect employment in the mining sector is 1:102, i.e., for every job created in the mining sector, another 10 jobs (indirect jobs) are generated along the supply chain. Therefore, as per the multiplier effect additional 2.3 crores jobs through indirect employment opportunities were created in other sectors.
2.7 Power generation remains the primary user of coal and coal products. India is the second largest coal consuming country for energy generation in 2017, next only to South Africa in terms of its dependency on coal for power generation
Country Oil Natural gas Coal Nuclear
energy Hydroelectric
Renewables Other Total
Coal consumption
% share of total power
generation in the country
Rank
South Africa - 1.9 223.8 15.8 0.9 8.7 4.1 255.1 87.7 1st India 10.30 75.5 1141.4 37.4 135.6 96.4 0.3 1497.0 76.2 2nd China 14.90 196.2 4360.9 248.3 1155.8 472.0 47.4 6495.1 67.1 3rd USA 22.70 1368.7 1314.0 847.3 296.5 419.0 13.6 4281.8 30.7 6th Australia 6.30 54.9 159.1 - 13.7 25.2 0.2 259.4 61.3 4th Indonesia 23.50 53.2 152.3 - 18.4 13.0 - 260.4 58.5 5th Canada 4.30 73.4 76.1 96.7 396.9 45.6 0.5 693.4 11.0 7th Mexico 40.80 181.1 31.0 10.9 31.7 19.6 - 315.0 9.8 8th Brazil 17.20 65.4 25.2 15.8 369.5 97.9 - 590.9 4.3 9th Argentina 11.10 82.8 1.7 6.3 41.6 3.0 0.5 147.0 1.2 10th Total World 883 5915.0 9723.0 2636.0 4060.0 2152.0 183.0 25551.0 38.1 - Source: BP Statistical Review of World Energy, 2018
2 Mining, Society and a Sustainable World (2009) Springer
B – Energy sector
Table – II (b)
Electricity generation by fuel (Terawatt–hours) 2017 (cross country analysis)

12
Mining Matters for India
Oil1%
Natural gas5%
Coal76%
Nuclear energy3%
Hydro electric9%
Renewables6%
2.8 India has the world's 4th largest coal reserves. From the table and chart below, it has been observed that, in India, coal is the bulk of primary energy contributor with 76% share equivalent to 1141.4 terawatt-hours in 2017. Therefore, in other words, the energy sector in India is highly dependent on the mining sector. Due to rapid economic expansion, India has one of the world's fastest-growing energy markets and is expected to be the second-largest contributor to the increase in global energy demand by 2035, accounting for 18% of the rise in global energy consumption according to the Ministry of New and Renewable Energy, Government of India.
Primary energy use (Terawatt-hours)
Year Resources India % use of energy
2017
Coal 1141 76 Hydroelectric 136 9 Renewables 96 6 Nuclear energy 37 3 Natural gas 76 5 Oil 10 1
Total 1497 100 Source: BP Statistical Review of World Energy, 2018
Source: BP Statistical Reivew of World Energy, 2018
Table – II (c)
Electricity generation by resource – India
Chart – II (a)
Primary energy used in India
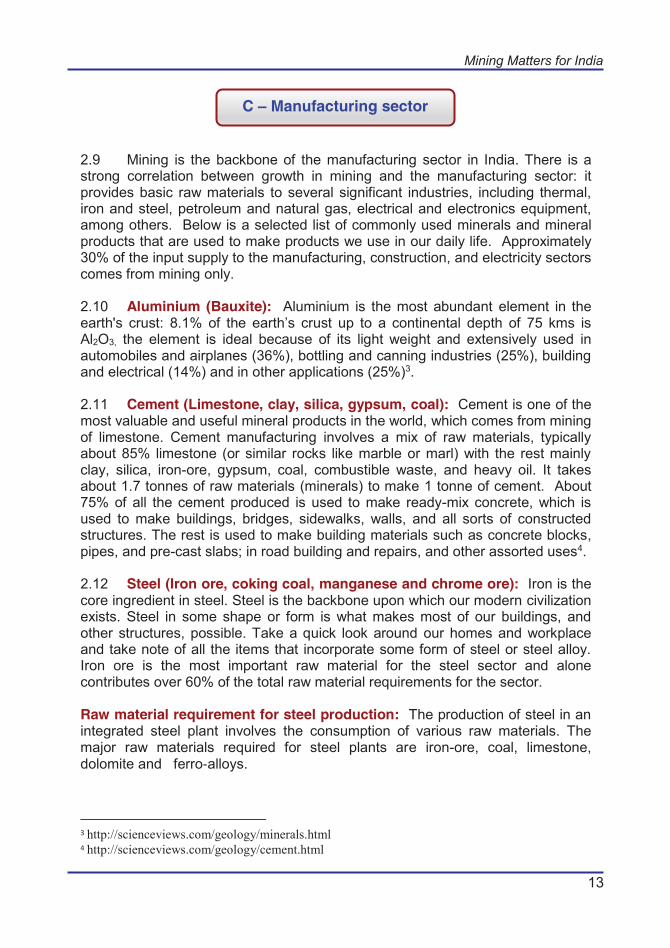
2.9 Mining is the backbone of the manufacturing sector in India. There is a strong correlation between growth in mining and the manufacturing sector: it provides basic raw materials to several significant industries, including thermal, iron and steel, petroleum and natural gas, electrical and electronics equipment, among others. Below is a selected list of commonly used minerals and mineral products that are used to make products we use in our daily life. Approximately 30% of the input supply to the manufacturing, construction, and electricity sectors comes from mining only. 2.10 Aluminium (Bauxite): Aluminium is the most abundant element in the earth's crust: 8.1% of the earth’s crust up to a continental depth of 75 kms is Al2O3, the element is ideal because of its light weight and extensively used in automobiles and airplanes (36%), bottling and canning industries (25%), building and electrical (14%) and in other applications (25%)3. 2.11 Cement (Limestone, clay, silica, gypsum, coal): Cement is one of the most valuable and useful mineral products in the world, which comes from mining of limestone. Cement manufacturing involves a mix of raw materials, typically about 85% limestone (or similar rocks like marble or marl) with the rest mainly clay, silica, iron-ore, gypsum, coal, combustible waste, and heavy oil. It takes about 1.7 tonnes of raw materials (minerals) to make 1 tonne of cement. About 75% of all the cement produced is used to make ready-mix concrete, which is used to make buildings, bridges, sidewalks, walls, and all sorts of constructed structures. The rest is used to make building materials such as concrete blocks, pipes, and pre-cast slabs; in road building and repairs, and other assorted uses4. 2.12 Steel (Iron ore, coking coal, manganese and chrome ore): Iron is the core ingredient in steel. Steel is the backbone upon which our modern civilization exists. Steel in some shape or form is what makes most of our buildings, and other structures, possible. Take a quick look around our homes and workplace and take note of all the items that incorporate some form of steel or steel alloy. Iron ore is the most important raw material for the steel sector and alone contributes over 60% of the total raw material requirements for the sector. Raw material requirement for steel production: The production of steel in an integrated steel plant involves the consumption of various raw materials. The major raw materials required for steel plants are iron-ore, coal, limestone, dolomite and ferro‐alloys. 3 http://scienceviews.com/geology/minerals.html 4 http://scienceviews.com/geology/cement.html
C – Manufacturing sector
13
Mining Matters for India
Oil1%
Natural gas5%
Coal76%
Nuclear energy3%
Hydro electric9%
Renewables6%
2.8 India has the world's 4th largest coal reserves. From the table and chart below, it has been observed that, in India, coal is the bulk of primary energy contributor with 76% share equivalent to 1141.4 terawatt-hours in 2017. Therefore, in other words, the energy sector in India is highly dependent on the mining sector. Due to rapid economic expansion, India has one of the world's fastest-growing energy markets and is expected to be the second-largest contributor to the increase in global energy demand by 2035, accounting for 18% of the rise in global energy consumption according to the Ministry of New and Renewable Energy, Government of India.
Primary energy use (Terawatt-hours)
Year Resources India % use of energy
2017
Coal 1141 76 Hydroelectric 136 9 Renewables 96 6 Nuclear energy 37 3 Natural gas 76 5 Oil 10 1
Total 1497 100 Source: BP Statistical Review of World Energy, 2018
Source: BP Statistical Reivew of World Energy, 2018
Table – II (c)
Electricity generation by resource – India
Chart – II (a)
Primary energy used in India
2.9 Mining is the backbone of the manufacturing sector in India. There is a strong correlation between growth in mining and the manufacturing sector: it provides basic raw materials to several significant industries, including thermal, iron and steel, petroleum and natural gas, electrical and electronics equipment, among others. Below is a selected list of commonly used minerals and mineral products that are used to make products we use in our daily life. Approximately 30% of the input supply to the manufacturing, construction, and electricity sectors comes from mining only. 2.10 Aluminium (Bauxite): Aluminium is the most abundant element in the earth's crust: 8.1% of the earth’s crust up to a continental depth of 75 kms is Al2O3, the element is ideal because of its light weight and extensively used in automobiles and airplanes (36%), bottling and canning industries (25%), building and electrical (14%) and in other applications (25%)3. 2.11 Cement (Limestone, clay, silica, gypsum, coal): Cement is one of the most valuable and useful mineral products in the world, which comes from mining of limestone. Cement manufacturing involves a mix of raw materials, typically about 85% limestone (or similar rocks like marble or marl) with the rest mainly clay, silica, iron-ore, gypsum, coal, combustible waste, and heavy oil. It takes about 1.7 tonnes of raw materials (minerals) to make 1 tonne of cement. About 75% of all the cement produced is used to make ready-mix concrete, which is used to make buildings, bridges, sidewalks, walls, and all sorts of constructed structures. The rest is used to make building materials such as concrete blocks, pipes, and pre-cast slabs; in road building and repairs, and other assorted uses4. 2.12 Steel (Iron ore, coking coal, manganese and chrome ore): Iron is the core ingredient in steel. Steel is the backbone upon which our modern civilization exists. Steel in some shape or form is what makes most of our buildings, and other structures, possible. Take a quick look around our homes and workplace and take note of all the items that incorporate some form of steel or steel alloy. Iron ore is the most important raw material for the steel sector and alone contributes over 60% of the total raw material requirements for the sector. Raw material requirement for steel production: The production of steel in an integrated steel plant involves the consumption of various raw materials. The major raw materials required for steel plants are iron-ore, coal, limestone, dolomite and ferro‐alloys. 3 http://scienceviews.com/geology/minerals.html 4 http://scienceviews.com/geology/cement.html
C – Manufacturing sector

14
Mining Matters for India
Processed iron ore 1600 kg per tonne of steel (iron ore based) Coking Coal
740 kg per tonne of steel through BF‐BOF (Blast Furnace route-basic oxygen furnace) route
Non‐coking coal (Pulverized Coal Injection)
160 kg per tonne of steel through (Blast Furnace route-basic oxygen furnace) route
Non‐coking coal (Direct reduced iron):
1620 kg per tonne of steel through DR‐EAF (Direct Reduction-Electric arc furnace)
Limestone and Dolomite 330 kg per tonne of steel through BF‐BOF and DR‐EAF Source: Mecon Ltd. Ranchi Report for Joint Plant Committee Ministry of Steel, GOI, 2015
Sr. No. Raw materials Projections (2030–31) 1 Iron ore 437 2 Coking coal 161 3 Manganese Ore 11 4 Chromite ore 5 5 Limestone and dolomite 86 6 Ferro-alloys 4
Source: National Steel Policy (NSP), 2017
Stainless steel (Chromium): Stainless steel also contains chromium, a mineral mined as chromite and used in a variety of applications, mostly as part of alloys. Most of us are familiar with chromium via shiny chrome plated objects, but chromium has many other common uses including as part of the leather tanning and dying process. 2.13 Agriculture (Potash, phosphate): Agriculture and mining both rely on the world’s natural resources to create wealth and happiness. As industries, they also rely on each other to prosper. Agriculture depends on mined minerals such as phosphates to fertilize the soil. Primarily a sedimentary rock, phosphate is used to produce fertilizers, phosphoric acid and ammoniated phosphate, feed additives for livestock, elemental phosphorus, and a variety of phosphate chemicals for industrial and home consumers. 2.14 Modern equipment, technology (Lead): If you've ever had an x-ray, it was another mineral called lead that shielded you from the harmful radiation emitted by this equipment. It's also lead that performs a similar task when you look at a computer monitor or switch on your television, both of which also emit
Table – II (e)
Forecast of the major raw materials requirement by 2030–31 (all values in million tonnes)
Table – II (d)
Estimated specific consumption of various raw materials in the iron and steel industry
radiation. When you turn the ignition key in your motor vehicle, and it purrs into life, it's thanks to the lead-acid battery installed under the bonnet. Being a very dense material lead is also used in sound and vibration insulation. It's corrosion proof, which makes it ideal for use in cable sheaths and for lining storage containers and pipes that carry corrosive liquids. Lead usually occurs in tandem with zinc and other minerals. 2.15 Electrical cabling (Copper): Copper is an important component in electrical cabling and water pipes, two essential building ingredients. It's an efficient conductor of electricity and heat. It doesn't rust easily and is soft and easy to manipulate. Copper is the primary component in bronze and brass. It is also the first metal our ancestors learned to extract and use instead of stone. Furthermore, it is also used in transport, consumer durables, engineering, construction, telecommunication, etc. 2.16 Tyre manufacturing, beauty products (Zinc): Like most minerals, zinc is a very handy mineral indeed. Apart from its popular use as a rust proof coating on steel products, zinc is also mixed with other minerals to create a range of alloys that are used in many applications. From die cast products to zinc-bromide and zinc-nickel batteries, zinc is all around us. Zinc oxide is used in rubber tyre manufacturing and also used in sunscreen cream. Anti-dandruff shampoos, calamine lotion, and some antiseptic lotions contain zinc oxide. Brass is a copper-zinc alloy. Zinc sulfate makes luminous numerals and dials luminous. Other types of zinc compounds are used to fireproof timber, as surgical dressings, and in glue. 2.17 Applications, medical equipment, beauty products (Titanium): Titanium is a mineral extracted from mineral sands. It makes a lightweight, very strong and rust-resistant metal with a very high melting point. For this reason, it is ideal for aerospace applications. Because it is non-toxic, titanium comes in handy for making medical equipment including artificial limbs, pacemakers, and surgical equipment. Titanium sports equipment are also popular. Titanium dioxide is used in sunscreens due to it’s UV reflective capacity. 2.18 Gadgets (Nickel): Nickel is an important mineral. Once extracted from the ground, nickel is used in many of the gadgets we take for granted. Our mobile phone, for example, uses a nickel-cadmium rechargeable battery. Coins contain nickel in varying amounts – the more 'silver' the coin, the more nickel it contains. But by far the biggest use for nickel is in alloys – there are around 3,000 different types of nickel alloys. The one that most of us would be familiar with is stainless steel. There are many more minerals which are used in the manufacturing sector. Every segment of society uses minerals and mineral resources every day. The roads we ride or drive on and the buildings we live learn and work, all contain minerals.

15
Mining Matters for India
Processed iron ore 1600 kg per tonne of steel (iron ore based) Coking Coal
740 kg per tonne of steel through BF‐BOF (Blast Furnace route-basic oxygen furnace) route
Non‐coking coal (Pulverized Coal Injection)
160 kg per tonne of steel through (Blast Furnace route-basic oxygen furnace) route
Non‐coking coal (Direct reduced iron):
1620 kg per tonne of steel through DR‐EAF (Direct Reduction-Electric arc furnace)
Limestone and Dolomite 330 kg per tonne of steel through BF‐BOF and DR‐EAF Source: Mecon Ltd. Ranchi Report for Joint Plant Committee Ministry of Steel, GOI, 2015
Sr. No. Raw materials Projections (2030–31) 1 Iron ore 437 2 Coking coal 161 3 Manganese Ore 11 4 Chromite ore 5 5 Limestone and dolomite 86 6 Ferro-alloys 4
Source: National Steel Policy (NSP), 2017
Stainless steel (Chromium): Stainless steel also contains chromium, a mineral mined as chromite and used in a variety of applications, mostly as part of alloys. Most of us are familiar with chromium via shiny chrome plated objects, but chromium has many other common uses including as part of the leather tanning and dying process. 2.13 Agriculture (Potash, phosphate): Agriculture and mining both rely on the world’s natural resources to create wealth and happiness. As industries, they also rely on each other to prosper. Agriculture depends on mined minerals such as phosphates to fertilize the soil. Primarily a sedimentary rock, phosphate is used to produce fertilizers, phosphoric acid and ammoniated phosphate, feed additives for livestock, elemental phosphorus, and a variety of phosphate chemicals for industrial and home consumers. 2.14 Modern equipment, technology (Lead): If you've ever had an x-ray, it was another mineral called lead that shielded you from the harmful radiation emitted by this equipment. It's also lead that performs a similar task when you look at a computer monitor or switch on your television, both of which also emit
Table – II (e)
Forecast of the major raw materials requirement by 2030–31 (all values in million tonnes)
Table – II (d)
Estimated specific consumption of various raw materials in the iron and steel industry
radiation. When you turn the ignition key in your motor vehicle, and it purrs into life, it's thanks to the lead-acid battery installed under the bonnet. Being a very dense material lead is also used in sound and vibration insulation. It's corrosion proof, which makes it ideal for use in cable sheaths and for lining storage containers and pipes that carry corrosive liquids. Lead usually occurs in tandem with zinc and other minerals. 2.15 Electrical cabling (Copper): Copper is an important component in electrical cabling and water pipes, two essential building ingredients. It's an efficient conductor of electricity and heat. It doesn't rust easily and is soft and easy to manipulate. Copper is the primary component in bronze and brass. It is also the first metal our ancestors learned to extract and use instead of stone. Furthermore, it is also used in transport, consumer durables, engineering, construction, telecommunication, etc. 2.16 Tyre manufacturing, beauty products (Zinc): Like most minerals, zinc is a very handy mineral indeed. Apart from its popular use as a rust proof coating on steel products, zinc is also mixed with other minerals to create a range of alloys that are used in many applications. From die cast products to zinc-bromide and zinc-nickel batteries, zinc is all around us. Zinc oxide is used in rubber tyre manufacturing and also used in sunscreen cream. Anti-dandruff shampoos, calamine lotion, and some antiseptic lotions contain zinc oxide. Brass is a copper-zinc alloy. Zinc sulfate makes luminous numerals and dials luminous. Other types of zinc compounds are used to fireproof timber, as surgical dressings, and in glue. 2.17 Applications, medical equipment, beauty products (Titanium): Titanium is a mineral extracted from mineral sands. It makes a lightweight, very strong and rust-resistant metal with a very high melting point. For this reason, it is ideal for aerospace applications. Because it is non-toxic, titanium comes in handy for making medical equipment including artificial limbs, pacemakers, and surgical equipment. Titanium sports equipment are also popular. Titanium dioxide is used in sunscreens due to it’s UV reflective capacity. 2.18 Gadgets (Nickel): Nickel is an important mineral. Once extracted from the ground, nickel is used in many of the gadgets we take for granted. Our mobile phone, for example, uses a nickel-cadmium rechargeable battery. Coins contain nickel in varying amounts – the more 'silver' the coin, the more nickel it contains. But by far the biggest use for nickel is in alloys – there are around 3,000 different types of nickel alloys. The one that most of us would be familiar with is stainless steel. There are many more minerals which are used in the manufacturing sector. Every segment of society uses minerals and mineral resources every day. The roads we ride or drive on and the buildings we live learn and work, all contain minerals.

16
Mining Matters for India
2.19 Cobalt and lithium – powering the future of motoring: Electric cars - they're clean and green, and they look set to be the future of motoring. The batteries in these cars though require cobalt, and lithium, amongst other minerals. Lithium is a very handy and much-overlooked mineral with many surprising uses, not the least of which are rechargeable batteries like those in electric cars. Cobalt is also an integral component in many different types of wear and corrosion resistant alloys. Lithium and cobalt are critical elements in batteries that power mobile phones, laptops, and electric vehicles, the centerpiece of future transport solutions. The global race for these minerals is intensifying in the wake of the growing use of such vehicles. Cobalt-60 is a radioactive type of cobalt that is used for treating cancer. Chinese imports of cobalt from the Congo, the world’s biggest producer of the mineral, was around $1.2 billion in the first nine months of 2017, compared with $3.2 million by India, the second-largest importer, according to a recent Wall Street Journal report5. 2.20 Road vehicles: Copper is a vital component for cars and trucks. In India, a standard car contains 42 pounds of copper while a hybrid car requires 75 pounds of the mineral. Many motorcycle parts also feature copper; such as exhausts or plating pieces used for design purposes. 2.21 Aircraft: Aircraft are mainly made up of aluminium and its alloys for light weight and strength essential for aviation. Aircrafts use copper and aluminum to protect the plane from lightning strikes. The high conductivity and extreme heat of vaporization needed to handle current levels from lightning strikes can be found in both materials, making them perfect for the job. 2.22 Trains: In India, a typical diesel-electric railroad locomotive uses about 11,000 pounds of copper. Copper is also used to convey messages from the control centre through power lines attached to track signals. 2.23 Ships: Ships require stainless steel, containing copper and nickel. Copper is used in fuel lines and electrical wiring, while stainless steel is used for the propellers and headliners of leisure ships. Copper and nickel alloys are also ideal materials for saltwater boat hulls due to their corrosion resistance.
5 https://economictimes.indiatimes.com/industry/indl-goods/svs/metals-mining/india-looks-to-acquire-lithium-and-cobalt-mines-abroad/articleshow/64876000.cms?from=mdr
D – Transport sector
2.24 Mining positively affects local communities in remote regions and helps in their socio–economic development. Companies engaged in mining contribute to the development of key socio-economic infrastructures such as roads, hospitals, schools and housing. While revenues accruing from mining activities contribute positively to the economy of the community, mining activities in the region serve as a major source of employment for local people and trigger the establishment of a wide range of small businesses such as transport of minerals, local grocery and food stalls, repair shops etc. 2.25 District Mineral Foundation (DMF) as on 10 October 2016, has been set up in 263 districts across 12 mineral-rich states for welfare of mining-affected communities. It is a trust set up as a non-profit body, in those districts affected by the mining works, to work for the interest and benefit of persons and areas affected by mining-related operations. It is solely funded through the contributions from miners.
2.26 Skill development is an effective way to improve the efficiency of the workforce towards better productivity. It entails fostering the skill-sets that develop employability and add values to the organization. 2.27 The Mining sector in India is gradually transforming with greater emphasis laid on reconnaissance and exploration activities, underground mining, mechanization of current operations, zero waste mining/ mining of associated minerals, etc. This involves skilling of the existing workers on newer skills and technology as well as suitably training the incremental human resource who will be entering the mining sector in the near future. 2.28 In view of the demand of skilled workforce anticipated by the mining industry and in alignment with the Government of India’s target of skilling, Federation of Indian Mineral Industries (FIMI) promoted a separate institution Skill Council for Mining Sector (SCMS) in October, 2013. SCMS is promoting skill development in mining sector and is not only enhancing productivity and safety at workplace, but more importantly also making the workforce ready to adapt to the new technologies and processes being used in the sector. So far, 1,38,705 students have been trained and 1,16,441 have been certified by the SCMS as part of skill development initiative in the country. 2.29 Scientific, sustainable, and transparent mining practices require well-trained manpower. Currently, this sector employs around 0.2 million workforces, which are estimated to grow to 0.3 million in the next ten years.
E – Communities
F – Skill and Technology

17
Mining Matters for India
2.19 Cobalt and lithium – powering the future of motoring: Electric cars - they're clean and green, and they look set to be the future of motoring. The batteries in these cars though require cobalt, and lithium, amongst other minerals. Lithium is a very handy and much-overlooked mineral with many surprising uses, not the least of which are rechargeable batteries like those in electric cars. Cobalt is also an integral component in many different types of wear and corrosion resistant alloys. Lithium and cobalt are critical elements in batteries that power mobile phones, laptops, and electric vehicles, the centerpiece of future transport solutions. The global race for these minerals is intensifying in the wake of the growing use of such vehicles. Cobalt-60 is a radioactive type of cobalt that is used for treating cancer. Chinese imports of cobalt from the Congo, the world’s biggest producer of the mineral, was around $1.2 billion in the first nine months of 2017, compared with $3.2 million by India, the second-largest importer, according to a recent Wall Street Journal report5. 2.20 Road vehicles: Copper is a vital component for cars and trucks. In India, a standard car contains 42 pounds of copper while a hybrid car requires 75 pounds of the mineral. Many motorcycle parts also feature copper; such as exhausts or plating pieces used for design purposes. 2.21 Aircraft: Aircraft are mainly made up of aluminium and its alloys for light weight and strength essential for aviation. Aircrafts use copper and aluminum to protect the plane from lightning strikes. The high conductivity and extreme heat of vaporization needed to handle current levels from lightning strikes can be found in both materials, making them perfect for the job. 2.22 Trains: In India, a typical diesel-electric railroad locomotive uses about 11,000 pounds of copper. Copper is also used to convey messages from the control centre through power lines attached to track signals. 2.23 Ships: Ships require stainless steel, containing copper and nickel. Copper is used in fuel lines and electrical wiring, while stainless steel is used for the propellers and headliners of leisure ships. Copper and nickel alloys are also ideal materials for saltwater boat hulls due to their corrosion resistance.
5 https://economictimes.indiatimes.com/industry/indl-goods/svs/metals-mining/india-looks-to-acquire-lithium-and-cobalt-mines-abroad/articleshow/64876000.cms?from=mdr
D – Transport sector
2.24 Mining positively affects local communities in remote regions and helps in their socio–economic development. Companies engaged in mining contribute to the development of key socio-economic infrastructures such as roads, hospitals, schools and housing. While revenues accruing from mining activities contribute positively to the economy of the community, mining activities in the region serve as a major source of employment for local people and trigger the establishment of a wide range of small businesses such as transport of minerals, local grocery and food stalls, repair shops etc. 2.25 District Mineral Foundation (DMF) as on 10 October 2016, has been set up in 263 districts across 12 mineral-rich states for welfare of mining-affected communities. It is a trust set up as a non-profit body, in those districts affected by the mining works, to work for the interest and benefit of persons and areas affected by mining-related operations. It is solely funded through the contributions from miners.
2.26 Skill development is an effective way to improve the efficiency of the workforce towards better productivity. It entails fostering the skill-sets that develop employability and add values to the organization. 2.27 The Mining sector in India is gradually transforming with greater emphasis laid on reconnaissance and exploration activities, underground mining, mechanization of current operations, zero waste mining/ mining of associated minerals, etc. This involves skilling of the existing workers on newer skills and technology as well as suitably training the incremental human resource who will be entering the mining sector in the near future. 2.28 In view of the demand of skilled workforce anticipated by the mining industry and in alignment with the Government of India’s target of skilling, Federation of Indian Mineral Industries (FIMI) promoted a separate institution Skill Council for Mining Sector (SCMS) in October, 2013. SCMS is promoting skill development in mining sector and is not only enhancing productivity and safety at workplace, but more importantly also making the workforce ready to adapt to the new technologies and processes being used in the sector. So far, 1,38,705 students have been trained and 1,16,441 have been certified by the SCMS as part of skill development initiative in the country. 2.29 Scientific, sustainable, and transparent mining practices require well-trained manpower. Currently, this sector employs around 0.2 million workforces, which are estimated to grow to 0.3 million in the next ten years.
E – Communities
F – Skill and Technology

18
Mining Matters for India
2.30 Ores and Minerals: The value of exports of ores and minerals was Rs. 2,00,956.9 crores in the year 2016-17 registering an increase of 18% as compared to that of about Rs. 1,70,946 crores in the previous year (2015-16)6. Diamond continued to be the largest constituent item with a share of 82%, i.e., Rs. 1,63,861 crores in the total value of mineral exports in 2016-17. Next in the order of share was iron ore (5.06%), granite with a contribution of 4.66%, followed by aluminium (1.52%). The individual share of remaining minerals in the total value of exports of ores and minerals from India during the year under review was less than 1%. 2.31 The value of exports showed a mixed trend for most of the minerals in 2016-17 as compared to that in the previous year. The quantity of exports of other minerals which showed a significant increase are iron-ore, granite, aluminium, barytes, limestone, zinc ores, and conc., chromite, etc. Whereas bauxite, coal (excluding lignite), titanium ores and conc., garnet (abrasive), etc. decreased as compared to that in the previous year. 2.32 Despite a high geological prospectivity, large quantities of various minerals/ores are imported due to economic consideration or requirement of specific grade to meet the demand for either blending with locally available mineral raw materials and/or for manufacturing special qualities of mineral-based products. To meet the increasing demand for uncut diamonds, emerald and other precious and semiprecious stones by the domestic cutting and polishing industry, India continues to depend on imports of raw uncut stones for their value-added re-exports. Therefore, in the future, mining can and should contribute significantly to exports. If the Government encourages exports, it will increase jobs, bring in higher wages, and raise the standard of living of the people. Exports also increase foreign exchange reserves. 2.33 Revenue to the Government includes royalties, taxes, and duty on mining and downstream commodities. Royalty forms a vital part of fiscal regime for mining, and when properly designed, it is an important means of revenue generation for the Government. Large amount of royalty is accrued in States including Rajasthan, Odisha, Andhra Pradesh, Madhya Pradesh, Karnataka, and
6 Ministry of Mines Annual Report 2017-2018
G – Exports
H – Government revenue and contribution to Gross Domestic Product
Chhattisgarh. The total royalty collected for major minerals for 2017-18 is Rs. 12477.36 crores7. 2.34 As per McKinsey & Company (December 2014)8, in 2012, the mining and downstream industry generated about USD 18 billion in taxes. It could contribute approximately USD 40 to 50 billion as royalties, taxes, and duty by 2025. Mining revenues can significantly boost States revenues in dominant mining states such as Chhattisgarh, Jharkhand, Goa, and Odisha. As per Ministry of Mines, National Mineral Exploration Trust (NMET) collected as percentage (2%) of royalty as on 2nd January, 2018 was Rs. 1,046.45 Crores9. Till November (2017-18), total fund accrued in the Pradhan Mantri Khanij Kshetra Kalyan Yojna (PMKKY) under DMF were Rs. 23,606.11 crores10. Of all the funds accrued, 60 percent have to be spent for drinking water supply, health care, sanitation, education, skill development, women and child care, welfare of aged and disabled people, skill development and environment conservation. The balance funds are to be spent on making roads, bridges, railways, waterways projects, irrigation, and alternative energy sources. It is noteworthy that a big amount of Government revenue comes from the mining sector in India. If the mining sector is encouraged, the Government revenue will also increase which will benefit the whole economy. 2.35 Gross Domestic Product: According to McKinsey and Company report 2014, the output from the mining sector in India could be 1.5 to 2.5 times the current levels by 2025. In the accelerated growth scenario, an additional USD 47 billion could be generated annually compared to the businesses-usual scenario. The performance of the mining sector will be an important factor for India to achieve 8 percent plus GDP growth. The mining industry has the potential to contribute an additional USD 125 billion to India's output and USD 47 billion to India’s GDP by 2025. 2.36 Products that owe their existence to mining include cellphones, laptops, computers, refrigerators, microwave ovens, escalators, elevators, cars, buses, trucks, forks, spoons, clothes, shoes, ships, rocket, jewelry that had to be manufactured by machines. Many components of these items are products of mining.
7 Ministry of Mines 8 Putting Indian on the Growth Path: Unlocking the Mining Potential (December, 2014) prepared by Mckinsey&Company 9 Ministry of Mines Annual Report 2017-2018 10 National Workshop on DMF – PMKKKY conducted by Ministry of Mines on 18th January, 2019 at New Delhi
I – Consumers

19
Mining Matters for India
2.30 Ores and Minerals: The value of exports of ores and minerals was Rs. 2,00,956.9 crores in the year 2016-17 registering an increase of 18% as compared to that of about Rs. 1,70,946 crores in the previous year (2015-16)6. Diamond continued to be the largest constituent item with a share of 82%, i.e., Rs. 1,63,861 crores in the total value of mineral exports in 2016-17. Next in the order of share was iron ore (5.06%), granite with a contribution of 4.66%, followed by aluminium (1.52%). The individual share of remaining minerals in the total value of exports of ores and minerals from India during the year under review was less than 1%. 2.31 The value of exports showed a mixed trend for most of the minerals in 2016-17 as compared to that in the previous year. The quantity of exports of other minerals which showed a significant increase are iron-ore, granite, aluminium, barytes, limestone, zinc ores, and conc., chromite, etc. Whereas bauxite, coal (excluding lignite), titanium ores and conc., garnet (abrasive), etc. decreased as compared to that in the previous year. 2.32 Despite a high geological prospectivity, large quantities of various minerals/ores are imported due to economic consideration or requirement of specific grade to meet the demand for either blending with locally available mineral raw materials and/or for manufacturing special qualities of mineral-based products. To meet the increasing demand for uncut diamonds, emerald and other precious and semiprecious stones by the domestic cutting and polishing industry, India continues to depend on imports of raw uncut stones for their value-added re-exports. Therefore, in the future, mining can and should contribute significantly to exports. If the Government encourages exports, it will increase jobs, bring in higher wages, and raise the standard of living of the people. Exports also increase foreign exchange reserves. 2.33 Revenue to the Government includes royalties, taxes, and duty on mining and downstream commodities. Royalty forms a vital part of fiscal regime for mining, and when properly designed, it is an important means of revenue generation for the Government. Large amount of royalty is accrued in States including Rajasthan, Odisha, Andhra Pradesh, Madhya Pradesh, Karnataka, and
6 Ministry of Mines Annual Report 2017-2018
G – Exports
H – Government revenue and contribution to Gross Domestic Product
Chhattisgarh. The total royalty collected for major minerals for 2017-18 is Rs. 12477.36 crores7. 2.34 As per McKinsey & Company (December 2014)8, in 2012, the mining and downstream industry generated about USD 18 billion in taxes. It could contribute approximately USD 40 to 50 billion as royalties, taxes, and duty by 2025. Mining revenues can significantly boost States revenues in dominant mining states such as Chhattisgarh, Jharkhand, Goa, and Odisha. As per Ministry of Mines, National Mineral Exploration Trust (NMET) collected as percentage (2%) of royalty as on 2nd January, 2018 was Rs. 1,046.45 Crores9. Till November (2017-18), total fund accrued in the Pradhan Mantri Khanij Kshetra Kalyan Yojna (PMKKY) under DMF were Rs. 23,606.11 crores10. Of all the funds accrued, 60 percent have to be spent for drinking water supply, health care, sanitation, education, skill development, women and child care, welfare of aged and disabled people, skill development and environment conservation. The balance funds are to be spent on making roads, bridges, railways, waterways projects, irrigation, and alternative energy sources. It is noteworthy that a big amount of Government revenue comes from the mining sector in India. If the mining sector is encouraged, the Government revenue will also increase which will benefit the whole economy. 2.35 Gross Domestic Product: According to McKinsey and Company report 2014, the output from the mining sector in India could be 1.5 to 2.5 times the current levels by 2025. In the accelerated growth scenario, an additional USD 47 billion could be generated annually compared to the businesses-usual scenario. The performance of the mining sector will be an important factor for India to achieve 8 percent plus GDP growth. The mining industry has the potential to contribute an additional USD 125 billion to India's output and USD 47 billion to India’s GDP by 2025. 2.36 Products that owe their existence to mining include cellphones, laptops, computers, refrigerators, microwave ovens, escalators, elevators, cars, buses, trucks, forks, spoons, clothes, shoes, ships, rocket, jewelry that had to be manufactured by machines. Many components of these items are products of mining.
7 Ministry of Mines 8 Putting Indian on the Growth Path: Unlocking the Mining Potential (December, 2014) prepared by Mckinsey&Company 9 Ministry of Mines Annual Report 2017-2018 10 National Workshop on DMF – PMKKKY conducted by Ministry of Mines on 18th January, 2019 at New Delhi
I – Consumers

20
Mining Matters for India
2.37 We would have the benefits of medicine to help us medicines that are the product of research in labs full of equipment that are the products of mining. We need mining to build buildings, hospitals, and we need mining to create the advanced medical instruments which are the heart of a hospital's ability to cure people. 2.38 The Government of India has launched the “Make in India” program in 2014. Its main goal is to project India as a global manufacturing hub. The “Make in India” initiative is expected to witness significant investments in construction, infrastructure, automobile, shipbuilding and power sectors, which will stimulate new material demand. Use of cost-efficient and competitive finished products will pave the way for infrastructure development and construction activities in the country which cannot be imagined without supply of minerals from a vibrant mining industry. India requires raw materials which comes from mines to create new infrastructure like roads, railway lines, buildings, and bridges and also need it to lay new pipelines for gas, water and sanitation, etc. Hence, we need to mine in India to Make in India. 2.39 There are two types of linkages in the mining industry - backward and forward. Backward linkages from mining represent the local or regional purchase of inputs. These often include food and catering services, electricity, transportation services, and raw materials. In turn, the regional suppliers of mining purchase their own inputs, which further stimulate regional economic activity. Forward linkages from mining represent downstream processing of mineral ores or concentrate, including, for instance, smelting, refining, semi-fabrication, fabrication, and manufacture of products. Final demand linkages describe the income that miners and their households spend on goods and services produced in the region (e.g., groceries, clothing, entertainment, restaurant etc.). 2.40 Finally, fiscal linkages embody the tax and royalty revenues regional Governments use to develop infrastructures such as hospitals and schools and to purchase other goods and services. How large are these linkages between mining and the rest of a regional economy? Economists use measures called multipliers to summarize their estimates of the size of linkages. Job multiplier is a demand-driven planning tool, which is designed to examine the inter-relationship among the productive sectors in the economy. It shows how many new jobs are created in the rest of the regional economy when one new job in the mining industry is created.
K – Linkages and Job Multiplier
J – Make in India and Smart cities
citiesCities
2.41 There are three sectors in the economy, the agriculture, industry, and service. Now if the mining sector’s growth increases, demand for employment in the industry sector (say the mining sector) increases. The direct effect of this is increased employment in the mining sector. As a result, the average disposable income as well as spending of the economy increases, which in turn increase the demand for other sectors (such as agriculture, manufacturing, trade, etc.). New jobs are created in the rest of the sectors. This means that when the demand for agriculture and service sector increases, the number of work hours and employment in agriculture, restaurants, health care, education, and other similar jobs increases as well. Hence, the Government can collect more taxes and royalties from the economy, which, in turn, creates a self-sustaining dominoes effect in the whole economy.
Conceptual Framework
Demand for workers in mining increases
Employment increases in mining sector
Average disposable income as well as spending increases in the economy
Demand for agriculture and services increases
New job created in the rest of the sectors
Self-sustaining dominoes effect in the entire economy
Number of work hours and employment in agriculture, restaurants, health care, education, and other similar jobs increases as well
Growth of the Mining sector increases

21
Mining Matters for India
2.37 We would have the benefits of medicine to help us medicines that are the product of research in labs full of equipment that are the products of mining. We need mining to build buildings, hospitals, and we need mining to create the advanced medical instruments which are the heart of a hospital's ability to cure people. 2.38 The Government of India has launched the “Make in India” program in 2014. Its main goal is to project India as a global manufacturing hub. The “Make in India” initiative is expected to witness significant investments in construction, infrastructure, automobile, shipbuilding and power sectors, which will stimulate new material demand. Use of cost-efficient and competitive finished products will pave the way for infrastructure development and construction activities in the country which cannot be imagined without supply of minerals from a vibrant mining industry. India requires raw materials which comes from mines to create new infrastructure like roads, railway lines, buildings, and bridges and also need it to lay new pipelines for gas, water and sanitation, etc. Hence, we need to mine in India to Make in India. 2.39 There are two types of linkages in the mining industry - backward and forward. Backward linkages from mining represent the local or regional purchase of inputs. These often include food and catering services, electricity, transportation services, and raw materials. In turn, the regional suppliers of mining purchase their own inputs, which further stimulate regional economic activity. Forward linkages from mining represent downstream processing of mineral ores or concentrate, including, for instance, smelting, refining, semi-fabrication, fabrication, and manufacture of products. Final demand linkages describe the income that miners and their households spend on goods and services produced in the region (e.g., groceries, clothing, entertainment, restaurant etc.). 2.40 Finally, fiscal linkages embody the tax and royalty revenues regional Governments use to develop infrastructures such as hospitals and schools and to purchase other goods and services. How large are these linkages between mining and the rest of a regional economy? Economists use measures called multipliers to summarize their estimates of the size of linkages. Job multiplier is a demand-driven planning tool, which is designed to examine the inter-relationship among the productive sectors in the economy. It shows how many new jobs are created in the rest of the regional economy when one new job in the mining industry is created.
K – Linkages and Job Multiplier
J – Make in India and Smart cities
citiesCities
2.41 There are three sectors in the economy, the agriculture, industry, and service. Now if the mining sector’s growth increases, demand for employment in the industry sector (say the mining sector) increases. The direct effect of this is increased employment in the mining sector. As a result, the average disposable income as well as spending of the economy increases, which in turn increase the demand for other sectors (such as agriculture, manufacturing, trade, etc.). New jobs are created in the rest of the sectors. This means that when the demand for agriculture and service sector increases, the number of work hours and employment in agriculture, restaurants, health care, education, and other similar jobs increases as well. Hence, the Government can collect more taxes and royalties from the economy, which, in turn, creates a self-sustaining dominoes effect in the whole economy.
Conceptual Framework
Demand for workers in mining increases
Employment increases in mining sector
Average disposable income as well as spending increases in the economy
Demand for agriculture and services increases
New job created in the rest of the sectors
Self-sustaining dominoes effect in the entire economy
Number of work hours and employment in agriculture, restaurants, health care, education, and other similar jobs increases as well
Growth of the Mining sector increases

22
Mining Matters for India
S. No.
Country Mining
1 India 10 2 Brazil 13 3 Scotland 2.5 4 United States For coal mining (4.4) and Metal mining and for
non-metallic minerals, except fuels (7) 5 Chile 7 6 Ghana 28 7 Western Australia 2 8 Canada 2
Source: Literature review for IFC jobs study, available at www.ifc.orgjobcreation11 1. India: In India, the ratio of direct to indirect employment in the mining sector is 1:10, i.e., for every job created in the mining sector another 10 jobs (indirect jobs) are generated along the supply chain. However, in Gujarat and West Bengal, employment multiplier in the mining sector is approximately 3 and 6 respectively.
Sector Names Employment multiplier Gujarat West Bengal
Mining 2.623 6.053 Bricks, Tiles (Structural Clay Products) 2.817 6.927 Cement 2.691 5.721 Non-Metallic Mineral Products 2.768 6.069 Iron and Steel (Ferro Alloys and Casting and Forging) 2.641 5.532 Iron and Steel Foundries 2.708 5.587 Source: ILO Geneva, 201512
11 www.ifc.orgjobcreation 12 Employment Dimension of Infrastructure Investment : State level input-output analysis – ILO Employment Working Paper No. 168 (2015)
Table – II (g) State-wise (Gujarat and West Bengal)
employment multiplier in India
Table – II (f)
Employment multipliers for indirect and induced job creation in the mining sector
Job multiplier in mining: Case studies
2. Brazil: A total of 175,000 workers were employed in the mining sector in 2011. Studies conducted by Brazil’s Ministry of Mines and Energy’s Secretariat for Geology, Mining and Mineral Processing show that the multiplier effect of job creation is 1:13 in the mining sector, i.e., for every job created in the mining sector another 13 jobs (indirect jobs) are generated along the supply chain in Brazil. 3. Scotland: Employment multiplier is 2.5, meaning that one direct job in mining may generate 2.5 additional jobs in Scotland. 4. United States: According to the U.S. Bureau of Economic Analysis Industry multiplier data, coal mining has an employment multiplier of 4.4. For metal mining and non-metallic minerals, except fuels, the employment multiplier is 7. If employment increases by one job in the coal sector, then 4.4 other jobs are created throughout the economy. Similarly, if employment increases by one job in metal mining and non-metallic mineral (except fuel), then 7 other jobs are created throughout the economy in the U.S.A. 5. Chile: Employment multiplier is 7, meaning that one direct job in mining may generate 7 additional jobs in the economy in Chile. 6. Ghana: Employment multiplier is 28, meaning that one direct job in mining may generate 28 additional jobs in the economy in Ghana. 7. Western Australia: Eggert (2001) notes that previous analyses of mining impacts in Western Australia indicate an employment multiplier of 2. 8. Canada: In British Columbia in Canada, the employment multiplier has been estimated at around 213. From the above analysis, it can be concluded that the employment multiplier is higher in a labour-intensive country (such as India, Brazil, Ghana) compared to a capital intensive country (Canada, Western Australia).
________
13 Mining, Regional Development and Benefit Sharing published by Lulea University of Technology, 2014.

23
Mining Matters for India
S. No.
Country Mining
1 India 10 2 Brazil 13 3 Scotland 2.5 4 United States For coal mining (4.4) and Metal mining and for
non-metallic minerals, except fuels (7) 5 Chile 7 6 Ghana 28 7 Western Australia 2 8 Canada 2
Source: Literature review for IFC jobs study, available at www.ifc.orgjobcreation11 1. India: In India, the ratio of direct to indirect employment in the mining sector is 1:10, i.e., for every job created in the mining sector another 10 jobs (indirect jobs) are generated along the supply chain. However, in Gujarat and West Bengal, employment multiplier in the mining sector is approximately 3 and 6 respectively.
Sector Names Employment multiplier Gujarat West Bengal
Mining 2.623 6.053 Bricks, Tiles (Structural Clay Products) 2.817 6.927 Cement 2.691 5.721 Non-Metallic Mineral Products 2.768 6.069 Iron and Steel (Ferro Alloys and Casting and Forging) 2.641 5.532 Iron and Steel Foundries 2.708 5.587 Source: ILO Geneva, 201512
11 www.ifc.orgjobcreation 12 Employment Dimension of Infrastructure Investment : State level input-output analysis – ILO Employment Working Paper No. 168 (2015)
Table – II (g) State-wise (Gujarat and West Bengal)
employment multiplier in India
Table – II (f)
Employment multipliers for indirect and induced job creation in the mining sector
Job multiplier in mining: Case studies
2. Brazil: A total of 175,000 workers were employed in the mining sector in 2011. Studies conducted by Brazil’s Ministry of Mines and Energy’s Secretariat for Geology, Mining and Mineral Processing show that the multiplier effect of job creation is 1:13 in the mining sector, i.e., for every job created in the mining sector another 13 jobs (indirect jobs) are generated along the supply chain in Brazil. 3. Scotland: Employment multiplier is 2.5, meaning that one direct job in mining may generate 2.5 additional jobs in Scotland. 4. United States: According to the U.S. Bureau of Economic Analysis Industry multiplier data, coal mining has an employment multiplier of 4.4. For metal mining and non-metallic minerals, except fuels, the employment multiplier is 7. If employment increases by one job in the coal sector, then 4.4 other jobs are created throughout the economy. Similarly, if employment increases by one job in metal mining and non-metallic mineral (except fuel), then 7 other jobs are created throughout the economy in the U.S.A. 5. Chile: Employment multiplier is 7, meaning that one direct job in mining may generate 7 additional jobs in the economy in Chile. 6. Ghana: Employment multiplier is 28, meaning that one direct job in mining may generate 28 additional jobs in the economy in Ghana. 7. Western Australia: Eggert (2001) notes that previous analyses of mining impacts in Western Australia indicate an employment multiplier of 2. 8. Canada: In British Columbia in Canada, the employment multiplier has been estimated at around 213. From the above analysis, it can be concluded that the employment multiplier is higher in a labour-intensive country (such as India, Brazil, Ghana) compared to a capital intensive country (Canada, Western Australia).
________
13 Mining, Regional Development and Benefit Sharing published by Lulea University of Technology, 2014.

III – MINING INDUSTRY AT CROSS ROADS – NEEDS REVIVAL
(A) – AN OVERVIEW OF MINERAL POLICY
For any industry to play its role, what is most important is a consistent long-term supportive policy so that it can deliver. Unfortunately, India has been lacking this. A brief review of the mineral policy will illustrate this: 3.2 Without going into distant past, prior to MMDR Amendment Act, 2015, mineral policy was governed by the MMDR Act, 1957 which was amended in December 1999 following B B Tandon Committee Report in January 1998. The Act provided reconnaissance permit (RP) for a total area of 10,000 sq. km to a firm for a period not exceeding 3 years provided a single RP will not be more than 5000 sq. km. A prospecting license (PL) would be for 25 sq. km for a period of 3 years extendable by another 2 years if required. Mining license which will be for 10 sq. km. for a maximum period of 30 years which may be renewed for another 20 years. In February 2000, 100% FDI was allowed in mining sector. 3.3 Following this amendment there was a spate of applications for RP / PL but none could reach next stage for one reason or other. The reasons adduced by State Governments have been varied and tepid. Some of these reasons are that the area has been reserved for their public sector units (reservation was done after application was made for RP / PL); areas applied for PL (after expiry of RP) is adjacent to the area of their PSUs; GSI has shown interest in their area; and lastly denial of environment or forest clearance. The Central Government has been mute spectator to the death-knell of the policy. 3.4 To make mining more attractive and in tune with international practice, a high powered Committee, popularly known as Hoda Committee, was set up following which National Mineral Policy (NMP) was revised in March 2008. The Policy gave private sector a primary role for exploration and emphasised that “In order to make the regulatory environment conducive to private investment the procedures for grant of mineral concessions of all types, such as Reconnaissance Permits, Prospecting Licenses and Mining Leases, shall be transparent and seamless and security of tenure shall be guaranteed to the concessionaires. The first-in-time principle in the case of sole applicants and the selection criteria in the case of multiple applicants will be appropriately elaborated. Prospecting and mining shall be recognized as independent activities with transferability of concessions playing a key role in mineral sector development. (para 3.3)”. This Policy remained only on paper and never saw the light of the day.

25
Mining Matters for India
III – MINING INDUSTRY AT CROSS ROADS – NEEDS REVIVAL
(A) – AN OVERVIEW OF MINERAL POLICY
For any industry to play its role, what is most important is a consistent long-term supportive policy so that it can deliver. Unfortunately, India has been lacking this. A brief review of the mineral policy will illustrate this: 3.2 Without going into distant past, prior to MMDR Amendment Act, 2015, mineral policy was governed by the MMDR Act, 1957 which was amended in December 1999 following B B Tandon Committee Report in January 1998. The Act provided reconnaissance permit (RP) for a total area of 10,000 sq. km to a firm for a period not exceeding 3 years provided a single RP will not be more than 5000 sq. km. A prospecting license (PL) would be for 25 sq. km for a period of 3 years extendable by another 2 years if required. Mining license which will be for 10 sq. km. for a maximum period of 30 years which may be renewed for another 20 years. In February 2000, 100% FDI was allowed in mining sector. 3.3 Following this amendment there was a spate of applications for RP / PL but none could reach next stage for one reason or other. The reasons adduced by State Governments have been varied and tepid. Some of these reasons are that the area has been reserved for their public sector units (reservation was done after application was made for RP / PL); areas applied for PL (after expiry of RP) is adjacent to the area of their PSUs; GSI has shown interest in their area; and lastly denial of environment or forest clearance. The Central Government has been mute spectator to the death-knell of the policy. 3.4 To make mining more attractive and in tune with international practice, a high powered Committee, popularly known as Hoda Committee, was set up following which National Mineral Policy (NMP) was revised in March 2008. The Policy gave private sector a primary role for exploration and emphasised that “In order to make the regulatory environment conducive to private investment the procedures for grant of mineral concessions of all types, such as Reconnaissance Permits, Prospecting Licenses and Mining Leases, shall be transparent and seamless and security of tenure shall be guaranteed to the concessionaires. The first-in-time principle in the case of sole applicants and the selection criteria in the case of multiple applicants will be appropriately elaborated. Prospecting and mining shall be recognized as independent activities with transferability of concessions playing a key role in mineral sector development. (para 3.3)”. This Policy remained only on paper and never saw the light of the day.

26
Mining Matters for India
3.5 As per MMDR (Amendment) Act 2015, effective from 12th January, 2015, all mining leases (ML) shall be granted for 50 years. All the mining leases granted before 12-01-2015 shall be deemed to have been granted for 50 years. The existing non-captive mines shall be deemed to be expiring on 31-03-2020 and captive mines till 31-03-2030. On the expiry of the lease period, the lease shall be put up for auction but captive mines will have the right of first refusal. Further grant of ML of notified minerals (bauxite, iron ore, limestone, and manganese ore) shall be through auction. However, where there is inadequate evidence of the existence of mineral content of any notified mineral in any area, PL-cum-ML can be granted through auction. With the previous approval of the Central Government for other than notified minerals, grant of prospecting-cum-mining lease (PL-cum-ML) will also be through auction but in case if there is evidence to show the existence of mineral contents, the State Government can also grant a mining lease for minerals other than notified minerals. Non-Exclusive Reconnaissance Permits (NERP) may be granted for any notified or non-notified minerals but the holder of NERP shall not be entitled to make any claim for PL-cum-ML. As if this is not enough, NERP Rules 2015 state that “The grant of a non- exclusive reconnaissance permit over any area shall not prohibit the State Government from notifying all or any part of such area for grant of a mining lease or a prospecting licence-cum-mining lease and upon such notification the validity of all non-exclusive reconnaissance permits over such notified area will stand automatically terminated.” (Rule 3(11)). Incidentally, these provisions do not apply to public sector units whom the State Governments can grant lease with provision for renewals. 3.6 As per provisions of Mineral (Auction) Rules, 2015, the successful bidder has to make an upfront payment for mining lease of 0.50% and another 0.50% as performance security of the value of estimated resource in lease area. The performance security shall be adjusted every five years so that it continues to correspond to 0.50% of the reassessed value of estimated resources. More or less same provisions apply to composite PL-cum-ML. All this is in addition to the payment of royalty which are highest in the world. Further, there is provision for a static Mine Development and Production Agreement (MDPA). This is a strange agreement for an industry which is subject to frequent booms and depressions. 3.7 As if this is not enough, the MMDR (Amendment) Act, 2015 has also introduced levies in addition to royalty, upfront payment and performance security:
─ payment to District Mineral Foundation (DMF) @ 30% of royalty for mining leases granted before 12th January, 2015 and 10% for ML and PL-cum-ML acquired through auction on or after 12th January, 2015.
Current policy
(B) – HIGH INCIDENCE OF TAXES AND LEVIES
─ Auction price (base price + premium) ─ Additional payment equal to 80% of the royalty in case of
transfer of captive leases. ─ payment of 2% of royalty to National Mineral Exploration
Trust (NMET). ─ GST at the rate of 18% of royalty w.e.f. 01-07-2017
3.8 All these stipulations are enough to make mining unviable. This is borne out by the fact that initial euphoria in coal waned after sometime and in the case of non-coal, out of 116 blocks of various minerals offered, auction of only 64 could be achieved and in some of the cases, the land belonged to the lessee. All these inputs are enough for Fraser Institute’s Annual Survey of Mining Companies 2016, India was among the 10 least attractive jurisdictions globally (97th out of 104) in terms of Investment Attractiveness Index for mining and exploration. In 2017 and 2018 Surveys, there was hardly any response (less than 5) and India was not even in reckoning. This is an eloquent epilogue on the Indian mining.
3.9 India has a complex mix of corporate and mining taxes administered by different authorities. The following table brings out the corporate income tax and royalty on some minerals in 2009 and 2014 respectively.
(i) Corporate Income Tax and Royalty regime

27
Mining Matters for India
3.5 As per MMDR (Amendment) Act 2015, effective from 12th January, 2015, all mining leases (ML) shall be granted for 50 years. All the mining leases granted before 12-01-2015 shall be deemed to have been granted for 50 years. The existing non-captive mines shall be deemed to be expiring on 31-03-2020 and captive mines till 31-03-2030. On the expiry of the lease period, the lease shall be put up for auction but captive mines will have the right of first refusal. Further grant of ML of notified minerals (bauxite, iron ore, limestone, and manganese ore) shall be through auction. However, where there is inadequate evidence of the existence of mineral content of any notified mineral in any area, PL-cum-ML can be granted through auction. With the previous approval of the Central Government for other than notified minerals, grant of prospecting-cum-mining lease (PL-cum-ML) will also be through auction but in case if there is evidence to show the existence of mineral contents, the State Government can also grant a mining lease for minerals other than notified minerals. Non-Exclusive Reconnaissance Permits (NERP) may be granted for any notified or non-notified minerals but the holder of NERP shall not be entitled to make any claim for PL-cum-ML. As if this is not enough, NERP Rules 2015 state that “The grant of a non- exclusive reconnaissance permit over any area shall not prohibit the State Government from notifying all or any part of such area for grant of a mining lease or a prospecting licence-cum-mining lease and upon such notification the validity of all non-exclusive reconnaissance permits over such notified area will stand automatically terminated.” (Rule 3(11)). Incidentally, these provisions do not apply to public sector units whom the State Governments can grant lease with provision for renewals. 3.6 As per provisions of Mineral (Auction) Rules, 2015, the successful bidder has to make an upfront payment for mining lease of 0.50% and another 0.50% as performance security of the value of estimated resource in lease area. The performance security shall be adjusted every five years so that it continues to correspond to 0.50% of the reassessed value of estimated resources. More or less same provisions apply to composite PL-cum-ML. All this is in addition to the payment of royalty which are highest in the world. Further, there is provision for a static Mine Development and Production Agreement (MDPA). This is a strange agreement for an industry which is subject to frequent booms and depressions. 3.7 As if this is not enough, the MMDR (Amendment) Act, 2015 has also introduced levies in addition to royalty, upfront payment and performance security:
─ payment to District Mineral Foundation (DMF) @ 30% of royalty for mining leases granted before 12th January, 2015 and 10% for ML and PL-cum-ML acquired through auction on or after 12th January, 2015.
Current policy
(B) – HIGH INCIDENCE OF TAXES AND LEVIES
─ Auction price (base price + premium) ─ Additional payment equal to 80% of the royalty in case of
transfer of captive leases. ─ payment of 2% of royalty to National Mineral Exploration
Trust (NMET). ─ GST at the rate of 18% of royalty w.e.f. 01-07-2017
3.8 All these stipulations are enough to make mining unviable. This is borne out by the fact that initial euphoria in coal waned after sometime and in the case of non-coal, out of 116 blocks of various minerals offered, auction of only 64 could be achieved and in some of the cases, the land belonged to the lessee. All these inputs are enough for Fraser Institute’s Annual Survey of Mining Companies 2016, India was among the 10 least attractive jurisdictions globally (97th out of 104) in terms of Investment Attractiveness Index for mining and exploration. In 2017 and 2018 Surveys, there was hardly any response (less than 5) and India was not even in reckoning. This is an eloquent epilogue on the Indian mining.
3.9 India has a complex mix of corporate and mining taxes administered by different authorities. The following table brings out the corporate income tax and royalty on some minerals in 2009 and 2014 respectively.
(i) Corporate Income Tax and Royalty regime

28
Mining Matters for India
3.10 It would be interesting to note that just as commodity melt-down was starting, India steeply increased royalty rates on all minerals which made the export of some of the commodities like iron ore and chrome ore (which were already reeling under 30% export duty effective from December 2011) unviable.
3.11 These taxes and royalty rates have to be viewed in the context of international scenario.
Chart – III
Status of Corporate Income and Royalty Rates
Country
Corporate income
tax
Mining taxes and royalties Method Coal Gold Iron ore
Australia 30% R 2.75%-15% 2.5%-5% 2.5%-5%
Brazil 25% R 2% 1% 2%
Canada 25%-31% P 2%-16% 2%-16% 2%-16%
Chile 20% P 0-14% 0-14% 0-20%
China 25% R 0.5%-4% 0.5%-4% 0.5%-4%
Ghana 25% R 5.00% 5.00% 5.00%
Indonesia 25% R 3-7% 3.75% 4.00%
Mexico 30% P 7.50% 8.00% 7.50%
Mongolia 10-25% R 2.5-7.5% 5%-7.5% 5%-30%
Peru 30% P 1%-12% 6%-21.5% 6%-21.5%
South Africa 28% R 0.5%-7.0% 0.5%-7.0% 0.5%-7.0%
US 40% P/R 8%-12.5% 4%-10% 4%-10%
India 34% R 14% 4% of LME 15%
Global average 2014 23.57%
Key R: Revenue basis P: profit or net basis Source: Mining Tax Databook, KSG, August 2014; For India: Ministry of Mines and Ministry of Coal 3.12 The following table brings out the vast gap in effective tax rate in India vis-à-vis other resource-rich countries. The calculations in the following table has been made on an iron ore mine after assuming same capital and operating costs of all countries based on available information on all sorts of taxes.
Table – III
Navigating the Royalty Maze: International Comparison

29
Mining Matters for India
3.10 It would be interesting to note that just as commodity melt-down was starting, India steeply increased royalty rates on all minerals which made the export of some of the commodities like iron ore and chrome ore (which were already reeling under 30% export duty effective from December 2011) unviable.
3.11 These taxes and royalty rates have to be viewed in the context of international scenario.
Chart – III
Status of Corporate Income and Royalty Rates
Country
Corporate income
tax
Mining taxes and royalties Method Coal Gold Iron ore
Australia 30% R 2.75%-15% 2.5%-5% 2.5%-5%
Brazil 25% R 2% 1% 2%
Canada 25%-31% P 2%-16% 2%-16% 2%-16%
Chile 20% P 0-14% 0-14% 0-20%
China 25% R 0.5%-4% 0.5%-4% 0.5%-4%
Ghana 25% R 5.00% 5.00% 5.00%
Indonesia 25% R 3-7% 3.75% 4.00%
Mexico 30% P 7.50% 8.00% 7.50%
Mongolia 10-25% R 2.5-7.5% 5%-7.5% 5%-30%
Peru 30% P 1%-12% 6%-21.5% 6%-21.5%
South Africa 28% R 0.5%-7.0% 0.5%-7.0% 0.5%-7.0%
US 40% P/R 8%-12.5% 4%-10% 4%-10%
India 34% R 14% 4% of LME 15%
Global average 2014 23.57%
Key R: Revenue basis P: profit or net basis Source: Mining Tax Databook, KSG, August 2014; For India: Ministry of Mines and Ministry of Coal 3.12 The following table brings out the vast gap in effective tax rate in India vis-à-vis other resource-rich countries. The calculations in the following table has been made on an iron ore mine after assuming same capital and operating costs of all countries based on available information on all sorts of taxes.
Table – III
Navigating the Royalty Maze: International Comparison
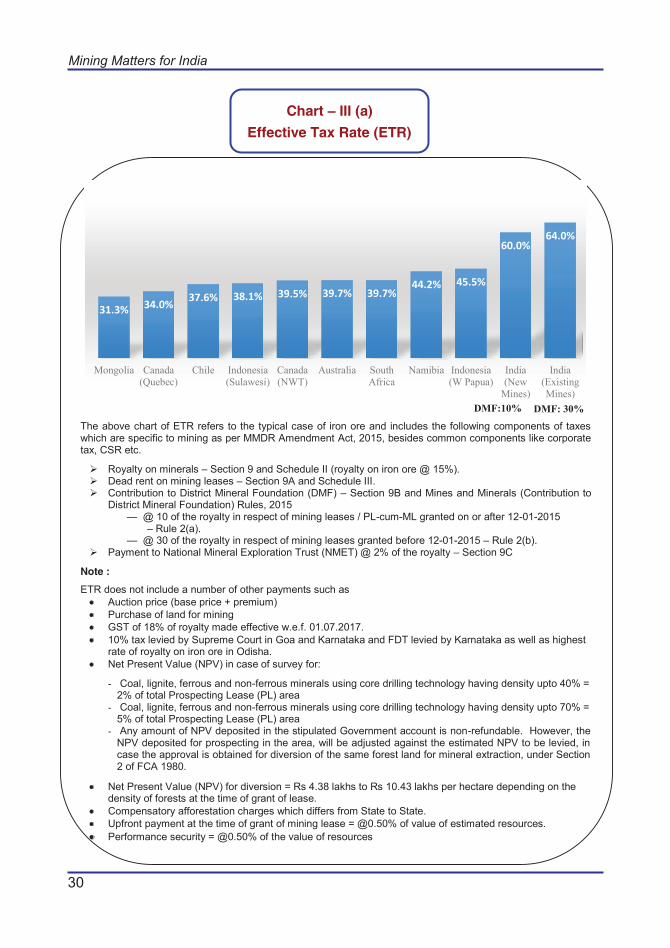
30
Mining Matters for India
The above chart of ETR refers to the typical case of iron ore and includes the following components of taxes which are specific to mining as per MMDR Amendment Act, 2015, besides common components like corporate tax, CSR etc.
Royalty on minerals – Section 9 and Schedule II (royalty on iron ore @ 15%). Dead rent on mining leases – Section 9A and Schedule III. Contribution to District Mineral Foundation (DMF) – Section 9B and Mines and Minerals (Contribution to
District Mineral Foundation) Rules, 2015 — @ 10 of the royalty in respect of mining leases / PL-cum-ML granted on or after 12-01-2015 – Rule 2(a). — @ 30 of the royalty in respect of mining leases granted before 12-01-2015 – Rule 2(b).
Payment to National Mineral Exploration Trust (NMET) @ 2% of the royalty – Section 9C
Note :
ETR does not include a number of other payments such as Auction price (base price + premium) Purchase of land for mining GST of 18% of royalty made effective w.e.f. 01.07.2017. 10% tax levied by Supreme Court in Goa and Karnataka and FDT levied by Karnataka as well as highest
rate of royalty on iron ore in Odisha. Net Present Value (NPV) in case of survey for:
- Coal, lignite, ferrous and non-ferrous minerals using core drilling technology having density upto 40% = 2% of total Prospecting Lease (PL) area
- Coal, lignite, ferrous and non-ferrous minerals using core drilling technology having density upto 70% = 5% of total Prospecting Lease (PL) area
- Any amount of NPV deposited in the stipulated Government account is non-refundable. However, the NPV deposited for prospecting in the area, will be adjusted against the estimated NPV to be levied, in case the approval is obtained for diversion of the same forest land for mineral extraction, under Section 2 of FCA 1980.
Net Present Value (NPV) for diversion = Rs 4.38 lakhs to Rs 10.43 lakhs per hectare depending on the density of forests at the time of grant of lease.
Compensatory afforestation charges which differs from State to State. Upfront payment at the time of grant of mining lease = @0.50% of value of estimated resources. Performance security = @0.50% of the value of resources
31.3% 34.0%37.6% 38.1% 39.5% 39.7% 39.7%
44.2% 45.5%
60.0%64.0%
Mongolia Canada(Quebec)
Chile Indonesia(Sulawesi)
Canada(NWT)
Australia SouthAfrica
Namibia Indonesia(W Papua)
India(New
Mines)
India(ExistingMines)
DMF:10% DMF: 30%
Chart – III (a)
Effective Tax Rate (ETR)
3.13 In addition to various taxes / levies detailed above, the existing mines have to give bank guarantee for financial assurance for progressive mine closure plan. These are Rs. 3 lakhs per hectare (minimum Rs. 10 lakhs) for 'A' category mines and Rs. 2 lakh per hectare (minimum Rs. 5 lakhs) for 'B' category mine. No financial assurance is required for leases granted through auctions where Mine Development and Production Agreement (MDPA) has to be signed. 3.14 The final scenario which emerges as regards royalty and other taxation [post auctions] in a typical case study of iron ore mine is as under:
Note: This table is restricted to only auction, royalty, DMF and NMET. It excludes all kinds of taxes/levies under other Acts, i.e., corporate income tax and other taxes/levies imposed by local bodies, net present value (NPV) and compensatory afforestation (CA) charges if area is under forest.
15% 15% 15% 15%4.50% 1.50% 1.50%
0.30%0.30%
0.30%36.70%
275%
0%
50%
100%
150%
200%
250%
300%
350%
Pre-MMDRAmendment
Mine A Mine B Mine C
Scenario pre and post-Act : Case Study of Iron-ore mines
Royalty DMF NMET Auction Commitment
Chart – III (b)
Royalty and Taxation Scenario post auctions : Case study – iron ore
(ii) Overall impact after obtaining mining lease
Mine A – Iron-ore mine granted prior to Act Mine B – Auctioned mine with lowest bid 36.70% (ML No. 2566, Chitradurga, Karnataka) Mine C – Auctioned mine with highest bid 275% (Pratappura Iron-ore Block, Madhya Pradesh)

31
Mining Matters for India
The above chart of ETR refers to the typical case of iron ore and includes the following components of taxes which are specific to mining as per MMDR Amendment Act, 2015, besides common components like corporate tax, CSR etc.
Royalty on minerals – Section 9 and Schedule II (royalty on iron ore @ 15%). Dead rent on mining leases – Section 9A and Schedule III. Contribution to District Mineral Foundation (DMF) – Section 9B and Mines and Minerals (Contribution to
District Mineral Foundation) Rules, 2015 — @ 10 of the royalty in respect of mining leases / PL-cum-ML granted on or after 12-01-2015 – Rule 2(a). — @ 30 of the royalty in respect of mining leases granted before 12-01-2015 – Rule 2(b).
Payment to National Mineral Exploration Trust (NMET) @ 2% of the royalty – Section 9C
Note :
ETR does not include a number of other payments such as Auction price (base price + premium) Purchase of land for mining GST of 18% of royalty made effective w.e.f. 01.07.2017. 10% tax levied by Supreme Court in Goa and Karnataka and FDT levied by Karnataka as well as highest
rate of royalty on iron ore in Odisha. Net Present Value (NPV) in case of survey for:
- Coal, lignite, ferrous and non-ferrous minerals using core drilling technology having density upto 40% = 2% of total Prospecting Lease (PL) area
- Coal, lignite, ferrous and non-ferrous minerals using core drilling technology having density upto 70% = 5% of total Prospecting Lease (PL) area
- Any amount of NPV deposited in the stipulated Government account is non-refundable. However, the NPV deposited for prospecting in the area, will be adjusted against the estimated NPV to be levied, in case the approval is obtained for diversion of the same forest land for mineral extraction, under Section 2 of FCA 1980.
Net Present Value (NPV) for diversion = Rs 4.38 lakhs to Rs 10.43 lakhs per hectare depending on the density of forests at the time of grant of lease.
Compensatory afforestation charges which differs from State to State. Upfront payment at the time of grant of mining lease = @0.50% of value of estimated resources. Performance security = @0.50% of the value of resources
31.3% 34.0%37.6% 38.1% 39.5% 39.7% 39.7%
44.2% 45.5%
60.0%64.0%
Mongolia Canada(Quebec)
Chile Indonesia(Sulawesi)
Canada(NWT)
Australia SouthAfrica
Namibia Indonesia(W Papua)
India(New
Mines)
India(ExistingMines)
DMF:10% DMF: 30%
Chart – III (a)
Effective Tax Rate (ETR)
3.13 In addition to various taxes / levies detailed above, the existing mines have to give bank guarantee for financial assurance for progressive mine closure plan. These are Rs. 3 lakhs per hectare (minimum Rs. 10 lakhs) for 'A' category mines and Rs. 2 lakh per hectare (minimum Rs. 5 lakhs) for 'B' category mine. No financial assurance is required for leases granted through auctions where Mine Development and Production Agreement (MDPA) has to be signed. 3.14 The final scenario which emerges as regards royalty and other taxation [post auctions] in a typical case study of iron ore mine is as under:
Note: This table is restricted to only auction, royalty, DMF and NMET. It excludes all kinds of taxes/levies under other Acts, i.e., corporate income tax and other taxes/levies imposed by local bodies, net present value (NPV) and compensatory afforestation (CA) charges if area is under forest.
15% 15% 15% 15%4.50% 1.50% 1.50%
0.30%0.30%
0.30%36.70%
275%
0%
50%
100%
150%
200%
250%
300%
350%
Pre-MMDRAmendment
Mine A Mine B Mine C
Scenario pre and post-Act : Case Study of Iron-ore mines
Royalty DMF NMET Auction Commitment
Chart – III (b)
Royalty and Taxation Scenario post auctions : Case study – iron ore
(ii) Overall impact after obtaining mining lease
Mine A – Iron-ore mine granted prior to Act Mine B – Auctioned mine with lowest bid 36.70% (ML No. 2566, Chitradurga, Karnataka) Mine C – Auctioned mine with highest bid 275% (Pratappura Iron-ore Block, Madhya Pradesh)

32
Mining Matters for India
3.15 Any interference with market forces creates abnormality. Auction therefore created artificial scarcity and led to distortion in the shape of higher bidding prices. Despite Hoda Committee’s recommendations for auction for fully explored surfacial deposits, National Mineral Policy, 2008 did not accept “auction” as a matter of Policy.
3.16 It also gave the wrong impression to the State / Central Governments that there is a lot of margin with the mining industry and encouraged it to impose more taxes so much so that the industry became unviable. 3.17 In course of time, auction regime failed even in the case of surfacial deposits as can be seen from the current status of the auctioning of mineral blocks (Table III (a) and Table III (b)):
Total concessions (including ML and PL-cum-ML) offered for auction
116 -
Actually auctioned 64 8 — Prospecting Licence-cum-Mining Lease (PL-cum-ML) 56 — Mining Lease (42 Greenfield + 14 ‘C’ Category iron ore mines of Karnataka)
— PL-cum-ML (composite license) granted
— Execution of MLs (Greenfield blocks)
— Execution of ML for ‘C’ category iron ore mines of Karnataka
1 license
NIL
3
Out of 8 PL-cum-ML No ML has been executed out of 42 Greenfield auctioned mineral blocks. These are from 14 ‘C’ category mines auctioned in Karnataka which were already operational earlier and where the Hon’ble Supreme Court had ruled that FC and EC granted to earlier operational lessees will automatically be transferred to successful bidder.
Table – III (a)
Status of auctioned non-coal mineral blocks (as on 23rd May, 2019)
(iii) Effect on Auction
Cancelled by Hon’ble Supreme Court
204 -
Net auctioned and allotted 79
31 auctioned (but allotment of 6 auctioned coal mines was cancelled). Net effective mine auctioned to private sector are 25 only.
Balance 54 allotted to Public Sector Undertakings Operational coal mines 24 Producing + underdevelopment (both public and
private sector)
Coal producing mines 16
13 mines are from 42 Schedule II mines which were already operational / under development prior to cancellation of coal blocks and where EC / FC are transferable as per judgment of the Hon’ble Supreme Court.
Balance 3 mines are from the Schedule III mines where some advancement was made for development prior to their cancellation.
3.18 The other main reason for failure of auction regime, apart from the procedures to be followed after auction (e.g. Environment clearance (EC) / Forest clearance (FC), land acquisition etc.), is excessive tax burden, undoubtedly the highest in the world.
3.19 All these imposts make raw materials costly and unviable. It would infact be cheaper to import. 3.20 One man’s products are another man’s raw materials. Since these raw material result in making intermediate products costly, they will also result in making final / downstream products, many of which are exported, more costly and uncompetitive.
Table – III (b)
Status of auctioned / allotted coal mines (as on 6th March, 2019)

33
Mining Matters for India
3.15 Any interference with market forces creates abnormality. Auction therefore created artificial scarcity and led to distortion in the shape of higher bidding prices. Despite Hoda Committee’s recommendations for auction for fully explored surfacial deposits, National Mineral Policy, 2008 did not accept “auction” as a matter of Policy.
3.16 It also gave the wrong impression to the State / Central Governments that there is a lot of margin with the mining industry and encouraged it to impose more taxes so much so that the industry became unviable. 3.17 In course of time, auction regime failed even in the case of surfacial deposits as can be seen from the current status of the auctioning of mineral blocks (Table III (a) and Table III (b)):
Total concessions (including ML and PL-cum-ML) offered for auction
116 -
Actually auctioned 64 8 — Prospecting Licence-cum-Mining Lease (PL-cum-ML) 56 — Mining Lease (42 Greenfield + 14 ‘C’ Category iron ore mines of Karnataka)
— PL-cum-ML (composite license) granted
— Execution of MLs (Greenfield blocks)
— Execution of ML for ‘C’ category iron ore mines of Karnataka
1 license
NIL
3
Out of 8 PL-cum-ML No ML has been executed out of 42 Greenfield auctioned mineral blocks. These are from 14 ‘C’ category mines auctioned in Karnataka which were already operational earlier and where the Hon’ble Supreme Court had ruled that FC and EC granted to earlier operational lessees will automatically be transferred to successful bidder.
Table – III (a)
Status of auctioned non-coal mineral blocks (as on 23rd May, 2019)
(iii) Effect on Auction
Cancelled by Hon’ble Supreme Court
204 -
Net auctioned and allotted 79
31 auctioned (but allotment of 6 auctioned coal mines was cancelled). Net effective mine auctioned to private sector are 25 only.
Balance 54 allotted to Public Sector Undertakings Operational coal mines 24 Producing + underdevelopment (both public and
private sector)
Coal producing mines 16
13 mines are from 42 Schedule II mines which were already operational / under development prior to cancellation of coal blocks and where EC / FC are transferable as per judgment of the Hon’ble Supreme Court.
Balance 3 mines are from the Schedule III mines where some advancement was made for development prior to their cancellation.
3.18 The other main reason for failure of auction regime, apart from the procedures to be followed after auction (e.g. Environment clearance (EC) / Forest clearance (FC), land acquisition etc.), is excessive tax burden, undoubtedly the highest in the world.
3.19 All these imposts make raw materials costly and unviable. It would infact be cheaper to import. 3.20 One man’s products are another man’s raw materials. Since these raw material result in making intermediate products costly, they will also result in making final / downstream products, many of which are exported, more costly and uncompetitive.
Table – III (b)
Status of auctioned / allotted coal mines (as on 6th March, 2019)

34
Mining Matters for India
(C) – REPERCUSSIONS OF EXPIRY OF NON-CAPTIVE MINING LEASES
ON 31st MARCH, 2020
3.21 Position as on 31-03-2020 :
S. No. State Working
Mines
Non-Working
Mines
Total Mines
Total Auctionable
Mines 1. Andhra Pradesh 3 6 9 9 2. Goa 0 184 184 Not Available 3. Gujarat 5 6 11 7 4. Himachal Pradesh 1 1 2 2 5. Jharkhand 6 12 18 15 6. Karnataka 6 42 48 33 7. Madhya Pradesh 1 12 13 2 8. Maharashtra 0 9 9 Not Available 9. Odisha 24 7 31 31 10. Rajasthan 2 2 4 2 Total 48 281 329 101 Source: Ministry of Mines’ CCEC meeting held on 12th Oct. 2018 at Ahmedabad 3.22 As per Section 8A(4), auction is possible only : “On the expiry of lease period, the lease shall be put up for auction as per the procedure specified in this Act”. 3.23 However, as per Rule 12(gg) of The Minerals (other than Atomic and Hydro Carbons Energy) Concessions Rules, 2016 “a lessee is entitled to remove within six months after the expiry of lease period all or any ore mineral excavated during the currency of lease, engines, machinery, plant, buildings structure, tramways, railways and other works”. 3.24 Further, as per Rule 12(hh), if a lessee is not able to remove all the materials within six months, he is given one more month to do so. In other words, a total period of seven months after expiry of the mining lease period are available with a lessee to remove all the materials. 3.25 Working mines in Jharkhand and Odisha provide roughly 45% of the iron / manganese requirements of the steel plants in Eastern sector. Further, there is
Table – III (c)
State-wise mining leases expiring on 31st March, 2020
(D) – IMMEDIATE REPERCUSSIONS : HIGH COST OF RAW MATERIALS TO AFFECT
MINE DEVELOPMENT
an unsold stock-pile of 127 million tonnes of iron ore in these two States: Odisha and Jharkhand (85 million tonnes in Odisha and 42 million tonnes in Jharkhand). This ore is not required by the domestic steel plants nor can be exported because of the export duty of 30% on +58% Fe grade. Nor is it possible for a prospective buyer to bid for unsold quantity not required in the domestic market or exported because of 30% export duty. 3.26 This will therefore lead to litigation and chaos and major disruption of raw material supplies to steel plants. Many of the major steel plants in the country are fully dependent on the sourcing of raw materials from these non-captive mines. It will therefore be very necessary to extend the period of existing non-captive leases till 31-03-2030 as is available for captive mines so that there is no disruption of raw material supplies. Thereafter, the lease period should be extended for 20 years at a time till reserves last.
3.27 The main objective behind MMDR (Amendment) Act, 2015 was to ensure that the State Governments get maximum revenue right from the start (cradle) to the closure (grave) of the mining operations. It has to be realised that in this country, the mines are mostly in tribal and forest areas with no infrastructure facilities. Development of a mine with the attendant infrastructure required therefor will directly affect the socio-economic milieu of the people living in those areas. If acquiring a mine and its continuous operations become unviable, no entrepreneur will be encouraged to acquire a mine and the area will remain backward. State will also get no revenue. Instead of earning more revenue from auction and other means, which may never be utilised in these backward and tribal areas, the State should attract more investment in mines in these areas which will provide jobs and lead to socio-economic development. 3.28 Commodity markets are subject to market fluctuations ― sometimes wild and sometimes moderate. In such a situation if it is insisted upon to adhere Mine Development and Production Agreement (MDPA) and to secure performance security, which can be invoked for any breach, it would make a mine unviable since very beginning. The experience of coal mines acquired through auction is a testimony to this; most of the mines could not go into production even after lapse of 5 years. 3.29 The performance security of 0.50% of the value of estimated resources which is to be adjusted every year to correspond to 0.50% of the reassessed estimated resources will discourage exploration. A lessee would not like to add to his cost, not only of the exploration expenses but in terms of additional

35
Mining Matters for India
(C) – REPERCUSSIONS OF EXPIRY OF NON-CAPTIVE MINING LEASES
ON 31st MARCH, 2020
3.21 Position as on 31-03-2020 :
S. No. State Working
Mines
Non-Working
Mines
Total Mines
Total Auctionable
Mines 1. Andhra Pradesh 3 6 9 9 2. Goa 0 184 184 Not Available 3. Gujarat 5 6 11 7 4. Himachal Pradesh 1 1 2 2 5. Jharkhand 6 12 18 15 6. Karnataka 6 42 48 33 7. Madhya Pradesh 1 12 13 2 8. Maharashtra 0 9 9 Not Available 9. Odisha 24 7 31 31 10. Rajasthan 2 2 4 2 Total 48 281 329 101 Source: Ministry of Mines’ CCEC meeting held on 12th Oct. 2018 at Ahmedabad 3.22 As per Section 8A(4), auction is possible only : “On the expiry of lease period, the lease shall be put up for auction as per the procedure specified in this Act”. 3.23 However, as per Rule 12(gg) of The Minerals (other than Atomic and Hydro Carbons Energy) Concessions Rules, 2016 “a lessee is entitled to remove within six months after the expiry of lease period all or any ore mineral excavated during the currency of lease, engines, machinery, plant, buildings structure, tramways, railways and other works”. 3.24 Further, as per Rule 12(hh), if a lessee is not able to remove all the materials within six months, he is given one more month to do so. In other words, a total period of seven months after expiry of the mining lease period are available with a lessee to remove all the materials. 3.25 Working mines in Jharkhand and Odisha provide roughly 45% of the iron / manganese requirements of the steel plants in Eastern sector. Further, there is
Table – III (c)
State-wise mining leases expiring on 31st March, 2020
(D) – IMMEDIATE REPERCUSSIONS : HIGH COST OF RAW MATERIALS TO AFFECT
MINE DEVELOPMENT
an unsold stock-pile of 127 million tonnes of iron ore in these two States: Odisha and Jharkhand (85 million tonnes in Odisha and 42 million tonnes in Jharkhand). This ore is not required by the domestic steel plants nor can be exported because of the export duty of 30% on +58% Fe grade. Nor is it possible for a prospective buyer to bid for unsold quantity not required in the domestic market or exported because of 30% export duty. 3.26 This will therefore lead to litigation and chaos and major disruption of raw material supplies to steel plants. Many of the major steel plants in the country are fully dependent on the sourcing of raw materials from these non-captive mines. It will therefore be very necessary to extend the period of existing non-captive leases till 31-03-2030 as is available for captive mines so that there is no disruption of raw material supplies. Thereafter, the lease period should be extended for 20 years at a time till reserves last.
3.27 The main objective behind MMDR (Amendment) Act, 2015 was to ensure that the State Governments get maximum revenue right from the start (cradle) to the closure (grave) of the mining operations. It has to be realised that in this country, the mines are mostly in tribal and forest areas with no infrastructure facilities. Development of a mine with the attendant infrastructure required therefor will directly affect the socio-economic milieu of the people living in those areas. If acquiring a mine and its continuous operations become unviable, no entrepreneur will be encouraged to acquire a mine and the area will remain backward. State will also get no revenue. Instead of earning more revenue from auction and other means, which may never be utilised in these backward and tribal areas, the State should attract more investment in mines in these areas which will provide jobs and lead to socio-economic development. 3.28 Commodity markets are subject to market fluctuations ― sometimes wild and sometimes moderate. In such a situation if it is insisted upon to adhere Mine Development and Production Agreement (MDPA) and to secure performance security, which can be invoked for any breach, it would make a mine unviable since very beginning. The experience of coal mines acquired through auction is a testimony to this; most of the mines could not go into production even after lapse of 5 years. 3.29 The performance security of 0.50% of the value of estimated resources which is to be adjusted every year to correspond to 0.50% of the reassessed estimated resources will discourage exploration. A lessee would not like to add to his cost, not only of the exploration expenses but in terms of additional

36
Mining Matters for India
performance security which may result following discovery of more resources. In the case of captive mines, their production from the mines is directly linked to the production of the product to which it is captive. The demand for cement / steel / aluminium is subject to market forces. How can thus one have a static Mine Development and Production Agreement (MDPA)? 3.30 In a competitive world, it is necessary that what we produce should be economically viable. Mr. Graeme Hancock of World Bank in his report submitted in 2006 has observed that "countries compete for mineral sector investment and generally offer terms of ETR between 40% and 50%". The taxes mentioned above have all the ingredients to make domestic raw materials costly. In present day uncertain commodity market around the world, a time may come when imports would be cheaper than buying raw materials in the domestic market. 3.31 Further, the high raw materials cost will make finished products unviable and open it to the vagaries of imports. Any safeguards against import of finished products like steel and aluminium and making them costly will hurt down-stream industries, many of whose products are exported. Down-stream industries provide jobs to a large number of people and if the cost of finished products increases, the domestic consumers and exports will get affected. 3.32 Even if for argument sake, one acquires mining lease through auction route, there are restrictions on market access particularly export and an entrepreneur is not able to realise best unit value for his product(s). Some of the minerals like iron ore, bauxite, ilmenite, chromite are subject to export duty and in the case of chromite and manganese ore, there are ceilings on the quantity to be exported despite being limited domestic demand. Needless to say that more export realisation adds value and increase GDP. Further, despite adequate resources and capacity to produce, imports are taking place at higher prices resulting closure of many of the small mines. 3.33 The high taxation on mining in India alongwith inordinate delays in grant and development of mines have already led to several major international players exiting the country. As James Ferguson, Global Mining Tax Leader at Deloitte, observes:
"This will impel miners to base future investments on three main factors — a
country's geology, its political stability, and its tax policy." 3.34 While resource-rich nations are competing to attract investors to explore, mine, contribute to socio-economic growth and create new employment opportunities by unlocking their own mineral potential whereas, in India, we are making it difficult for investors with state-of-the-art technologies to invest in exploration and development of mineral resources.
3.35 This high incidence of taxation especially in mining could possibly be attributed to an erroneous perception that miners continue to make windfall profits even after the global commodity slump. It has to be realised that the mining sector in India is heavily taxed, not only in comparison to international level but also in comparison to other domestic sectors. The taxation regime for mining in India affects all downstream industries and employment opportunities in the economy, while fuelling the already skewed balance of payment through additional import of minerals. Hence, there is need to rationalize the taxation structure for the mining sector for sustainable development and deriving long-term benefits in terms of sustained raw material security for industries. 3.36 The mining industry boosts the economy by generating employment, meeting the ever-growing demand of the downstream industries such as manufacturing and infrastructure, and also through increased fiscal contributions. There is therefore an urgent need for Government of India to take positive steps to unlock the mineral potential in India.
________

37
Mining Matters for India
performance security which may result following discovery of more resources. In the case of captive mines, their production from the mines is directly linked to the production of the product to which it is captive. The demand for cement / steel / aluminium is subject to market forces. How can thus one have a static Mine Development and Production Agreement (MDPA)? 3.30 In a competitive world, it is necessary that what we produce should be economically viable. Mr. Graeme Hancock of World Bank in his report submitted in 2006 has observed that "countries compete for mineral sector investment and generally offer terms of ETR between 40% and 50%". The taxes mentioned above have all the ingredients to make domestic raw materials costly. In present day uncertain commodity market around the world, a time may come when imports would be cheaper than buying raw materials in the domestic market. 3.31 Further, the high raw materials cost will make finished products unviable and open it to the vagaries of imports. Any safeguards against import of finished products like steel and aluminium and making them costly will hurt down-stream industries, many of whose products are exported. Down-stream industries provide jobs to a large number of people and if the cost of finished products increases, the domestic consumers and exports will get affected. 3.32 Even if for argument sake, one acquires mining lease through auction route, there are restrictions on market access particularly export and an entrepreneur is not able to realise best unit value for his product(s). Some of the minerals like iron ore, bauxite, ilmenite, chromite are subject to export duty and in the case of chromite and manganese ore, there are ceilings on the quantity to be exported despite being limited domestic demand. Needless to say that more export realisation adds value and increase GDP. Further, despite adequate resources and capacity to produce, imports are taking place at higher prices resulting closure of many of the small mines. 3.33 The high taxation on mining in India alongwith inordinate delays in grant and development of mines have already led to several major international players exiting the country. As James Ferguson, Global Mining Tax Leader at Deloitte, observes:
"This will impel miners to base future investments on three main factors — a
country's geology, its political stability, and its tax policy." 3.34 While resource-rich nations are competing to attract investors to explore, mine, contribute to socio-economic growth and create new employment opportunities by unlocking their own mineral potential whereas, in India, we are making it difficult for investors with state-of-the-art technologies to invest in exploration and development of mineral resources.
3.35 This high incidence of taxation especially in mining could possibly be attributed to an erroneous perception that miners continue to make windfall profits even after the global commodity slump. It has to be realised that the mining sector in India is heavily taxed, not only in comparison to international level but also in comparison to other domestic sectors. The taxation regime for mining in India affects all downstream industries and employment opportunities in the economy, while fuelling the already skewed balance of payment through additional import of minerals. Hence, there is need to rationalize the taxation structure for the mining sector for sustainable development and deriving long-term benefits in terms of sustained raw material security for industries. 3.36 The mining industry boosts the economy by generating employment, meeting the ever-growing demand of the downstream industries such as manufacturing and infrastructure, and also through increased fiscal contributions. There is therefore an urgent need for Government of India to take positive steps to unlock the mineral potential in India.
________

IV – HOW TO REVIVE MINING IN INDIA?
Mineral exploration is the lifeline of mining. It is a scientific knowledge-
driven process and a commercial business of value addition to a licenced block of land with the eventual aim of mining it for a profit. The process of discovering and defining mineable mineral deposits evolves in stages from conceptualization and selection of a target to be explored followed by reconnaissance (exploration), prospecting, pre-feasibility and feasibility studies for mining operations. The initial licenced area would be a large block of land, generally called as Greenfield, which progresses with reduction in area to a Brownfield or Prospect and eventually, if successful, results in a mineable mineral deposit. 4.2 Exploration is not always a rewarding exercise. Globally, mineral exploration is viewed as a high risk business because it involves high investment but may fail, at any stage of exploration, to show up the potential of the chosen area to deliver a profitably mineable mineral deposit. The level of exploration activity determines the level of mining in a country.
4.3 All over the world, prospecting and mining are recognised as an independent activity with transferability of the concessions. By and large, almost all the resource-rich countries have adopted the system of First-come-First-Served (FCFS) for their resource development barring Russia and of late India and Indonesia. China has adopted hybrid system for resource development:
(A) Regulatory regime in resource-rich countries

39
Mining Matters for India
IV – HOW TO REVIVE MINING IN INDIA?
Mineral exploration is the lifeline of mining. It is a scientific knowledge-
driven process and a commercial business of value addition to a licenced block of land with the eventual aim of mining it for a profit. The process of discovering and defining mineable mineral deposits evolves in stages from conceptualization and selection of a target to be explored followed by reconnaissance (exploration), prospecting, pre-feasibility and feasibility studies for mining operations. The initial licenced area would be a large block of land, generally called as Greenfield, which progresses with reduction in area to a Brownfield or Prospect and eventually, if successful, results in a mineable mineral deposit. 4.2 Exploration is not always a rewarding exercise. Globally, mineral exploration is viewed as a high risk business because it involves high investment but may fail, at any stage of exploration, to show up the potential of the chosen area to deliver a profitably mineable mineral deposit. The level of exploration activity determines the level of mining in a country.
4.3 All over the world, prospecting and mining are recognised as an independent activity with transferability of the concessions. By and large, almost all the resource-rich countries have adopted the system of First-come-First-Served (FCFS) for their resource development barring Russia and of late India and Indonesia. China has adopted hybrid system for resource development:
(A) Regulatory regime in resource-rich countries

40
Mining Matters for India
Sl. No.
Country Method of Grant Initial mining lease tenure
Renewal Provision
1 Argentina FCFS Till Mineral Exhaustion — 2 Bolivia FCFS 30 years 30 years 3 Botswana FCFS 25 years 25 years 4 Brazil FCFS Till Mineral Exhaustion — 5 Canada FCFS 20 years 10 years 6 Chile FCFS Till Mineral Exhaustion — 7 Columbia FCFS 30 years 30 years 8 Ghana FCFS 30 years 30 years 9 Mexico FCFS 50 years 50 years 10 Namibia FCFS 25 years 15 years 11 Peru FCFS 30 years Extension on
request 12 USA FCFS Till Mineral Exhaustion — 13 South Africa FCFS 30 years 30 years 14 South
Australia FCFS 21 years 21 years
15 West Australia
FCFS 21 years 21 years
16 Mongolia FCFS 30 years 20 years for two successive periods
17 Mauritania FCFS 30 years Not available 18 Morocco FCFS 10 years 10 years 19 Mozambique FCFS 25 years 25 years 20 China Hybrid System –
– FCFS for the unexplored areas – Auction for already explored areas
– 30 years for large mines – 20 years for medium mines – 10 years for small mines
Extension on request
21 Indonesia Auction – 20 years for metallic mineral – 10 years for non-metallic minerals
Renewal tenure varies for different minerals
22 Russia Auction 25 years Extension on request
23 India Auction 50 years No Renewal Note: FCFS (First-come-First-Served)
Table – IV
Model of grant of mining concessions in mineral-rich countries
4.4 Under the FCFS system, an agreement is entered with the Government with full checks and balances whereby there is annual financial / expenditure commitment (which differs from country to country) by the concessionaire to undertake minimum committed level of work, which goes on increasing every year.
4.5 Normally the success rate of prospects in exploration is 1:100. As such, no resource rich country spends tax payers’ money on such a risky venture. For undertaking exploration job, these countries entrust the same to private companies, popularly known as junior exploration companies. An idea of the exploration expenditure undertaken by junior exploration companies over last few years – country-wise – and where it was spent can be had from the following tables:
Year
Companies involved Amount spent (US$ billion)
% increase / decrease over last year
2012 3500 20.53 - 2013 3500 14.43 (-) 29.71 2014 2700 10.74 (-) 25.57 2015 3500 9.20 (-)14.34 2016 1580 6.97 (-) 24.24 2017 1535 7.95 14.06
Source: S&P Global Market Intelligence (For 2012-17)
Country 2013 2014 2015 2016 2017 Canada 1.88 1.51 1.28 0.96 1.11 Australia 1.88 1.30 1.09 0.90 1.08 China 0.57 0.70 0.54 0.41 0.40 Peru 0.72 0.54 0.54 0.41 0.56 Brazil 0.04 0.30 0.27 0.28 0.24 Global 14.43 10.74 9.20 6.97 7.95 Note: India’s exploration expenditure for the financial years 2016, 2017 and 2018 was USD 0.13, 0.15 and 0.17 billion respectively. This comprises of expenditures incurred by GSI, MECL and NMET only. In addition, CMPDIL, Department of Atomic Energy and State DMGs also incur significant expenditure on exploration.
Source: (1) S&P Global Market Intelligence, 2018 (2) For India: Ministry of Mines
Table – IV (b)
Country-wise exploration expenditure (in billion USD)
Table – IV (a)
World exploration expenditure and number of junior companies involved

41
Mining Matters for India
Sl. No.
Country Method of Grant Initial mining lease tenure
Renewal Provision
1 Argentina FCFS Till Mineral Exhaustion — 2 Bolivia FCFS 30 years 30 years 3 Botswana FCFS 25 years 25 years 4 Brazil FCFS Till Mineral Exhaustion — 5 Canada FCFS 20 years 10 years 6 Chile FCFS Till Mineral Exhaustion — 7 Columbia FCFS 30 years 30 years 8 Ghana FCFS 30 years 30 years 9 Mexico FCFS 50 years 50 years 10 Namibia FCFS 25 years 15 years 11 Peru FCFS 30 years Extension on
request 12 USA FCFS Till Mineral Exhaustion — 13 South Africa FCFS 30 years 30 years 14 South
Australia FCFS 21 years 21 years
15 West Australia
FCFS 21 years 21 years
16 Mongolia FCFS 30 years 20 years for two successive periods
17 Mauritania FCFS 30 years Not available 18 Morocco FCFS 10 years 10 years 19 Mozambique FCFS 25 years 25 years 20 China Hybrid System –
– FCFS for the unexplored areas – Auction for already explored areas
– 30 years for large mines – 20 years for medium mines – 10 years for small mines
Extension on request
21 Indonesia Auction – 20 years for metallic mineral – 10 years for non-metallic minerals
Renewal tenure varies for different minerals
22 Russia Auction 25 years Extension on request
23 India Auction 50 years No Renewal Note: FCFS (First-come-First-Served)
Table – IV
Model of grant of mining concessions in mineral-rich countries
4.4 Under the FCFS system, an agreement is entered with the Government with full checks and balances whereby there is annual financial / expenditure commitment (which differs from country to country) by the concessionaire to undertake minimum committed level of work, which goes on increasing every year.
4.5 Normally the success rate of prospects in exploration is 1:100. As such, no resource rich country spends tax payers’ money on such a risky venture. For undertaking exploration job, these countries entrust the same to private companies, popularly known as junior exploration companies. An idea of the exploration expenditure undertaken by junior exploration companies over last few years – country-wise – and where it was spent can be had from the following tables:
Year
Companies involved Amount spent (US$ billion)
% increase / decrease over last year
2012 3500 20.53 - 2013 3500 14.43 (-) 29.71 2014 2700 10.74 (-) 25.57 2015 3500 9.20 (-)14.34 2016 1580 6.97 (-) 24.24 2017 1535 7.95 14.06
Source: S&P Global Market Intelligence (For 2012-17)
Country 2013 2014 2015 2016 2017 Canada 1.88 1.51 1.28 0.96 1.11 Australia 1.88 1.30 1.09 0.90 1.08 China 0.57 0.70 0.54 0.41 0.40 Peru 0.72 0.54 0.54 0.41 0.56 Brazil 0.04 0.30 0.27 0.28 0.24 Global 14.43 10.74 9.20 6.97 7.95 Note: India’s exploration expenditure for the financial years 2016, 2017 and 2018 was USD 0.13, 0.15 and 0.17 billion respectively. This comprises of expenditures incurred by GSI, MECL and NMET only. In addition, CMPDIL, Department of Atomic Energy and State DMGs also incur significant expenditure on exploration.
Source: (1) S&P Global Market Intelligence, 2018 (2) For India: Ministry of Mines
Table – IV (b)
Country-wise exploration expenditure (in billion USD)
Table – IV (a)
World exploration expenditure and number of junior companies involved

42
Mining Matters for India
(US$ billion)
Year Gold Base Metals
(copper, nickel, lead/zinc)
Diamond PGM
(platinum group of metals)
Other Minerals Total
2012 9.65 (47%)
6.57 (32%)
0.62 (3%)
0.31 (1.5%)
3.39 (16.5%)
20.53 (100%)
2013 6.64 (46%)
4.76 (33%)
0.58 (4%)
0.14 (1%)
2.31 (16%)
14.43 (100%)
2014 4.62 (43%)
3.76 (35%)
0.54 (5%)
0.21 (2%)
1.61 (15%)
10.74 (100%)
2015 4.14 (45%)
3.13 (34%)
0.46 (5%)
0.14 (1.5%)
1.33 (14.5%)
9.20 (100%)
2016 3.48 (50%)
2.16 (31%)
0.28 (4%)
0.070 (1%)
0.98 (14%)
6.97 (100%)
2017 4.05 (51%)
2.38 (30%)
0.25 (3%)
0.080 (1%)
1.19 (15%)
7.95 (100%)
Source: S&P Global Market Intelligence (For 2012-17)
4.6 Junior Exploration Company is formed by a group of geologists whose domain expertise is in a particular mineral or group of minerals. For exploration job, they bank on venture capital or hedge funds (80% funds raised from Toronto Stock Exchange; and 20% funds from New York Stock Exchange and London Stock Exchange and Perth Exchange).
4.7 A junior exploration company, when it is successful in locating a world class discovery, sells it to a major mining company at a price which would recover all the past losses, if any, and may cover possibly future losses.
4.8 A mining company can also undertake exploration such as Rio Tinto who discovered the diamond deposit in Bunder area in Madhya Pradesh.
4.9 Both the Junior exploration companies as well as mining companies have freedom to sell / transfer the concessions with its tenurial guarantee and seamless transition to mining stage, all of which are key to success of FCFS system.
In Presidential Special Reference No. 1 of 2012 [Under Article 143(1) of the
Constitution of India dated 27th September, 2012, Hon’ble Supreme Court of India has observed that “even auction has a potential of abuse, like any
Table – IV (c) Commodity-wise expenditure on exploration
(B) Suggestions for India
other method of allocation”. “Therefore, auction, an economic choice of disposal of natural resources, is not a constitutional mandate”;
The private sector in future should be the main source of investment in
reconnaissance, exploration and mining with right to seamless transition, transferability with security of tenure.
The Government agencies such as GSI, MECL etc. may continue to
perform the exploration and surveys on regional basis and in areas where private investment is not forthcoming;
First-come-First-Served (FCFS) should be adopted in the case where there
is a sole applicant for an area; Selection criteria in the case where there are multiple applicants for an area
thrown open by Government or otherwise; Level playing field for both private (captive and non-captive) and
Government sector companies in terms of tenure of leases, area selection etc.;
There should be a fixed timeframe within which an application for
RP / PL / ML has to be disposed of. If an application is not disposed within a stipulated timeframe, an applicant can file revision petition before the Central Regulatory Authority, which should be created at the Centre. The Central Regulatory Authority, on receipt of an application, should after hearing the State Government, take decision within a period of 90 days which has to be implemented by the State Government.
4.10 The concept of captive mines for an industry is typical to India. While the supplies of materials from captive mine are limited to its end use linked industry only, non-captive mine caters to the need of wide spectrum of industry. A mine or a deposit contains various grades with different chemical and physical composition whereas a plant would require a uniform grade to maintain a consistent feed. A plant therefore blends ores from various sources to make a consistent feed to make a quality product economically. The system of acquiring captive mines has not been able to unleash the full potential of mining in India. The mining and smelting are the business of volumes. It is volume which gives the mining and smelting the economy of scale. Captive mining limits the scale of mining, leads to selective mining and wastage of resources. Since area granted for captive leases is large, exploration activities are minimal and limited to the requirements of the plant(s). There is no benefit to the down-stream users of the products as inter-sectoral subsidy from mining sector is not passed on to them and hence there is no multiplier benefits.
(C) Mining to be considered as an ‘Independent Activity’

43
Mining Matters for India
(US$ billion)
Year Gold Base Metals
(copper, nickel, lead/zinc)
Diamond PGM
(platinum group of metals)
Other Minerals Total
2012 9.65 (47%)
6.57 (32%)
0.62 (3%)
0.31 (1.5%)
3.39 (16.5%)
20.53 (100%)
2013 6.64 (46%)
4.76 (33%)
0.58 (4%)
0.14 (1%)
2.31 (16%)
14.43 (100%)
2014 4.62 (43%)
3.76 (35%)
0.54 (5%)
0.21 (2%)
1.61 (15%)
10.74 (100%)
2015 4.14 (45%)
3.13 (34%)
0.46 (5%)
0.14 (1.5%)
1.33 (14.5%)
9.20 (100%)
2016 3.48 (50%)
2.16 (31%)
0.28 (4%)
0.070 (1%)
0.98 (14%)
6.97 (100%)
2017 4.05 (51%)
2.38 (30%)
0.25 (3%)
0.080 (1%)
1.19 (15%)
7.95 (100%)
Source: S&P Global Market Intelligence (For 2012-17)
4.6 Junior Exploration Company is formed by a group of geologists whose domain expertise is in a particular mineral or group of minerals. For exploration job, they bank on venture capital or hedge funds (80% funds raised from Toronto Stock Exchange; and 20% funds from New York Stock Exchange and London Stock Exchange and Perth Exchange).
4.7 A junior exploration company, when it is successful in locating a world class discovery, sells it to a major mining company at a price which would recover all the past losses, if any, and may cover possibly future losses.
4.8 A mining company can also undertake exploration such as Rio Tinto who discovered the diamond deposit in Bunder area in Madhya Pradesh.
4.9 Both the Junior exploration companies as well as mining companies have freedom to sell / transfer the concessions with its tenurial guarantee and seamless transition to mining stage, all of which are key to success of FCFS system.
In Presidential Special Reference No. 1 of 2012 [Under Article 143(1) of the
Constitution of India dated 27th September, 2012, Hon’ble Supreme Court of India has observed that “even auction has a potential of abuse, like any
Table – IV (c) Commodity-wise expenditure on exploration
(B) Suggestions for India
other method of allocation”. “Therefore, auction, an economic choice of disposal of natural resources, is not a constitutional mandate”;
The private sector in future should be the main source of investment in
reconnaissance, exploration and mining with right to seamless transition, transferability with security of tenure.
The Government agencies such as GSI, MECL etc. may continue to
perform the exploration and surveys on regional basis and in areas where private investment is not forthcoming;
First-come-First-Served (FCFS) should be adopted in the case where there
is a sole applicant for an area; Selection criteria in the case where there are multiple applicants for an area
thrown open by Government or otherwise; Level playing field for both private (captive and non-captive) and
Government sector companies in terms of tenure of leases, area selection etc.;
There should be a fixed timeframe within which an application for
RP / PL / ML has to be disposed of. If an application is not disposed within a stipulated timeframe, an applicant can file revision petition before the Central Regulatory Authority, which should be created at the Centre. The Central Regulatory Authority, on receipt of an application, should after hearing the State Government, take decision within a period of 90 days which has to be implemented by the State Government.
4.10 The concept of captive mines for an industry is typical to India. While the supplies of materials from captive mine are limited to its end use linked industry only, non-captive mine caters to the need of wide spectrum of industry. A mine or a deposit contains various grades with different chemical and physical composition whereas a plant would require a uniform grade to maintain a consistent feed. A plant therefore blends ores from various sources to make a consistent feed to make a quality product economically. The system of acquiring captive mines has not been able to unleash the full potential of mining in India. The mining and smelting are the business of volumes. It is volume which gives the mining and smelting the economy of scale. Captive mining limits the scale of mining, leads to selective mining and wastage of resources. Since area granted for captive leases is large, exploration activities are minimal and limited to the requirements of the plant(s). There is no benefit to the down-stream users of the products as inter-sectoral subsidy from mining sector is not passed on to them and hence there is no multiplier benefits.
(C) Mining to be considered as an ‘Independent Activity’

44
Mining Matters for India
4.11 As per the Ministry of Mines Annual Report 2017-18, the distribution of mining leases of major minerals in the country as on 31st March, 2015 is as under:
Frequency group
(Area in hectares)
Number of mining leases
Percentage of total leases
Area in ‘000 hectares
Percentage of total area
All Groups 4,128 100 3,54,908.75 100 0 to 10 1,942 47 7,852.95 2
10 to 20 469 11 6,882.63 2 20 to 50 585 14 19,401.02 5
50 to 100 513 13 38,854.06 11 100 to 200 235 6 33,242.80 9 200 to 500 204 5 65,878.66 19 Above 500 180 4 1,82,796.63 52
*: excludes the mining leases of the minerals declared as “Minor” vide Gazette Notification Part II, Section 3, Sub-section (ii) dated 10th February, 2015.
Source: Ministry of Mines Annual Report 2017-18
It can be observed that 72% of the leases of major minerals in the country are less than 50 hectares in size, covering only 9% of the total mining area. In addition, there are numerous leases of minor minerals ranging from 0-5 hectares. Thus, majority of the mines in India are so small that these are neither sustainable nor can be scientifically mined. Further administration of so many small mines also becomes difficult. It is therefore necessary that in future, no fresh lease may be granted of less than 50-hectare size, unless the deposit is itself small.
(D) Minimum area of mining leases
Table – IV (d)
All India – Area-wise distribution of mining leases* as on 31-03-2015
4.12 In the current regime and practice, it takes 3-5 years involving various stages for getting EC and FC for grant of mineral concessions. In addition, acquisition of private land and land falling in Schedule-V areas are the major bottlenecks for grant of mining lease. It is therefore necessary that in-principle approval for statutory clearances like EC and FC and land acquisition should be in place before offering the mineral blocks for its grant. 4.13 As per MOEFCC Notification dated 6th April, 2018, existing mining leases having EC under EIA Notification, 1994 are to seek fresh EC under EIA Notification, 2006. Since validity of EC under EIA Notification, 1994 is for 5 years as per the Hon’ble Supreme Court judgement dated 7th February, 2018 in Goa Foundation vs M/s Sesa Sterlite Ltd. & Ors., any production beyond these 5 years is liable to attract penalty under Section 21(5).
4.14 Appropriate amendment is therefore necessary in the Environment Protection Act, 1986 so that all ECs issued under EIA Notification, 1994 have validity co-terminus with lease period. As per Amendment Act, 2015, only private companies’ non- captive leases are going to expire on 31st March 2020, where after the lease will be put to auction, but there will be no auction for mining leases for Government companies. Government companies will be allocated/ granted mining leases as per Minerals (Mining by Government Company) Rules, 2015. Government companies will be entitled to an extension of mining leases up to 20 years at a time beyond the stipulated grant period of 50 years. It is strange that Amendment Act, 2015 differentiates between Government and private companies. Till amendment Act, 2015, there was no distinction between captive and non-captive and Government companies. They were at par in all respects, including tenure of leases, which will, in turn, adversely affect the mining sector. Both private and public companies contribute to the country’s GDP. There should be a level playing field for both private (captive and non-captive) and Government sector companies in terms of tenure of leases, area selection etc.
(F) Level playing field for both private (captive and non-captive)
and Government companies
(i) Skewness towards Government sector
(E) Inordinate delays in grant of statutory clearances like Environment Clearance (EC)
and Forest Clearance (FC) and Land Acquisition

45
Mining Matters for India
4.11 As per the Ministry of Mines Annual Report 2017-18, the distribution of mining leases of major minerals in the country as on 31st March, 2015 is as under:
Frequency group
(Area in hectares)
Number of mining leases
Percentage of total leases
Area in ‘000 hectares
Percentage of total area
All Groups 4,128 100 3,54,908.75 100 0 to 10 1,942 47 7,852.95 2
10 to 20 469 11 6,882.63 2 20 to 50 585 14 19,401.02 5
50 to 100 513 13 38,854.06 11 100 to 200 235 6 33,242.80 9 200 to 500 204 5 65,878.66 19 Above 500 180 4 1,82,796.63 52
*: excludes the mining leases of the minerals declared as “Minor” vide Gazette Notification Part II, Section 3, Sub-section (ii) dated 10th February, 2015.
Source: Ministry of Mines Annual Report 2017-18
It can be observed that 72% of the leases of major minerals in the country are less than 50 hectares in size, covering only 9% of the total mining area. In addition, there are numerous leases of minor minerals ranging from 0-5 hectares. Thus, majority of the mines in India are so small that these are neither sustainable nor can be scientifically mined. Further administration of so many small mines also becomes difficult. It is therefore necessary that in future, no fresh lease may be granted of less than 50-hectare size, unless the deposit is itself small.
(D) Minimum area of mining leases
Table – IV (d)
All India – Area-wise distribution of mining leases* as on 31-03-2015
4.12 In the current regime and practice, it takes 3-5 years involving various stages for getting EC and FC for grant of mineral concessions. In addition, acquisition of private land and land falling in Schedule-V areas are the major bottlenecks for grant of mining lease. It is therefore necessary that in-principle approval for statutory clearances like EC and FC and land acquisition should be in place before offering the mineral blocks for its grant. 4.13 As per MOEFCC Notification dated 6th April, 2018, existing mining leases having EC under EIA Notification, 1994 are to seek fresh EC under EIA Notification, 2006. Since validity of EC under EIA Notification, 1994 is for 5 years as per the Hon’ble Supreme Court judgement dated 7th February, 2018 in Goa Foundation vs M/s Sesa Sterlite Ltd. & Ors., any production beyond these 5 years is liable to attract penalty under Section 21(5).
4.14 Appropriate amendment is therefore necessary in the Environment Protection Act, 1986 so that all ECs issued under EIA Notification, 1994 have validity co-terminus with lease period. As per Amendment Act, 2015, only private companies’ non- captive leases are going to expire on 31st March 2020, where after the lease will be put to auction, but there will be no auction for mining leases for Government companies. Government companies will be allocated/ granted mining leases as per Minerals (Mining by Government Company) Rules, 2015. Government companies will be entitled to an extension of mining leases up to 20 years at a time beyond the stipulated grant period of 50 years. It is strange that Amendment Act, 2015 differentiates between Government and private companies. Till amendment Act, 2015, there was no distinction between captive and non-captive and Government companies. They were at par in all respects, including tenure of leases, which will, in turn, adversely affect the mining sector. Both private and public companies contribute to the country’s GDP. There should be a level playing field for both private (captive and non-captive) and Government sector companies in terms of tenure of leases, area selection etc.
(F) Level playing field for both private (captive and non-captive)
and Government companies
(i) Skewness towards Government sector
(E) Inordinate delays in grant of statutory clearances like Environment Clearance (EC)
and Forest Clearance (FC) and Land Acquisition

46
Mining Matters for India
As per the current regime, many of the mineral bearing areas are reserved for grant of concessions to Government / public sector companies leading to the locking of the huge mineral resources. With a view to unleash the development of resources, all the areas reserved for Government companies should be de-reserved and opened for all. As per the Ministry of Mines Notification No. G.S.R. 134(E) dated 20th February, 2019 the mining of beach sand minerals is allowed only for Government companies and the role of the private sector has been eliminated. Private sector has been playing active role in mining BSM and contributing to the current revenue of about Rs. 5000 crores annually since the opening of this sector to private sector. Further, this sector has been exporting BSM to the tune of Rs 4000 crores annually. It happens only in India that instead of improving our regulatory regime, we blame only private industry which in this case resulted in job loss to lakhs of workers engaged directly and indirectly. Closing of an industry is not the solution. Closure of BSM mines of private sector had adverse impact on downstream industries and the consumers will now have to resort to imports. India is one of the rich countries having beach sand minerals. Beach sand minerals are replenishable as these are placer deposits formed in beach environments by concentration due to the specific gravity of the mineral grains. Private sector should be continued to be allowed for mining of beach sand minerals and we suggest that the Notification barring private sector should be rescinded. 4.15 Even though India has vast mineral resources and favorable geological environment for mineral production, the mining sector in India is performing below its potential. The contribution of the mineral sector to the country's GDP is miserably low. The mineral sector (excluding petroleum and natural gas) contribution to GDP has been decreased from 1.93 % in 2012-13 to 1.53 % in 2017-18. If mining output growth is unable to keep pace with India’s demand, demand supply gap will widen. By 2025, India may become a large importer of iron ore, thermal coal, and coking coal. India’s mineral sector is heavily dependent on import. Every year, India spends approximately Rs.7 to 10 lakh crores on the imports of natural resources. On the contrary, the total export contribution of the mining sector (net of diamond and jewellery exports which is
(ii) Reservation of areas for Government companies
(iii) Mining of Beach Sand Minerals (BSM) – exclusivity of Government companies
(G) Increase the production and export from the mining sector
exported against the imports of diamond) in India during the year (2016-17) is meagre 1.95%14. While the export contribution of the mineral sector (excluding petroleum and natural gas) of resource-rich countries like, South Africa, Australia and Chile, Ghana, are, 35 %, 55 %, 52% and 47%, respectively. 4.16 Free trade is an engine of growth. With more trade, domestic firms will face more competition from abroad. Therefore, there will be more incentives to cut costs and increase efficiency. It may prevent domestic monopolies from charging too high prices. If an economy protects its domestic industry by increasing tariffs, industries may not have any incentives to cut costs. Free trade enables lower prices for consumers, increased exports and benefits from economics of scale. Therefore, there should not be any trade barriers in the mining industry to realize its full potential in terms of the value of minerals.
Year 2010 2011 2012 2013 2014 2015 2016
Country (Metallic mineral, metals, and coal export contribution
(as % of total) Simple average)
Australia 59.12 60.57 57.32 59.07 56.72 53.48 54.86
Chile 65.01 62.8 61.55 59.04 57.02 54.61 51.9
Ghana 39.59 23.75 39.5 35.22 36.86 48.14 47.2
Namibia 43.78 48.03 49.18 44.36 51.04 58.18 54.17
South Africa 37.55 46.79 43.08 43.23 38.27 34.71 35.24 Source: http://data.icmm.com/
14 Ministry of Mines Annual Report 2017-18 and Ministry of Commerce and Industry Annual Report 2017-18
Table – IV (e)
Export contribution

47
Mining Matters for India
As per the current regime, many of the mineral bearing areas are reserved for grant of concessions to Government / public sector companies leading to the locking of the huge mineral resources. With a view to unleash the development of resources, all the areas reserved for Government companies should be de-reserved and opened for all. As per the Ministry of Mines Notification No. G.S.R. 134(E) dated 20th February, 2019 the mining of beach sand minerals is allowed only for Government companies and the role of the private sector has been eliminated. Private sector has been playing active role in mining BSM and contributing to the current revenue of about Rs. 5000 crores annually since the opening of this sector to private sector. Further, this sector has been exporting BSM to the tune of Rs 4000 crores annually. It happens only in India that instead of improving our regulatory regime, we blame only private industry which in this case resulted in job loss to lakhs of workers engaged directly and indirectly. Closing of an industry is not the solution. Closure of BSM mines of private sector had adverse impact on downstream industries and the consumers will now have to resort to imports. India is one of the rich countries having beach sand minerals. Beach sand minerals are replenishable as these are placer deposits formed in beach environments by concentration due to the specific gravity of the mineral grains. Private sector should be continued to be allowed for mining of beach sand minerals and we suggest that the Notification barring private sector should be rescinded. 4.15 Even though India has vast mineral resources and favorable geological environment for mineral production, the mining sector in India is performing below its potential. The contribution of the mineral sector to the country's GDP is miserably low. The mineral sector (excluding petroleum and natural gas) contribution to GDP has been decreased from 1.93 % in 2012-13 to 1.53 % in 2017-18. If mining output growth is unable to keep pace with India’s demand, demand supply gap will widen. By 2025, India may become a large importer of iron ore, thermal coal, and coking coal. India’s mineral sector is heavily dependent on import. Every year, India spends approximately Rs.7 to 10 lakh crores on the imports of natural resources. On the contrary, the total export contribution of the mining sector (net of diamond and jewellery exports which is
(ii) Reservation of areas for Government companies
(iii) Mining of Beach Sand Minerals (BSM) – exclusivity of Government companies
(G) Increase the production and export from the mining sector
exported against the imports of diamond) in India during the year (2016-17) is meagre 1.95%14. While the export contribution of the mineral sector (excluding petroleum and natural gas) of resource-rich countries like, South Africa, Australia and Chile, Ghana, are, 35 %, 55 %, 52% and 47%, respectively. 4.16 Free trade is an engine of growth. With more trade, domestic firms will face more competition from abroad. Therefore, there will be more incentives to cut costs and increase efficiency. It may prevent domestic monopolies from charging too high prices. If an economy protects its domestic industry by increasing tariffs, industries may not have any incentives to cut costs. Free trade enables lower prices for consumers, increased exports and benefits from economics of scale. Therefore, there should not be any trade barriers in the mining industry to realize its full potential in terms of the value of minerals.
Year 2010 2011 2012 2013 2014 2015 2016
Country (Metallic mineral, metals, and coal export contribution
(as % of total) Simple average)
Australia 59.12 60.57 57.32 59.07 56.72 53.48 54.86
Chile 65.01 62.8 61.55 59.04 57.02 54.61 51.9
Ghana 39.59 23.75 39.5 35.22 36.86 48.14 47.2
Namibia 43.78 48.03 49.18 44.36 51.04 58.18 54.17
South Africa 37.55 46.79 43.08 43.23 38.27 34.71 35.24 Source: http://data.icmm.com/
14 Ministry of Mines Annual Report 2017-18 and Ministry of Commerce and Industry Annual Report 2017-18
Table – IV (e)
Export contribution

48
Mining Matters for India
Therefore, in order to create jobs, eradicates poverty, and to reduce the trade deficit, India needs to increase mineral production and increase export contribution while satisfying the domestic demand. For this, the prevailing export on iron ore (+58% Fe) and bauxite (non-metallurgical) be removed so that what cannot be sold or required in the country can be exported. In order to reduce the import of these items, India needs to focus on exploration and increasing domestic production for the minerals for which it is heavily dependent on imports. 4.17 In India, per unit labor productivity in the mining industry is very low compared to other mineral-rich countries. According to the PwC report, the average productivity of coal in U.S.A is 36,700 tonnes per employee per year (Peabody Energy) (for surface mines 20,882 tonnes per employee per year and for underground mines 6,902 tonnes per employee per year). As a result, total coal production in the USA for the year 2014 was 916.2 million tonnes. In China, the productivity of coal is 12,700 (Shenhua Energy) tonnes per employee per year. Consequently, total coal production in China for the year 2018 was 3550
0
10
20
30
40
50
60
70
2010 2011 2012 2013 2014 2015 2016
Australia Chile Ghana Namibia South Africa
Chart – IV
Export contribution (as % of total), simple average
(H) Increase per unit of labour productivity
million tonnes. In stark contrast to USA and China, the productivity of coal in India is only 1,497 (Coal India Ltd.) tonnes per employee per year15. As a result, total coal production for the year 2017-18 was 675.40 million tonnes. There is a positive relationship between per unit labour productivity and total productivity and competitiveness of the product. In order to increase the total production or growth of the mining sector, it is necessary to increase the per unit mining labour productivity in India. 4.18 Advanced integrated exploration techniques are needed to thoroughly explore deeper deposits or deposits in the complex geological environment, including deposits concealed in the offshore zone. State-of-the-art drilling techniques with sophisticated rigs (such as RC) for three-dimensional sub-surface delineation of ore body as well as for directional drilling and underground exploratory drilling are needed to be employed. Technological up-gradation in underground non-ferrous metal mining in respect of sub-level stopping methods for improving productivity. Moreover, technology can help in significantly reducing the job-related risks in mining such as dust inhalation, casualty to hearing due to the noise at the mining location, chemical risks and the exposure to collapse. Operations, productivity, and wastages can also be managed better. It is necessary to adopt improved technology to increase the efficiency of the mining sector. 4.19 Foreign Direct investment (FDI) inflows in the mining sector have hit the slow lane. After touching a peak of $596 million in 2014-15, FDI inflows into mining have tanked to $82 million at the end of 2017-18. Mining in India is still conducted by outdated methods. It needs high-end technology and equipment to increase extraction, productivity, safety, and surveillance. And for that, India badly needs FDI in this sector.
15 Provisional Coal Statistics 2017-18, Coal Controller’s Organisation (Ministry of Coal)
(I) Technology upgradation in mining
(J) Increase FDI

49
Mining Matters for India
Therefore, in order to create jobs, eradicates poverty, and to reduce the trade deficit, India needs to increase mineral production and increase export contribution while satisfying the domestic demand. For this, the prevailing export on iron ore (+58% Fe) and bauxite (non-metallurgical) be removed so that what cannot be sold or required in the country can be exported. In order to reduce the import of these items, India needs to focus on exploration and increasing domestic production for the minerals for which it is heavily dependent on imports. 4.17 In India, per unit labor productivity in the mining industry is very low compared to other mineral-rich countries. According to the PwC report, the average productivity of coal in U.S.A is 36,700 tonnes per employee per year (Peabody Energy) (for surface mines 20,882 tonnes per employee per year and for underground mines 6,902 tonnes per employee per year). As a result, total coal production in the USA for the year 2014 was 916.2 million tonnes. In China, the productivity of coal is 12,700 (Shenhua Energy) tonnes per employee per year. Consequently, total coal production in China for the year 2018 was 3550
0
10
20
30
40
50
60
70
2010 2011 2012 2013 2014 2015 2016
Australia Chile Ghana Namibia South Africa
Chart – IV
Export contribution (as % of total), simple average
(H) Increase per unit of labour productivity
million tonnes. In stark contrast to USA and China, the productivity of coal in India is only 1,497 (Coal India Ltd.) tonnes per employee per year15. As a result, total coal production for the year 2017-18 was 675.40 million tonnes. There is a positive relationship between per unit labour productivity and total productivity and competitiveness of the product. In order to increase the total production or growth of the mining sector, it is necessary to increase the per unit mining labour productivity in India. 4.18 Advanced integrated exploration techniques are needed to thoroughly explore deeper deposits or deposits in the complex geological environment, including deposits concealed in the offshore zone. State-of-the-art drilling techniques with sophisticated rigs (such as RC) for three-dimensional sub-surface delineation of ore body as well as for directional drilling and underground exploratory drilling are needed to be employed. Technological up-gradation in underground non-ferrous metal mining in respect of sub-level stopping methods for improving productivity. Moreover, technology can help in significantly reducing the job-related risks in mining such as dust inhalation, casualty to hearing due to the noise at the mining location, chemical risks and the exposure to collapse. Operations, productivity, and wastages can also be managed better. It is necessary to adopt improved technology to increase the efficiency of the mining sector. 4.19 Foreign Direct investment (FDI) inflows in the mining sector have hit the slow lane. After touching a peak of $596 million in 2014-15, FDI inflows into mining have tanked to $82 million at the end of 2017-18. Mining in India is still conducted by outdated methods. It needs high-end technology and equipment to increase extraction, productivity, safety, and surveillance. And for that, India badly needs FDI in this sector.
15 Provisional Coal Statistics 2017-18, Coal Controller’s Organisation (Ministry of Coal)
(I) Technology upgradation in mining
(J) Increase FDI

50
Mining Matters for India
Source: Reserve Bank of India Annual Report 2017-1816 In order to increase productivity, export and reduce imports, it is necessary to increase foreign direct investment in the mining sector, which will happen only if the FDI has avenues for generating competitive return on investment.
4.20 Innovative developments, such as new detection methods, automation, advanced exploration and mining technologies, can help mitigate many of the challenges faced by the mining sector, including deepening underground mining operations, lower grades and higher labour costs. To encourage research and development investment, India should introduce tax incentive for the same. To encourage small and large local companies to invest in research and development initiatives, the Government should introduce tax incentives, tax holidays etc. The tax incentives have positive effects, inducing research and development activities, and helping growth in the host country’s economy. Other regions such as Brazil and Singapore have also implemented tax incentives, and developing countries were increasingly investing in research and development. Therefore, to encourage research and development investment, India should introduce tax incentive systems for the mining industries.
_____
16 https://rbidocs.rbi.org.in/rdocs/AnnualReport/PDFs/0ANREPORT201718077745EC9A874DB38C991F580ED14242.PDF
24
129
596
14182
0
100
200
300
400
500
600
700
2013-14 2014-15 2015-16 2016-17 2017-18
IN $
MIL
LIO
N
YEAR
FDI inflow in mining (in $ million)
Chart – IV (a)
FDI Inflow in Mining
(K) Research and Development
V – PROMOTE MINING : PROMOTE GROWTH
Mining has always had its critics. There are groups who believe mining in certain locations, or mining some commodities, should be banned. There are also groups who believe the damage mining causes to the environment justifies it being banned entirely. If you add climate change protest groups into the mix, the number of people opposed to mining seems to grow daily. But something these groups overlook is that life would look very different without the contribution the mining and resources industry makes to our everyday lives.
5.2 Consider what wouldn’t be available if there were not a mining and resource sector.
There would be no coal, gas or diesel for power, and while we may have wind, we would still need metals to build turbines and pipes.
Without power, there would be no lights, phone, heating or cooling,
internet, mobile phones, TV or movies. Minerals are in almost every product in your bathroom and nearly
every product in your home. The food you eat, whether it be plant or animal relies upon minerals
and products produced by the mining industry to be fertilised, watered, fed or housed.
There would be no copper for cabling and pipes, no silica for glass
and no lithium for your phone battery. There would be no fuel to power your car.
This list shows just a few of the things we use daily that rely on a strong mining and resources sector. There are numerous examples about the impact the industry has on everyday life in a country like India.
5.3 The very real benefits of mining to local communities:17
When the international companies establish mining operations, the impact on local communities is a positive one.
In most cases, international mining companies begin liaising with the locals from the first day — with local people assisting in land clearing where necessary and working as drillers and offsiders for
17 www.minedex.com.au

51
Mining Matters for India
Source: Reserve Bank of India Annual Report 2017-1816 In order to increase productivity, export and reduce imports, it is necessary to increase foreign direct investment in the mining sector, which will happen only if the FDI has avenues for generating competitive return on investment.
4.20 Innovative developments, such as new detection methods, automation, advanced exploration and mining technologies, can help mitigate many of the challenges faced by the mining sector, including deepening underground mining operations, lower grades and higher labour costs. To encourage research and development investment, India should introduce tax incentive for the same. To encourage small and large local companies to invest in research and development initiatives, the Government should introduce tax incentives, tax holidays etc. The tax incentives have positive effects, inducing research and development activities, and helping growth in the host country’s economy. Other regions such as Brazil and Singapore have also implemented tax incentives, and developing countries were increasingly investing in research and development. Therefore, to encourage research and development investment, India should introduce tax incentive systems for the mining industries.
_____
16 https://rbidocs.rbi.org.in/rdocs/AnnualReport/PDFs/0ANREPORT201718077745EC9A874DB38C991F580ED14242.PDF
24
129
596
14182
0
100
200
300
400
500
600
700
2013-14 2014-15 2015-16 2016-17 2017-18
IN $
MIL
LIO
N
YEAR
FDI inflow in mining (in $ million)
Chart – IV (a)
FDI Inflow in Mining
(K) Research and Development
V – PROMOTE MINING : PROMOTE GROWTH
Mining has always had its critics. There are groups who believe mining in certain locations, or mining some commodities, should be banned. There are also groups who believe the damage mining causes to the environment justifies it being banned entirely. If you add climate change protest groups into the mix, the number of people opposed to mining seems to grow daily. But something these groups overlook is that life would look very different without the contribution the mining and resources industry makes to our everyday lives.
5.2 Consider what wouldn’t be available if there were not a mining and resource sector.
There would be no coal, gas or diesel for power, and while we may have wind, we would still need metals to build turbines and pipes.
Without power, there would be no lights, phone, heating or cooling,
internet, mobile phones, TV or movies. Minerals are in almost every product in your bathroom and nearly
every product in your home. The food you eat, whether it be plant or animal relies upon minerals
and products produced by the mining industry to be fertilised, watered, fed or housed.
There would be no copper for cabling and pipes, no silica for glass
and no lithium for your phone battery. There would be no fuel to power your car.
This list shows just a few of the things we use daily that rely on a strong mining and resources sector. There are numerous examples about the impact the industry has on everyday life in a country like India.
5.3 The very real benefits of mining to local communities:17
When the international companies establish mining operations, the impact on local communities is a positive one.
In most cases, international mining companies begin liaising with the locals from the first day — with local people assisting in land clearing where necessary and working as drillers and offsiders for
17 www.minedex.com.au

52
Mining Matters for India
the exploration teams and subsequently when the mining starts the economic and social benefits to the local communities is diverse and immense.
Companies contribute to national revenue through taxation and
shared ownership policies. Mine operations provide employment opportunities for locals and contribute to grassroots community programme, providing local communities with access to training and business opportunities they could never have envisaged without the support of a mining company.
Mining companies develop infrastructure where none exists, build
medical centres, schools and improve the water supply and sanitations in communities. Training gives locals the opportunity to become the drivers, operators, mechanics, welders and electricians needed for the mine, and the skills they learn allow them to continue in these occupations long after the mine is closed.
Without the mining industry, we would all be living very different lives. That’s true for everyone, no matter their walk of life, but particularly true for the communities where mines are located, where the impact the industry has on people can be positive and beneficial — not just in the immediate but also the long term. 5.4 The Indian mining industry directly employs ~23.23 lakh people across the country and 2.3 crores indirectly who are dependent on mining. If mining is promoted, more jobs will be created bringing all round growth in the economy. 5.5 Countries need mining to not only thrive but also to survive: Mining is the economic foundation for a number of developing countries like India. According to ICMM (International Council on Mining and Metals), at least 70 countries are extremely dependent on the mining industry, and most low-income countries need it to survive. This same study shows that in many low-middle income countries, mining accounts for as much as 60–90% of total foreign direct investment. 5.6 As per McKinsey & Company Report, (December, 2014), in 2012, the mining and downstream industry generated about USD 18 billion in taxes. It can contribute approximately USD 40 to 50 billion as royalties, taxes, and duty by 2025. Mining revenues can significantly boost state revenues in dominant mining states such as Chhattisgarh, Jharkhand, Goa, and Odisha. If mining is promoted, these Governments can generate more revenues, which in turn will improve the economy of the resource-rich states and bring all round growth across the country. 5.7 In the present scenario and tax regime, it is very difficult to predict any vision for Indian mining. The main objective behind MMDR (Amendment) Act,
2015 seems to ensure that the State Governments get maximum revenue right from the start (cradle) to the closure (grave) of the mining operations. It has to be realised that the mines are mostly in tribal and forest areas with no infrastructure facilities. Development of a mine with the attendant infrastructure required there-for will directly impact the socio-economic milieu of the people living in those areas. If acquiring a mine and its continuous operations become unviable, no entrepreneur will be encouraged to acquire a mine and the area will remain backward. States will also lose revenue. Instead of earning more revenue from auction, the State should ensure that investment in mines is viable so as to provide jobs and lead to socio-economic development of these areas. 5.8 As with mineral commodities and metals every new amendment is thought to be an improvement over previous one. MMDR Amendment Act, 2015 was thought to be a “reform” whereas it has not to be growth positive as far as mining is concerned. Old MMDR Act, as amended in December, 1999 following B.B. Tandon Committee Report, should be revived with necessary changes as per National Mineral Policy 2008 which did not accept auction as a tool of resource development. 5.9 In fact auction regime has put the whole process of mineral development into the realm of astrology which cannot be predicted in the mineral and metal trade where boom and depression alternate. Unless the approach of Centre and States changes, Indian mining will continue to have uncertain future. Country will continue to depend on imports for most of the vital raw materials and metals. 5.10 It is sad that India in the last seventy years since Independence in 1947, has not been able to formulate a stable and attractive policy for the development of its resources and continues to be highly unexplored despite having good geological prospectivity. The MMDR Act as amended in December 1999, was a good piece of legislation. It is not the Act which failed; it is the regulatory regime in the States, right from political to civil servants, which failed and we blamed the statute. 5.11 In fact, the regulatory regime, both political and civil, were fully aware of the level of production and the States were realising royalty on the ore produced and transported. In the case of beach sand minerals (BSM), private sector has been debarred for mining, putting jobs of a large sector at stake and deprive the country of revenue to the extent of Rs 5000 crores and exports of about Rs 4000 crores annually. Question arises, if private sector was indulging in malpractices, what was regulatory machinery doing? It is therefore necessary to reform and streamline the regulatory regime to be in line with modern and positive outlook rather than blaming any sector of wrong doing. Let us therefore improve our regulatory mechanism and promote mining to promote growth which will bring all-round prosperity for the people.
___

53
Mining Matters for India
the exploration teams and subsequently when the mining starts the economic and social benefits to the local communities is diverse and immense.
Companies contribute to national revenue through taxation and
shared ownership policies. Mine operations provide employment opportunities for locals and contribute to grassroots community programme, providing local communities with access to training and business opportunities they could never have envisaged without the support of a mining company.
Mining companies develop infrastructure where none exists, build
medical centres, schools and improve the water supply and sanitations in communities. Training gives locals the opportunity to become the drivers, operators, mechanics, welders and electricians needed for the mine, and the skills they learn allow them to continue in these occupations long after the mine is closed.
Without the mining industry, we would all be living very different lives. That’s true for everyone, no matter their walk of life, but particularly true for the communities where mines are located, where the impact the industry has on people can be positive and beneficial — not just in the immediate but also the long term. 5.4 The Indian mining industry directly employs ~23.23 lakh people across the country and 2.3 crores indirectly who are dependent on mining. If mining is promoted, more jobs will be created bringing all round growth in the economy. 5.5 Countries need mining to not only thrive but also to survive: Mining is the economic foundation for a number of developing countries like India. According to ICMM (International Council on Mining and Metals), at least 70 countries are extremely dependent on the mining industry, and most low-income countries need it to survive. This same study shows that in many low-middle income countries, mining accounts for as much as 60–90% of total foreign direct investment. 5.6 As per McKinsey & Company Report, (December, 2014), in 2012, the mining and downstream industry generated about USD 18 billion in taxes. It can contribute approximately USD 40 to 50 billion as royalties, taxes, and duty by 2025. Mining revenues can significantly boost state revenues in dominant mining states such as Chhattisgarh, Jharkhand, Goa, and Odisha. If mining is promoted, these Governments can generate more revenues, which in turn will improve the economy of the resource-rich states and bring all round growth across the country. 5.7 In the present scenario and tax regime, it is very difficult to predict any vision for Indian mining. The main objective behind MMDR (Amendment) Act,
2015 seems to ensure that the State Governments get maximum revenue right from the start (cradle) to the closure (grave) of the mining operations. It has to be realised that the mines are mostly in tribal and forest areas with no infrastructure facilities. Development of a mine with the attendant infrastructure required there-for will directly impact the socio-economic milieu of the people living in those areas. If acquiring a mine and its continuous operations become unviable, no entrepreneur will be encouraged to acquire a mine and the area will remain backward. States will also lose revenue. Instead of earning more revenue from auction, the State should ensure that investment in mines is viable so as to provide jobs and lead to socio-economic development of these areas. 5.8 As with mineral commodities and metals every new amendment is thought to be an improvement over previous one. MMDR Amendment Act, 2015 was thought to be a “reform” whereas it has not to be growth positive as far as mining is concerned. Old MMDR Act, as amended in December, 1999 following B.B. Tandon Committee Report, should be revived with necessary changes as per National Mineral Policy 2008 which did not accept auction as a tool of resource development. 5.9 In fact auction regime has put the whole process of mineral development into the realm of astrology which cannot be predicted in the mineral and metal trade where boom and depression alternate. Unless the approach of Centre and States changes, Indian mining will continue to have uncertain future. Country will continue to depend on imports for most of the vital raw materials and metals. 5.10 It is sad that India in the last seventy years since Independence in 1947, has not been able to formulate a stable and attractive policy for the development of its resources and continues to be highly unexplored despite having good geological prospectivity. The MMDR Act as amended in December 1999, was a good piece of legislation. It is not the Act which failed; it is the regulatory regime in the States, right from political to civil servants, which failed and we blamed the statute. 5.11 In fact, the regulatory regime, both political and civil, were fully aware of the level of production and the States were realising royalty on the ore produced and transported. In the case of beach sand minerals (BSM), private sector has been debarred for mining, putting jobs of a large sector at stake and deprive the country of revenue to the extent of Rs 5000 crores and exports of about Rs 4000 crores annually. Question arises, if private sector was indulging in malpractices, what was regulatory machinery doing? It is therefore necessary to reform and streamline the regulatory regime to be in line with modern and positive outlook rather than blaming any sector of wrong doing. Let us therefore improve our regulatory mechanism and promote mining to promote growth which will bring all-round prosperity for the people.
___
