mining tera-scale graphs with mapreduce: theory ...ukang/proposal.pdfmining tera-scale graphs with...
TRANSCRIPT

Mining Tera-Scale Graphs withMapReduce: Theory, Engineering
and DiscoveriesU Kang
October 2011CMU-CS-11-XXX
Computer Science DepartmentSchool of Computer ScienceCarnegie Mellon University
Pittsburgh, PA
Thesis Committee:Christos Faloutsos, chair
Tom MitchellGarth Gibson
Robert Grossman, University of Chicago
Submitted in partial fulfillment of the requirementsfor the degree of Doctor of Philosophy.
Copyright c© 2011 U Kang

Keywords: graph mining, MAPREDUCE

Abstract
How do we find patterns and anomalies, on graphs with billions of nodes and edges, whichdo not fit in memory? How to use parallelism for such Tera- or Peta-scale graphs? In thisthesis, we propose a carefully selected set of fundamental operations, that help answer thosequestions, including diameter estimation, solving eigenvalues, and inference on graphs. Wepackage all these operations in PEGASUS, which, to the best of our knowledge, is the firstsuch library, implemented on the top of the HADOOP platform, the open source version ofMAPREDUCE.
One of the key observations in this thesis is that many graph mining operations are essen-tially repeated matrix-vector multiplications. We describe a very important primitive for PE-GASUS, called GIM-V (Generalized Iterated Matrix-Vector multiplication). GIM-V is highlyoptimized, achieving (a) good scale-up on the number of available machines, (b) linear run-ning time on the number of edges, and (c) more than 9 times faster performance over thenon-optimized version of GIM-V.
Finally, we run experiments on real graphs. Our experiments ran on DiscCloud and M45,one of the largest HADOOP clusters available to academia. We report our findings on severalreal graphs, including one of the largest publicly available Web graphs, thanks to Yahoo!,with ∼6,7 billion edges. Some of our most impressive findings are (a) the discovery of adultadvertisers in the who-follows-whom on Twitter, and (b) the 7-degrees of separation in theWeb graph.
Based on our current work, we propose the followings: large scale tensor analysis, graphlayout for better compression, and anomaly detection in network data.

Contents
1 Introduction 11.1 Motivation . . . . . . . . . . . . . . . . . . . . . . . . . . . . . . . . . . . . . . . . . . . 11.2 Completed Work . . . . . . . . . . . . . . . . . . . . . . . . . . . . . . . . . . . . . . . 11.3 Proposed Work . . . . . . . . . . . . . . . . . . . . . . . . . . . . . . . . . . . . . . . . 21.4 Overview . . . . . . . . . . . . . . . . . . . . . . . . . . . . . . . . . . . . . . . . . . . 2
2 Survey 42.1 Large Scale Graph Mining . . . . . . . . . . . . . . . . . . . . . . . . . . . . . . . . . . 42.2 MAPREDUCE and HADOOP . . . . . . . . . . . . . . . . . . . . . . . . . . . . . . . . . 5
3 Completed Work 63.1 Discoveries . . . . . . . . . . . . . . . . . . . . . . . . . . . . . . . . . . . . . . . . . . 6
3.1.1 Radius Plots . . . . . . . . . . . . . . . . . . . . . . . . . . . . . . . . . . . . . 63.1.2 Connected Components . . . . . . . . . . . . . . . . . . . . . . . . . . . . . . . 83.1.3 Triangle Counting . . . . . . . . . . . . . . . . . . . . . . . . . . . . . . . . . . 8
3.2 Algorithms for Large Graph Mining . . . . . . . . . . . . . . . . . . . . . . . . . . . . . 93.2.1 Structure Analysis . . . . . . . . . . . . . . . . . . . . . . . . . . . . . . . . . . 93.2.2 Eigensolver . . . . . . . . . . . . . . . . . . . . . . . . . . . . . . . . . . . . . . 113.2.3 Inference . . . . . . . . . . . . . . . . . . . . . . . . . . . . . . . . . . . . . . . 113.2.4 Storage and Indexing . . . . . . . . . . . . . . . . . . . . . . . . . . . . . . . . . 12
4 Ongoing and Proposed Work 134.1 Task 1: Large Scale Tensor Analysis . . . . . . . . . . . . . . . . . . . . . . . . . . . . . 134.2 Task 2: Graph Layout and Compression . . . . . . . . . . . . . . . . . . . . . . . . . . . 134.3 Task 3: Anomaly Detection in Network Data . . . . . . . . . . . . . . . . . . . . . . . . 144.4 Timeline . . . . . . . . . . . . . . . . . . . . . . . . . . . . . . . . . . . . . . . . . . . . 14
5 Conclusion 15
iv

Chapter 1
Introduction
1.1 Motivation
Graphs are ubiquitous: computer networks, social networks, mobile call networks, the World Wide Web[Broder et al., 2000], protein regulation networks to name a few. The large volume of available data,the low cost of storage and the stunning success of online social networks and web2.0 applications alllead to graphs of unprecedented size. Typical graph mining algorithms silently assume that the graphfits in the memory of a typical workstation, or at least on a single disk; the above graphs violate theseassumptions, spanning multiple Giga-bytes, and heading to Tera- and Peta-bytes of data. A promising toolis parallelism, and specifically MAPREDUCE [Dean and Ghemawat, 2004] and its open source version,HADOOP.
The first question we investigate in our work is: what are the patterns and anomalies that we can discoverin large, real-world graphs with billions of nodes and edges? Large graphs have interesting patterns orregularities including radius, connected components, triangles, and etc. Discovering the patterns helpsus spot anomalies which can be useful for applications ranging from cyber-security (computer networks),phone companies(fraud detection), social networks (spammer detection), to name a few.
The second question we address is: how can we design efficient MAPREDUCE algorithms which lead todiscoveries in graphs of such scale? There are several challenges to answer the question. First, how canwe formulate many graph mining algorithms using simple operations that can be efficiently implementedon MAPREDUCE? Second, how to store the graphs efficiently so that storage spaces are minimized andgraph mining queries can be answered quickly?
1.2 Completed Work
We divide this work into two main sections: discoveries, and algorithms for large graph mining.
We first show discoveries on very large, real-world graphs. The discoveries include patterns and anomaliesin connected components [Kang et al., 2010a][PDF], radius plots [Kang et al., 2010b][PDF] [Kang et al.,2011e][PDF], and triangle counting [Kang et al., 2011b][PDF].
1

Next, we describe algorithms for mining large graphs, including the ones that enabled the discoveries.The algorithms include structure analysis (GIM-V [Kang et al., 2009][PDF] [Kang et al., 2011f][PDF]and HADI [Kang et al., 2010b][PDF] [Kang et al., 2011e][PDF]), eigensolver (HEIGEN) [Kang et al.,2011b][PDF], and inferences (HA-LFP) [Kang et al., 2011a][PDF]. We also study efficient storage andindexing methods for large graphs (GBASE) [Kang et al., 2011d][PDF].
1.3 Proposed Work
The proposed work branches into three.
Large Scale Tensor Analysis. We propose to design an efficient tensor decomposition(e.g. Tucker andPARAFAC) on MAPREDUCE. Tensors, or multi-dimensional arrays, give rich information of complexobjects: examples include predicates(subject, verb, object) in knowledge bases, hyperlinks and anchortexts in Web graphs, sensor stream(time, location, and type), and DBLP conference-author-keyword re-lations [Kolda and Sun, 2008]. The goal is to handle tensors with millions or billions of nonzero en-tries.
Graph Layout and Compression. We propose to study a method for laying out the edges of real worldgraphs, so that they can be easily compressed, and graph mining algorithms based on block matrix-vectormultiplication can run quickly. We observe that many traditional researches for graph compression arenot suitable for real world graphs which do not have clear-cut communities often. Our main idea is basedon the power-law characteristic of complex networks: real world networks have many ‘hub’ nodes withhigh centralities, and the removal of such hub nodes disconnects the graph quickly. Exploiting the idea,we recursively cut ‘hub’ nodes from the graph, and carefully reorder the rest of the nodes so that nonzeroelements are clustered compactly.
Anomaly Detection in Network Data. We propose to find patterns and anomalies in network data, includingP2P network and the StackOverflow Q & A data (stackoverflow.com). For example, we want todetect an insider adversary in a bank who shares sensitive customer information to outside adversarythrough P2P network. We plan to design a scalable method, as well as to apply previously described tools,for the anomaly detection in the data.
1.4 Overview
An outline of the thesis work is shown in Table 1.1. Following a survey of related work in Chapter 2, wediscuss the completed work in Chapter 3 with two subsections in the following order: the discoveries, andthe algorithms for large graph mining. Completed work includes seven published conference papers andtwo published journal papers. Proposed work and a time-line for completion (end date October 2012) isoutlined in Chapter 4.
2

Table 1.1: Outline of thesis work. Click the [PDF] next to the citations, to obtain the pdf of the corre-sponding paper.
Completed Work Ongoing and Proposed WorkDiscoveries Section 3.1 Section 4.3
• Patterns and anomalies in radiusplots [Kang et al., 2011e][PDF]
• Patterns and anomalies in connectedcomponents [Kang et al., 2011b][PDF]
• Patterns and anomalies in trianglecounting [Kang et al., 2010a][PDF]
• Anomaly detection in network data
Algorithms forLarge Graph Min-ing
Section 3.2 Section 4.1, 4.2
• Structure analysis (GIM-V [Kang et al.,2011f][PDF] and HADI [Kang et al.,2011e][PDF])
• Eigensolver (HEIGEN) [Kang et al.,2011b][PDF]
• Inference (HA-LFP) [Kang et al.,2011a][PDF]
• Storage and indexing (GBASE) [Kanget al., 2011d][PDF]
• Large Scale Tensor Analysis• Graph Layout and Compression
3

Chapter 2
Survey
The related works are categorized into two parts: large scale graph mining and MAPREDUCE/HADOOP.
2.1 Large Scale Graph Mining
Research on large scale graph mining has been receiving significant attention. We study existing workson the areas including structural analysis(radius and connected components), eignesolver, and infer-ences.
Radius. The typical algorithms to compute the radius and the diameter of a graph include Breadth FirstSearch (BFS) and Floyd’s algorithm ([Cormen et al., 1990]). Both approaches are prohibitively slow forlarge graphs, requiring O(n2 + nm) and O(n3) time, where n and m are the number of nodes and edges,respectively. For the same reason, related BFS or all-pair shortest-path based algorithms like [Ferrezet al., 1998], [Bader and Madduri, 2008], [Ma and Ma, 1993], [Sinha et al., 1986] can not handle largegraphs. A sampling approach starts BFS from a subset of nodes, typically chosen at random as in [Broderet al., 2000]. Despite its practicality, this approach has no obvious solution for choosing the representativesamples for BFS.
Connected Components. There are many algorithms for computing connected components of a graph,using Breadth-First Search, Depth-First-Search, “propagation” [Shiloach and Vishkin, 1982, Awerbuchand Shiloach, 1983, Hirschberg et al., 1979], or “contraction” [Greiner, June 1994] . These works rely ona shared memory model which limits their ability to handle large, disk-resident graphs.
Eigensolver. There are many parallel eigensolvers for large matrices: the work by Zhao et al. [Zhaoet al., 2007], HPEC [Guarracino et al., 2006], PLANO [Wu and Simon, 1999], PREPACK [R.B. et al.,1998], SCALABLE [Blackford et al., 1997], PLAYBACK [Alpatov et al., 1997] are several examples.All of them are based on MPI with message passing, which has difficulty in dealing with billion-scalegraphs. The maximum order of matrices analyzed with these tools is less than 1 million [Wu and Simon,1999] [Song et al., 2008], which is far from that of the web-scale data with billions of nodes and edges.
4

Very recently(March 2010), the Mahout project [Mah] provides SVD on top of HADOOP. Due to insuffi-cient documentation, we were not able to find the input format and run a head-to-head comparison. But,reading the source code, we discovered that Mahout suffers from two major issues: (a) it assumes that thevector (b, with n=O(billion) entries) fits in the memory of a single machine, and (b) it implements the fullre-orthogonalization which is inefficient.
Inference. Belief Propagation(BP) [Pearl, 1982] is an efficient inference algorithm for probabilisticgraphical models. Since its proposal, it has been widely, and successfully, used in a myriad of domainsto solve many important problems. BP is computationally-efficient; its running time scales linearly withthe number of edges in the graph. However, for graphs with billions of nodes and edges — a focus ofour work — this cost becomes significant. There are several recent works that investigated parallel BPon multicore shared memory [Gonzalez et al., 2009b] and MPI [Gonzalez et al., 2009a, Mendiburu et al.,2007]. However, all of them assume the graphs would fit in the main memory (of a single computer, or acomputer cluster). Our work specifically tackles the important, and increasingly prevalent, situation wherethe graphs would not fit in main memory.
2.2 MAPREDUCE and HADOOP
MAPREDUCE is a programming framework [Dean and Ghemawat, 2004] [Aggarwal et al., 2004] forprocessing huge amounts of unstructured data in a massively parallel way. MAPREDUCE has two ma-jor advantages: (a) the programmer is oblivious of the details of the data distribution, replication, loadbalancing etc. and furthermore (b) the programming concept is familiar, i.e., the concept of functionalprogramming. Briefly, the programmer needs to provide only two functions, a map and a reduce. Thetypical framework is as follows [Lammel, 2008]: (a) the map stage sequentially passes over the input fileand outputs (key, value) pairs; (b) the shuffling stage groups of all values by key, and (c) the reduce stageprocesses the values with the same key and outputs the final result.
HADOOP is the open source implementation of MAPREDUCE. HADOOP provides the Distributed FileSystem (HDFS) and PIG, a high level language for data analysis [Olston et al., 2008]. Due to itspower, simplicity, fault tolerance, and low maintenance costs, HADOOP is a very promising tool for largescale graph mining applications, something already reflected in academia, see [Papadimitriou and Sun,2008] [Kang et al., 2009][PDF] [Kang et al., 2011f][PDF]. In addition to PIG, there are several high-levellanguage and environments for advanced MAPREDUCE-like systems, including Sphere [Grossman andGu, 2008], SCOPE [Chaiken et al., 2008], and Sawzall [Pike et al., 2005].
5

Chapter 3
Completed Work
In this chapter, we first present the discoveries of patterns and anomalies in large, real-world graphs. Then,we describe the algorithms including the ones that enabled such discoveries. Table 3.1 lists the graphsused. The experiments were performed in the DiscCloud and M45 HADOOP clusters. The DiscCloudcluster, provided by Parallel Data Lab in CMU, has 64 machines with 256 Terabyte storage and 1 Terabytememory in total. The M45 cluster by Yahoo!, one of the largest HADOOP clusters available to academia,has total 480 machines with 1.5 Petabyte storage and 3.5 Terabyte memory in total.
Graph Nodes Edges File Size DescriptionYahooWeb 1.4 B 6.6 B 116 G web page links in 2002
Twitter 62.5 M 2.8 B 56 G who follows whom in Nov. 2009U.S. Patent 6 M 16 M 0.3 G patent citations from 1975 to 1999Kronecker 177 K 1,977 M 25 G synthetic Kronecker graphs [Leskovec et al., 2005]
120 K 1,145M 13.9 G59 K 282 M 3.3 G
Erdos-Renyi 177 K 1,977 M 25 G random graphs [Erdos and Renyi, 1959]120 K 1,145 M 13.9 G
59 K 282 M 3.3 G
Table 3.1: Datasets. B: Billion, M: Million, K: Thousand, G: Gigabytes
3.1 Discoveries
We report interesting discoveries in large, real-world graphs. They include the patterns and anomalies inradius plots, connected components, and triangle counting.
3.1.1 Radius Plots
Problem 1. What are the central nodes and outliers in graphs? How closely are nodes in graphs con-nected? How do they change over time?
Our main idea. These questions can be answered by radius plot, which is the distribution of the radiusof nodes. The radius r(v) of node v is the distance between v and a reachable node farthest away from v.
6

The diameter of a graph is the maximum radius of nodes. The effective radius and the effective diameterprovide more robust definitions of the radius and the diameter [Kang et al., 2010b][PDF] [Kang et al.,2011e][PDF].
We analyze the diameter and the radii of YahooWeb and U.S. patent graphs in Figure 3.1 and 3.2, respec-tively. We have the following observations.
(a) Radius plot of YahooWeb (b) Radius plot of GCC of YahooWeb
Figure 3.1: (a) Radius plot(Count versus Radius) of the YahooWeb graph. Notice the effective diameteris surprisingly small. Also notice the peak(marked ‘S’) at radius 2, due to star-structureddisconnected components, and multi-modality which is possibly due to a mixture of relativelysmaller subgraph. (b) Radius plot of GCC(Giant Connected Component) of YahooWeb graph.The only node with radius 5 (marked ‘C’) is google.com.
Small Web. The effective diameter of the YahooWeb graph (year: 2002) is surprisingly small (≈ 7 ∼ 8).google.com has the smallest radius of 5.
Multi-modality of Web graph. The Radius distribution of the Web graph has a multi-modal structure, whichis possibly due to a mixture of relatively smaller subgraphs which got loosely connected recently.
(a) U.S. Patent at 1985 (b) U.S. Patent-Expansion (c) U.S. Patent-Contraction
Figure 3.2: (a) Static radius plot(Count versus Radius) of U.S. Patent. Notice the bi-modal structurewith ‘outsiders’, ‘core’, and ‘whiskers’. (b,c) Radius plot over time. “Expansion”: the radiusdistribution moves to the right until the gelling point. “Contraction”: the radius distributionmoves to the left after the gelling point.
Structure of real graphs. Nodes in real graphs are grouped into three, according to the radius and mem-berships of connected components: 1) outsiders, having the smallest radii and belonging to disconnectedcomponents, 2) core, belonging to the GCC(Giant Connected Component) and having relatively smallradii, and 3) ‘whiskers’, belonging to the GCC and having high radii.
7

Expansion-Contraction. The radius distribution expands to the right until it reaches the gelling point [Mc-glohon et al., 2008], which is the time several disconnected components gel into a huge giant connectedcomponent. After the gelling point, it contracts to the left.
3.1.2 Connected Components
Problem 2. What are the patterns and anomalies in the connected components of a Web graph?
Our main idea. We analyze the size distribution of connected components of the YahooWeb graph inFigure 3.3. We have the following observation which shows the patterns of anomalous web pages [Kanget al., 2009][PDF] [Kang et al., 2011f][PDF].
Figure 3.3: Connected Components of YahooWeb. Notice the two anomalous spikes which deviate sig-nificantly from the constant-slope tail.
Anomalous connected components. In Figure 3.3, we found two outstanding spikes which deviate fromthe ‘power-law’ like size distributions of small disconnected components. In the first spike at size 300,more than half of the components have exactly the same structure and they were made from a domainselling company where each component represents a domain to be sold. The spike happened because thecompany replicated sites using the same template. In the second spike at size 1101, more than 80 % ofthe components are adult sites disconnected from the giant connected component. Again, the adult sitesare generated from a template. By looking at the distribution plot of connected components, we could findinteresting communities with special purposes which are disconnected from the rest of the Internet.
3.1.3 Triangle Counting
Problem 3. What are the patterns and anomalies in the triangle counts and the degrees in social networkgraphs?
Our main idea. We analyze the degree and the number of participating triangles in the Twitter ‘whofollows whom’ graph at year 2009 [Kang et al., 2011b][PDF] in Figure 3.4. We have the followingobservation which can be used to spot and eliminate harmful accounts such as those of adult advertisersand spammers.
8

Figure 3.4: The degree vs. participating triangles of some ‘celebrities’ in Twitter accounts. Also shownare accounts of adult sites which have smaller degree, but belong to an abnormally largenumber of triangles.The reason of the large number of triangles is that adult accounts areoften from the same provider, and they follow each other to form a clique, to possibly boosttheir rankings or popularity.
Anomalous triangles vs. degree ratio. In Figure 3.4, celebrities have high degree and mildly connectedfollowers, while accounts for adult sites have many fewer, but extremely well connected, followers. Thereason is that adult accounts are often from the same provider, and they follow each other to possibly boosttheir rankings or popularity.
3.2 Algorithms for Large Graph Mining
We describe algorithms for large scale graph mining, including the ones that enabled the discoveries inSection 3.1.
3.2.1 Structure Analysis
Problem 4. How can we find connected components, diameter, PageRank, node proximities of very largegraphs quickly? Furthermore, how can we design a general primitive which can be applied to manydifferent algorithms?
Our main idea. We observe that many algorithms, like connected components, diameter, PageRank,and node proximities, can be unified via the GIM-V primitive, standing for Generalized Iterative Matrix-Vector multiplication [Kang et al., 2009][PDF] [Kang et al., 2011f][PDF], which is a generalization of thestandard matrix-vector multiplication. In the GIM-V, we customize the three internal operations(multiply,sum, and assign) in the standard matrix-vector multiplications to define many different algorithms.
Having defined GIM-V, the next question is to design efficient methods for the generalized matrix-vectormultiplication in MAPREDUCE. Our first main idea is to put together several nonzero elements into squareblocks, and perform the block-wise matrix-vector multiplication instead of element-wise multiplication.Our second main idea is to cluster the graph so that nonzero elements in the adjacency matrix are closelylocated, and then compress the nonzero bit strings of each block by standard compression algorithms like
9

gzip. This compression greatly saves space, which leads to faster running time of block-wise matrix-vectormultiplication.
We compared our proposed CCB method which combines the block encoding, clustering, and compres-sion, with other methods including RAW(naive method), NNB(only block encoding), and NCB(blockencoding and compression without clustering). Figure 3.5 shows the result of the disk space and the run-ning time comparison. The ‘Random’ graph refers to both Kronecker and Erdos-Renyi graphs. Note thatGIM-V CCB provides up to 43× smaller storage, 9.2× faster running time. Furthermore, GIM-V CCBenjoys linear scalability on the number of machines and edges, as shown in Figure 3.6.
(a) File size (b) Running time
Figure 3.5: (a) Effect of different encoding methods for GIM-V. The Y-axis is in log scale. Notice ourproposed compressed block encoding on clustered graph(CCB) achieves the best compres-sion, reducing up to 43× smaller than the original(RAW). The ‘Random’ graph has betterperformance gain than real-world graphs since the density is much higher. (b) Running timecomparison of PageRank queries over different storage methods. The CCB method performsthe best, outperforming RAW method up to 9.2×.
1
1.5
2
2.5
3
3.5
25 50 75 100
’’Sca
le u
p’’:
1/T
M
Number of Machines
YahooWebTwitter
Random
80
100
120
140
160
180
200
282M 1146M 1977M
Run
ning
Tim
e in
Sec
onds
Number of Edges
10 machines25 machines40 machines
(a) Scale-up with machines (b) Scale-up with edges
Figure 3.6: (a) Machine scalability of our proposed CCB method. The Y-axis shows the ratio of therunning time TM with M machines, and T25, for PageRank queries. Note the running timesscale up near-linearly with the number of machines. (b) Edge scalability of our proposed CCBmethod. The Y-axis shows the running time in seconds, for PageRank queries on Kroneckergraphs. Note the running times scale up near-linearly with the number of edges for all thesettings(10, 25, and 40 machines).
10
3.2.2 Eigensolver
Problem 5. How can we design a scalable eigensolver? How can we handle skewed matrix-matrixmultiplication where one matrix is much larger than the other?
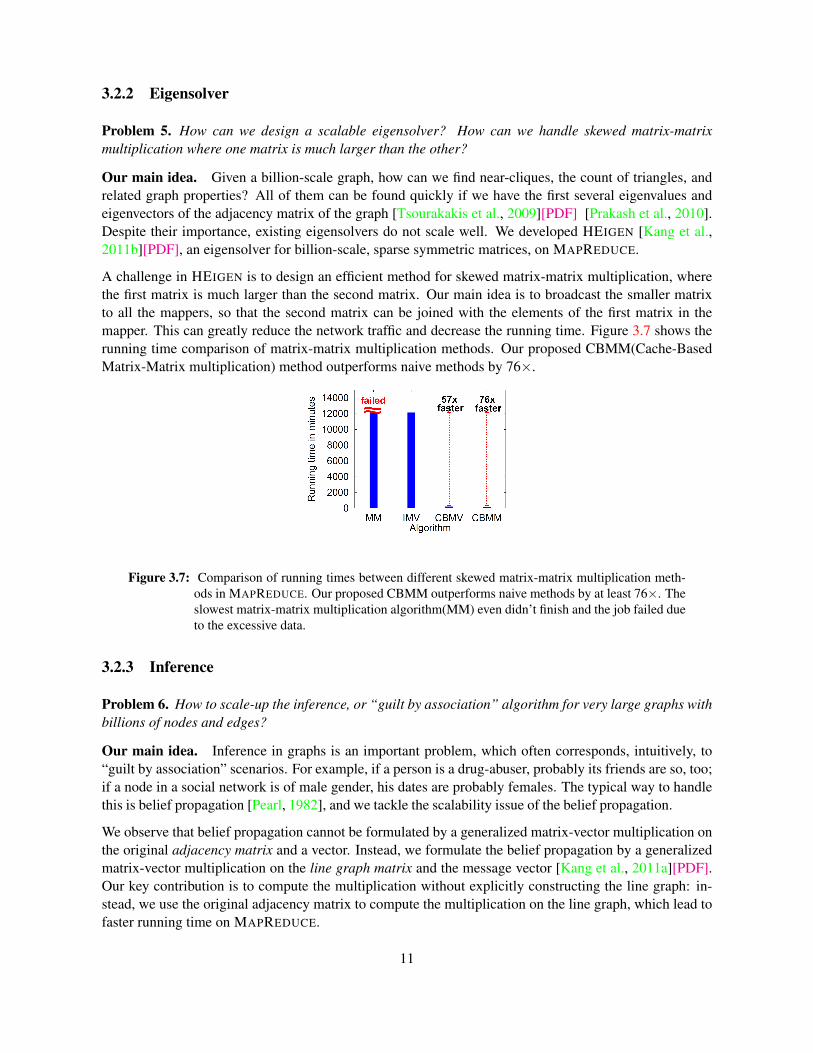
Our main idea. Given a billion-scale graph, how can we find near-cliques, the count of triangles, andrelated graph properties? All of them can be found quickly if we have the first several eigenvalues andeigenvectors of the adjacency matrix of the graph [Tsourakakis et al., 2009][PDF] [Prakash et al., 2010].Despite their importance, existing eigensolvers do not scale well. We developed HEIGEN [Kang et al.,2011b][PDF], an eigensolver for billion-scale, sparse symmetric matrices, on MAPREDUCE.
A challenge in HEIGEN is to design an efficient method for skewed matrix-matrix multiplication, wherethe first matrix is much larger than the second matrix. Our main idea is to broadcast the smaller matrixto all the mappers, so that the second matrix can be joined with the elements of the first matrix in themapper. This can greatly reduce the network traffic and decrease the running time. Figure 3.7 shows therunning time comparison of matrix-matrix multiplication methods. Our proposed CBMM(Cache-BasedMatrix-Matrix multiplication) method outperforms naive methods by 76×.
Figure 3.7: Comparison of running times between different skewed matrix-matrix multiplication meth-ods in MAPREDUCE. Our proposed CBMM outperforms naive methods by at least 76×. Theslowest matrix-matrix multiplication algorithm(MM) even didn’t finish and the job failed dueto the excessive data.
3.2.3 Inference
Problem 6. How to scale-up the inference, or “guilt by association” algorithm for very large graphs withbillions of nodes and edges?
Our main idea. Inference in graphs is an important problem, which often corresponds, intuitively, to“guilt by association” scenarios. For example, if a person is a drug-abuser, probably its friends are so, too;if a node in a social network is of male gender, his dates are probably females. The typical way to handlethis is belief propagation [Pearl, 1982], and we tackle the scalability issue of the belief propagation.
We observe that belief propagation cannot be formulated by a generalized matrix-vector multiplication onthe original adjacency matrix and a vector. Instead, we formulate the belief propagation by a generalizedmatrix-vector multiplication on the line graph matrix and the message vector [Kang et al., 2011a][PDF].Our key contribution is to compute the multiplication without explicitly constructing the line graph: in-stead, we use the original adjacency matrix to compute the multiplication on the line graph, which lead tofaster running time on MAPREDUCE.
11

Figure 3.8 shows the scalability of our proposed HA-LFP algorithm. HA-LFP scales up linearly with thenumber of edges and the machines, respectively.
(a) Scale-up with machines (b) Scale-up with edges
Figure 3.8: (a) “Scale-up” (throughput 1/TM , where TM is the running time with M machines) versusnumber of machines M , of HA-LFP on the YahooWeb graph. Notice the near-linear scale-upclose to the ideal(dotted line). (b) Running time of 1 iterations of message update in HA-LFPon Kronecker graphs. Notice that the running time scales-up linear to the number of edges.
3.2.4 Storage and Indexing
Problem 7. How to store and index graph edge files so that graph mining queries can be answeredquickly?
Our main idea. We consider targeted graph mining queries whose answers require the access to onlyparts of the graph. Examples of targeted queries include k-step in/out-neighbors, and egonet queries [Akogluet al., 2010]. Our GBASE [Kang et al., 2011d][PDF] system solves the problem of efficiently storing andindexing large graphs, with the following main ideas. In the indexing stage, we make rectangular blocksof adjacency matrix, and store several blocks into grids where each grid corresponds to a square-shapedarea in the adjacency matrix. In the query stage, only relevant grids are selected based on the queries. Fig-ure 3.9 shows the performance of this ‘grid selection(GS)’ strategy. Applying the grid selection reducesthe running time by 2.6×(CCB+GS vs. CCB), and the grid selection strategy combined with clusteringand compression performs 4.6× faster than the naive method (CCB+GS vs. RAW).
Figure 3.9: Running times of targeted queries over different storage and indexing methods, on Twittergraph. 1-Nh and 2-Nh denote the 1-step and the 2-step neighborhood queries, respectively.Note that the CCB+GS(grid selection method combined with the clustered zip block encod-ing) outperforms the others by 4.6× at maximum.
12

Chapter 4
Ongoing and Proposed Work
4.1 Task 1: Large Scale Tensor Analysis
Problem 8. How can we design a scalable algorithm for large scale tensor analysis?
Our main idea. Tensors, or multi-dimensional arrays are everywhere: predicates(subject, verb, ob-ject) in knowledge bases [Carlson et al., 2010], hyperlinks and anchor texts in Web graphs [Kolda et al.,2005], sensor stream(time, location, and type) [Sun et al., 2006], and DBLP conference-author-keywordrelations [Kolda and Sun, 2008], to name a few. Analysis of multi-dimensional arrays by tensor decom-positions, as shown in Figure 4.1, have interesting applications including clustering, trend detection, andanomaly detection [Kolda and Sun, 2008]. We propose to design an efficient tensor decomposition(e.g.Tucker and PARAFAC) on MAPREDUCE.
Figure 4.1: A tensor, or a multi-dimensional array, and its decomposition.
4.2 Task 2: Graph Layout and Compression
Problem 9. How can we layout edges of a graph so that they are better compressed and graph miningqueries are answered quickly?
Our main idea. Graph layout and compression is an important problem for reducing storage space andanswering graph mining queries quickly. The traditional research focus was to find homogeneous regionsor communities in the graph so that nodes inside a region are tightly connected to each other than to nodes
13

in other regions. However, clear-cut communities in real world graphs are hard to be found [Leskovecet al., 2008] due to ‘hub’ nodes having high centralities [Kang et al., 2011c][PDF]. We propose to studya method for laying out the edges of real world graphs, so that they can be easily compressed, and graphmining algorithms based on block matrix-vector multiplication can run quickly. Our main idea is basedon the observation that real world graphs are easily disconnected by hubs: removing hubs from a graphcreates many small disconnected components, and the remaining giant connected component is substan-tially smaller than the original graph. We recursively cut the hubs, and carefully reorder the hubs anddisconnected components to achieve better compression.
4.3 Task 3: Anomaly Detection in Network Data
Problem 10. What are the patterns and anomalies in network data?
Our main idea. We propose to find patterns and anomalies in network data, including P2P networkand the StackOverflow Q & A data (stackoverflow.com). The P2P network data contains users,machines, files, and the communication records containing ‘who searched which files’ information. TheStackOverflow Q & A data contains ‘who answered to whom how many times’ records. In both of thedata, the goal is to find suspicious users, who behave in a different way compared to other normal users.For example, we want to detect an insider adversary in a bank who shares sensitive customer informationto outside adversary through P2P network. We plan to design a scalable method, as well as to applypreviously described tools, for the anomaly detection in the data.
4.4 Timeline
Each of task 4.1, 4.2, and 4.3 will take approximately 2-3 months a piece. Projected dissertation comple-tion is in October 2012.
• October 2011: Thesis proposal.
• October - December 2011: Task 4.2: graph layout and compression.
• January - March 2012: Task 4.1: large scale tensor analysis.
• April - June 2012: Task 4.3: anomaly detection in network data.
• June - August 2012: Internship.
• August - September 2012: Thesis writing.
• October 2012: Thesis defense.
14

Chapter 5
Conclusion
This thesis focuses on the discoveries in large, real-world graphs, and the algorithms for mining largegraphs that enabled such discoveries. The main contributions so far include:
• Patterns and anomalies of structural features in large, real world graphs, including the discovery ofanomalous accounts in Twitter, and the 7-degrees of separation in the Web graph.
• Scalable algorithms for mining Tera-scale graphs, including the Generalized Iterative Matrix-VectorMultiplication, the belief propagation, and the eigensolver.
• Methods for efficient storage and indexing of large graphs.
Proposed work can be summarized as follows.
• Large scale tensor analysis.• Graph layout for better compression and efficient query answering.• Anomaly detection in network data.
15
Bibliography
Mahout information. http://lucene.apache.org/mahout/. 5
G. Aggarwal, M. Data, S. Rajagopalan, and M. Ruhl. On the streaming model augmented with a sortingprimitive. Proceedings of FOCS, 2004. 5
L. Akoglu, M. McGlohon, and C. Faloutsos. oddball: Spotting anomalies in weighted graphs. In PAKDD(2), pages 410–421, 2010. 12
P. Alpatov, G. Baker, C. Edward, J. Gunnels, G. Morrow, J. Overfelt, R. van de Gejin, and Y.-J. Wu.Plapack: Parallel linear algebra package - design overview. SC97, 1997. 4
B. Awerbuch and Y. Shiloach. New connectivity and msf algorithms for ultracomputer and pram. ICPP,1983. 4
D. A. Bader and K. Madduri. A graph-theoretic analysis of the human protein-interaction network usingmulticore parallel algorithms. Parallel Comput., 2008. 4
L. Blackford, J. Choi, A. Cleary, E. D’Azevedo, J. Demmel, and I. Dhillon. Scalapack users’s guide.SIAM, 1997. 4
A. Broder, R. Kumar, F. Maghoul, P. Raghavan, S. Rajagopalan, R. Stata, A. Tomkins, and J. Wiener.Graph structure in the web. Computer Networks 33, 2000. 1, 4
A. Carlson, J. Betteridge, B. Kisiel, B. Settles, E. R. H. Jr., and T. M. Mitchell. Toward an architecture fornever-ending language learning. In AAAI, 2010. 13
R. Chaiken, B. Jenkins, P.-A. Larson, B. Ramsey, D. Shakib, S. Weaver, and J. Zhou. Scope: easy andefficient parallel processing of massive data sets. VLDB, 2008. 5
T. Cormen, C. Leiserson, and R. Rivest. Introduction to Algorithms. The MIT Press, 1990. 4
J. Dean and S. Ghemawat. Mapreduce: Simplified data processing on large clusters. OSDI, 2004. 1, 5
P. Erdos and A. Renyi. On random graphs. Publicationes Mathematicae, 6:290–297, 1959. 6
J.-A. Ferrez, K. Fukuda, and T. Liebling. Parallel computation of the diameter of a graph. In HPCSA,1998. 4
J. Gonzalez, Y. Low, C. Guestrin, and D. O’Hallaron. Distributed parallel inference on large factor graphs.In Conference on Uncertainty in Artificial Intelligence (UAI), Montreal, Canada, July 2009a. 5
J. E. Gonzalez, Y. Low, and C. Guestrin. Residual splash for optimally parallelizing belief propagation.AISTAT, 2009b. 5
J. Greiner. A comparison of parallel algorithms for connected components. Proceedings of the 6th ACMSymposium on Parallel Algorithms and Architectures, June 1994. 4
R. L. Grossman and Y. Gu. Data mining using high performance data clouds: experimental studies using
16

sector and sphere. KDD, 2008. 5
M. R. Guarracino, F. Perla, and P. Zanetti. A parallel block lanczos algorithm and its implementation forthe evaluation of some eigenvalues of large sparse symmetric matrices on multicomputers. Int. J. Appl.Math. Comput. Sci., 2006. 4
D. Hirschberg, A. Chandra, and D. Sarwate. Computing connected components on parallel computers.Communications of the ACM, 22(8):461–464, 1979. 4
U. Kang, C. Tsourakakis, and C. Faloutsos. Pegasus: A peta-scale graph mining system - implemen-tation and observations. ICDM, 2009. URL http://www.cs.cmu.edu/˜ukang/papers/PegasusICDM2009.pdf. 2, 5, 8, 9
U. Kang, M. McGlohon, L. Akoglu, and C. Faloutsos. Patterns on the connected components of terabyte-scale graphs. In ICDM, pages 875–880, 2010a. URL http://www.cs.cmu.edu/˜ukang/papers/CCEvolICDM2010.pdf. 1, 3
U. Kang, C. Tsourakakis, A. P. Appel, C. Faloutsos, and J. Leskovec. Radius plots for mining tera-bytescale graphs: Algorithms, patterns, and observations. SIAM International Conference on Data Mining,2010b. URL http://www.cs.cmu.edu/˜ukang/papers/HadiSDM2010.pdf. 1, 2, 7
U. Kang, D. H. Chau, and C. Faloutsos. Mining large graphs: Algorithms, inference, and discover-ies. In ICDE, pages 243–254, 2011a. URL http://www.cs.cmu.edu/˜ukang/papers/HalfpICDE2011.pdf. 2, 3, 11
U. Kang, B. Meeder, and C. Faloutsos. Spectral analysis for billion-scale graphs: Discoveries and im-plementation. In PAKDD (2), pages 13–25, 2011b. URL http://www.cs.cmu.edu/˜ukang/papers/HeigenPAKDD2011.pdf. 1, 2, 3, 8, 11
U. Kang, S. Papadimitriou, J. Sun, and H. Tong. Centralities in large networks: Algorithms and obser-vations. In SDM, pages 119–130, 2011c. URL http://www.cs.cmu.edu/˜ukang/papers/CentralitySDM2011.pdf. 14
U. Kang, H. Tong, J. Sun, C.-Y. Lin, and C. Faloutsos. Gbase: A scalable and general graph managementsystemn. ACM SIGKDD Conference on Knowledge Discovery and Data Mining, 2011d. URL http://www.cs.cmu.edu/˜ukang/papers/GbaseKDD2011.pdf. 2, 3, 12
U. Kang, C. E. Tsourakakis, A. P. Appel, C. Faloutsos, and J. Leskovec. Hadi: Mining radii of largegraphs. ACM Trans. Knowl. Discov. Data, 5:8:1–8:24, February 2011e. ISSN 1556-4681. doi: http://doi.acm.org/10.1145/1921632.1921634. URL http://www.cs.cmu.edu/˜ukang/papers/HadiTKDD2011.pdf. 1, 2, 3, 7
U. Kang, C. E. Tsourakakis, and C. Faloutsos. Pegasus: mining peta-scale graphs. Knowl. Inf. Syst., 27(2):303–325, 2011f. URL http://www.cs.cmu.edu/˜ukang/papers/PegasusKAIS.pdf. 2,3, 5, 8, 9
T. G. Kolda and J. Sun. Scalable tensor decompositions for multi-aspect data mining. In ICDM, pages363–372, 2008. 2, 13
T. G. Kolda, B. W. Bader, and J. P. Kenny. Higher-order web link analysis using multilinear algebra. InICDM, pages 242–249, 2005. 13
R. Lammel. Google’s mapreduce programming model – revisited. Science of Computer Programming,70:1–30, 2008. 5
J. Leskovec, D. Chakrabarti, J. M. Kleinberg, and C. Faloutsos. Realistic, mathematically tractable graphgeneration and evolution, using kronecker multiplication. PKDD, pages 133–145, 2005. 6
17

J. Leskovec, K. J. Lang, A. Dasgupta, and M. W. Mahoney. Statistical properties of community structurein large social and information networks. In WWW, pages 695–704, 2008. 14
J. Ma and S. Ma. Efficient parallel algorithms for some graph theory problems. JCST, 1993. 4
M. Mcglohon, L. Akoglu, and C. Faloutsos. Weighted graphs and disconnected components: patterns anda generator. KDD, pages 524–532, 2008. 8
A. Mendiburu, R. Santana, J. Lozano, and E. Bengoetxea. A parallel framework for loopy belief propaga-tion. GECCO, 2007. 5
C. Olston, B. Reed, U. Srivastava, R. Kumar, and A. Tomkins. Pig latin: a not-so-foreign language fordata processing. In SIGMOD ’08, pages 1099–1110, 2008. 5
S. Papadimitriou and J. Sun. Disco: Distributed co-clustering with map-reduce. ICDM, 2008. 5
J. Pearl. Reverend Bayes on inference engines: A distributed hierarchical approach. In Proceedings of theAAAI National Conference on AI, pages 133–136, 1982. 5, 11
R. Pike, S. Dorward, R. Griesemer, and S. Quinlan. Interpreting the data: Parallel analysis with sawzall.Scientific Programming Journal, 2005. 5
B. A. Prakash, M. Seshadri, A. Sridharan, S. Machiraju, and C. Faloutsos. Eigenspokes: Surprisingpatterns and community structure in large graphs. PAKDD, 2010. 11
J. L. R.B., S. D.C., and Y. C. Arpack user’s guide: Solution of large-scale eigenvalue problems withimplicitly restarted arnoldi methods. SIAM, 1998. 4
Y. Shiloach and U. Vishkin. An o(logn) parallel connectivity algorithm. Journal of Algorithms, pages57–67, 1982. 4
B. P. Sinha, B. B. Bhattacharya, S. Ghose, and P. K. Srimani. A parallel algorithm to compute the shortestpaths and diameter of a graph and its vlsi implementation. IEEE Trans. Comput., 1986. 4
Y. Song, W. Chen, H. Bai, C. Lin, and E. Chang. Parallel spectral clustering. In ECML, 2008. 4
J. Sun, S. Papadimitriou, and P. S. Yu. Window-based tensor analysis on high-dimensional and multi-aspect streams. In ICDM, pages 1076–1080, 2006. 13
C. E. Tsourakakis, U. Kang, G. L. Miller, and C. Faloutsos. Doulion: counting triangles in massivegraphs with a coin. In KDD, pages 837–846, 2009. URL http://www.cs.cmu.edu/˜ukang/papers/kdd09.pdf. 11
K. Wu and H. Simon. A parallel lanczos method for symmetric generalized eigenvalue problems. Com-puting and Visualization in Science, 1999. 4
Y. Zhao, X. Chi, and Q. Cheng. An implementation of parallel eigenvalue computation using dual-levelhybrid parallelism. Lecture Notes in Computer Science, 2007. 4
18