ministry of water resources, works and housing ghana …aug 25, 2011 · edward gyan households’...
TRANSCRIPT
Ministry of Water Resources, Works and Housing
Ghana
Ghana Water Forum Journal First Edition
3rd Ghana Water Forum Water and Sanitation Services Delivery in a Rapidly Changing
Urban Environment 5th – 7th September, 2011

3rd Ghana Water Forum Water and Sanitation Services Delivery in a Rapidly Changing
Urban Environment
College of Physicians and Surgeons, Accra, Ghana 5th – 7th September, 2011
i
Organizing Committee
Mr. Harold Clottey – Chairman of Organizing Committee (Water Directorate, MWRWH) Mr. Minta Aboagye – Former Director for Water, MWRWH Dr. Sumani Alhassan – Director for Water, MWRWH Ms. Patricia Buah – Forum Coordinator (Water Directorate, MWRWH) Mr. Harold Esseku – Forum Process Consultant (Rapha Consult) Mr. Attah Arhin – Chair, Sponsorship & Procurement Sub-Committee (Water Directorate, MWRWH) Mr. Stanley Martey – Chair, Publicity Sub-Committee (Ghana Water Company Limited) Ms. Bertha Darteh – Chair, Technical Sub-Committee (SWITCH) Mrs. Adwoa Dako (Water Resources Commission) Mrs. Theodora Adomako-Adjei (Community Water and Sanitation Agency) Mr. Michael Agyeman (Ghana Water Company Limited) Mrs. Vida Nyenku (Environmental Health and Sanitation Directorate, MLGRD) Dr. Frederick Amu-Mensah (Water Research Institute) Dr. Benjamin Gyampoh (International Water Management Institute) Mr. Samuel Appenteng (Association of Ghana Industries) Mr. Kwame Frempah-Yeboah (CIDA) Mr. Samuel Amoako-Mensah (UNICEF) Ms. Lamisi Dabire (Triple-S) Mr. Abu Wumbei (Resources Centre Network) Mr. Alexander Obuobisa-Darko (WASHCost) Mr. Emmanuel Addai (Water and Sanitation Monitoring Platform) Mr. Oduro Donkor (CONIWAS) Mr. Peter Serinye (WATSAN Journalists Network) Mr. Karim Janfaru Saeed (Vestergaard Frandsen West Africa Limited) Mr. Abraham Otabil (Public Relations, MWRWH) Ms. Suzzy Abaidoo (Water Directorate, MWRWH) Mr. Albert Ekuful (Water Directorate, MWRWH) Mr. Kwabena Asare Gyasi-Duku (Water Directorate, MWRWH) Mr. Enoch Ofosu (Water Directorate, MWRWH) Mrs. Louisa Wosey-Kumah (Water Directorate, MWRWH) Ms. Anita Effah (Water Directorate, MWRWH)
Paper Review Committee
Dr. Frederick Amu-Mensah – Chairman (Water Research Institute) Dr. Patrick Moriarty – (IRC) Mr. Joseph Kenneth Buckson (Ghana Institution of Engineers) Dr. Edward Sabi (University of Ghana) Dr. Kwabena Nyarko (WASHCost / Kwame Nkrumah University of Science and Technology)
Journal Editors
Dr. Frederick Amu-Mensah (Water Research Institute) Mr. Kwabena Asare Gyasi-Duku (Water Directorate, MWRWH) Ms. Patricia Buah (Water Directorate, MWRWH) Mr. Attah Arhin (Water Directorate, MWRWH)

ii
Table of Contents
SANITATION
Improving Sanitation in Poor Urban Areas: The Role of Non-State Actors in the Sanitation Service Delivery in Ashaiman Municipality, Ghana 2 Abena Korang Acheampong Abaitey Potential Energy Recovery from Wastewater Treatment - Study of UASB Reactor in Accra, Ghana 8 K.M. Afful Implementing Environmental Sanitation Policies and Plans 17 S.E. Amekudzie, R. Boakye & K.M. Afful Improving Access to Basic Sanitation in Ghana. Lessons from a Water and Sanitation Project in Ghana 23 Joseph Ampadu-Boakye, Francis Mawuena Dotse, Nii Odai Anidaso Laryea, Daniel Yaw Karikari & Edward Gyan Households’ Perception of Community Toilets in Low Income Communities in Kumasi 31 E.O. Appiah & S. Oduro-Kwarteng Motivation for Construction of Household Toilets in Low Income Communities in Kumasi 38 E.O. Appiah & S. Oduro-Kwarteng Meeting Ghana’s MDG Target on Sanitation, through Dissemination of Biogas Plants 45 Richard Arthur & Edward Antwi Ghana’s Revised Environmental Sanitation Policy 2010: A Review 52 Edem Cudjoe Bensah, Edward Antwi & Julius Cudjoe Ahiekpor The Canker of Open Defecation 60 Nii Odai Anidaso Laryea, Joseph Ampadu-Boakye, Francis Mawuena Dotse, Daniel Yaw Karikari & Edward Gyan No Household Sanitation Facilities: What Options Remain For Urban Dwellers? 66 Adrien Mazeau, Benedict Tuffuor & Kevin Sansom Biofil Toilet Digester: An Innovative On-Site Treatment 74 V. Mema & Evelyn Gyampo
WATER The Human Factor in Urban Water Services in Ghana 82 Matthew Adombire Wet Oxidation of Paper Mill Debarking Water: Improving the Rates of Contaminant Removal 87 Daniel Adjah Anang
iii
Quality Drinking Water for Rural Communities: Technology Options 94 Edward Antwi, Edem Cudjoe Bensah, Julius Cudjoe Ahiekpor, Richard Arthur & Elijah Boadu Cost of Rural and Small Town Water Service Delivery in the Bosomtwe District 102 E. Appiah-Effah, K.B. Nyarko, B. Dwumfour-Asare & P. Moriarty Degradation of Water Resources and the Effect on Drinking Water Treatment in Ghana 110 Evans Y. Balaara & Nicholas H. Okyere Promoting Decentralised Solar Water Purification Systems in Ghana: A Case Study at Bongo 115 Edem Cudjoe Bensah, Edward Antwi & Julius Cudjoe Ahiekpor Supply Constraints of Utility Water Services to Newly Developing Private Estates in Accra 122 Hector Emmanuel Adjetey Boye Characterisation and Adsorption Potential of Kpong Water Treatment Plant Filter Media 128 R. Buamah & A. Yakubu Comparative Study of the Physico-Chemical and Bacteriological Quality of Drinking Water in Kumasi and Ho Metropolitan Areas 135 Philip Dwamena-Boateng, Bright Kofi Bansah, Oppong Manu Michael & Raphael K .Klake Evaluating the Implications of Future Water Resource Development under Current and Projected Climate in the Volta Basin 140 Gerald Forkuor, Matthew McCartney & Barnabas Amisigo Capacity Development Tools for Improving Solid Waste Management Services Delivery in Metropolitan, Municipal and District Assemblies in Ghana 150 Kodwo Beedu Keelson Rainwater Harvesting (RWH) as a Complementary Approach to Improving Water Supply in Ghana 158 Jemila Mashood, Joseph Ampadu-Boakye & Nii Odai Anidaso Laryea Decentralised Water Supply for Low Income Urban Areas: Institutional Arrangements and Forms of Agreement 163 Kwabena Nyarko & Tim Hayward Performance of a Multi-District Water Supply Scheme in Ghana – Case Study of the Three District Water Supply Scheme 170 K. B. Nyarko, S. Oduro-Kwarteng, B. Dwumfour-Asare & J. H. Ankomah Cancer Health Risk Assessment of Resident Adults and Children from Exposure to Arsenic in Contaminated Water Bodies in Obuasi Municipality 178 S. Obiri, A. F. Armah & A. P. Awuah Suitability of the Private Finance Initiative (PFI) System for Adoption in Ghana’s Water Sector 186 Ofori-Kuragu K, Attafua Y.B. & Lamptey L. J.

iv
Towards a Sustainable Allocation of Potable Water in Ghana: Evidence from Kumasi 194 J. D. Quartey Impacts of Energy Price Changes on the Financial Sustainability of Water Facilities: Case from Ghana 203 S. J. Tenkorang, S. N. Odai, F. O. Annor & K. A. Adjei The Urban Pro-Poor Water Services Delivery – The Access Dimension: The Case of AVRL Tanker Service Supply 210 Benedict Tuffuor, Eugene Larbi & Anne Barendregt Economic Efficiency of Water Storage Options: An Application of the Approach to Ghana 217 Stefanos Xenarios, Felix Asante & Matthew McCartney
POSTER PRESENTATION ABSTRACTS The Effects of Climate Change – The Anthropogenic Factor on Vea Reservoir 227 Etornyo Agbeko & Barnabas Amisigo Enhancing Sustainability of Water and Sanitation Facilities through Mobile Phone Technology 228 Patrick Apoya & Aelaf Dafla Construction of Ferrocement Rain-Harvesting Tanks 229 L. Danso-Amoako & Herbert Attefuah No Toilet at Home: Sanitation Strategies for Urban Dwellers 231 Adrien Mazeau

1
Theme: Sanitation
2
_______________________________________________________________________
3rd Ghana Water Forum, Accra, Ghana, 2011 Water and Sanitation Services Delivery in a Rapidly Changing Urban Environment
Improving Sanitation in Poor Urban Areas: The Role of Non-State
Actors in the Sanitation Service Delivery in Ashaiman Municipality, Ghana
Abena Korang Acheampong Abaitey
_______________________________________________________________________________
Abstract This paper presents a study on sanitation service delivery in an urban poor locality in Ghana,
Ashaiman. Ashaiman is a sprawling urban settlement in Ghana and suffers from poor sanitary
conditions. Close to 80 per cent of households in the Tulaku area, a suburb of Ashaiman, do not
have toilet facilities in their homes because landlords did not deem it necessary to construct toilet
facilities (Ashaiman Medium Term Development Plan, 2008-2011). Most public toilet facilities are
also in a deplorable state. As a result of these inadequacies, there is over dependence on the few
public toilet facilities and this has further led to indiscriminate defecation in open spaces and
bushes.Compounding the problems discussed above, is the poor attitude of residents who
indiscriminately dispose of refuse, and again, most residents refuse to pay refuse fees. The poor
attitudinal problem has made it increasingly difficult for city authorities to maintain good
sanitation in the communities despite several interventions adopted by the government, as well as,
civil society organizations to improve the appalling sanitation situation.
The study sought to discuss the role played by non-state actors’ sanitation service delivery. The
study identified some challenges confronting the sanitation delivery in Ashaiman as; Inadequate
budgetary and financial allocation for implementing sanitation action plans, lack of sanitation
byelaws at the municipal level, thus, weak or no enforcement of laws, Deficient capacity of civil
society to mobilize the community to engage in sanitation exercises, the Lack of coordination
between local authority and other stakeholders, and the lack of community engagement in the
sanitation service delivery.
A major finding that emerged from the study was that there were a range of community actors in
sanitation delivery, not withstanding, they were not recognized as important stakeholders and
local authorities hardly partner with them in the process of change.
The study has discussed measures of improving sanitation in the poor urban localities of Ghana
and recommends that if local authorities collaborate with non-state actors, especially informal
service providers and community based groups, it would enhance improvement in the sanitation
situation in poor urban localities.
________________________________________________________________________________
Introduction Urban Local authorities in Ghana are grappling with the growing sanitation crisis in their
localities. Ashaiman, a sprawling ‘urban slum’ and the fifth largest settlement in the Greater Accra
Region of Ghana is one of such municipalities. Despite various interventions adopted by the

3
Government and civil society organizations, the problems continuously persist. Current sanitation
delivery approaches are not able to integrate effective pro-poor community partnerships in a
meaningful way.
The question to ask is, how can communities’ be engaged to improve the sanitation situation in
their vicinities?
The objectives of the study were:
To identify the range of significant community actors in the sanitation sector at Ashaiman and
to find out what each can do to bring about improvement in sanitation;
To suggest appropriate ways of engaging community actors in supporting sanitation service
delivery in the sanitation situation in Ashaiman Municipality;
To provide adequate information and basis to guide communities and local authorities in the
efficient delivery of sanitation services especially in poor urban communities of Ghana.
Analysis and Discussion Current Conditions and Practices
In most parts of Ashaiman, drains have been used as waste receptacles, and residents often do so
especially at night. During rains too, residents often dump refuse in the drains. The Waste
Management Officer reported that,
“Residents do so as if the collector has come”.
Non-state actors play a significant role in sanitation service delivery in Ashaiman. The study
revealed that over 400 informal service providers popularly called the “truck pushers” operate in
house to house solid waste collection in Ashaiman. They offer quick services, and their charges are
comparatively cheaper. Most residents prefer this option because they pay small amounts on daily
basis and charges are flexible and negotiable. Charges are based on the quantum of refuse and are
determined by the service provider. However, there is little recognition of their roles by local
governments. In an interview with a truck pusher, he said,
“I have been working for the past 2 years and I am satisfied with the work I am doing
because it is good. I earn at least not less than GH¢25 ($20) a day. Apart from the money,
I contribute a lot to keep the communities clean. The Zoomlion alone (private service
provider) cannot do this work. The Assembly must not drive as away since we are willing
to pay our license”.
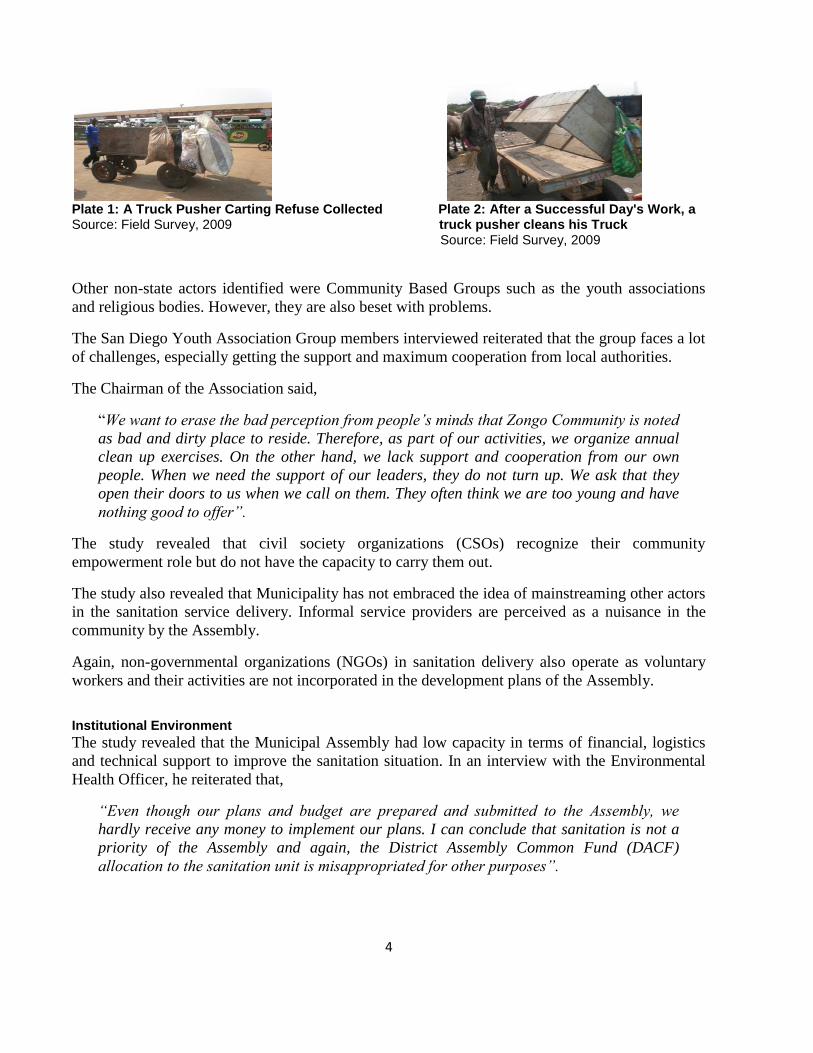
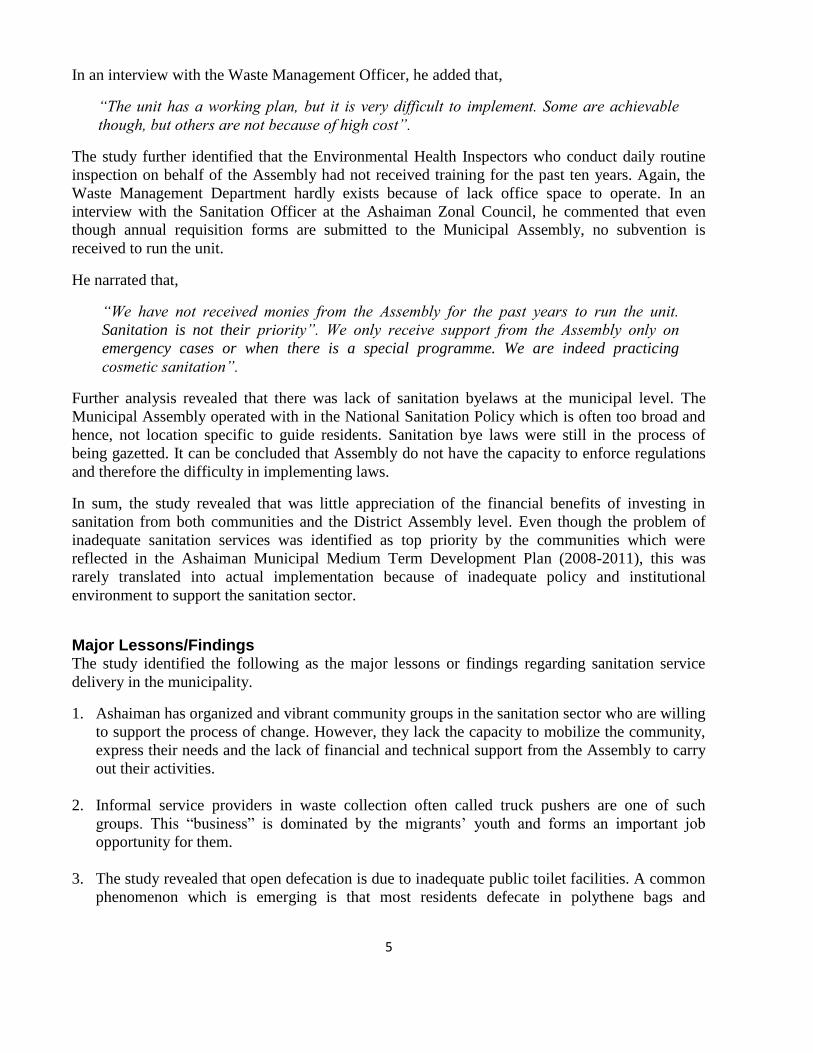
Plates 1 and 2 below show truck pushers on their daily routine.
4
Plate 1: A Truck Pusher Carting Refuse Collected Plate 2: After a Successful Day's Work, a Source: Field Survey, 2009 truck pusher cleans his Truck
Source: Field Survey, 2009
Other non-state actors identified were Community Based Groups such as the youth associations
and religious bodies. However, they are also beset with problems.
The San Diego Youth Association Group members interviewed reiterated that the group faces a lot
of challenges, especially getting the support and maximum cooperation from local authorities.
The Chairman of the Association said,
“We want to erase the bad perception from people’s minds that Zongo Community is noted
as bad and dirty place to reside. Therefore, as part of our activities, we organize annual
clean up exercises. On the other hand, we lack support and cooperation from our own
people. When we need the support of our leaders, they do not turn up. We ask that they
open their doors to us when we call on them. They often think we are too young and have
nothing good to offer”.
The study revealed that civil society organizations (CSOs) recognize their community
empowerment role but do not have the capacity to carry them out.
The study also revealed that Municipality has not embraced the idea of mainstreaming other actors
in the sanitation service delivery. Informal service providers are perceived as a nuisance in the
community by the Assembly.
Again, non-governmental organizations (NGOs) in sanitation delivery also operate as voluntary
workers and their activities are not incorporated in the development plans of the Assembly.
Institutional Environment
The study revealed that the Municipal Assembly had low capacity in terms of financial, logistics
and technical support to improve the sanitation situation. In an interview with the Environmental
Health Officer, he reiterated that,
“Even though our plans and budget are prepared and submitted to the Assembly, we
hardly receive any money to implement our plans. I can conclude that sanitation is not a
priority of the Assembly and again, the District Assembly Common Fund (DACF)
allocation to the sanitation unit is misappropriated for other purposes”.
5
In an interview with the Waste Management Officer, he added that,
“The unit has a working plan, but it is very difficult to implement. Some are achievable
though, but others are not because of high cost”.
The study further identified that the Environmental Health Inspectors who conduct daily routine
inspection on behalf of the Assembly had not received training for the past ten years. Again, the
Waste Management Department hardly exists because of lack office space to operate. In an
interview with the Sanitation Officer at the Ashaiman Zonal Council, he commented that even
though annual requisition forms are submitted to the Municipal Assembly, no subvention is
received to run the unit.
He narrated that,
“We have not received monies from the Assembly for the past years to run the unit.
Sanitation is not their priority”. We only receive support from the Assembly only on
emergency cases or when there is a special programme. We are indeed practicing
cosmetic sanitation”.
Further analysis revealed that there was lack of sanitation byelaws at the municipal level. The
Municipal Assembly operated with in the National Sanitation Policy which is often too broad and
hence, not location specific to guide residents. Sanitation bye laws were still in the process of
being gazetted. It can be concluded that Assembly do not have the capacity to enforce regulations
and therefore the difficulty in implementing laws.
In sum, the study revealed that was little appreciation of the financial benefits of investing in
sanitation from both communities and the District Assembly level. Even though the problem of
inadequate sanitation services was identified as top priority by the communities which were
reflected in the Ashaiman Municipal Medium Term Development Plan (2008-2011), this was
rarely translated into actual implementation because of inadequate policy and institutional
environment to support the sanitation sector.
Major Lessons/Findings The study identified the following as the major lessons or findings regarding sanitation service
delivery in the municipality.
1. Ashaiman has organized and vibrant community groups in the sanitation sector who are willing
to support the process of change. However, they lack the capacity to mobilize the community,
express their needs and the lack of financial and technical support from the Assembly to carry
out their activities.
2. Informal service providers in waste collection often called truck pushers are one of such
groups. This “business” is dominated by the migrants’ youth and forms an important job
opportunity for them.
3. The study revealed that open defecation is due to inadequate public toilet facilities. A common
phenomenon which is emerging is that most residents defecate in polythene bags and
6
indiscriminately dispose of them in open drains. These open drains also serve as defecating
grounds for children and some adults especially during the night.
4. The Municipal Assembly lacks the capacity to in terms of financial, logistical and technical
constraints to ensure good sanitation.
5. CSOs in the sanitation sector activities’ are not mainstreamed in the medium term development
plans of the Assembly. They are rarely recognized as important stakeholders in local level
development and local authorities hardly partner with them in the process of change.
Recommendations and Conclusion It is recommended that improvement in the sanitation services especially in poor urban areas can
be sustained through the co-operation and concerted efforts of municipal authorities, non-
government organizations, community-based organizations, as well as, the entire community. This
paper suggests successful implementation of the following actions;
Mainstreaming Non-State Actors in the Sanitation Delivery
If governments have interest in addressing sanitation needs, it can start by simply recognising
the important roles played by community actors especially the informal private providers by
mainstreaming them into the formal system. Identification and Mapping activity of
Stakeholders through an inventory process in the sanitation sector should be carried out to
support the process of bringing change.
Assign Roles and Responsibilities to Community Actors
Assemblies can assign specific roles in the sanitation sector. Different components of
sanitation such as solid waste management, community public toilet facilities supervision,
public dump site management, and drains cleansing should be taken care of by specific groups
in the community. This would ensure community ownership and create a sense responsibility
by every member of the community.
Institutionalization of Regulatory Procedures
The Ashaiman Municipal Assembly must institute regulatory measures such as sanitation
byelaws to ensure that people do the “right thing”. Laws must be enforced and punity measures
such as payment of huge fines must be instituted to serve as deterrent to others. However,
much would be achieved if the building regulation (as stipulated in the National building
regulations), that enjoins every builder to provide a private place of convenience within the
building is enforced by the Assembly.
Strengthening of Monitoring Control Team
The Ashaiman municipality monitoring task force’s capacity must be strengthened in terms of
providing adequate logistics to carry out daily routine inspections. The Environmental Health
and the Waste Management Department of the Assembly must be resourced and adequate
capacity building training must be given to staff to help improve general sanitation in the
Municipality.
In conclusion, it was recognised that the role played by non-state actors in sanitation sector is very
enormous and hence, can contribute immensely to the local level development. Non-state actors
including informal private providers must be seen as a fundamental first step in the process of

7
engagement. This requires little investment and therefore less risk. More importantly, local
governments must commit efforts to train and build their capacity so that they support the process
of change in the sanitation sector of their localities. _______________________________________________________________________________
Acknowledgement I acknowledge the following people for their immense contributions towards this piece.
Dr. Esther Ofei-Aboagye, Director ILGS
Dr. Johnny Astrand, Director, HDM, Lund University, Sweden
Maria Rummueson, Lecturer, HDM, Lund University Sweden
Dr. Kwadwo Ohene Sarfoh, Dean, Consultancy and Advisory Department, ILGS
Mr. Kate, Waste Management Department , Ashaiman Municipal Assembly
Mr. Blondel Akun Abaitey, Managing Director, Nugroove Ltd
_______________________________________________________________________________
References 1. Ashaiman Medium Term Development Plan (2008-2011) Ashaiman Municipal Assembly,
Municipal Planning Coordinating Unit.
2. Kar Kamar and Robert Chambers (2008) Handbook on Community led Total Sanitation
Approach, Plan international and IDA www. Ida.org.com assessed on February, 2010.
3. Yin, R.K. (1994) Case Study Research, Design and Methods, Applied Social Research
Methods Series, Vol.5 Sage Publications, United Kingdom, London.
_______________________________________________________________________________
Contact Details Abena Korang Abaitey (Mrs.)
Institute of Local Government Studies (ILGS)
P.O. Box LG 549
Legon, Accra
Cell: 0244-989907 or 0264-989907
Office: 0302-508817 or 508818 or 508063
Fax: 0302-508818
Email: [email protected] or [email protected]
_______________________________________________________________________________

8
3rd Ghana Water Forum, Accra, Ghana, 2011
Water and Sanitation Services Delivery in a Rapidly Changing Urban Environment
Potential Energy Recovery from Wastewater Treatment - Study of UASB Reactor in Accra, Ghana
K.M. Afful
_______________________________________________________________________________
Abstract In 2000, the Accra Sewerage Treatment Plant (ASTP) incorporating the Upflow Anaerobic Sludge
Blanket (UASB) technology among other treatment units was commissioned (the UASB is the main
treatment process). The plant was designed to handle about 16,000m3/d of sewage. As per the
design, the biogas produced was flared off and the dried sludge was sold as fertilizer.
Unfortunately, plant operations failed after it was handed over to the Accra Metropolitan
Assembly (AMA), the city authority. Currently the plant is non-functional and the sewage is
bypassed into the Korle Lagoon, severely polluting it. A study was carried out to determine the
"methane recovery potential" of the ASTP from treating sewage, feacal sludge and septage flows
with available data obtained during the plant's operational years. A simplified version of the IWA
Anaerobic Digestion Model No. 1 (ADM1)(D.J Bastone, J Keller et al. 2002a) was developed and
implemented AQUASIM1(Reichert 1998).
Results from the study shows that the UASB has the capacity of treating the sewage flow with
additional 30 and 50 trucks per day of faecal sludge of public toilet origin and septage. This mix
of flows has a gas generation potential of about 4165 CH4 m3/d. This amount of gas flow has an
annual economic benefit of 950,000GHC (equivalent to 475,000€)
Introduction The management of sewage, septage and public toilet effluent in Accra, capital city of Ghana has
been very poor over the past several decades and it is becoming worse. The overflow of septage
from septic tanks into drains and water courses and indiscriminate disposal of public toilet effluent
pollutes the immediate environment including rivers and the sea with drastic effects on the
recreational value of our beaches. With increasing population and urban housing stock more septic
tanks and public toilets are being constructed and the challenges of poor septage management will
increase several folds; domestic and public toilets using vaults without drain-fields, public toilets
and cesspits are the main sources of septage and faecal sludge. The situation of septage treatment
in the Greater Accra Metropolitan Area, in particular, is dire – all the gains made during the early
1990s by strategically locating treatment plants at Achimota, Teshie-Nungua (Fertilizer) and Korle
Gonno (Lavender Hill) is completely naught. The closure of the Achimota Treatment Plant
(redeveloped into a Transport Terminal) and the recent closure of the Teshie Faecal Sludge
Treatment Plants (FSTPs) has resulted in more truck loads of septage and faecal sludge being
diverted to the Korle Gonno site which does not offer any form of treatment. This situation has
brought to the fore the urgent need to revisit AMA’s Accra Sewage Treatment Plant which has
1 A computer program for the identification and simulation of Aquatic Systems

9
Upflow Anaerobic Sludge Blanket (UASB) reactor cells as the main treatment process. The plant
was commissioned in 2000 and its management handed over to the AMA in 2002; it has remained
largely non-operational since then.
As part of efforts to rehabilitate the plant and restore treatment, an urgent need of the city
authority, a simulation of the UASB compartment of the full scale plant was carried out with
available data obtained on the plant during its operational years. This study was carried out mainly
to assess the capacity of the existing plant to treat additional organic loads from septage and public
toilets generated from the city. Also it focused on the "methane recovery potential" of the facility
from treating these waste streams. A major set-back to simulating the full-scale UASB was the
lack of requisite data for a more detailed model development to describe a wide range of key
parameters of importance in the anaerobic digestion process. Nonetheless, the full scale UASB
was simulated to predict methane (CH4), effluent COD and TSS concentrations.
The Accra Sewerage Treatment Plant (ASTP) Sewage enters the works from the Central Accra Pumping Station (CAPS). Pumps deliver the raw
influent to the elevated inlet works structure and from this point forward it flows through the
process by gravity. The initial treatment at the headworks provides for duty/standby stainless steel
fine screens and gravity grit channels. The primary plant consists of six separate UASB reactor
cells, having a total volume of approximately 6500m3. Each compartment is equipped with gas-
liquid-solids separators in which the biogas is collected before it is directed to the flare stack.
Adjacent to each UASB reactor is a gravity thickener that thickens the stabilised sludge from the
UASB, and additionally treats sludge from the latter stages of the process. Sludge from the
thickeners is pumped directly to sludge drying beds. Two fixed growth reactors or trickling filters
(TFs) and two final settling tanks (FSTs) provide secondary and tertiary treatment to the effluent
stream. The rotating distribution arms of the TFs are reaction-driven stainless steel, further
reducing the need for additional power consumption and costly maintenance requirements. The
FSTs incorporate energy diffusing inlets and periphery screening to further enhance effluent
quality. The treated final effluent was discharged to the estuarine waters of the tidal Korle Lagoon
(see Figure 1).

10
Figure 1: Schematic Diagram of Accra Sewage Treatment Plant (adapted from report of Titia Des Mes).
Materials and Methods The UASB reactor is considered to consist of the liquid and gas phase. The liquid phase contains
soluble components, particulate substrate and the biomass. The gas phase contains the biogas that
escapes from the liquid phase. For this study one (1) enzymatic process (hydrolysis), four (4)
biological processes (acidogenesis, methanogenesis, decay of acidogens and decay of
methanogens) and one (1) gas-liquid transfer process were considered.
Biochemical Process
In the ADM1, fermentation of 8 different substrates is considered separately with 7 bacterial
population required for the description of the process. The ADM1 as fully proposed would require
simultaneous solution of mass-balance equations for each individual substrate and bacterial
population for the system to be described. Such treatment is extremely complex, yielding
equations with numerous unknown parameters. Hence the idea for the development and adoption
of a simplified version of the ADM1 was driven by the objectives of the study and the availability
of data for input and calibration of the model. The seven (7) groups of bacteria in the ADM1 were
therefore divided into two major groups: acid producing bacteria and methane producing micro
organisms (Noykoya, Muller et al. 2002).
screen
Grit channel
Influent
Overflow
Grit channel
screen
Primary distribution boxes
Secondary distribution box
Tertiary distribution box
Sludge thickener
Gas hood
Pen stocks
UASB 1UASB 2UASB 3UASB 4UASB 5UASB 6
Effluent channel
CAPS
Trickling Filter
FST Trickling Filter
FST
Final Effluent to Korle Lagoon
Sea
out-
fall
Slu
dg
e D
ryin
g B
eds
Slu
dg
e D
ryin
g B
eds
11
Physico-Chemical Processes
In this model only the methane (CH4) gas component was considered.
Wastewater Characterisation
As a first step to determining the influent fractions into the model, the soluble biodegradable (Ss),
particulate biodegradable (Xs), soluble inert (Si) and particulate inert (Xs) were determined based
on the percentage biodegradability of the influent COD relying on data from Des Mes (2002).
Model Implementation
The model was implemented in AQUASIM: Computer Program for the Identification and
Simulation of Aquatic Systems (Reichert 1998). The model has been implemented as consisting of
two compartments: reactor and the headspace. A diffusive link was used to describe gas transfer
between the reactor and the headspace. There were two other "virtual" compartments with
advective links for effluent flow and waste sludge collection. A bifurcation link was also defined
to describe the recirculation of particulates that escape through the effluent.
The reactor was assumed to be a Completely Stirred Tank Reactor (CSTR). Similarly the
headspace was implemented as mixed reactor compartment. In addition to these, two other
compartments, outlet and WAS collector were defined for effluent and waste sludge flows
respectively. A diffusive link was defined from reactor to headspace. Advective links were defined
from reactor to outlet compartment and from reactor to WAS collector compartment. There was a
bifurcation link on reactor to outlet compartment link to describe the recirculation of solids in the
effluent back into the reactor compartment.
The identified conversion processes namely: hydrolysis, acidogenesis, methanogenesis and
biomass decay, were then defined in the process compartment of the AQUASIM. The dynamic
simulation of the entire duration was then defined. With the described processes and the
appropriate state variables active in the defined program compartment, the simulation was then
performed.
Results and Discussion Calibration and Validation of Model
The model was calibrated with the average values of measured data on methane generation, COD
and TSS in the effluent for the period of 21st August 2002 - 21st November 2002. Due to
insufficient sets of data the model was not validated. An iterative method was used for the
calibration of the parameters to fit the model output to the measured data. The estimated parameter
values providing the best fitting between model outputs and measured data are given in Table 1.
During calibration influent COD fractions, yield of acidogenes on substrate (Yac), yield of
methanogens on substrate (Ych4) and the hydrolysis (khyd) constant were found to be most sensitive.

12
(a) (b) (c)
Figure 2: Comparison between measured average methane production (a), effluent COD (b), effluent TSS (c) and the model calculation
As can be seen in Figure 2 (a), there is a disparity (about 16%) between the measured data and
model calculation. This percentage deviation was expected to be higher due to the following:
From the data obtained it was assumed that 70% (theoretical fraction of methane in biogas) of
the measured gas was methane, meaning the other gaseous by products of the anaerobic
digestion process (CO2, H2S, N2) makes up the remaining 30%. This proportion may be a little
under estimated. For instance average influent sulphate measured is 50mg/l (Des Mes 2002).
Theoretically this sulphate concentration oxidises about 2% of available COD (1g SO42-
is
takes up to 0.67 gCOD). At low concentrations of sulfate, sulfate-reducing bacteria compete
with methanogenic archaea for hydrogen and acetate, and at high concentration the sulfate
reducing bacteria also compete with acetogenic bacteria for propionate and butyrate. Sulfate-
reducing bacteria can easily out-compete hydrogenotrophic methanogens for hydrogen (Stams,
Plugge et al. 2005).
Also in the model it was assumed that all the gas that collected in the headspace was methane.
This again is not necessarily true since there are/may be other gases such as CO2, H2, H2S, N2.
This reduces the total pressure of gas in the headspace and hence its ratio with atmospheric
pressure. In the model, the higher the pressure in the headspace, the higher the calculated
methane production.
Again the model did not consider methane lost in the effluent and that all the methane
produced escapes into the gaseous phase.
Figure 2 (b) shows the comparison between measured average effluent COD and the model
calculation of average effluent COD. Due to the long solids retention time (SRT) and hydraulic
retention time (HRT), the effluent COD is assumed to be made up mainly of soluble
unbiodegradable COD (Si). Also in reality, a UASB reactor is not completely stirred tank reactor
(CSTR) but rather, solids concentration generally decrease with increase in height. On the other
hand, the reactor compartment was modeled as a CSTR.
Figure 2 (c) shows the comparison between measured average effluent TSS and the model
calculation of average effluent TSS. The model fitted well with effluent TSS concentration. In the
model, effluent TSS was calculated by the sum of particulate COD in the effluent divided by the

13
COD:VSS ratio of 1.5gCOD/gVSS (to convert the COD to VSS) and the effluent particulate
inorganic suspended solids.
Table 1: Summary of Model Parameters after Calibration
Parameter Symbol Value Unit Reference/Remarks
Fraction of Ss f_COD
_Ss
0.491 Ratio Based on model
calibration
Fraction of Xs f_COD
_Xs
0.308
8
Ratio Based on model
calibration
Fraction of Si f_COD
_Si
0.122 Ratio Based on model
calibration
Fraction of Xi f_COD
_Xi
0.077
2
Ratio Based on model
calibration
Fraction of inert particulates in
effluent
f_Xeff 0.01 Ratio Based on model
calibration
Fraction of soluble inerts from
decay of complex particulates
f_SI_xs 0.1 Ratio Bastone et al 2002a
Fraction of particulate inerts
from acidogenic biomass
f_XI_x
s
0.25 Ratio Bastone et al 2002a
Hydrolysis constant khyd 0.1 d-1
Bastone et al 2002a
Half saturation constant Ks,ss 0.022 kgCOD m-3
Bastone et al 2002a
Maximum specific uptake rate km,ss 51 kgCOD
COD-1
d-1
Bastone et al 2002a
Yield of acidogenes on
substrate
Yac 0.085 COD COD-1
Bastone et al 2002a
First order decay rate kdec,ac 0.02 d-1
Bastone et al 2002a
Half saturation constant Ks,ch4 0.5 kgCOD m-3
Bastone et al 2002a
Maximum specific uptake rate km,ch4 19 kgCOD
COD-1
d-1
Bastone et al 2002a
Yield of methanogens on
substrate
Ych4 0.04 COD COD-1
Bastone et al 2002a
Decay constant kdec,ch4 0.02 d-1
Bastone et al 2002a
Modeling Studies
The calibrated model was used to predict the extent to which the UASB can accommodate the
additional loads and the amount of methane generated from treating the organic loads.
Three wastewater streams from the city of Accra were identified under this study. These are
sewage, septage and faecal sludge from public toilet origin discharges (we have either discussed
this earlier or should have done so). Model calculations for CH4 production, COD effluent, TSS

14
effluent and flux of excess sludge is presented and discussed. These results are presented in Table
2.
Table 2: Model predictions for various scenarios
Scenario Model Prediction
CH4
(m3/d)
Effluent COD Flux
(kgCOD/d)
Flux of Excess
Sludge (kgTSS/d)
1. Sewage only 2763 527 3574
2. Sewage + Septage 2802 2354 3545
3. Sewage + Faecal Sludge from public toilet 4266 5229 8477
4. Sewage + Septage + Faecal Sludge from
public toilet
4294 5428 8294
Based on the design of the ASTP the trickling filter was designed for an average COD load of
6,580kg COD day-1
, the sludge thickener was designed for an excess sludge waste of 7420 kgTSS
day-1
in 8 hours and the drying beds for 9750kg TSS day-1
.
From the results of (Table 2), all 4 scenarios meet the average design COD loading for the
trickling filter. Scenarios 3 and 4 exceed the average TSS load for the thickeners. Nonetheless, it
must be noted that influent wastewater streams parameters for the study were measured in-situ. In
reality the influent wastewater into the reactors will have undergone some primary treatment as
mechanical screening and grit removal will reduce to an extent the influent TSS concentrations and
by extension reduce the TSS flux (because TSS concentration in the reactor is reduced). Same can
also be said for CH4 production and effluent COD.
Determination of Extra Organic Loads from Septage and Public Toilet
The limiting parameter regarding the capacity of the plant to treat loads from septage and public
toilet is the TSS load. The allowable TSS flux was set to 7420kgTSS/day (designed excess sludge
load).
This gave total flow of septage and public toilet of 780m3/d. With an average daily truck volume
of 9.5m3/d, the plant can accommodate approximately 80 trucks/day. Going by the daily flow
proportion of about 35% public toilet and 65% septage, the plant can then accommodate about 30
trucks public toilet content and 50 trucks of septage content. The estimated methane production is
4165m3/d.
Overview of Economic Benefit from Methane
This section makes an estimation of the amount of income that could be made from the sale of
biogas (Van Lier 2010) and estimated as follows:
100kg COD produces approximately 35m3 CH4. Therefore 4165m3 CH4 will represents
11,785kgCOD.
1tonne COD is equivalent to 3820kWh-e. With 0.85 efficiency of gas treatment unit and a
motor efficiency of 40%, 11.785tonnes COD will generate 11.785 x 3820 x 0.85 x 40% =
15,306 kWh-e.
15
In Ghana, current 1kWh cost 0.17 GHC. Hence 15,306 kWh-e will cost approximately
2,602GHC. Hence annual income from gas sale is equivalent to 950,000GHC (equivalent to
475,000€)
Conclusion and Recommendation Conclusion
The study revealed the applicability of simplified ADM 1 for UASB treating municipal waste
water in the prediction of effluent characteristics.
There may be an under estimation of the potential methane produced due because the methane
produced from conversion of H2 and CO2 is not included in the model.
Due to the unavailability of enough data for the model development, calibration and validation,
there is wide uncertainty with the use of this model for precise forecasting. That
notwithstanding it gives a fair forecast than can be used for planning purposes. Recommendation
Extensive study into influent characterisation of the various waste water streams should be
implemented as part of the O&M management of the plant.
Expansion of the model to describe other processes that were not considered under this study.
The predicted methane production could be treated with addition of extra harvesting and
processing unit and sold to nearby brewery industry. There is therefore the need for an
extensive financial model to determine the economic viability of this measure.
________________________________________________________________________________
Acknowledgement The author will like to thank Prof. Jules van Lier, Carlos Lopez Vasquez and Lukman Salifu for their
support at various stages of this study.
________________________________________________________________________________
References 1. D.J Bastone, J Keller, et al. (2002a). Anaerobic Digestion Model No.1. London, IWA
Publishing.
2. Des Mes, T. (2002). Municipal Wastewater Treatment in Accra-Commissioning Sewage
Treatment Works containing UASB
3. Noykoya, N., T. G. Muller, et al. (2002). "Quantitative Analysis of Anaerobic Wastewater
Treatment Processes: Identifiability and Parameter Estimation." Biotechnology and
Bioengineering Vol. 78 No.1.
4. Reichert, R. (1998). Computer Program for the Identification and Simulation of Aquatic
Systems: AQUASIM 2.0 - User Manual, Swiss Federal Institute for Environmental Science and
Technology (EAWAG).

16
5. Stams, A. J. M., C. M. Plugge, et al. (2005). "Metabolic interactions in methanogenic and
sulfate-reducing bioreactors." Water Science and Technology 52(1-2): 13-20.
6. Van Lier, J. B. (2010). Lecture Note - Anaerobic Wastewater Treatment.
________________________________________________________________________________
Keywords Upflow Anaerobic Sludge Blanket (UASB), Methane, Anaerobic Digestion Model.
________________________________________________________________________________

17
________________________________________________________________________________
3rd Ghana Water Forum, Accra, Ghana, 2011
Water and Sanitation Services Delivery in a Rapidly Changing Urban Environment
Implementing Environmental Sanitation Policies and Plans
S.E. Amekudzie, R. Boakye & K.M. Afful
________________________________________________________________________________
Abstract The Environmental Sanitation Assessment and Audit (ESAA) process has been applied in the water
and environmental sanitation sector as situational and facilities assessment tool since 2007. Salifu
et al. during the 33rd
WEDC International Conference Accra, 2008 gave a generic overview of the
ESAA process. A major output of ESAA is the preparation of Town Environmental Sanitation
Development Plan (TESDP) which outlines specific interventions to be undertaken within a
specified period. This paper discusses the relevance of the ESAA process as the "building block"
to meeting the overall objectives of the Environmental Sanitation Policy. The paper goes further to
assess the level of implementation of interventions proposed in the accompanying TESDP.
Information gathered under the study shows that although quite a number of ESAAs have been
conducted across regions in Ghana, implementation of proposed interventions is very low. The
Central Government’s showing more commitments to funds allocation for implementing
environmental sanitation interventions and the development of the capacity of Metropolitan,
Municipal and District Assemblies (MMDAs) to market their TESDPs, are among some of the
recommendations.
________________________________________________________________________________
Introduction The National Environmental Sanitation Strategy and Action Plan (NESSAP) 2010, prepared to
give the national Environmental Sanitation Policy (ESP, revised 2010), “legs”, as part of its
measures to expedite and guide the systematic development and implementation of programmes
and services in the water and environmental sanitation (WES) sector recommended that,
Metropolitan, Municipal and District Assemblies (MMDAs) develop strategic District
Environmental Sanitation Strategy and Action Plans (DESSAPs). The DESSAPs shall not be static
but rather be updated regularly. In order to meet the objectives of the DESSAP as well as a
measure to support research into appropriate technologies to meet the needs of all segments of
society, especially the vulnerable and poor people, the ESP (revised 2010), proposed "carrying out
assessments to determine effective demand of communities (urban, peri-urban, small towns and
rural) for environmental sanitation infrastructure". A budget of GH¢ 6,000,000 has been set aside
in the accompanying Strategic Environmental Sanitation Investment Plan (SESIP) for carrying out
ESAAs over the period 2011-2015.
Environmental Sanitation Assessment and Audit (ESAA) comprise two major processes-
assessment and auditing. The assessment involves a situational appraisal of the town and
comprises field observations and surveys. The auditing processing on the other hand involves
finding out the extent to which laid down regulations, guidelines and/or procedures are followed

18
and adhered to by respective District Assemblies (local governments). The detail stages of the
process are presented in Figure 1.
Figure 1: Framework for conducting Environmental Sanitation Assessment and Audit (Salifu et al., 2008)
Relevance of ESAA in Meeting Policy Objectives The ESAA process is highly participatory and in conformity with Strategic Environmental
Assessment (SEA) principles. Participatory tools used in the assessment and audit process are
derived from the Practical Guide on Strategic Environmental Assessment (SEA) of Water and
Environmental Sanitation and supplemented with additional information from other sources. The
environmental sanitation components assessed where applicable include- watershed management,
water supply, storm water/sullage disposal, solid waste management, liquid (faecal) waste
disposal, health and hygiene practices and environmental sanitation bye-laws. These components
have also been defined in the policy, as the main components of environmental sanitation. The
ESAAs due to their participatory approach ensure community ownership and more importantly
allows for the bottom-up approach which the policy recommends.
ESAAs form the basis for the preparation of TESDPs and financing packages which shall be
further aggregated into the DESSAPs. Figure 2 shows the hierarchy of planning process to meet
policy objectives.
Figure 2: Flow chart for environmental sanitation assessment and audit
Source: Inception report (2007), Environmental Sanitation Assessment and Audit in Small Towns (Mankessim, Kissi, Twifo Manpong)
Figure 2: Flow chart for environmental sanitation assessment and audit
Audit
Managements Improvements
Plan Improvements
Policy Recommendations
Framework for Audit (prototype)
Assessment
Define Scope of Environmental Sanitation
Assessment and Audit
Develop Audit Framework
Administer survey
Instruments
Evaluate and Analyze
Documents
Develop instruments for
Assessment
Identify gaps, overlaps
etc
Assemble all relevant Documents – Guidelines,
Regulations, Standards, etc.
Compile and Analyze
Findings
Conduct Audit
Compile and Analyze
Findings
OUTPUTS

19
Figure 2: Hierarchy of planning process to meet policy objectives (modified from NESSAP document,
2010)
Review of Implementation of Proposed TESDPs The TESDP closely follows the generic format prepared for use by cities under the first phase of
the Urban Environmental Sanitation Project (UESP-I), aspects of the Guidelines for Preparing
Waste Management Plans published by the Environmental Protection Agency (EPA) and the
Ministry of Local Government and Rural Development (MLGRD); the Operational Manual for
Planning, Budgeting, Monitoring and Evaluation, for Water and Environmental Sanitation
prepared by the National Development Planning Council (NDPC) and the Community Water and
Sanitation Agency (CWSA); and the Handbook for Preparation of District Environmental
Sanitation and Action Plan (DESSAP) prepared by the Environmental Health and Sanitation
Directorate (EHSD) of the MLGRD. The TESDPs have been broken down into separate packages
for easier implementation-usually three packages within a 10-15 year planning horizon with each
package covering the various components of environmental sanitation.
From the review of available information on ESAAs carried out and their accompanying TESDPs
prepared for about 20 towns across 4 regions starting 2007, only a couple of the proposed
interventions have been implemented to date (see Table 1). Furthermore, these implemented
interventions only constitute a part of the first package of the three-package implementation plan.
The failure of the respective district assemblies to implement these interventions is largely due to
lack of funds. The districts also lack the capacity to solicit for funds from development partners
and always rely on funds from central government/projects. This poses a question on how
equipped our MMDAs regarding managing their roles in the delivery of facilities and services to
their communities.
DISTRICT LEVEL
Projects
(Feasibility Studies /ESAAs)
DESSAPs
Environmental Sanitation Policy etc POLICIES
NESSAP SESIP PLANS (NATIONAL
LEVEL)
TESDP/Financing Packages
TOWNS/COMMUNITY
LEVEL

20
A close look at Table 1 shows two (2) ESAAs carried out in Akplabanya alone. The first carried
out in 2008 by CWSA under the DANIDA supported Water and Sanitation Sector Programme
Support Phase I (WSSPS I, 1998 - 2003) and the other in 2010 under the Government of Ghana
(GoG)/DANIDA-supported Local Services Delivery and Governance Programme (LSGDP) -
Environmental Sanitation Sub-Component. This again raises the issue of effective coordination
within the sector in streamlining activities and programmes often leading to duplication of efforts.
Although the NESSAP proposes that ESAA be carried out in urban, rural small and peri-urban
towns, from the review, the ESAAs carried so far have been largely skewed towards small towns
and communities neglecting the urban and peri-urban areas. It is worth noting that the challenges
facing the urban/peri-urban areas (due to rapid urbanisation) are enormous and complex and have a
dire effect on facilities and services, hence planning for such areas have to be given all the
attention it needs.
Table 1: Review of TESDPs and level of implementation of proposed interventions (Package 1 only).
REGION DISTRICT TOWN YEAR OF
ESAA
LEVEL OF
IMPLEMENTATION
DONOR- /PROGRAMME/PROJECT
Mfantsiman Municipal Mankessim* 2007
Komenda Edina Eguafo Abirem Kissi 2007
Twifo Hemang Lower Denkyira Twifo Mamapong 2007
Abura Asebu Kwamankese Surodofo 2010
Assin North Assin Adiembra 2010
Gomoa East Gomoa Akwamu 2010
Dangme West Asutsuare 2008
Dangme West Dawa 2008
Dangme East Sege 2008
Dangme East Akplabanya 2008
Ga East Abokobi 2008
Tema Municipal Oyibi 2008
Ga South Obom 2010
Dangme West Kodiabe 2010
Dangme East Akplabanya 2010
Atiwa Anyinam 2010
Kwahu East Kotosu 2010
Kwahu North Mame Krobo 2010
Jasikan New Ayoma 2010
Ketu North Penyi 2010
Nkwanta South Brewaniase 2010
Total 17 20
Volta (3)
Central (6)
Greater
Accra (8)
Eastern (3)
DANIDA-Water and Sanitation Sector
Support Programme (WSSPSII) –
District Based Water and Sanitation
(DBWS) Component
Government of Ghana (GoG)/Danida-
Local Service Del ivery and Governance
Programme (LSDGP)-Environmental
Sanitation Sub–Component
DANIDA-Water and Sanitation Sector
Support Programme (WSSPSII) –
District Based Water and Sanitation
(DBWS) Component
Government of Ghana (GoG)/Danida-
Local Service Del ivery and Governance
Programme (LSDGP)-Environmental
Sanitation Sub–Component
* Urban Town
Not Implemented
Partially Implemented/
Implementation in progress
Fully Implemented
21
Recommendation and Conclusion To meet the set targets in both the revised ESP 2010 and NESSAP for improving environmental
sanitation services delivery and facilities, the following suggestions are worth considering:
The Central Government as the prime benefactor shows more commitment by ensuring it
provides the needed funding investments allocated to it in the Strategic Environmental
Sanitation Investment Plan (SESIP).
The ESAAs process is also adopted in carrying out assessments for identifying Water and
Environmental Sanitation (WES) improvement interventions for urban and peri-urban areas.
Budgetary allocations for the implementation of ESAA interventions/TESDPs should be
considered in the design of projects/programmes in which ESAA forms a part.
Development of capacity of MMDAs to market their TESDPs/DESSAPs
Development of a results-based monitoring and evaluation (R-B M&E) mechanism for
assessing the relevance of ESAAs as situational assessment and audit tool for the (WES) sector
by tracking the improvements in the delivery of services and facilities for towns in which
ESAA recommendations/TESDPS have been implemented.
Effective coordination between WES sector players in the carrying out of ESAAs and the
implementation of TESDPs to avoid duplication of efforts.
________________________________________________________________________________
Acknowledgements The authors would like to extend thanks to Mr. Lukman Y. Salifu-WasteCare Associates, Mr. Issaka
Musah of Water and Sanitation for the Urban Poor (WSUP) Project and Mr. Donkor Badu of the
Greater Accra Regional Office of the Community Water and Sanitation Agency.
________________________________________________________________________________
References 1. L.Y. Salifu, K.M Afful & E.Darko-Mensah, Environmental Sanitation Assessment Aids Town
Environmental Sanitation Planning-33rd WEDC International Conference, Accra, Ghana, 2008
2. National Environmental Sanitation Policy (Revised 2010)
3. National Environmental Sanitation Strategy and Action Plan (NESSAP 2010)
4. Strategic Environmental Sanitation Strategy and Action Plan (SESIP 2010)
________________________________________________________________________________
Keywords Environmental sanitation assessment and audit, town environmental sanitation development plans
22
Contact Details Amekudzie Selasi Elorm
Environmental Scientist
WasteCare Associates
P. O Box LG 486
Legon, Accra-Ghana
Tel: 233-302-786072
Email: [email protected]
Rhoda Boakye
Assistant Engineer
WasteCare Associates
P. O Box LG 486
Legon, Accra-Ghana
Tel: 233-302-786072
Email: [email protected]
_______________________________________________________________________________

23
________________________________________________________________________________
3rd Ghana Water Forum, Accra, Ghana, 2011
Water and Sanitation Services Delivery in a Rapidly Changing Urban Environment Improving Access to Basic Sanitation in Ghana. Lessons from a Water
and Sanitation Project in Ghana Joseph Ampadu-Boakye, Francis Mawuena Dotse, Nii Odai Anidaso Laryea, Daniel Yaw Karikari
& Edward Gyan
________________________________________________________________________________
Abstract The Rural Water Supply Programme IV is one of several water and sanitation projects
implemented in Ghana with the objective of improving access to safe sanitation and potable water
and to improve health conditions. The provision of subsidised household demonstration latrines
and hygiene education was the main strategy adopted by the project for sanitation promotion. A
review of the outcome of the sanitation promotion component of the project established varied
uptake of latrines between different districts – ranging from 5% to 150% of what was planned.
This paper discusses the processes and outcome of the sanitation component of the project and
draws key lessons useful for subsequent sanitation promotion interventions in both the rural and
urban context in Ghana.
________________________________________________________________________________
Introduction Improving access to basic sanitation is a priority of Ghana government as a means to improving
health status and living conditions of people. Relevant sections of the Ghana Shared Growth and
Development Agenda (2010-2013), National Water Policy and the National Environmental
Sanitation Policy underscore the importance of sanitation in Ghana’s development agenda.
Notwithstanding this level of interest in promoting sanitation, the results in terms of access and
coverage rates have been abysmal. The Joint Monitoring Platform (JMP) reports that sanitation
coverage in Ghana was 13% in 2008 with the coverage in rural and urban areas being 18% and 7%
respectively. Ghana aims at achieving 54% coverage for sanitation by 2015 and 100% by 2025%
(Republic of Ghana, 2011). To accelerate the process towards attaining the MDG target for
sanitation and addressing other environmental sanitation issues in Ghana, a National
Environmental Sanitation Strategy and Action Plan (NESSAP) and an accompanying Strategic
Environmental Sanitation Investment Plan (SESIP) have been developed. A National Rural
Sanitation Model and Scaling up Strategy based on a two prong approach of sanitation marketing
and community led total sanitation (CLTS) has also been developed in 2010 but is yet to be
implemented.
The Rural Water Supply Programme IV was one of several water and sanitation projects that did
not yield the expected impact in improving access to basic sanitation. The project was
implemented in 15 districts of the Ashanti Region of Ghana from January 2005 to January 2009
and was jointly financed by Kreditanstalt fur Wiederaufbau (KfW) and the Government of Ghana
within the framework of the National Community Water and Sanitation Programme (NCWSP).
Following the implementation of the project, a number of valuable lessons have emerged which

24
are critical in Ghana’s drive to improve sanitation coverage in order to meet the MDG target of
54% coverage for sanitation.
Institutional Framework of Sanitation Sector In Ghana, responsibility for sanitation is within the ambit of three main government institutions i.e.
Ministry of Local Government and Rural Development (MLGRD) supported by the
Environmental Health and Sanitation Directorate, Community Water and Sanitation Agency
(CWSA) and Metropolitan, Municipal and District Assemblies (MMDAs). The Ministry of Local
Government and Rural Development is the lead government agency responsible for broad policy
formulation, implementation, monitoring and evaluation of sanitation. CWSA facilitates basic
sanitation promotion as part of its strategy for rural and small towns’ water provision and hygiene
education and supports MLGRD to develop and apply international norms in the sanitation sector
(Republic of Ghana, 2008). MMDAs are responsible for planning and delivery of sanitation
services.
Overview of the Project and Strategy The goal of the Rural Water Supply Programme IV was to improve the livelihood and health of
about 300,000 people in the region by improving access to potable water and safe sanitation and
hygiene. CWSA estimates its contribution to rural sanitation coverage in Ashanti Region to be
8.45% as at 2006 (ibid). Only 3.4% of the population practiced open defecation while 87% of the
household population used sanitary means of excreta disposal including shared facilities (GSS,
2006). The project entailed facilitating the construction of 3,400 demonstration household VIP
latrines through provision of subsidies. The project was implemented within the framework of the
National Community Water and Sanitation Programme (NCWSP) developed by CWSA. The
NCWSP had as one of its principles, the integration of water, sanitation and hygiene promotion in
project implementation and the provision of subsidies as an approach to sanitation promotion as at
2006. In 2008, the approach to sanitation was reviewed to include adopting innovative approaches
such as CLTS, encouraging behavioural change and providing targeted subsidies (up to 2015) for
demonstration latrines.
The project provided support for the formation and training of District Water and Sanitation Teams
(DWSTs) and Water and Sanitation Committees (WATSANs) to be responsible for hygiene and
sanitation promotion at the district and community levels respectively. In addition, Partner
Organisations 2(POs) were engaged and trained by the project consultant to provide training to the
581 beneficiary communities and their WATSANs. The POs carried out hygiene education and
sanitation promotion for all residents and also as part of the training programme for WATSAN
Committees.
The extension activities by POs terminated after the signing of a Facilities Management Plan
(FMP) to allow for drilling and pump installation. After drilling and pump installation, the POs
resume extension activities in the communities. The scheduled break in extension activities was for
an anticipated period of 8-10 months, but in almost all cases, the break extended beyond this. In
2 A Partner Organisation is either a community based organization or a small consulting firm whose services have
been engaged to undertake community mobilization and hygiene education in respect of projects being undertaken in communities within the framework of NCWSP

25
some districts, the break was close to 2 years. Drilling and pump installation activities under the
project were beset with numerous administrative, financial and technical problems from the start
and throughout the project. The delay in drilling and pump installation brought in its trail, loss of
momentum by the WATSAN committees as most of them failed to meet regularly during the
period of inactivity and a lull in the construction of the household latrines given the absence of the
POs to reinforce and sustain the hygiene and sanitation promotion messages facilitated during the
pre-drilling phase.
A total of 190 latrine artisans were trained by the project in the 15 districts to support household
latrine construction. The latrine artisans were also trained to promote the concept of individual
sanitation not only for their own benefit of getting business but also to expand the concept.
Given the available resources to construct 3,400 VIP demonstration latrines in the 15 beneficiary
DAs, the project decided to share the facilities equally among the beneficiary districts. In this
connection, it was agreed to allocate 226 to each district. The project consultant in concert with
CWSA and DAs agreed to restrict the construction of the household latrines to communities which
would be beneficiaries of the water facilities. The rationale for this decision was to ensure
consistency in the anticipated impact of the project interventions on the living standards of
beneficiary communities. In other words, it was decided not to promote the construction of
household sanitation facilities in communities that would not benefit from the water facilities.
The construction of the demonstration latrines and provision of subsidy was administered in line
with procedures instituted by CWSA illustrated in Figure 1.
Figure 1: Application Process
Potential beneficiaries were to apply through WATSAN and DWST to the DAs. After site
inspection and its approval by the DWST, the DA gave approval pledging to pay the subsidy after
the VIP had been constructed in accordance with design criteria. The beneficiary then bought the
material and approached one of the trained latrine artisans and negotiated with him the costs of
construction whereby he/she could reduce costs by doing the pit digging by him/herself and by
using local materials (mud bricks instead of concrete blocks, grass instead of iron sheets etc.).
After completion and inspection by the DWST, the DA would release the subsidy. The DA was to
administer a revolving fund of about GH¢2,000.00 from which to pay the subsidy and then seek
refund through CWSA from project funds. A cash subsidy of GH¢90.30 for the Mozambique VIP
and GH¢97.70 for the Rectangular VIP was paid to each beneficiary upon certification of a latrine.
This was expected to cover about 50% of the total cost of constructing a basic household VIP
latrine. It was to cover the cost of artisan fees, squat slab, vent slab, cover slab and vent pipe for a
basic latrine.
Project Results In the course of the project, it became obvious that the hygiene education and the provision of
subsidy towards construction of household latrines showed remarkably varied uptake of household
Submit
application to
Watsan
/PO/DWST
DWST/DA
vets
application
DWST inspects
site and
approves
application
DA pledges to
pay subsidy
Beneficiary
approaches LA
for construction
DWST inspects
completed
latrine
DA releases
subsidy
26
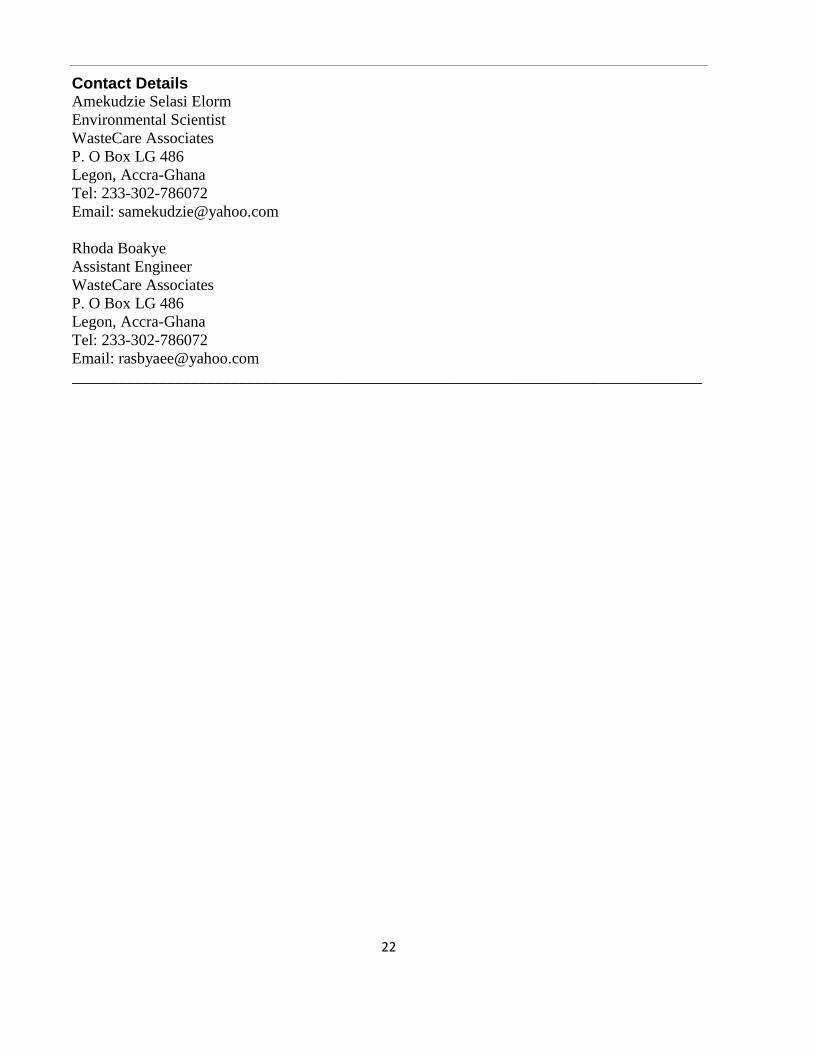
latrines across the beneficiary districts ranging from 5% to 150% of the planned uptake. Out of a
total allocation of 3,400 household VIP latrines, only 2,172 (63.9%) latrines were constructed
between January 2005 and November 2009 as shown in Table 1. The implication is that the project
strategy for sanitation promotion could not raise the beneficiaries’ interest in owning a VIP.
Potential beneficiaries of the project showed little enthusiasm in constructing private latrines and
rather preferred communal latrines.
Table 1: Household VIP Latrines Constructed under Project
Name of district Number of
communities
No. of VIP
Latrines
Constructed
No of VIP
Latrines
Allocated
% of VIP
Latrines
Constructed
Ejura-Sekyedumase 34 10 226 4.4
Sekyere West 24 103 226 45.6
Afigya Sekyere 30 162 226 71.7
Kwabre 32 200 226 88.5
Atwima Nwabiagya 37 176 226 77.9
Atwima Mponua 29 206 226 91.2
Amansie West 47 126 226 55.8
Amansie Central 74 340 226 150.4
Obuasi 22 9 226 4.0
Adansi South 53 165 226 73.0
Adansi North 42 77 226 34.1
Amansie East 55 173 226 76.5
Bosomtwi Atwima
Kwanwoma 39 286 226 126.5
Asante Akim North 45 61 226 27.0
Asante Akim South 18 78 226 34.5
Total 581 2,172 3,400 63.9
Source: Preliminary Final Report, RWSP IV, December 2010
The Amansie Central and Bosomtwi Atwima Kwanwoma districts were the only districts that were
able to utilise their maximum allocation of 226 latrines. This can be attributed to the high morale
among staff of the DWST in the two districts. The DWSTs received financial support from their
27
respective DAs which enabled them conduct follow up visits to beneficiary communities when PO
activities had terminated. It was also realised that the location and distribution of trained latrine
artisans had an effect on the uptake of latrines. The Amansie Central and Bosomtwi Atwima
Kwanwoma districts had most of their trained latrine artisans resident either within or fairly close
to the beneficiary communities as compared to other districts and so were able to market the
household latrines.
About 40% of the districts were able to construct less than 50% of their maximum allocation. The
performance of Obuasi and Ejura Sekyedumase districts was very dismal representing about 4% of
facilities allocated. The expected demonstration effect of the promotion of household latrine
construction did not materialise in these areas. It was only in Atwima Mponua and Amansie
Central districts that there have been claims of household latrine construction without subsidy.
These claims are yet to be investigated and documented.
A lot of factors account for the poor uptake of latrines and the low demonstration effect of
sanitation promotion strategy. Firstly, the majority of rural community members in Ghana consider
excreta disposal as a temporary inconvenience and are not too enthusiastic about accessing
improved sanitation facilities. Having a household toilet is not a status symbol in some
communities in Ghana and this attitude is not to be changed by paying a 50% subsidy towards
construction costs. Changing the attitude requires much more education over a longer period
(possibly a generation) and not only by projects like this but as a national task. Secondly, some of
the community members in the beneficiary communities were migrants and symptomatic of this
category of residents, investment in physical structures is refused since their “temporary” abode is
not considered their home albeit long periods of settlement spanning over a decade. This was
particularly evident in Ejura Sekyedumase and Obuasi where the majority of residents were
migrants and therefore showed little interest in household latrine construction. It is estimated that
about 52% of Ghana’s population are migrants and this could account for the rather high
communal latrine ownership and low interest in household latrine construction.
Thirdly, the period of engagement of the Partner Organisations (about 8 man-month input spread
over 2 years) to conduct health and hygiene education was relatively short to make a serious
impact on establishing the linkage between safe sanitation and good health. Fourthly, the cost of
building materials for the facilities continued to escalate resulting in a corresponding increase in
the cost of the VIP latrines. Fifthly, the process for the payment of the subsidy was often times
delayed by the DAs thereby frustrating beneficiaries awaiting payment and de-motivating potential
beneficiaries. At other times, the trained latrine artisans lived very far from beneficiary
communities and this made it difficult to access their services. Sixthly, the poor soil stability in
some districts especially Ejura Sekyedumase and Sekyere West districts (now Mampong
Municipal) made it difficult to construct household VIP latrines without lining the pits. Given
these challenges, the demand for the latrines has at best been average. This phenomenon questions
the replicability of the household latrine construction outside the project environment.
Lessons Project Approach Vis a Vis Service Delivery Approach
The process of approaching sanitation promotion through a “projectised” approach did not work.
The project approach requires that interventions are carried out within defined time boundaries and
scope. This situation did not allow for flexibility in the approach to sanitation promotion and
28
affected the outcome of the project. This lesson is not isolated and only reinforces the lessons from
other interventions that have suffered a similar fate e.g., UNDP/GWSC in Volta and Eastern
Regions, IDA CWSP 1 and 2, NORWASP, EU NRWSP, RWSP III, etc.
Baseline Information and Strategy Formulation
It is doubtful whether feasibility studies including baseline studies were conducted prior to the
design of the project and whether the results were factored in the design of the project. However,
given available information on access and coverage rates for sanitation in Ashanti Region for
2006, the decision to construct demonstration latrines as a strategy for sanitation promotion was
purely driven by the desire to comply with the existing national framework for sanitation
promotion rather than the background situation. A strong culture of communal ownership of
latrines existed so the focus of sanitation promotion should have been sanitation marketing and
facilitating the supply of basic minimum affordable household latrines. Although latrine artisans
were trained on sanitation marketing, this initiative was not backed by a sustained hygiene and
sanitation education to create demand for household latrines.
Adopting Appropriate Engagement Strategy with Communities
The strategy of engaging Partner Organisations over a relatively short period of time (about 8 man-
month input spread over 2 years) could not have resulted in a significant change in attitude of the
beneficiaries. The delay in drilling and pump installation for almost two (2) years contrary to the
planned 8-month break also affected POs work in sustaining hygiene education in the
communities. This strategy clearly did not yield the anticipated benefits. But for the follow up
support provided by the DWSTs in Amansie Central and Bosomtwi Atwima Kwanwoma districts,
none of the beneficiary districts could have been able to fully construct the household latrines
allocated. Regrettably, this is the situation in several other sanitation projects in Ghana including
interventions based on CLTS.
Limited Low Cost Sanitation Technology Options
The project limited the technology options available for construction to the “mozambique” and
“rectangular” VIP latrine types. These technology options were estimated to cost almost GHC300
(US$150). Given the poverty level in most rural communities in Ghana including the project area
(39%) (GSS, 2007), these latrine options were beyond the means of most beneficiaries. This
accounts for the low patronage and the fact that there has been very minimal latrine construction
without the project’s subsidy. Related to this issue is the fact that very few low technology options
are available for household latrine construction.
Application Procedures
The process of submitting application for vetting and approval by DA before commencement of
household latrine construction also affected patronage. The vetting of applications was delayed
and even where construction was completed, there were delays in the payment of subsidies.
Access to Trained Latrine Artisans
It was also established proximity of beneficiary communities trained latrines affected the
marketing and uptake of household latrines by beneficiary communities.

29
Recommendations
MLGRD has developed the national sanitation model and scaling up strategy. The model has
five (5) pillars i.e. creating the enabling environment for sanitation promotion; creating
demand for hygiene and sanitation; facilitating supply of basic hygiene and sanitation facilities;
strengthening capacity to trigger demand and supply; and providing supportive supervision,
monitoring and evaluation. Although the model defines the broad national strategy for
sanitation, it is recommended that MMDAs should adapt the model and strategy to the peculiar
situations in their respective districts. MMDAs should ensure that district and sub district level
structures i.e. DWST, EHAs, latrine artisans are well resourced and adequately motivated to
carry out sanitation and hygiene education and promotion on a sustainable basis. MMDAs
should carry out adequate baseline studies and use the results in designing and implementing
an appropriate strategy for sanitation promotion.
Sanitation promotion should be approached from a service delivery perspective rather than
projectised approach. The Ghana Government should demonstrate its commitment to making
basic sanitation promotion a priority by providing the required financial resources indicated in
the Sanitation and Water for All Compact signed by MoFEP, MWRWH and MLGRD in April
2010, the National Environmental Sanitation Strategy and Action Plan (NESSAP)/Strategic
Environmental Sanitation Investment Plan (SESIP). This would make the required resources
available to MLGRD-EHSD, CWSA and MMDAs to enable them carry out hygiene education
and sanitation marketing on a sustainable service scale at the national, regional, district and sub
district levels.
There is still room for developing affordable household latrine technology options. The
existing approved household latrine technology options i.e. Water Closet, VIP and KVIP are
fairly expensive. Given the adoption of CLTS as the approach to sanitation promotion, it is
imperative to develop low cost and affordable technology options to meet increasing demand
for basic sanitation facilities. It is recommended that the Ghana Government should provide
adequate financing for research into low cost technology options which can be promoted
through effective sanitation marketing.
________________________________________________________________________________
References
1. Government of Ghana (2010) Rural Water Supply Programme IV Preliminary Final Report
January 2005- April 2009. Submitted to Community Water and Sanitation Agency. Accra-
Ghana. December 2010.
2. Ghana Statistical Service (2007a) Monitoring the Situation of Children, Women and Men.
Multiple Indicator Cluster Survey 2006. Ghana Statistical Service, Accra.
3. Ghana Statistical Service (2007b) Patterns and Trends of Poverty in the 1999-2006. Ghana
Statistical Service, Accra.
4. Republic of Ghana (2008) Strategic Investment Plan 2008-2015. Community Water and
Sanitation Agency. November 2008.
30
5. Republic of Ghana (2003) Ghana Shared Growth and Development Agenda, 2010-2013. National
Development Planning Commission, Accra.
6. MAPLE Consult (2005) Partner Organisation Manual. MAPLE Consult, Accra.
7. Republic of Ghana (2011) Draft Water Sector Strategic Development Plan (2011-2025). Ministry
of Water Resources, Works and Housing. Accra. August 2011.
Contact Details Joseph Ampadu-Boakye, Nii Odai Anidaso Laryea, Francis Mawuena Dotse, Daniel Yaw Karikari
and Edward Gyan
Maple Consult
P. O. Box CT 3700, Cantonments-Accra
Tel: 233-302-241133/241415
Email: [email protected]
________________________________________________________________________________
31
________________________________________________________________________________
3rd Ghana Water Forum, Accra, Ghana, 2011
Water and Sanitation Services Delivery in a Rapidly Changing Urban Environment
Households’ Perception of Community Toilets in Low Income
Communities in Kumasi
E.O. Appiah & S. Oduro-Kwarteng
________________________________________________________________________________
Abstract Ghana is not on track in achieving the target of the Millennium Development Goal (MDG) Seven
towards improving sanitation by 2015. The country has just 13% of improved sanitation (JMP,
2010). The JMP classification of community (shared) toilet as unimproved sanitation is a major
challenge to the country in meeting the MDG since Ghana has a lot of the shared toilets. A survey
of 348 households was conducted using a structured questionnaire to collect data on perception of
toilet conditions and management. The results show that only 7.2% of respondents rely solely on
household toilet and 63.5% rely solely on shared community toilet and the remaining 29.3% uses
shared household toilet as well as the community toilet due inadequacy of the house facility. The
general perception on hygiene and privacy were poor but security was generally perceived fair.
The people using shared household toilets were usually satisfied with the share household facility
in terms all parameters except adequacy. The study shows that the sanitation sector needs to focus
on toilet facility management and guidelines that will ensure adequacy, hygiene and good
condition of the facilities.
________________________________________________________________________________
Introduction The MDG Seven (7) target towards environmental sustainability has as part of it to halve by 2015
the proportion of the people without sustainable access to safe drinking water and basic sanitation.
The WHO/UNICEF Joint Monitoring Programme (JMP) classifies shared latrines- used by two or
more households – as unimproved form of sanitation (JMP, 2010). Hence all communal toilets in
Ghana are unimproved form of sanitation. Households who use community toilet facilities in
Kumasi and Ghana in 2000 were 36.8% and 31.4 % respectively (Ghana statistical service, 2002).
A shared facility is classified as unimproved not by virtue of technology but because it is shared.
In Ghana, the public toilets- meant for visitors - are built close to and in the communities for
communal use.
Shared facility is most common in urban sub –Saharan Africa with 31% in the world but the
predominant country is Ghana (JMP, 2010). In 2008 the JMP found that 70% of the urban
population and 38% of the rural population in Ghana were using shared sanitation facilities. On the
whole , Ghana had 13% improved sanitation and 87% of unimproved sanitation which is made
up of shared 54%, unimproved facilities 13% and open defecation 25% (JMP, 2010). Communal
latrines as alternative to household latrines in congested areas are rarely satisfactory (Cotton et al.,
1995) and 71% of communal latrines users in Kumasi were not satisfied (Whittington et al., 1993).
Communal latrines irrespective of the type of design have usually proved to fail and malfunction
(Wagner and Lanoix, 1958 as cited in Cotton et al., 1995).

32
Jenkins and Scott (2006) reported that the attributes people dislike about their defecation places,
which were not household toilet, were smelly (27.1%), dirty (26.6%), the distance to toilet
facilities (8.3%), lack of comfort (7.0%), having to pay to use them (6.0%), and 5.8% having to
share with others. Women are found to be more interested in their privacy than the technology type
and the structure of the facility (Cotton et al., 1995), but Jenkins and Scott (2006) reported that
public toilets usually lacks privacy. The objective of this study was to find the perceptions of the
people who use communal toilets and to provide reasons for the various perception attributes.
Methodology The study was conducted in six low income communities in the periphery of the
KNUST campus in Kumasi. A survey of 348 households was conducted using a structured
questionnaire to collect data on perception attributes in Table 1. The definitions of the attributes
are shown in the Table 1. The communities and their percentages of households were Atonsu
(23.6), Ayeduase (16.7), Ayigya (28.7), Bomso (12.9), Gyinyase 6.6) and Kotei (11.5). The
structured questionnaires were administered and the data was analysed using SPSS software.
Table 1: Perception Attributes and their Definitions
Perception Definition Measuring parameter
Sharing mode Number of people households using
the facility.
o Households sharing facility
Accessibility Latrine opens throughout the day. o Latrine being opened
everyday and 24hours a day
Adequacy A maximum of 10 persons per
squat hole.
o Queuing at facility
o Usage rate per hole
Security Lighting availability and structural
stability of the facility.
o Illumination of pathway,
cubicle and availability of
light
o Structural stability of
superstructure
Convenience Facilities less than 50m from
households.
o Distance to facility
Privacy Availability of complete non-
transparent enclosure/doors.
o Privacy – cubicles with door
Hygienic Hygienically separates excreta from
human contact.
o Odour level
o Emptying of bins
o Cleanliness of the cubicle
Scores for the perception attributes were calculated using equation 3.1 by assigning ratings of one
(1) as poor, two (2) as fair and then three (3) as good. The number of respondents (n1, n2, n3) were
then multiplied by their respective ratings and then summed up to get the score. The denominator
gives the maximum score of best condition.
X 100%........................................................Equation 3.1
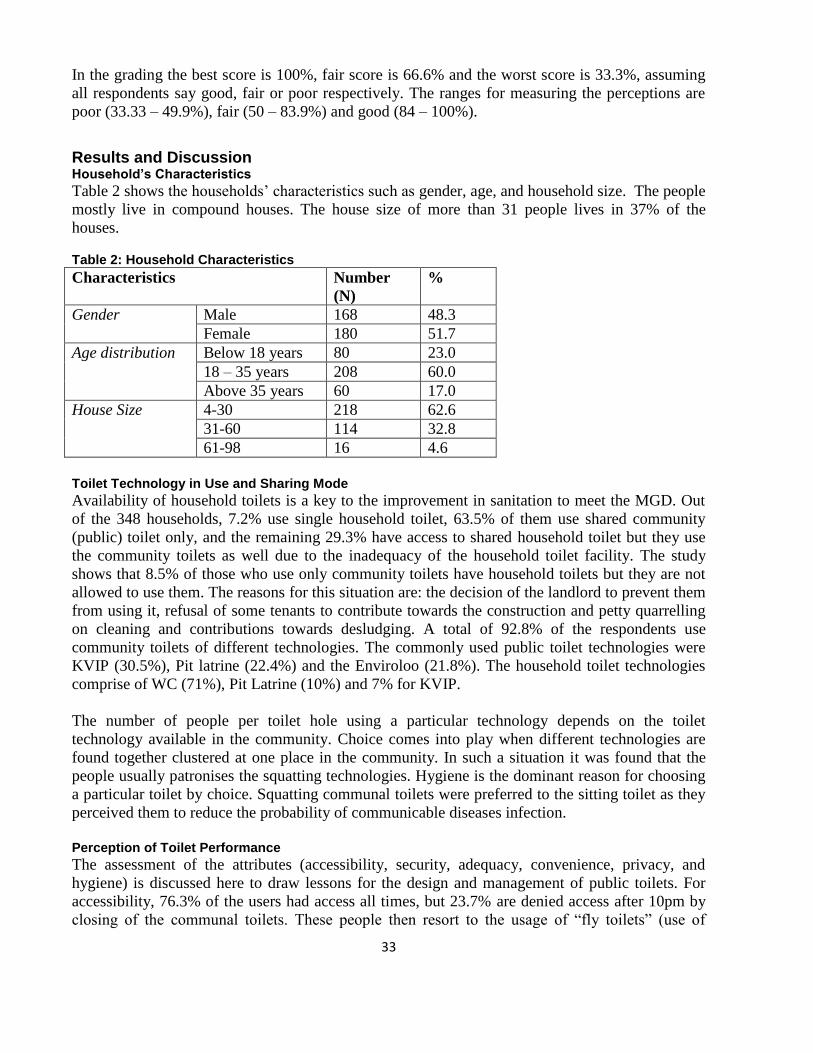
33
In the grading the best score is 100%, fair score is 66.6% and the worst score is 33.3%, assuming
all respondents say good, fair or poor respectively. The ranges for measuring the perceptions are
poor (33.33 – 49.9%), fair (50 – 83.9%) and good (84 – 100%).
Results and Discussion Household’s Characteristics
Table 2 shows the households’ characteristics such as gender, age, and household size. The people
mostly live in compound houses. The house size of more than 31 people lives in 37% of the
houses. Table 2: Household Characteristics
Characteristics Number
(N)
%
Gender Male 168 48.3
Female 180 51.7
Age distribution Below 18 years 80 23.0
18 – 35 years 208 60.0
Above 35 years 60 17.0
House Size 4-30 218 62.6
31-60 114 32.8
61-98 16 4.6
Toilet Technology in Use and Sharing Mode
Availability of household toilets is a key to the improvement in sanitation to meet the MGD. Out
of the 348 households, 7.2% use single household toilet, 63.5% of them use shared community
(public) toilet only, and the remaining 29.3% have access to shared household toilet but they use
the community toilets as well due to the inadequacy of the household toilet facility. The study
shows that 8.5% of those who use only community toilets have household toilets but they are not
allowed to use them. The reasons for this situation are: the decision of the landlord to prevent them
from using it, refusal of some tenants to contribute towards the construction and petty quarrelling
on cleaning and contributions towards desludging. A total of 92.8% of the respondents use
community toilets of different technologies. The commonly used public toilet technologies were
KVIP (30.5%), Pit latrine (22.4%) and the Enviroloo (21.8%). The household toilet technologies
comprise of WC (71%), Pit Latrine (10%) and 7% for KVIP.
The number of people per toilet hole using a particular technology depends on the toilet
technology available in the community. Choice comes into play when different technologies are
found together clustered at one place in the community. In such a situation it was found that the
people usually patronises the squatting technologies. Hygiene is the dominant reason for choosing
a particular toilet by choice. Squatting communal toilets were preferred to the sitting toilet as they
perceived them to reduce the probability of communicable diseases infection.
Perception of Toilet Performance
The assessment of the attributes (accessibility, security, adequacy, convenience, privacy, and
hygiene) is discussed here to draw lessons for the design and management of public toilets. For
accessibility, 76.3% of the users had access all times, but 23.7% are denied access after 10pm by
closing of the communal toilets. These people then resort to the usage of “fly toilets” (use of

34
polythene bags) 23%, refuse dump 27%, other nearby public toilet 14% and the rest (36%) have no
option.
The security was assessed by asking respondents about lighting availability and structural stability
of the facility. Most of the facilities had lighting system with 87% availability inside the cubicles,
and 58.5% were very satisfied with the illumination of the pathway to the latrine. The illumination
of the cubicles was largely perceived fair (45%). The facilities were perceived as 51% structurally
stable and good. The general security perception was poor (19.8%), fair (31.6%) and good
(48.6%). In general it is concluded that the communal toilets are fairly secured to use.
On the basis of convenience, 70% just travel less than 50 metres and the remaining 30% travel
more than 50 metres to the toilet facility. All the communal toilets were inadequate using 10
people per squat hole as the standard for adequacy. Only 9% of the people have access to adequate
toilet facilities, all being household toilets. The rest of the people use inadequate facilities. The
maximum number of people per squat hole was 44. Availability of queues was as high as 64%
among the people. The queues were relatively high in the morning (74.7%). People will have to
wait usually up to 10 minutes (67.3%) and 11-20 minutes (22.4%) in queues. Most of the people
(81%) were not satisfied with the long queues in the mornings. The people mentioned impact of
the queues to include lateness to work and school (26%), leads to disgrace (34%), unsuitable for
the sick to join queue (24%), and sickness and delays (16%).
Table 3 shows the hierarchical reasons from left to right for the perceptions on privacy and
hygiene. It can be deduced that the reasons for the perceptions may differ for technologies, but are
similar for the same technology.

35
Table 3: Overall Perception of Toilet Performance and Hierarchy Order of Reasons
Attributes Grading Percentage (%) Respondents’ Hierarchical Reasons for
Grading Both Male Female
Privacy Poor 51.5 43.9 58.9 No doors available, Broken doors, and
Exposed nakedness
Fair 27.8 40.8 14.7 Exposed nakedness, Broken doors, and
Doors cannot close well
Good 20.7 15.3 25.3 Good doors, and Doors cannot close well
Odour
Level
Poor 51.2 49.0 53.7 Poor management, Smelly clothes, and
Poor Ventilation
Fair 38.0 38.8 36.8 Poor management, Poor Ventilation, and
Smelly clothes
Good 10.7 12.2 9.5 Good cleaning, Newly constructed, and
Need for rehabilitation
Emptying
of Bins
Poor 56.3 53.0 58.9 Bins overflow, Delays in emptying, and
Bins emptied frequently
Fair 23.0 23.5 23.2 Bins emptied frequently, Delays in
emptying, and Bins overflow
Good 20.6 23.5 17.9 Bins emptied frequently, and Bins
overflow
Cleansing
of Cubicles
Poor 60.7 57.1 64.2 Late and poor cleaning, Children dirties
the place and Poor Usage
Fair 21.6 19.4 23.2 Late and poor cleaning, and Frequent and
good cleaning
Good 17.7 23.5 12.6 Frequent and good cleaning, Good toilet
design and Prudent use
Table 4 presents the perception on the toilet technologies. The Enviroloo has declined in privacy
over the years due to the fact that the doors to the cubicles have been removed to prevent people
from squatting on the bowl. An Enviroloo toilet having a very good structure is not patronised by
the people due to lack of privacy to allow them to squat instead of sitting, and this is consistent
with what Cotton et al., (1995) found in Maputo, Mozambique, that it is not about the quality of
the superstructure that is significant from the users’ point of view but the privacy it can afford.
Table 4: Perception on the toilet technology
Toilet
Technology
Freq. Maximum
Score of
Best
Condition
Privacy Odour level Emptying of
bin
Cubicle
Cleanliness
Score (%) Score (%) Score (%) Score (%)
WC 10 30 27 90 27 90 30 100 27 90
Pit Latrine 78 234 110 47 105 44.9 112 47.9 100 42.7
KVIP 105 315 178 56.5 147 46.7 131 41.6 157 49.8
Enviroloo 76 228 111 48.7 131 57.5 109 47.8 117 51.3
Aqua privy 21 60 42 70 34 56.7 27 45 26 43.3
VIP 6 18 11 61.1 6 33.3 15 83.3 8 44.4
Pour Flush 21 63 50 79.4 44 69.8 44 69.8 51 81

36
The pit latrines were graded generally poor in privacy and odour because the cubicles are built
without doors and vent pipes. The pit latrines function as holding tanks without vent pipes and
they are desludged when they are full. The VIP was perceived to have high odour and was rated
poor due to the poor functioning of the vents resulting in heat and high odour generation in the
cubicles. Smell and dirt of public latrine were major causes of dislike by people who do not have
house latrines but dislike the communal latrines (Jenkins and Scott, 2006), and the situation is not
different in this study. Emptying of the bins has degraded over the years and it is really a challenge
due to poor managerial practices. There is a relationship between the cleanliness of the cubicles
and the sanitation type. The wet sanitation was perceived to be good in contrast to the poor
perception of the dry sanitation. The single household toilet users have a fair perception of the
communal toilets. There is a poor perception of the three preferred communal toilets (KVIP, Pit
latrine and Enviroloo).
A shared household toilet facility which will improve upon their privacy, adequacy, convenience,
accessibility and hygiene, offering proper separation between human and faeces is good for the
people especially those in the compound houses. The only problem with the shared household
toilet is the inadequacy due to the number of squat holes hence forcing the people to use the
communal toilets though having access to the shared household toilet. The study shows poor
management of the communal toilets since the reasons given for the perception on hygienic
parameters were mostly due to poor management of the toilets. The perceptions of toilets about
KVIP and Pit Latrine were mainly poor but they are the most widely used. The people does not
usually patronise the Enviroloo because of the sitting position and the risk of infections.
Conclusion The people who have access to single household toilet - used by one household - were 7% and
those solely relying on the public toilet were 64%. The remaining 29% has access to shared
household toilet but they also rely on the public toilets by reason of inadequacy. The people resort
to use of unimproved sanitation (fly toilet and refuse dump) when denied access at night.
Management of the facilities was very poor and this explained why the perception of privacy and
hygiene on the communal toilets was very poor. None of the communal toilets was found to be
adequate resulting in queuing. The perception on the hygiene parameters and the preference of the
squatting toilets call for general hygiene to be addressed very well when dealing with communal
toilets.
Recommendation The stake holders of sanitation in Ghana should stop the promotions of public toilets and
concentrate on household toilets. In construction of households’ toilets the number of squat holes
must be more than one to ensure adequacy. The local governing bodies in charge of the
management of the communal toilets should provide standards and enforce them to improve upon
the management system of the existing communal toilets in order to provide a rather dignified
sanitation as we plan to phase them out with time.
________________________________________________________________________________
Acknowledgement Thank you to Mr. George Obeng and family for such an enormous support and also to John
Asumadu in the questionnaires administration.
37
________________________________________________________________________________
References 1. Cotton, A, Franceys R., & Pickford, J. a. (1995). On-plot sanitation in low-income urban
communities. United Kingdom: Water, Engineering and Development Centre.
2. Jenkins, M. W. and Scott (2006). Behavioral Indicators of Household Decision-Making and
Demand for Sanitation and Potential Gains from Sanitation Marketing in Ghana.
3. Ghana Statistical Service (2002). Population and housing census, 2000.
4. Whittington, D., Lauria, D. T., Choe, K., Hughes, J. A., & Swarna, V. a. (1993). Household
sanitation in Kumasi, Ghana: A descrption of current practices, attitudes and perceptions.
World Development , 21 (5), 733 - 748.
5. World Health Organisation and UNICEF. (2010). Progress on Sanitation and Drinking Water.
WHO/UNICEF Joint Monitoring Programme on Water Supply and Sanitation
_____________________________________________________________________________
Contact Details Emmanuel Obeng Appiah
Kwame Nkrumah University of Science and Technology
Department of Civil Engineering
Kumasi
Mob: +233 262 041287
Email: [email protected]
Sampson Oduro-Kwarteng, PhD
Kwame Nkrumah University of Science and Technology
Department of Civil Engineering
Kumasi
Tel: +233 51 60235
Fax: +233 51 60235
Email: [email protected]
____________________________________________________________________________
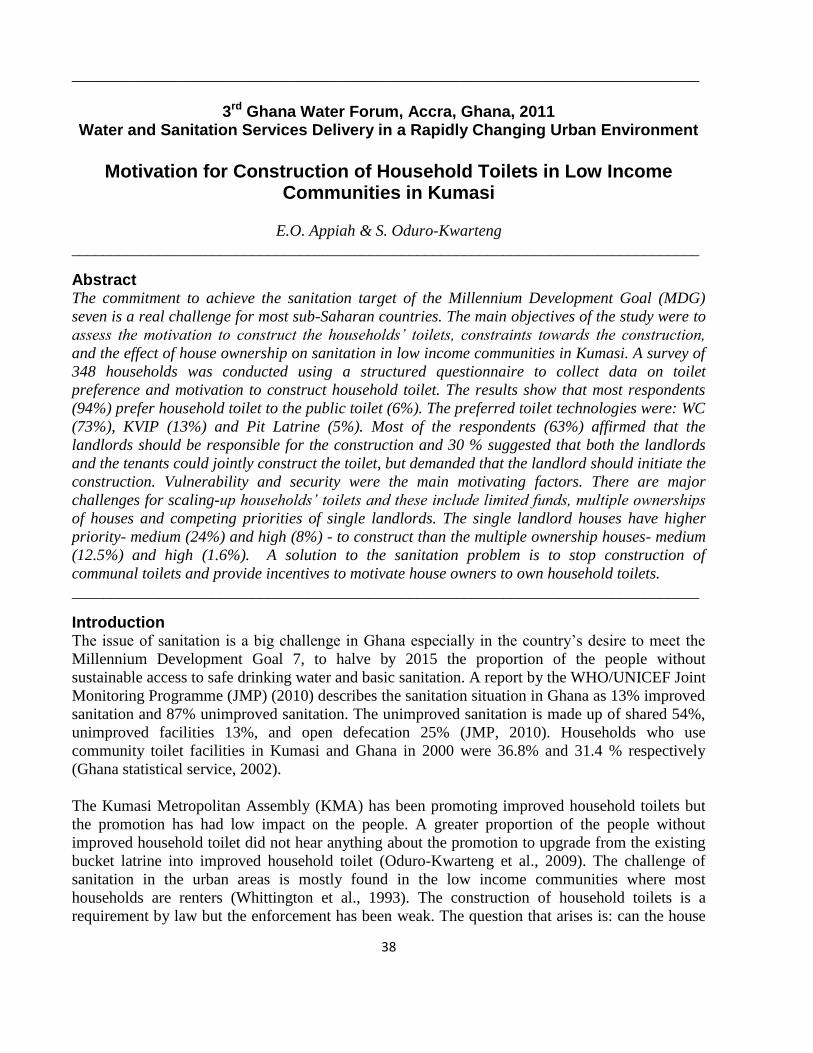
38
________________________________________________________________________________
3rd Ghana Water Forum, Accra, Ghana, 2011
Water and Sanitation Services Delivery in a Rapidly Changing Urban Environment
Motivation for Construction of Household Toilets in Low Income
Communities in Kumasi E.O. Appiah & S. Oduro-Kwarteng
________________________________________________________________________________
Abstract The commitment to achieve the sanitation target of the Millennium Development Goal (MDG)
seven is a real challenge for most sub-Saharan countries. The main objectives of the study were to
assess the motivation to construct the households’ toilets, constraints towards the construction,
and the effect of house ownership on sanitation in low income communities in Kumasi. A survey of
348 households was conducted using a structured questionnaire to collect data on toilet
preference and motivation to construct household toilet. The results show that most respondents
(94%) prefer household toilet to the public toilet (6%). The preferred toilet technologies were: WC
(73%), KVIP (13%) and Pit Latrine (5%). Most of the respondents (63%) affirmed that the
landlords should be responsible for the construction and 30 % suggested that both the landlords
and the tenants could jointly construct the toilet, but demanded that the landlord should initiate the
construction. Vulnerability and security were the main motivating factors. There are major
challenges for scaling-up households’ toilets and these include limited funds, multiple ownerships
of houses and competing priorities of single landlords. The single landlord houses have higher
priority- medium (24%) and high (8%) - to construct than the multiple ownership houses- medium
(12.5%) and high (1.6%). A solution to the sanitation problem is to stop construction of
communal toilets and provide incentives to motivate house owners to own household toilets.
________________________________________________________________________________
Introduction The issue of sanitation is a big challenge in Ghana especially in the country’s desire to meet the
Millennium Development Goal 7, to halve by 2015 the proportion of the people without
sustainable access to safe drinking water and basic sanitation. A report by the WHO/UNICEF Joint
Monitoring Programme (JMP) (2010) describes the sanitation situation in Ghana as 13% improved
sanitation and 87% unimproved sanitation. The unimproved sanitation is made up of shared 54%,
unimproved facilities 13%, and open defecation 25% (JMP, 2010). Households who use
community toilet facilities in Kumasi and Ghana in 2000 were 36.8% and 31.4 % respectively
(Ghana statistical service, 2002).
The Kumasi Metropolitan Assembly (KMA) has been promoting improved household toilets but
the promotion has had low impact on the people. A greater proportion of the people without
improved household toilet did not hear anything about the promotion to upgrade from the existing
bucket latrine into improved household toilet (Oduro-Kwarteng et al., 2009). The challenge of
sanitation in the urban areas is mostly found in the low income communities where most
households are renters (Whittington et al., 1993). The construction of household toilets is a
requirement by law but the enforcement has been weak. The question that arises is: can the house
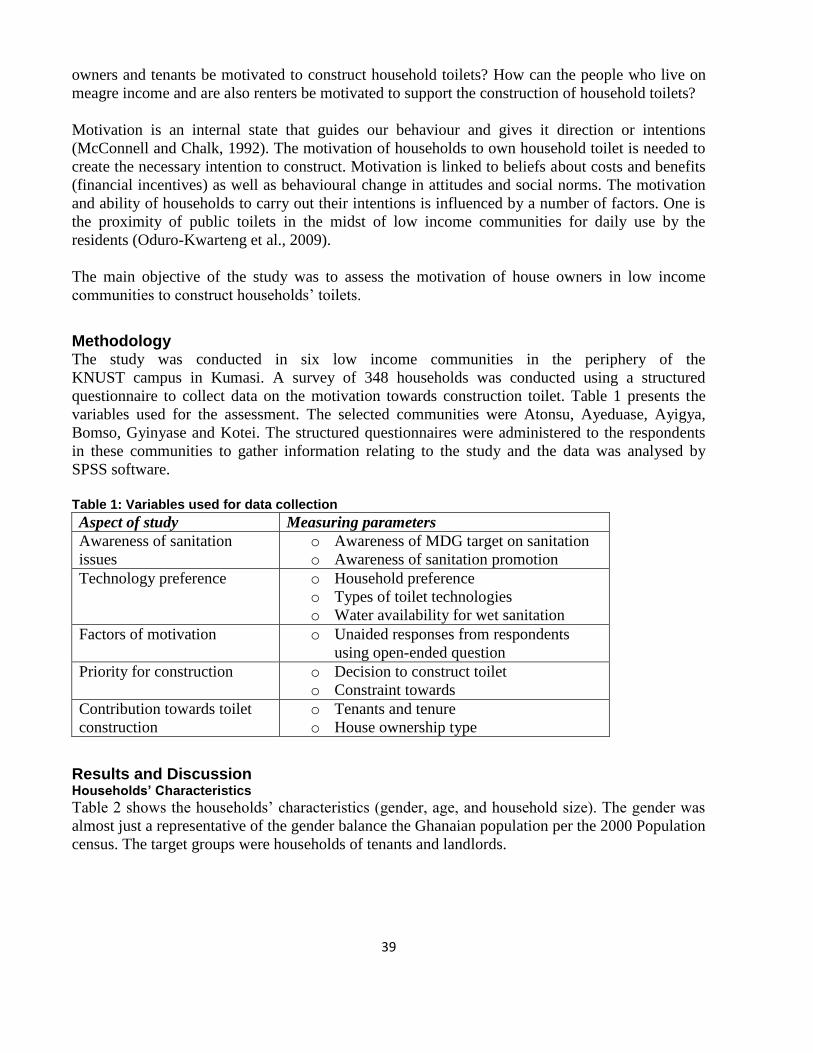
39
owners and tenants be motivated to construct household toilets? How can the people who live on
meagre income and are also renters be motivated to support the construction of household toilets?
Motivation is an internal state that guides our behaviour and gives it direction or intentions
(McConnell and Chalk, 1992). The motivation of households to own household toilet is needed to
create the necessary intention to construct. Motivation is linked to beliefs about costs and benefits
(financial incentives) as well as behavioural change in attitudes and social norms. The motivation
and ability of households to carry out their intentions is influenced by a number of factors. One is
the proximity of public toilets in the midst of low income communities for daily use by the
residents (Oduro-Kwarteng et al., 2009).
The main objective of the study was to assess the motivation of house owners in low income
communities to construct households’ toilets.
Methodology The study was conducted in six low income communities in the periphery of the
KNUST campus in Kumasi. A survey of 348 households was conducted using a structured
questionnaire to collect data on the motivation towards construction toilet. Table 1 presents the
variables used for the assessment. The selected communities were Atonsu, Ayeduase, Ayigya,
Bomso, Gyinyase and Kotei. The structured questionnaires were administered to the respondents
in these communities to gather information relating to the study and the data was analysed by
SPSS software.
Table 1: Variables used for data collection
Aspect of study Measuring parameters
Awareness of sanitation
issues
o Awareness of MDG target on sanitation
o Awareness of sanitation promotion
Technology preference o Household preference
o Types of toilet technologies
o Water availability for wet sanitation
Factors of motivation o Unaided responses from respondents
using open-ended question
Priority for construction o Decision to construct toilet
o Constraint towards
Contribution towards toilet
construction
o Tenants and tenure
o House ownership type
Results and Discussion Households’ Characteristics
Table 2 shows the households’ characteristics (gender, age, and household size). The gender was
almost just a representative of the gender balance the Ghanaian population per the 2000 Population
census. The target groups were households of tenants and landlords.

40
Table 2: Households’ Characteristics
Characteristics Number (N) %
Gender Male 168 48.3
Female 180 51.7
Age distribution Below 18 years 80 23.0
18 – 35 years 208 60.0
Above 35 years 60 17.0
House Size 4-30 218 62.6
31-60 114 32.8
61-98 16 4.6 Awareness of the MDG Seven and Sanitation Preference
The people were found to have a fair knowledge of MDG 7, where about half of them were aware
of it and 57.4% have heard of the sanitation campaign promoting household toilet. However, most
of them were not aware of public toilets described as unimproved form of sanitation by the JMP.
Most of the people prefer household toilet (improved sanitation) as against the unimproved public
toilet. The results show that 94.3% preferred household latrine but 5.7% still opted for the
community toilets. The technologies preferred are: WC (72.9%), KVIP (13%), Pit Latrine (5.1%)
and VIP, Enviroloo or Aqua privy altogether 9.1%. Previous studies showed that more than 70%
preferred household toilet and the WC is the preferred technology (Oduro-Kwarteng et al., 2009).
The proportion of people who preferred household toilet in the low income communities over the
years were 83.3% (Bassah, 2005), 77.6% (Dumelo, 2007), and 79.3% (Pireku, 2008), and high
percentage of the people preferred the Water Closet toilet in these studies.
Wet sanitation was preferred to the dry sanitation hence the need to assess the water availability to
support the sanitation. Ghana Water Company Limited (GWCL) does provides water directly in
their homes for 65.2% of the people, whilst 19.3% buy water from their neighbours which are
usually sourced from GWCL and sometimes boreholes. Only 9.8% have their water sourced from
wells and 1.7% from boreholes. Even among those who buy water from neighbours some buys it
right in their houses. The houses initially not connected to the GWCL pipelines have been
connected by the landlords, and they then commercialise the water even to the households of the
houses. Some of the landlords claim this helps in the paying of the water bills smoothly to avoid
petty rifles among households in the house in the payment of the bills. Kumasi earlier on had 57%
private water tap connections in houses, 32% of the people were buying water from neighbours,
7% depended on the well and 2% on public tap which was in its phasing out stage by GWCL
(Whittington et al., 1993). This current study then shows an improvement in the water supply in
Kumasi in the low income areas, since 67% of the people were fairly satisfied with the level of
service of the water supply, 25.5% were satisfied and 7.4% were not satisfied at all.
Motivation and Constraint to the Construction of Household Toilet
The results show that the vulnerability, security, adequacy and cleanliness were the main
motivation factors for the household toilet preference. The various combinations of the factors of
motivation were: security and vulnerable (43.2%); vulnerable, security, adequacy and cleanliness
(20.5%); convenience, accessibility, security and cleanliness (14.8%); privacy, convenience,
hygienic and accessibility (13.6%) and 7.9% for other combinations. Motivation factors
precipitating the need for household toilet which were identified by Jenkins and Scott (2006) are:
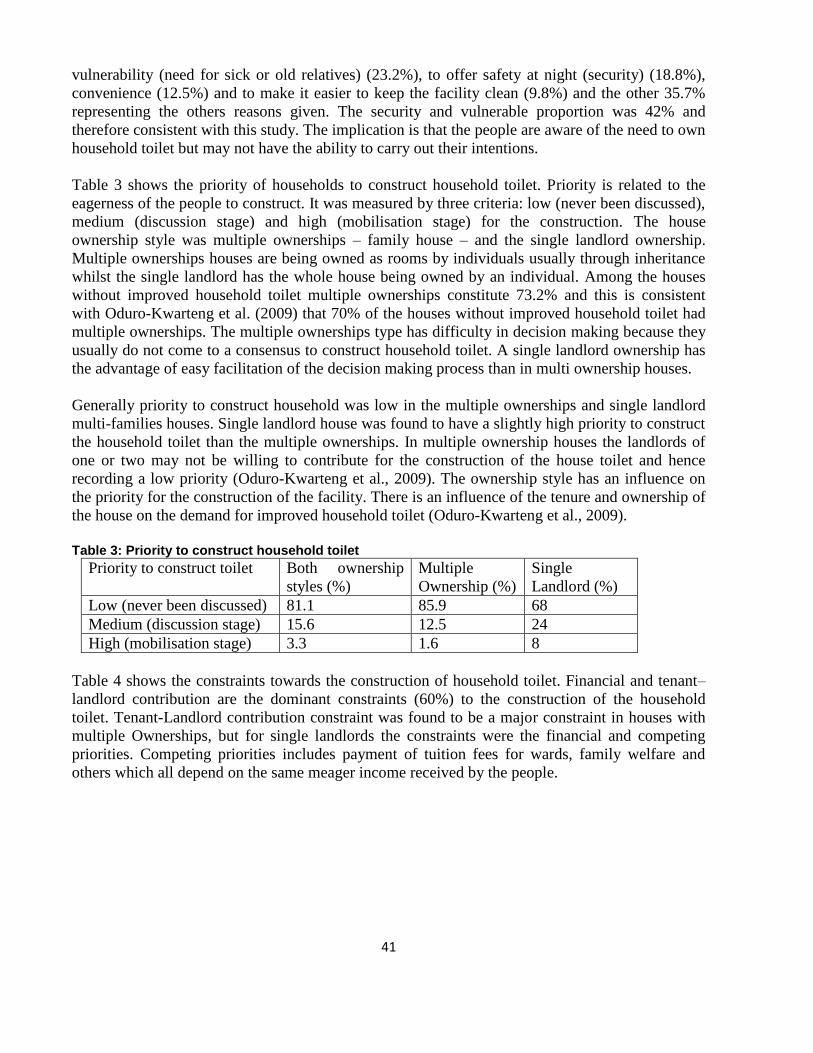
41
vulnerability (need for sick or old relatives) (23.2%), to offer safety at night (security) (18.8%),
convenience (12.5%) and to make it easier to keep the facility clean (9.8%) and the other 35.7%
representing the others reasons given. The security and vulnerable proportion was 42% and
therefore consistent with this study. The implication is that the people are aware of the need to own
household toilet but may not have the ability to carry out their intentions.
Table 3 shows the priority of households to construct household toilet. Priority is related to the
eagerness of the people to construct. It was measured by three criteria: low (never been discussed),
medium (discussion stage) and high (mobilisation stage) for the construction. The house
ownership style was multiple ownerships – family house – and the single landlord ownership.
Multiple ownerships houses are being owned as rooms by individuals usually through inheritance
whilst the single landlord has the whole house being owned by an individual. Among the houses
without improved household toilet multiple ownerships constitute 73.2% and this is consistent
with Oduro-Kwarteng et al. (2009) that 70% of the houses without improved household toilet had
multiple ownerships. The multiple ownerships type has difficulty in decision making because they
usually do not come to a consensus to construct household toilet. A single landlord ownership has
the advantage of easy facilitation of the decision making process than in multi ownership houses.
Generally priority to construct household was low in the multiple ownerships and single landlord
multi-families houses. Single landlord house was found to have a slightly high priority to construct
the household toilet than the multiple ownerships. In multiple ownership houses the landlords of
one or two may not be willing to contribute for the construction of the house toilet and hence
recording a low priority (Oduro-Kwarteng et al., 2009). The ownership style has an influence on
the priority for the construction of the facility. There is an influence of the tenure and ownership of
the house on the demand for improved household toilet (Oduro-Kwarteng et al., 2009).
Table 3: Priority to construct household toilet
Priority to construct toilet Both ownership
styles (%)
Multiple
Ownership (%)
Single
Landlord (%)
Low (never been discussed) 81.1 85.9 68
Medium (discussion stage) 15.6 12.5 24
High (mobilisation stage) 3.3 1.6 8
Table 4 shows the constraints towards the construction of household toilet. Financial and tenant–
landlord contribution are the dominant constraints (60%) to the construction of the household
toilet. Tenant-Landlord contribution constraint was found to be a major constraint in houses with
multiple Ownerships, but for single landlords the constraints were the financial and competing
priorities. Competing priorities includes payment of tuition fees for wards, family welfare and
others which all depend on the same meager income received by the people.

42
Table 4: Constraints to Construction against Ownership Type
Constraints All households
(%)
Multiple
Ownerships %
Single
Landlord (%)
Financial Constraint 34.5 37.9 28
Tenant-Landlord Contribution 26.2 34.5 8
Unavailability of space for construction 11.9 6.9 12
Competing Priorities 9.5 3.4 24
Limited spaces and Finances 8.3 10.3 12
Other reasons 9.6 7.5 16
The unavailability of space for construction was 12% of the houses. Some houses have been built
with no space made available for the construction of improved household toilet (Oduro-Kwarteng
et al., 2009). Rooms designated for toilet in the house plans of some building has been converted
into bedroom sometimes due to shear negligence.
Responsibility to Construct the Household Toilet
Table 5 assesses willingness of the tenants to take up the responsibility to construct the household
toilet. The responsibility to construct toilet is very important if construction of the household toilet
is to be implemented. Most of the respondents (63%) suggested that the construction of the facility
must be undertaken by the landlords. In houses with single landlord, the tenants (18%) were
willing to construct it on their own than 1.6% for the multiple Ownerships. This situation confirms
why tenant-landlord constraint is not a major constraint faced by the single landlord houses. In a
study in Ghana, Jenkins and Scott (2006) reported that 56.2% of the household latrines were put up
by the landlords (owners of the compound houses) and in extremely rare cases (1.5%) the tenants
took the initiative to construct the latrine. The current study shows willingness of the tenants
(36%) to support household toilet construction compare to the 1.5% of tenants agreeing to
construct in the case of Jenkins and Scott (2006) study.
Table 5: Responsibility to construct
Who should construct General % Multiple Ownership % Single Landlord %
Landlord must provide 63.6 65.6 59.3
Tenants could provide 6.8 1.6 18.5
Both landlords and tenants 29.5 32.8 22.2
The main reasons for the results of Table 5 were that the house belongs to the landlord (41.2%),
and others also said the toilet will bring benefit to both the tenant and landlord (26.2%). The other
reasons given are the chances that the tenant can be ejected anytime from the house (13.8%), the
toilet should be part of the house plan (5.0%), toilet availability is already part of the tenancy
agreement (7.5%) and support will be given to the landlord (6.2%). Tenants are usually motivated
to support the construction when the landlord takes the initiative. The motivations to support the
landlord in the toilet construction and maintenance are: support construction if initiated by the
landlord (39%), support because it will ensure security of tenant (17%), support construction if the
contribution is made by all including the landlord (11%), support because it will benefit both
tenant and landlord (9%), and 13% will only contribute towards the maintenance of the facility.
Tenant in Ghana have little or no control over the sanitation infrastructure where they live (Jenkins
and Scott, 2006). The tenants know that unless the landlord agrees to construct it they can do
nothing about the sanitation problem.
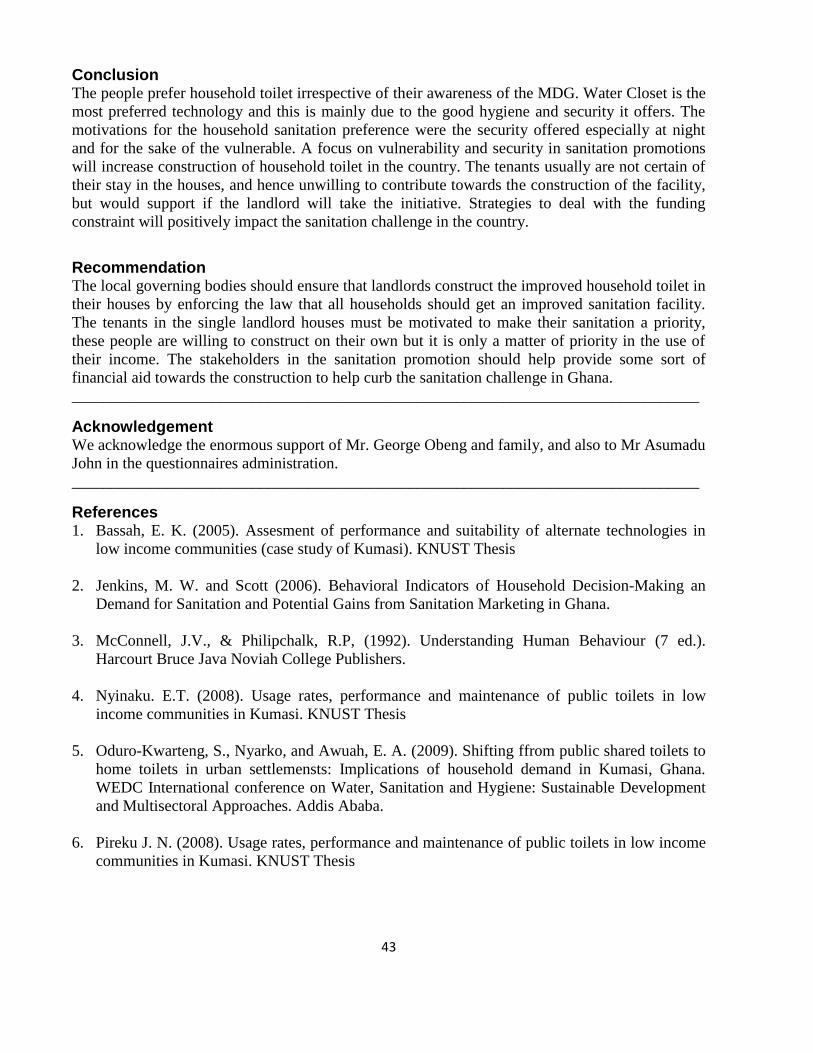
43
Conclusion The people prefer household toilet irrespective of their awareness of the MDG. Water Closet is the
most preferred technology and this is mainly due to the good hygiene and security it offers. The
motivations for the household sanitation preference were the security offered especially at night
and for the sake of the vulnerable. A focus on vulnerability and security in sanitation promotions
will increase construction of household toilet in the country. The tenants usually are not certain of
their stay in the houses, and hence unwilling to contribute towards the construction of the facility,
but would support if the landlord will take the initiative. Strategies to deal with the funding
constraint will positively impact the sanitation challenge in the country.
Recommendation The local governing bodies should ensure that landlords construct the improved household toilet in
their houses by enforcing the law that all households should get an improved sanitation facility.
The tenants in the single landlord houses must be motivated to make their sanitation a priority,
these people are willing to construct on their own but it is only a matter of priority in the use of
their income. The stakeholders in the sanitation promotion should help provide some sort of
financial aid towards the construction to help curb the sanitation challenge in Ghana.
________________________________________________________________________________
Acknowledgement We acknowledge the enormous support of Mr. George Obeng and family, and also to Mr Asumadu
John in the questionnaires administration.
________________________________________________________________________________
References 1. Bassah, E. K. (2005). Assesment of performance and suitability of alternate technologies in
low income communities (case study of Kumasi). KNUST Thesis
2. Jenkins, M. W. and Scott (2006). Behavioral Indicators of Household Decision-Making an
Demand for Sanitation and Potential Gains from Sanitation Marketing in Ghana.
3. McConnell, J.V., & Philipchalk, R.P, (1992). Understanding Human Behaviour (7 ed.).
Harcourt Bruce Java Noviah College Publishers.
4. Nyinaku. E.T. (2008). Usage rates, performance and maintenance of public toilets in low
income communities in Kumasi. KNUST Thesis
5. Oduro-Kwarteng, S., Nyarko, and Awuah, E. A. (2009). Shifting ffrom public shared toilets to
home toilets in urban settlemensts: Implications of household demand in Kumasi, Ghana.
WEDC International conference on Water, Sanitation and Hygiene: Sustainable Development
and Multisectoral Approaches. Addis Ababa.
6. Pireku J. N. (2008). Usage rates, performance and maintenance of public toilets in low income
communities in Kumasi. KNUST Thesis
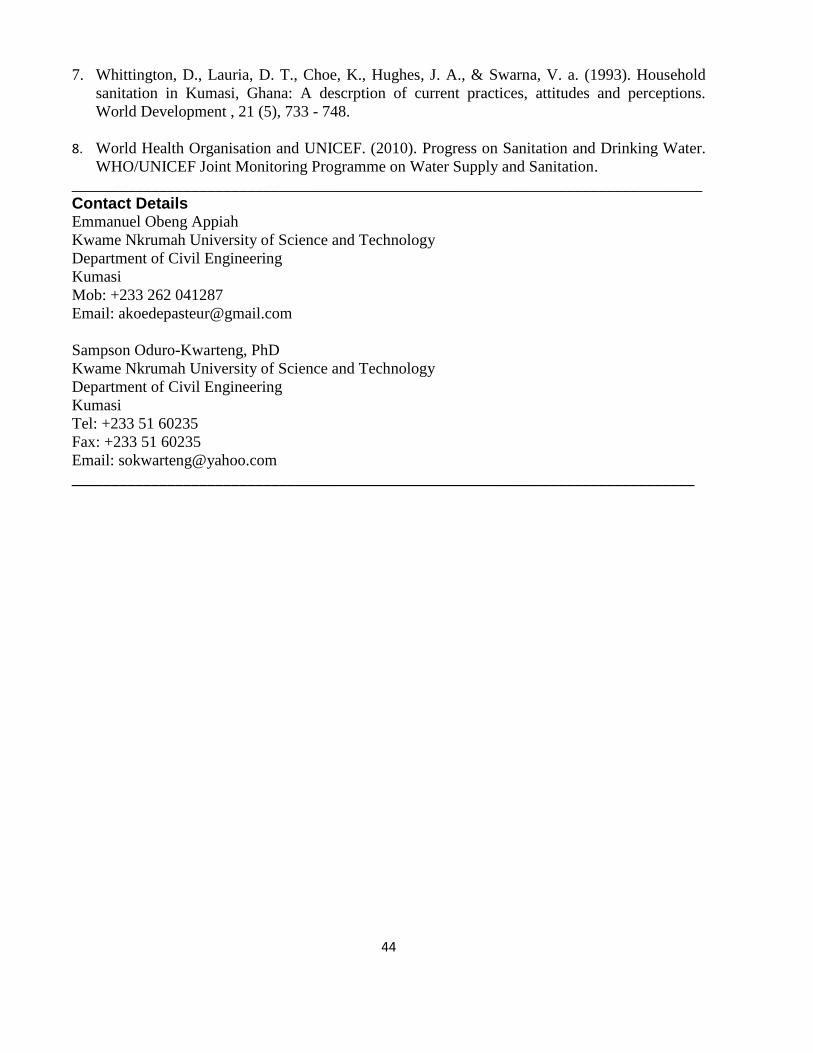
44
7. Whittington, D., Lauria, D. T., Choe, K., Hughes, J. A., & Swarna, V. a. (1993). Household
sanitation in Kumasi, Ghana: A descrption of current practices, attitudes and perceptions.
World Development , 21 (5), 733 - 748.
8. World Health Organisation and UNICEF. (2010). Progress on Sanitation and Drinking Water.
WHO/UNICEF Joint Monitoring Programme on Water Supply and Sanitation. _______________________________________________________________________________
Contact Details Emmanuel Obeng Appiah
Kwame Nkrumah University of Science and Technology
Department of Civil Engineering
Kumasi
Mob: +233 262 041287
Email: [email protected]
Sampson Oduro-Kwarteng, PhD
Kwame Nkrumah University of Science and Technology
Department of Civil Engineering
Kumasi
Tel: +233 51 60235
Fax: +233 51 60235
Email: [email protected]
______________________________________________________________________________

45
________________________________________________________________________________
3rd Ghana Water Forum, Accra, Ghana, 2011
Water and Sanitation Services Delivery in a Rapidly Changing Urban Environment
Meeting Ghana’s MDG Target on Sanitation, through Dissemination of
Biogas Plants
Richard Arthur & Edward Antwi
________________________________________________________________________________
Abstract According to the MDG report on Ghana for 2008, only 21.2% of Ghanaians will have access to
improved sanitation by 2015. This is below the target figure of 52%, suggesting that there are still
challenges with the existing sanitation policies and programmes. This paper presents the status of
sanitation biogas technology in Ghana. The paper suggests that current policy recommendations
should be expanded to include individual household biogas plants in addition to institutional and
community plants. A nexus is also made between the provision of basic sanitation and energy
through the use of biogas plant which could further support the creation of sustainable
development in Ghana. The paper suggests that greater emphasis must be laid on developing
funding schemes for households for the adoption of biogas systems. The paper also argues that it
is possible for Ghana to achieve the MDG target on sanitation by developing a comprehensive and
implementable programme involving all the stakeholders using the biogas technology as the focal
points.
________________________________________________________________________________
Introduction Access to safe clean water and adequate sanitation is a fundamental right and a condition for basic
health for every human being. However, in the developing world, one person in three lacks safe
drinking water and sanitation [14]. Ghana has its share of the sanitation problems. It is expected
that increasing population in the rural and urban areas should be accompanied with corresponding
expansion of sanitation facilities which could aptly deal with social and environment issues
regarding sanitation. In the past, numerous efforts have been made to combat poor sanitation in
Ghana. However, The United Nations Development Programme [1] in its Human Development
Report (HDR) for 2007/2008 estimated that about 82 % of Ghanaians lacked access to improved
sanitation at the end of 2004. According to the HDR for 2007/2008, the 2004 figure of 82 % is
higher than the sub-Saharan average of 68 %, this makes Ghana’s sanitation situation alarming.
Some disease causing agents get into the human system because of such practises as not covering
food, eating unwashed food, not washing hands and drinking untreated water. According to Joint
Monitoring Programme most recent report on sanitation in Africa, open defecation rate in Ghana
reduced marginally from 24% in 1990 to 20% in 2006 [2] and dropped to 13% in 2008 [16]. Both
local and international reports indicate that more than 4 million people in Ghana still resort to
defecating in fields, drains and bushes. Poor sanitation has been identified as one of the greatest
drivers of poverty globally and it is an affront to human dignity. The objective of this paper is to
present biogas systems as one of the technical options to improve sanitation in Ghana and to meet
the MDG target on halving by 2015, the proportion of people without sustainable access to safe
drinking water and basic sanitation.
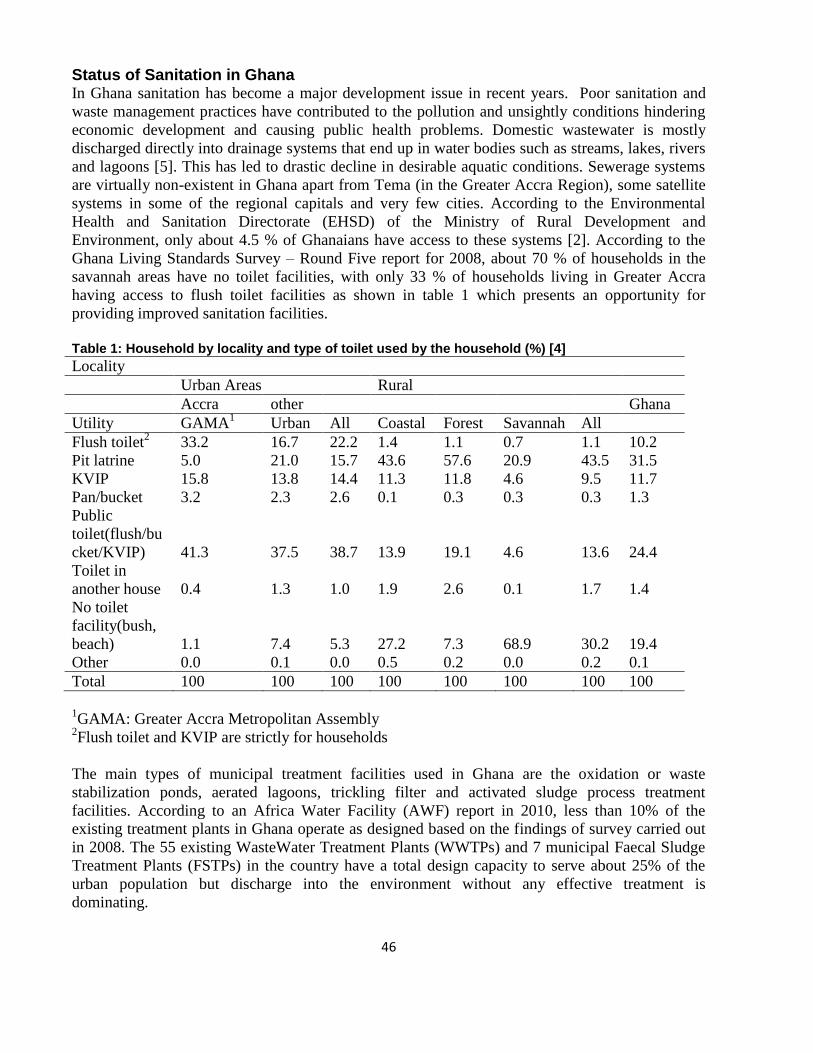
46
Status of Sanitation in Ghana In Ghana sanitation has become a major development issue in recent years. Poor sanitation and
waste management practices have contributed to the pollution and unsightly conditions hindering
economic development and causing public health problems. Domestic wastewater is mostly
discharged directly into drainage systems that end up in water bodies such as streams, lakes, rivers
and lagoons [5]. This has led to drastic decline in desirable aquatic conditions. Sewerage systems
are virtually non-existent in Ghana apart from Tema (in the Greater Accra Region), some satellite
systems in some of the regional capitals and very few cities. According to the Environmental
Health and Sanitation Directorate (EHSD) of the Ministry of Rural Development and
Environment, only about 4.5 % of Ghanaians have access to these systems [2]. According to the
Ghana Living Standards Survey – Round Five report for 2008, about 70 % of households in the
savannah areas have no toilet facilities, with only 33 % of households living in Greater Accra
having access to flush toilet facilities as shown in table 1 which presents an opportunity for
providing improved sanitation facilities.
Table 1: Household by locality and type of toilet used by the household (%) [4]
Locality
Urban Areas Rural
Accra other Ghana
Utility GAMA1 Urban All Coastal Forest Savannah All
Flush toilet2 33.2 16.7 22.2 1.4 1.1 0.7 1.1 10.2
Pit latrine 5.0 21.0 15.7 43.6 57.6 20.9 43.5 31.5
KVIP 15.8 13.8 14.4 11.3 11.8 4.6 9.5 11.7
Pan/bucket 3.2 2.3 2.6 0.1 0.3 0.3 0.3 1.3
Public
toilet(flush/bu
cket/KVIP) 41.3 37.5 38.7 13.9 19.1 4.6 13.6 24.4
Toilet in
another house 0.4 1.3 1.0 1.9 2.6 0.1 1.7 1.4
No toilet
facility(bush,
beach) 1.1 7.4 5.3 27.2 7.3 68.9 30.2 19.4
Other 0.0 0.1 0.0 0.5 0.2 0.0 0.2 0.1
Total 100 100 100 100 100 100 100 100
1GAMA: Greater Accra Metropolitan Assembly
2Flush toilet and KVIP are strictly for households
The main types of municipal treatment facilities used in Ghana are the oxidation or waste
stabilization ponds, aerated lagoons, trickling filter and activated sludge process treatment
facilities. According to an Africa Water Facility (AWF) report in 2010, less than 10% of the
existing treatment plants in Ghana operate as designed based on the findings of survey carried out
in 2008. The 55 existing WasteWater Treatment Plants (WWTPs) and 7 municipal Faecal Sludge
Treatment Plants (FSTPs) in the country have a total design capacity to serve about 25% of the
urban population but discharge into the environment without any effective treatment is
dominating.

47
A Ghana Statistical Service Multiple Indicator Cluster Survey report for 2006 indicates that, open
defecation is prevalent in all the ten regions in Ghana but mostly widespread in the Upper East
Region with about 82% without any form of latrine, followed by the Upper West Region with
about 79% and then the Northern Region with about 73%.
According to table 1, 32% and 12% of Ghanaians use Pit latrine and Kumasi Ventilated Improved
Pit (KVIP) respectively as toilet facilities whiles about 10% use flush toilet and over 19% defecate
in the bush, beaches, etc. This is quite alarming as human faeces are the primary source of
diarrhoea pathogens. Diarrhoea diseases are ranked the third greatest public health problem after
malaria and upper respiratory tract infection in Ghana from 2002 to 2008 [5].
MDG Target 7.C: Ghana’s Case One of the MDG goals, Goal 7 - Ensuring environmental sustainability, Target 7.C is aimed at
halving by 2015, the proportion of people without sustainable access to safe drinking water and
basic sanitation. According to the 2008 MDGs report for Ghana, the country is on track to
achieving the target on halving the proportion without access to safe water but challenges exist in
achieving the targets of reversing the loss of environment resource and reducing the proportion of
people without access to improved sanitation. At the current trend the proportion of the population
with access to improved sanitation will reach 21.2% by 2015 instead of 52%, while the proportion
of urban population with access to improved sanitation will be 23.4% instead of 55% by 2015. In
the rural areas, only 20.6% will have access to improved sanitation instead of 50.5% [6].
Currently, the national coverage on improved sanitation is 12.4% instead of 52% target by 2015
indicating that there must approximately five times increase in the coverage to be able to achieve
the set target. According to Sachs et al [7], for Ghana to meet the MDG target set for sanitation
and wastewater management needs, a total of about US$ 941 million will be needed from 2005 to
2015. The Local government and Rural Development points toward an amount of US$ 1.5 Billion
within the next five years to achieve the set target by 2015. About US$ 51 million was needed for
solving sanitation problems in the urban areas in 2010. This figure will increase to about US$ 70
million by 2015, if the set targets are to be achieved. Between 2005 and 2015 about US$ 240
million will be needed for the wastewater management in both urban and rural areas [7].
Biogas Generation from Faecal Sludge The bio-latrine (or bio-toilet) is a special type of the sanitary biogas plant where the digester
receives the excreta from a community or institutional facility; the excreta enter the digester in a
‘long drop’ without being mixed with water. The main advantage of the bio-latrine is its ability to
solve the sanitation problems of public toilets in communities where water is scarce. The bio-
latrine can provide a viable solution to the public health and environmental problems posed by
improper sewage waste disposal. During anaerobic digestion of night soil at a Hydraulic Retention
Time (HRT) of 30 days, there is a remarkable reduction (up to 85%) of Biochemical Oxygen
Demand (BOD) of the effluent of biogas systems [15]
Status of Biogas Technology in Ghana A 10 m
3 Chinese fixed dome digester was the first biogas demonstration plant in Ghana. It was
constructed in 1986 by the Ministry of Energy supported by the Chinese government at a cattle
ranch in Shai Hills in the Greater Accra Region. In the following year, UNICEF also provided

48
support for the construction of a couple of domestic biogas demonstration plants as Jisonavilli and
Kurugu in the Northern Region [8]. The Ministry of Energy established one of the first major
comprehensive biogas demonstration projects in Ghana - the “Integrated Rural Energy and
Environment” at Appolonia- a village located some 46 km from Accra. The feedstock for the
biogas plant at Appolonia were animal dung and human excreta providing biogas for a 12.5 kW
generator to provide power for street and home lights as well as cooking whiles the bio-slurry was
used as organic fertilizer [9]. The total number of biogas plants in Ghana is unknown however; a
survey conducted by authors [10] on 50 biogas plants in Ghana showed that 76% of the plants
have been constructed for treatment of human excreta with 14 of the plants not functioning. This is
attributed to poor design and construction of digesters, wrong operation and lack of maintenance
by users, poor dissemination strategies, lack of project monitoring and follow ups by promoters,
and poor ownership responsibility by users [12]. Following the lack of government involvement in
developing a biogas dissemination strategy at domestic and community levels, a number of private
biogas companies have marketed the technology on purely business grounds, and mainly based on
the ability of biogas plants to improve sanitation. There are at least 10 biogas service providers
who have been actively involved in the design and construction of both domestic and institutional
size biogas plants across the country [11]. The biogas digester designs that are common Ghana are
fixed dome, floating drum and Puxin digester for domestic and institutional use [17] providing
biogas to supplement energy needs.
Lessons At the current trend, the proportion of the population with access to improved sanitation will reach
21.2% by 2015 instead of 52%, while the proportion of urban population with access to improved
sanitation will be 23.4% instead of 55% by 2015. The absence of adequate sanitation facilities
presents a major challenge in the socio-economic development socio-economic for most
Ghanaians partly due to the lack of adequate support from government. A number of private
biogas service providers have on purely business grounds, marketed the technology [12] providing
biogas plants for individual with biogas plant sizes between 8m3 and 12m
3 [8] whiles institutions
have sizes from 40m3to 800m
3. The existing Biogas systems are used to treat sewage in addition to
producing biogas for lighting and heating. The individuals with biogas systems are not directly
involve with the sewage treatment process except during maintenance of the system. In some
households, the effluent from the digester is used as an organic fertilizer to boost crop
productivity. Even though biogas is capable of solving some of the energy and environmental
problems of the poor rural populations, urban communities and industrial estates, there is usually
high investment requirement. This limiting factor discourages individuals from owning a biogas
plant. The pathogen levels in digested faecal sludge from the bio-latrines would be reduced; hence
disposing it would be less harmful as compared with the fresh faecal sludge. Farmers in
developing countries are in dire need of fertilizer for maintaining cropland productivity. At the
same time, the amount of technically available Nitrogen (N), potassium (K) and phosphorous (P)
in the form of organic materials is around eight times as high as the quantity of chemical fertilizers
actually consumed in developing countries.
Conclusions Ghana might not meet the MDG target on sanitation by 2015. For Ghana meet the MDG target,
biogas systems should be one of focal points when disseminating sanitation facilities for
communities. The presence of domestic biogas plants not only treat faecal sludge but, but can also
49
digest kitchen waste and food leftovers. This will reduce the amount of solid waste at the domestic
level. The biogas produced could substitute woodfuel and supplement Liquefied Petroleum Gas
(LPG) used for cooking and heating. Even though there are no clear-cut policies for the promotion
of the domestic biogas technologies in Ghana [9] a number of plants have been constructed since
1996 [8]. According to [13], the government will promote biogas-for-heating in institutional
kitchens, laboratories, hospitals, boarding schools, barracks, etc. The benefits it provides to the
country are environmental sustainability, improved health and increase in agricultural productivity
inter alia. It will further to reduce the workload of women in households providing avenues for
other social and economic benefits when proper programmes are followed. Implementation of
biogas technology will support the global climate change mitigation interventions through methane
capture. The biogas produced from community bio-latrines can be used to provide lighting at night
for the immediate environs of the bio-latrines. The presence of the light, can the opportunity for
the community folks to sell at night to earn some income.
Recommendation The government should begin to focus on the dissemination of bio-latrines in communities where
there are plans for constructing KVIPs. The bio-latrines in this regard, will treat the faecal sludge
under anaerobic conditions to produce biogas. Consequently, the designated sewage dumping site
will become redundant preventing direct exposure to individuals which could otherwise affect their
health. The effluent from the digester has been proven to be the best fertilizer for farms which
provides farmers with an improved organic fertilizer. This could increase crop productivity in
these communities. Biogas systems not only could help Ghana achieve its MDG target on access to
basic sanitation, but would help in the creation of sustainable development through the provision
of renewable energy source, environmental sustainability, economic empowerment and increase in
agricultural production.
The government should develop a domestic biogas dissemination programme which should
include the introduction of financial incentives such as soft loans and subsidies at the initial stage.
This can be done by involving ministry of Environment Science and Technology, Energy
Commission, Universities and other institutions should be involved in developing such a plan. The
various technologies applied in Ghana should be studied by Centre for Scientific and Industrial
Research (CSIR) or by other research institutions mandated in this regard.
There is need for intensive ad extensive public education during the project planning and
implementation phrase. The basic facts about biogas technology should be made clear beforehand,
so that possible problems of biogas technology are transparent to the stakeholders involved.
Obstacles can arise from religious and social taboos in respect of prohibitions in the use of biogas
primarily for the preparation of food and in the use of the effluent. The government can also
provide support to local energy Non-governmental Organizations (NGOs) such as KITE and
Centre for Energy, Environment and Sustainable Development (CEESD) who will then provide
periodic technical and financial support to domestic biogas owners.
50
________________________________________________________________________________
References 1. UNDP (2008). Human Development Report– Fighting Climate Change: Human Solidarity in
a Divided World.
2. WSMP (2008). Use of Toilet facilities in Ghana. Can the country achieve MDGs for
Sanitation? A WSMP brief, Ghana, from http://www.watermwrwh.com/downloads/
Use%20of%20Toilet%20Facilities%20in%20Ghana2.pdf.
3. Anku S. E. K. (2005). Waste Management in Ghana, 18th
Session of the United Nations
Commission on Sustainable Development, National Report for Ghana. from
http://www.un.org/esa/dsd/dsd_aofw_ni/ni_pdfs/NationalReports/ghana/Anku_SCD_Waste%2
0Mgt%5B1%5D.pdf.
4. GLSS (2008). Ghana Statistical Service, Ghana Living Standards Survey, GLSS 5, Report of
the fifth round, Ghana.
5. Ghana Health Service: Ghana Health Sector, Facts and Figures, 2009, from
http://www.ghanahealthservice.org/includes/upload/publications/Facts%20and%20Figures%20
2009.pdf.
6. NDPC (2008). Millennium Development Goals, Report National Development Planning
Commission (NDPC)/Government of Ghana and United Nations Development Programme
(UNDP), Ghana.
7. Sachs, J. D., McArthur, J. W., Schmidt-Traub, G., Kruk, M/, Buhadar, C., Faye, M. McCord G
(2004). Millennium Development Goals Needs Assessments for Ghana, Tanzania and Uganda.
Millennium Project, UN Millennium Project Secretariat.
8. KITE (2008). Feasibility Study report on domestic biogas in Ghana. Submitted to Shell
foundation, Kumasi Institute of Technology, Energy and Environment (KITE), Accra, Ghana.
9. Arthur, R. (2009). Feasibility study for institutional biogas plant for KNUST sewage treatment
plant. MSc. Thesis. Kwame Nkrumah University of Science and Technology (KNUST),
Kumasi, Ghana.
10. Bensah, E. C., & Brew-Hammond, A. (2010). Biogas technology dissemination in Ghana:
History, current status, future Prospects and policy significance. International Journal of
Energy and Environment. 1(2)277-294
11. Arthur R, Baidoo MF, Brew-Hammond A and Bensah EC. Biogas generation from sewage
in four public universities in Ghana: A solution to potential health risk. Biomass and Bioenergy
2011, 35 (7), 3086-3093
51
12. Bensah, E., C. (2009). Technical evaluation and standardization of biogas plants in Ghana.
MSc. Thesis, Kwame Nkrumah University of Science and Technology (KNUST), Kumasi,
Ghana.
13. SNEP (2006). Strategic National Energy Plan (2006-2020) and Ghana Energy Policy: Main
Version, Energy Commission (EC) Accra, Ghana, 2006.
14. Palamuleni, L., G. (2002). Effect of sanitation facilities, domestic solid waste disposal and
hygiene practices on water quality in Malawi‟ s urban poor areas: a case study of South Lunzu
Township in the city of Blantyre. Physics and Chemistry of the Earth, 27 (11-22) 845-850.
15. Jha PK. Recycling and reuse of Human Excreta from Public Toilets Through Biogas
Generation to Improve Sanitation, Community Health and Environment. www.unapcaem.org
[Cited 15.08.2011] available at
http://unapcaem.org/Activities%20Files/A01/Recycling%20and%20reuse%20of%20human%2
0excreta%20from%20public%20toilets%20through%20biogas%20generation%20to%20impro
ve%20sanitation,%20community%20health%20and%20environment.pdf
16. RCN (2011). Ghana Decides: CLTS is the way to go. WASH REFLECTIONS. Monthly
Review of the National Level Learning Alliance Platform. Resource Centre Network Ghana
(RCN). Number 13; 2011.
17. Arthur R, Baidoo MF, Antwi E. Biogas as a potential renewable energy source. A Ghanaian
case study. Renewable Energy 2011;36 (5):1510-6.
_______________________________________________________________________________
Contact Details Richard Arthur
Department of Energy Systems Engineering
Koforidua Polytechnic
P.O Box KF981
Koforidua
Email: [email protected]
Edward Antwi
Department of Mechanical Engineering
Kumasi Polytechnic
P. O Box 854
Kumasi
Email: [email protected]
_______________________________________________________________________________
52
________________________________________________________________________________
3rd Ghana Water Forum, Accra, Ghana, 2011
Water and Sanitation Services Delivery in a Rapidly Changing Urban Environment
Ghana’s Revised Environmental Sanitation Policy 2010: A Review
Edem Cudjoe Bensah, Edward Antwi & Julius Cudjoe Ahiekpor
________________________________________________________________________________
Abstract About 78 % of Ghanaians lack access to improved latrines and the challenge of meeting the
Millennium Development Goals for sanitation are becoming increasingly difficult. The revised
Environmental Sanitation Policy of 2010 is expected to deal effectively with the issues that have
led to the persistent underlying causes of poor environmental sanitation and its vital link to health.
This paper reviews the revised Policy and examines its readiness to close gaps in the delivery of
sanitation interventions in Ghana. The paper shows that the revised Policy prioritizes waste
collection and disposal at the expense of the four Rs: reduction, reuse, recycling and recovery. The
policy also fails to set concrete targets on various aspects of waste management, a situation that
makes it difficult to evaluate the Policy with regards to the policy actions and measures outlined.
Even though the challenges as well as policy actions and measures touch on every aspect of
environmental sanitation, the Policy fails to set the right priorities which mean incentives and
other support mechanisms are likely to end up in the wrong hands. A more robust Policy with
concrete targets and timelines, and which revolves around the principles of the 4Rs is urgently
needed.
________________________________________________________________________________
Introduction Sanitation in Ghana Sanitation is a critical intervention needed to improve the standard of living of all Ghanaians, and
to reduce or prevent the incidence of communicable diseases. Sanitation has become a major
development issue in recent years. The lack of adequate sanitation facilities in both rural and urban
communities is recognized in Ghana’s Medium-Term Development Policy Framework (MTDPF)
which covers the period 2010 – 2013. MTDPF recognizes the importance of improved sanitation
and thus contains strategies for improving sanitation such as prevention of slum formation and
promotion of private sector involvement in flood control and coastal protection [1]. Solid and
liquid waste disposal is said to be one of the problems facing peri-urban and urban communities
[2]. Most public toilets are under undue pressure due to the fact that most houses in both rural and
urban areas lack adequate toilet facilities; moreover, overcrowding in cities and towns, insufficient
housing units, illegal structures, and streetism have worsened the problem [3].
Baseline data gathered by local authorities in 2007/8 put the percentage of household relying on
poor waste collection and disposal methods at 76 %, and only 5 % have access to house-to-house
collection. The five largest cities comprising Accra, Kumasi, Sekondi-Takoradi, Tamale and Tema
generate over 3,200 tonnes of solid waste daily in addition to over 5000 tonnes of solid waste
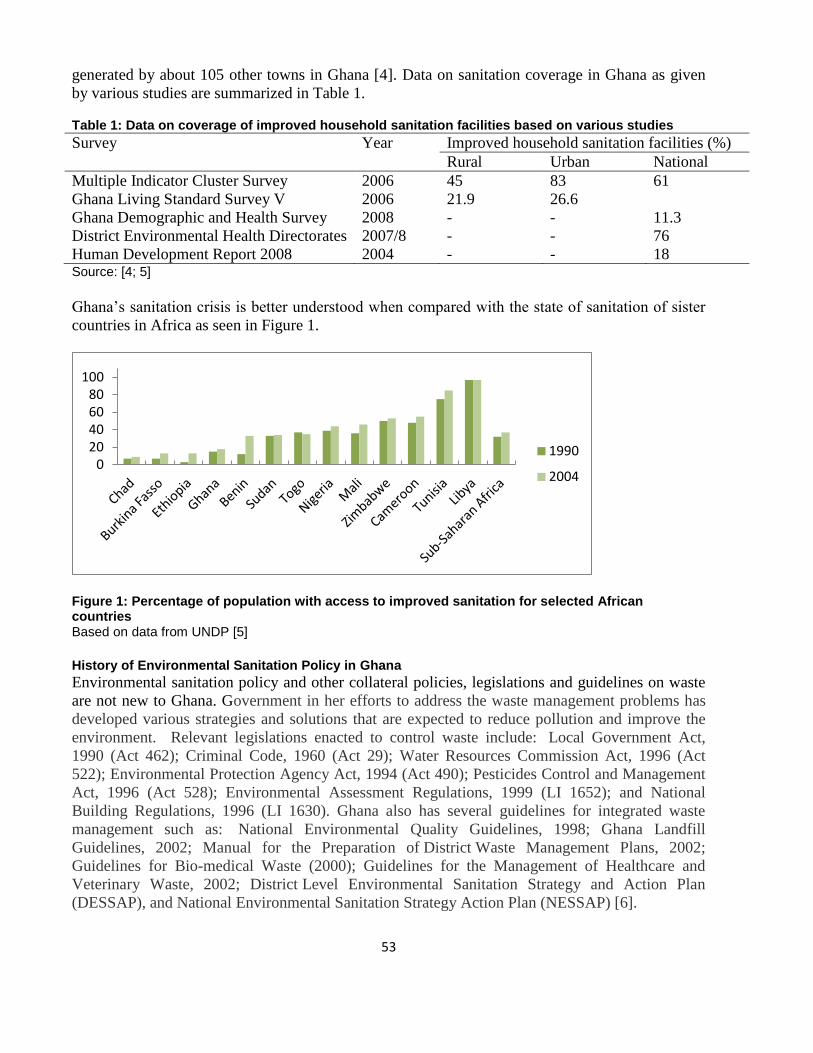
53
generated by about 105 other towns in Ghana [4]. Data on sanitation coverage in Ghana as given
by various studies are summarized in Table 1. Table 1: Data on coverage of improved household sanitation facilities based on various studies
Survey Year Improved household sanitation facilities (%)
Rural Urban National
Multiple Indicator Cluster Survey 2006 45 83 61
Ghana Living Standard Survey V 2006 21.9 26.6
Ghana Demographic and Health Survey 2008 - - 11.3
District Environmental Health Directorates 2007/8 - - 76
Human Development Report 2008 2004 - - 18 Source: [4; 5]
Ghana’s sanitation crisis is better understood when compared with the state of sanitation of sister
countries in Africa as seen in Figure 1.
Figure 1: Percentage of population with access to improved sanitation for selected African countries Based on data from UNDP [5]
History of Environmental Sanitation Policy in Ghana Environmental sanitation policy and other collateral policies, legislations and guidelines on waste
are not new to Ghana. Government in her efforts to address the waste management problems has
developed various strategies and solutions that are expected to reduce pollution and improve the
environment. Relevant legislations enacted to control waste include: Local Government Act,
1990 (Act 462); Criminal Code, 1960 (Act 29); Water Resources Commission Act, 1996 (Act
522); Environmental Protection Agency Act, 1994 (Act 490); Pesticides Control and Management
Act, 1996 (Act 528); Environmental Assessment Regulations, 1999 (LI 1652); and National
Building Regulations, 1996 (LI 1630). Ghana also has several guidelines for integrated waste
management such as: National Environmental Quality Guidelines, 1998; Ghana Landfill
Guidelines, 2002; Manual for the Preparation of District Waste Management Plans, 2002;
Guidelines for Bio-medical Waste (2000); Guidelines for the Management of Healthcare and
Veterinary Waste, 2002; District Level Environmental Sanitation Strategy and Action Plan
(DESSAP), and National Environmental Sanitation Strategy Action Plan (NESSAP) [6].
0 20 40 60 80
100
1990
2004
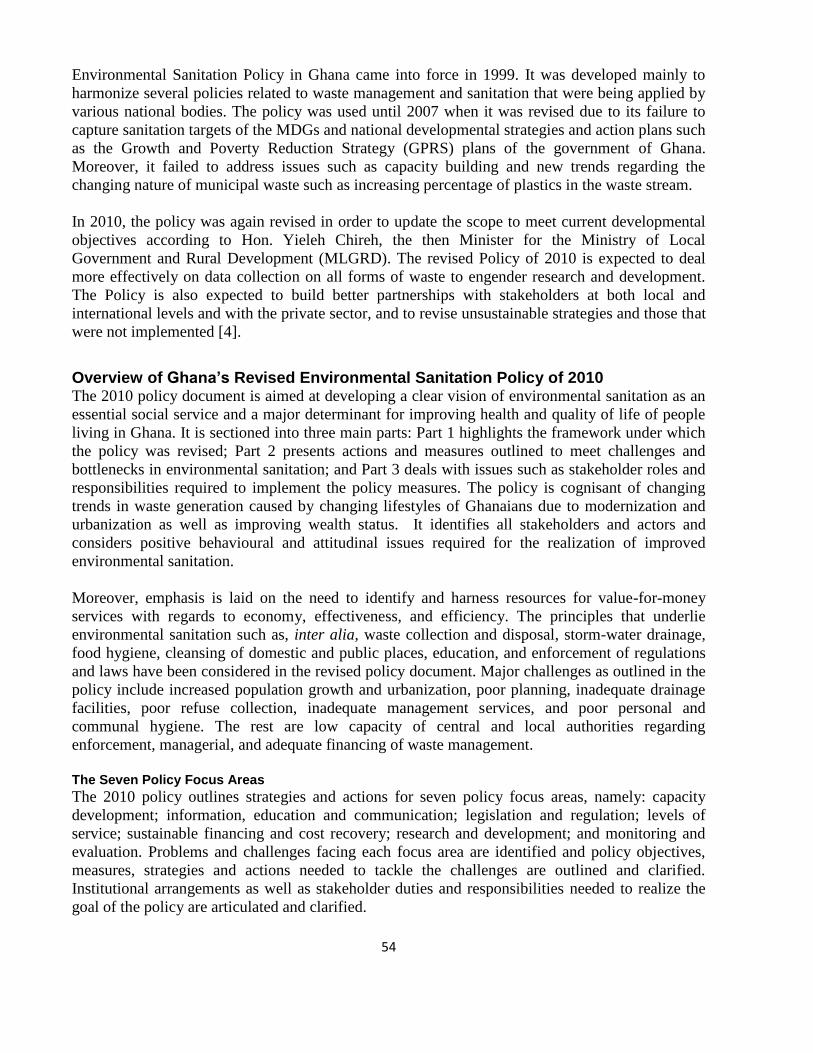
54
Environmental Sanitation Policy in Ghana came into force in 1999. It was developed mainly to
harmonize several policies related to waste management and sanitation that were being applied by
various national bodies. The policy was used until 2007 when it was revised due to its failure to
capture sanitation targets of the MDGs and national developmental strategies and action plans such
as the Growth and Poverty Reduction Strategy (GPRS) plans of the government of Ghana.
Moreover, it failed to address issues such as capacity building and new trends regarding the
changing nature of municipal waste such as increasing percentage of plastics in the waste stream.
In 2010, the policy was again revised in order to update the scope to meet current developmental
objectives according to Hon. Yieleh Chireh, the then Minister for the Ministry of Local
Government and Rural Development (MLGRD). The revised Policy of 2010 is expected to deal
more effectively on data collection on all forms of waste to engender research and development.
The Policy is also expected to build better partnerships with stakeholders at both local and
international levels and with the private sector, and to revise unsustainable strategies and those that
were not implemented [4].
Overview of Ghana’s Revised Environmental Sanitation Policy of 2010 The 2010 policy document is aimed at developing a clear vision of environmental sanitation as an
essential social service and a major determinant for improving health and quality of life of people
living in Ghana. It is sectioned into three main parts: Part 1 highlights the framework under which
the policy was revised; Part 2 presents actions and measures outlined to meet challenges and
bottlenecks in environmental sanitation; and Part 3 deals with issues such as stakeholder roles and
responsibilities required to implement the policy measures. The policy is cognisant of changing
trends in waste generation caused by changing lifestyles of Ghanaians due to modernization and
urbanization as well as improving wealth status. It identifies all stakeholders and actors and
considers positive behavioural and attitudinal issues required for the realization of improved
environmental sanitation.
Moreover, emphasis is laid on the need to identify and harness resources for value-for-money
services with regards to economy, effectiveness, and efficiency. The principles that underlie
environmental sanitation such as, inter alia, waste collection and disposal, storm-water drainage,
food hygiene, cleansing of domestic and public places, education, and enforcement of regulations
and laws have been considered in the revised policy document. Major challenges as outlined in the
policy include increased population growth and urbanization, poor planning, inadequate drainage
facilities, poor refuse collection, inadequate management services, and poor personal and
communal hygiene. The rest are low capacity of central and local authorities regarding
enforcement, managerial, and adequate financing of waste management.
The Seven Policy Focus Areas
The 2010 policy outlines strategies and actions for seven policy focus areas, namely: capacity
development; information, education and communication; legislation and regulation; levels of
service; sustainable financing and cost recovery; research and development; and monitoring and
evaluation. Problems and challenges facing each focus area are identified and policy objectives,
measures, strategies and actions needed to tackle the challenges are outlined and clarified.
Institutional arrangements as well as stakeholder duties and responsibilities needed to realize the
goal of the policy are articulated and clarified.

55
Evaluation of the Environmental Sanitation Policy of 2010 While the policy identifies challenges affecting all forms of sanitation delivery, it is handicapped
in defining the priorities with regards to policy actions and measures for fighting the myriad of
problems enumerated. In the arena of solid and liquid waste management, the policy fails to
emphasize the application of the principle of the four Rs (Reduce, Reuse, Recycle, and Recovery)
which are globally accepted as integral part of integrated waste management. While the 4R
concept is recognized by the Policy in a few sections, it fails to apply the principle to the seven
policy focus areas.
The Neglect of the Four Rs The revised Policy of 2010 puts too much emphasis on waste collection and disposal contrary to
internationally accepted strategies for achieving integrated waste management. The four Rs –
Reduce, Reuse, Recycle, and Recovery is a waste management strategy that outlines four means of
dealing with waste in a preferential order, from the most useful (Reduce) to the least favoured
(Recover). The concept of the 4Rs aims at reducing to the barest minimum the quantum of waste
generation while realizing the maximum practical benefits from products. Though disposal has a
place in an integrated waste management system, it is usually the last option on the table.
With Ghana’s population currently estimated at over 24 million coupled with the growth of cities
and towns, waste generation is increasingly at a fast rate. The fraction of waste collected is small
in most peri-urban communities but has increased in major cities such as Accra (70%), Kumasi
(75%), Sekondi-Takoradi (60%), and Tamale (55%). Well engineered waste disposal sites are
absent in all the cities except Kumasi. Waste treatment facilities for both solid and liquid waste are
woefully inadequate leading to open dumping of waste and discharge of faecal sludge in water
bodies. According to the National Population Council [7], only 4.8 % of household waste is
collected. A staggering 57.6 % of all waste generated ends up at public dumping grounds untreated
and in unhygienic conditions. Burning contributes 7.9 % whiles 25 % of the waste is dumped
elsewhere and 3.9 % are buried [4]. Moreover, close to 76 % of households still rely on improper
waste collection and disposal methods, and only 5 % rely on house-to-house collection, according
to the baseline environmental sanitation data gathered in 2007/8 [4].
Regionally, Greater Accra performs better than all the other regions with 19.5 % of waste
generated collected. Central and Brong Ahafo Regions have the lowest quantities of waste
generated collected, 0.8 % and 0.9 % respectively. The three northern regions – Northern, Upper
East and Upper West have the highest rate of indiscriminate waste disposal, 55.3 %, 55.2 % and
65.6 % respectively. Analysis of municipal waste in Ghana gives the following composition for
waste collected: organic (40 – 70%), plastic (15 – 20%), paper and cardboard (4 - 13 %), metals (2
– 5 %), and others comprising glass, textiles, e-waste, and ashes (7 - 25%) [8].
The numerous problems facing the sector thus require a realistic strategy that tackles the problem
right from the source. While it is understood that the fraction of waste collected and disposed
appropriately is woefully poor, prioritizing the 4R concepts will lead to reduced waste reduction in
the first place, a situation that will put less constraints on waste collection companies and local
authorities as there will be less waste to collect and dispose.

56
Waste Reduction
There is the need to apply the 4Rs to each category of waste. Reducing waste leads to prevention
and minimization of waste in the first place. That means there is less waste to worry about. The
benefits of waste reduction are numerous: less pollution and therefore improved sanitation,
reduced financial constraints on waste collection, time savings from waste collection, reduced
pressure on dumps and landfills, among others. The policy should also look at issues pertaining to
the reduction in the use of toxics, inorganic chemicals, pesticides, e-waste, and hazardous
chemicals. The policy should for instance encourage:
1. Sorting of waste at source
2. Household composting of organic waste
3. Reduced packaging materials by industries
Waste Reuse
Reusing waste creates resources out of waste. That means the material or substance called waste is
no longer considered waste. Finding new uses for old materials avoid waste generation and thus
promote environmental sanitation. Organic waste reuse involves the use of technologies such as
composting to organic fractions of municipal waste.
Waste Recycling
Recycling of waste ensures that waste materials that would have ended at the landfill are rather
used for another purpose. Recyclable products should be promoted through appropriate policy
guidelines on education and awareness creation. The policy should explore avenues for creating
incentives for companies involved in recycling. Several initiatives that can be promoted to improve
waste recycling include composting for organic waste and purchasing of materials with higher
percentages of recyclable components and packaging,
Waste Recovery
This involves the identification and reprocessing of useful components of items considered as
waste. The recovered part may be reused or recycled. Waste recovery ensures that only unusable
parts or components of old materials, gadgets and equipment are sent to the landfill site. It helps in
reducing the volume of waste disposed. An example of waste recovery is the removal of certain
useful components from old computers before the computers are disposed.
The Lack of Targets
While the 2010 Policy adequately identifies challenges and gaps in the delivery of environmental
sanitation services in the country, it fails to set targets with regards to policy measures and actions
outlined under the seven focus areas. The policy, for example, does not have targets on the
percentage of Ghanaians that are expected to enjoy improved household latrines within a time
period. It also unclear whether the Policy aims at achieving the MDG targets on sanitation.
Targets on house-to house waste collection as well as waste reuse and recycling are not clearly
defined. It is also unknown when ad-hoc disposal dumps that receive waste from the major cities
would be replaced with engineered landfills.
In order to address non-existence of targets in the Policy, future reviews should take cognisant of
targets on waste collection as stipulated in the NESSAP [9]. Moreover, the NESSAP should also
57
be reviewed to include targets on waste reuse, reduction, recycling and recovery, as well as targets
on the provision of public toilets, which are currently non-existent. While targets were set for
dislodging faecal matter, pertinent issues such as disposal sites and treatment options were not
clearly outlined [9].
Even though NESSAP contains minimum targets for home-latrines, the baseline underlying the
target is not clear. It is also not clear the type of technology that will be promoted. While some
aspects deal with support for biogas digesters, no targets were included and the exact digester
models that would be promoted are not listed [9]. NESSAP fails to outline deliverables for
instance and milestones that are essential in evaluating the policy.
Lessons Policies that set the right priorities create the framework for incentives to go to the right receivers
and for the right activities and programmes. It leads to the development of sustainable and
effective programmes and ensures that limited resources are used judiciously and at the best
interest of society. If the priorities are gotten wrong, resources would be wasted in the long run. It
should also be noted that policies engender programmes and dictate where incentives should go
and the people/organizations that should receive them. Looking at the current Policy, it is clear that
attention is focused on the collection and disposal of waste. That means much of the incentives and
support will go to individuals and organizations that collect and dispose waste which should not be
the case. A bigger fraction should rather be channeled into activities and programmes aimed at
reducing, reusing, recycling and recovering waste.
The lack of concrete targets in the Policy has made it extremely difficult to monitor and evaluate
the implementation of the policy. The document is replete with numerous policy actions and
measures that cannot be verified.
Conclusion and Recommendations The revised Environmental Sanitation Policy of 2010 has its strong and weak points. The seven
focus areas of the Policy embrace every sector of the waste management chain. It adequately
creates an enabling environment that encourages access to and use of sustainable sanitation
services and this facilitates the tasks of those concerned with sanitation provision. The weak point
of the Policy is its failure to build the seven focus areas around the principles of the four Rs. This
has created a situation where waste collection and disposal are given paramount interest at the
neglect of the four Rs. This means government, local authority and donor funds will mainly go into
activities such as waste collection and disposal as opposed to waste reduction, reuse, recycling,
and recovery.
It is recommended that the Policy is revised again to make the principle of the 4Rs the central
focus of a new revised policy that gets its priorities right and embraces the core principles of
integrated waste management. The proposed revised policy should set concrete targets in all
aspects of environmental sanitation and realistic policy measures and actions should focus on
achieving the targets against specified timelines.
58
_______________________________________________________________________
References 1. National Development Planning Commission (2009). Medium-Term Development Policy
Framework 2010 – 2013. Accra, Ghana. Available at
http://www.ndpc.gov.gh/GPRS/Policy%20Matrix%20for%20MTDFramework%202010-
2013.pdf (accessed on 15/07/11)
2. National Development Planning Commission (2005). Growth and poverty reduction strategy II
– economic development and poverty reduction in Ghana. Accra, Ghana.
3. Ministry of Water and Housing / Community Water and Sanitation Agency (2004). Strategic
Investment Plan, 2005-2015. Accra, Ghana.
4. Ministry of Local Government and Rural Development (2010). Environmental Sanitation
Policy – Revised Draft. Accra, Ghana.
5. UNDP, 2008. Human Development Report – Fighting Climate Change: Human Solidarity in a
Divided World.
6. UN Commission on Sustainable Development: 18th
Session. National Report for Ghana: Waste
Management in Ghana. Available at
http://www.un.org/esa/dsd/dsd_aofw_ni/ni_pdfs/NationalReports/ghana/Anku_SCD_Waste%2
0Mgt%5B1%5D.pdf (accessed on 17/07/11)
7. National Population Council (2005). Fact Sheet III. National Population Council, Accra
8. Abu-Samad F., Kankam J. (2011). Production of Compost from Sorted Organic Waste at
Kumasi Polytechnic. Chemical Engineering Department, Kumasi Polytechnic, Kumasi
9. MLGRD (2010). National Environmental Sanitation Strategy and Action Plan. Accra, Ghana
________________________________________________________________________________
Keywords Environmental sanitation, policy, four Rs, waste management
59
Contact Details Ing. Edem Bensah
Chemical Engineering Department
Kumasi Polytechnic
Box 854
Kumasi
Mobile: 0246450842
Email: [email protected] / [email protected]
Website: www.ceesdghana.org / www.kpoly.edu.gh
Ing. Edward Antwi
Mechanical Eng. Dept.
K. Poly
Mobile: 0208250357
Email: [email protected]
Julius Ahiekpor
Chemical Engineering Department
Kumasi Polytechnic
Mobile: 0244529589
Email: [email protected] / [email protected]
60
________________________________________________________________________________
3rd Ghana Water Forum, Accra, Ghana, 2011
Water and Sanitation Services Delivery in a Rapidly Changing Urban Environment
The Canker of Open Defecation
Nii Odai Anidaso Laryea, Joseph Ampadu-Boakye, Francis Mawuena Dotse, Daniel Yaw Karikari
& Edward Gyan
________________________________________________________________________________
Abstract Even though the International Drinking Water Supply and Sanitation Decade (IDWSSD) was
launched in 1991 and was expected to have ended in 2000 with many developing countries
increasing accessibility and usage of potable water and improved latrines, many in Africa are still
lagging behind these two basic necessities of life particularly in sanitation (WaterAid, 2008). In
Ghana, in spite of fair progress made in water coverage, less than 15% of the population has
access to improved sanitation (WSMP, 2008). Indeed, it has been reported that about 20% of
Ghana’s population defecate in drains, fields, streams, the bush and beaches. Given the pace of
development with respect to basic sanitation, there is no way the country can achieve the MDG
targets by 2015. This paper examines the reasons for Ghana’s slow pace in sanitation delivery and
makes suggestions on what can be done to accelerate progress.
________________________________________________________________________________
Background Between the 1980s and late 1990s to-date, much of the approach to basic sanitation improvement
in rural areas has been through the assistance of Development Partners and non-governmental
organisations as part of water and sanitation programme interventions. These have been done
through the training of latrine artisans for construction of certain types of latrines3 on the one hand
and the provision of selected items or direct cash payments as subsidies to rural dwellers within the
project areas on the other hand. Even though these latrines were to serve as demonstration models
for others to emulate and construct accordingly, the “knock-on” impact has been slow and
discouraging. Only 12.4% of the population uses improved sanitation facilities which are not
shared (GSS, 2008). The Ashanti, Greater Accra, Brong Ahafo, Western and Central Regions have
the highest use of improved latrines while many residents in the Upper East, Upper West and
Northern Regions resort to “open defecation” (GSS, 2006). The slow pace of latrine construction
and proper usage can be attributed to a number of challenges. They have been classified into
physical, financial, psycho-social and institutional/legal and are examined in the sections
hereunder.
Challenges Physical
Lack of adequate space/land especially in urban areas or densely-populated neighbourhoods is one
factor that accounts for construction of inadequate latrines and predisposes people to open
defecation. One reason given why people are unwilling and sometimes unable to construct latrines
3 Artisans were trained and provided with equipment for the construction of (a) Mozambique type Ventilated Improved Pit (b)Reinforced Ring beam Ventilated Improved Pit (c) Kumasi Ventilated Improved Pit and (d)Sanplat latrines.
61
is that they simply do not have the space available. About 25% of people interviewed in a recent
survey said that even though they would have liked to build their own latrines, there is simply no
land available (WaterAid, 2005). Areas are built-up with little space for construction of latrines
and this is attributed to open and wanton disregard for laid-out plans for many settlements with
little space for dislodgement if even the latrines are built (Smith-Asante, 2010). The housing
density in Accra in 2009 was estimated at 558 houses per square kilometer (CHF, 2011).
Given this phenomenon, residents are prepared to pool resources with a few households to enable
them to share a common latrine as has occurred in a number of countries where the Community-
Led Total Sanitation (CLTS) has been triggered e.g. Bangladesh, Nepal and Nigeria.
Unhygienic and unkempt nature of many public latrines become “push factors” for people to
defecate openly. A visit to a majority of our public latrines (except for some of the most recent
types e.g. water closets and pour flush) reveals unsightly scenes such that it is extremely difficult
to go in and come out without being subjected to extreme stench. Human contact with faeces is
even possible owing to the poor maintenance culture and negative attitude of users. For example,
as much as 30% of Accra residents report that they are dissatisfied with the state of public latrines
owing to how they are poorly managed and maintained (World Bank, 2010).
Unstable soils that cave in when pits are dug are a related physical reason for open defecation,
though not justified. One of the biggest challenges facing both rural and urban dwellers regarding
digging pits for latrine construction is weak soils and high water tables (Smith-Asante, 2010). In
some cases, residents have attempted digging pits over and over again, only for the pits to collapse.
The implication is that these pits have to be lined and this has cost implications. If there was no
need for lining to be effected prior to the construction of the main building or habitat of the people
who dwell in the house, they do not see why they should line a pit for what they consider
“temporary use”.
Financial
Some opine that it is a waste of resources spending funds on “waste product” from your
system/body. For them, it is illogical that one should spend hard-earned money to finance a
structure to take care of something that is unwanted. In the cities, there is the phenomenon of the
conversion of latrines by landlords into sleeping places for financial gain. In many urban areas, the
increase in demand for residential accommodation has made a number of landlords/ladies change
originally-meant rooms earmarked for toilets into dwelling places (Bessey, 2011). Tenants are too
glad to rent a place to lay their heads without a corresponding place to let go what they take in. In
Accra-Tema, Kumasi and Sekondi-Takoradi, the three most urbanized centres in Ghana, the rate of
growth is over 4% per annum (Ghana Statistical Service, 2003) and this has become a source of
ready income for some landlords in those places.
In spite of the wrong priorities people place on acquisition of certain material things, it is equally
true to admit that there are some 18% of the extremely poor in Ghana who may not find it easy to
construct a basic latrine of about GHC2004 (equivalent to about $140). These are those whose
standard of living is insufficient to meet their basic nutritional requirements even if they devoted
their entire consumption budget to food (Ghana Statistical Service, 2007).
4 1US$=GHC1.50
62
Psycho-Social
Anecdoctal evidence suggests that some people mostly illiterates and those living in fairly
homogenous communities where there is a high rate of open defecation get addicted to such
behavioural patterns. In a survey carried out in 1990 among people living along the coastal parts of
Ghana, it was discovered that almost 70% of the populace were using the beach as their place of
convenience. Where people have grown up in communities there is open defecation, they are more
likely to continue in similar vein rather than attempting to change what they have become
accustomed to.
Sanitation and hygiene have not been accorded premium by authorities (M/M/DAs.). Right from
the top, our leaders (political, administrative and the elite in general) do not appear to be enthused
about household latrine and hygiene promotion. Many see them as trifles whereas politicians and
decision-makers appear to be concerned with grandiose physical structures and projects that will
win votes and popularity. In the few cases that some attention has been devoted to sanitation, this
has either been in the form of construction of storm drains in large settlements, large refuse
disposal sites and public or communal latrines. Promoting household latrine construction and
ensuring the eradication of “free range” has always been relegated to the background
The long distance and waiting time at public latrines are perceived as “wasted time” and hence it is
“faster to do it in the open”. When people have to walk for more 500 metres in the cities and towns
to the nearest public latrine and have to queue, they resort to open defecation as a “prompt and
ready” strategy. On average, people find it difficult to spend more than 20 minutes waiting for
their turn in order to use either a KVIP, aqua privy or most recently the public water closet system.
Considering that this could be inconvenient to people, they would rather resort to open defecation
where there are no restrictions regarding time or distance.
It has also been realized that there is no sense of shame for many including adults who defecate
openly. One of the biggest reasons people defecate openly is that unlike the “initiated”, most
people do not have any sense of disgrace whatsoever while easing themselves.
Closely related to this reason is the perception of some people that excreta disposal is only “a
temporary inconvenience”. If people are going to spend just a few minutes every day to dispose of
“waste” from their system, they do not see why they should bother constructing a latrine for it.
There are a also a number of migrant communities or groups of settlers in Ghana who, because
they do not consider their present places of abode as their permanent home towns, do not deem it
necessary to build latrines they would leave behind eventually. The irony however is that while it
has been realized that these settlers are not interested in constructing household latrines for their
use in the communities they have migrated to, they do not have the improved latrines in their areas
of origin or permanent homes either. The number of migrants in our communities is fairly high.
The Ghana Statistical Service estimates that 52% of Ghana’s population is migrants.
Owing to misplaced priorities, people deem it expensive to build a latrine as compared to spending
money on other “prioritized needs”. People who give the impression that they are poor are
prepared to spend funds on issues such as annual festivals, “out-dooring”5 ceremonies of newly-
5 In Ghana, the traditional naming ceremony of a a newly born child (usually after 8 days) is referred to as outdooring
63
born babies, funeral ceremonies, lottery, multiple marriages, alcohol intake on a regular basis,
units for mobile phones, expensive clothes especially wax prints for women, regular “dressing of
the hair” for women etc. (Dotse & Laryea, 2001). Legal/Institutional
Laws on indiscriminate defecating have not been applied on people who are found defecating. In a
few cases where people have been arrested, the judgment passed on them has not been punitive
enough to serve as a deterrent hence people get away with the practice Only a small minority of
people who defecate openly are apprehended and the fines only range from GHC50 to GHC100
(equivalent of about $70).
Inadequate staff of the Environmental Health and Sanitation Directorate (EHSD) to monitor and
check the menace is another challenge. Inadequate resources, logistics and incentives for
Environmental Health Assistants and their officers to monitor sanitation generally is another big
challenge. Whenever resources are made available to the water and sanitation sector, much more
goes into hardware and the construction of physical facilities rather than on hygiene promotion and
community mobilisation which are not perceived as the more basic essentials for change in
behavior than the structures (Simpson-Herbert & Wood, 1998).
It is opined that until the 1970s and 80s, Environmental Health Assistants who used to champion
the adoption and proper use of improved latrines were seen and/or perceived as “policemen” who
only cracked the whip on defaulters. Defaulters who were often found in the rural areas or
relatively poor sectors within the urban enclaves were fined. People neither understood the nature
of their “crimes” nor were they made to appreciate the health linkage of their actions or inactions.
In the few cases where EHAs engaged residents in discussions, they were primarily didactic and
only “pushed information down the throats of their audience” without assisting them to establish
the cause/origin, transmission routes and effects of their deeds or misdeeds. Beneficiaries were
made mere spectators rather than participants of their own development.
Way Forward A national crusade should be launched to rid the population of this canker and move away from
these disgraceful acts and ensure that people own latrines and use them effectively as to reduce and
possibly eradicate certain diseases associated with poor sanitation in our country! Some of the
ways in which this can be done effectively include the following:
Governmental support
Having realized that we are off-track to achieving MDGs for sanitation, Ghana and its
Development Partners pledged to allocate US$200 million annually from 2010 to 2015 and an
additional US$50 million annually to reinforce hygiene promotion. It is recommended that the
Ghana government should provide the required financing to support hygiene and sanitation
promotion across all levels in the country.
Stronger Collaboration and Sector Harmonisation
The various institutions involved in aspects of sanitation should harmonise their approaches for a
concerted effort at combating open defecation in Ghana. This has to be spearheaded by the
Ministry of Local Government and Rural Development, supported by the Community Water and
Sanitation Agency, MMDAs and Development Partners operating within the water, sanitation and

64
hygiene promotion (WASH) sector. Some of these are WaterAid, Plan Ghana, World Vision
Ghana, Ghana Education Service-Ghana Health Service under the School Health Education
Programme (SHEP), Ministry of Information, UNICEF, DANIDA, KfW, European Union, CIDA
etc. This will help build concensus on issues such as abolition of subsidies for household facilities
and concentration on school facilities. It will also ensure that a single strategy is adopted in
hygiene and sanitation promotion.
Review of Annual MMDAs Performance Assessment Indicators
To put a stop to open defecation, it should become mandatory for an MMDA to achieve a
minimum percentage of latrine-use by residents/households in that district as a minimum
condition for the assessment of MMDAs under the Functional and Organisation Assessment Tool
(FOAT) which enables MMDAs to qualify for funds allocation under the District Development
Facility (DDF)6. This will trigger political and administrative interest in hygiene and sanitation
promotion at the district level and contribute to stopping open defecation.
Communal Septic Tanks & Support to EHSD
In urban areas where land becomes a key issue, a number of households (e.g.10) could be brought
together for them to use “communal septic tanks” that will be connected to a central sewerage
system like the one being done for Accra under the Accra Sewerage Improvement Project (ASIP)
(Smith-Asante, 2010) – this approach would not only reduce open defecation but also require less
space as compared to insisting that every household should have a latrine which is not feasible. In
rural areas and areas with uninhabited land such as large portions of the Northern, Upper East and
Upper West Regions, emphasis must be placed on the CLTS approach coupled with adequate
resourcing of staff of the Environmental Health and Sanitation Directorate at all levels to provide
sustained hygiene promotion.
Conclusion In conclusion, it must be emphasized that the approach to ending open defecation should be a
full-scale and sustained head-long attack which would be similar to the earlier programmes
waged for malaria, HIV-AIDs etc. We should use print and electronic media e.g. FM stations,
newspapers, television and other sources including celebrities to advocate proper disposal of
human excreta and improved hygiene messages like hand-washing with soap at critical times to
drum home this idea.
________________________________________________________________________________
References 1. Dabire, Lamisi, 2010, “Ghana Observes World Toilet Day”, Water Focus (Ghana’s Water
Sector Newsletter, 2nd
Edition), January – May, 2010, Accra
2. Dotse, F. M. & Nii Odai Laryea, 2001, Rural Poverty or Misplaced Priorities? Paper presented
at the 27th
WEDC Conference, “People and Systems for Water, Sanitation and Health”,
Lusaka, Zambia, September
3. Ghana Statistical Service, 2007, Patterns and Trends on Poverty in Ghana, April, Accra
6 This is a performance based grant system for local governments based on an annual assessment with the use of
certain indicators.

65
4. Ghana Statistical Service,,2003, Analysis of the 2000 Population and Housing Census, Accra
5. Mayling Simpson Herbert & Sara Wood (ed.), 1998, Sanitation Promotion, WSSCC Working
Group on Promotion of Sanitation, World Health Organisation
6. Ghana Statistical Service, 2006, Multiple Indicator Cluster Survey, 2006. Monitoring the
Situation of Children, Women and Men. Ghana Statistical Service, Accra
7. Ghana Statistical Service, 2008, Ghana Demographic and Health Survey, 2008. Ghana
Statistical Service, Accra
8. Ministry of Finance & Economic Planning, Ministry of Local Government and Rural
Development, Ministry of Local Government, Rural Development and Environment, 2009,
Revised Sanitation Policy, May, Accra;
9. Ministry of Water Resources, Works and Housing, 2010, The Ghana Compact, Sanitation and
10. Smith-Asante, Edmund, WaterAid, 2010, “Why Open Defecation Is Still Rife In Ghana,
Dawuro No. 24 (October – December), pp 10-11;
11. Water for ALL: a Global Framework for Action (SWA), April. Accra;
12. WaterAid, 2005 Sustainability and Equity Aspects of Total Sanitation Programmes;
13. WaterAid, 2008, WaterAid’s Global Strategy, 2009 – 2015, Durham. UK;
14. World Bank, 2010, City of Accra, Ghana, Consultative Citizens’ Report Card, Washington
DC, USA.
15. CHF International (2009) Poverty Map of Accra.
http://www.chfinternationalghana.org/resource/maps.html?iMaps=2-Housing-density-pp.jpg
16. Bessey, B., 2011, Lack of Public/Private Toilets in Accra…as Ghana, world celebrates World
Toilet Day, The Chronicle. Accra, 18th July 2011, http://ghanaian-chronicle.com/regional-
files/greater-accra-region/lack-of-publicprivate-toilet-facilities-in-accra/
Contact Details Nii Odai Anidaso Laryea, Joseph Ampadu-Boakye, Francis Mawuena Dotse, Daniel Yaw Karikari
and Edward Gyan
Maple Consult
P. O. Box CT 3700
Cantonments-Accra
Email: [email protected]
Tel: 233-302-241133/241415
_______________________________________________________________________________

66
________________________________________________________________________________
3rd Ghana Water Forum, Accra, Ghana, 2011
Water and Sanitation Services Delivery in a Rapidly Changing Urban Environment
No Household Sanitation Facilities: What Options Remain For Urban
Dwellers?
Adrien Mazeau, Benedict Tuffuor & Kevin Sansom
________________________________________________________________________________
Abstract Nowadays the poorest and the most vulnerable have little access to individual sanitation in low
income and high density urban areas of sub Saharan Africa. In Ghana, more than 60% of the
urban dwellers use shared sanitation facilities. This paper explores the diversity of shared toilets
with a focus on Ashaiman. Several models of toilets with different sizes, prices per use, level of
formalization and management model serve the urban dwellers. The spread of each type of facility
is linked to the specificity of the urban development of each neighbourhood. This research argues
that in a context where providing household sanitation to all in the short term is not possible,
shared sanitation can be a transitional solution. However adequate shared facilities need to be
defined according to the specificities of the areas, the users ‘perceptions of such facilities and the
legal and local institutional framework. If shared facilities that meet certain agreed criteria are
recognised in policy statements, it can encourage more investment by entrepreneurs.
________________________________________________________________________________
Introduction In Ghana, more than half of the urban population is sharing sanitation facilities. Sharing is done in
many different ways: with neighbours, through community blocks, or using public toilets. The
Joint Monitoring Programme (JMP) using primarily technological criteria, do not consider shared
facilities as improved sanitation, however UNICEF and WHO recently acknowledge the limits of
such thinking (WHO & UNICEF, 2010, p. 36). Examples from India (Burra et al., 2003), certain
projects in Kenya (Peal & Evans, 2010) show that shared facilities can provide a healthy
alternative in the context of high density and low income areas. Therefore the JMP called for
investigating the user perceptions of such facilities and for including in the investigations a range
of aspects such as health, maintenance, operation, safety, privacy and inclusion of most vulnerable
groups.
Shared sanitation facilities range from public toilets shared by anyone to toilet shared by two
families. Each shared toilet can be characterized by its management model, targeted public,
ownership, price and other aspects (Mazeau & Ramsay, 2011; WSUP, 2011). Understanding the
reasons for implementing and using these different models of facilities is a first step towards
understanding the role played by shared facilities in the provision of adequate urban sanitation.
The paper, through a case study in Ashaiman, aims to improve the understanding of sanitation
provision in a rapidly changing environment. Ashaiman is typical of a town where infrastructure
and sanitation cannot keep pace with urbanization. This paper discusses first the range of shared
facilities at a global level, and describes the specificity of sanitation coverage in urban Ghana.
Then, the paper presents the range of toilets available in Ashaiman and considers links that exist
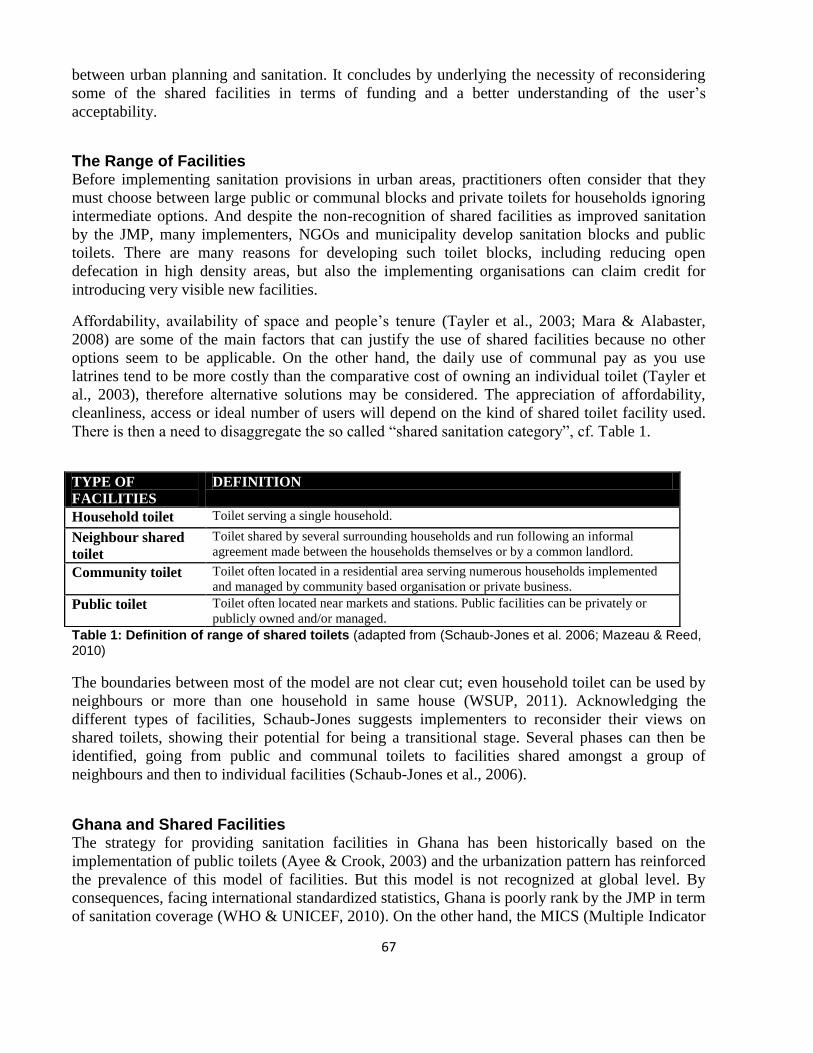
67
between urban planning and sanitation. It concludes by underlying the necessity of reconsidering
some of the shared facilities in terms of funding and a better understanding of the user’s
acceptability.
The Range of Facilities Before implementing sanitation provisions in urban areas, practitioners often consider that they
must choose between large public or communal blocks and private toilets for households ignoring
intermediate options. And despite the non-recognition of shared facilities as improved sanitation
by the JMP, many implementers, NGOs and municipality develop sanitation blocks and public
toilets. There are many reasons for developing such toilet blocks, including reducing open
defecation in high density areas, but also the implementing organisations can claim credit for
introducing very visible new facilities.
Affordability, availability of space and people’s tenure (Tayler et al., 2003; Mara & Alabaster,
2008) are some of the main factors that can justify the use of shared facilities because no other
options seem to be applicable. On the other hand, the daily use of communal pay as you use
latrines tend to be more costly than the comparative cost of owning an individual toilet (Tayler et
al., 2003), therefore alternative solutions may be considered. The appreciation of affordability,
cleanliness, access or ideal number of users will depend on the kind of shared toilet facility used.
There is then a need to disaggregate the so called “shared sanitation category”, cf. Table 1.
Table 1: Definition of range of shared toilets (adapted from (Schaub-Jones et al. 2006; Mazeau & Reed, 2010)
The boundaries between most of the model are not clear cut; even household toilet can be used by
neighbours or more than one household in same house (WSUP, 2011). Acknowledging the
different types of facilities, Schaub-Jones suggests implementers to reconsider their views on
shared toilets, showing their potential for being a transitional stage. Several phases can then be
identified, going from public and communal toilets to facilities shared amongst a group of
neighbours and then to individual facilities (Schaub-Jones et al., 2006).
Ghana and Shared Facilities The strategy for providing sanitation facilities in Ghana has been historically based on the
implementation of public toilets (Ayee & Crook, 2003) and the urbanization pattern has reinforced
the prevalence of this model of facilities. But this model is not recognized at global level. By
consequences, facing international standardized statistics, Ghana is poorly rank by the JMP in term
of sanitation coverage (WHO & UNICEF, 2010). On the other hand, the MICS (Multiple Indicator
TYPE OF
FACILITIES
DEFINITION
Household toilet Toilet serving a single household.
Neighbour shared
toilet
Toilet shared by several surrounding households and run following an informal
agreement made between the households themselves or by a common landlord.
Community toilet Toilet often located in a residential area serving numerous households implemented
and managed by community based organisation or private business.
Public toilet Toilet often located near markets and stations. Public facilities can be privately or
publicly owned and/or managed.

68
Cluster Survey) survey, which also uses technology criteria, encompasses shared facilities in the
improved sanitation category. Thus in 2006 according to the MICS, 80 % of the urban population
of Ghana has access to improved sanitation.
Several sanitation stakeholders call for clear decision in terms of definition in order to better
decide sanitation strategy (WSMP, 2008). Many countries have national sanitation policies (e.g. in
Malawi (GoM, 2008)) that have different definitions of what is improved sanitation compared to
the JMP definition, often with higher standards than the JMP definition. The challenge for the
sanitation sector in Ghana is to arrive at a definition and criteria for improved sanitation that may
include certain types of shared sanitation and physical design characteristics. This will form the
basis for sector targets and funding for 2015 and beyond, after the current MDG (Millennium
development Goals) target period.
Case Study: Ashaiman This paper does not challenge the importance of the technological dimension but focuses on the
user interface, and on the difficulties for urban dwellers to access a sanitation facility from a
financial, social, and geographical perspective. User perspectives are often not adequately taken
into consideration when new shared sanitation facilities are being developed. As seen above,
sanitation in the high density and unplanned urban areas is in most cases provided through shared
services. The diversity of these services depends on a group of local factors. Therefore the paper
makes the choice to focus on one city in Ghana: Ashaiman.
In May 2011, a research team observed several areas of Ashaiman, conducted six focus groups,
facilitated three participatory mapping and conducted 20 households’ questionnaires and
interviews with sanitation providers. Ashaiman is a city of approximately 200 000 inhabitants.
Population increased massively during the last 40 years (20 000 in 1970). The area that was
initially a satellite settlement of Tema became an autonomous municipal assembly in 2008, known
as AshMA (Ashaiman Municipal Assembly).
A month of observations in Ashaiman confirms that the city is characterized both by a diversity of
population with origins from more than 50 ethnics groups and by heterogeneity in term of urban
development (settlement’s structures, quality of housing, and level of services). Due to the
interconnection of traditional and formal power, land ownership is a sensitive issue (Gough &
Yankson, 2000), new land is expensive. Therefore, the core areas of Ashaiman are dense and land
availability is very limited which poses a lot of challenge for sanitation services delivery.
Sanitation Models in Ashaiman The Figure 1 shows the spectrum of type of sanitation facilities available for dwellers living in
high density areas of Ashaiman, bearing in mind that there is no clear cut between the models.

69
Figure 1: Spectrum of model of shared sanitation facilities in Ashaiman
The management of public toilets in Ashaiman (called AshMA toilets) has historically suffered
from unplanned modifications and disruptions whenever there is a change in the political leadership.
The nature of the change is characterised by political activists forcefully taking over the management
of public toilets because their management has been seen as a lucrative. This has obviously had
effects on the sustainable and financial management issues of the facilities. The recent seizure of
toilets occurred in 2009 and currently there is no evidence of any agreement between the operators
and the owners of the toilets (AshMA). Before the forceful take-over in 2009, the AshMA had met
with the previous operators and had agreed on revenues to be paid to AshMA from the operation of
the facilities. However, since the seizure, the new operators have not made any payments. There are
24 public toilets in the town and the price per use had recently gone up from 5 to 10 pesewas.
The commercial toilets, as well as the public ones are supposed to serve customers only in
commercial areas and public spaces such as stations (GoG, 2010). Understanding the lack of
household toilets, private entrepreneurs driven by financial and sometimes philanthropic interests
develop commercial toilets in many residential areas. These toilets are often made of 8 to 20
cubicles and propose different levels of services (shower, water supply) and comfort (fan, toilet
paper...). Due to the different level of comfort but also their locations and the motivations of the
owner, the price per use of these toilets vary in Ashaiman from 10 to 35 pesewas in Ashaiman. The
Ashaiman municipality welcomes the development of commercial toilets also in residential areas,
as it increases the availability of sanitation facilities in some neighbourhoods. According to the
Ashaiman municipal assembly, there are 144 formalized commercial toilets in the town.
Similarly to the commercial toilet, the private shared ones are built by private initiative, but they
usually do not offer more than one or two cubicles. Individuals, who build them, invest in a toilet
to serve their family then receive some extra income by selling the service to their neighbours.
This system is widespread in the middle density area of Ashaiman where land availability is less of
an issue. Such commercialisation is informal and mechanisms of sharing are not clearly
understood as arrangements between owners and users may vary from one situation to another.
In the most densely populated area of Ashaiman, there are fewer toilets inside compound house
than a few years ago (Bertrand, 2002). This option is of two types: one that is used by only one
household (the landlord’s) and the other that is used by more than one household. Providing
Categories
Location
Targeted clients
Price per use
Ownership
Management
Household toilet
House
Household members
/
Household or landlord
Household
Landlord - Tenants toilet
Compound house
Compound members
Part of the rent
Landlord
Compound members
Private shared toilet
Neighbourhood
Neighbours
10 to 30 pesewas
Individual
Individual (informal)
Commercial toilet
Residential and commercial areas
Any dwellers
15 to 35 pesewas
Individual
Hired attendant
Public (AshMA) toilet
Residential and commercial areas
Any dwellers
10 pesewas
AshMA
Contracted

70
household sanitation is in the hands of the landlords and influenced by the landlord - tenant
relationship. Ban of the pan latrines, the conversion of old toilets to new renting space and the
absence of sewerage system have pushed the toilet out of the familial area. In high density areas,
household toilets are not prevalent, and household members have to deal with sanitation issues in
the collective space relying on the models presented above.
A Typology Influenced by the Urbanization Pattern Different segments of the municipality characterised by dissimilar urban pattern are served by
diverse combination of the models. Comparing two areas of Ashaiman distant of only a kilometre
allows us to understand this heterogeneity.
Kaketo is located in one of the poorest area of Ashaiman. Kaketo had been developed without any
urban planning, streets have an irregular pattern model and infrastructures provisions are very low,
quality and pattern of housing is very heterogeneous. Conversely, Asensu is characterised by a grid
plan model of urbanization. All housing is done in compound houses with a high density of
populations. Looking at sanitation provision in these two areas, Kaketo is mostly served by public
toilets and private shared facilities. In Asensu where available land is limited and expensive,
sanitation facilities are fewer and mostly own by local entrepreneurs (commercial toilets).
Individuals do not seem to have resources to build a facility for their own use or for an informal
business. This single example illustrates both the heterogeneity of Ashaiman and the importance of
the urban patterns. Similar observations are found in Uganda where the authors state that the
“sanitation is spatially defined by nature of urban development” (Letema et al., 2010, p. 156).
Enabling More Investment in Urban Sanitation Despite the number of shared sanitation models, the municipality and the inhabitants remain
concerned about the sanitary conditions of Ashaiman. Open defecation and use of polyethylene
bags are widespread practices. Participatory mapping and interviews confirm that many
individuals who do not have household toilet do not also use any of the shared facilities. Following
focus group discussions and interviews with dwellers, some individual explain that such facilities
remain unsafe, too expensive, inaccessible or uncomfortable. Further work is on-going to
understand usages and perceptions of shared facilities by the different groups of dwellers. This
corresponds to the second part of this research which the paper is drawn from. The relative
acceptability of shared sanitation amongst users will be assessed against key agreed determinants,
using participatory techniques.
Another explanation relates to the lack of investment in the construction and management of new
facilities. During the last decade, the number of new facilities does not seem to have kept pace
with the large population increases in Ashaiman. The service providers, both private and public, do
not or cannot meet the potential demand. Land availability and land ownership together with
political lobbying and in some cases lack of initial capital explain this gap between supply and
demand. If there was clear policy guidance that certain types of shared sanitation, that meet agreed
criteria, are acceptable; it would give implementers and key stakeholders more confidence and
incentives to invest in acceptable forms of shared sanitation with good design features. Such
minimum design features could relate to access, space, and ease of cleaning etc., depending on the
size of the shared facility. Individual household sanitation is not feasible in many areas such as
Ashaiman, so we need to carefully examine alternative shared sanitation models.

71
Lessons Learnt This paper is drawn from a larger study which aims to understand the approach of both providers
and urban dwellers concerning shared sanitation facilities. At this stage of the research, a set of
lessons can already be drawn:
Careful judgements need to be made about the acceptability of shared sanitation facilities;
depending on the characteristics of the different shared sanitation models being used.
The particularity of each shared facility model may answer constraints of some neighbourhood
given the nature of their urban development.
The town or the slum cannot be seen as a homogeneous unit and the urban planners need to
better apprehend the heterogeneity of the city.
In determining acceptable forms of sanitation in the future, we need a better understanding of
the users’ perceptions of relative acceptability for different sanitation models, including shared
sanitation alternatives.
If we find that some forms of shared sanitation do have reasonably good levels of acceptability
amongst users, consideration should be given to providing clear policy guidance that certain
types of shared sanitation that meet agreed criteria, are acceptable. This would give
implementers and key stakeholders more confidence and incentives to invest in acceptable
forms of shared sanitation with good design features. More investment in effective shared
sanitation facilities together with appropriate management arrangements can in turn lead to
better sanitation services and excreta disposal, which in turn can contribute to better health and
well-being outcomes for urban dwellers living in high density areas with limited services.
Conclusion Shared facilities are still relevant given the present challenges in Ashaiman. However there is the
urgent need to look at how to improve the services that the users experience. There is the need for
greater stakeholders’ dialogue to understand the needs and perceptions of users, to improve
sanitation and generate interest for local investment in sanitation. Future policy guidance can
increase incentives for implementers to invest in specific types of shared sanitation that meet
certain criteria, provided there is clear evidence of reasonably good levels of acceptability amongst
users.
_______________________________________________________________________________
Acknowledgements The authors would like to extend thanks to those who facilitate the collection and analysis of data, in
particular Henry Tenu and Patrick Larbik for sharing their knowledge of Ashaiman; and our
colleagues of TREND and WEDC.

72
________________________________________________________________________________
References 1. Ayee, J., & Crook, R. (2003). "Toilet wars": Urban sanitation services and the politics of
public-private partnerships in Ghana. IDS working paper 213. Institute of Development
Studies: Brighton, Sussex, UK.
2. Bertrand, M. (2002). Profiles of local leadership in Ghana: conflicts et urban fragmentation in
metropolitan area of Grand Accra. Autrepart, 21, 135-149 (in french).
3. Burra, S., Patel, S., & Kerr, T. (2003). Community-designed, built and managed toilet blocks
in Indian cities. Environment and Urbanization, 15(2), 11-32.
4. GoG Government of Ghana. (2010). Environmental Sanitation Policy (revised 2009).
Government of Ghana, Ministery of Local Government and Rural Development (MLGRD).
5. GoM Government of Malawi. (2008). The National Sanitation Policy. Malawi Government,
Ministry of Irrigation and Water Development.
6. Gough, K., & Yankson, P. (2000). Land Markets in African Cities: The Case of Peri-urban
Accra, Ghana. Urban Studies, 37(13), 2485-2500.
7. Letema, S., van Vliet, B., & van Lier, J. (2010). Reconsidering Urban Sewers and Treatment
Facilities in East Africa as Interplay of Flows, Networks and Spaces. In B. van Vliet, G.
Spaargaren, & P. Oosterver, Social Perspectives on the Sanitation Challenge (pp. 145-162).
Springer.
8. Mara, D., & Alabaster, G. (2008). A new paradigm for low-cost urban water supplies and
sanitation in developing countries. Water Policy 10 (2), 119-129.
9. Mazeau, A., & Ramsay, J. (2011). Reconsidering shared sanitation in Sub-Saharan African
cities: example of Freetown, Sierra Leone. 35th WEDC International Conference. Water,
Engineering and Development Centre (WEDC), Loughborough, UK.
10. Mazeau, P., & Reed, B. (2010). Assessing people’s views of infrastructure: methodologies to
study urban shared sanitation. Paper presented during the Young Environmental Scientists
workshop: Arcueil, France.
11. Peal, A., & Evans, B. (2010). Breaking Barriers in Water and Sanitation Delivery to Informal
Settlements. Practical Action: Nairobi, Kenya.
12. Tayler, K., Parkinson, J., & Colin, J. (2003). Urban Sanitation: A Guide to Strategic Planning.
ITDG Publishing: London, UK.
13. WHO & UNICEF. (2010). Progress on Sanitation and Drinking-water: 2010 Update. World
Health Organization and United Nations Children’s Fund Joint Monitoring Programme for
Water Supply and Sanitation. UNICEF, New York and WHO, Geneva.
14. WSMP. (2008). Shared latrine facilities – safe or unsafe? Retrieved October 2010, from Water
and Sanitation Sector Monitoring Platform (WSMP) Ghana:
http://wsmpghana.wordpress.com/?s=share+sanitation+safe+or+unsafe
73
15. WSUP. (2011). When are communal or public toilets an appropriate options? Topic brief.
Water & Sanitation for the Urban Poor.
Contact Details
Mr. Adrien Mazeau
PhD Scholar
WEDC
Loughborough University
Loughborough, Leics. LE11 3TU
Tel: (+44) 0759 892 8397
Email: [email protected]
Mr. Benedict Tuffuor
Urban Planner/Researcher
TREND (WASH HOUSE)
Hse No. C218/14
Wama Close, Dzorwulu
Tel: (+233) 030 2769552
Email: [email protected]
Mr. Kevin Sansom
Programme Manager
WEDC
Loughborough University
Loughborough, Leics. LE11 3TU
Tel: (+44) 1509 22 2617
Email: [email protected]
74
________________________________________________________________________________
3rd Ghana Water Forum, Accra, Ghana, 2011
Water and Sanitation Services Delivery in a Rapidly Changing Urban Environment
Biofil Toilet Digester: An Innovative On-Site Treatment
V. Mema & Evelyn Gyampo
________________________________________________________________________________
Abstract National government is committed to eliminating the backlog in basic sanitation services and to
progressively improve levels of service over time in line with the original aims of the
Reconstruction and Development Programme in 1994 (City of Cape Town 2008). Although this is
the most important policy priority, with this right comes a responsibility to service providers to
provide appropriate and acceptable sanitation systems. A range of toilet technology types are
currently used in South Africa, including: buckets, chemical toilets, simple pit toilets, ventilated
improved pit toilets etc. High service levels, such as flush toilets are viewed as burdensome and as
having costly O&M requirements.
The biofil toilet digester has been applied to replace septic tanks for water-closet systems, correct
existing failed septic tanks and replaced non-flush/micro-flush systems in properties where water
supply in an issues. When the digester is attached to the collector, the water can be collected,
treated and reused or the water directed into the French-drain where the liquid percolates slowly
into the ground. The technology can also be incorporated into superstructures made to sit on
VIP’s or other onsite treatment options making biofil toilet digester a highly flexible system. A
single unit of biofil system is able to support a family of eight people without being overstressed.
_______________________________________________________________________________
Introduction Water-, sanitation- and hygiene-related diseases are a huge burden in developing countries. It is
estimated that 88% of diarrhoeal disease is caused by unsafe water supply, and inadequate
sanitation and hygiene (WHO 2004c). The Millennium Development Goal 7 emphasizes on the
need for countries to strive for environmental sustainability and to “halve, by 2015, the proportion
of people without sustainable access to safe drinking water and basic sanitation” (Abuom 2004). In
the drive to achieve this goal the primary focus of many country programs is to facilitate
infrastructure provision for safe household and school sanitation. Under the emerging approaches
to sustainable development, preferred sanitation systems must;
Be ecologically friendly
Be affordable and safe
Improve health by minimizing the introduction of pathogens from human excrements into the
water cycle
Promote safe recovery and use of nutrients, organics, trace elements, water and energy
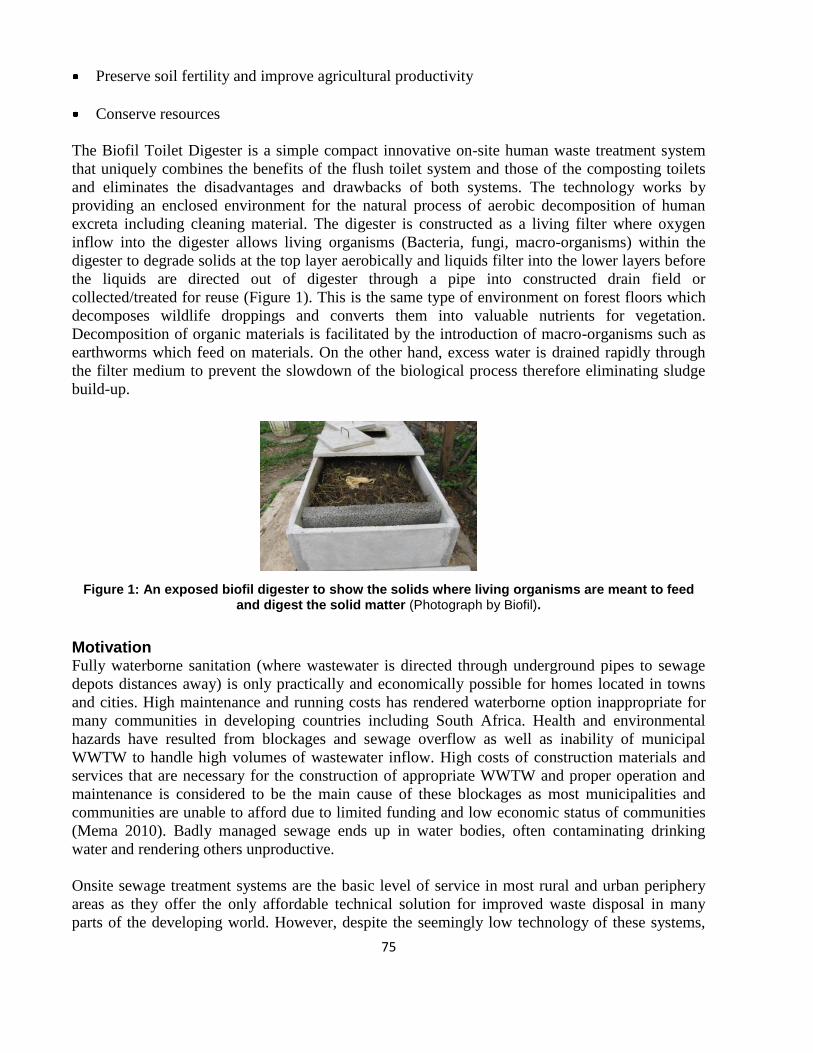
75
Preserve soil fertility and improve agricultural productivity
Conserve resources
The Biofil Toilet Digester is a simple compact innovative on-site human waste treatment system
that uniquely combines the benefits of the flush toilet system and those of the composting toilets
and eliminates the disadvantages and drawbacks of both systems. The technology works by
providing an enclosed environment for the natural process of aerobic decomposition of human
excreta including cleaning material. The digester is constructed as a living filter where oxygen
inflow into the digester allows living organisms (Bacteria, fungi, macro-organisms) within the
digester to degrade solids at the top layer aerobically and liquids filter into the lower layers before
the liquids are directed out of digester through a pipe into constructed drain field or
collected/treated for reuse (Figure 1). This is the same type of environment on forest floors which
decomposes wildlife droppings and converts them into valuable nutrients for vegetation.
Decomposition of organic materials is facilitated by the introduction of macro-organisms such as
earthworms which feed on materials. On the other hand, excess water is drained rapidly through
the filter medium to prevent the slowdown of the biological process therefore eliminating sludge
build-up.
Figure 1: An exposed biofil digester to show the solids where living organisms are meant to feed
and digest the solid matter (Photograph by Biofil).
Motivation Fully waterborne sanitation (where wastewater is directed through underground pipes to sewage
depots distances away) is only practically and economically possible for homes located in towns
and cities. High maintenance and running costs has rendered waterborne option inappropriate for
many communities in developing countries including South Africa. Health and environmental
hazards have resulted from blockages and sewage overflow as well as inability of municipal
WWTW to handle high volumes of wastewater inflow. High costs of construction materials and
services that are necessary for the construction of appropriate WWTW and proper operation and
maintenance is considered to be the main cause of these blockages as most municipalities and
communities are unable to afford due to limited funding and low economic status of communities
(Mema 2010). Badly managed sewage ends up in water bodies, often contaminating drinking
water and rendering others unproductive.
Onsite sewage treatment systems are the basic level of service in most rural and urban periphery
areas as they offer the only affordable technical solution for improved waste disposal in many
parts of the developing world. However, despite the seemingly low technology of these systems,
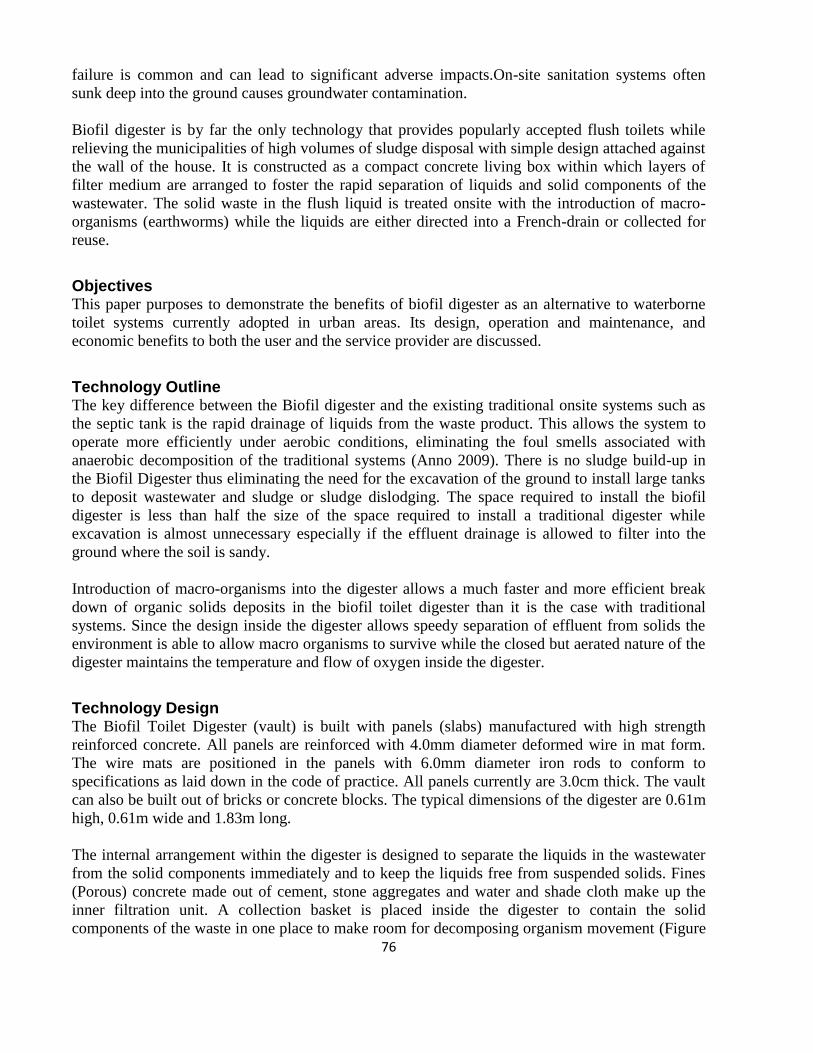
76
failure is common and can lead to significant adverse impacts.On-site sanitation systems often
sunk deep into the ground causes groundwater contamination.
Biofil digester is by far the only technology that provides popularly accepted flush toilets while
relieving the municipalities of high volumes of sludge disposal with simple design attached against
the wall of the house. It is constructed as a compact concrete living box within which layers of
filter medium are arranged to foster the rapid separation of liquids and solid components of the
wastewater. The solid waste in the flush liquid is treated onsite with the introduction of macro-
organisms (earthworms) while the liquids are either directed into a French-drain or collected for
reuse.
Objectives This paper purposes to demonstrate the benefits of biofil digester as an alternative to waterborne
toilet systems currently adopted in urban areas. Its design, operation and maintenance, and
economic benefits to both the user and the service provider are discussed.
Technology Outline The key difference between the Biofil digester and the existing traditional onsite systems such as
the septic tank is the rapid drainage of liquids from the waste product. This allows the system to
operate more efficiently under aerobic conditions, eliminating the foul smells associated with
anaerobic decomposition of the traditional systems (Anno 2009). There is no sludge build-up in
the Biofil Digester thus eliminating the need for the excavation of the ground to install large tanks
to deposit wastewater and sludge or sludge dislodging. The space required to install the biofil
digester is less than half the size of the space required to install a traditional digester while
excavation is almost unnecessary especially if the effluent drainage is allowed to filter into the
ground where the soil is sandy.
Introduction of macro-organisms into the digester allows a much faster and more efficient break
down of organic solids deposits in the biofil toilet digester than it is the case with traditional
systems. Since the design inside the digester allows speedy separation of effluent from solids the
environment is able to allow macro organisms to survive while the closed but aerated nature of the
digester maintains the temperature and flow of oxygen inside the digester.
Technology Design The Biofil Toilet Digester (vault) is built with panels (slabs) manufactured with high strength
reinforced concrete. All panels are reinforced with 4.0mm diameter deformed wire in mat form.
The wire mats are positioned in the panels with 6.0mm diameter iron rods to conform to
specifications as laid down in the code of practice. All panels currently are 3.0cm thick. The vault
can also be built out of bricks or concrete blocks. The typical dimensions of the digester are 0.61m
high, 0.61m wide and 1.83m long.
The internal arrangement within the digester is designed to separate the liquids in the wastewater
from the solid components immediately and to keep the liquids free from suspended solids. Fines
(Porous) concrete made out of cement, stone aggregates and water and shade cloth make up the
inner filtration unit. A collection basket is placed inside the digester to contain the solid
components of the waste in one place to make room for decomposing organism movement (Figure
77
2). Composting materials like shredded coconut husk, lawn clippings, wood shavings, dried leaves
etc. are introduced into the composting chamber to simulate a natural habitat for the composting
organisms in the absence of the worm cast (compost).
Figure 2: Red worms used as decomposing organism of the solid material in the biofil digester
(Photograph by Biofil)
Inoculation of macro-invertebrates (earthworms) into the digester as shown in figure … provides
stabilisation and volume reduction of solids. Their movements in and out of the solid material
ensure aeration of the contents therefore, creating a favourable environment for them to survive.
Air gaps within the digester allow for positive suction of air at all times facilitating aerobic
degradation of the waste-end products. In the presence of oxygen and appropriate aerobic micro-
organisms, biodegradable material is converted to CO2, water and more cell mass for the
participating micro-organisms. Therefore at a steady state of operation the system is odourless.
Operation The digester is useable in a wide variety of contexts. Macro-organisms inside the digester are able
to decompose anything organic; including food scraps, egg shells, paper and cardboard, lawn
clippings and even clothes from natural fibres.
Operation of the toilet which is usually done inside the house is the same as the operation of a
normal flush toilet. The difference come only after the toilet flush wherein the flush is directed into
the biofil digester just on the outside of the house and is usually designed to lean against the wall
of the house. As the flush material reaches the digester it is collected inside a framed bucket which
is surrounded by macro-organisms usually earthworms. The liquids are separated from the solids
and are directed into the bottom of the digester. However, to avoid movement of solids with the
liquids to the bottom of the digester the liquids are filtered through the sieve and from the sieve
through porcelain concrete. The solids which are left behind immediately become feed for the
earthworms. The liquids on the other hand are redirected from the digester to either into a
collection pond where they can be made available for reuse or directed into the French-drain via a
PVC pipe.
A standard size of the digester which is usually 0.61m high, 061m wide and 1.83m long and can
accommodate a family of 8 people without being over worked. There is almost no maintenance
required especially if the digester is used according to specifications provided by the manufacturer.
Figure 3 below shows the Biofil digester installed in a household.

78
Figure 3: A biofil digester installed in a household (Photograph by Biofil)
To prevent groundwater contamination the digester is installed above ground, half-buried in the
ground or below ground (600cm depth) to increase the depth of the unsaturated zone where
attenuation of contaminants is most effective.

79
Summary of Benefits for Using the Biofil Toilet Digester
Table 2: Key benefits of using the biofil digester
Area of benefit Benefit/s
Economic
benefits
Long-term savings as a result of eliminated need for dislodging.
Near zero operating cost
Appropriate for any soil conditions (clayey) / solid rock sites /high water
table
Minimum land-take
Environmental
Health Impacts
They eliminate the possibility of costly site remediation and clean-up
Suitable for all soil types – no leakage of nutrient to ground water
No potential discharge of effluent into water courses
Health impact mitigation
No inappropriate disposal of sludge
Ecological
impact
mitigation
The system eliminates water and air contamination.
It has a potential of reducing greenhouse gases emissions through the
avoidance methane emissions directly into the atmosphere.
Biologically filtered effluent does not trigger prolific plant growth (e.g. algal
blooms).
Health Benefits-
Disease
prevention
No human contact with excreta.
No odours or sludge to attract flies
Impossible for rodents to burrow into digester
Replicability Fabricated from local materials
Rely entirely on local manufacturers
Do not require heavy equipment
Easy to build /Quick and easy to install
Low / ease of maintenance
Ease of Use and
Maintenance
Meet the specific needs of all user groups
Provides privacy and comfortability
User education ensures end-users know system’s principles of operation and
maintenance
Impact on Service Provision There is great demand in South Africa for safe, reliable, affordable sanitation systems. Flush toilet
systems are usually preferred over other systems as they provide acceptable convenience to the
user. If it was possible, flush toilets would be supplied in every location across South Africa;
however, water supplies and wastewater disposal options are limited. As a result of this situation,
supply of sanitation services is usually achieved through the provision of aerobic composting
toilets as they offer a more viable solution. Unfortunately, composting toilets have earned a rather
dubious reputation, especially in rural South Africa where these systems are mostly provided, with
at least as many reported failures as successes (Still, 2003).
Due to environmental concerns, careful selection of a flush toilet system is required before this
service is implemented in any community. There are certain standards that should be considered if
a flush toilet system is to be considered for application in a certain environment. According to
Brikké and Brederó (2003) these standards must include Technical, Institutional, Environmental

80
and Community factors. The ability of the Biofil toilet digester to incorporate the highly accepted
flush toilet while eliminating sludge disposal and encouraging onsite biological treatment of sludge
and reuse of wastewater in food production gives this technology an ability not only to address
sanitation needs but also food security among communities. Elimination of sludge disposal into
municipal treatment works relieves the municipality of high wastewater treatment and
maintenance costs. The biofil toilet digester has been applied to replace septic tanks for water-
closet system; correct existing failed septic tanks and replaced non-flush/micro-flush systems in
properties where water supply is an issue.
Conclusion The technology for biofil digester construction is simple and easy to replicate. The digester has
been designed with environmental, sanitation and health considerations. Replication of the Biofil
Toilet System in schools and communities will reinforce the service provider’s sanitation and
environmental commitment in the eyes of intervention schools/communities. Cesspit emptying and
the general indiscriminate disposal in water bodies by third party waste disposal due to lack of
satisfactory operating sewage treatment plant would be avoided.
________________________________________________________________________________
References
1. Abuom, A., 2004. The Millenium Development Goals in Africa: Progress and challenges,
Beacon.
2. Brikké, F., and M. Bredero 2003. “Linking Technology Choice with Operation and
Maintenance in the Context of Community Water Supply and Sanitation.” (WHO)
3. Mema, V., 2010. Impact of poorly maintained wastewater and sewage treatment plants:
Lessons from South Africa. Wisa Conference, ICC Durban.
4. World Health Organization (2004c). Water, sanitation and hygiene links to health. Facts and
figures. Geneva.
5. Anno K., 2009. Biofil Toilet Digester: Technology and Operations (unpublished)
6. Still D.A. 2002 after the pit latrine is full . . . What then? Effective options for pit latrine
management
________________________________________________________________________________
Contact Details V. Mema
CSIR
South Africa
Email: [email protected]
Evelyn Gyampo
Biofil Technologies
South Africa
________________________________________________________________________________
81
Theme: Water

82
________________________________________________________________________________
3rd Ghana Water Forum, Accra, Ghana, 2011
Water and Sanitation Services Delivery in a Rapidly Changing Urban Environment
The Human Factor in Urban Water Services in Ghana
Matthew Adombire
________________________________________________________________________________
Abstract It is human beings that run businesses. The Ghana Water Company was set up to add and
maximise value for the people of Ghana by providing them potable water for social and healthy
well being and economic growth. There must therefore be professionals of all relevant categories
who have the knowledge, understanding, ability and freedom to choose from alternatives to be
able to deliver this service on a continuously improving basis. This paper explores this human
factor in the water supply delivery in Ghana and spells out its importance and how the resource
should be deployed to yield the desired outcome.
________________________________________________________________________________
Introduction Businesses, institutions, organisations are set up to fulfil a need. The Ghana Water Company was
established to provide potable water for use by people living in Ghana, whilst the Community
Water and Sanitation Agency was set up to facilitate the provision of potable water by district
assemblies to small towns and rural communities. These were set up by the government of Ghana
to add value to the lives of its citizens and others living in Ghana. Human beings have therefore
been employed to get things done. The staff employed should therefore have the knowledge,
understanding, ability and freedom to choose from alternatives to do good business. The staff must
know what those alternatives are, their worth and the consequences of a chosen alternative, with
the ultimate aim of adding value to the business. These staff are of various disciplines, (engineers,
accountants, chemists, operators, labourers), experiences, qualifications, interests, skills and goals,
all working as a team to provide the expected services. Even though other factors of production
such as materials and money are needed to provide the service, the human resource is the most
important since human beings apply the other resources. The effectiveness and efficiency with
which those other resources will be utilised greatly depends on the calibre of the applicants-the
human resource.
Knowledge of Staff Water supply is basically an engineering discipline which involves a number of professional
disciplines. On the technical side, these include engineers (civil, electrical, mechanical and
geodetic, computer specialist, etc), chemists/bacteriologists and their technicians. However, the
whole industry requires the support of other professions including marketers, accountants,
administrators, auditors, and their clerks.
For public water supply, large metropolitan and urban centres make use of surface water sources
whilst smaller communities, private businesses and institutions normally use underground sources.
The requirements of a public water supply demand that the water shall:
83
1. Contain no disease causing organisms.
2. Be sparkling clear and colourless.
3. Be good tasting, free from odours and preferably cool.
4. Be reasonably soft.
5. Neither be scale forming nor corrosive.
6. Be free from objectionable gas, such as hydrogen sulphide and objectionable minerals, such as
iron and manganese.
7. Be plentiful and produced at a low cost.
The water therefore has to be treated to meet those requirements. The principal methods used are:
Aeration, Coagulation/Flocculation, Sedimentation, Filtration, Disinfection, Corrosion Protection
and Desalination. It must be pointed out that depending on the nature of the raw water a
combination of some of these methods is used for treatment so as to obtain the desired results. The
treated water obtained from the waterworks has to be sent to the consumer at the place of need.
This could be their homes, commercial houses, offices, hotels, institutions and factories. The water
is delivered to the consumer through a series of pipelines either by pumping or by gravity flow.
The water could also be stored in service reservoirs to either balance the flow in the distribution
network or for later use.
There is a cost involved in the supply of water which has to be recovered adequately to ensure
sustainable service delivery. These costs include:
1. The raw water source
2. The civil structures of the treatment plant
3. Mechanical and electrical equipment
4. Pipes and accessories for transmission and distribution of water
5. Service reservoirs
6. Operation and maintenance
7. Labour
8. Unaccounted for costs
9. Replacement of facilities
People employed in the water supply industry therefore must have the requisite knowledge and
skills to conduct the business and all its processes as outlined above.
84
Continuous Development of Staff There is a basic qualification requirement to be met before people can be engaged to play various
roles in the water supply industry. Just like any other growing industry, new developments take
place in the water supply industry. Better, faster and modern methods are evolved to reduce costs
and provide a more efficient quality service to the consumer. The staff should therefore be given
regular and periodic training and retraining, either on or off the job, to improve on their skills and
work methods for increased productivity and efficient deployment of the other resources of the
industry. In Ghana there is a clamour for off-the-job training especially abroad because of the
ensuing personal economic benefits arising from per diem, etc. Sometimes, unsuitable staffs rather
manage to be included in such training courses for which no returns are gained to the business on
their return. Such staffs pride themselves for being abroad. Staff on on-the-job training sometimes
do not benefit from experienced staff that are reluctant to impart knowledge. Willing staff who
impart knowledge to other workers should be adequately rewarded.
Resource Deployment The utilization of every natural resource follows a laid down procedure. If these procedures are not
followed, the full benefits of the resource or its subsequent benefits are not realised. For example,
if a water supply system is designed to produce a given quantity and quality of water, it must be
constructed and operated according to the design. The location and sizing of the treatment plant
components, the pumping regimes, the sizing of the electro-mechanical equipment, the amount and
timing of chemical application, the material, sizing and laying of transmission and distribution
pipelines and storage tanks and the frequency of monitoring the performance of the treatment plant
and pipe network, all have to comply with specifications. There are laid down procedures for the
operation and maintenance of the components of the water supply systems. The same pertains to
the equipment and tools used in the industry. It is not only the use of materials and money that
these procedures exist, but are also required for the staffs that deploy these other resources. Time
and duration of work, work methods, procedures and duration, rewards and sanctions, facilities
application, etc are also spelt out for compliance by the staffs. Enforcement of standards, rules and
regulations is therefore absolutely necessary and mandatory for the achievement of the objectives
of the water supply business.
In my opinion, incompetent staffs wrongly apply resources resulting in wastage, losses and
malfunction of facilities, but explain their inefficiency as political interference. Examples include
extensions of utility services beyond service areas, wrong sizing or inadequate provision of
facilities, inflation of prices of materials and services, etc.
Impact of Other Services Obviously, water supply services are provided on land, and are located with respect to other
services needed for the convenience of people. These include buildings, roads, bridges, railways,
telephone, electricity, waste disposal, etc. For example, a power source is needed to run a water
treatment plant, access to the plant is made possible by road, and telephone provides the other
means of access or communication to the waterworks. Pipelines are laid in the ground and pass
along the natural topography which may be undulating with streams or rivers and bushes as well as
all the other structures on the ground. This therefore requires proper planning and coordination of
the provision of all facilities on the land. The use of the land has to be properly planned and
implemented in a well coordinated manner involving all relevant agencies.

85
Experience shows that planning and provision of infrastructure in Ghana is haphazard and no
government has been able to coordinate effectively for smooth implementation and maximum
realisation of the benefits expected from such investments. The building of individual empires by
ministries, departments and agencies has to stop. Why should we at this age of our development
grow by trial and error when we have the developed world to copy from? Cost of infrastructure
provision is unnecessarily expensive when compensation has to be paid to undisciplined public
who erect structures on lee ways. Ghana seems to have all the good laws for a peaceful and perfect
livelihood, but lack of timely enforcement is the bane of our woes. We are quick to explain away
our reasons for lack of enforcement as corruption, political interference and an inefficient judicial
system.
Lessons for Ghana When we are unable to fully and effectively deploy the right quality and numbers of human
resources in the business of water supply, we encounter the problems of poor services that prevail.
The staff need to be oriented about the appropriate standards of moral conduct and a good
understanding of their purpose in life and work. Proper recruitment and selection of staff also
results in what Wriston said “I believe the only game in town is the personnel game. My theory is
that if you have the right person in the right place, you do not have to do anything else. If you have
the wrong person in the job, there is not a management system known to man that can save you”.
Therefore, political leanings, nepotism, “old boyism”, sexual favours, tribalism, bribery and
corruption, favouritism, religiousness etc, should not be applied in the recruitment and selection of
staff. Politicians are myopic in thinking and believing that fielding their cronies in management
positions is rewarding. Wise politicians will field competent staff whose performance will realise
the objectives of the business for the benefit of society, thus bringing them the credit and
maintenance of political power. All human resource management activities must be performed
professionally keeping in mind the ethics of business. The major activities include human resource
planning, recruitment and selection, equal employment compliance, job analysis, performance
appraisals, compensation and benefits, employee relations, management-labour relations, health
and safety, training and development and human resource information systems. It is the lack of
professionalism and ethics in the utilisation and treatment of the human resource that creates
problems in the work place resulting in low worker productivity, low financial rewards,
overstaffing, occupational hazards and accidents, upheavals, shut-downs, removal of chief
executive officers, dismissals, incompetence, and conflicts and so on. Guidelines, procedures, and
authority limits, rules and regulations must be drawn up and strictly followed and implemented so
that discretion is sparingly used. Politicians or other interest groups interfere with staff discipline.
It should be noted that transfers of staff is not a disciplinary action but rather a perpetuation of
indiscipline. Irrespective of these seeming interferences discipline must be instilled at work places
and the “hot-stove” rule is the best guiding principle for instilling discipline because it is fair and
just. The “hot-stove” rule is as follows:
1. The hot-stove burns immediately. Disciplinary policies should be administered quickly. There
should be no question of cause and effect.
2. The hot-stove gives a warning and so should discipline.
3. The hot-stove consistently burns everyone that touches it. Discipline should be consistent.

86
4. The hot-stove burns everyone in the same manner regardless of who they are. Discipline must
be impartial. People are disciplined for what they have done and not because of who they are.
Recommendations and Conclusions Efficient operation and maintenance of the water supply industry will deliver water in adequate
pressure and quality to the consumer. This can be achieved by the utilization of competent staff,
their efficient deployment of the available resources of the industry, their continuous acquisition
and application of knowledge in the business, coordination and cooperation with other utilities and
businesses and the instillation of discipline can change things for the better in the water supply
sector.
________________________________________________________________________________
Reference 1. Adombire, M. A. (2007) Water Supply for the Consumer-A Concise Practical Guide, Science
Press, CSIR-INSTI, Accra, Ghana.
_______________________________________________________________________________
Contact Details Ing. Matthew Adombire
Ghana Water Company Limited
P. O. Box GP 130
Accra
Telephone: 0302 779241
Mobile: 020-8518326; 024-3479465
Email: [email protected]; [email protected]
Website: www.ghanawater.info
_______________________________________________________________________________

87
________________________________________________________________________________
3rd Ghana Water Forum, Accra, Ghana, 2011
Water and Sanitation Services Delivery in a Rapidly Changing Urban Environment
Wet Oxidation of Paper Mill Debarking Water: Improving the Rates of
Contaminant Removal
Daniel Adjah Anang
________________________________________________________________________________
Abstract Highly concentrated wastewater from a Finnish paper mill was subjected to wet oxidation process.
The study assesses the impact of temperature, oxygen partial pressure, catalyst loading and initial
chemical oxygen demand concentration on pollutant removal in a wet oxidation process. A study
on the process was conducted at 120-180 oC temperature, 0-10 bar oxygen partial pressure, 0-1
g/L catalyst concentration and 1000-3000 mg/L initial COD. Chemical Oxygen Demand (COD),
Lignin/tannin concentration, Total Organic Carbon (TOC), Biochemical Oxygen Demand (BOD)
and pH were measured and analyzed. A Platinum (1-wt %) on activated catalyst was used for the
work. It was observed that increment in temperature (120-180 oC), oxygen partial pressure (0-10
bar) and catalyst concentration (0-1 g/L) improved the rate of contaminates reduction from the
wastewater during the oxidation process. Lower initial COD concentration improved the
contaminants removal. The optimum conditions were at 180 oC temperature, 10 bar oxygen
pressure, 1 g/L catalyst concentration and 3000 mg/L initial COD. At these conditions, 74% of
COD, 97% of lignin/tannin, 54% of TOC and 90% of color were removed from the wastewater.
________________________________________________________________________________
Introduction Effluents from pulp and paper industries are a major worry since large volumes of wastewater are
generated per each metric ton of paper produced [1]. Wastewater from paper mill contains toxic,
hazardous and non-biodegradable organic chemicals derived from the different stages of paper
making [2]. Many traditional wastewater treatment methods are already in use but they are not able
to effectively deal with the toxic and or non-biodegradable nature of the organics in the water.
Wet oxidation (WO), an advanced oxidation technique, which takes place at higher temperatures
and pressures, governed by the generation of active species such as hydroxyl radical is known to
have a great potential for the treatment of effluent containing high content of organic matter
(chemical oxygen demand (COD) 10-100 g/l), or for toxic contaminants for which direct
biological purification is unfeasible [3]. The WO process can significantly be improved by the use
of catalyst as well as operating at optimum conditions of temperature and pressure. Therefore, this
work investigates the effects of catalyst, increment in oxygen partial pressure and temperature on
the rates of contaminants reduction during WO process.
Materials and Methods The feed for this study was a concentrated dark brown debarking wastewater obtained from a
Finnish paper mill. A Platinum (1-wt %) on activated carbon catalyst was used for the
investigation. The lignin concentration was measured with a photometric method developed by

88
Hach Company. COD was measured by a closed reflux dichromate method, using a COD reactor
(Hach Company, USA) and a spectrophotometer DR/2000 (Hach Company, USA). The
biochemical oxygen demand was assessed by standard BOD5 test. TOC was measured using a
Shimadzu 5050 TOC analyzer.
Experimental Procedure
The experiment was performed in a 450 mL high pressure stainless steel batch reactor
manufactured by Parr Instrumental Company, U. S. A. 300 mL of the filtered wastewater was
loaded into the reactor. When necessary, the catalyst was weighed and added to the wastewater.
After the reactor was properly sealed, it was placed in the heating jacket and heated to the required
reaction temperature. Oxygen was introduced into the reactor through the gas inlet when the set
temperature was attained. The reaction medium was stirred thoroughly by the stirrer. Samples of
the wastewater were taken during the experiment. The first sample was taken before the reactor
was loaded. This was referred to as sample at t=-30 minutes. The second sample was drawn off
immediately after preheating and before the oxygen valves were opened. That was sample at t=0.
The rest of the samples were taken at times t=10, 20, 30, 60, 90 and 120 minutes after reaction had
started and were analyzed. These analyses included COD, Biochemical oxygen demand (BOD),
Total Organic Carbon (TOC), lignin/tannin, color and pH. Biodegradability (BOD/COD) was also
determined for the wastewater.
Modelling of the WO System Creation of General Model
Mathematical expressions were generated to represent the WO process. The general expression of
the modeled response using linear model function is given as,
(1)
Where A, B, C, D, and E are the coefficients of the respective input variables which must be
generated. Y is the response measured (COD, TOC, lignin/tannin, etc). T, PO2, Cc and CODini are
the temperature, oxygen pressure, catalyst concentration and initial COD concentration used
during the WO study. The responses where measured at time t=0, 10, 20, 30, 60, 90 and 120
minutes. An auto-generated Laptop system which uses matlab 7.3.0 (R2006b) software was used
to generate the coefficients at various times for various responses. Later, Microsoft Excel was used
to model the coefficients at all times.
Discussion of Results Effect of Increasing Temperature
The effect of increasing temperature from 120 oC to 180
oC on contaminants removal from the
water can be summed up in figure 1.
The pH of debarked wastewater during WO is depicted against time in figure 1. The pHs
decreased gradually from neutrality to acidity for all experiments. This may be as a result of toxic
organic contaminants being decomposed into organic acids during the process. The rate at which
the pollutants decompose depends on the conditions used.

89
time (mins)
pH
-30 0 30 60 90 1204.0
4.5
5.0
5.5
6.0
6.5
7.0
7.5
8.0
180oC, 10bar, 1g/L, 3000mg/L
120oC, 10bar, 1g/L, 3000mg/L
150oC, 5bar, 0.5g/L, 2000mg/L
180oC, 10bar, 0g/L, 1000mg/L
120oC, 10bar, 0.5g/L, 1000mg/L
120oC, 10bar, 0g/L, 3000mg/L
150oC, 5bar, 0.5g/L, 3000mg/L
180oC, 0bar, 1g/L, 1000mg/L
150oC, 5bar, 0.5g/L, 1000mg/L
180oC, 0bar, 0g/L, 3000mg/L
120oC, 0bar, 0g/L, 1000mg/L
Figure 1: pH reduction against time
From figure 1, it can be observed that higher temperatures reduced pH greatly. Again, there is a
sharp decrease in pH during the preheating period. This is because the organic pollutants
decompose into organic acids immediately they are exposed to higher temperatures. Higher
temperature exposure leads to higher rate of decomposition of organic contaminants.
From the study conducted, it was realized that the decomposition of organic pollutants into organic
acids and inorganic minerals occurred at elevated temperatures. Lower temperatures gave least
decomposition rates. This is so because oxygen must first diffuse into the liquid phase for WO
reaction to occur, its solubility in water is critical since it depends on temperature. The higher the
temperature, the more soluble the oxygen becomes in water and the higher the reaction rates.
Increase in temperature between 120oC and 180
oC improved reduction in COD, TOC, Color and
Lignin/tannin concentrations as well as pH observed.
Effect of Increasing Catalyst Concentration
To study the effect of catalyst concentration on contaminants removal from the wastewater, the
COD responses of some experiments are presented. Figure 2 shows COD removed (%) with time
for four comparable experiments. Results of two of the experiments without catalyst addition,
whose conditions are at 120 oC, 0 bar, 0 g/L, 1000 mg/L and 120
oC, 10 bar, 0 g/L and 3000mg/L
showed closed COD reduction of 10.1 and 13.4% respectively. This means, they did not remove
much of the organic pollutants in the wastewater. The other results (cases where catalyst were
used) showed higher COD removal with the highest catalyst concentration used giving a COD
removal of 38.5%.

90
time (mins)
% C
OD
Re
du
ctio
n
-30 0 30 60 90 1200
5
10
15
20
25
30
35
40120oC, 10bar, 1g/L, 3000mg/L
120oC, 10bar, 0.5g/L, 1000mg/L
120oC, 10bar, 0g/L, 3000mg/L
120oC, 0bar, 0g/L, 1000mg/L
Figure 2: % COD removal against time
Effect of Increasing Oxygen Partial Pressure
Oxygen partial pressure helped in the removal of contaminants from the wastewater. To see how
this affects the various outputs, some experimental runs where analyzed. The results are shown in
figures 3 and 4 for % COD and % TOC respectively. It can be seen from these pictures that,
oxygen partial pressure clearly differentiates the cases giving high TOC and COD reduction to
54% and 75% respectively within 2 hours.
time (mins)
% C
OD
Re
du
ctio
n
0 10 20 30 60 90 120
0
20
40
60
80
180oC, 10bar, 1g/L, 3000mg/L
180oC, 0bar, 1g/L, 1000mg/L
180oC, 0bar, 0g/L, 3000mg/L
Figure 3: % COD removal against time

91
time (mins)
% T
OC
Red
uct
ion
0 10 20 30 60 90 120
0
20
40
60
180oC, 10bar, 1g/L, 3000mg/L
180oC, 0bar, 1g/L, 1000mg/L
180oC, 0bar, 0g/L, 3000mg/L
Figure 4: % TOC removal against time
The role of oxygen pressure is to maintain oxygen in the liquid phase. A higher pressure will
increase the dissolved oxygen concentration which is important for wet oxidation whiles a lower
pressure will liberate oxygen from the liquid phase.
Mathematical Models of the WO System
Using equation (1), the mathematical models describing the WO system for some responses are
presented below.
COD(t)=(-0.0889t2+16.439t+580.34) + (0.0003t
2-0.0543t-3.2208) T + (0.004t
2-0.6729t-
10.784) PO2 + (0.021t2-4.6953t-225.33) Cc + (0.7664 exp(-0.0033t)) CCOD
TOC(t)=(-0.058t2+10.813t-106.85) + (0.0003t
2-0.0625t+0.9271) T +(0.0023t
2-
0.4017t+3.1779) PO2 + (-8 10-7
t5+0.0002t
4-0.0219t
3+0.7964t
2-8.5523t-174.11) Cc + (0.2973
exp(-0.0009t)) CCOD
Forecasting the Behaviour of Input Variables
The models generated were used to predict the behavior of the input variables outside the
experimental range. The analyses were done at the best experimental conditions (180oC, 10 bar,
1g/L and 3000mg/L) for 2 hours. The input variables were increased by 5, 10 and 20%. The results
showed gradual reduction in the output (COD, TOC, Color, etc). Temperature increment will make
the most impact by giving further 21% COD reduction if it is increased by 20%. Oxygen pressure
demonstrates very little expected COD reduction after the suppose increment. The higher the
oxygen pressure expected to be applied, the more the expected COD gets to zero. This could mean
that the 10 bar pressure is enough for the WO system. Expected increment in catalyst
concentration will lead to further reduction in the response.
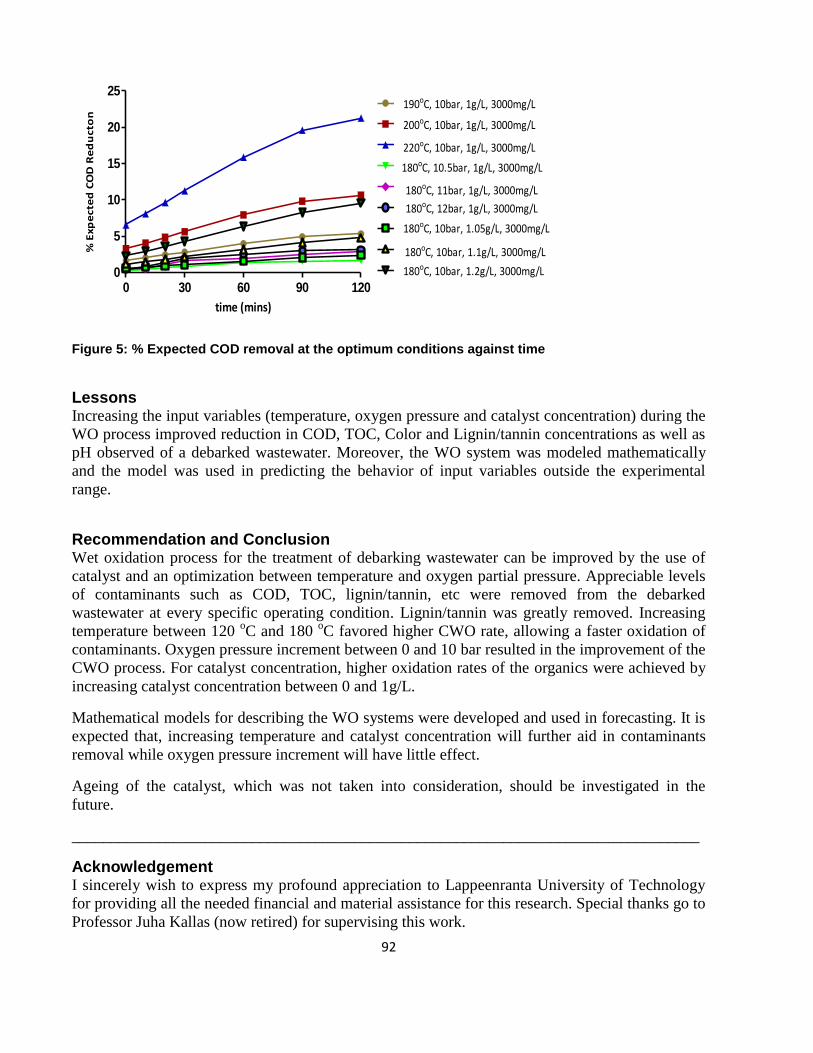
92
time (mins)
% E
xp
ecte
d C
OD
Re
du
cto
n
0 30 60 90 1200
5
10
15
20
25190oC, 10bar, 1g/L, 3000mg/L
200oC, 10bar, 1g/L, 3000mg/L
220oC, 10bar, 1g/L, 3000mg/L
180oC, 10.5bar, 1g/L, 3000mg/L
180oC, 11bar, 1g/L, 3000mg/L
180oC, 12bar, 1g/L, 3000mg/L
180oC, 10bar, 1.05g/L, 3000mg/L
180oC, 10bar, 1.1g/L, 3000mg/L
180oC, 10bar, 1.2g/L, 3000mg/L
Figure 5: % Expected COD removal at the optimum conditions against time
Lessons Increasing the input variables (temperature, oxygen pressure and catalyst concentration) during the
WO process improved reduction in COD, TOC, Color and Lignin/tannin concentrations as well as
pH observed of a debarked wastewater. Moreover, the WO system was modeled mathematically
and the model was used in predicting the behavior of input variables outside the experimental
range.
Recommendation and Conclusion Wet oxidation process for the treatment of debarking wastewater can be improved by the use of
catalyst and an optimization between temperature and oxygen partial pressure. Appreciable levels
of contaminants such as COD, TOC, lignin/tannin, etc were removed from the debarked
wastewater at every specific operating condition. Lignin/tannin was greatly removed. Increasing
temperature between 120 oC and 180
oC favored higher CWO rate, allowing a faster oxidation of
contaminants. Oxygen pressure increment between 0 and 10 bar resulted in the improvement of the
CWO process. For catalyst concentration, higher oxidation rates of the organics were achieved by
increasing catalyst concentration between 0 and 1g/L.
Mathematical models for describing the WO systems were developed and used in forecasting. It is
expected that, increasing temperature and catalyst concentration will further aid in contaminants
removal while oxygen pressure increment will have little effect.
Ageing of the catalyst, which was not taken into consideration, should be investigated in the
future.
________________________________________________________________________________
Acknowledgement I sincerely wish to express my profound appreciation to Lappeenranta University of Technology
for providing all the needed financial and material assistance for this research. Special thanks go to
Professor Juha Kallas (now retired) for supervising this work.

93
________________________________________________________________________________
References 1. Pokhrel D., and Viraraghavan T., Treatment of pulp and paper mill wastewater—a review.
Science of the Total Environment 333 (2004) 37– 58
2. Ali M., and Sreekrishman R. T., Aquatic toxicity from pulp and paper mill effluents: a review.
Advances in Environmental Research 5 (2001) 175-196.
3. Mishra S. V., Mahajani V. V., Joshi J. B., Reviews, Wet air oxidation. Ind. Eng. Res. 34
(1995), pp 2-48.[4] Donlagic J., and Levec J., Comparison of catalysed and noncatalysed
oxidation of azo dye and effect on biodegradability. Environ. Sci. Technol., 32 (1998) 1294-13
4. Pintar A., and Levec J., Catalytic liquid phase oxidation of refractory organics in waste water,
Chem. Eng. Sci. 47 (1992), pp 2395-2400
_______________________________________________________________________________
Contact Details Daniel Adjah Anang
Laboratory of Separation Technology, Department of Chemical Technology
Lappeenranta University of Technology
Skinnarilankatu 34, 53850 Lappeenranta
Finland
Chemical Engineering Department
Kwame Nkrumah University of Science and Technology
P. M. B., University Post Office
Kumasi, Ghana
Tel: +233546240089
Email: [email protected]
______________________________________________________________________________
94
________________________________________________________________________________
3rd Ghana Water Forum, Accra, Ghana, 2011
Water and Sanitation Services Delivery in a Rapidly Changing Urban Environment
Quality Drinking Water for Rural Communities: Technology Options
Edward Antwi, Edem Cudjoe Bensah, Julius Cudjoe Ahiekpor, Richard Arthur & Elijah Boadu
________________________________________________________________________________
Abstract Availability of water is very crucial for sustaining life. In Ghana, many rural communities and
some urban dwellers depend so much on underground water to meet their basic water needs. Just
as water is very important, the quality is equally important. Some wells in Ghana are prone to
high levels of infection and contamination by heavy metal contaminants due to the poor
management of waste, industrial activities, floods and natural causes such as rock formation. This
paper looks at the treatment options of infected and contaminated wells in Ghana as a way of
ensuring the provision of quality water for our people.
_______________________________________________________________________________
Introduction Ghana’s Water Situation
Surface water bodies dominate Ghana’s water resources of which the Volta River is the largest,
draining nearly 70% of the country. Aside this, other surface water bodies including major rivers
like the Ankobra, Pra, Densu, Birim drain the remaining 30% [1]. Underground water resources
have been associated with three major geological formations. The consolidated sedimentary and
the crystalline igneous and metamorphic geological formation constitutes about 45% and 54%
respectively while the mesozoic and cenozoic constitute just about 1% [1]. Put together, Ghana’s
total actual renewable water resources stands at about 53.2 km3/year [2].
Portable water supplies to urban areas are mainly as a result of major impoundments in and around
these major cities. For instance the Accra and Tema metropolis have been served by two major
impoundments at Weija and Kpong. Residents of Kumasi on the other hand have been served with
water from the Owabi and Barekese impoundments [3]. Population explosion in urban areas has
placed undue pressure on these water supplies managed by the Ghana Water Company Limited.
More often than not residents experience major disruption in the flow of water thus affecting their
livelihood.
The water needs of people in rural areas have to some extent been catered for by the Community
Water and Sanitation Agency (CWSA) under the National Community Water Supply Program
(NCWSP). Over 95% of the water needs under this programme has been met with underground
water resources either in the form of stand-alone wells or small isolated mini-supply for a small
community [4]. In spite of these advances and programmes in place to make water accessible to
the general population, many individuals still lack access to portable water. The problem has
further been exacerbated by the rampant disruption in supply resulting in women and children
queuing or walking long distances in search of water. Individuals in both urban and rural areas
who live in the three main geological areas tend to sink their own wells to enjoy uninterrupted
95
supply of water. Though good, legitimate concerns of the quality of the underground water have
been raised, in that natural and environmental conditions tend to affect the quality of the water.
Sources of Underground Water Contamination
Water they say is life. In as much as this is true it is equally true that bad/unhygienic water leads to
diseases which sometimes results in death. High quality water is thus needed. According to WHO
[5] environmental factors such as unsafe drinking water among others is responsible for almost
24% of all diseases worldwide and 80% in developing countries. The main cause of diarrhoea the
leading cause of illness, death and disability adjusted life years (DALY), accounting for nearly 1. 7
million deaths annually is caused mainly by lack of access to good drinking water, poor sanitation
and unhygienic conditions [5]. In addition, 94% of all diarrhoea cases are attributable to unsafe
drinking water, poor sanitation and hygiene [6]. Since water plays a very important role in both
good sanitation and hygienic conditions, any effort to provide good quality water will go a long
way to eliminate this potent threat.
Underground waters are usually safe for use as drinking water. However, in recent times
environmental factors have led to the contamination of these otherwise safe underground waters
[7]. Source of contamination of underground waters include leachate of minerals that are unsafely
disposed off, pit latrines and general unhygienic conditions at the wells. Natural contamination of
the underground water due to the rock formation like in the case of Bongo district where high
fluoride contamination have been reported [1,8,9] and in so many areas where manganese and iron
contamination are common [1]. Heavy metal contaminations such as Arsenic, Lead among others
due to industrial activity have also been reported [10].
Some of the causes of underground water pollution are pit latrines, and waste dumping sites close
to wells [11, 12, 13]. The presence of E-coli in underground water is mainly due to the presence of
faecal matter in the water [12]. In rural communities the presence of pit latrines are very common
and wide spread: 57.7% in Forest Areas, 43.6% in Coastal areas and 20% in Savannah areas [14].
Because the basement and the walls of the pit latrines are not lined, some of the faecal matter seeps
into the soil [13]. During floods and heavy down pour, these pits often get full or overflow. The
resulting seepage enters underground waters contaminating it. On the other hand overflowing pits
flow directly into wells. In cases of heavy flooding, rivers break their banks carrying with them
dirt, faecal matter and all sorts of waste straight into wells. The results are heavily polluted wells in
the immediate vicinity. Dumping of waste in open fields is a common spectacle in rural areas
where no proper waste management takes place [14]. Hazardous waste such as batteries, drugs and
other chemical are mixed with household waste and dumped together. The leachate from the waste
seeps into the underground waters contaminating it.
Effluents from some industrial activities like mining especially small-scale mining activities are
known contaminants of water bodies. In most cases surface water bodies are the most affected
however the possibility of spillage of chemicals on the soil cannot be ruled out. In such cases,
these harmful chemicals will leach into the underground water bodies [12]. Since these activities
are not regulated, such spillages are neither reported nor monitored, putting people in the
immediate neighbourhood at risk. Other industrial setups like petrol stations and fuel storage sites
often experience spillage of petroleum products that are not properly handled. The result is the
leaching of the volatile organic compounds that are carcinogenic into underground waters.
Extensive use of chemicals and pesticides for farming purposes also result in the leachate of

96
harmful chemicals and pollutants into underground water bodies. The drinking water quality
specification as provided by the Environmental Protection Agency (EPA) Ghana, and the World
Health Organisation (WHO), are provided in table 1.
Table 1: EPA and WHO water quality standards
Parameter EPA, Ghana WHO
Manganese (mg/l) - 0.4
Lead (mg/l) 0.1 0.01
Copper (mg/l) - 2.0
Arsenic (mg/l) 1.0 0.01
Zinc (mg/l) 10 3.0
Mercury (ppb) 0.2 0.01
Iron (mg/l) - 0.3
Cadmium (mg/l) - 0.003
pH 6.5 – 8.5 6.5 – 8.5
Turbidity (NTU) 5 5
Electrical Conductivity (μS/cm) - -
Colour 15 15
Total dissolved solids (mg/l) 1000 1000
Treatment Options Water Quality Not Just Availability
For a very long time, a lot of emphasis has been laid on water availability. Donor funding as well
as government programmes have targeted increasing water access thus extending water supply to
the remotest of places. Erroneously, underground waters have always been considered of very
good quality because of the extensive filtering process the water undergoes. True as it may be, as
has been pointed out both natural and environmental conditions most often than not make
nonsense of this claim. To curb the incidence of water related diseases, water quality must be taken
just as serious with adequate funding as water access and availability. In the next section proven
methods of purifying the water are explored.
Disinfection of Wells
This section looks at how infected wells are treated for high levels of bacteria. Faecal
contamination of wells leads to the aggregation of bacteria and other harmful germs. Periodic
laboratory analysis of water quality checks needs to be carried out in all areas to ascertain the level
of bacterial contamination. Disease causing bacteria such as e-coli, salmonella, vibrio cholerae
among others must be the target of such investigation. When the level of contamination is
determined to be unsafe for human consumption, the well has to be capped and disinfected before
allowing the inhabitants to use it. In situations where the well cannot be capped due to the urgent
need for water, residents must be advised to boil their water before drinking it. Chlorination is a
very effective way of killing germs and disease causing bacteria. The quantity of hypochlorite used
however depends on a number of factors:
Quantity of water in the well
Level of contamination.
97
The quantity of water in the well can be calculated using the formula in [15]
Where:
V = volume of water in the well
d = diameter of the well
h = water column height
This method is particularly good for boreholes and occasional contamination of wells like
flooding. Where the contamination is coming from the walls of the well other methods will have to
be employed. Assuming the water table is contaminated as a result of a pit latrine situated close to
the well or leachate from dumpsites, then one time disinfection of the water in the well might not
solve the problem. If the water table is contaminated then either the latrine is closed down which
will most likely not be the case or the dump site is completely cleared which will also not
materialize. In such a situation one solution is effective, an automatic hypochlorite dispensing
machine placed on top of the well, which occasionally dispenses hypochlorite solution into the
well in precisely measured quantities to kill germs and bacteria. Such a system will depend to a
large extent on the rate of recovery of the well. The authors are working on a similar system
powered by solar energy.
Removal of heavy metals Treatment Using Lignocellulosic Materials
Treatment of contaminated water using dung and carbon prepared from animal bones by CWSA,
though successful, has not been accepted due to cultural connotations. The use of agricultural
waste to reduce heavy metal contaminants have also been reported to be successful by Harman et
[16], even though the same success rate was not achieved with light metals like Mg2+
and K+.
Significant amounts of Mg2+
and K+ were not removed from the water. This was explained to
mean that the heavier metals had more affinity for the cellulosic materials than the lighter metals.
This means the heavier the metal the higher the affinity. Though this may be true as reported a
careful selection of cellulosic material and the right environmental conditions like PH may be able
to increase the removal of the lighter metals.
Activated Charcoal
The CWSA has also reported the successful removal of the heavy metals from ground water using
activated charcoal in the MWACAFE filtration plant. They strongly believe that since charcoal is a
household commodity cultural barriers leading to rejection will be greatly reduced, thus making it
more acceptable. Initial reports indicate that high removal of manganese and iron was achieved
using the MWACAFE plant [17]. Charcoal has a very high porosity which makes it a good
absorber. When is it activated, its affinity for metallic ions increases, thus its ability to reduce the
concentration of metallic ions in solution. The ability of the MWACAFE plant to remove other
heavy metals has not been investigated.
Distillation
Distilled water is said to be the purest form of water. Though good, distillation is very expensive
since a lot of energy is expended during the distillation process. Also the distillation receptacle is
often expensive and thus beyond the economic reach of most people. The Centre for Energy,
Environment and Sustainable Development, CEESD has demonstrated how solar energy can be

98
utilized to remove distil water and make it safe for drinking. Solar water distillers virtually remove
all contaminants and bacterial infections, thus making the water clean. A small unit installed in
AnaafoBissi in the Bongo district was able to reduce the fluoride contaminants from 20 mg/l to
about 0.7 mg/l which is way below the WHO standard [18].
Special areas that deserve particular attention with regards to underground water quality are
discussed below. Mining Town
Mining communities have long suffered from contamination of their surface water bodies by both
multinational mining companies and local mining groups popularly called “galamsay”. This has
had both huge health and economic toll on the inhabitants of these areas. Because the activities of
these companies and groups are not properly monitored, it is increasingly becoming alarming that
underground water bodies may have been polluted as well. In an extensive survey by the Wassa
Amenfi Communities Affected by Mining (WACAM) of underground waters in the Tarkwa and
Oboasi Municipalities showed that most wells shown in figure 1 had higher heavy metal content
than the EPA and WHO standards. This is very alarming given the health implications of ingesting
heavy metals.
Figure 1: Results of heavy metal contaminants in mining areas
Source: Adapted from WACAM report [20]
Flood Prone Areas
During rainy seasons we often hear of floods in so many areas in Ghana. In 2009 and 2010, major
floods in Ghana were attributed to the effect of climate change. As has already been pointed out,
due to our poor waste management situation, the potential of flood waters carrying potentially
harmful waste into already dug wells is very high. Besides that, leachate from waste dumping sites
seeping into underground waters is a major concern. Due to these issues the quality of the water
from the wells needs to be checked.
99
Areas Close To Dump Sites
In Ghana, there is only one engineered landfill site in Kumasi. All other cities and towns have
dump sites. Due to the nature of our waste collection and dumping systems, mingled waste
containing, organic, industrial, plastic and in some cases medical waste are dumped together on
these open fields. All wells close to dumping sites must therefore have their water quality tested
regularly.
Areas around Magazines and Heavy Industrial Setups
Fitting shops and magazines do not usually have mechanisms for treating their liquid waste. Dirty
engine oils, other lubricants, fuels and greases are usually poured onto the bear ground. These
petroleum products and synthetic oils often containing harmful chemicals seep into underground
water bodies. Due to the movement of water molecules in the earth not just the immediate
environment is affected, however, other areas further away from the magazine or fitting shop may
also be affected.
All Wells
Aside these two special cases, the authors believe that all wells in the country should be checked
periodically. Through preventive measures, contaminated and infested wells would be disinfected
before any calamity occurs.
Conclusion Wells have come to stay as an important source of water supply for especially people in rural
areas, not only them; urban communities are increasingly depending on wells as well. The quality
of water from many wells is questionable since it might contain high levels of metal contaminants
and or bacterial infection due to several factors such as floods, poor waste management and poor
hygiene. Several methods for removing metallic contaminants have been reviewed while a
comprehensive disinfection of wells has also been explored. It is hoped that a system will be put in
place to check the quality of water from wells periodically and a disinfection plan put in place. In
the case of metallic contaminants, a cost effective method should be selected and promoted
vigorously in areas known for high levels of contamination either with donor support or a special
government programme.
________________________________________________________________________________
References 1. Water Resources Commission, 2011. Ghana's Water Resources. http://www.wrc-
gh.org/ghanaswaterresources.html. Assessed on 10/07/2011
2. FAO, Summary Table: Renewable Water Resources in the world by country.
(http://www.fao.org/nr/water/aquastat/water_res/waterres_tab.htm). Assessed on 13/07/2011.
1. Kuma, S. J., Owusu, O. R. and Gawu, K. Y. S. 2010. Evaluating the Water Supply System in
Kumasi, Ghana, European Journal of Scientific Research, Vol . 40, No. 4, pp 506 - 514.
2. (CWSA), C. W. 2011. overview of underground water quality . Accra: CWSA.
5. EarthTrends. 2003. Water Resources and Freshwater Ecosystems - Ghana. Earthtrends.
100
6. WHO.(2002). Burden of Disease Statistics. Burden of Disease Unit. Geneva: WHO.
HYPERLINK "http://www.who.int/research/en/" http://www.who.int/research/en/
7. Pruss-Ustun, K. A. 2006. Preventing Diseases through Healthy Enviornment: Towards an
Estimate of the Environmental Burden of disease. France : WHO.
8. Chiroma, T. M., Ugheoke, I. B. and Patrick D. O. Environmental Impact on the Quality of
Water from Hand-Dug Wells in Yola Environs, Unpublished
9. F. A. Atipoka, Water supply challenges in rural Ghana, Desalination 251 (2010) 212–217
10. Bongo District Assembly: Bongo district, Ghana districts – a repository of all districts of
Ghana, Available at HYPERLINK
"http://ghanadistricts.com/districts1on1/bongo/?arrow=dnf&_=103"
http://ghanadistricts.com/districts1on1/bongo/?arrow=dnf&_=103 (Accessed 15.06.10)
11. WACAM. 2006. Interim report, unpublished
(http://www.wacamghana.com/app/webroot/img/documents/4af460c32ea9c.pdf)
12. Kabongo, I. and Kabiswa, C. 2008. Pit latrines and their impact on Groundwater in Small and
Towns in Uganda A case of Bugiri Town Council, Coupling of Sustainable and Groundwater
Protection, Ecological Christian Organisation, 14 – 17th
October, 2008.
13. Cave, B. and Kolsky, P. 1999. Well Study Groundwater latrines and health, Well water and
Environmental Health, Task No: 163, London.
14. Kimani-Murage, E. W. and Ngindu, A. M. 2007. Quality of Water the Slum Dwellers Use: The
Case of a Kenyan Slum, Journal of Urban Health, 84(6): 829 – 838.
15. Ghana Statistical Service: Ghana Living Standards Survey: Report of the Fifth Round
(GLSS5), 2008.
16. WHO: Technical notes for Emergencies, Technical note 2, 2005.
17. Harman, G. P. (2007). Removal of Heavy Metal from Polluted Water using Lignocellulosic
Agricultural Waste . Industrial Biotechnology Winter , Vol 3. No.4 366 - 374.
18. NETSSAF. (2007). Second current research outside consortium.
http://www.netssaf.net/typo3conf/ext/naw_securedl/secure.php?u=0&file=fileadmin/Files/Doc
uments/Secured_Area/6_Final_Deliverables/NETSSAF_D29.pdf&t=1233287846&hash=7125
df24232c4fed35e742060e426849: European Commisssion.
19. Antwi, E., Bensah, E. and Ahiekpor, J. (2011), Use of Solar Water Distiller for treatment of
fluoride-contaminated water: The case of Bongo District of Ghana,
doi:10.1016/j.desal.2011.05.044 (article in press).
20. WACAM report. (www.wacam.com) assessed on 21/08/2010
101
________________________________________________________________________________
Keywords Quality water, contamination, sanitation, wells
_______________________________________________________________________________
Contact Details Edward Antwi
Mechanical Engineering Department
Kumasi Polytechnic
Box 854
Kumasi, Ghana
Edem Cudjoe Bensah, Julius Cudjoe Ahiekpor
Chemical Engineering Department
Kumasi Polytechnic
Box 854
Kumasi, Ghana
Richard Arthur
Energy Systems Department
Koforidua Polytechnic
PMB
Koforidua, Ghana
Elijah Boadu
Civil Engineering Department
Kumasi Polytechnic
Box 854
Kumasi, Ghana
______________________________________________________________________________

102
_______________________________________________________________________________
3rd Ghana Water Forum, Accra, Ghana, 2011
Water and Sanitation Services Delivery in a Rapidly Changing Urban Environment
Cost of Rural and Small Town Water Service Delivery in the Bosomtwe District
E. Appiah-Effah, K.B. Nyarko, B. Dwumfour-Asare & P. Moriarty
_______________________________________________________________________________
Abstract This paper uses the Life-Cycle Cost Approach (LCCA) to quantify the costs of providing
sustainable water services and measures the actual water service received by the users in
Bosomtwe district in the Ashanti region of Ghana. The study covered 28 water point systems
(boreholes fitted with handpumps) in 10 communities and one small town piped system serving
5,462 inhabitants in the district. The water services received was assessed through household
surveys covering 620 households with the following indicators: quantity, quality, accessibility,
crowding and reliability. The paper discusses the cost of providing water services for the two
main models of water supply (water point systems and piped schemes) using the Bosomtwe
district. The study revealed that the cost of constructing the small towns water system is about
twice that of the water point systems and the ongoing cost of operating and maintenance of the
small towns is four times that of the water point system. The small town water system also
provided acceptable service to 72% of the inhabitants compared to 34 % by the water point
system. The paper concludes with some policy recommendations on the use of life cycle costing
to improve decision making in water service delivery.
_______________________________________________________________________________
Introduction In Ghana like other developing countries, the method of water supply to rural and small towns
inhabitants are predominantly water point systems (boreholes with handpumps) and small town
piped systems (mechanized water schemes). According to CWSA (2009a) 6,668,484 rural people
(56%) have been served with handpumps as against 1,816,891 (62%) served under small-town
piped water systems all in the 2008 year. However, provision of facilities is not enough and will
not necessarily contribute to long term coverage statistics if operations are not based on
sustainability.
WASHCost project partners have developed the Life-cycle cost approach (LCCA) methodology
for costing sustainable water, sanitation and hygiene (WASH) services by assessing life-cycle
costs and comparing them against levels of service provided. The approach has been tested in
Ghana, Burkina Faso, Mozambique and Andhra Pradesh (India). The life-cycle costs approach is
a robust tool to study cost effectiveness of service delivery. In Ghana, Kwame Nkrumah
University of Science and Technology (KNUST), International Water and Sanitation Centre in
Netherlands (IRC), and Community Water and Sanitation Agency (CWSA) are using the LCCA
to identify the true costs of providing sustainable Water, Sanitation and Hygiene in rural and
peri-urban areas.
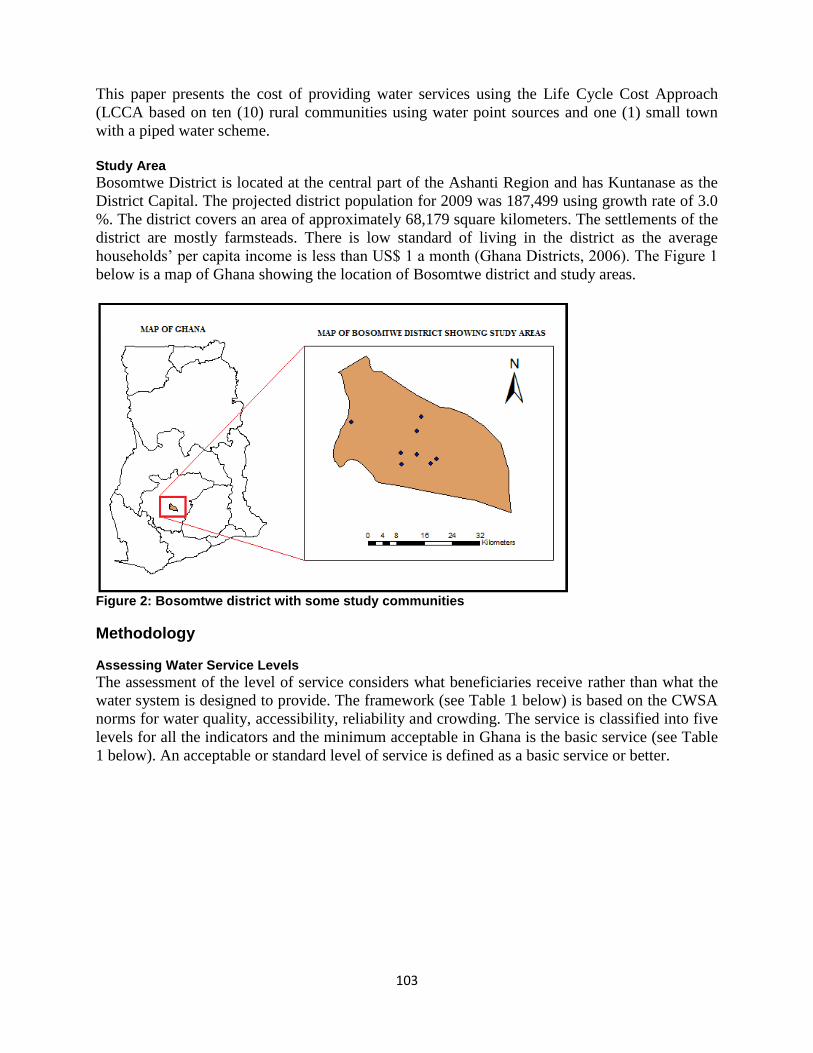
103
This paper presents the cost of providing water services using the Life Cycle Cost Approach
(LCCA based on ten (10) rural communities using water point sources and one (1) small town
with a piped water scheme.
Study Area
Bosomtwe District is located at the central part of the Ashanti Region and has Kuntanase as the
District Capital. The projected district population for 2009 was 187,499 using growth rate of 3.0
%. The district covers an area of approximately 68,179 square kilometers. The settlements of the
district are mostly farmsteads. There is low standard of living in the district as the average
households’ per capita income is less than US$ 1 a month (Ghana Districts, 2006). The Figure 1
below is a map of Ghana showing the location of Bosomtwe district and study areas.
Figure 2: Bosomtwe district with some study communities
Methodology Assessing Water Service Levels
The assessment of the level of service considers what beneficiaries receive rather than what the
water system is designed to provide. The framework (see Table 1 below) is based on the CWSA
norms for water quality, accessibility, reliability and crowding. The service is classified into five
levels for all the indicators and the minimum acceptable in Ghana is the basic service (see Table
1 below). An acceptable or standard level of service is defined as a basic service or better.
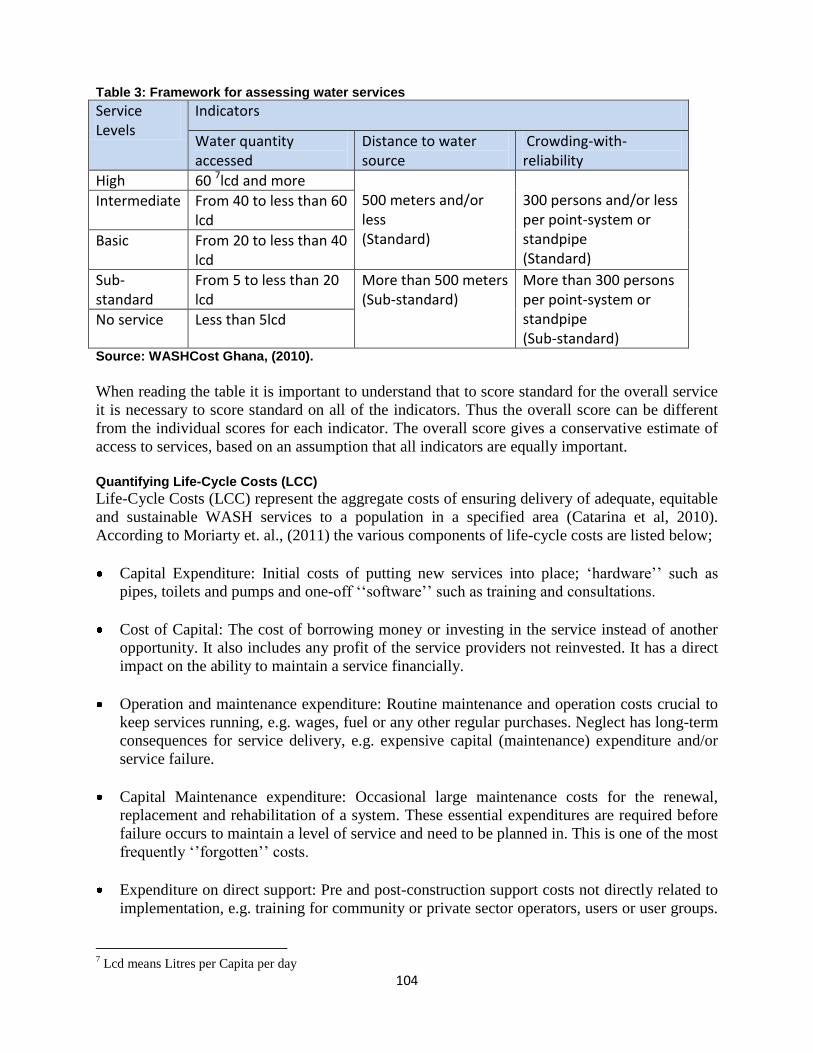
104
Table 3: Framework for assessing water services
Service Levels
Indicators
Water quantity accessed
Distance to water source
Crowding-with-reliability
High 60 7lcd and more 500 meters and/or less (Standard)
300 persons and/or less per point-system or standpipe (Standard)
Intermediate From 40 to less than 60 lcd
Basic From 20 to less than 40 lcd
Sub-standard
From 5 to less than 20 lcd
More than 500 meters (Sub-standard)
More than 300 persons per point-system or standpipe (Sub-standard)
No service Less than 5lcd
Source: WASHCost Ghana, (2010).
When reading the table it is important to understand that to score standard for the overall service
it is necessary to score standard on all of the indicators. Thus the overall score can be different
from the individual scores for each indicator. The overall score gives a conservative estimate of
access to services, based on an assumption that all indicators are equally important.
Quantifying Life-Cycle Costs (LCC)
Life-Cycle Costs (LCC) represent the aggregate costs of ensuring delivery of adequate, equitable
and sustainable WASH services to a population in a specified area (Catarina et al, 2010).
According to Moriarty et. al., (2011) the various components of life-cycle costs are listed below;
Capital Expenditure: Initial costs of putting new services into place; ‘hardware’’ such as
pipes, toilets and pumps and one-off ‘‘software’’ such as training and consultations.
Cost of Capital: The cost of borrowing money or investing in the service instead of another
opportunity. It also includes any profit of the service providers not reinvested. It has a direct
impact on the ability to maintain a service financially.
Operation and maintenance expenditure: Routine maintenance and operation costs crucial to
keep services running, e.g. wages, fuel or any other regular purchases. Neglect has long-term
consequences for service delivery, e.g. expensive capital (maintenance) expenditure and/or
service failure.
Capital Maintenance expenditure: Occasional large maintenance costs for the renewal,
replacement and rehabilitation of a system. These essential expenditures are required before
failure occurs to maintain a level of service and need to be planned in. This is one of the most
frequently ‘’forgotten’’ costs.
Expenditure on direct support: Pre and post-construction support costs not directly related to
implementation, e.g. training for community or private sector operators, users or user groups.
7 Lcd means Litres per Capita per day
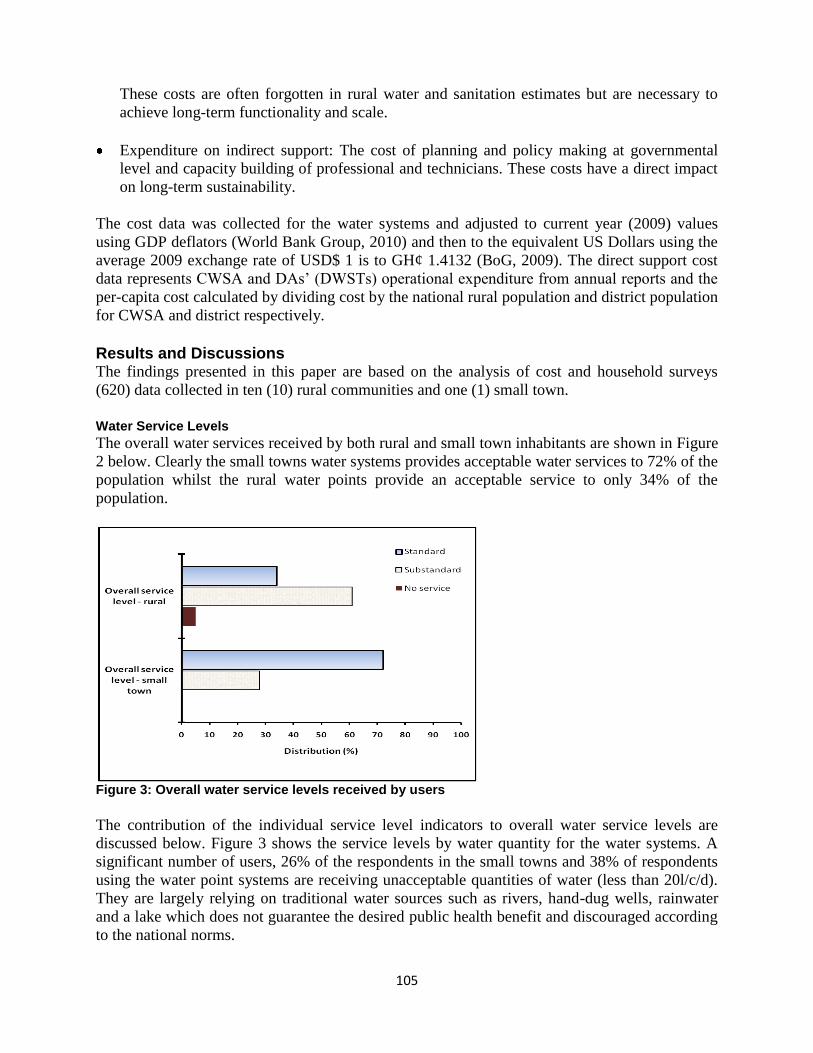
105
These costs are often forgotten in rural water and sanitation estimates but are necessary to
achieve long-term functionality and scale.
Expenditure on indirect support: The cost of planning and policy making at governmental
level and capacity building of professional and technicians. These costs have a direct impact
on long-term sustainability.
The cost data was collected for the water systems and adjusted to current year (2009) values
using GDP deflators (World Bank Group, 2010) and then to the equivalent US Dollars using the
average 2009 exchange rate of USD$ 1 is to GH¢ 1.4132 (BoG, 2009). The direct support cost
data represents CWSA and DAs’ (DWSTs) operational expenditure from annual reports and the
per-capita cost calculated by dividing cost by the national rural population and district population
for CWSA and district respectively.
Results and Discussions The findings presented in this paper are based on the analysis of cost and household surveys
(620) data collected in ten (10) rural communities and one (1) small town.
Water Service Levels
The overall water services received by both rural and small town inhabitants are shown in Figure
2 below. Clearly the small towns water systems provides acceptable water services to 72% of the
population whilst the rural water points provide an acceptable service to only 34% of the
population.
Figure 3: Overall water service levels received by users
The contribution of the individual service level indicators to overall water service levels are
discussed below. Figure 3 shows the service levels by water quantity for the water systems. A
significant number of users, 26% of the respondents in the small towns and 38% of respondents
using the water point systems are receiving unacceptable quantities of water (less than 20l/c/d).
They are largely relying on traditional water sources such as rivers, hand-dug wells, rainwater
and a lake which does not guarantee the desired public health benefit and discouraged according
to the national norms.
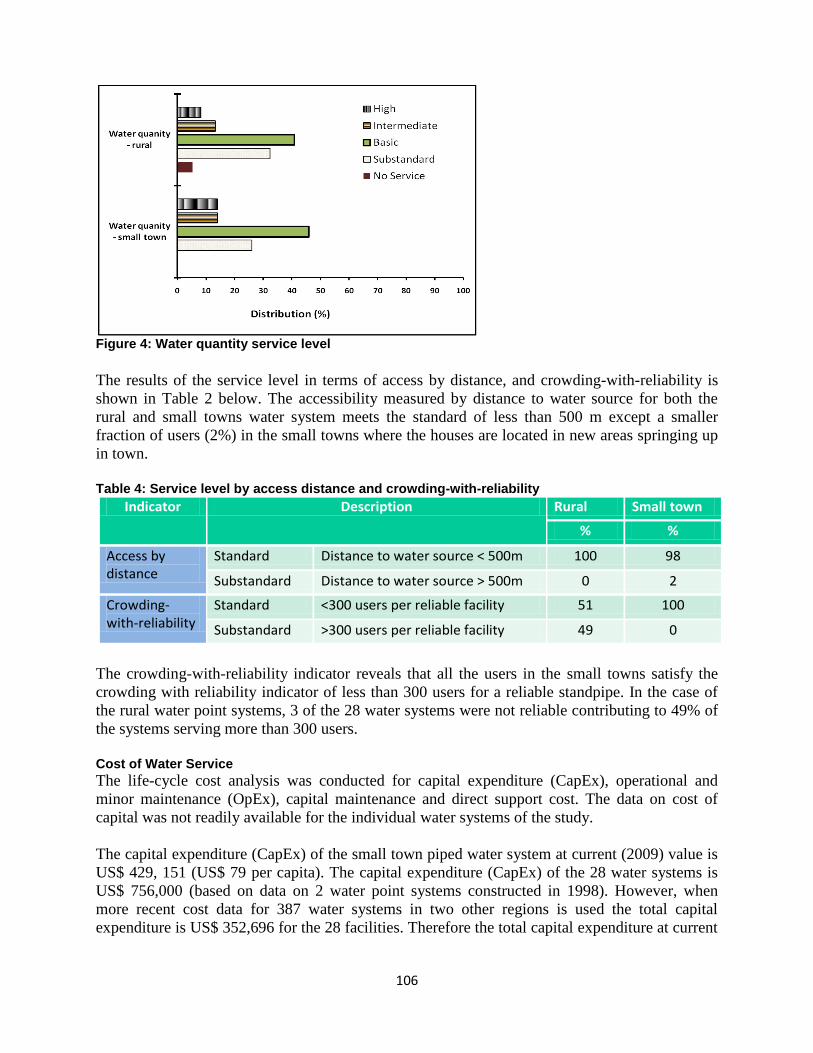
106
Figure 4: Water quantity service level
The results of the service level in terms of access by distance, and crowding-with-reliability is
shown in Table 2 below. The accessibility measured by distance to water source for both the
rural and small towns water system meets the standard of less than 500 m except a smaller
fraction of users (2%) in the small towns where the houses are located in new areas springing up
in town.
Table 4: Service level by access distance and crowding-with-reliability
The crowding-with-reliability indicator reveals that all the users in the small towns satisfy the
crowding with reliability indicator of less than 300 users for a reliable standpipe. In the case of
the rural water point systems, 3 of the 28 water systems were not reliable contributing to 49% of
the systems serving more than 300 users.
Cost of Water Service
The life-cycle cost analysis was conducted for capital expenditure (CapEx), operational and
minor maintenance (OpEx), capital maintenance and direct support cost. The data on cost of
capital was not readily available for the individual water systems of the study.
The capital expenditure (CapEx) of the small town piped water system at current (2009) value is
US$ 429, 151 (US$ 79 per capita). The capital expenditure (CapEx) of the 28 water systems is
US$ 756,000 (based on data on 2 water point systems constructed in 1998). However, when
more recent cost data for 387 water systems in two other regions is used the total capital
expenditure is US$ 352,696 for the 28 facilities. Therefore the total capital expenditure at current
Indicator Description Rural Small town
% %
Access by distance
Standard Distance to water source < 500m 100 98
Substandard Distance to water source > 500m 0 2
Crowding-with-reliability
Standard <300 users per reliable facility 51 100
Substandard >300 users per reliable facility 49 0

107
cost is US$ 781,847 for a population of 15,584. With 15 % of the water point systems not
functioning, the current value of the non functional systems investment is US$ 52,904.
The operational and minor maintenance expenditure (OpEx) available for 23 water point-systems
gives cost range from US$ 0 to 102 per facility per year (median of US$ 43 per facility/yr). The
operational and minor maintenance expenditure (OpEx) in terms of cost per capita based on
observed population ranges from US$ 0 to US$2.0 (median, US$ 0.1). However, for the small
town water system the average annual OpEx is US$ 12,427 representing US$ 2.3 per capita/yr.
There was no cost data available on capital maintenance for WPS even though six (6) facilities
had their handpumps replaced. For the small town system, the average annual capital
maintenance (CapManEx) is US$ 4,948 representing US$ 1 per capita/yr. The total per capita
direct support costs in the Bosomtwe district covering activities of CWSA and DWST is US$
0.56 per capita/year. The direct support cost is low as both CWSA and the DWSTs have low
budgets for monitoring and supporting the water service delivery in communities.
Conclusions and Recommendation The water point systems cost US$ 42 per capita and a running cost of US$ 0.9 per capita/yr and
delivers acceptable service to only 34 % of the populace. On the contrary, the small towns are
more expensive, costing about twice that of the water point system and a running cost of about
four times that of the water point system. The small town water system also provided acceptable
service to 72 % of the inhabitants compared to 34 % by the water point system
The total investment at current cost for the 10 rural communities and 1 small town is US$
781,847. The recurrent expenditures (direct support cost, operational and minor, and capital
maintenance) are relatively low contributing to the non functional system which has a current
value of US $ 52,904. The CWSA and DWST are under resourced adversely affecting their role
in the post-construction support activities. Meanwhile, these routine expenditures are crucial for
facilities’ functionality and reliability for long term sustainable service delivery.
It is recommended that CWSA (regional) and DA (DWST) should be adequately resourced for
post-construction monitoring of operations and maintenance especially with the WPS to achieve
100% functionality and reliability rates for sustainable services. Also there should be planned
capital maintenance for especially very old rural water systems to replace the handpumps.
_______________________________________________________________________________
Acknowledgement The authors wish to acknowledge the support of International Water and Sanitation Centre,
WASHCost Ghana team (research assistants, drivers etc), Community Water and Sanitation
Agency (head and regional offices), Bosomtwe District Water and Sanitation Team,
enumerators, Kuntenase Water and Sanitation Development Board, WATSANs and respondents
of communities, and other diverse contributors.
_______________________________________________________________________________

108
References 1. BoG, (2009). Bank of Ghana annual report 2009. Bank of Ghana, 1 Thorpe Road P. O. Box
GP 2674, Accra, Ghana. www.bog.gov.gh
2. CWSA, (2009a). Communi ty Water and Sanitation Agency: National coverage. Available
from: http://www.cwsagh.org/cwsa_subcat_sel ect.cf m?tbl NewsCatI D=20& prodcatI D=5.
[accessed 6/23/2011]
3. CWSA, (2009b). Ashanti Region Rural Water Coverage: Bosomtwe District. Ashanti
Regional Community Water and Sanitation Agency, Kumasi, Ghana.
4. Fonseca, C., Franceys, R., Batchelor, C., McIntyre, P., Klutse, A., Komives, K., Moriarty, P.,
Arjen, N., Nyarko, K., Pezon, C., Alana, P., Ratna, R., Mekala, S., (2010). Life-cycle cost
approach: Glossary and cost components. WASHCost Briefing Note1, International Water
and Sanitation Centre (IRC), The Hague, Netherlands. Available from:
http://www.washcost.info/content/download/763/4808/file/20100409_WASHCost_
BriefingNoteN1%20LowRes.pdf [Accessed 2 July 2010]
5. Ghana Districts (2006). Bosomtwe District, Demographic Characteristics;
http://www.ghanadistricts.com/districts/?r=2&_=20&sa=5514 [Date accessed, 15th, July
2011]
6. GWCL, (2010). Cost estimate for the drilling of 125mm borehole. Ghana Water Company
Limited, Drilling Unit, Kumasi.
7. Moriarty, P., Nyarko, K. B., Dwumfour-Asare, B., Appiah-Effah, E. and Obuobisa-Darko, A.
(2011). Life-cycle costs in Ghana: Backgrounds and Methodology. Briefing Note 1.
International Water and Sanitation Centre (IRC) Ghana, Accra. (Awaiting publication).
8. World Bank Group, (2010). World Development Indicators (WDI). Available from:
http://databank.worldbank.org/ddp/home.do?Step=2&id=4&hActiveDimensionId=WDI_SE
RIES. [Accessed 2 July 2010]
___________________________________________________________________________________
Key Words Life-cycle cost approach, rural water point systems, small town piped system, service levels

109
___________________________________________________________________________________
Contact Details Eugene Appiah-Effah
WASHCost Project – Ghana
Civil Engineering Department
KNUST
Ghana
Tel: +233243034733
Email: [email protected]
Nyarko K. B.
WASHCost Ghana
Civil Engineering Department
KNUST
Ghana
Tel: +233208165515
Email: nyarko.k.b@gmail
Dwumfour-Asare B.
WASHCost – Ghana
Civil Engineering Department
KNUST
Ghana
Tel: +233261533327
Email: [email protected]
Patrick Moriarty
International Water and Sanitation Centre (IRC)
The Hague, The Netherlands
Tel: +233245521982
Email: [email protected]
______________________________________________________________________________

110
________________________________________________________________________________
3rd Ghana Water Forum, Accra, Ghana, 2011
Water and Sanitation Services Delivery in a Rapidly Changing Urban Environment
Degradation of Water Resources and the Effect on Drinking Water
Treatment in Ghana
Evans Y. Balaara & Nicholas H. Okyere
________________________________________________________________________________
Abstract Ghana Water Company Limited is the urban water provider in Ghana. It has been facing problems
with some of its raw water resources due to environmental degradation such as illegal mining
activities in the catchment areas. This has resulted in poor raw water quality as well as occasional
and permanently drying up of some dams. Colour and turbidity are the worst affected water
quality parameters. Degradation of the water catchment areas has resulted in increasing chemical
cost of water treatment and also intermittent shut downs of some water treatment Plants. Key
Stakeholders in the management of water resources need to have a common platform to discuss
the way forward in managing pollution situations of water bodies.
________________________________________________________________________________
Introduction Water is a precious commodity that touches the life of every person on the planet. The availability
and provision of clean water still proves to be a scarcity.
Ghana Water Company is responsible for the provision of potable water for the urban population
in the country. The Company currently operates forty six [46] major surface Water Treatment
Plants and is able to meet only about 59% of the demand of its customers nationwide. Within the
last few years, our operations have been facing an unprecedented water treatment challenges
arising from poor quality of the raw water abstracted from the river sources.
The water resources in Ghana have over the years experienced an escalating degradation. This
degradation affects the water quality of the rivers making it difficult and sometimes unfit to treat
for human usage. This situation has come about because of the continuous degradation of the
environment with severe negative impact on catchment areas of raw water sources.
For instance a number of Water Treatment Plants sometimes have to be shut down on several
occasions as a result of heavy pollution. These Plants have not been designed and built to process
the current rate of deterioration of the raw water quality characteristics caused mainly by human
activities such as inappropriate industrial and domestic waste disposal, poor sanitation, mining
within catchments and in the beds of rivers, deforestation or removal of vegetation cover, fishing,
farming, climate change etc.
The degradation resulted in dried up raw water sources for which some Water Treatment Plants
have permanently closed down or occasionally shut down. Shut down of Treatment Plants denies
the people of regular supply of water. It has however been the only necessary precautionary measures applied to avoid supplying communities with unsafe drinking water. Apart from the
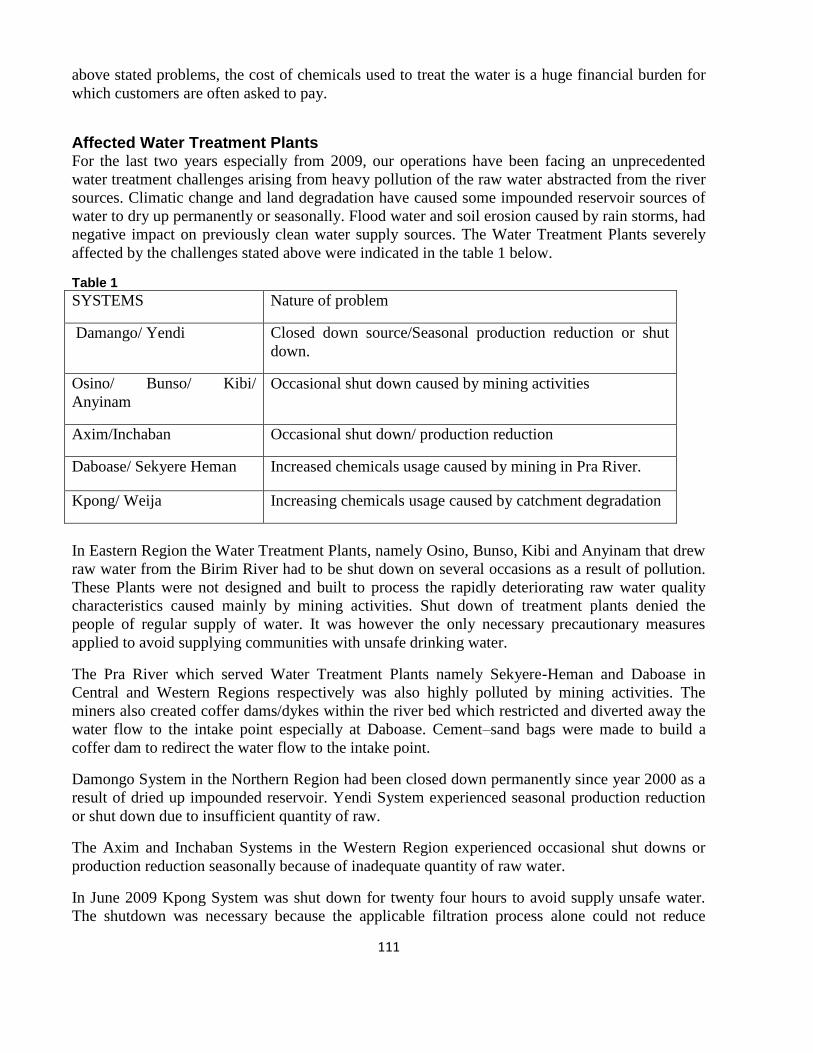
111
above stated problems, the cost of chemicals used to treat the water is a huge financial burden for
which customers are often asked to pay.
Affected Water Treatment Plants For the last two years especially from 2009, our operations have been facing an unprecedented
water treatment challenges arising from heavy pollution of the raw water abstracted from the river
sources. Climatic change and land degradation have caused some impounded reservoir sources of
water to dry up permanently or seasonally. Flood water and soil erosion caused by rain storms, had
negative impact on previously clean water supply sources. The Water Treatment Plants severely
affected by the challenges stated above were indicated in the table 1 below.
Table 1
SYSTEMS Nature of problem
Damango/ Yendi Closed down source/Seasonal production reduction or shut
down.
Osino/ Bunso/ Kibi/
Anyinam
Occasional shut down caused by mining activities
Axim/Inchaban Occasional shut down/ production reduction
Daboase/ Sekyere Heman Increased chemicals usage caused by mining in Pra River.
Kpong/ Weija Increasing chemicals usage caused by catchment degradation
In Eastern Region the Water Treatment Plants, namely Osino, Bunso, Kibi and Anyinam that drew
raw water from the Birim River had to be shut down on several occasions as a result of pollution.
These Plants were not designed and built to process the rapidly deteriorating raw water quality
characteristics caused mainly by mining activities. Shut down of treatment plants denied the
people of regular supply of water. It was however the only necessary precautionary measures
applied to avoid supplying communities with unsafe drinking water.
The Pra River which served Water Treatment Plants namely Sekyere-Heman and Daboase in
Central and Western Regions respectively was also highly polluted by mining activities. The
miners also created coffer dams/dykes within the river bed which restricted and diverted away the
water flow to the intake point especially at Daboase. Cement–sand bags were made to build a
coffer dam to redirect the water flow to the intake point.
Damongo System in the Northern Region had been closed down permanently since year 2000 as a
result of dried up impounded reservoir. Yendi System experienced seasonal production reduction
or shut down due to insufficient quantity of raw.
The Axim and Inchaban Systems in the Western Region experienced occasional shut downs or
production reduction seasonally because of inadequate quantity of raw water.
In June 2009 Kpong System was shut down for twenty four hours to avoid supply unsafe water.
The shutdown was necessary because the applicable filtration process alone could not reduce
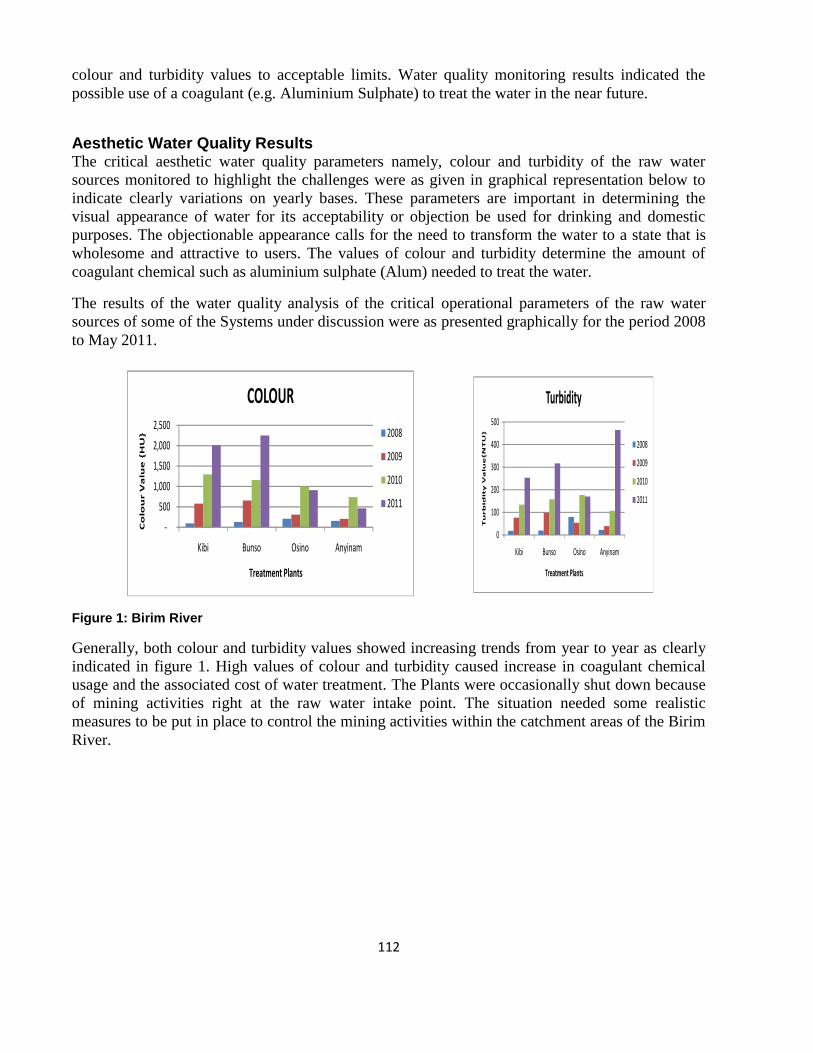
112
colour and turbidity values to acceptable limits. Water quality monitoring results indicated the
possible use of a coagulant (e.g. Aluminium Sulphate) to treat the water in the near future.
Aesthetic Water Quality Results The critical aesthetic water quality parameters namely, colour and turbidity of the raw water
sources monitored to highlight the challenges were as given in graphical representation below to
indicate clearly variations on yearly bases. These parameters are important in determining the
visual appearance of water for its acceptability or objection be used for drinking and domestic
purposes. The objectionable appearance calls for the need to transform the water to a state that is
wholesome and attractive to users. The values of colour and turbidity determine the amount of
coagulant chemical such as aluminium sulphate (Alum) needed to treat the water.
The results of the water quality analysis of the critical operational parameters of the raw water
sources of some of the Systems under discussion were as presented graphically for the period 2008
to May 2011.
Figure 1: Birim River
Generally, both colour and turbidity values showed increasing trends from year to year as clearly
indicated in figure 1. High values of colour and turbidity caused increase in coagulant chemical
usage and the associated cost of water treatment. The Plants were occasionally shut down because
of mining activities right at the raw water intake point. The situation needed some realistic
measures to be put in place to control the mining activities within the catchment areas of the Birim
River.
-
500
1,000
1,500
2,000
2,500
Kibi Bunso Osino Anyinam
Co
lou
r V
alu
e {
HU
}
Treatment Plants
COLOUR
2008
2009
2010
2011
0
100
200
300
400
500
Kibi Bunso Osino Anyinam
Tu
rb
idit
y V
alu
e{N
TU
}
Treatment Plants
Turbidity
2008
2009
2010
2011

113
Figure 2: Pra River at Sekyere-Heman and Daboase.
The colour and turbidity values of the Pra River at Sekyere- Heman and Daboase Systems in the
Central and Western Regions respectively were as represented by figure 2 showed increasing
yearly trends. Changes at Sekyere-Heman were more pronounced than at Daboase. The intensive
illegal mining activities took place close to the intake points.
Figure 3: Densu River Figure 4: Volta River
The colour and turbidity values of the raw water of the Densu River at Weija were as represented
by figure 3. The Station suffered algal bloom which required the use of high quantity of coagulant
chemical Aluminium Sulphate. The algal bloom was caused by domestic and industrial waste
discharges into the catchment area. The colour and turbidity values of the raw water of the Volta
River at Kpong were as represented by figure 4. The raw water quality characteristics were so
good that filtration, disinfection and pH Adjustment processes were only required. However, in
June 2009 Kpong System was shut down for twenty four hours to avoid supply unsafe water. The
situation was caused by extraordinary high values of colour [125HU) and turbidity (174NTU) such
that the filtration process was ineffective. Investigation conducted revealed sand weaning activities
in a portion of the catchment area close to the intake point. The trend of yearly colour
measurements pointed to the fact that we may soon begin to use coagulant chemicals to remove
colour and turbidity.
-
500
1,000
1,500
2,000
2,500
3,000
2008 2009 2010 2011
Co
lou
r V
alu
e [
HU
]
Year
COLOUR
Sekyere-Heman
Daboase
0
50
100
150
2008 2009 2010 2011
Va
lue
s [
HU
] a
nd
[N
TU
]
Year
COLOUR AND TURBIDITY
Colour
Turbidity
-
2
4
6
8
10
12
14
2008 2009 2010 2011
Va
lue
s [
HU
] a
nd
[N
TU
]
Year
COLOUR AND TURBIDITY
Colour
Turbidity

114
Major Concerns One of the major components of water production is the chemicals cost apart from dried up raw
water sources and occasional shut down of treatment plants. Deterioration of the raw water quality
characteristics in terms of colour and turbidity increased the quantities of chemicals used to treat
the water. What it means is that production cost will continue to increase at a faster rate and
customers would be asked to pay higher tariffs if something is not done to minimize the pollution
effects.
Recommendation For reasons stated here and other factors, it is very important that Management of Ghana Water
Company Limited should in collaboration with especially Water Resources Commission (WRC),
initiate steps to create a common platform for key stakeholders to meet regularly and discuss the
way forward in managing pollution situations of water bodies.
________________________________________________________________________________
References 1. Ghana Water Company Limited, Water Quality Assurance Department, 2011
2. UNESCO (2006), Water: A shared Responsibility by UNESCO
3. Alaskans for Responsible Mining. December, 2004. Environmental Impacts Fact Sheet.
http://www.miningwatch.ca/updir/ARM_Envt_Impacts_Fact_Sheet.pdf
4. Mining and Water Pollution: www.safewater.org
________________________________________________________________________________
Contact Details Evans Y. Balaara
Ghana Water Company Limited
P.O. Box GP130
Accra-Ghana
Telephone: 0277515678
Email: [email protected]
________________________________________________________________________________
115
________________________________________________________________________________
3rd Ghana Water Forum, Accra, Ghana, 2011
Water and Sanitation Services Delivery in a Rapidly Changing Urban Environment
Promoting Decentralised Solar Water Purification Systems in Ghana: A Case Study at Bongo
Edem Cudjoe Bensah, Edward Antwi & Julius Cudjoe Ahiekpor
________________________________________________________________________________
Abstract Solar purification of water is a proven technology that can be used to produce clean water on
decentralized basis to households in communities that face challenges with the quality of
groundwater resources. Even though Ghana has quality groundwater resources, there are
numerous localities whose groundwater systems are not potable due to high salinity, fluoride
contamination, and other chemical and biological contaminants. Moreover, the risk of
groundwater becoming contaminated from faecal matter from poorly constructed septic tanks is
high especially in peri-urban communities. This paper assesses the potential of using solar stills to
produce clean water from contaminated groundwater in Ghana. The paper highlights the success
of using two solar stills to treat fluoride-contaminated water at Anaafo Biisi Primary School in the
Bongo District of Ghana. Water quality analysis conducted showed a reduction of fluoride
concentration from 20 mg/l to below 1 mg/l, which is acceptable under WHO standards. As a
result of the ability of solar stills to mitigate the incidence of fluorosis in Bongo, it is envisaged
that the project will receive the necessary support so that it can be expanded to cover over 100
households and three basic schools in Anaafo Biisi.
________________________________________________________________________________
Introduction Groundwater Quality in Ghana
Water resources in Ghana are decreasing at an alarming rate owing to several factors: population
growth and urbanization, forest degradation, agricultural expansion, industrialization, pollution of
water bodies, and destruction of wetlands, among others. Pollution of surface water bodies and the
groundwater is a major developmental challenge [1]. Seepage of contaminants into groundwater
systems from agriculture, mining and other industrial waste, and poor waste disposal practices are
raising concerns regarding the quality of underground water. According to the fifth round of the
Ghana Living Standards Survey (GLSS5), about 73 % of urban households have access to pipe-
borne water compared to only 14 % of rural households [2]. The quality of groundwater resources
in Ghana is generally good except for some cases of localised pollution and areas with high levels
of iron, fluoride and other minerals [3]. Salinity in certain groundwater occurrences is also found
especially in some coastal aquifers. Over 10,000 boreholes are known to have been dug in Ghana
[1]. The number is likely to have been understated since a common trend observed in many cities
and towns is the construction of wells and boreholes by estate delivers especially in new suburbs
where pipe-borne water may not be available. City dwellers are increasingly using water from
boreholes as a way of cutting down expenditure on pipe water.
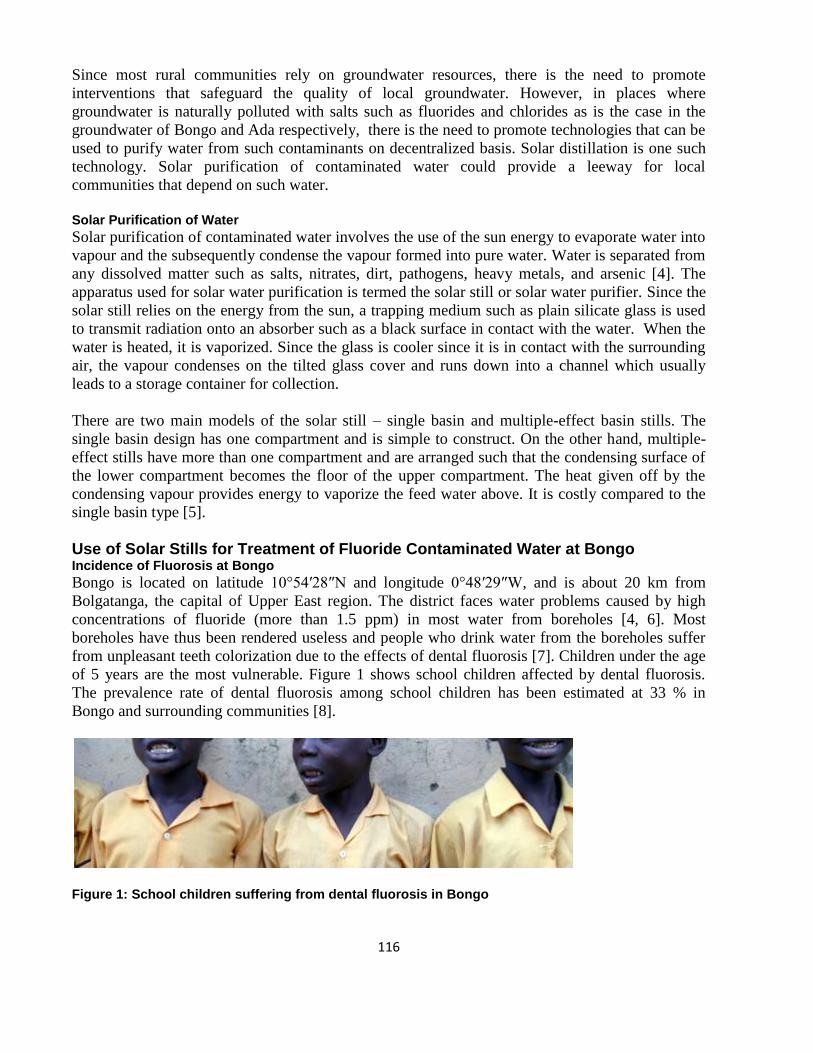
116
Since most rural communities rely on groundwater resources, there is the need to promote
interventions that safeguard the quality of local groundwater. However, in places where
groundwater is naturally polluted with salts such as fluorides and chlorides as is the case in the
groundwater of Bongo and Ada respectively, there is the need to promote technologies that can be
used to purify water from such contaminants on decentralized basis. Solar distillation is one such
technology. Solar purification of contaminated water could provide a leeway for local
communities that depend on such water.
Solar Purification of Water
Solar purification of contaminated water involves the use of the sun energy to evaporate water into
vapour and the subsequently condense the vapour formed into pure water. Water is separated from
any dissolved matter such as salts, nitrates, dirt, pathogens, heavy metals, and arsenic [4]. The
apparatus used for solar water purification is termed the solar still or solar water purifier. Since the
solar still relies on the energy from the sun, a trapping medium such as plain silicate glass is used
to transmit radiation onto an absorber such as a black surface in contact with the water. When the
water is heated, it is vaporized. Since the glass is cooler since it is in contact with the surrounding
air, the vapour condenses on the tilted glass cover and runs down into a channel which usually
leads to a storage container for collection.
There are two main models of the solar still – single basin and multiple-effect basin stills. The
single basin design has one compartment and is simple to construct. On the other hand, multiple-
effect stills have more than one compartment and are arranged such that the condensing surface of
the lower compartment becomes the floor of the upper compartment. The heat given off by the
condensing vapour provides energy to vaporize the feed water above. It is costly compared to the
single basin type [5].
Use of Solar Stills for Treatment of Fluoride Contaminated Water at Bongo Incidence of Fluorosis at Bongo
Bongo is located on latitude 10°54′28″N and longitude 0°48′29″W, and is about 20 km from
Bolgatanga, the capital of Upper East region. The district faces water problems caused by high
concentrations of fluoride (more than 1.5 ppm) in most water from boreholes [4, 6]. Most
boreholes have thus been rendered useless and people who drink water from the boreholes suffer
from unpleasant teeth colorization due to the effects of dental fluorosis [7]. Children under the age
of 5 years are the most vulnerable. Figure 1 shows school children affected by dental fluorosis.
The prevalence rate of dental fluorosis among school children has been estimated at 33 % in
Bongo and surrounding communities [8].
Figure 1: School children suffering from dental fluorosis in Bongo

117
Even though most boreholes have been shutdown as a result of this, people in some of the villages
continue to consume water from hand-dug wells and even capped boreholes because there are no
alternative sources of safe drinking water. Anaafo Biisi is one of such villages in Bongo. Dental
fluorosis has reached extremely high levels – as high as 80 % of entire population. A water quality
analysis conducted on a sample of water from a borehole is shown in Table 1.
Table 1: Results of water quality analysis of water from the solar still
Parameter Value
TDS 138.0 mg/l
Total Hardness (CaCO3) 90.0 mg/l
Calcium 23.0 mg/l
Magnesium 7.8 mg/l
Fluoride 20.65 mg/l
Chloride 11.0 mg/l
pH 6.73
Turbidity 0.1 Source: [4]
Attempts have been made by the Bongo district assembly, government, local and international
non-governmental organizations to find a lasting solution to the problem. The use of fluoride
removal methods such as precipitation and ion exchange has been tried by several organizations to
no avail due to the relatively high cost of such systems and problems with availability of chemicals
and equipment.
Intervention by the Centre for Energy, Environment and Sustainable Development (CEESD)
In an attempt to find a sustainable means of treating contaminated water at Bongo, the Centre for
Energy, Environment and Sustainable Development (CEESD), a local non-profit organization,
assessed the water problem at Bongo in August 2010. Based on the findings from the survey,
CEESD was convinced that the solar still would be an appropriate technology for purifying
fluoride contaminated water at Bongo.
CEESD Solar Stills
Two solar water distillers (Figure 2) have been designed and installed at Anaafo Biisi primary
school by CEESD. Figure 3 shows a picture of the solar still constructed at Anaafo Biisi. The
value of the solar insolation for Navrongo was used in the design of the stills since Navrongo is the
closest town to Bongo for which such information is available. The two models could deliver up to
25 litres of clean water daily. The stills were constructed readily available materials at Bongo with
the exception of the glazing which consisted of plain silicate glass.

118
Figure 2: Diagram of solar still
Figure 3: Solar stills constructed at Anaafo Biisi Primary School in Bongo
Results and Discussion Samples of purified water produced from the stills were analysed at the laboratories of Ghana
Water Company Limited and Department of Civil Engineering of Kwame Nkrumah University of
Science and Technology. Analysis of the solar purified water collected on five different days
indicates that the fluoride level in the raw borehole water had reduced significantly by about 96 %,
from 20.65 mg/l to an average of 0.76 mg/l which falls below the WHO figure of 1.5 mg/l (Figure
4).
Water inlet
Collection point
of distilled water
Plain silicate glass
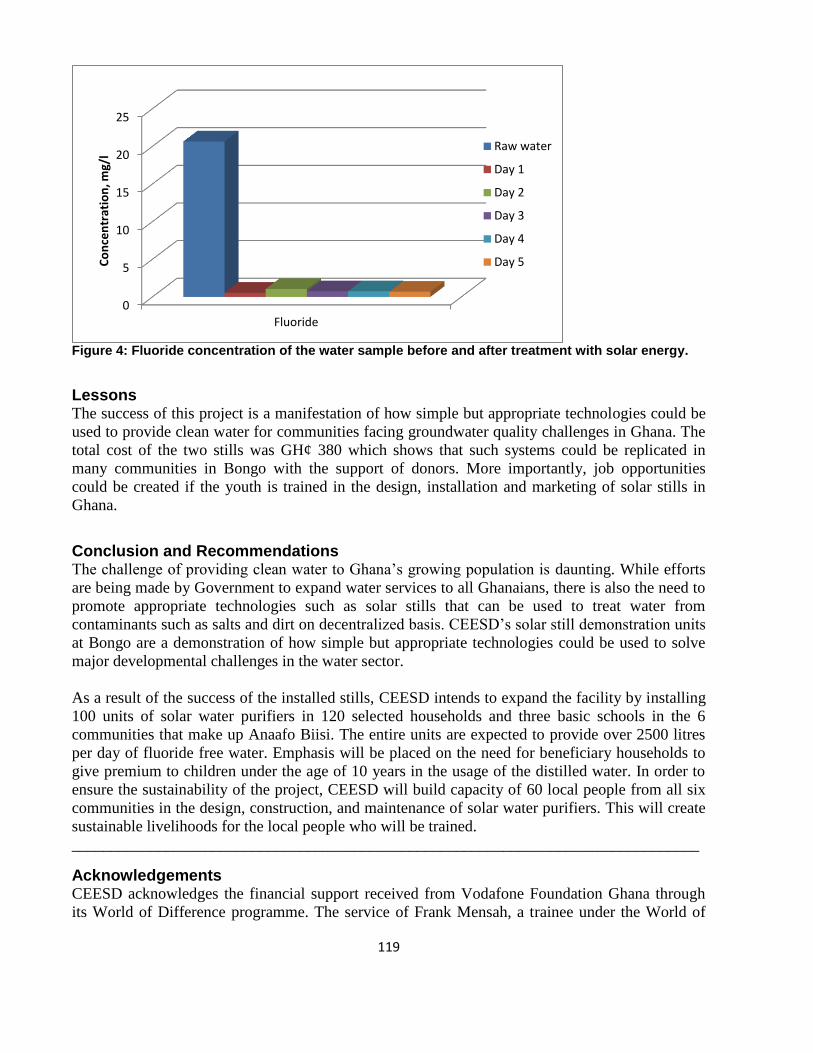
119
Figure 4: Fluoride concentration of the water sample before and after treatment with solar energy.
Lessons The success of this project is a manifestation of how simple but appropriate technologies could be
used to provide clean water for communities facing groundwater quality challenges in Ghana. The
total cost of the two stills was GH¢ 380 which shows that such systems could be replicated in
many communities in Bongo with the support of donors. More importantly, job opportunities
could be created if the youth is trained in the design, installation and marketing of solar stills in
Ghana.
Conclusion and Recommendations The challenge of providing clean water to Ghana’s growing population is daunting. While efforts
are being made by Government to expand water services to all Ghanaians, there is also the need to
promote appropriate technologies such as solar stills that can be used to treat water from
contaminants such as salts and dirt on decentralized basis. CEESD’s solar still demonstration units
at Bongo are a demonstration of how simple but appropriate technologies could be used to solve
major developmental challenges in the water sector.
As a result of the success of the installed stills, CEESD intends to expand the facility by installing
100 units of solar water purifiers in 120 selected households and three basic schools in the 6
communities that make up Anaafo Biisi. The entire units are expected to provide over 2500 litres
per day of fluoride free water. Emphasis will be placed on the need for beneficiary households to
give premium to children under the age of 10 years in the usage of the distilled water. In order to
ensure the sustainability of the project, CEESD will build capacity of 60 local people from all six
communities in the design, construction, and maintenance of solar water purifiers. This will create
sustainable livelihoods for the local people who will be trained.
________________________________________________________________________________
Acknowledgements CEESD acknowledges the financial support received from Vodafone Foundation Ghana through
its World of Difference programme. The service of Frank Mensah, a trainee under the World of
0
5
10
15
20
25
Fluoride
Co
nce
ntr
atio
n, m
g/l
Raw water
Day 1
Day 2
Day 3
Day 4
Day 5

120
Difference Programme is appreciated. Also acknowledged are the Chief of Anaafo Biisi, the DCE
of Bongo, the District Educational Director for Bongo, and the District Health Director of Bongo.
Last but the least, special gratitude goes to the people of Anaafo Biisi especially the women who
actively participated in the construction of the facility.
________________________________________________________________________________
References 1. Water Resources Commission of Ghana. http://www.wrc-gh.org/
2. Ghana Statistical Service (2008). Report of the fifth round of the Ghana Living Standard
Survey (GLSS5), Accra, Ghana.
3. British Geological Survey (BGS). Groundwater quality: Ghana. Prepared for WaterAid Ghana
office, Accra, Ghana.
4. Antwi E., Bensah E. C., Ahiekpor J. (2011). Use of solar water distiller for treatment of
fluoride-contaminated water: the case of Bongo district of Ghana, Desalination, doi:
10.1016/j.desal.2011.05.044
5. The Schumacher Centre for Technology and Development, Rugby, UK
6. F. A. Atipoka, Water supply challenges in rural Ghana, Desalination 251 (2010) 212–217
7. W. M. Apambire, D. R. Boyle, F.A. Michel, Geochemistry, genesis and health implications of
fluoriferous groundwaters in the upper regions of Ghana, Environmental Geology, 35: 13-24,
1997
8. Bongo District Assembly: Bongo district, Ghana districts – a repository of all districts of
Ghana, Available at http://ghanadistricts.com/districts1on1/bongo/?arrow=dnf&_=103
(accessed 15.04.11)

121
Contact Details Ing. Edem Bensah
Chemical Engineering Department
Kumasi Polytechnic
Box 854
Kumasi
Mobile: 0246450842
Email: [email protected] / [email protected]
Website: www.ceesdghana.org / www.kpoly.edu.gh
Ing. Edward Antwi
Mechanical Eng. Dept.
K. Poly
Mobile: 0208250357
Email: [email protected]
Julius Ahiekpor
Chemical Engineering Department
Kumasi Polytechnic
Mobile: 0244529589
Email: [email protected] / [email protected]

122
________________________________________________________________________________
3rd Ghana Water Forum, Accra, Ghana, 2011
Water and Sanitation Services Delivery in a Rapidly Changing Urban Environment
Supply Constraints of Utility Water Services to Newly Developing
Private Estates in Accra
Hector Emmanuel Adjetey Boye
________________________________________________________________________________
Abstract The ramifications of the elements of “private, peripheral location and sheer size” of newly
emerging private housing estates in peri-urban areas raise questions concerning availability and
quality of public water services and how these issues are overcome. Against this background, this
paper examines the policies, existing institutional arrangements and constraints associated with
the delivery of water services to newly developing estates in Ghana and to develop
recommendations aimed at addressing the identified bottlenecks. By analyzing the various roles
played by potable water service providers and estate developers, the lack of coordination amongst
and between the various stakeholders in land use and engineering planning for potable water
services in peri-urban regions of Accra and the Ghana Water Company Limited capacity
constraint are identified as key problems. The paper recommends measures to address current
problems associated with public water supply including amongst others the need for regular flow
of information amongst the various stakeholders so that they move in tandem. The
recommendations give some directions for planning, financing, public and/or private provision
and operation of water service infrastructure. The paper particularly recommends promulgation
and enforcement of legislation requiring estate development of peri-urban Accra to be
directionally zoned periodically.
________________________________________________________________________________
Introduction Statement of the Problem
The elements of “private, peripheral location and sheer size” collectively contribute to the
inadequacy of water supply services to estate housing sites. The inadequate capacity of the
government water agencies to service these estates therefore compel tenants and/or developers to
look for alternative arrangements and/or sources of water supply, which sometimes are not of good
quality. Four (4) estates respectively located to the east, north, northwest and west of Accra are
investigated in the light of the afore-mentioned. It is also noted that housing development in Ghana
is bereft of direct guidance through legislation. Indirect guidance has however been provided
through various land laws and planning-related legislation. Some of the policies are: The Town
and Country Planning Ordinance 1945 (Chapter 84); The State Lands Act, 1962 (Act 125); The
State Lands Regulation, 1962 (L.I. 230); The Local Government Act, 1993 (Act 462)
Aim and Objectives
The Ghana Water and Sewerage Corporation (GWSC) was established in 1965 under an Act of
Parliament (Act 310) as a legal public utility entity to (1) provide, distribute, conserve and supply
water in Ghana for public, domestic, commercial and industrial purposes; and (2) establish, operate
and control sewerage systems for such purposes. Under the Statutory Corporations Act (Act 461),

123
which enabled government to convert hitherto public-owned statutory corporations into limited
liability companies in anticipation of privatization, GWSC was renamed the Ghana Water
Company Limited (GWCL) and registered in July 1999. In December 1998 the Community Water
and Sanitation Agency (CWSA) was formed by Act 564 to assist District Assemblies and
communities to provide water supply services to rural and small towns. With the capacity-
constrained GWCL primarily focused on urban areas, a policy gap is indicated for peri-urban
areas. This paper examines the policies, existing institutional arrangements and constraints
associated with the delivery of potable water supply to newly developing estates in Ghana, which
are often situated in peri-urban areas. In specific terms, the paper’s objectives are to:
1. Investigate the processes that estate developers go through to acquire water utility service,
2. Identify the problems associated with the processes,
3. Make recommendations to inform policy formulation in respect of supply of water utility
service for promotion of real estate development.
Application processes, delivery time and the question of shared responsibility amongst the various
parties concerned are investigated. This generally informs recommendations that are made to
enhance collaboration amongst the stakeholders and to reduce the problems associated with water
supply to peri-urban areas.
Key Issues and Challenges There are a number of key development policy issues and challenges associated with appropriate
development of water supply infrastructure in peri-urban areas of Ghana.
1. The primal status of Accra has resulted in the city experiencing urban sprawl in all its major
forms; namely:-
low-density continuous development,
ribbon development and
leap frog development.
2. Whilst institutions involved in water supply arguably have their distinct roles to play in urban
or rural settings, the indication and reality is that there is a problem of poor coordination and
sometimes-conflicting roles in peri-urban areas. This is evidenced for instance by the current
situation where CWSA operates in peri-urban areas to the north of Accra previously served by
GWCL.
3. It is noted that enforcement of existing legislation (Chapter 84) by local authorities could have
provided a platform for the requisite coordination of the various agencies involved. This is
presently lacking, resulting in estate developers accessing land anywhere for development
without considering implications for water utility service.
Analysis of Utility Water Supply Constraints Water Mains Extension Process
Relevant issues pertaining to application and design in the process for supplying water to some
peri-urban locations are indicated in Table 1.
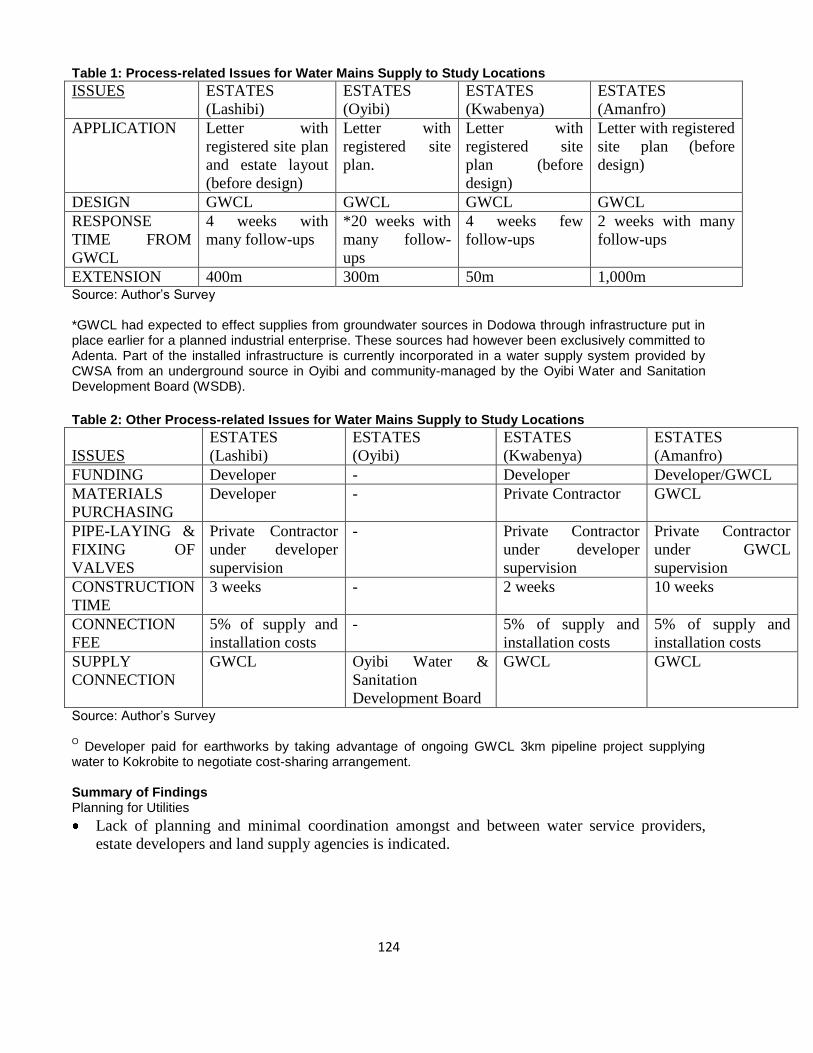
124
Table 1: Process-related Issues for Water Mains Supply to Study Locations
ISSUES ESTATES
(Lashibi)
ESTATES
(Oyibi)
ESTATES
(Kwabenya)
ESTATES
(Amanfro)
APPLICATION Letter with
registered site plan
and estate layout
(before design)
Letter with
registered site
plan.
Letter with
registered site
plan (before
design)
Letter with registered
site plan (before
design)
DESIGN GWCL GWCL GWCL GWCL
RESPONSE
TIME FROM
GWCL
4 weeks with
many follow-ups
*20 weeks with
many follow-
ups
4 weeks few
follow-ups
2 weeks with many
follow-ups
EXTENSION 400m 300m 50m 1,000m Source: Author’s Survey *GWCL had expected to effect supplies from groundwater sources in Dodowa through infrastructure put in place earlier for a planned industrial enterprise. These sources had however been exclusively committed to Adenta. Part of the installed infrastructure is currently incorporated in a water supply system provided by CWSA from an underground source in Oyibi and community-managed by the Oyibi Water and Sanitation Development Board (WSDB).
Table 2: Other Process-related Issues for Water Mains Supply to Study Locations
ISSUES
ESTATES
(Lashibi)
ESTATES
(Oyibi)
ESTATES
(Kwabenya)
ESTATES
(Amanfro)
FUNDING Developer - Developer Developer/GWCL
MATERIALS
PURCHASING
Developer - Private Contractor GWCL
PIPE-LAYING &
FIXING OF
VALVES
Private Contractor
under developer
supervision
- Private Contractor
under developer
supervision
Private Contractor
under GWCL
supervision
CONSTRUCTION
TIME
3 weeks - 2 weeks 10 weeks
CONNECTION
FEE
5% of supply and
installation costs
- 5% of supply and
installation costs
5% of supply and
installation costs
SUPPLY
CONNECTION
GWCL Oyibi Water &
Sanitation
Development Board
GWCL GWCL
Source: Author’s Survey O Developer paid for earthworks by taking advantage of ongoing GWCL 3km pipeline project supplying
water to Kokrobite to negotiate cost-sharing arrangement. Summary of Findings Planning for Utilities
Lack of planning and minimal coordination amongst and between water service providers,
estate developers and land supply agencies is indicated.

125
Key Water Supply Issues/Problems
The key problem for water supply to newly developing estates in Accra stems from the GWCL
capacity constraint. Groundwater supplies appeared to be the most viable alternative available
to private developers.
Operational conflicts between GWCL and CWSA exist in certain peri-urban areas.
Mobilising funds for the huge capital outlay involved for water supply in site and services
schemes in which housing utility infrastructure is installed prior to actual building of houses, is
difficult for developers; who are likely to immediately bear all physical infrastructure
extension costs prior to transferring the costs to house buyers.
Related Issues
Private estate developers, in supplying and installing water mains infrastructure to their peri-
urban housing sites also tend to be at the forefront of acquisition of land and compensation for
the required right-of- way for mains extensions through undeveloped lands. In taking-over
developer-installed physical infrastructure for service operations, the water utilities do not
coordinate with the land agencies to secure and protect the previously acquired rights-of-way.
Recommendations and Conclusions Recommendations
In the light of the key findings, some recommendations are suggested at two levels.
Short-Term Proposals to Address Water Supply Problems Estate Developers
Developers should endeavour to ensure that private design consultants take cognizance of the
spatial variations in the supply constraint of GWCL water in and around Accra.
Developers should be made aware of the need to involve the Water Resources Commission in
any plans for groundwater abstraction.
Service Providers
GWCL must increase its water supply capacity and introduce electronic operations in
distribution.
Government needs to immediately address the policy gap in water supply operations in peri-
urban areas.
Long-Term Proposals to Address Water Supply Problems Planning and Financing
Physical plans of the metropolis ought to be updated for subsequent harmonization with Master
Plans of utility water agencies.
There should be promulgation and enforcement of legislation requiring estate development of
peri-urban Accra to be directionally zoned periodically.
126
Collaboration between water utilities and private sector organizations such as estate developers
should be better promoted. The Ministry of Water Resources, Works and Housing should
create a Department of Private Estate Development under which GREDA could be promoted
as a public-private partnership and made to collaborate with the District and/or Municipal
Assemblies.
Provision of Infrastructure
Limited liability companies formed through partnerships with the utilities should be made
responsible for the entire process of providing service to newly developing estates
commencing with planning, through financing, installation, operation and maintenance. Service Operations
Developers should be encouraged with long-term financing and management arrangements to
collaborate with trained and certified contractors for dedicated services (bulk supply) and
associated water utilities management (operation and maintenance) within their estates.
Studies must be concluded on the effect of private finance of public water utility network
extensions on tariffs and in fairness any rebates ought to be credited to house owners and/or
residents. This exercise should be spearheaded by the PURC.
Modern technology such as Geographic Information Systems and Remote Sensing Service
operations should be introduced into monitoring and supervision of water service networks. Conclusion
A coordination problem was identified as key in planning for public water utilities as well as for
adequate designs for water supply to peri-urban Accra. There is also a policy gap in water service
delivery to peri-urban communities. In order to market their estates however, developers go to
great lengths to service their estates with water supply resulting in increased housing delivery
costs, but oblivious to buyers. The price quoted by the developer includes exhorbitant costs
incurred for ensuring utility water provision.
In the short term, through planning, the water utilities are advised to enhance their operational
efficiencies with modern technology whilst government is advised to bridge the policy gap in
water service delivery in peri-urban areas. In the long-term, legislation to geographically and
cardinally direct spatial development is recommended along with creation in the Ministry of Water
Resources, Works and Housing, a Department of Private Estate Development under which
GREDA could be promoted as a public-private partnership entity.
_______________________________________________________________________________
Acknowledgement Prof. S. K. Afrane of the Kwame Nkrumah University of Science and Technology (KNUST). His
outstanding and constructive suggestions gave meaning to the original work.
________________________________________________________________________________
Reference 1. Boye, H. E. A. (2006): Supply Constraints of Utility Services to Newly-Developing Private
Estates in Accra, An unpublished M. Sc Thesis, Department of Planning, KNUST.

127
________________________________________________________________________________
Contact Details Hector Boye
PRAEKT Limited
P. O. Box MB469
Accra
Tel: 0244888015
_______________________________________________________________________________
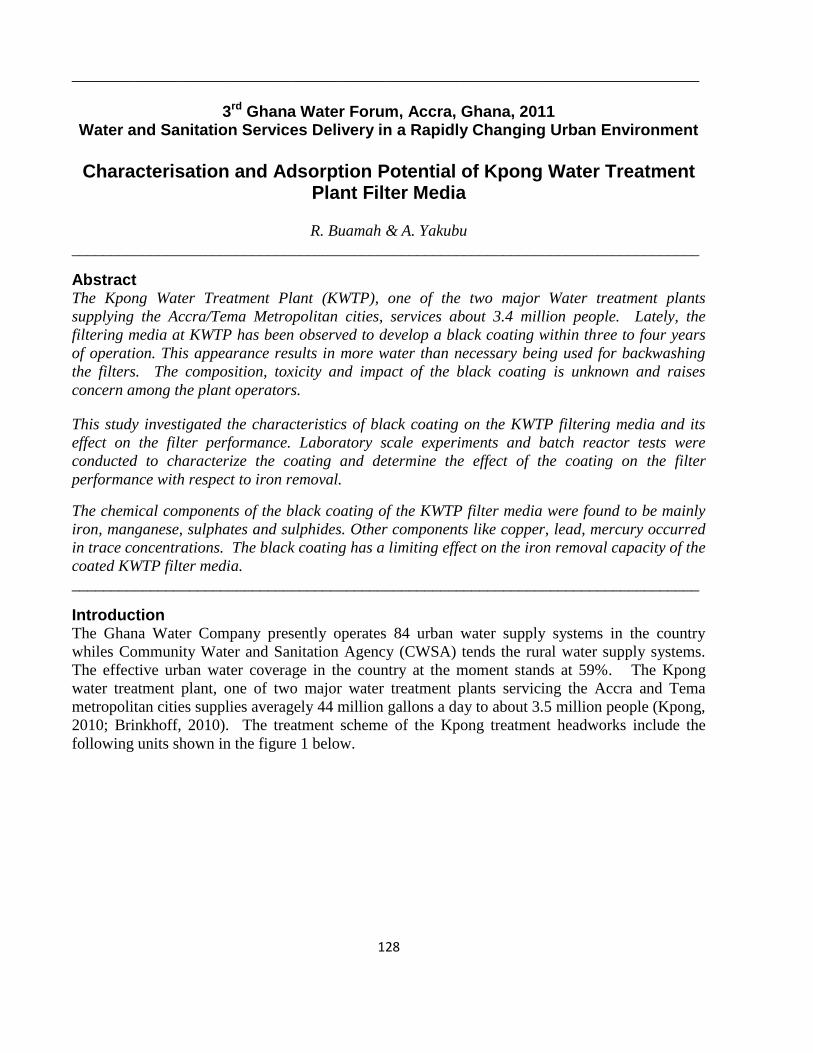
128
________________________________________________________________________________
3rd Ghana Water Forum, Accra, Ghana, 2011
Water and Sanitation Services Delivery in a Rapidly Changing Urban Environment
Characterisation and Adsorption Potential of Kpong Water Treatment
Plant Filter Media
R. Buamah & A. Yakubu
________________________________________________________________________________
Abstract The Kpong Water Treatment Plant (KWTP), one of the two major Water treatment plants
supplying the Accra/Tema Metropolitan cities, services about 3.4 million people. Lately, the
filtering media at KWTP has been observed to develop a black coating within three to four years
of operation. This appearance results in more water than necessary being used for backwashing
the filters. The composition, toxicity and impact of the black coating is unknown and raises
concern among the plant operators.
This study investigated the characteristics of black coating on the KWTP filtering media and its
effect on the filter performance. Laboratory scale experiments and batch reactor tests were
conducted to characterize the coating and determine the effect of the coating on the filter
performance with respect to iron removal.
The chemical components of the black coating of the KWTP filter media were found to be mainly
iron, manganese, sulphates and sulphides. Other components like copper, lead, mercury occurred
in trace concentrations. The black coating has a limiting effect on the iron removal capacity of the
coated KWTP filter media.
________________________________________________________________________________
Introduction The Ghana Water Company presently operates 84 urban water supply systems in the country
whiles Community Water and Sanitation Agency (CWSA) tends the rural water supply systems.
The effective urban water coverage in the country at the moment stands at 59%. The Kpong
water treatment plant, one of two major water treatment plants servicing the Accra and Tema
metropolitan cities supplies averagely 44 million gallons a day to about 3.5 million people (Kpong,
2010; Brinkhoff, 2010). The treatment scheme of the Kpong treatment headworks include the
following units shown in the figure 1 below.
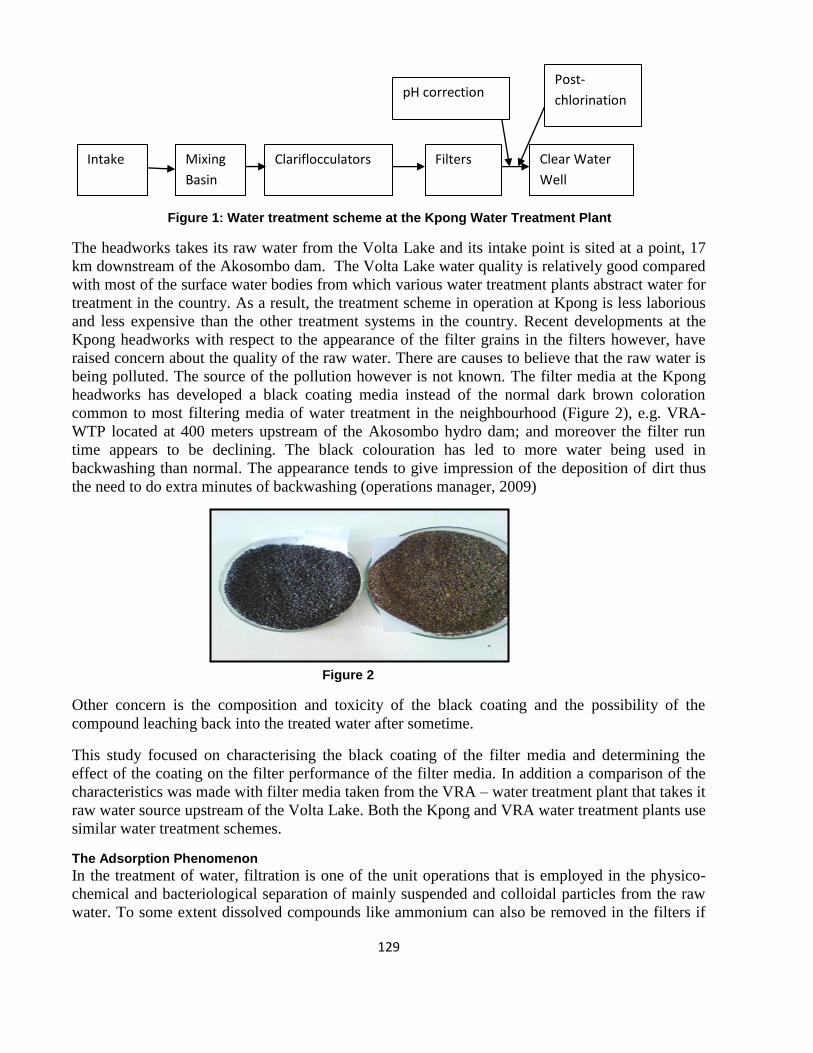
129
Figure 1: Water treatment scheme at the Kpong Water Treatment Plant
The headworks takes its raw water from the Volta Lake and its intake point is sited at a point, 17
km downstream of the Akosombo dam. The Volta Lake water quality is relatively good compared
with most of the surface water bodies from which various water treatment plants abstract water for
treatment in the country. As a result, the treatment scheme in operation at Kpong is less laborious
and less expensive than the other treatment systems in the country. Recent developments at the
Kpong headworks with respect to the appearance of the filter grains in the filters however, have
raised concern about the quality of the raw water. There are causes to believe that the raw water is
being polluted. The source of the pollution however is not known. The filter media at the Kpong
headworks has developed a black coating media instead of the normal dark brown coloration
common to most filtering media of water treatment in the neighbourhood (Figure 2), e.g. VRA-
WTP located at 400 meters upstream of the Akosombo hydro dam; and moreover the filter run
time appears to be declining. The black colouration has led to more water being used in
backwashing than normal. The appearance tends to give impression of the deposition of dirt thus
the need to do extra minutes of backwashing (operations manager, 2009)
Figure 2
Other concern is the composition and toxicity of the black coating and the possibility of the
compound leaching back into the treated water after sometime.
This study focused on characterising the black coating of the filter media and determining the
effect of the coating on the filter performance of the filter media. In addition a comparison of the
characteristics was made with filter media taken from the VRA – water treatment plant that takes it
raw water source upstream of the Volta Lake. Both the Kpong and VRA water treatment plants use
similar water treatment schemes.
The Adsorption Phenomenon
In the treatment of water, filtration is one of the unit operations that is employed in the physico-
chemical and bacteriological separation of mainly suspended and colloidal particles from the raw
water. To some extent dissolved compounds like ammonium can also be removed in the filters if
Mixing
Basin
Clariflocculators Filters Clear Water
Well
Intake
pH correction Post-
chlorination
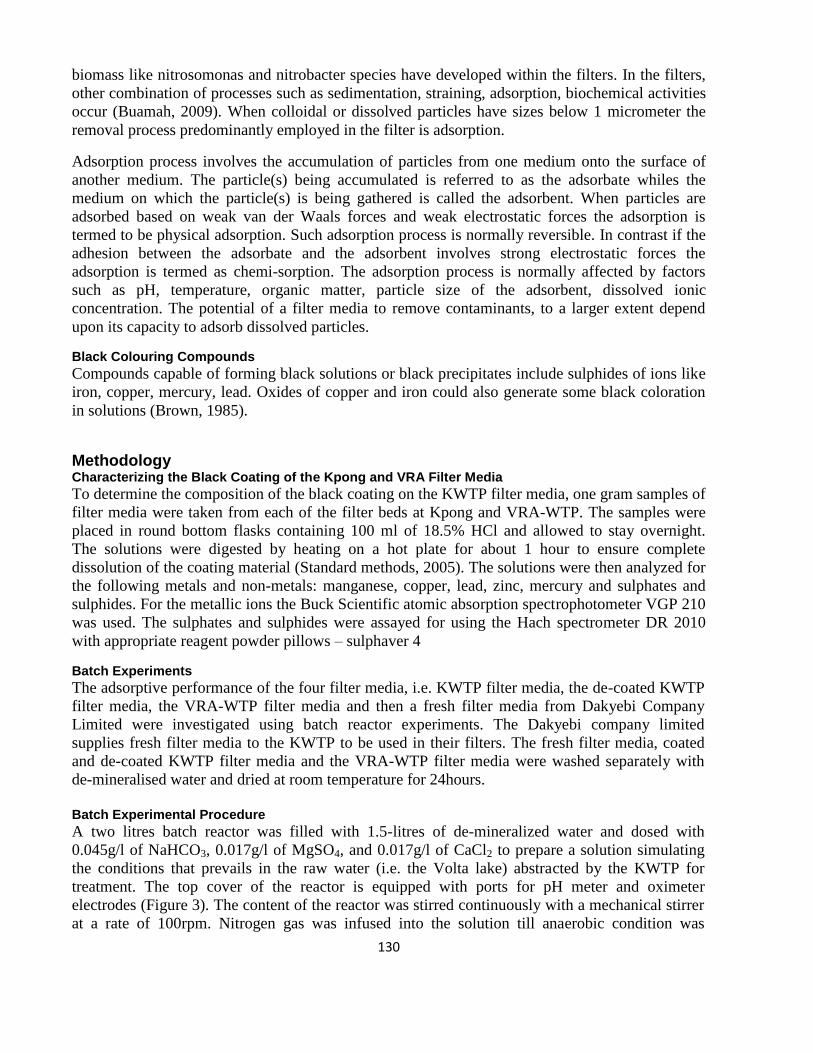
130
biomass like nitrosomonas and nitrobacter species have developed within the filters. In the filters,
other combination of processes such as sedimentation, straining, adsorption, biochemical activities
occur (Buamah, 2009). When colloidal or dissolved particles have sizes below 1 micrometer the
removal process predominantly employed in the filter is adsorption.
Adsorption process involves the accumulation of particles from one medium onto the surface of
another medium. The particle(s) being accumulated is referred to as the adsorbate whiles the
medium on which the particle(s) is being gathered is called the adsorbent. When particles are
adsorbed based on weak van der Waals forces and weak electrostatic forces the adsorption is
termed to be physical adsorption. Such adsorption process is normally reversible. In contrast if the
adhesion between the adsorbate and the adsorbent involves strong electrostatic forces the
adsorption is termed as chemi-sorption. The adsorption process is normally affected by factors
such as pH, temperature, organic matter, particle size of the adsorbent, dissolved ionic
concentration. The potential of a filter media to remove contaminants, to a larger extent depend
upon its capacity to adsorb dissolved particles.
Black Colouring Compounds
Compounds capable of forming black solutions or black precipitates include sulphides of ions like
iron, copper, mercury, lead. Oxides of copper and iron could also generate some black coloration
in solutions (Brown, 1985).
Methodology Characterizing the Black Coating of the Kpong and VRA Filter Media
To determine the composition of the black coating on the KWTP filter media, one gram samples of
filter media were taken from each of the filter beds at Kpong and VRA-WTP. The samples were
placed in round bottom flasks containing 100 ml of 18.5% HCl and allowed to stay overnight.
The solutions were digested by heating on a hot plate for about 1 hour to ensure complete
dissolution of the coating material (Standard methods, 2005). The solutions were then analyzed for
the following metals and non-metals: manganese, copper, lead, zinc, mercury and sulphates and
sulphides. For the metallic ions the Buck Scientific atomic absorption spectrophotometer VGP 210
was used. The sulphates and sulphides were assayed for using the Hach spectrometer DR 2010
with appropriate reagent powder pillows – sulphaver 4
Batch Experiments
The adsorptive performance of the four filter media, i.e. KWTP filter media, the de-coated KWTP
filter media, the VRA-WTP filter media and then a fresh filter media from Dakyebi Company
Limited were investigated using batch reactor experiments. The Dakyebi company limited
supplies fresh filter media to the KWTP to be used in their filters. The fresh filter media, coated
and de-coated KWTP filter media and the VRA-WTP filter media were washed separately with
de-mineralised water and dried at room temperature for 24hours.
Batch Experimental Procedure
A two litres batch reactor was filled with 1.5-litres of de-mineralized water and dosed with
0.045g/l of NaHCO3, 0.017g/l of MgSO4, and 0.017g/l of CaCl2 to prepare a solution simulating
the conditions that prevails in the raw water (i.e. the Volta lake) abstracted by the KWTP for
treatment. The top cover of the reactor is equipped with ports for pH meter and oximeter
electrodes (Figure 3). The content of the reactor was stirred continuously with a mechanical stirrer
at a rate of 100rpm. Nitrogen gas was infused into the solution till anaerobic condition was

131
obtained. The pH of the solution was adjusted by infusing carbon dioxide gas to 6.9 ± 0.1 (pH of
the Volta Lake). Iron was then dosed to obtain a 0.2mgFe2+
/l solution; and stirred continuously for
15 minutes to ensure complete mixing.
Fifteen millilitre of the solution was fetched from the reactor and immediately acidified with
hydrochloric acid (time zero sample). This was followed immediately by the addition of 1.0g of
the coated filter media. Water samples (10 ml) of the solution were withdrawn at: 15min, 30min,
1hr, 2hr, 4hr, 6hr, 8hrand 12h; acidified with hydrochloric acid and their respective iron(II)
concentration determined using Buick Scientific Atomic Absorption Spectrophotometer. The
experiment was repeated for the de-coated KWTP filter media and the VRA-WTP filter media.
Figure 3: Batch Experiment set up
Results and Discussions Chemical Composition of the Black Coating
The Table 1 below shows the average values obtained for the constituents of the outer coating of
the various filter media after the characterization experiments.
Table1: Results of analyses of filter media coating
Parameter VRA WTP (mg/g) Kpong WTP (mg/g) Increasing factor
Iron 2.71 5.96 2 times
Manganese 0.12 2.06 17 times
Copper 0.12 0.32 3 times
Zinc 0.002 0.02 10 times
Mercury 0.00001 0.00024 24 times
Lead 0.02 0.03 -
Sulphide 0.00010 0.0005 5 times
Sulphate 0.00704 0.00798 -
CO2 infusion
N2 infusion stirrer
pH meter
Oximeter
Filter media

132
All the ions analysed for were higher in the coating of KWTP filter media than in the VRA WTP
filter media. The predominant metals present were found to be iron and manganese. In terms of
magnitude the iron occurrence was higher but the remarkable feature is the tremendous increase in
the amount of manganese on the KWTP filter media. This is an indication that activities occurring
within the lake at the area stretching from the location of the VRA-WTP to the KWTP contribute
appreciable amount of manganese to the lake. With the high concentrations of the sulphides
recorded (Table 1), it shows that most of the black coating material is predominantly manganese
sulphides. Iron sulphate and / or sulphides may also be present. These results point to the fact that
there may be sources of these contaminants other than the raw water from the Volta Lake, thus the
need to analyse the discharges from the riparian industries. Mercury was found in trace quantities
however the sharp increase observed for the KWTP filter media raises concern about the source
and the need to trace it. Mercury is toxic and noted for bioaccumulation in aquatic species.
In the case of the anions, sulphate happens to be higher in concentration compared with the
sulphide. It can be inferred that the sulphide interacts with the iron or the manganese to get it
oxidized to the sulphate. Iron oxide and manganese oxides are known potential catalyst (Buamah
et al., 2009).
Adsorption of Iron by Filter Media
To investigate the iron removal potential of the black coated filter media of KWTP, laboratory
scale experiments were conducted using model water dosed with 0.2mg Fe2+
/L at a pH 6.9 (Figure
2). The experiment was conducted using four different filter media (i.e. black coated, de-coated,
fresh and VRA WTP filter media). From Figure 4, the Fe2+
adsorption trends of the coated, de-
coated fresh and VRA filter media indicate the VRA filter media having the highest iron (II)
adsorption capacity within the tested period of 12 hours (i.e. 720 minutes). The de-coated filter
media had the least adsorption capacity. All things being equal, the KWTP filter media having
been in use for about fifteen years now, was expected to exhibit a higher adsorption capacity than
VRA filter media, which has been in use for only ten years. Generally, filters that have been in
operation for longer periods do have denser coating material on the sand grains and higher
occurrence of iron oxides in the coating. The iron oxides enhance the adsorption capacity of the
sand grains for iron (II) in the raw water. A higher adsorption capacity exhibited by the VRA filter
media is an indication that the black coating on the KWTP is limiting the full adsorption potential
of the coated filter media. The VRA filter media, although fed with the same source is not coated
black.

133
Figure 4: Performance of the various filter media in iron (II) adsorption at pH 6.9
Conclusions 1. The chemical components of the black coating of the Kpong filter media are mainly iron,
manganese, sulphates and sulphides. Other components like copper, lead, mercury occurred in
trace concentrations.
2. The blackening of the filter media at KWTP is probably due to manganese and iron sulphates
or sulphides. Iron oxides may also be a contributory factor.
3. The black coating is limiting iron removal capacity of the Kpong filter media.
Recommendations 1. Discharges from riparian industries and communities located within the area between the
VRA-WTP and KWTP must be sampled to trace the source of the manganese, iron, sulphate or
sulphide and mercury that eventually coats the KWTP filter media.
2. Further works using columns must be carried out to determine the effect of the coating on the
filter run time.
0
0.05
0.1
0.15
0.2
0.25
0 15 30 60 120 240 360 480 720 Co
nce
ntr
atio
n o
f Ir
on
II (
mg/
L)
Time (min) Coated filter media Decoated filter media
Fresh filter media VRA filter media
134
_______________________________________________________________________________
References 1. Brinkhoff, T. (2010) City Population: http://www.citypopulation.de [Last accessed: 12/2/2011]
2. Brown, G. I. (1985). Introduction to Inorganic Chemistry, 2nd
edition, Longman group UK Ltd.
pp. 290 – 286.
3. Buamah, R. (2009). Adsorptive removal of Manganese, arsenic and iron from groundwater.
PhD Thesis. UNESCO-IHE, Institute for water education. CRC Press / Balkema; Leiden, The
Netherlands. www.crcpress.com; www.taylorandfrancis.co.uk pp 57 – 75
4. Buamah, R.; Petrusevski, B. and Schippers J.C. (2008). Oxidation of adsorbed ferrous and
manganese: kinetics and influence of process conditions. In: Proceedings of the UCOWR/
NIWR Conference at North Carolina, Durham (U. S. A). 21- 23 July, 2008.
5. Kpong, W.T.P. (2010) Monthly Production Report. Kpong Water Treatment Plant, Ghana
Water Company Limited
6. Standard methods for the examination of water and wastewater (2005). American Public
Health Association / American Water Works Association / Water Environment Federation,
Washington DC.
_______________________________________________________________________________
Keywords Black coated media, adsorption, filter
_______________________________________________________________________________

135
_______________________________________________________________________________
3rd Ghana Water Forum, Accra, Ghana, 2011 Water and Sanitation Services Delivery in a Rapidly Changing Urban Environment
Comparative Study of the Physico-Chemical and Bacteriological Quality of Drinking Water in Kumasi and Ho Metropolitan Areas
Philip Dwamena-Boateng, Bright Kofi Bansah, Oppong Manu Michael & Raphael K .Klake
_______________________________________________________________________
Abstract Physico-Chemical and Bacteriological analyses were performed on water supplied by Ghana
Water Company Limited (GWCL) in Ho and Kumasi, water stored in Tanks in the Ho
Municipality, and Commercial Drinking water (sachet and bottled waters) from various
manufacturers. The results were compared with Ghana Drinking Water Standards (GDWS) and
WHO Guideline values to ascertain whether they meet the above guideline values and also to find
out if they differ from each other. The Commercial drinking waters and GWCL water quality were
found to be within the GDWS and WHO guideline values and therefore suitable for drinking. The
quality of the water from storage tanks depended on whether the tanks were covered or not. For
the tanks that were covered, the water quality compared with the GWCL water was of suitable
quality for drinking. For tanks that were not covered, there were colour, turbidity problems and
bacteriological contamination. This deterioration in quality can be attributed to irregular or no
cleaning of tanks and improper maintenance.
________________________________________________________________________________
Introduction The main purpose of the study is to ascertain the claims by some consumers that water supplied by
GWCL is of poorer quality as compared with bottled and sachet waters and to investigate the
source of any possible contamination.
To achieve the purpose of the study, the following specific objectives were pursued.
i. To conduct quality analysis on GWCL treated water samples, water from GWCL
distribution systems and water from overhead storage tanks as well as Commercial
drinking waters (Sachet and bottled water).
ii. To compare the results with Ghana Drinking Water Standards and WHO guideline values.
iii. To verify whether there is contamination in any of the sources and recommend solutions.
The essence of this project is to help ensure and maintain consumer confidence and improve
storage services. Currently, the use of overhead storage tanks is inevitable due to intermittent
supply of water to the consumers.
136
Methodology Sampling Points
In all, fifteen (15) samples were taken from the various overhead storage tanks; thus the Ho-
Polytechnic (central Hall and main entrance house 2), Residency (1,3,5,7,10), lands commission
office, OLA HSE 1, OLA HSE2, Regional Hospital Gate, Nurses training school, Mawuli S.H.S,
Mawuko Girls (hostel), Corn oil filling station, eleven (11) bottled water samples, ten (10) sachet
water samples as well as GWCL treated water samples from Ho and Kumasi.
Sampling Procedure
For the physico-chemical analysis, 1-Litre plastic containers were used. Before filling, each
container was rinsed three times with the sample of water to be taken. The pH was measured in the
field. Samples for bacteriological analysis were however taken in polypropylene bottles. All
samples analyses were performed within 24 hours.
Analyses of Samples Physico-chemistry: pH was measured with the Horiba Compact B-122 and Inolab 7300
Conductivity/TDS portable meters. Colour, turbidity and total iron were also measured by
spectrophotometry using Hach DR/2500 following Standard Methods (APHA, 1998). Alkalinity
and chloride were performed by Titration Methods (APHA, 1998).
Bacteriology: Faecal coliform (E-coli) was measured with the traditional Multiple Tube
Fermentation method proposed in Standard Methods (APHA, 1998). All equipments used were
first pre-sterilised using an autoclave and 95% ethanol.
Discussion The results of the physico-chemical and bacteriological analyses are shown in Tables 1, 2 and 3.
pH
The pH of Ghana Water Company Water from Ho and Kumasi and all the water from the storage
tanks as well as the sachet water were all within the GDWS and WHO guideline values. However,
some bottled water samples (Amrita, Everpure, Adeshe Nsuo and Icecool) showed pH levels
below the above standards.
Turbidity
All the water samples showed turbidity of zero with some stored water samples showing turbidities
of 0.2 and 0.3 NTU. Overall, all showed turbidity values below the guideline value.
Colour
All the water samples showed colour of zero with some stored water samples showing colour of 8
and 7 Pt.CO which are above the GDWS but below the WHO guideline value.
Total Iron
The GWCL water and all the Commercial drinking water samples showed values below the
GDWS and WHO guideline value. The total iron values were also low for stored water with the
exception of site NA1 which is a partially covered tank and PH2 which is uncovered. This is
probably due to the fact that the two tanks are galvanized and have corroded.

137
Bacteriology
The study indicated that there was no bacteriological contamination (faecal coliform or E. coli) in
the selected brands of bottled water, sachet and tap water per every 100 ml analyzed.
However the partially covered and uncovered sources showed high faecal counts. This can be
attributed to contamination due to exposure.
Conclusions and Recommendations
Results obtained from the analysis show that all the Sachet, bottled and GWCL waters were
within the guideline values.
The iron levels in some of the stored water were higher than the guideline values and this has
been attributed to the make of the tanks (galvanized).
Faecal contamination was only found in uncovered and partially covered storage tanks which
is as a result of contamination through exposure.
Lessons Learnt
The quality of GWCL treated waters from Ho and Kumasi if taken directly from the taps is
comparable to the Commercial Drinking water in both physic-chemical and bacteriological
quality.
Contamination of GWCL waters normally takes place when the storage tank is partially
covered or uncovered.
The chemical composition of the material used in storing water has direct impact on the quality
of the water that is being stored.
Proper handling and maintenance of storage tanks can help in preserving the quality of water
stored in them.
Recommendations
More extensive surveillance of bottled and Sachet water industries and more stringent
regulations should be developed.
The Food and Drugs Board (FDB) of Ghana, as the regulatory authority should insist on
official registration of all producers of Sachet and bottled water.
Routine tests should be conducted on these products and consumers alerted about those
products that are unwholesome.
Workshops should be conducted to educate producers and vendors on how to maintain quality.
Overhead storage tanks must have tight covers to prevent contamination.
GWCL should educate consumers on the proper maintenance and inspection of their overhead
storage tanks to avoid contamination.

138
GWCL should encourage the consumer to do regular cleaning and disinfection of overhead
storage tanks.
________________________________________________________________________________
References 1. American Public Health Association, American Waterworks Association Water Environment
Federation. Standard Methods for the examination of water and wastewater 20th
Edition,
Washington D.C., (1998).
2. The American Water Associations Inc: Water Quality and Treatment, 3rd
Edition, McGraw-
Hill Inc., New York(1971), pg 607-609
3. Helfrid. M.A., et al., Chemical drinking water quality in Ghana: Water costs and Scope for
advanced treatment,doi: 10.106/j.scitotenv.2010.01.053.
4. Mahmoud A. Saleh., Emmanuel Ewane., et al., Chemical Evaluation of commercial Drinking
Water fom Egypt: Jounal of Food Composition And Analysis (2001) 14, 127- 152: doi,
10.006/jfca.2000.0858. htt://www.idealibrary.com.
5. Addo, K. K., Mensah, G. I., et al., Bacteriological Quality of Sachet Water Produced and Sold
in Teshie – Nungua Suburb of Accra, Ghana (July 1 2009). African Journal of Food,
Agriculture, Nutrition and Development, 6GHAN.
6. Peter H. Gleick., Bottled and Sold: The Story Behind Our Obsession with bottled Water, Island
Press, DC, Published 2010.
htt://en.wikipedia.org/wiki/Bottled_water#mw-head.
________________________________________________________________________________
Contact Details Philip Dwamena-Boateng
Ghana Water Company Ltd
Ho, Ghana
Tel: 0244 787794
Email: [email protected]
Bright Kofi Bansah, Oppong Manu Michael
Chemistry Dept.
University of Cape Coast
Raphael K. Klake
Chemistry Dept.
University of Ghana
Legon, Ghana
Tel: 0207523076
Email: [email protected]
_______________________________________________________________________________

139
Table 1: Physico-chemical and bacteriological results of sachet drinking water.
Parameter Tap Water
(Ho)
Tap Water
(Kumasi)
Woezor I am Ok Mount Zion Eli Medels Constant Sela Hydroplus Kristar Rose GDWS WHO
pH 7.4 7 7.4 7.2 7.5 7.2 6.7 7.6 8.2 7.2 8.2 7.3 6.5-8.5 6.5-8.5
Turbidity
(NTU)
0 0 0 0 0 0 0 0 0 0 0 0 5 5
Colour (Pt.Co) 0 0 0 0 0 0 0 0 0 0 0 0 5 15
Total Iron mg/L 0 0 0 0 0 0 0 0 0 0 0 0 0.3 0.3
Faecal Coliform
(MPN/100ml)
0 0 0 0 0 0 0 0 0 0 0 0 0 0
Table 2: Physico-chemical and bacteriological results of bottled drinking water.
Parameter Tap
Water
(Ho)
Tap
Water
(Kumasi)
Mobile
Water
Amrita Grafton Everpure Aquasplash Ecospa Voltic Adeshe Safina Aqua
fill
Icecool GDWS WHO
Nsuo
pH 7.4 7 6.5 6.1 6.5 6.1 6.3 6.7 6.7 6 6.8 6.9 6.1 6.5-8.5 6.5-
8.5
Turbidity (NTU) 0 0 0 0 0 0 0 0 0 0 0 0 0 5 5
Colour (Pt.Co) 0 0 0 0 0 0 0 0 0 0 0 0 0 5 15
Total Iron mg/L 0 0 0.01 0 0 0.01 0.01 0 0 0 0.01 0.01 0.01 0.3 0.3
Faecal Coliform
(MPN/100ml)
0 0 0 0 0 0 0 0 0 0 0 0 0 0 0
Table 3: Physico-chemical and bacteriological results of stored drinking water.
Parameter Tap
Water
(Ho)
Tap
Water
(Kumasi)
CO R1 R3
(PC)
R5
(C)
R7 R10 OH1
(PC)
OH2
(U)
RHG
(PC)
NST
(C)
PC PH2 MSH MG LCO GDWS WHO
(C) ( C) (C) (C) (C) (G) (PC) (U) (C)
GALV.
pH 7.4 7 7.2 7 7.1 7 7.1 7.1 6.5 7.2 7 7.1 7 7.2 6.9 8.5 7 6.5-8.5 6.5-
8.5
Turbidity
(NTU)
0 0 0 0 0 0 0 0.2 0 0 0 0 0 0.3 0 0 0 5 5
Colour (Pt.Co) 0 0 0 0 0 0 4 8 0 0 0 0 0 7 0 0 0 5 15
Total Iron
mg/L
0 0 0.02 0.03 0.03 0.02 0.03 0.4 0.35 0.03 0.03 0.02 0.0
1
0.45 0.02 0.0
3
0.03 0.3 0.3
Faecal
Coliform
(MPN/100ml)
0 0 0 0 5.1 0 0 >16 9.2 0 5.1 0 0 >16 2.2 2.2 0 0 0

140
_____________________________________________________________________________________
3rd Ghana Water Forum, Accra, Ghana, 2011
Water and Sanitation Services Delivery in a Rapidly Changing Urban Environment
Evaluating the Implications of Future Water Resource Development under Current and Projected Climate in the Volta Basin
Gerald Forkuor, Matthew McCartney & Barnabas Amisigo
_____________________________________________________________________________________
Abstract This study combines climate change (CC), hydrological and water resource evaluation models to assess
the impact of one downscaled mid-range CC scenario (A1B) on the performance of existing and planned
irrigation and hydropower schemes in the Volta basin. The models were run (1983-2100) to simulate the
CC scenario in combination with three development scenarios, each reflecting different levels of water
resource development in the basin. Results indicate a general trend of declining rainfall and increasing
potential evapotranspiration in the basin. This trend was found to have caused: i) a significant reduction
in flows at key stream gauge locations; ii) an increase in average basin-wide per hectare irrigation
requirement and iii) a significant reduction in the percentage of the potential hydropower that could be
generated in the basin. This has the tendency to undermine the economic development of the riparian
countries unless due consideration is given to these impacts and suitable adaptation measures
introduced.
_____________________________________________________________________________________
Introduction The Volta basin is an important source of water for the inhabitants of the six riparian countries it drains.
It plays a vital role in the economic prosperity of the people. Agriculture, which employs majority of the
basin’s inhabitant and generates about 40% of the basin’s economic output, is heavily reliant on it
(Biney, 2010). Water is also used to generate cheap hydropower which supports major industries (i.e.
mining, aluminium, etc.) in Ghana and is also exported to neighbouring countries (Owusu et al. 2008).
Other uses include livestock rearing, fisheries, recreation and tourism.
Water resources in the basin have come under increasing pressure in recent years. Massive population
growth in the two main countries - Ghana and Burkina Faso – has resulted in larger abstractions to meet
increasing demand (Van de Giesen et al., 2001). The basin’s population is projected to reach 34million
in 2025, up from 18.6 in 2000 (Biney, 2010). Despite the existing pressure on the resource, there are
plans to build more dams to increase electricity production and expand irrigation in the basin. In
addition, CC and the uncertainty associated with it, will further complicate the management of the
basin’s water resources. Signs of a probable CC (i.e. shorter rainy seasons and increased temperature),
which could have dire consequences for future development in the basin, have been reported (Jung and
Kunstmann, 2007).
Previous studies have assessed the implications of CC and the ongoing development of dams/reservoirs
on the water resources in the basin (e.g. Andah et al. 2004; de Condappa et al., 2009). It has been
predicted that CC similar to that which has been observed in recent years will have a greater impact on

141
Lake Volta than the continued construction of small reservoirs in the upstream portion of the basin (de
Condappa et al., 2009).
This paper reports the findings of research conducted to determine the impact of one specific CC
scenario on the performance of existing and planned irrigation and hydropower schemes in the Volta
basin. The scenario selected for analyses was the IPCC SRES-AR4 A1B emissions scenario. This
scenario is distinguished from other scenarios by the technological emphasis on a balance between fossil
intensive and non-fossil energy sources (IPCC, 2000). The research was conducted by combining CC,
hydrological and water resource evaluation models. Simulations were conducted between the period
1983 and 2100. In order to systematically assess the impact of growing water demand on the basin’s
water resources, three development scenarios were identified and modelled:
Current Development – this simulated present water withdrawals/demand. Irrigation and
hydropower schemes in this scenario were the ones that are currently operating.
Intermediate Development – this simulated possible expansion of existing irrigation schemes as well
as new hydropower and irrigation schemes that are likely to come on line by approximately 2025.
Full Development – this simulated expansion of the near-future schemes and additional new
schemes that may come on line by 2050.
Study Area The Volta Basin is drained by four major river systems: the Black (147,000km
2), White (106,000km
2),
Oti (72,000km2) and Lower Volta (73,000km
2) systems (Figure 1). The total annual runoff is estimated
to be 40.4 Bm3 (Andah et al. 2004). Climatically, the southern part of the basin is tropical, with a bi-
modal rainfall distribution that reaches about 1500mmy-1
. The northern part has a semi-arid climate with
a uni-modal distribution of about 500mmy-1
. The amount and distribution of rainfall varies significantly
from year to year and also seasonally (van de Giesen et al. 2001).

142
Figure 1: Volta Basin showing hydropower and irrigation demand points
Current Water Resource Development The most significant development in the basin so far is the construction of the Akosombo dam on Lake
Volta primarily for hydropower production. The Lake reservoir has a surface area of 8,500km2, an
average depth of 18.8m and a storage capacity of 148 Bm3 (Barry et al. 2005). Current installed
generating capacity is 1,020 MW. Other hydropower stations are Kompienga and Bagre in Burkina Faso
which have total volumes of 2.03 Bm3 and 1.7 Bm
3 and installed generating capacities of 14 MW and 10
MW respectively.
A number of small, medium and large reservoirs have been constructed in the basin primarily for
irrigation. The total storage volume of these reservoirs (excluding the hydropower schemes) is about 1.4
Bm3.
These are mainly formal irrigation schemes. Total area under these formal schemes is 30,500 ha.
Informal irrigation practice is widespread, but information on it is scanty despite attempts to compile it
(Drechsel et al. 2006).
Future Water Resource Development Major developments planned for the basin focus primarily on hydropower generation and irrigation
development. In Ghana, for instance, the Volta River Authority has identified potential sites for
hydropower generation in the Black and White Volta as well as the Oti (Figure 1). All together, these
planned schemes, including the Bui scheme which is currently under construction, will have a
generating capacity of approximately 900MW. At the time of writing, information on similar planned
schemes in the other riparian countries were not available.

143
Expansion in the irrigated area of existing schemes and construction of new ones is expected to increase
irrigated area in the basin by close to 33,000 ha. This includes 30,000 ha of irrigation under the Bui
scheme. The Ghana Irrigation Development Authority (GIDA) plans to develop an additional 22,590 ha
of small or micro scale irrigation and drainage schemes within five years in five regions of Ghana
(including the three northern regions). Again, information on future irrigation development in Burkina
Faso was not readily available.
Method In this study, the Water Evaluation and Planning System (WEAP) was used to evaluate the effects of CC
on water resources in the face of increasing water demand for irrigation, domestic and hydropower
generation in the Volta basin. Modelling was performed in 18 sub-basins. The Soil and Water
Assessment Tool (SWAT) was used to simulate flows (supply resources) in each sub-basin, with the
downscaled CC (A1B) scenario as input. By using SWAT and WEAP in combination it was possible to
simulate the amalgamated impacts of both increasing future demands and changed water availability
resulting from CC. Table 1 below gives brief details about the models used.

144
Table 1: Models used to evaluate the implications of climate change on existing and future water resource development in the Volta Basin
Climate Modelling
COSMO-CLM (CCLM) is a dynamic, non-hydrostatic regional climate model (Davin et al.
2011). The data used for this study were taken from COSMO_4.0_CLM simulations, run for the
African continent with grid dimension of 165 x 162 and grid spacing of 0.5o. It has 32 vertical
layers and 10 soil layers. The simulations comprised 30 years of daily control runs using
ECHAM5-OM (1971-2000) and 100 years of transient scenario runs using ECHAM5, A1B
climate scenarios (2001-2100). The initial and boundary conditions were taken from the
ECMWF Re-Analysis (ERA40)
Hydrological Modelling
The Soil and Water Assessment Tool (SWAT) is a rainfall-runoff model (Arnold et al., 1998). It
operates on a daily time step on sub-basins identified using a digital elevation model. In this case
31 sub-basins were identified. Similar land-use, soil characteristics and topography (slope)
within each sub-basin are lumped together into hydrological response units (HRUs). The model
was first set up using observed daily climate data for the period 1968-1980 derived from fourteen
meteorological stations located within the basin. Historic flow records at eight stations were used
to calibrate and six were used to validate the model. Output from the model comprised, potential
and actual evapotranspiration as well as flow and groundwater recharge for each sub-basin.
Results were combined to provide data for the 18 sub-catchments used in WEAP.
Water Resource Modelling
The Water Evaluation and Planning (WEAP) model is used to evaluate planning and
management issues associated with water resource development. It calculates a mass balance of
flow sequentially down a river system, making allowance for human induced abstractions and
inflows. It is typically used to simulate alternative scenarios comprising different development
and management options. In this study the model was configured to simulate the 18 major sub-
catchments of the basin. It was used with flows generated by the SWAT model for the period
1983-2100. Rainfall and evapotranspiration data, required for irrigation schemes and reservoirs,
were also taken from the SWAT model output, and varied depending on which sub-basin they
were located in. The WEAP model was calibrated and validated by simulating the recent past
and comparing simulated and observed flows at Bamboi, Nawuni and Sabari, on the Black,
White and Oti basins respectively.
As earlier stated, three separate development scenarios were modelled. Table 2 compares total reservoir
storage, irrigated area and installed hydropower generating capacity for the three scenarios. To facilitate
comparison between the scenarios, results were summarized over three periods: 1983-2012, 2071-2050
and 2071-2100. Basin average results were computed from sub-basin results by computing the
arithmetic mean of the results from individual basins.
Table 2: Water resource development scenarios
Scenario Total
reservoir
storage
(Mm3)
Irrigated
Area (ha)
Installed
hydroelectricity
generating capacity
(MW)
Current Development 153,124 30,468 1,020
Intermediate Development 180,124 63,253 1,547
Full Development 203,437 65,207 1,916
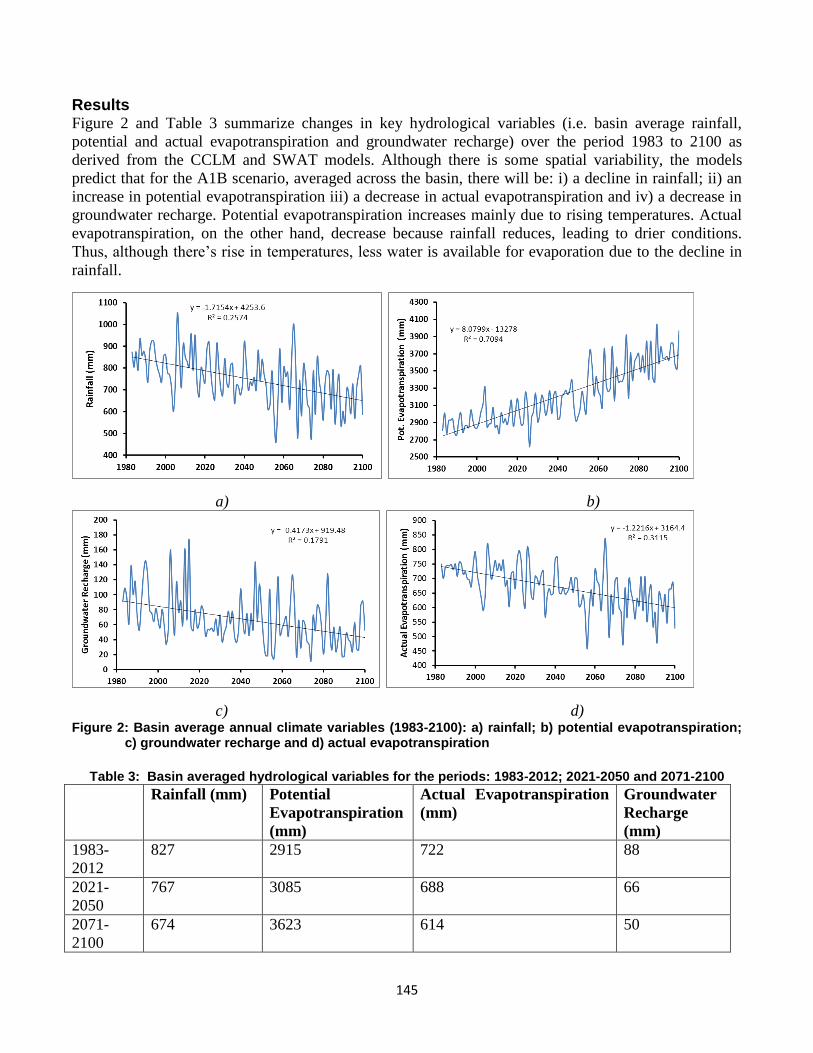
145
Results Figure 2 and Table 3 summarize changes in key hydrological variables (i.e. basin average rainfall,
potential and actual evapotranspiration and groundwater recharge) over the period 1983 to 2100 as
derived from the CCLM and SWAT models. Although there is some spatial variability, the models
predict that for the A1B scenario, averaged across the basin, there will be: i) a decline in rainfall; ii) an
increase in potential evapotranspiration iii) a decrease in actual evapotranspiration and iv) a decrease in
groundwater recharge. Potential evapotranspiration increases mainly due to rising temperatures. Actual
evapotranspiration, on the other hand, decrease because rainfall reduces, leading to drier conditions.
Thus, although there’s rise in temperatures, less water is available for evaporation due to the decline in
rainfall.
a) b)
c) d) Figure 2: Basin average annual climate variables (1983-2100): a) rainfall; b) potential evapotranspiration;
c) groundwater recharge and d) actual evapotranspiration
Table 3: Basin averaged hydrological variables for the periods: 1983-2012; 2021-2050 and 2071-2100
Rainfall (mm) Potential
Evapotranspiration
(mm)
Actual Evapotranspiration
(mm)
Groundwater
Recharge
(mm)
1983-
2012
827 2915 722 88
2021-
2050
767 3085 688 66
2071-
2100
674 3623 614 50

146
Irrigation
Figure 3 and Table 4 compare irrigation water demand and unmet demand for the three development
scenarios. Unmet demand shows an increasing trend due to (i) increase in irrigated areas, (2) decrease in
rainfall and increase in evapotranspiration, and (3) increased per hectare water demand.
Figure 3: a) Predicted average irrigation demand for the basin; b) Unmet irrigation demand for the three development scenarios
Table 4: Changes in total irrigation demand and unmet demand and in each of the three development
scenarios
1983-2012 2021-2050 2071-2100
Basin avg. irrigation demand (m3ha
-1) 14234 14527 15328
Current
Development
Water Demand (Mm3) 356 376 394
Unmet Demand (Mm3) 51 113 227
% demand delivered 86 70 42
Intermediate
Development
Water Demand (Mm3) 786 817 855
Unmet Demand (Mm3) 60 212 513
% demand delivered 92 74 40
Full
Development
Water Demand (Mm3) 824 856 896
Unmet Demand (Mm3) 51 144 505
% demand delivered 94 83 44
Hydropower
Figure 4 and Table 5 show the decreasing trend in hydroelectricity production and the reverse trend in
total unmet potential in the basin for each of the scenarios. The results show a very significant increase
in hydroelectricity produced as a consequence of the increased generating capacity between current and
full development. They also show that reduced river flows, arising as a consequence of climate change,
will significantly reduce the amount of power generated in comparison to the potential, particularly in
the second half of the century. This could affect significantly the economic gains of the riparian
countries, especially as they move towards industrialization.
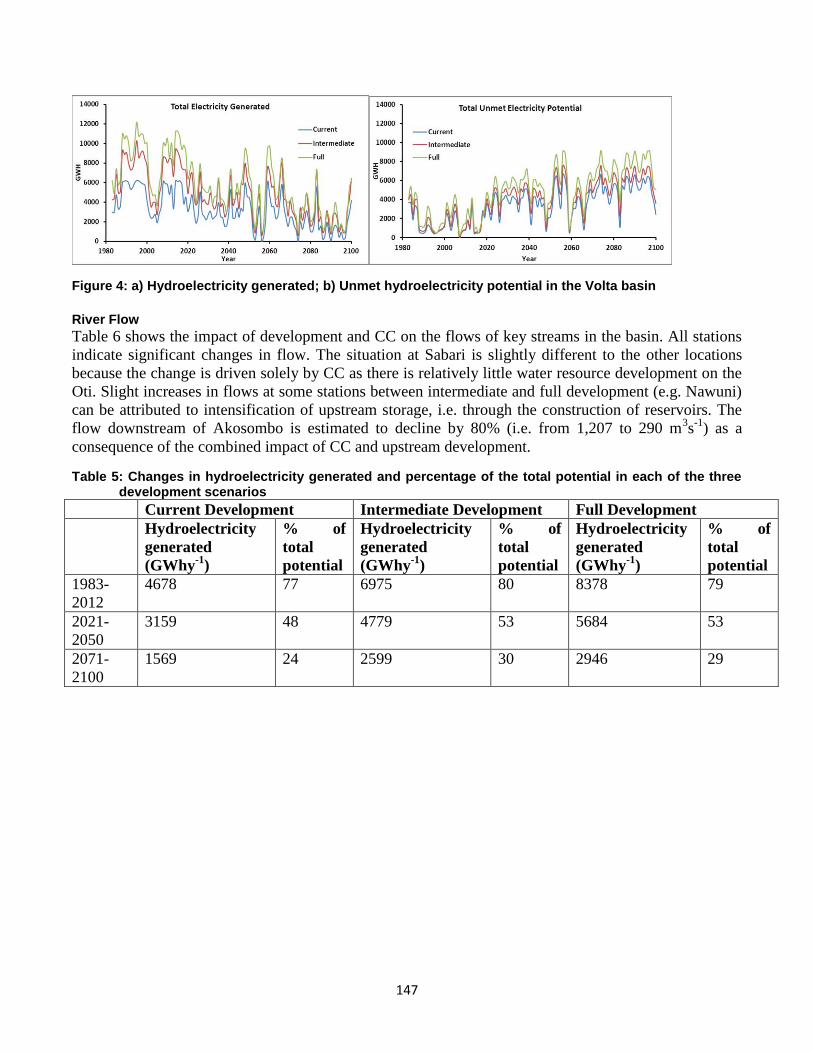
147
Figure 4: a) Hydroelectricity generated; b) Unmet hydroelectricity potential in the Volta basin
River Flow
Table 6 shows the impact of development and CC on the flows of key streams in the basin. All stations
indicate significant changes in flow. The situation at Sabari is slightly different to the other locations
because the change is driven solely by CC as there is relatively little water resource development on the
Oti. Slight increases in flows at some stations between intermediate and full development (e.g. Nawuni)
can be attributed to intensification of upstream storage, i.e. through the construction of reservoirs. The
flow downstream of Akosombo is estimated to decline by 80% (i.e. from 1,207 to 290 m3s
-1) as a
consequence of the combined impact of CC and upstream development.
Table 5: Changes in hydroelectricity generated and percentage of the total potential in each of the three development scenarios
Current Development Intermediate Development Full Development
Hydroelectricity
generated
(GWhy-1
)
% of
total
potential
Hydroelectricity
generated
(GWhy-1
)
% of
total
potential
Hydroelectricity
generated
(GWhy-1
)
% of
total
potential
1983-
2012
4678 77 6975 80 8378 79
2021-
2050
3159 48 4779 53 5684 53
2071-
2100
1569 24 2599 30 2946 29
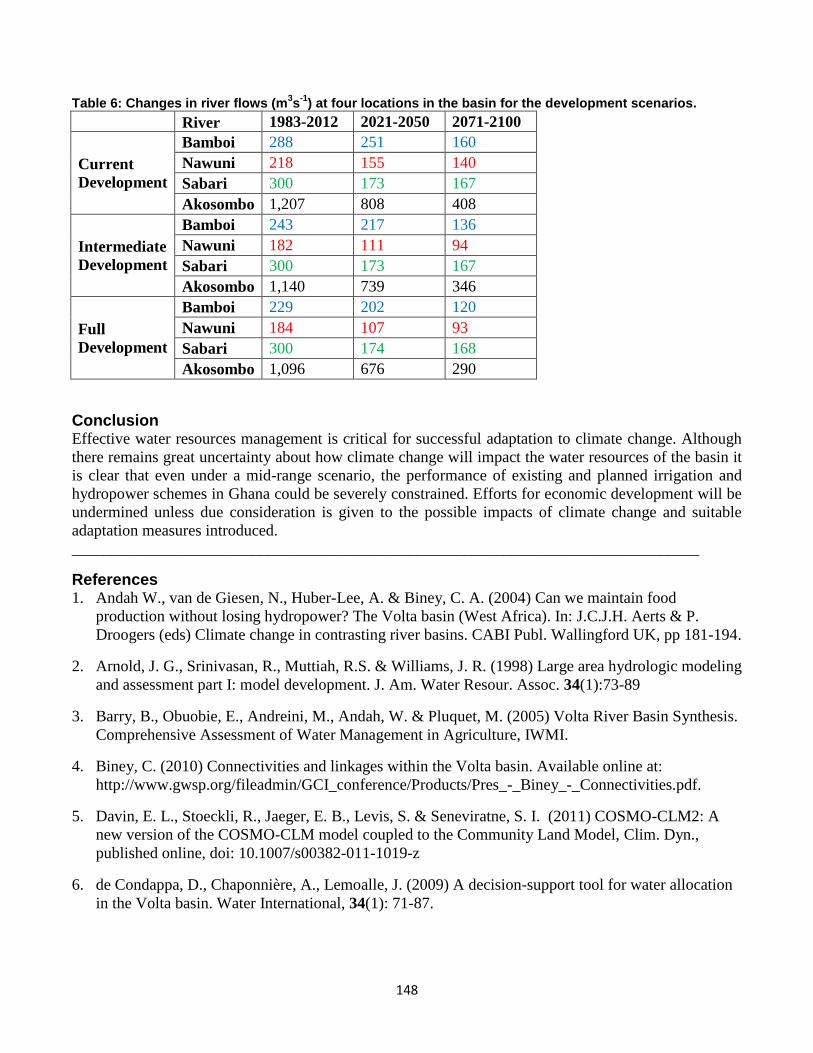
148
Table 6: Changes in river flows (m3s
-1) at four locations in the basin for the development scenarios.
River 1983-2012 2021-2050 2071-2100
Current
Development
Bamboi 288 251 160
Nawuni 218 155 140
Sabari 300 173 167
Akosombo 1,207 808 408
Intermediate
Development
Bamboi 243 217 136
Nawuni 182 111 94
Sabari 300 173 167
Akosombo 1,140 739 346
Full
Development
Bamboi 229 202 120
Nawuni 184 107 93
Sabari 300 174 168
Akosombo 1,096 676 290
Conclusion Effective water resources management is critical for successful adaptation to climate change. Although
there remains great uncertainty about how climate change will impact the water resources of the basin it
is clear that even under a mid-range scenario, the performance of existing and planned irrigation and
hydropower schemes in Ghana could be severely constrained. Efforts for economic development will be
undermined unless due consideration is given to the possible impacts of climate change and suitable
adaptation measures introduced.
________________________________________________________________________________
References 1. Andah W., van de Giesen, N., Huber-Lee, A. & Biney, C. A. (2004) Can we maintain food
production without losing hydropower? The Volta basin (West Africa). In: J.C.J.H. Aerts & P.
Droogers (eds) Climate change in contrasting river basins. CABI Publ. Wallingford UK, pp 181-194.
2. Arnold, J. G., Srinivasan, R., Muttiah, R.S. & Williams, J. R. (1998) Large area hydrologic modeling
and assessment part I: model development. J. Am. Water Resour. Assoc. 34(1):73-89
3. Barry, B., Obuobie, E., Andreini, M., Andah, W. & Pluquet, M. (2005) Volta River Basin Synthesis.
Comprehensive Assessment of Water Management in Agriculture, IWMI.
4. Biney, C. (2010) Connectivities and linkages within the Volta basin. Available online at:
http://www.gwsp.org/fileadmin/GCI_conference/Products/Pres_-_Biney_-_Connectivities.pdf.
5. Davin, E. L., Stoeckli, R., Jaeger, E. B., Levis, S. & Seneviratne, S. I. (2011) COSMO-CLM2: A
new version of the COSMO-CLM model coupled to the Community Land Model, Clim. Dyn.,
published online, doi: 10.1007/s00382-011-1019-z
6. de Condappa, D., Chaponnière, A., Lemoalle, J. (2009) A decision-support tool for water allocation
in the Volta basin. Water International, 34(1): 71-87.
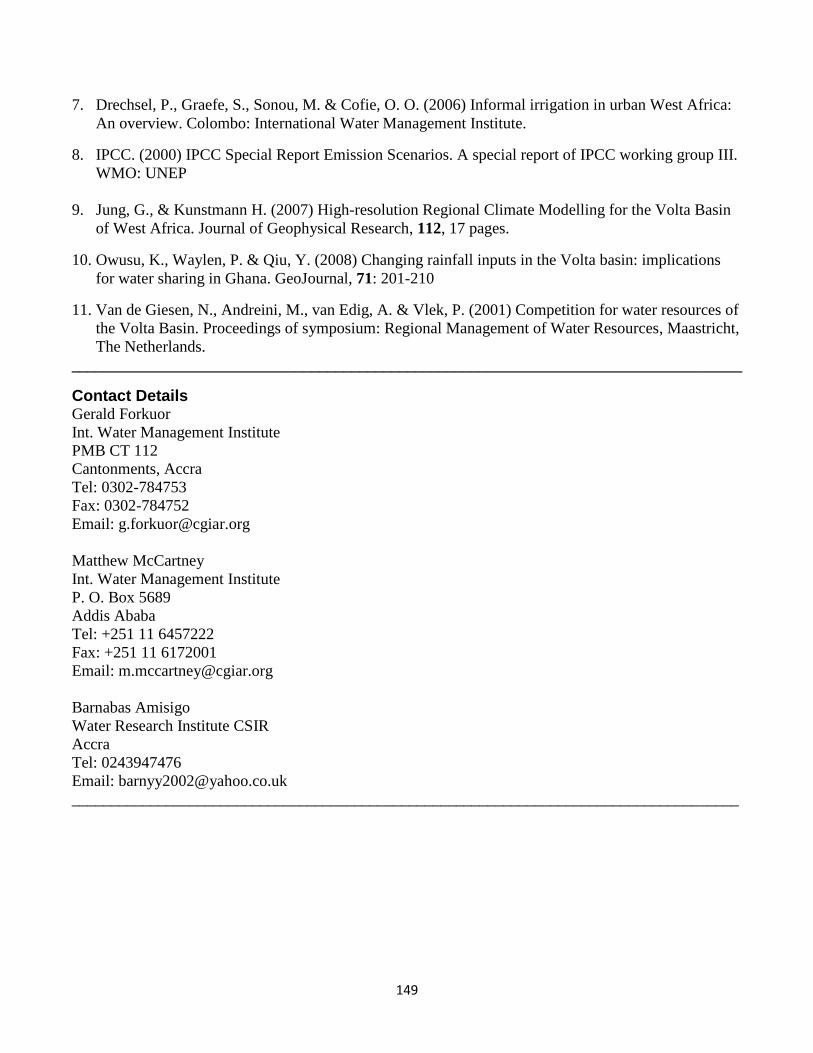
149
7. Drechsel, P., Graefe, S., Sonou, M. & Cofie, O. O. (2006) Informal irrigation in urban West Africa:
An overview. Colombo: International Water Management Institute.
8. IPCC. (2000) IPCC Special Report Emission Scenarios. A special report of IPCC working group III.
WMO: UNEP
9. Jung, G., & Kunstmann H. (2007) High-resolution Regional Climate Modelling for the Volta Basin
of West Africa. Journal of Geophysical Research, 112, 17 pages.
10. Owusu, K., Waylen, P. & Qiu, Y. (2008) Changing rainfall inputs in the Volta basin: implications
for water sharing in Ghana. GeoJournal, 71: 201-210
11. Van de Giesen, N., Andreini, M., van Edig, A. & Vlek, P. (2001) Competition for water resources of
the Volta Basin. Proceedings of symposium: Regional Management of Water Resources, Maastricht,
The Netherlands.
____________________________________________________________________________________
Contact Details Gerald Forkuor
Int. Water Management Institute
PMB CT 112
Cantonments, Accra
Tel: 0302-784753
Fax: 0302-784752
Email: [email protected]
Matthew McCartney
Int. Water Management Institute
P. O. Box 5689
Addis Ababa
Tel: +251 11 6457222
Fax: +251 11 6172001
Email: [email protected]
Barnabas Amisigo
Water Research Institute CSIR
Accra
Tel: 0243947476
Email: [email protected]
_____________________________________________________________________________________

150
_____________________________________________________________________________________
3rd Ghana Water Forum, Accra, Ghana, 2011
Water and Sanitation Services Delivery in a Rapidly Changing Urban Environment
Capacity Development Tools for Improving Solid Waste Management Services Delivery in Metropolitan, Municipal and District Assemblies in
Ghana
Kodwo Beedu Keelson
_____________________________________________________________________________________
Abstract The WastePro Software is suite of computer modeling tools that is currently being developed at the Kaaf
University College in Ghana. The modeling capabilities of this desktop software application make it a
suitable choice as a capacity development tool for waste management departments in developing
countries. The Revised Environmental Sanitation Policy 2009 for Ghana identifies capacity development
as a critical element for improving environmental sanitation services. Furthermore, it recognizes that
there has been a decline in the coverage of services from the late 1970’s which has continued and
worsened. To overcome this deficit and make progress requires that there is urgent and scaled up
capacity enhancement within the sector. This paper presents a technical description of the WastePro
Software package and discusses how the various computer modeling tools can be used for institutional
capacity development at the local government level in Ghana.
_____________________________________________________________________________________
Introduction The WastePro Software is being developed under the framework of the Waste Informatics Research
Project at the Kaaf University College. This privately funded research project seeks to investigate and
promote the use of information technology and information systems to support water and sanitation
services delivery at the local governmental level.
The use of information technology in water management is now a common feature in both advanced and
developing countries. Several Windows–based software applications such as MOUSE, HEC-RAS and
SWMM have proved useful in the engineering design and rehabilitation of large urban water
infrastructure projects. However, the use of ICT systems and tools in the environmental sanitation sector
is very limited in spite of the potential benefits that could be realized especially in developing countries.
The need to bridge this technological and knowledge gap has led to the development of the WastePro
Software. This software package has been envisioned as a user friendly desktop application that can be
used by researchers, practitioners and educators to deal with emerging challenges in the environmental
sanitation sector.
This paper presents a technical description of this software package and discusses how the various
computer modeling tools can be used for institutional capacity development to improve solid waste
management services delivery at the local government level.

151
Technical Description Software Structure
The WastePro software package is a suite of computer modeling tools which have been programmed in
the Microsoft Excel 2003 environment. The software modules in the current version WastePro 2.0
(WastePro, 2010) include:
WastePro Municipal Waste Manager Software
WastePro Waste Generation Software
WastePro Waste Haulage EDM Software
WastePro Decision Makers ISWM Toolbox
Each computer modeling tool is an Excel workbook consisting of a specific number of worksheets. The
worksheets consist of sections called Cell Blocks. The cell blocks in each worksheet are for data input or
visualization of simulation results.
Graphical User Interface
The WastePro Software package has a Microsoft Excel interface that offers comprehensive functions for
data handling and visualization. The cell blocks in all the worksheets are colour-coded in three different
font colours to serve as a guide for the user as to what data needs to be provided, and what data is
automatically calculated by the software module. The simulation results are presented in bar charts,
scatter plots and pie charts which can be edited by any user who is familiar with Microsoft Excel
spreadsheets. Some of the cell blocks are programmed to return an error message when input data for
certain modeling parameters are not specified correctly.
Modeling Tools WastePro Municipal Waste Manager Software
This solid waste cycle modeling tool simulates waste material flows through the various stages of the
waste cycle i.e. waste collection, waste collection and transfer, waste treatment and waste disposal for a
typical urban waste management system.
Figure 1: Municipal Waste Manager Software cell blocks for data input and visualization of results
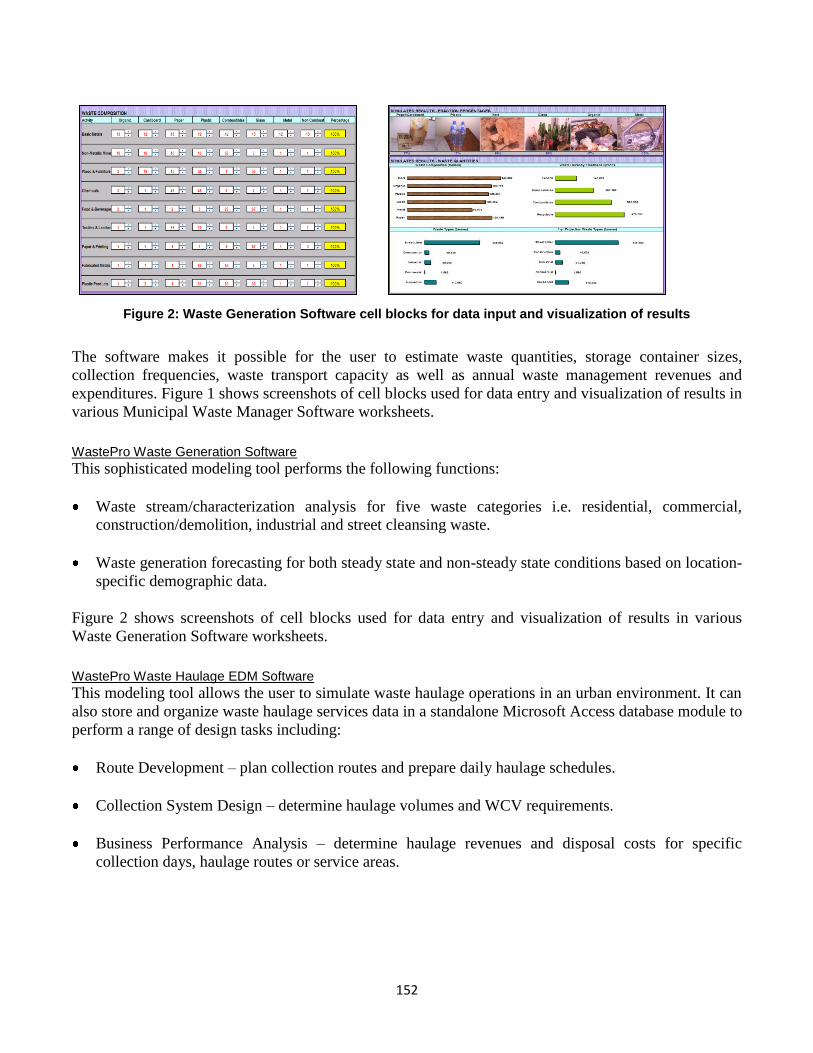
152
Figure 2: Waste Generation Software cell blocks for data input and visualization of results
The software makes it possible for the user to estimate waste quantities, storage container sizes,
collection frequencies, waste transport capacity as well as annual waste management revenues and
expenditures. Figure 1 shows screenshots of cell blocks used for data entry and visualization of results in
various Municipal Waste Manager Software worksheets.
WastePro Waste Generation Software
This sophisticated modeling tool performs the following functions:
Waste stream/characterization analysis for five waste categories i.e. residential, commercial,
construction/demolition, industrial and street cleansing waste.
Waste generation forecasting for both steady state and non-steady state conditions based on location-
specific demographic data.
Figure 2 shows screenshots of cell blocks used for data entry and visualization of results in various
Waste Generation Software worksheets.
WastePro Waste Haulage EDM Software
This modeling tool allows the user to simulate waste haulage operations in an urban environment. It can
also store and organize waste haulage services data in a standalone Microsoft Access database module to
perform a range of design tasks including:
Route Development – plan collection routes and prepare daily haulage schedules.
Collection System Design – determine haulage volumes and WCV requirements.
Business Performance Analysis – determine haulage revenues and disposal costs for specific
collection days, haulage routes or service areas. S
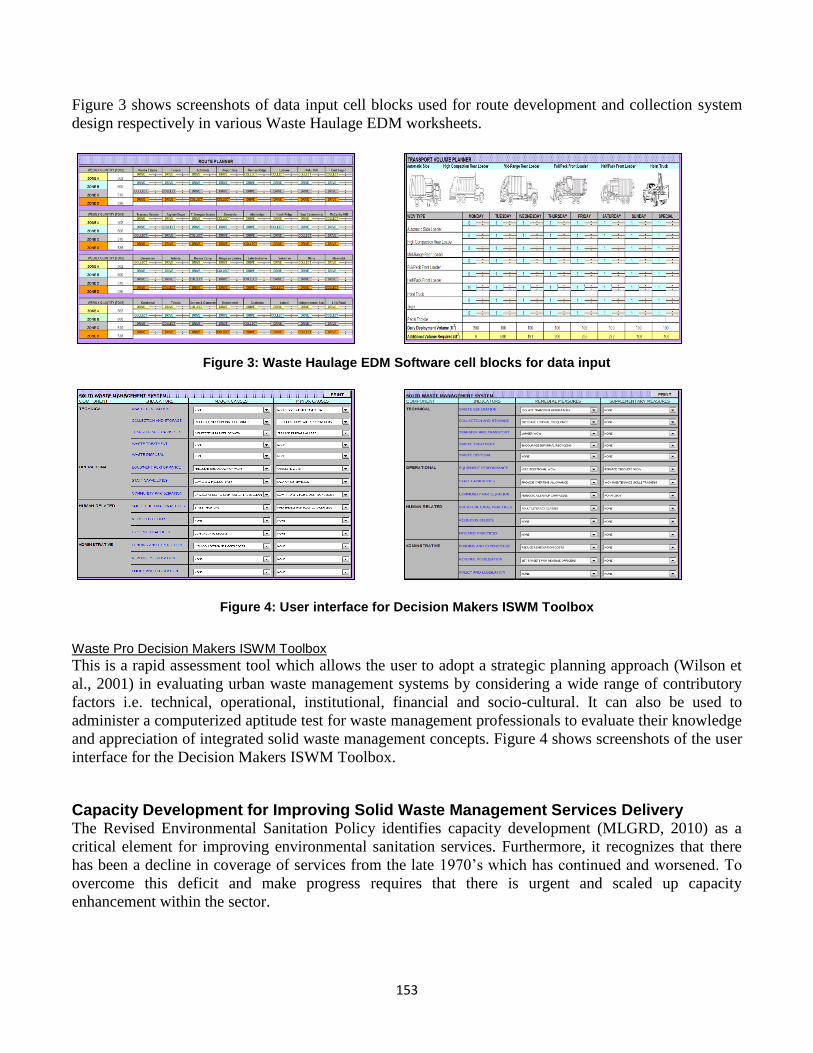
153
Figure 3 shows screenshots of data input cell blocks used for route development and collection system
design respectively in various Waste Haulage EDM worksheets.
Figure 3: Waste Haulage EDM Software cell blocks for data input
Figure 4: User interface for Decision Makers ISWM Toolbox
Waste Pro Decision Makers ISWM Toolbox
This is a rapid assessment tool which allows the user to adopt a strategic planning approach (Wilson et
al., 2001) in evaluating urban waste management systems by considering a wide range of contributory
factors i.e. technical, operational, institutional, financial and socio-cultural. It can also be used to
administer a computerized aptitude test for waste management professionals to evaluate their knowledge
and appreciation of integrated solid waste management concepts. Figure 4 shows screenshots of the user
interface for the Decision Makers ISWM Toolbox.
Capacity Development for Improving Solid Waste Management Services Delivery The Revised Environmental Sanitation Policy identifies capacity development (MLGRD, 2010) as a
critical element for improving environmental sanitation services. Furthermore, it recognizes that there
has been a decline in coverage of services from the late 1970’s which has continued and worsened. To
overcome this deficit and make progress requires that there is urgent and scaled up capacity
enhancement within the sector.
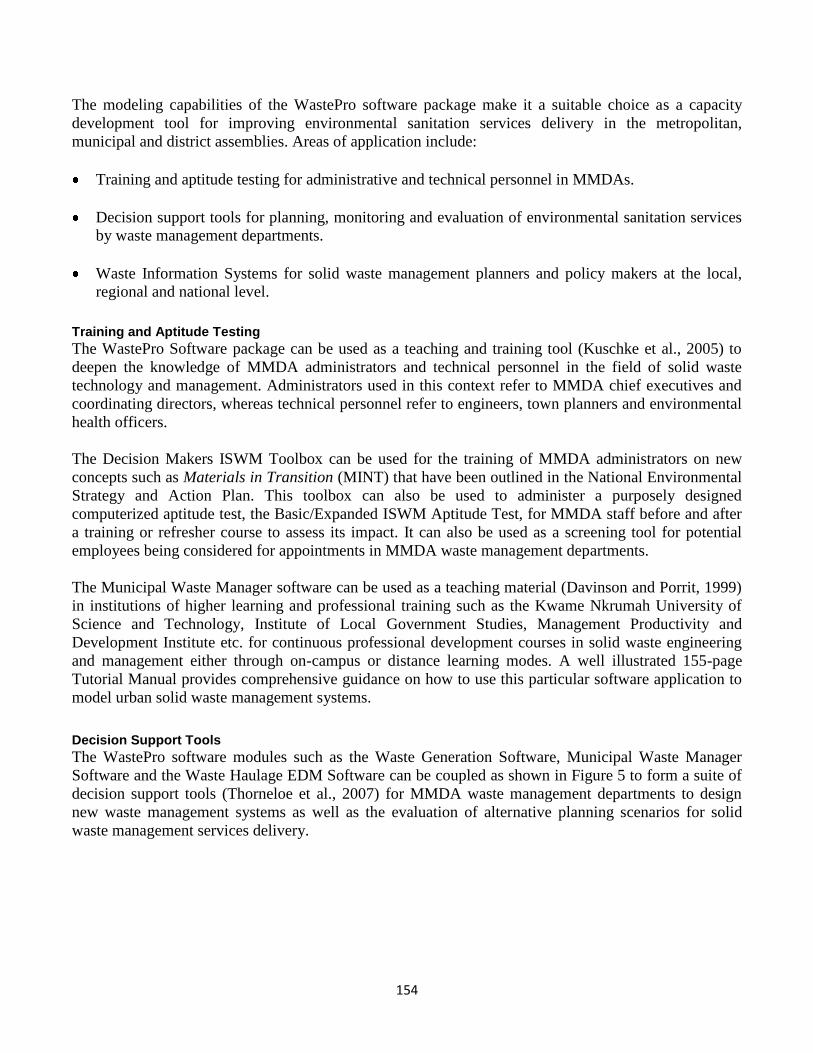
154
The modeling capabilities of the WastePro software package make it a suitable choice as a capacity
development tool for improving environmental sanitation services delivery in the metropolitan,
municipal and district assemblies. Areas of application include:
Training and aptitude testing for administrative and technical personnel in MMDAs.
Decision support tools for planning, monitoring and evaluation of environmental sanitation services
by waste management departments.
Waste Information Systems for solid waste management planners and policy makers at the local,
regional and national level.
Training and Aptitude Testing
The WastePro Software package can be used as a teaching and training tool (Kuschke et al., 2005) to
deepen the knowledge of MMDA administrators and technical personnel in the field of solid waste
technology and management. Administrators used in this context refer to MMDA chief executives and
coordinating directors, whereas technical personnel refer to engineers, town planners and environmental
health officers.
The Decision Makers ISWM Toolbox can be used for the training of MMDA administrators on new
concepts such as Materials in Transition (MINT) that have been outlined in the National Environmental
Strategy and Action Plan. This toolbox can also be used to administer a purposely designed
computerized aptitude test, the Basic/Expanded ISWM Aptitude Test, for MMDA staff before and after
a training or refresher course to assess its impact. It can also be used as a screening tool for potential
employees being considered for appointments in MMDA waste management departments.
The Municipal Waste Manager software can be used as a teaching material (Davinson and Porrit, 1999)
in institutions of higher learning and professional training such as the Kwame Nkrumah University of
Science and Technology, Institute of Local Government Studies, Management Productivity and
Development Institute etc. for continuous professional development courses in solid waste engineering
and management either through on-campus or distance learning modes. A well illustrated 155-page
Tutorial Manual provides comprehensive guidance on how to use this particular software application to
model urban solid waste management systems.
Decision Support Tools
The WastePro software modules such as the Waste Generation Software, Municipal Waste Manager
Software and the Waste Haulage EDM Software can be coupled as shown in Figure 5 to form a suite of
decision support tools (Thorneloe et al., 2007) for MMDA waste management departments to design
new waste management systems as well as the evaluation of alternative planning scenarios for solid
waste management services delivery.

155
Figure 5: Coupling of modules for decision support at MMDA waste management departments
The increasing private sector participation in solid waste management services provision means that the
MMDAs should be well resourced with requisite monitoring and evaluation systems (Cointreau–Levine
and Coad, 2000) to be able regulate their activities. The Integrated Solid Waste Management Series,
which is a set of technical reference manuals, have been purposely developed to assist MMDA waste
management departments in using the WastePro software package to perform their solid waste
management planning functions.
Waste Information Systems
Waste Information Systems (WIS) are now being adopted in many transition and developing countries.
Typical examples include Slovakia (Hrebicek et al., 2001) and South Africa (City of Cape Town, 2004).
The city of Cape Town, for example, has knowledge based waste management planning system
incorporating a waste generation model that makes it possible to set waste reduction targets up to the
year 2030.
The WastePro software modules such as the Waste Generation Software, Municipal Waste Manager
Software and the Waste Haulage EDM Software can be used to set up local level WIS in the various
MMDAs. Each MMDA-WIS will contain updated information on all the elements of the local waste
management systems including equipment, facilities, level of services etc. The MMDA-WIS will
facilitate the preparation of District-level Environmental Strategy and Action Plans (DESSAPs) by the
various MMDAs (MLGRD, 2007) which are informed by a proper knowledge based system. It will also
ensure the reporting of annual waste statistics in a standardized format that allows the creation of
regional and national databases by the relevant state agencies such as the Environmental Protection
Agency and the Environmental Health and Sanitation Directorate of the Ministry of Local Government
and Rural Development.
Conclusion This paper has presented a technical description and the potential applications of the WastePro Software
package in improving solid waste management service delivery in the metropolitan, municipal and
district assemblies in Ghana. The first stable version WastePro 2.0, which was programmed in the Excel
2003 environment, has been released. A number of field tests using this software package are being
planned in the first quarter of 2012 for some selected MMDAs in the Greater Accra and Central regions.
Future work will involve migration unto the Excel 2007 platform and the integration of open source GIS
software modules into the waste haulage simulation tools.

156
________________________________________________________________________________
Acknowledgement The work for this paper was carried out with funding from Kspyx HR Consult Ltd. The author also
wishes to thank faculty members at the Department of Civil and Geomatic Engineering of Kaaf
University College.
_____________________________________________________________________________________
References 1. City of Cape Town (2004): Draft Integrated Waste Management Plan Framework Document. Final
Status Quo Report.
2. Cointreau-Levine S. and Coad A. (2000): Private Sector Participation in Municipal Solid Waste
Management. World Bank Publication.
3. Davinson L. and Porrit N. (1999): Using computers to teach. Proceedings of the Institution of Civil
Engineers, Civil Engineering, 132, 1999, Feb., 24 -30.
4. Hrebicek J., Lacuska M., Jancarik A. and Sluka J. (2001): Waste Management Information System
of the Slovak Republic. Sustainability in the Information Society, Proceedings of 15th
International
Symposium Informatics for Environmental Protection, Zurich, X-10, 437 – 442.
5. Kuschke C., Harting M., Koerner I. and Stegman R. (2005): Planning a Composting Facility – A
software for teaching and training. Proceedings Sardinia 2005, Tenth International Waste
Management and Landfill Symposium.
6. MLGRD (2007): Handbook for Preparation of District Level Environmental Sanitation Strategies
and Action Plans (DESSAPs). Ministry of Local Government and Rural Development, Ghana.
7. MLGRD (2010): National Environmental Sanitation Strategy and Action Plan (NESSAP). Ministry
of Local Government and Rural Development, Ghana.
8. Thorneloe S., Weitz K. and Jambeck J. (2007): Application of U.S. Decision Tool for Materials and
Waste Management. Waste Management, 27(8), 1006 – 1020.
9. WastePro (2010): WastePro 2.0 Software Brochure 2010. WastePro Software Documentation,
Kspyx HR Consult Ltd, Ghana.
10. Wilson D., Whiteman A. and Tormin A. (2001): Strategic Planning Guide for Municipal Solid
Waste Management. Environmental Resource Management.
_____________________________________________________________________________________
Keywords Capacity development, information systems, decision support, teaching and training
157
_____________________________________________________________________________________
Contact Details Kodwo Beedu Keelson
Kaaf University College
P.O. Box ML 36
Mallam, Accra
Tel: 0243822223 / 0205389305
Email: [email protected]
________________________________________________________________________________

158
_____________________________________________________________________________________
3rd Ghana Water Forum, Accra, Ghana, 2011
Water and Sanitation Services Delivery in a Rapidly Changing Urban Environment
Rainwater Harvesting (RWH) as a Complementary Approach to Improving Water Supply in Ghana
Jemila Mashood, Joseph Ampadu-Boakye & Nii Odai Anidaso Laryea
_____________________________________________________________________________________
Abstract At the 2006 Climate Change Convention in Nairobi, Rainwater Harvesting (RWH) was recognised as a
viable option to addressing the current water needs and providing security against future droughts in
many African countries. This paper demonstrates that while RWH is a viable option for water supply, it
has not received the required support for adoption and scaling up in Ghana The paper examines the
reasons for the low interest and adoption of RWH in Ghana and concludes that the RWH technology
can, in most cases be introduced as part of an integrated water supply system especially in areas where
existing water supply sources are intermittent, unreliable and cannot provide all year round water
supply. The paper recommends strategies to strengthen institutional support, adoption, scaling up and
sustainability of RWH as an appropriate technology for water service delivery in Ghana.
_____________________________________________________________________________________
Introduction Rainwater harvesting is an old practice which has evolved over time and presently adopted in many
countries of the world including Brazil, Togo, India, Kenya, China, and Germany among others.
Rainwater harvesting means capturing the rain where it falls or capturing the runoff and taking measures
to store that water for domestic use and other purposes. In Africa, countries such as Kenya by 1994 had
more than 10,000 people who had already benefited from rainwater harvesting and many more facilities
have been built since then (Mbugua, 2005). Several global and regional declarations have recognised
rainwater harvesting (RWH) as a viable option for addressing water supply needs in many Sub Saharan
African countries and to provide security against future droughts. Notable among these declarations are
the 2007 Brazzaville Declaration by the African Ministerial Council on Water; the 2006 Climate Change
Convention in Nairobi and the United Nations UNEP General Assembly of 2005 to the Commission on
Sustainable Development. Governments that have endorsed RWH include Benin, Egypt, Ghana, Guinea,
Kenya, Mauritania, Rwanda, South Africa, Swaziland and Zimbabwe (Partners for Sustainable
Development, 2005).
The purpose of this paper is to assess the prospects as well as current levels of adoption of RWH as a
water supply technology in Ghana, challenges with the adoption of RWH and to propose measures to
scale up RWH as a viable water supply technology option in Ghana.
Prospects for Rainwater Harvesting The national coverage rate for drinking water in Ghana for 2009 was estimated at 58.98% (Republic of
Ghana, 2010). On account of this, about 38.26% of the existing population was yet to be served with
potable water as at the end of 2009 especially in rural areas, low income urban communities and peri-
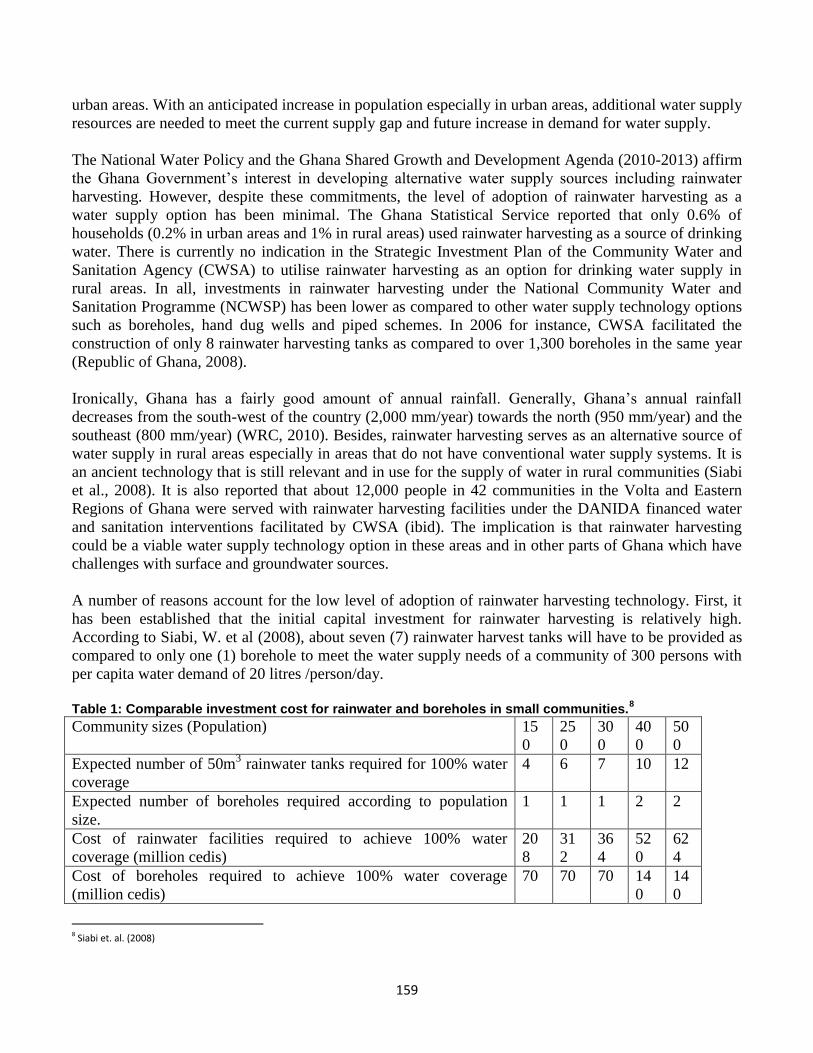
159
urban areas. With an anticipated increase in population especially in urban areas, additional water supply
resources are needed to meet the current supply gap and future increase in demand for water supply.
The National Water Policy and the Ghana Shared Growth and Development Agenda (2010-2013) affirm
the Ghana Government’s interest in developing alternative water supply sources including rainwater
harvesting. However, despite these commitments, the level of adoption of rainwater harvesting as a
water supply option has been minimal. The Ghana Statistical Service reported that only 0.6% of
households (0.2% in urban areas and 1% in rural areas) used rainwater harvesting as a source of drinking
water. There is currently no indication in the Strategic Investment Plan of the Community Water and
Sanitation Agency (CWSA) to utilise rainwater harvesting as an option for drinking water supply in
rural areas. In all, investments in rainwater harvesting under the National Community Water and
Sanitation Programme (NCWSP) has been lower as compared to other water supply technology options
such as boreholes, hand dug wells and piped schemes. In 2006 for instance, CWSA facilitated the
construction of only 8 rainwater harvesting tanks as compared to over 1,300 boreholes in the same year
(Republic of Ghana, 2008).
Ironically, Ghana has a fairly good amount of annual rainfall. Generally, Ghana’s annual rainfall
decreases from the south-west of the country (2,000 mm/year) towards the north (950 mm/year) and the
southeast (800 mm/year) (WRC, 2010). Besides, rainwater harvesting serves as an alternative source of
water supply in rural areas especially in areas that do not have conventional water supply systems. It is
an ancient technology that is still relevant and in use for the supply of water in rural communities (Siabi
et al., 2008). It is also reported that about 12,000 people in 42 communities in the Volta and Eastern
Regions of Ghana were served with rainwater harvesting facilities under the DANIDA financed water
and sanitation interventions facilitated by CWSA (ibid). The implication is that rainwater harvesting
could be a viable water supply technology option in these areas and in other parts of Ghana which have
challenges with surface and groundwater sources.
A number of reasons account for the low level of adoption of rainwater harvesting technology. First, it
has been established that the initial capital investment for rainwater harvesting is relatively high.
According to Siabi, W. et al (2008), about seven (7) rainwater harvest tanks will have to be provided as
compared to only one (1) borehole to meet the water supply needs of a community of 300 persons with
per capita water demand of 20 litres /person/day.
Table 1: Comparable investment cost for rainwater and boreholes in small communities.
8
Community sizes (Population) 15
0
25
0
30
0
40
0
50
0
Expected number of 50m3 rainwater tanks required for 100% water
coverage
4 6 7 10 12
Expected number of boreholes required according to population
size.
1 1 1 2 2
Cost of rainwater facilities required to achieve 100% water
coverage (million cedis)
20
8
31
2
36
4
52
0
62
4
Cost of boreholes required to achieve 100% water coverage
(million cedis)
70 70 70 14
0
14
0
8 Siabi et. al. (2008)
160
NB: One 50m3
rainwater concrete tank cost 55 million cedis.
A borehole fitted with hand pump cost 70 million cedis.
The investment is however less risky as compared to investment in groundwater supply. Besides, given
the lifespan, and operation and maintenance cost of the rainwater harvesting tank and the borehole or
hand dug well, the rainwater harvest tank is cheaper in the long term.
Other reasons include the low level of adoption of rainwater harvesting technology, limited
demonstration facilities, the perception that rainwater quality is suspect as compared to groundwater and
treated surface water sources, inadequate financing and inadequate building regulatory framework to
support rainwater harvesting.
Key Lessons
Rainwater harvesting facilities are currently being used in selected regions in Ghana as a water
supply service and could serve as a basis of assessing prospects for scaling up the technology option
for household and communal use.
Rainwater harvesting has comparatively high initial investment cost but given the lifespan, and
operation and maintenance cost of the technology, it is comparatively cheaper in the long term than
groundwater sources.
Given the initial investment requirement, it is more feasible to promote rainwater harvesting at the
household level in the short term and to focus on communal level use in the long term
Recommendations and Conclusions
The Ministry of Water Resources, Works and Housing should support CWSA to assess the prospects
of using rainwater harvesting for water service delivery in areas where surface water and
groundwater resources are not readily available and difficult to access. This strategy should
culminate in a review of the CWSA Strategic Investment Plan (SIP) to include rainwater harvesting
technology option. The strategy should be backed by a comprehensive nationwide awareness
creation on the benefits of rainwater harvesting as a water supply technology option.
The Ministry of Water Resources, Works and Housing through CWSA and GWCL should develop
guidelines for rainwater harvesting as a drinking water supply system. This should be supported by
providing training for Planners, Architects and Contractors on the need to include rainwater
harvesting facilities in the designs of buildings. Existing and prospective real estate developers
should also be encouraged to provide gutters in the roofs of building designs to enable harvesting of
rainwater into receptacles for use by occupants.
Extensive public education should be provided for households on the need to harvest rainwater in
water receptacles/storage tanks as the starting point. This should be accompanied by simple
household level water treatment methods. In the long term, a more sustainable approach should be
shared investment for communal use with consideration for models that focus on cost reduction.
161
There is currently lack of information on knowledge levels and skills in rainwater harvesting at the
national, regional and district levels in both the public and the private sectors. This would require a
detailed assessment of the human resource capacity at all levels to establish existing capacity needs
that would be required to support the promotion, operation and maintenance of rainwater harvesting
as a technology for water service delivery.
The Ghana Government should demonstrate commitment by adopting an innovative financing
arrangement for the provision of RWH facilities both at the community level through CWSA and at
the household level by providing seed money for micro finance for households who adopt RWH.
An Inter-Ministerial dialogue process should be initiated by the Ministry of Water Resources, Works
and Housing and should include the Ministries of Finance and Economic Planning, Local
Government and Rural Development, Education and Health. The dialogue process should review
modalities and approaches that will ensure implementation of the policy measure that “due
consideration be given to water harvesting as a source of water supply in building regulations”
(Ghana National Water Policy 2007 page 28)
_____________________________________________________________________________________
Acknowledgements We are grateful to Ms. Charlotte Engmann Community Water and Sanitation (CWSA) and Mr. Erasmus
Adongo of PRONET-Wa for their invaluable contribution to the preparation of this paper.
_____________________________________________________________________________________
References 1. Republic of Ghana (2008) Strategic Investment Plan of CWSA. Ministry of Water Resources, Works
and Housing. Accra.
2. Ghana Statistical Service (2008) Ghana Demographic and Health Survey 2008. GSS, Accra.
3. Gould, Nissen-Petersen (2005) Rainwater Catchment Systems for Domestic Supply (IT-
publications) www.margraf-publishers.com
4. Johann, G. (year unknown) Promote Rainwater Catchment Systems in the Brazilian Semiarid
Tropics.
5. John Mbugua, (2005) The Greening of Laikipia: Women harvest rain and donors participate.
Margraf-Publishers.com
6. RAIN Foundation (2010): Strategic Analysis. October 2010
7. Rain Foundation (2011): World Water Day Joint Press Release. March 2011
8. Republic of Ghana (2009) Water and Sanitation Sector Performance Report 2009. Ministry of Water
Resources, Works and Housing. Accra
162
9. Siabi W.K, Van-Ess RKD, Engmann C, Mensah T, Tagoe M. (Sept. 2008) Rainwater Harvesting,
Last Water Supply Option for Small Communities and Institutions in Difficult Hydro-geological
Formations. www.cwsagh.org/downloads/rainwater_harvesting.pdf. Accessed on 15th July, 2011.
10. Smith- Asante E, June 2010: Ghana to incorporate rainwater harvesting in building designs:
www.ghanabusinessnews.com
11. Water Resources Commission (2010) National Baseline Studies and Institutional Analyses towards
the Development of the National Integrated Water Resources Management Plan. Draft Report
Prepared by SAL Consult, Accra.
_____________________________________________________________________________________
Contact Details Jemila Mashood, Joseph Ampadu-Boakye and Nii Odai Anidaso Laryea
Maple Consult
P. O. Box CT 3700
Cantonments-Accra
Tel: 233-302-241133/241415
Email: [email protected]
_____________________________________________________________________________________
163
_____________________________________________________________________________________
3rd Ghana Water Forum, Accra, Ghana, 2011
Water and Sanitation Services Delivery in a Rapidly Changing Urban Environment
Decentralised Water Supply for Low Income Urban Areas: Institutional
Arrangements and Forms of Agreement
Kwabena Nyarko & Tim Hayward
_____________________________________________________________________________________
Abstract Water and Sanitation for the Urban Poor (WSUP) has been working on the development of community
and private sector approaches that address the inadequate water and sanitation services in low income
urban areas in Ghana. The paper is based on WSUP’s experience of implementing the USAID-funded
OWAS project in Kotei, Kumasi, and also the CHF project in Avenor, Accra. It explains the challenges
faced by GWCL in increasing water supply provision to under-served urban areas and highlights some
alternative service delivery approaches that are being trialed by WSUP and CHF. It focuses on the
process of close consultation that WSUP has taken with Ghana Water Company Limited (GWCL),
traditional leaders and a Community Management Committee that has been established by WSUP and it
describes the institutional model that has now been agreed upon by all parties. The paper discusses the
challenges faced and compares and contrasts the Kotei model with other similar initiatives currently
taking place in Ghana. The paper concludes with some comments and recommendations on the general
applicability of such an approach in Ghana and the implications for current policy and practice if scale
up of a decentralised approach to service delivery is to be achieved in Ghana.
_____________________________________________________________________________________
Introduction In many developing countries, including Ghana, a major characteristic of urban water service delivery is
that the urban poor, most of whom live in low income settlements and peri-urban areas, are usually the
last to be served (Addo-Yobo and Njiru, 2006). Consequently large proportions of the urban poor are
not served directly by formal utilities and are compelled to resort to unsafe and/or expensive sources of
water.
In Ghana, the formal urban water utility provider, Ghana Water Company Limited (GWCL) estimates
coverage to be only 59% based on water production and the estimated water demand (MWRWH, 2010).
The fifth round of the Ghana Living Standards Survey revealed that people living in urban areas access
water from eight different sources as indicated in the diagram below (GSS, 2008). The diagram also
illustrates that a significant proportion of urban dwellers do not have access to GWCL services. A
consultative citizens report card conducted in Accra by the World Bank (World Bank, 2010) revealed
that a greater proportion of the households with lower household incomes lack a connection to the
GWCL system compared to the households with high income. Consequently, the worst affected by
inadequate GWCL services are the urban poor and the lack of access to the urban poor is one of the
major challenges identified in the national water policy which calls for the development of strategies to
serve them better (GOG, 2007).
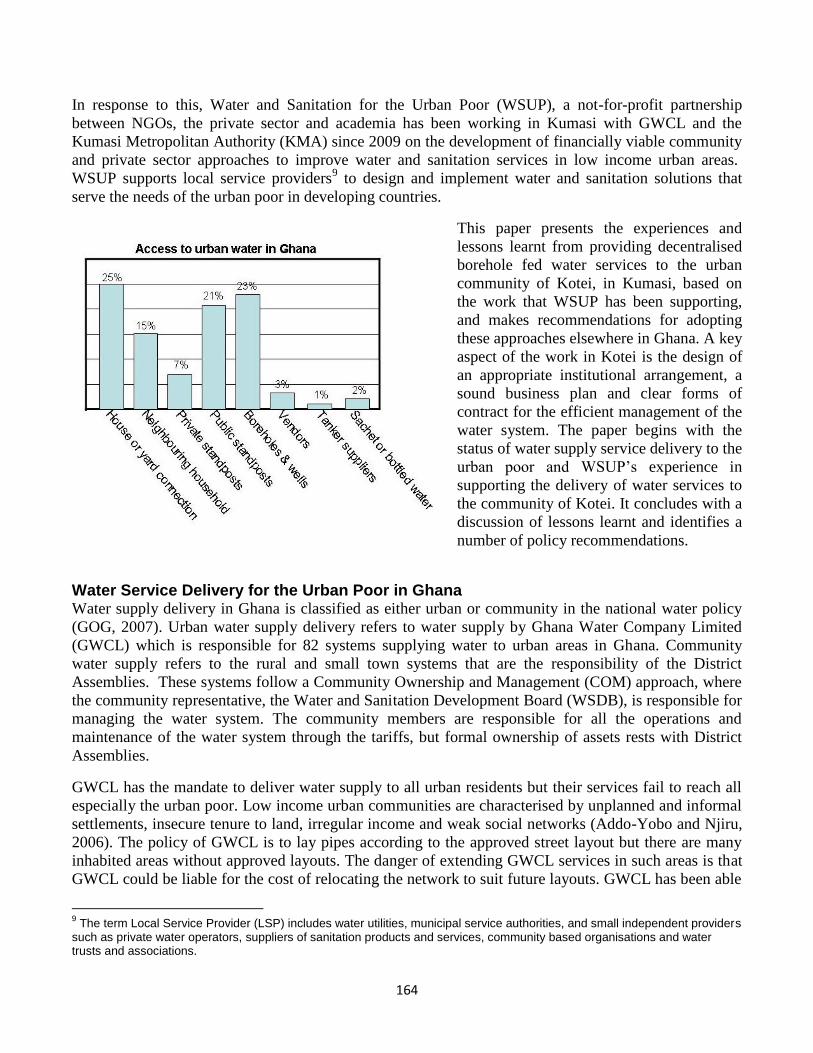
164
In response to this, Water and Sanitation for the Urban Poor (WSUP), a not-for-profit partnership
between NGOs, the private sector and academia has been working in Kumasi with GWCL and the
Kumasi Metropolitan Authority (KMA) since 2009 on the development of financially viable community
and private sector approaches to improve water and sanitation services in low income urban areas.
WSUP supports local service providers9 to design and implement water and sanitation solutions that
serve the needs of the urban poor in developing countries.
This paper presents the experiences and
lessons learnt from providing decentralised
borehole fed water services to the urban
community of Kotei, in Kumasi, based on
the work that WSUP has been supporting,
and makes recommendations for adopting
these approaches elsewhere in Ghana. A key
aspect of the work in Kotei is the design of
an appropriate institutional arrangement, a
sound business plan and clear forms of
contract for the efficient management of the
water system. The paper begins with the
status of water supply service delivery to the
urban poor and WSUP’s experience in
supporting the delivery of water services to
the community of Kotei. It concludes with a
discussion of lessons learnt and identifies a
number of policy recommendations.
Water Service Delivery for the Urban Poor in Ghana Water supply delivery in Ghana is classified as either urban or community in the national water policy
(GOG, 2007). Urban water supply delivery refers to water supply by Ghana Water Company Limited
(GWCL) which is responsible for 82 systems supplying water to urban areas in Ghana. Community
water supply refers to the rural and small town systems that are the responsibility of the District
Assemblies. These systems follow a Community Ownership and Management (COM) approach, where
the community representative, the Water and Sanitation Development Board (WSDB), is responsible for
managing the water system. The community members are responsible for all the operations and
maintenance of the water system through the tariffs, but formal ownership of assets rests with District
Assemblies.
GWCL has the mandate to deliver water supply to all urban residents but their services fail to reach all
especially the urban poor. Low income urban communities are characterised by unplanned and informal
settlements, insecure tenure to land, irregular income and weak social networks (Addo-Yobo and Njiru,
2006). The policy of GWCL is to lay pipes according to the approved street layout but there are many
inhabited areas without approved layouts. The danger of extending GWCL services in such areas is that
GWCL could be liable for the cost of relocating the network to suit future layouts. GWCL has been able
9 The term Local Service Provider (LSP) includes water utilities, municipal service authorities, and small independent providers
such as private water operators, suppliers of sanitation products and services, community based organisations and water trusts and associations.

165
to provide water to some areas without approved layout by working closely with the Districts
Assemblies to agree on the location of the road. Currently, the formal water sector lacks the capacity to
improve water supplies to the poor and un-served in urban Ghana (AMCOW/WSP, 2010). As
recommended in the national water policy, new methods and approaches to addressing their needs are
therefore required as the formal utility business model does not currently target the urban poor.
The urban water utility regulator, Public Utilities Regulatory Commission (PURC), has started focussing
on the provision of water to the urban poor, in line with its mandate to protect the interests of both
consumers and providers of utility services. PURC has been piloting interventions that involve
community management of bulk water supply to generate lessons to guide replication in regulatory
decisions and future policy whilst bringing benefits to the urban poor. PURC pilot interventions have
been based on extension of GWCL’s network or use of water tankers to supply to communities. In all
the pilots, the community representative (water boards) was responsible for the management of the
water schemes.
In addition to the pilots by PURC, there are other initiatives. CHF10
, with funding from USAID, has
extended the GWCL network to the community of Avenor in Accra and provided house connections,
water kiosks and standpipes to the residents. The management model is direct community management
whereby the community representatives, through a water and sanitation board, are responsible for
operation and maintenance as well as bill collection. The water board has an arrangement with GWCL
to carry out repairs and maintenance for a fee.
The challenge of providing urban water services to the poor is summarised in the national water policy
as “achieving equity in access to water supply for peri-urban and urban poor to meet their basic needs at
affordable cost” and calls for an understanding of the needs of the poor and designing interventions to
suit their supply and payment choices (GOG, 2007). Furthermore, the policy encourages cooperation
between private operators and small-scale independent providers, rather than grant exclusivity to either
party, to facilitate adequate and affordable provision of safe drinking water to un-served and
underserved areas. The experience in Kotei and Avenor indicate that shared responsibilities between the
community and GWCL present promising approaches to scaling urban water service delivery which are
also closely aligned with the national water policy directives.
WSUP Supported Process of Improving Urban Water Service Delivery in Kotei, Kumasi. WSUP is supporting efforts of local service providers in Kotei, which is part of the Oforikrom
Constituency, to improve access to potable water and sanitation services by local residents. Kotei is a
suburb of Kumasi located about 10 kilometres southeast of the central business district. Prior to WSUP’s
intervention 86 % of the residents in Kotei old township (project site) were relying on water supply
either from their neighbours or hand dug wells and boreholes (CARE, 2007). Currently water sells at
Ghs 2.8 per m3 (5 Gps per 18 litre bucket) compared to GWCL residential tariff of 80 Gp per m
3 for the
first 20 m3 or Ghc 1.20 per m
3 for consumption more than 20 m
3.
WSUP works by harnessing both local and global expertise to deliver improved water and sanitation
services to the urban poor and by developing innovative management models. WSUP’s approach is to
improve the interface between low income communities and local service providers (LSPs), to increase
10
The aim of all CHF’s work is to build the capacity of local partners, governments and the private sector to create communities who are economically, socially and environmentally self-sufficient.
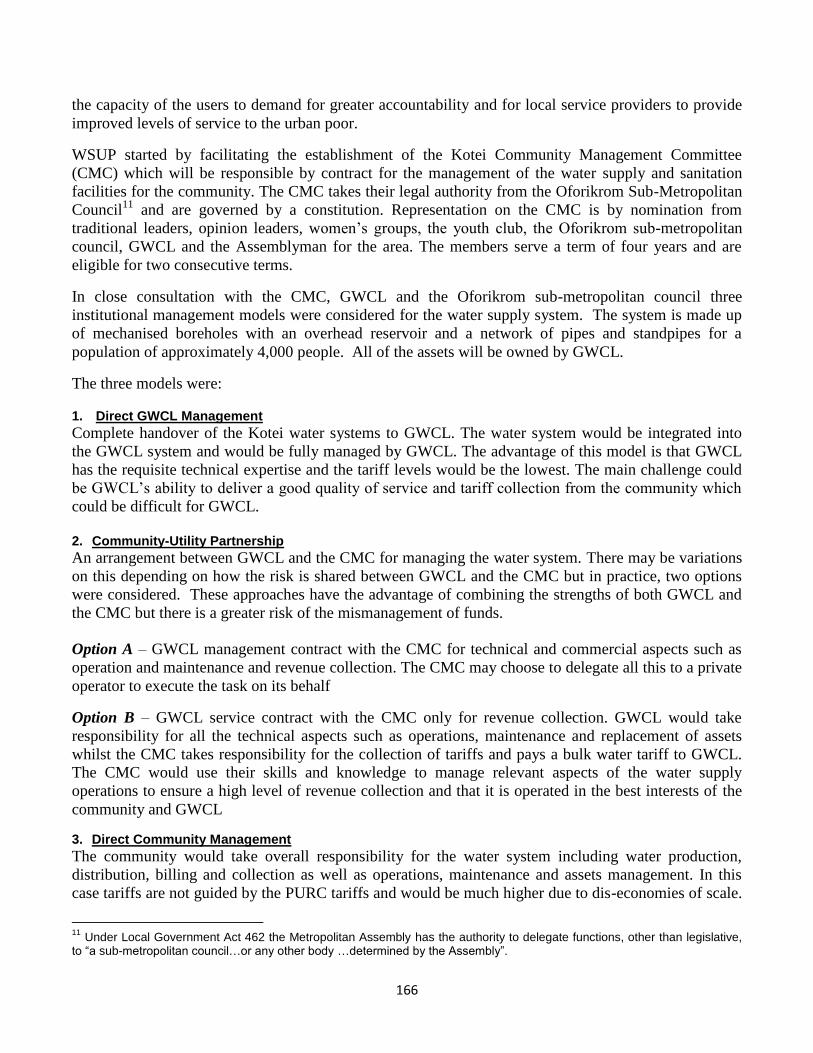
166
the capacity of the users to demand for greater accountability and for local service providers to provide
improved levels of service to the urban poor.
WSUP started by facilitating the establishment of the Kotei Community Management Committee
(CMC) which will be responsible by contract for the management of the water supply and sanitation
facilities for the community. The CMC takes their legal authority from the Oforikrom Sub-Metropolitan
Council11
and are governed by a constitution. Representation on the CMC is by nomination from
traditional leaders, opinion leaders, women’s groups, the youth club, the Oforikrom sub-metropolitan
council, GWCL and the Assemblyman for the area. The members serve a term of four years and are
eligible for two consecutive terms.
In close consultation with the CMC, GWCL and the Oforikrom sub-metropolitan council three
institutional management models were considered for the water supply system. The system is made up
of mechanised boreholes with an overhead reservoir and a network of pipes and standpipes for a
population of approximately 4,000 people. All of the assets will be owned by GWCL.
The three models were:
1. Direct GWCL Management
Complete handover of the Kotei water systems to GWCL. The water system would be integrated into
the GWCL system and would be fully managed by GWCL. The advantage of this model is that GWCL
has the requisite technical expertise and the tariff levels would be the lowest. The main challenge could
be GWCL’s ability to deliver a good quality of service and tariff collection from the community which
could be difficult for GWCL. 2. Community-Utility Partnership
An arrangement between GWCL and the CMC for managing the water system. There may be variations
on this depending on how the risk is shared between GWCL and the CMC but in practice, two options
were considered. These approaches have the advantage of combining the strengths of both GWCL and
the CMC but there is a greater risk of the mismanagement of funds.
Option A – GWCL management contract with the CMC for technical and commercial aspects such as
operation and maintenance and revenue collection. The CMC may choose to delegate all this to a private
operator to execute the task on its behalf
Option B – GWCL service contract with the CMC only for revenue collection. GWCL would take
responsibility for all the technical aspects such as operations, maintenance and replacement of assets
whilst the CMC takes responsibility for the collection of tariffs and pays a bulk water tariff to GWCL.
The CMC would use their skills and knowledge to manage relevant aspects of the water supply
operations to ensure a high level of revenue collection and that it is operated in the best interests of the
community and GWCL
3. Direct Community Management
The community would take overall responsibility for the water system including water production,
distribution, billing and collection as well as operations, maintenance and assets management. In this
case tariffs are not guided by the PURC tariffs and would be much higher due to dis-economies of scale.
11
Under Local Government Act 462 the Metropolitan Assembly has the authority to delegate functions, other than legislative, to “a sub-metropolitan council…or any other body …determined by the Assembly”.

167
Another disadvantage of this model is that in the future when GWCL’s network services become
available an independent system would collapse due to the availability of cheaper alternative services.
However there would be a high sense of ownership by the community.
The choice of the institutional model was based on community involvement in the delivery of services,
arrangements that strengthen GWCL to deliver services to the poor and innovative models that may be
relevant to other urban areas in Ghana. At a stakeholder workshop the Utility-Community Partnership
Option B was endorsed. Thus GWCL will own the assets and take responsibility for operations,
maintenance and capital maintenance, and the CMC will hire vendors to manage the standpipes, take
responsibility for tariff collection, payment of vendors, payment of GWCL water bill and act as an
interface between the utility and the community.
Initially the community had been in favor of direct community management due to their mistrust of
GWCL. However, during the stakeholder consultation process GWCL made a significant contribution
in offering to drill the boreholes at their cost. GWCL also oversaw the technical design of the water
system. The financial model also indicated that direct community management would have the highest
tariff. The stakeholders endorsed the utility-community partnership because it was seen as a “win win”
situation for both parties.
Following the selection of the institutional model, contracts have been drawn showing clear delegation
of responsibilities for smooth and efficient delivery of water services. There is one agreement between
the CMC and the water vendors and another agreement between the CMC and GWCL. All parties were
consulted during the writing of the contracts.
This approach for improving water services is also in line with PURC’s strategy for involving
communities in the delivery of services to the urban poor and also has similarities with other pro-poor
initiatives. All the pro-poor initiatives are using the community representatives (Water Boards or
Community Management Committees) in the management of the water system. The Avenor model
contrasts with the model in Kotei where GWCL is responsible for all the technical aspect of the water
system whilst the CMC takes responsibility for bill collection. The implication of the Avenor model is
that the bulk water tariffs should be less than the PURC approved tariffs for standpipes or lifeline to
compensate for the water boards responsibility for the technical aspects such as repairs and maintenance.
Lessons in Implementing Water Services for the Urban Poor The experience discussed above of implementing water service delivery in Kotei has provided a number
of lessons.
The involvement of the community, i.e. the users, is important for designing an appropriate model that
meets the expectation of the community. All the pro-poor interventions were implemented with the
active involvement of the communities to provide context specific solutions to the community needs.
The process must therefore involve consultation with the community and local service providers in order
to develop viable sustainable solutions. However, WSUP’s experience reveals that GWCL does not have
specific officers with the skills to liaise between the utility and the communities to address pro-poor
concerns.
The appropriate bulk water tariff is currently unclear and not regulated. The experience of CHF has
revealed a lack of clarity on the issue of bulk water tariffs for communities that take responsibility for
168
operation and maintenance of a water system. For example, in Avenor bulk water tariffs are still being
discussed and in Kotei the tariffs at the tapstands will be the GWCL approved tariffs. Clear guidance on
bulk water tariffs from PURC is required.
Scaling up pro-poor interventions country wide requires financing and cost reflective tariffs to extend
distribution systems into un-served and underserved urban areas. In Kotei the project is funded by
USAID and GWCL contributed by drilling two boreholes. However, financial modeling showed that for
the system to run independently of GWCL a cost recovery tariff (i.e. a tariff that covers all capital and
maintenance costs) five times higher than standard PURC-approved tariffs would be required. Therefore
urban poor users would be paying higher tariffs than regular GWCL customers. This underlines the need
for a holistic review of urban water tariff policy. GWCL as the urban water monopoly provider benefits
from economies of scale to provide services at the cheapest cost. Yet still the urban poor are clearly not
getting the full benefit of GWCL’s services. Therefore, strategies for GWCL to use their existing
business to leverage funding to extend services to achieve universal service obligation should be
examined. For example the use of the tariff structure to generate dedicated funding to serve the urban
poor could be explored by GWCL and PURC.
Conclusions and Recommendations The partnership between GWCL and the CMC in Kotei for delivering water services is promising as it
employs the strengths of both GWCL and the CMC to ensure sustainable service delivery beyond the
provision of the water infrastructure. The experience gained in Kotei and other pilots leads to the
following recommendations if large scale improvements to the delivery of urban water services are to be
achieved in Ghana:
GWCL should use its monopoly power to leverage funding to deliver services to all. Furthermore,
PURC should require GWCL to provide a plan with cost implications of ensuring universal service
coverage including services to the urban poor.
PURC should review the current tariff structure and provide clear guidance on bulk water tariffs
when GWCL supplies bulk water for community management.
A framework and guidance for community-utility partnerships based on ongoing pilots should be
developed by the Ministry of Water Resources Works and Housing to guide future supplies to low
income urban areas of Ghana.
Given the wide recognition of the importance of community engagement GWCL should establish a
specific team with staff of appropriate skills to support this and to develop and promote the
importance of pro-poor service expansion/universal service within the company.
_____________________________________________________________________________________
Acknowledgement This paper is made possible by the generous support of the American people through the United States
Agency for International Development (USAID). The contents are the responsibility of WSUP and do
not necessarily reflect the views of USAID or the United States Government.

169
_____________________________________________________________________________________
References 1. AMCOW and WSP (2010). Water supply and sanitation in Ghana: turning finance into services for
2015 and beyond. An AMCOW Country Status Overview. African Ministers’ Council on Water
(AMCOW) and Water and Sanitation Program
2. Addo-Yobo, F. N., and C. Njiru (2006). Role of consumer behaviour studies in improving water
supply delivery to the urban poor. Water Policy 8 (2006) 111–126.
3. Albu, M and C. Njiru (2002). The role of small-scale independent water providers in urban areas.
Waterlines Vol 20. No 3.
4. CARE (2007) Engineering survey and mapping in the Oforikrom constituency of Kumasi
Metropolis.
5. GOG (2007) National Water Policy, Ministry of Water Resources Works and Housing, Government
of Ghana.
6. GSS (2008) Report of the 5th round of the Ghana Living Standards Survey, Ghana Statistical
Service, Accra, Ghana.
7. MWRWH (2010) Ghana Water and Sanitation Sector Performance Report 2009.
8. World Bank (2010) Accra City- Consultative citizens report card. Report No. 55117-GH. The World
Bank. Washington, DC 20433.
9. WHO/UNICEF (2010) Progress on Sanitation and Drinking Water 2010 update. Available at
http://www.wssinfo.org/documents-links/documents. accessed in June 2011.
_____________________________________________________________________________________
Contact Details Kwabena Biritwum Nyarko
Civil Eng. Dept
KNUST-Ghana
Tel: +233208165515
Email: nyarko.k.b@gmail
Tim Hayward Water & Sanitation for the Urban Poor
London, UK
Email: [email protected]
____________________________________________________________________________________

170
_____________________________________________________________________________________
3rd Ghana Water Forum, Accra, Ghana, 2011
Water and Sanitation Services Delivery in a Rapidly Changing Urban Environment
Performance of a Multi-District Water Supply Scheme in Ghana – Case
Study of the Three District Water Supply Scheme
K. B. Nyarko, S. Oduro-Kwarteng, B. Dwumfour-Asare & J. H. Ankomah
_____________________________________________________________________________________
Abstract In Ghana, small town water systems have increasingly become a popular method of water service
delivery in rural and small town communities. Meanwhile the performances of most small town water’
schemes are unknown and not sufficiently understood. The study examines the performance of the first
complex multi-district small town water supply scheme, the 3-DWSS managed by three local authorities
and a private operator. Based on key informants’ interviews with local authorities, Community Water
and Sanitation Agency (CWSA) and Private Operator (PO); focus group discussions (FGD) with
management team, WATSANs and WSDB members; and household surveys with the users, technical and
financial performances of the scheme. In addition household survey was conducted with 305 household
to measure customer satisfaction to supplement the quantitative performance indicators. The findings of
the study revealed that the 3-DWSS is performing well with respect to the CWSA technical and financial
indicator targets. The household survey revealed a high customer satisfaction of the service, which
confirms the good performance obtained by the objective indicators.
_____________________________________________________________________________________
Introduction The small towns piped system currently serves 1,816,891 inhabitants (CWSA 2009). Increasingly,
multi-village piped schemes are being implemented for cluster of towns/villages when there are water
resource constraints in the individual communities. The Community Water and Sanitation Agency
(CWSA) has recently facilitated the construction of the three district water supply systems (3-DWSS),
which is presently the biggest small town water supply scheme in Ghana, serving a population of about
115,092 in 130 communities and 18 institutions (Maple Consult, 2008).
The performances of most small town water’ schemes in Ghana are unknown and not sufficiently
understood. The performances of the water systems in relation to the CWSA norms are important to
inform decision making for sustainable water service delivery. Performance measurement can be
defined as an approach to determine how effectively and efficiently a local body delivers the required
service (Gupta, 2006). There are a number of performance indicators that can be used to measure the
performance of the water systems. Some of the indicators used by WSP (2006) to measure the efficiency
of water supply systems are investment, financial, billing and collection, water quality, costs and
staffing, metering, unaccounted for water (UFW), production/consumption, coverage etc. Owusu (2010)
indicate that performance measurement of water systems for service delivery requires the views of the
users on level of satisfaction.
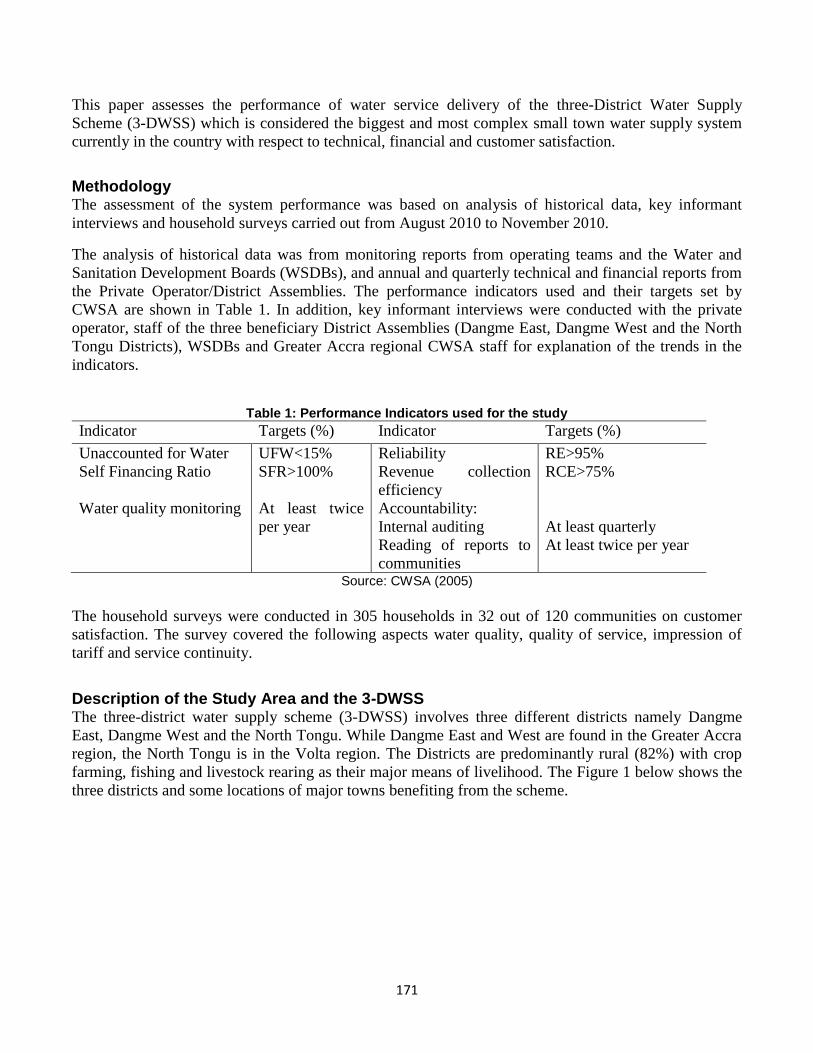
171
This paper assesses the performance of water service delivery of the three-District Water Supply
Scheme (3-DWSS) which is considered the biggest and most complex small town water supply system
currently in the country with respect to technical, financial and customer satisfaction.
Methodology The assessment of the system performance was based on analysis of historical data, key informant
interviews and household surveys carried out from August 2010 to November 2010.
The analysis of historical data was from monitoring reports from operating teams and the Water and
Sanitation Development Boards (WSDBs), and annual and quarterly technical and financial reports from
the Private Operator/District Assemblies. The performance indicators used and their targets set by
CWSA are shown in Table 1. In addition, key informant interviews were conducted with the private
operator, staff of the three beneficiary District Assemblies (Dangme East, Dangme West and the North
Tongu Districts), WSDBs and Greater Accra regional CWSA staff for explanation of the trends in the
indicators.
Table 1: Performance Indicators used for the study
Indicator Targets (%) Indicator Targets (%)
Unaccounted for Water UFW<15% Reliability RE>95%
Self Financing Ratio SFR>100% Revenue collection
efficiency
RCE>75%
Water quality monitoring
At least twice
per year
Accountability:
Internal auditing
Reading of reports to
communities
At least quarterly
At least twice per year
Source: CWSA (2005)
The household surveys were conducted in 305 households in 32 out of 120 communities on customer
satisfaction. The survey covered the following aspects water quality, quality of service, impression of
tariff and service continuity.
Description of the Study Area and the 3-DWSS The three-district water supply scheme (3-DWSS) involves three different districts namely Dangme
East, Dangme West and the North Tongu. While Dangme East and West are found in the Greater Accra
region, the North Tongu is in the Volta region. The Districts are predominantly rural (82%) with crop
farming, fishing and livestock rearing as their major means of livelihood. The Figure 1 below shows the
three districts and some locations of major towns benefiting from the scheme.
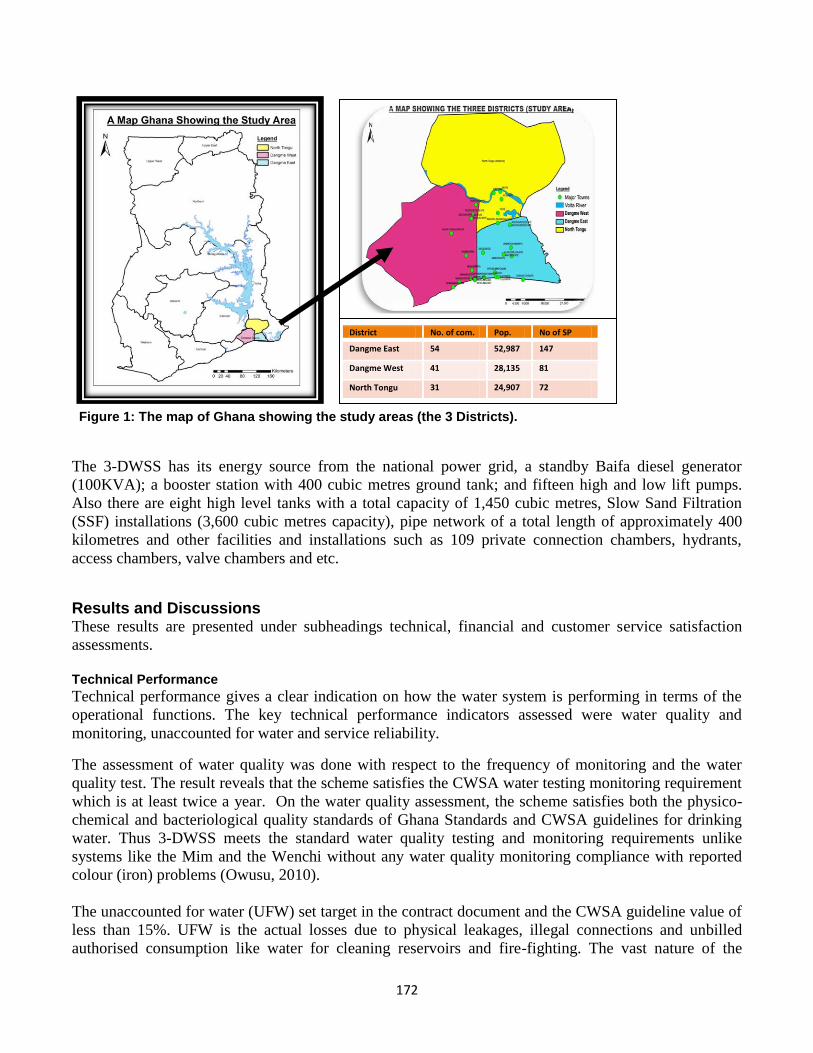
172
The 3-DWSS has its energy source from the national power grid, a standby Baifa diesel generator
(100KVA); a booster station with 400 cubic metres ground tank; and fifteen high and low lift pumps.
Also there are eight high level tanks with a total capacity of 1,450 cubic metres, Slow Sand Filtration
(SSF) installations (3,600 cubic metres capacity), pipe network of a total length of approximately 400
kilometres and other facilities and installations such as 109 private connection chambers, hydrants,
access chambers, valve chambers and etc.
Results and Discussions These results are presented under subheadings technical, financial and customer service satisfaction
assessments. Technical Performance
Technical performance gives a clear indication on how the water system is performing in terms of the
operational functions. The key technical performance indicators assessed were water quality and
monitoring, unaccounted for water and service reliability.
The assessment of water quality was done with respect to the frequency of monitoring and the water
quality test. The result reveals that the scheme satisfies the CWSA water testing monitoring requirement
which is at least twice a year. On the water quality assessment, the scheme satisfies both the physico-
chemical and bacteriological quality standards of Ghana Standards and CWSA guidelines for drinking
water. Thus 3-DWSS meets the standard water quality testing and monitoring requirements unlike
systems like the Mim and the Wenchi without any water quality monitoring compliance with reported
colour (iron) problems (Owusu, 2010).
The unaccounted for water (UFW) set target in the contract document and the CWSA guideline value of
less than 15%. UFW is the actual losses due to physical leakages, illegal connections and unbilled
authorised consumption like water for cleaning reservoirs and fire-fighting. The vast nature of the
Figure 1: The map of Ghana showing the study areas (the 3 Districts).
District No. of com. Pop. No of SP
Dangme East 54 52,987 147
Dangme West 41 28,135 81
North Tongu 31 24,907 72
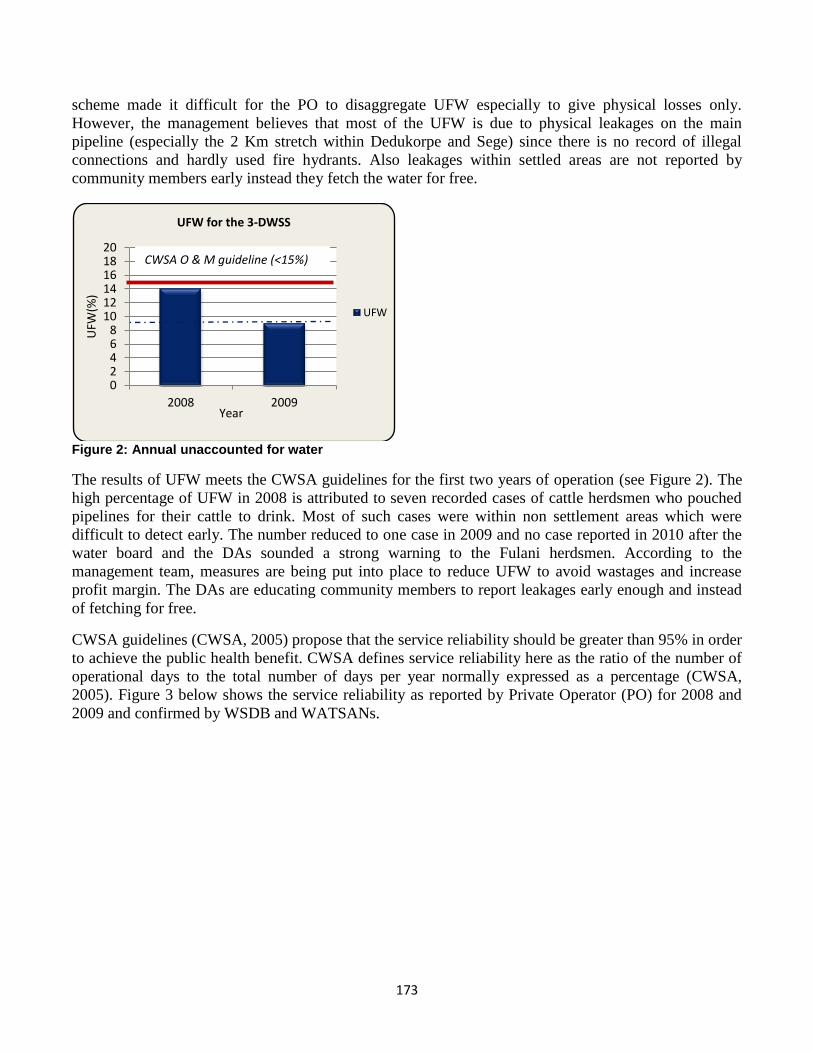
173
scheme made it difficult for the PO to disaggregate UFW especially to give physical losses only.
However, the management believes that most of the UFW is due to physical leakages on the main
pipeline (especially the 2 Km stretch within Dedukorpe and Sege) since there is no record of illegal
connections and hardly used fire hydrants. Also leakages within settled areas are not reported by
community members early instead they fetch the water for free.
Figure 2: Annual unaccounted for water
The results of UFW meets the CWSA guidelines for the first two years of operation (see Figure 2). The
high percentage of UFW in 2008 is attributed to seven recorded cases of cattle herdsmen who pouched
pipelines for their cattle to drink. Most of such cases were within non settlement areas which were
difficult to detect early. The number reduced to one case in 2009 and no case reported in 2010 after the
water board and the DAs sounded a strong warning to the Fulani herdsmen. According to the
management team, measures are being put into place to reduce UFW to avoid wastages and increase
profit margin. The DAs are educating community members to report leakages early enough and instead
of fetching for free.
CWSA guidelines (CWSA, 2005) propose that the service reliability should be greater than 95% in order
to achieve the public health benefit. CWSA defines service reliability here as the ratio of the number of
operational days to the total number of days per year normally expressed as a percentage (CWSA,
2005). Figure 3 below shows the service reliability as reported by Private Operator (PO) for 2008 and
2009 and confirmed by WSDB and WATSANs.
0 2 4 6 8
10 12 14 16 18 20
2008 2009
UFW
(%)
Year
UFW for the 3-DWSS
UFW
CWSA O & M guideline (<15%)

174
Figure 3: Service Reliability for 3-DWSS
The relatively low service reliability in 2008 is attributed to the high frequent power cuts within that
year. According to the operating team, the fuel (diesel) needed to run the gen sets (as standby energy
source) was expensive and could not afford it all the time because of the schemes’ wider coverage
requiring lot of energy. For the 2010 year the team expected service reliability of about 95% (less than
2009) because the scheme for the past two months had been running on three (3) high lift pumps instead
of the six provided (three damaged)making it impossible to run every day.
Financial Performance
The financial performance of the scheme is assessed using revenue collection efficiency and cost
recovery. At the start of operations, the revenue collection efficiency (RCE) was 30% when the
WATSANs were in-charge for the revenue mobilization from the vendors for 5 months. When the PO
was put in-charge after the WATSANs’ poor performance, the efficiency shot up to 99%. Though the
change over has resulted in poor working relations between the WATSANs and the operator, it has
prevented huge revenue losses from users. Also the revenue collection efficiency with the private
institutions and individuals is 100%. However, the collection efficiency with government institutions is
poor because of delays in payment where in a particular instant over a year bill had not been settled by
the ministry.
According to management of the scheme, the larger consumer is community users (over 95%) and
higher RCE (99%) with this group is positive for the whole system. Though the overall RCE looks good
but for long term sustainability, RCE should be 100% by instituting effective mechanisms to improve
efficiency with the government institutions. 100% RCE is more recommendable in terms of
sustainability even though from the CWSA Operations and Maintenance guidelines (CWSA, 2005), the
RCE should be 75% or more.
CWSA uses the self financing ratio (SFR) for cost recovery assessment and satisfactory SFR should be
greater than 100%. The SFR of the operator is approximately 102% (see Box 1 below) based on the
2009 records. The result indicates a satisfactory cost recovery for the system using the CWSA norm
though figures used in the computation exclude revenue from institutions and commercial businesses.
The private operator believes subsequent years will follow similar self financing ratio.
70
75
80
85
90
95
100
2008 2009 Year
Service Reliability for the Scheme
CWSA norm =95%
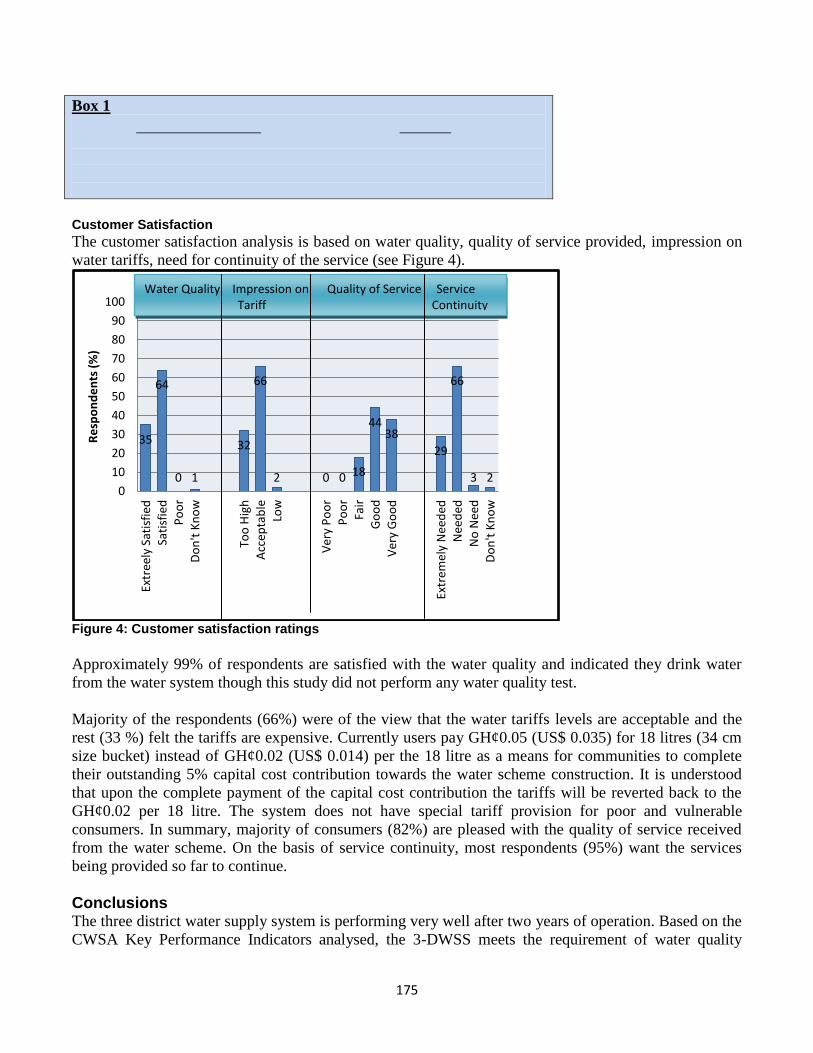
175
Box 1
Customer Satisfaction
The customer satisfaction analysis is based on water quality, quality of service provided, impression on
water tariffs, need for continuity of the service (see Figure 4).
Figure 4: Customer satisfaction ratings
Approximately 99% of respondents are satisfied with the water quality and indicated they drink water
from the water system though this study did not perform any water quality test.
Majority of the respondents (66%) were of the view that the water tariffs levels are acceptable and the
rest (33 %) felt the tariffs are expensive. Currently users pay GH¢0.05 (US$ 0.035) for 18 litres (34 cm
size bucket) instead of GH¢0.02 (US$ 0.014) per the 18 litre as a means for communities to complete
their outstanding 5% capital cost contribution towards the water scheme construction. It is understood
that upon the complete payment of the capital cost contribution the tariffs will be reverted back to the
GH¢0.02 per 18 litre. The system does not have special tariff provision for poor and vulnerable
consumers. In summary, majority of consumers (82%) are pleased with the quality of service received
from the water scheme. On the basis of service continuity, most respondents (95%) want the services
being provided so far to continue.
Conclusions The three district water supply system is performing very well after two years of operation. Based on the
CWSA Key Performance Indicators analysed, the 3-DWSS meets the requirement of water quality
35
64
0 1
32
66
2 0 0 18
44 38
29
66
3 2 0
10
20
30
40
50
60
70
80
90
100
Extr
eely
Sat
isfi
ed
Sati
sfie
d
Po
or
Do
n't
Kn
ow
Too
Hig
h
Acc
epta
ble
Lo
w
Ver
y P
oo
r P
oo
r Fa
ir
Go
od
V
ery
Go
od
Extr
emel
y N
eed
ed
Nee
ded
N
o N
eed
D
on
't K
no
w
Re
spo
nd
en
ts (
%)
Water Quality Impression on Quality of Service Service Tariff Continuity

176
standards (water quality testing and monitoring frequency), self financing ratio, un-accounted for water
(UFW), service reliability and revenue collection efficiency. Furthermore, the consumers are satisfied
with the service. Thus the overall performance of the 3-DWSS is good from technical, financial and
customer satisfaction assessments. The water system is operated by the private operator who has the
incentive to improve performance since their management fee is linked to quantity of water that is
delivered to the users.
For the purpose of long term sustainability, performance could be improved especially by addressing the
few challenges such as delays in payment of bills by government institutions; frequent pumps
breakdowns, frequent power fluctuations, delays in the detection of leakages, etc. Further studies are
recommended on the scheme for performance monitoring with time as the system becomes old and also
on partnership performance between the District Assemblies and the Private Operator to get a complete
story for similar water schemes.
____________________________________________________________________________________
Acknowledgement The authors wish to acknowledge UNESCO-IHE Partnership Research Fund (UpARF) for the
sponsorship the research; the management of 3-DWSS (DAs, PO, WSDBs, and WATSANs), CWSA
(Greater Accra region) and respondents from various communities for providing the relevant
information for analysis.
_____________________________________________________________________________________
References 1. CWSA (2005): Small Communities Water & Sanitation Policy, “Operation and Maintenance
guideline for Small Towns”. Ministry of Water Resources, Works and Housing, Accra.
2. CWSA (2009): Small Communities Water & Sanitation Policy, “Operation and Maintenance
guideline for Small Towns”, Ministry of Water Resources, Works and Housing, Community Water
and Sanitation Agency, Accra.
3. Gupta (2006): Measuring the performance of water service providers in urban India: Implications for
managing water utilities, November 2006, National Institute of Urban Affairs (NIUA) WP 06-08, pp
2-3.
4. Maple Consult (2008): Final Report on Three Districts Water Supply Project.
5. Ministry of Water Resources, Works and Housing; MWRWH (2009): Water and Sanitation Sector
Performance Report, 2009, Government of Ghana.
6. Owusu, P. A. (2010): Partnership in Small towns’ water service delivery in Ghana, Master of
Science Thesis, 2010, Water Resources and Environmental Sanitation Project – KNUST.
7. WSP (2006): “India water supply and sanitation: bridging the gap between infrastructure and
service” Water and sanitation program: Delhi.

177
_______________________________________________________________________________
Contact Details Nyarko K. B.
WASHCost Ghana/Civil Eng. Dept
KNUST-Ghana
Tel: +233208165515
Email: nyarko.k.b@gmail
Oduro-Kwarteng S.
Civil Eng. Dept
KNUST-Ghana
Tel:+233206606238
Email: sodurokwarteng@gmail
Dwumfour-Asare B.
WASHCost -Ghana
Civil Eng. Dept
KNUST-Ghana
Tel: +233261533327
Email: [email protected]
Ankomah J. H.
Civil Eng. Dept
KNUST-Ghana
Tel: +233246676414
Email: [email protected]
_______________________________________________________________________________
178
________________________________________________________________________________
3rd Ghana Water Forum, Accra, Ghana, 2011 Water and Sanitation Services Delivery in a Rapidly Changing Urban Environment
Cancer Health Risk Assessment of Resident Adults and Children from
Exposure to Arsenic in Contaminated Water Bodies in Obuasi Municipality
S. Obiri, A. F.
Armah & A. P. Awuah
________________________________________________________________________________
Abstract Cancer health risk was assessed for resident adults and children from exposure to borehole, tap
and surface water in the Obuasi Municipality in line with USEPA’s (US Environmental Protection
Agency) Human Health Risk Assessment guidelines. The results of cancer health risk for resident
adults in Obuasi exposed to arsenic in their tap water for both Central Tendency Exposure (CTE)
and Reasonable Maximum Exposure (RME) parameters respectively are 6.6 x 10⁻⁴
and 5.5 x 10⁻⁶
,
which means that approximately 7 out of 10,000 resident adults in Obuasi who are exposed to
arsenic in tap water are likely to develop cancer related diseases by CTE parameters and 6 out of
every 1,000,000 resident adults are also likely to develop cancer related diseases by ingesting
arsenic in the tap water per RME parameters. For resident children, we had 4.3 x 10⁻³
and 4.6 x
10-3
by both CTE and RME parameters respectively. That is, 4 and 5 resident children out of every
1,000 children are likely to suffer from cancer related diseases by both CTE and RME parameters
respectively, which is above USEPA’s acceptable cancer risk range of 1 x 10⁻⁶
to 1 x 10⁻⁴
, i.e., 1
case of cancer out of 1,000,000 people to 1 case of cancer out of 10,000 people.
________________________________________________________________________________
Introduction Surface water in most mining communities in Ghana have become unfit for human consumption
due to chemical contamination from gold mining and processing activities such as roasting of
arsenopyrites ores and cyanide heap leach methods (Obiri, 2007). Obuasi municipality, the
primary focus of this paper has a long history of gold mining which dates as far back as AD 1896.
Studies conducted by several scientists has revealed that most water bodies in the study area as
well as other gold mining communities have high levels of inorganic arsenic (Adimadoo and
Amegbey, 2003; Carbo and Serfor–Armah, 1997). Oral and dermal exposure to arsenic in water causes a lot of diseases among which include
gastrointestinal symptoms such as nausea, diarrhoea, loss of water, central and peripheral
neuropathy, cancer of the skin, lung, liver and blood, skin pigmentation such as hyperkerotosis,
melanosis, blackfoot disease, reproductive toxicity (see figure 1 below for pictures of patients with
symptoms of arsenic related diseases).
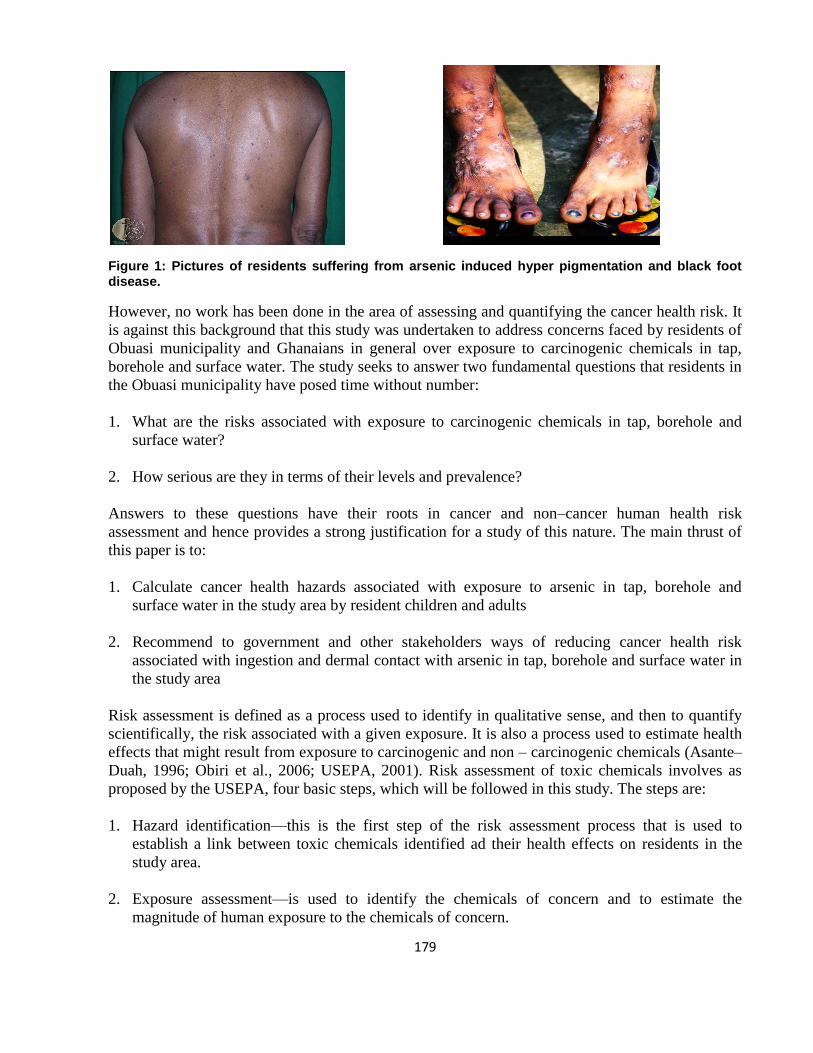
179
Figure 1: Pictures of residents suffering from arsenic induced hyper pigmentation and black foot disease.
However, no work has been done in the area of assessing and quantifying the cancer health risk. It
is against this background that this study was undertaken to address concerns faced by residents of
Obuasi municipality and Ghanaians in general over exposure to carcinogenic chemicals in tap,
borehole and surface water. The study seeks to answer two fundamental questions that residents in
the Obuasi municipality have posed time without number:
1. What are the risks associated with exposure to carcinogenic chemicals in tap, borehole and
surface water?
2. How serious are they in terms of their levels and prevalence?
Answers to these questions have their roots in cancer and non–cancer human health risk
assessment and hence provides a strong justification for a study of this nature. The main thrust of
this paper is to:
1. Calculate cancer health hazards associated with exposure to arsenic in tap, borehole and
surface water in the study area by resident children and adults
2. Recommend to government and other stakeholders ways of reducing cancer health risk
associated with ingestion and dermal contact with arsenic in tap, borehole and surface water in
the study area
Risk assessment is defined as a process used to identify in qualitative sense, and then to quantify
scientifically, the risk associated with a given exposure. It is also a process used to estimate health
effects that might result from exposure to carcinogenic and non – carcinogenic chemicals (Asante–
Duah, 1996; Obiri et al., 2006; USEPA, 2001). Risk assessment of toxic chemicals involves as
proposed by the USEPA, four basic steps, which will be followed in this study. The steps are:
1. Hazard identification—this is the first step of the risk assessment process that is used to
establish a link between toxic chemicals identified ad their health effects on residents in the
study area.
2. Exposure assessment—is used to identify the chemicals of concern and to estimate the
magnitude of human exposure to the chemicals of concern.
180
3. Toxicity assessment—identifies the toxicity criteria to be used to evaluate human risk
associated with each carcinogenic and non-carcinogenic chemical in the study area.
4. Risk characterization/estimation—incorporates information gathered from hazard
identification, exposure assessment and toxicity assessment to evaluate the potential health risk
residents in the study area face.
Random sampling techniques were adopted in the collection of sixty water samples from rivers,
boreholes and tap water in the study area between March 2006 and June 2006. The samples were
stored under 4 C and conveyed to CSIR–Water Research Institute for the analysis of total arsenic
and pH. The results of the concentration of arsenic in the samples have been shown in table 1.0
below and were used as input parameters for the calculation of the cancer health risk.
An exposure assessment is used to identify and evaluate the pathways through which constituents
of concern (COC’s) enter the human body, and to estimate the magnitude of human exposure to
arsenic. In this scenario, ingestion and dermal contact of tap, borehole and surface water in the
study area by resident adults and children were evaluated based on both Central Tendency
Exposure (CTE) and Reasonable Maximum Exposure (RME) parameters respectively. CTE
exposure parameters were used so that health risks associated with typical or average exposures to
the COC’s can be calculated. RME parameters were also used so that health risks associated with
high–end exposures can be calculated.
The potential receptors evaluated in this study are resident adults and children aged between 20 –
80 years and 2 – 19 years respectively.
The USEPA has provided oral cancer slope factor (CSForal) values in its online toxicity database
file for use in assessing cancer health risk from exposure to arsenic in tap, borehole and surface
water. Default values were used from RISC 4.02 software for CSFdermal respectively for assessing
health risks associated with exposure to arsenic in drinking water.
Cancer health risks were evaluated using RISC 4.02 human health risk software. The results of the
analytical concentration of arsenic in the water samples in table 1.0 below were used to calculate
excess cancer risk using the RISC 4.02 software.
Results and Discussions The results of concentration of arsenic in the water samples, pH and cancer health risks for both
resident adults and children from exposure to arsenic in tap, borehole and surface water in the
Obuasi Municipality have been presented in Tables 1 and 2 below.
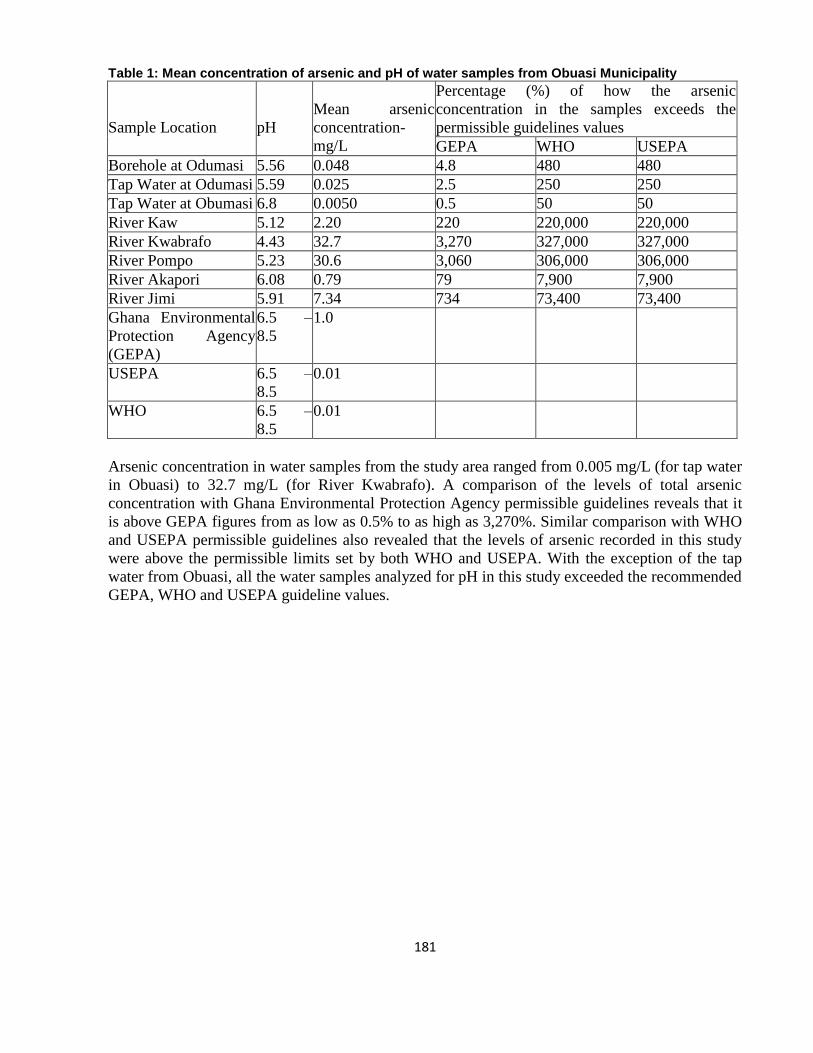
181
Table 1: Mean concentration of arsenic and pH of water samples from Obuasi Municipality
Sample Location
pH
Mean arsenic
concentration-
mg/L
Percentage (%) of how the arsenic
concentration in the samples exceeds the
permissible guidelines values
GEPA WHO USEPA
Borehole at Odumasi 5.56 0.048 4.8 480 480
Tap Water at Odumasi 5.59 0.025 2.5 250 250
Tap Water at Obumasi 6.8 0.0050 0.5 50 50
River Kaw 5.12 2.20 220 220,000 220,000
River Kwabrafo 4.43 32.7 3,270 327,000 327,000
River Pompo 5.23 30.6 3,060 306,000 306,000
River Akapori 6.08 0.79 79 7,900 7,900
River Jimi 5.91 7.34 734 73,400 73,400
Ghana Environmental
Protection Agency
(GEPA)
6.5 –
8.5
1.0
USEPA 6.5 –
8.5
0.01
WHO 6.5 –
8.5
0.01
Arsenic concentration in water samples from the study area ranged from 0.005 mg/L (for tap water
in Obuasi) to 32.7 mg/L (for River Kwabrafo). A comparison of the levels of total arsenic
concentration with Ghana Environmental Protection Agency permissible guidelines reveals that it
is above GEPA figures from as low as 0.5% to as high as 3,270%. Similar comparison with WHO
and USEPA permissible guidelines also revealed that the levels of arsenic recorded in this study
were above the permissible limits set by both WHO and USEPA. With the exception of the tap
water from Obuasi, all the water samples analyzed for pH in this study exceeded the recommended
GEPA, WHO and USEPA guideline values.
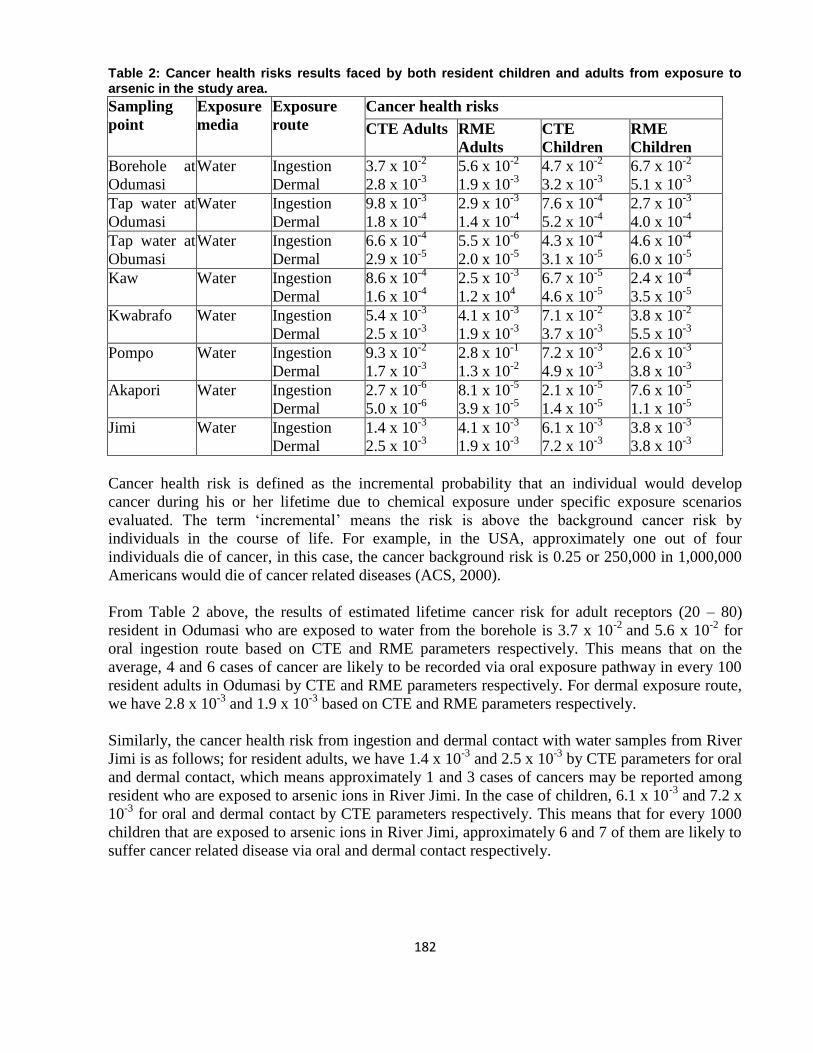
182
Table 2: Cancer health risks results faced by both resident children and adults from exposure to arsenic in the study area.
Sampling
point
Exposure
media
Exposure
route
Cancer health risks
CTE Adults RME
Adults
CTE
Children
RME
Children
Borehole at
Odumasi
Water Ingestion
Dermal
3.7 x 10⁻²
2.8 x 10⁻³
5.6 x 10⁻²
1.9 x 10⁻³
4.7 x 10⁻²
3.2 x 10⁻³
6.7 x 10⁻²
5.1 x 10⁻³
Tap water at
Odumasi
Water Ingestion
Dermal
9.8 x 10⁻³
1.8 x 10⁻⁴
2.9 x 10⁻³
1.4 x 10⁻⁴
7.6 x 10⁻⁴
5.2 x 10⁻⁴
2.7 x 10⁻³
4.0 x 10⁻⁴
Tap water at
Obumasi
Water Ingestion
Dermal
6.6 x 10⁻⁴
2.9 x 10⁻⁵
5.5 x 10⁻⁶
2.0 x 10⁻⁵
4.3 x 10⁻⁴
3.1 x 10⁻⁵
4.6 x 10⁻⁴
6.0 x 10⁻⁵
Kaw Water Ingestion
Dermal
8.6 x 10⁻⁴
1.6 x 10⁻⁴
2.5 x 10⁻³
1.2 x 10⁴
6.7 x 10⁻⁵
4.6 x 10⁻⁵
2.4 x 10⁻⁴
3.5 x 10⁻⁵
Kwabrafo Water Ingestion
Dermal
5.4 x 10⁻³
2.5 x 10⁻³
4.1 x 10⁻³
1.9 x 10⁻³
7.1 x 10⁻²
3.7 x 10⁻³
3.8 x 10⁻²
5.5 x 10⁻³
Pompo Water Ingestion
Dermal
9.3 x 10⁻²
1.7 x 10⁻³
2.8 x 10⁻¹
1.3 x 10⁻²
7.2 x 10⁻³
4.9 x 10⁻³
2.6 x 10⁻³
3.8 x 10⁻³
Akapori Water Ingestion
Dermal
2.7 x 10⁻⁶
5.0 x 10⁻⁶
8.1 x 10⁻⁵
3.9 x 10⁻⁵
2.1 x 10⁻⁵
1.4 x 10⁻⁵
7.6 x 10⁻⁵
1.1 x 10⁻⁵
Jimi Water Ingestion
Dermal
1.4 x 10⁻³
2.5 x 10⁻³
4.1 x 10⁻³
1.9 x 10⁻³
6.1 x 10⁻³
7.2 x 10⁻³
3.8 x 10⁻³
3.8 x 10⁻³
Cancer health risk is defined as the incremental probability that an individual would develop
cancer during his or her lifetime due to chemical exposure under specific exposure scenarios
evaluated. The term ‘incremental’ means the risk is above the background cancer risk by
individuals in the course of life. For example, in the USA, approximately one out of four
individuals die of cancer, in this case, the cancer background risk is 0.25 or 250,000 in 1,000,000
Americans would die of cancer related diseases (ACS, 2000).
From Table 2 above, the results of estimated lifetime cancer risk for adult receptors (20 – 80)
resident in Odumasi who are exposed to water from the borehole is 3.7 x 10⁻²
and 5.6 x 10⁻²
for
oral ingestion route based on CTE and RME parameters respectively. This means that on the
average, 4 and 6 cases of cancer are likely to be recorded via oral exposure pathway in every 100
resident adults in Odumasi by CTE and RME parameters respectively. For dermal exposure route,
we have 2.8 x 10⁻³
and 1.9 x 10⁻³
based on CTE and RME parameters respectively.
Similarly, the cancer health risk from ingestion and dermal contact with water samples from River
Jimi is as follows; for resident adults, we have 1.4 x 10⁻³
and 2.5 x 10⁻³
by CTE parameters for oral
and dermal contact, which means approximately 1 and 3 cases of cancers may be reported among
resident who are exposed to arsenic ions in River Jimi. In the case of children, 6.1 x 10⁻³
and 7.2 x
10-3
for oral and dermal contact by CTE parameters respectively. This means that for every 1000
children that are exposed to arsenic ions in River Jimi, approximately 6 and 7 of them are likely to
suffer cancer related disease via oral and dermal contact respectively.
183
_______________________________________________________________________
Key Lessons Learnt From the discussion above, it is important to take note of the following:
1. The long history of gold mining operations in the study area has impacted negatively on the
quality of water bodies in the study area.
2. Elevated levels of arsenic were found in most of the water bodies sampled in this study with
the exception of tap water in Obuasi which had arsenic concentration of 0.0050 mg/L. Also
low pH values were recorded for the water bodies sampled in this study. A comparison of
arsenic levels in the water bodies sampled in this study with WHO and USEPA permissible
guideline values shows that they exceeded the limits by 5–327,000%.
3. Ingestion and dermal contact of the arsenic contaminated water bodies in the study area is
responsible for the high levels of cancer health risk results faced by resident adults and
children. The cancer health risk results obtained in this study were found to be above the
USEPA acceptable cancer risk range of 1 x10⁻⁴
to 1 x 10⁻⁶
.
4. It calls for a strict enforcement of all regulations governing health and environmental quality of
the mining sector.
Conclusion Given that only total arsenic was measured in this study and the fact that it is not only arsenic that
is present in water bodies, soil, air and food crops in the study area for which resident adults and
children might be exposed, it follows that considerable uncertainty exists regarding the actual
toxicities of the various forms of toxic chemicals in water bodies for which resident adults and
children might be exposed to. Similarly, arsenic is noted to cause non–cancer diseases such as
diabetes mellitus, nausea, blackfoot disease, keratosis, etc which were not considered in this study.
The results of cancer health risk indicates high prevalence of diseases associated with exposure to
arsenic via oral and dermal contact with tap, borehole and surface water in the study area. The
cancer health risk results obtained from Obuasi Municipality in most cases exceeded USEPA
acceptable cancer health risk range of 1 x 10⁻⁴
to 1 x 10⁻⁶
, i.e., one case of cancer in every 10,000
to 1,000,000 people and acceptable hazard index of 1.0 (USEPA, 1989, 1997).
Comparing the cancer health risk results obtained in this study to the average life expectancy
figures of 55.4 years for men and 58.6 years for women in Ghana, it can be inferred that resident
adults and children in the study area would have reduced life expectancy figures (GLSS, 2003).
Government and other stakeholders responsible for providing potable water should act accordingly
to provide clean and safe drinking water for residents in the Obuasi Municipality.
184
Recommendations 1. A similar study should be conducted in different regions or mining communities to assess the
health impacts of exposure to toxic chemicals used in mining operations by both small scale
mining and mining companies.
2. Civil society organisations working in the sector should advocate for the establishment and
resourcing of the Agency for Toxic Substances and Disease Registry in all mining
communities which should be mandated to carry out further medical examination of some
diseases such as diarrhoea, nausea, etc which have other causative agents. This will help
government and all stakeholders to have a firm knowledge about the impacts of mining
operations on human health of residents of mining communities in Ghana.
3. Government, CSOs, Ghana Health Service, EPA, Minerals Commission, CHRAJ and other
stakeholders should continuously educate residents of mining communities on (a) content of
EIS of mining companies prepared by mining companies (b) “galamsey” operators to desist
from smelting of the gold amalgam in the communities.
________________________________________________________________________________
Acknowledgement We are grateful to WACAM and its partners for funding this project.
________________________________________________________________________________
References 1. Ahmad, K.; Carboo, D. (2000): Speciation of As (III) and As (V) in some Ghanaian gold
tailings by a simple distillation method. Water, Air and Soil Pollution. 122:317-326.
2. American Cancer Society (ACS, 2000): Statistics facts and figures. Available:
www.cancer.org/statistics/index. 12/27/2006
3. Asante – Duah, D. K. (1996): Managing contaminated sites: Problem diagnosis and
development of site restoration. John Wiley, West Sussex.
4. Carboo, D. And Serfor – Armah, Y. (1997): Arsenic in stream and sediments in Obuasi area.
Proceeding of the symposium on the mining industry and the environment KNUST/IDRC
1997, 114 – 119.
5. Ghana Living Standard Survey (GLSS, 2003): Ghana Demographic and health survey, Ghana
Statistical Service, Unpublished, Accra.
6. Obiri, S. (2007): Determination of heavy metal in water from boreholes in Dumasi in the
Wassa West District of Western Region of Republic of Ghana. Environmental Monitoring and
Assessment. 130: 455 – 463.
7. Obiri, S., Dodoo, D. K., Essumang, D. K. and Okai – Sam, F. (2006): Cancer health risk
assessment from exposure to arsenic by workers of Anglogold Ashanti – Obuasi Mine. Bull.
Environ. Contam. Toxicol. 76: 195-201.

185
8. USEPA (1989): Risk Assessment Guidance for Superfund (RAGS), Vol. I, Human Health
Evaluation Manual (Part A), Office of Emergency and Remedial Response, Washington, D.C.,
OWSER Directive 9285. 7-01A. EPA-540/1-89 -002.
9. USEPA (1997): Exposure Factor Handbook NCEA-W-005. 1995.107. USEPA: Exposure
Factors Handbook. Vol. I: General Factors, Office Of Research And Development,
Washington, D.C. 1997
10. USEPA (2001b): Integrated Risk Information System (IRIS), National Centre for
Environmental Assessment, Office of Research and Development, Washington, D.C., USA.
________________________________________________________________________________
Contact Details Samuel Obiri
Centre for Environmental Impact Analysis
P. O. Box AD 738
Cape Coast
Email: [email protected]
Frederick Ato Armah
School of Biological Sciences
University of Cape Coast
Cape Coast
Email: [email protected]
Priscilla Achiaa Awuah
Centre for Environmental Impact Analysis
P. O. Box AD 738
Cape Coast
Email: [email protected]
________________________________________________________________________________

186
________________________________________________________________________________
3rd Ghana Water Forum, Accra, Ghana, 2011
Water and Sanitation Services Delivery in a Rapidly Changing Urban Environment
Suitability of the Private Finance Initiative (PFI) System for Adoption in
Ghana’s Water Sector
Ofori-Kuragu K, Attafua Y.B. & Lamptey L. J.
________________________________________________________________________________
Abstract Despite successive intervention programmes, Ghana’s water sector continues to cause concern.
Large areas of Ghana do not have access to safe drinking water. In most cases, supply of water is
rationed, sometimes for days. The quality of water produced in most cases is poor. The dire
situation of Ghana’s water supply system is a result, among other reasons, of a lack of investment
in the water supply system for several decades. The government continues to be the major
financier of the network, however, with lots of other competing priorities; the water sector has
suffered decades of underinvestment leading to the deterioration of Ghana’s water infrastructure.
To improve the current state of Ghana’s water supply system, urgent efforts are required to
mobilise funds to invest in the network. This requires innovative approaches to the management
and financing of infrastructure which reduces the over-dependence on the government as the main
financier and with responsibility for asset development. This paper explores the suitability of the
Private Finance Initiative (PFI) system for adoption in Ghana’s water sector. An assessment of the
current situation of water supply is made. Alternatives to the current system for developing,
financing and maintaining infrastructure are explored. Drawing lessons from current best
practice, the paper makes recommendations on the way forward for Ghana’s water sector.
________________________________________________________________________________
Introduction The need to provide infrastructure for the urban water sector to meet the needs of Ghana’s
population is a major challenge. According to the Ghana’s National Water Policy, the Ghana
Water Company Limited (GWCL) produces just about 45% of daily demand with
only 41.4% of people living in urban areas having piped water in their homes (Water Resources
Commission, 2008). Insufficient water supply in urban and peri-urban centres is attributed to the
worsening financial situation of the utility, low levels of investment in the sector as well as poor
managerial and implementation capacity. With the current state of operation where about 50% of
the water supplied is unaccounted for due to leakages, illegal connections and inefficient
distribution infrastructure, poor revenue mobilisation, the current system of operation can be
described as inefficient (Water Aid, 2008).
Apart from problems such as political interference and poor management of Ghana’s urban water
sector through the years, competition from different sectors for government resources limits
investment in infrastructure to about a third of what is actually required to meet the growing
demand (Water Aid, 2008). Whilst the Government of Ghana (GoG) has shown interest in a
greater role by the private sector in the provision of public services previously exclusively
provided by governmental agencies including some new works, the involvement of the private

187
sector in the water sector is mainly in the form of small businesses operating as suppliers to areas
not connected to the network (PURC, 2005). In 2005, the water sector had its first exposure to
international private participation through a Management Contract with Aqua Vitens Rand Limited
(AVRL) in which AVRL was responsible for operations and customer service whilst GWCL
remained the asset holder with responsibility for developing and expanding infrastructure
(Agblevor, 2011). However, following the final review of the AVRL’s Management Contract by
an independent Consultant appointed by the Government of Ghana and the World Bank, it
emerged that AVRL failed to meet vital targets such the water quality service standard; delays in
Customer Accounts Receivables as well as the unimpressive targets for Treatment Plant Operating.
Management of Ghana’s urban water sector has been entrusted to an interim Special Purpose
Vehicle (SPV), Ghana Urban Water Ltd for a period of 12 months with GWCL still responsible for
the assets (Agblevor, 2011). Given that AVRL was brought in to address the perceived
shortcomings of GWCL, there is concern as to the future direction of Ghana’s water services.
This paper explores alternatives to the current structure, organisation and management of Ghana’s
water sector. The potential for the Private Finance Initiative (PFI), a public private partnership
system of procurement is explored. Recommendations are made as to the way forward for Ghana’s
water sector.
Explanation of Key Terms Public-Private Partnerships (PPPs)
Merna and Smith (1999) describe a situation where projects are not sufficiently robust to be
procured by total private finance funding, in which case the gap between commercial and private
funding can be closed by some type of public sector involvement. PPP projects deliver
significantly improved public services in terms of both the quality and the quantum of investment,
release the full potential of public sector assets to provide value-for-money for the taxpayer and
wider benefits for the economy (Balfour Beatty, 2004).
Concession Contracts
In concession contracts, a contractor effectively becomes the promoter and finances the project,
operates and maintains it over an agreed period of time to generate a commercial return. At the
expiration of the concession period, all assets revert back to the original owners. Variants of Concession Contracts
Pricewaterhouse Coopers (2004) developed a framework for the implementation of concession
projects in Ghana. Some other variants in concession contracts identified in Pricewaterhouse
Coopers (2004) include: Finance Build Own Operate Transfer (FBOOT), Build Own Operate
(BOO), Build Own Lease (BOL), Design Build Operate Maintain (DBOM), Design Build Operate
Transfer (DBOT), Build Operate Deliver (BOD), Build Own Operate Subsidise (BOOST), Build
Transfer Operate (BTO), Maintain Operate and Transfer (MOT), Reconstruct Operate and
Transfer (ROT) and Build Operate Transfer (BOT).
Private Finance Initiative (PFI)
PFI is the system of procurement, which involves the use of private sector finance and
management in the provision of public services in which the public sector or the government
makes a commitment at the contract stage to acquire the services to be provided by the private
sector (Merna and Smith, 1999). In its simplest form, PFI incorporates a guarantee by the
188
government to procure the services to be provided by the management organisation or a guarantee
by the government that the services will be procured by the public (Merna and Smith, 1994).
Using PFI in Infrastructure Provision Why PFI?
The PFI system of procurement enables the provision of world-class infrastructure and public
services (HM Treasury, 2003) and the modernisation of infrastructure even in times of public-
sector spending controls where strict limits are placed on public sector borrowing (Grout 1997).
This according to Grout (1997) removes the need for the “upfront funding” as in the case of
traditional funding of projects. Where debt financing is used to finance infrastructural development
and public services provision, these costs and associated interests are kept off government books.
Types of PFI Projects
There are three (3) main forms of PFI namely: joint ventures, financially independent projects and
services-sold projects. Financially independent projects involve the identification of a business
opportunity in public service delivery by a private sector operator which seeks approval from the
state and sets out to design and finance the project. The private entity after completion charges the
consumer for use of the facility. Joint-ventures involve an agreement by the public and private
sectors to share equity of a facility to be operated by the private sector with the aim of making
profit whilst the private sector retains control. The public sector’s interest stems from the fact that
the project will deliver a public service or help solve a public problem (Owen & Merna, 1997). In
the services sold system, the public entity has specifications for a public service to be provided for
a concession by a private partner selected competitively and is required to provide a service for a
concession period of usually 25-30 years. During this period the state will make payments for the
availability of the service till the end of the concession period. After this period, the public sector
takes over the ownership and operation of the facility (Owen & Merna, 1997).
PFI versus Privatisation
PFI differs from privatisation because in PFI schemes unlike privatisation, the public sector retains
a substantial role, either as the main purchaser of the services provided, or as an enabler of the
project and guardian of the users’ interests (Merna and Smith, 1999). In the case of Ghana’s urban
water sector, the state could assume the role of an enabler responsible for protecting user interests.
Financing PFI Projects Project Financing
In Project Financing, the future cash flow provides the basis for raising resources for investing in
the project. Merna and Smith (1999) explain that the entire financing of the project is dependent on
an assured income stream from the project since the lenders and investors would have recourse to
any funds other than the income streams generated by the project when complete. The project
sponsor would therefore need to demonstrate evidence of future income for the proposed project.
Equity Finance
Equity represents the portion of the finance required that the project sponsor is willing and able to
mobilise for the project. The sponsors provide the seed equity to the project company to start
operating. According to Merna and Smith (1999), the project company can raise additional equity
funds from the general public to part-finance the construction and early operation phase. H-M
Treasury (2003) guidelines acknowledge a debt-equity ratio of 90:10 as being an acceptable ratio.
However this needs not be always the case as shown by Tiong (1995). Tiong (1995) cites several
examples of different projects around the world with equity ranging from 0 to 59% (Tiong, 1995)
189
Term Loans
These are for large infrastructure projects where the funds required to be raised are very high. A
group of banks and financial institutions pool their resources together to provide the loans to the
project. In the case of the Channel Tunnel project in the UK, the original financing structure for
this project involved 210 organisations. More than half the capital raised was underwritten by a
UK government guarantee, which substantially reduced the cost of borrowing (Source: ctrl.co.uk,
accessed 19th
October, 2004). Despite problems with financing and scheduling problems with the
Channel Tunnel project, the project presents a financing model which if managed well can provide
a useful alternative to the use of public funds for infrastructure projects.
Using Bonds in PFI
Part of the funding for the landmark Channel Tunnel Project was raised through bonds issued in
two tranches comprising of fixed-rate tranche with a weighted average life of 20 years and index-
linked tranche with a weighted average life of 40 years. The bonds involved in the securitisation
paid interest to investors at a relatively small margin above the yield payable on gilts, reflecting
the favourable credit status granted by the government obligations, and also the unusually long
maturity of the bonds, for which there was significant investor appetite (CTRL, 2004).
Low Equity Finance
Tiong (1995) describes instances when the revenues, which are projected to be generated from PFI
projects are reliable and predictable in which case little or in extreme cases no equity finance may
be used as in three BOT projects in the UK – Dartford Bridge, Second Severn Bridge and the Skye
Bridge in Scotland. This was possible because being estuarial crossings, they were monopolistic in
nature, which made their revenues both predictable and reliable (Tiong 1995)
Use of Special Taxes / Levies
In Greece, a new airport was constructed using a special tax on all airline tickets to raise money.
The funds yielded were used as a second source of equity to bridge the gap between the level
required by the lenders and the equity raised by the promoter (Merna and Smith, 1999). Critical Success Factors for PFI Projects Zhang (2005) identifies Critical Success Factors for PFIs largely responsible for the modest
successes achieved on the PFI projects front in the UK as follows:
1. Favourable Investment Climate.
2. Economic viability
3. Reliable concessionaire consortium with strong technical support.
4. Sound financial package.
5. Appropriate risk allocation through reliable contractual arrangement. PFI in Other Countries
In nations like China, Uganda and Malaysia, forms of private involvement have been used with
varied degrees of success. Other countries are beginning to consider various forms of private-
public participation to deliver badly needed water supply infrastructure. The case of Guinea gives
an example of the operational efficiency of the private sector in the late 1980s when the

190
Government of Guinea together with two French companies formed a consortium for the
management of the water sector (Baumert & Bloodgood, 2004).
Monopolies in the Water Sector
Firms in the water sector usually operate as monopolies due to the nature of the industry which
leads to concerns over the private control of a monopoly which provides public service. Such
concerns may be addressed by the use of competitive selection methods (Edwards & Shaoul, 2003)
which help to regulate pricing. This ensures that fees paid by end-users are modest (Baumert &
Bloodgood, 2004). In the UK for example, there are around 24 water companies most of which
consistently exceed 99% of targets set by the Office of the Water Regulator, OFWAT. Increasing
the number of participants in the water sector has generated competition and innovation as
different providers strive to outperform the other and deliver more value to both customers and
shareholders (water-guide.org.uk).
Protecting the Interests of the Poor
According to PURC(2005), the majority of those without direct access to water supply are poor
and are mostly supplied water by private operators who charge substantially higher rates compared
to the public supplier. In some cases, private suppliers may sell to the poor at rates which may be
as high as 20 times the GWCL rates (Water Aid, 2008). In the traditional PFI project, the
government or public sector retains some control over the project during the concession term
(Merna and Smith, 1999). This control may be in a regulatory capacity or to ensure quality and
affordability for the end users. In the UK example, the water supply companies make proposals for
new prices every five years. The proposals are subject to review by the regulator, OFWAT which
approves new prices (water-guide.org.uk).
Discussion Despite progressive intervention programmes by previous governments and development partners,
the current situation of water supply in Ghana is poor with less than half the population of Ghana
having access to safe drinking water from the public water supply company. The quantity and
quality of water produced are still poor. After five years of private sector management, the
management of the Ghana’s water production and delivery has reverted to public control. The
government of Ghana retains sole responsibility for the funding and management of water supply.
However given the scarcity of resources and the number of competing demands, investment in the
water sector has been and continues to be insufficient. The resultant effect of this and other
problems facing the water sector such as political interference and poor management is that
Ghana’s urban water infrastructure is poor and in need of urgent updating.
Whilst the idea of private sector management which saw the involvement of AVRL was a positive
move, the fact that AVRL brought no new funding to the operations made this a poor choice for
the water sector. What the sector needs is an urgent injection of much needed finances to repair
and maintain old parts of the network and to develop capacity to meet the standards of 21st century
water supply services for a rapidly growing population. Whilst the government is still able, to a
limited extent, to source for loans and grants to develop the network, it is our opinion that the risks
and responsibilities for sourcing finance could be better borne by the private sector. The private
sector is also better motivated to handle some of the problems which the sector faces such as
leakages and unaccounted for water and non-revenue water in the system. It is in this vein that we
191
propose the PFI system of financing infrastructure as the best way forward for Ghana’s water
sector.
Different options of PFI approaches such as joint ventures and financially independent project may
be adopted for Ghana’s water sector. Each of these options provides public infrastructure which is
critical to efficient public services and utilities such as water without the need for direct investment
by the state. This offers benefits for government accounting as PFI investments are kept off the
government’s balance sheet.
Amongst the risks associated with PFI schemes is the lack of political will based on a fear of
public opposition to so-called “privatisation of essential public services”. However the PFI scheme
is clearly distinct from privatisation because in PFI schemes, the public sector maintains an on-
going involvement in the scheme which safeguards the interests of consumers. The state’s
involvement in PFIs as a PPP type project also addresses the concerns over the operation of
monopolistic utilities by private companies. The issue of monopolistic operation of utilities such as
water can be addressed through the break-up of these single water supply companies into smaller
leaner operations to promote efficiency. This can be seen in the UK example where water
companies serve different areas thus promoting efficiency. In the UK example, most of the water
companies are public listed companies thus diversifying their fund raising capacities. The
proposed smaller companies may be privately owned or state owned though the general trend
suggests private sector management is more effective than state run enterprises. PFI presents
several innovative options for raising finance including project financing, equity financing, the use
of term loans and bonds or special taxes/levies. Where debt financing is used, the expected cash
inflows can be used for re-payment. In developing a PFI approach for Ghana’s water sector,
Government Guarantees may be used as part of the public’s contribution. Guarantees may be given
in the form of guaranteed revenue for private operators, by varying the concession periods, through
exchange rate guarantees, debt guarantees, equity guarantees or as compensation for changes.
Whilst PFI has been mainly applied in the UK health, defence and road sectors, the model can be
easily adapted to Ghana’s urban water sector.
Most of the critical success factors for PFIs such as a favourable investment climate can be met
easily in Ghana. Further innovation will need to be introduced to enhance the economic viability of
PFIs in the Ghanaian water sector. For example given the low levels of tariffs collected in Ghana
as compared to many developed countries, it may be helpful to increase the concession period for
PFIs from the usual avearge of between 25 and 30 to a new avaerage of 40 to 50 years to enable
investors to obtain reasonable return on their investment in PFI projects.
Lessons This paper establishes that the PFI system of finance has been used successfully to develop
infrastructure projects including water sector infrastructure in some developing countries. The
system allows the development of public infrastructure without the upfront commitment of
government funds. Loans used to finance infrastructure projects are thus kept off government
books. It is argued that the private sector is better incentivised to manage public services to ensure
a good return on the investment in such projects. The paper asserts that PFI differs from
privatisation in that the interests of the consumer are protected through the active involvement and
regulatory function of the public sector. This ensures services provided are of an appreciable
standard and that charges are affordable. Different approaches to PFI implementation and potential
192
funding strategies which can be adapted to implement the PFI system in Ghana’s urban water
sector are identified.
Recommendations It is recommended that the PFI system of financing projects be adopted for the development of
infrastructure for Ghana’s urban water sector. This will transfer project risks including both
financial and construction to the private sector which is better equipped to manage these. In this
vein, it is proposed that government borrowing to develop urban water infrastructure be
discontinued and instead, the government should create an enabling environment which supports
private sector fund raising efforts.
It is also proposed that instead of the commonly used 25-30 year concession period used for most
PFI projects, a 40 to 50 year concession period may be considered for the Ghanaian urban water
sector. This will provide ample time for investors to obtain a reasonable return on investments.
This paper proposes that the Ghana Water Company Limited be broken up into smaller companies
which will manage specific areas and regions. In this case, the Kpong, Owabi, Barekese, Weija
Water Works etc. would be managed as concessions by independent private or public listed
companies able to independently mobilise private sector finance or enter into joint ventures for the
purposes of raising finance to develop and maintain their infrastructure.
It is further recommended that bidding for the respective concessions be open to international
competition in the hope that international contractors with sufficient financial resources and
proven track record in world-class water provision are selected to run Ghana’s water production
and distribution facilities as concessions.
________________________________________________________________________________
References 1. Agblevor, E. (2011, June 09). AVRL hands over to GWCL. Retrieved August 25, 2011, from
Ghana Government Official Portal: www.ghana.gov.gh
2. Balfour Beatty (2004) Balfour Beatty PLC PFI / PPP Projects www.balfourbeatty.com website
viewed on the 19th
of October, 2004
3. Baumert, J., & Bloodgood, L. (2004). Private water participation in the water and waste water
service industry. U.S. International Trade Commission, Office of Industry. Washington DC:
Office of Industry.
4. CTRL (2004) The Channel Tunnel Rail Link Ltd “LCR securitisation of CTRL Section 1
access charges” www.ctrl.co.uk website accessed: 19th
October, 2004
5. Edwards, P., & Shaoul, J. (2003). Controlling the PFI process in schools: a case study of the
Pimlico project. Policy and Politics , 31 (3), 371-395.
6. Grout, P. (1997). The Economics of Private Finance Initiative. Oxord Review of Economic
Policy , Vol.13 (No 4).
7. HM Treasury (2005) The UK Treasury Department “Meeting the Investment Challenge”
www.hm-treasury.gov.uk; Website accessed: January 2005
193
8. Merna A & Smith J (1999) “Privately Financed Infrastructure in the 21st Century” Civil
Engineering Vol. 132
9. Merna, A., & Smith, N. J. (1994). Concession Contracts for Power Generation. Engineering,
Construction and Architectural Management , Vol 1, Pp 17-27.
10. Owen, G., & Merna, A. (1997). The Private Finance Initiative. Engineering, Construction and
Architectural Management , Vol 4 (3), Pp 163-177.
11. Pricewaterhouse Coopers (2004) “Preparation of the Economic, Financial, Technical and
Administrative Framework for Road Concession projects in Ghana” (Report for the World
Bank and the Ministry of Roads and Transport).
12. Public Utilites Regulatory Commission. (2005). Urban Water Tariff Policy. Retrieved June 24,
2011, from PURC.com: http://www.purc.co.gh
13. Tiong, R. (1995). Risks and Guarantees in BOT Tender. Journal of Construction Engineering
and Management , Vol 121 (2), Pp 286.
14. Water Aid. (2008). Urban sector assessment report. Water Aid.
15. water-Guide.org.uk. (2011). Water Guide.org.uk. Retrieved June 28, 2011, from Water
Guide.org.uk: http://www.water-guide.org.uk/
16. Water Resources Commission. (2008). National Water Policy. Retrieved July 1, 2011, from
Ghana Water Resources Commission: http://www.wrc-gh.org
________________________________________________________________________________
Contact Details Kwame Ofori-Kuragu
Kwame Nkrumah University of Science and Technology
Tel: 00233 24618 3736
Email: [email protected]
Brako Attafua
Kwame Nkrumah University of Science and Technology
Tel: 00233 276901253
Email: [email protected]
James Leslie Lamptey
Kwame Nkrumah University of Science and Technology
Tel: 00233 243421815
Email: [email protected]
________________________________________________________________________________

194
________________________________________________________________________________
3rd Ghana Water Forum, Accra, Ghana, 2011
Water and Sanitation Services Delivery in a Rapidly Changing Urban Environment
Towards a Sustainable Allocation of Potable Water in Ghana: Evidence
from Kumasi
J. D. Quartey
________________________________________________________________________________
Abstract The provision of potable water for human sustenance both now and in the future is one of the most
critical issues in the world today. This paper sought to assess the sustainability of potable water
distribution in Ghana through the Contingent Valuation Method in Kumasi, Ghana’s second
largest urban centre. Willingness-to-pay values were elicited by means of a bidding game
technique through administered questionnaire to communities in Kumasi, where potable water
supply was either non-existent or very irregular. The analysis shows that Ghana Water Company
Limited (GWCL) can increase current tariffs by about 300% without hurting consumers, since,
that would rather increase welfare considerably. A sizeable consumers’ surplus exists, which is an
indication of households being susceptible to extortion by water vendors. This requires urgent
government intervention to save some residents of Kumasi from undue exploitation as well as the
return to the consumption of unwholesome water that would increase pressure on medical and
Health Insurance resources.
________________________________________________________________________________
Introduction Efficient and equitable distribution of potable water is a key requirement for urbanization to lead
to improved welfare. Increasing urbanization as well as the growth in human populations has
resulted in an increasing need for a sustainable allocation of potable water in Ghana. This requires
efficient water distribution to people wherever they live, no matter the cost involved. Where this is
not done, long hours and much energy are spent to search for water; which turns out to be labour-
intensive, excessively time-consuming and counter-productive. Reasonable access12
to potable
water for a community would mean the saving of time and energy due to reduced walking distance
to the source of water or waiting to be served from a distant source. This releases labour which
may be used for productive purposes leading to economic benefits. Even if the economic value of
the saved labour is zero, there would be a social benefit from the time saved and drudgery
eliminated because more time can be spent with one’s family or on domestic activities and leisure.
In Ghana, increasing amounts of water is being used to meet the needs of a rapidly growing
population. This has resulted in the reduction of the per capita annual availability of water.
According to the Ghana Water Company Limited, in 1960, when the population of Ghana was
6.77million, the annual surface water available to each Ghanaian was 4950 cubic metres. By the
year 2025, when the population of Ghana is projected to be 35.44 million, the annual surface water
12 Reasonable access to potable water means “a disproportionate part of the day is not spent in water fetching

195
that will be available to each Ghanaian would be 950 cubic metres. Ghana would then have
reached a theoretical limit for ‘water stress’ - below the 1000 cubic metres per capita annual water
availability threshold (Ghana Water Company Limited, 1995). This insight about Ghana’s water
resources calls for a sustainable allocation of water resources to delay or even avoid ‘water
stresses’ for present and future generations.
The provision of potable water being largely a responsibility of government in Ghana or even in
collaboration with donor agencies is not sustainable, considering the huge capital investments
involved, coupled with high population growth rate. It was estimated by the Ghana Water
Company Limited (GWCL) that an amount of about $2billion was needed to extend the water
sector in Ghana from 1998 to the year 2020.
It is however interesting to know that since the early 1980s, World Bank (IDA) total support to
Ghana in credit and grants has been only a little above $5 billion (World Bank, 2007). It can be
asserted that the slow pace at which potable water has been made available to communities in
Ghana stems from the fact that the sector does not get meaningful returns from the investments
made to sustain the sector (considering the fact that the Ghana Water Company Limited until June,
1999, supplied water at a loss). This is further worsened by the waste and inefficiencies associated
with the handling of public property, partly responsible for the 50% unaccounted-for-water rate.
Kumasi, the second largest city in Ghana with a population of about 1.2 million has suffered and
continues to suffer from water shortages. This situation has given water vendors the opportunity to
sell water to residents of various suburbs at exorbitant prices. The pertinent question here is
whether the residents would shift from the consumption of potable water to other water sources
which might negatively affect their health and well-being. This study examined how the
distribution of potable water could be done on an equitable and efficient basis to enhance human
welfare, as a means of attaining sustainable allocation of water resources. This is against the
background where about 97% of the budget of the Ministry of Water Resources Works and
Housing in Ghana is donor funded (Ministry of Water Resources Works and Housing, 2011).
Conceptual Framework The current structure of the distribution of potable water in Ghana is skewed in favor of people
who are capable of paying for water. Effective demand encompasses the ability and willingness to
pay for an economic good. Since potable water is a merit good,13
the effective demand need not
necessarily include an ability to pay. In such a situation the willingness to pay (WTP) is sufficient
to warrant government provision. However, this notion of potable water being a merit good does
not contradict the 1992 Dublin statement from the United Nations Conference on Environment and
Development, calling for the recognition of water as an economic good. There have been several
debates on the theoretical and operational implications as well as the economic impact of this call
on the poor. The main objective therefore of this study is to use the Contingent Valuation Method
(CVM) to assess the welfare implications of potable water pricing and provision, to appropriately
inform policy, towards a sustainable distribution.
13 A merit good is one considered by government as so important for health and well being that more of it should be
provided than what the market mechanism alone will allow.
196
A change in the provision of a good gives rise to a ‘full price effect’ in the ordinary demand curve
where real increases of consumers are allowed to vary. The Hicksian approach however yields a
theoretically more accurate measure of welfare change since it holds real income constant (Varian,
2006; Katz and Rosen, 1998). With the change in the provision of potable water, the consumer’s
utility can be maximized subject to his budget. The assumption here is that the consumer has an
exogenous budget Y which is to be spent on some or all of n commodities which can be bought in
non-negative quantities at given fixed, strictly positive prices.
A change in the provision (distribution) of potable water produces a change in utility whose
maximization will bring optimum satisfaction leading to welfare maximization (Johansson, 1987).
Environmental Economic methodology describes six phases in the practical application of the
CVM. These are the market description, elicitation, calculation, estimation, aggregation and
validation phases.
Methodology A hypothetical market was set up for the provision of a 24-hour supply of easily and quickly
accessible potable water to communities in the suburbs of Kumasi that had no access to potable
water in the description phase of this research.
The hypothetical market explained the services that could be made available and at what price. The
payment mechanism, modalities of delivering the service, its quality and reliability were also
discussed to make the market scenario complete.
These are presented in the elicitation scenario as discussed below. The survey used questionnaires
that started by describing the problem and the change envisioned - the provision of a 24-hour
supply of potable water just around consumers’ homes through public taps by private operators.
Payment for the commodity would be made through on the spot pay-as-you-fetch principle or
arrangement.
The questionnaires included questions on the socio-economic and demographic background of the
respondents and their families. This was mainly for purposes of cross-checking WTP responses. In
each case the respondent was a household head, representing his or her household.
The iterative bidding game method was used to elicit responses from respondents. The question
asked for the iterative bidding game is, “suppose you are supplied with a 24-hour daily service of
potable water just outside your home, how much would you be willing to pay for each bucket14
of
potable water you fetch?” If the respondent’s answer is yes to the bid of (say) 7 pesewas (7p) per
bucket, then the question is repeated with a higher bid of 8p, if the answer is no, the question is
repeated with a lower bid of 6p. This continues until the respondent’s maximum WTP is reached.
This same method was repeated for 24-hour in-house taps as an alternative commodity. The
bidding game approach produces a continuous bid variable which can be analyzed using the
Ordinary Least Squares (OLS) method.
14 A bucket here refers to an 18 liter volume. The use of bucket emanated from ascertaining which measure was
more familiar to households in Kumasi for water. Even though the ‘Kufuor galon’ is used, households were more
familiar and accustomed to the bucket as a measure. This is confirmed by Whittington et al (1992) and Owusu (2009)

197
In all, 23 suburbs of Kumasi were identified as areas not receiving regular supplies of potable
water. Through random sampling from the list 5 suburbs were selected, namely Buokrom Estates,
Sepe Buokrom, Asuoyeboa (SSNIT flats area), Kokode (Agric college) and Edwinase. 70
households were interviewed from the randomly selected suburbs.
The starting point bid of 5p per bucket was to give respondents enough room to be realistic since
the current 5p per bucket charged by vendors was for water with uncertain purity and
wholesomeness. This amount was also considered high enough to satisfy potential investors.
The Variables For all households information was collected on socio-economic characteristics including
measures of monthly income, education level, household size, total expenditure on other
commodities, proximity of current water source and characteristics of the current water source.
The dependent variable for the study is maximum Willingness-To-Pay for potable water (WTP) in
each of the two market scenarios depicted, which was regressed on the quantity of potable water
demanded to obtain the demand functions. For a quantity dependent variable, quantity of water
consumed per day in buckets of water (Q) was regressed on Households’ monthly Incomes in
cedis (Y), Educational levels in codes of years (E), Ages in years (A), proximity of current source
of water (Pc), Expenditure on other commodities(x) and maximum Willingness-To-Pay for potable
water (WTP). This therefore gave a functional relationship between maximum Willingness-To-Pay
and the remaining variables, stated as
WTP = f(Y,E,A,Pc,Q, X).
Similar functional relationships have been used by Briscoe et al (1990), Hanley and Spash (1993)
and Carruthers and Browne (1977).
Based on the theoretical framework, respondents’ WTP were modeled on a continuous utility
framework in which each household head’s response represents the indirect utility that the
household receives from consuming a bucket of potable water. Such WTP is based on the
characteristics of the commodity.
Analysis of Results Plotting midpoint values for willingness- to- pay (in Ghana Pesewas) against quantity of potable
water demanded, which here is pegged at two buckets per household member, gives us the
Hicksian demand function for potable water supplied through community taps near households.
The assumption of two buckets per household member (meaning the demand per household is
equal to twice the number of people in the household) is consistent with the findings of Nyarko et
al. (2006); Feachem (1973); and White et al, (1972) that city dwellers without taps consume on the
average about 30 litres (2 buckets) of potable water per person daily. This then means that for each
WTP value, the cumulative percentage number of households represent the quantity (number of
buckets) demanded.
For community taps near consumers’ homes the demand function was
WTP1 = 756.626 – 6.629Qd ----------------------------------- ( 1)

198
(13.289) (-9.254) t- values
R2 = 0.966, R
2 Adjusted = 0.955, F-statistic = 85.629
While for in-house taps, the demand function was
WTP2 = 639.024 – 4.297Qd ----------------------------------- ( 2)
(8.643) (-4.105) t- values
R2 = 0.849, R
2 Adjusted = 0.799, F-statistic = 16.853
The two demand functions are consistent with the tenets of economic theory.
Total Willingness-to-Pay Aggregation To aggregate for Kumasi as a whole we convert the mean WTP bids to a population total figure.
Here, it is possible to capture all those whose utility would be significantly affected by the change
in provision of potable water in Kumasi.
Tables 1 and 2 below show the computations to obtain the mean total willingness to pay for
potable water and the expected total revenue for Kumasi.
Table 1: Total Willingness to Pay for potable water in Kumasi for one day
WTP
(Midpoints)
(a)
Percentage
of
Households
(b)
Number of
Households
(c)
Cumulative
No of
Households
(d)
%
Cumulative
Frequency
(e)
TWTP
(in GH₵)
f=(a)×(c)×2
0 0.1 300 300,000 100 0
0.5p 1.4 4,200 299,700 99.9 42.00
1p 1.4 4,200 295,500 98.5 84.00
5p 47.8 143,400 291,300 97.1 14,340.00
8p 46.4 139,200 147,900 49.3 22,272.00
10p 2.9 8,700 8,700 2.9 1,740.00
Total 100 300,000 38,478.00
Source: Author’s fieldwork
From Table 1, with the mean household size in Kumasi of 4 (GSS, 2008), if each household
member consumes two buckets in a day, then for one day the TWTP would be GH¢ (4 x
38,478.00) = GH¢153,912.00 for the 300,000 households. The Freshwater Country Profile of
Ghana of the United Nations Organization has indicated that it costs Ghana US$0.80 per cubic
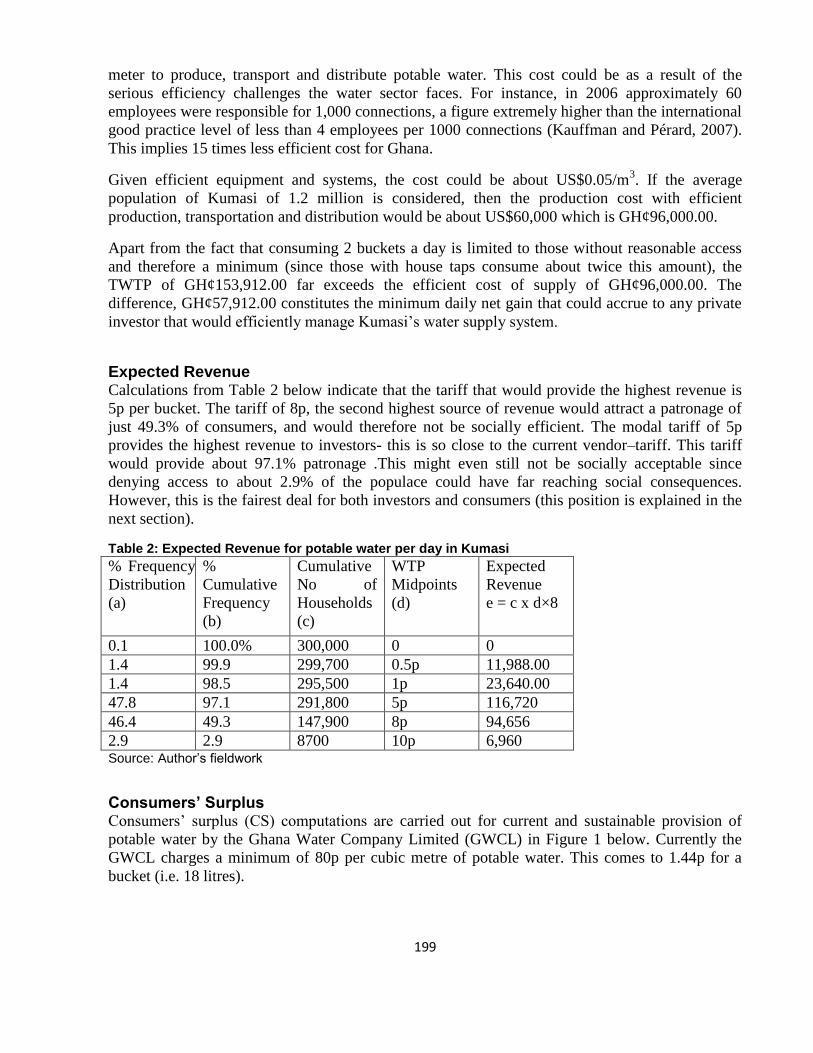
199
meter to produce, transport and distribute potable water. This cost could be as a result of the
serious efficiency challenges the water sector faces. For instance, in 2006 approximately 60
employees were responsible for 1,000 connections, a figure extremely higher than the international
good practice level of less than 4 employees per 1000 connections (Kauffman and Pérard, 2007).
This implies 15 times less efficient cost for Ghana.
Given efficient equipment and systems, the cost could be about US$0.05/m3. If the average
population of Kumasi of 1.2 million is considered, then the production cost with efficient
production, transportation and distribution would be about US$60,000 which is GH¢96,000.00.
Apart from the fact that consuming 2 buckets a day is limited to those without reasonable access
and therefore a minimum (since those with house taps consume about twice this amount), the
TWTP of GH¢153,912.00 far exceeds the efficient cost of supply of GH¢96,000.00. The
difference, GH¢57,912.00 constitutes the minimum daily net gain that could accrue to any private
investor that would efficiently manage Kumasi’s water supply system.
Expected Revenue Calculations from Table 2 below indicate that the tariff that would provide the highest revenue is
5p per bucket. The tariff of 8p, the second highest source of revenue would attract a patronage of
just 49.3% of consumers, and would therefore not be socially efficient. The modal tariff of 5p
provides the highest revenue to investors- this is so close to the current vendor–tariff. This tariff
would provide about 97.1% patronage .This might even still not be socially acceptable since
denying access to about 2.9% of the populace could have far reaching social consequences.
However, this is the fairest deal for both investors and consumers (this position is explained in the
next section).
Table 2: Expected Revenue for potable water per day in Kumasi
% Frequency
Distribution
(a)
%
Cumulative
Frequency
(b)
Cumulative
No of
Households
(c)
WTP
Midpoints
(d)
Expected
Revenue
e = c x d×8
0.1 100.0% 300,000 0 0
1.4 99.9 299,700 0.5p 11,988.00
1.4 98.5 295,500 1p 23,640.00
47.8 97.1 291,800 5p 116,720
46.4 49.3 147,900 8p 94,656
2.9 2.9 8700 10p 6,960 Source: Author’s fieldwork
Consumers’ Surplus Consumers’ surplus (CS) computations are carried out for current and sustainable provision of
potable water by the Ghana Water Company Limited (GWCL) in Figure 1 below. Currently the
GWCL charges a minimum of 80p per cubic metre of potable water. This comes to 1.44p for a
bucket (i.e. 18 litres).
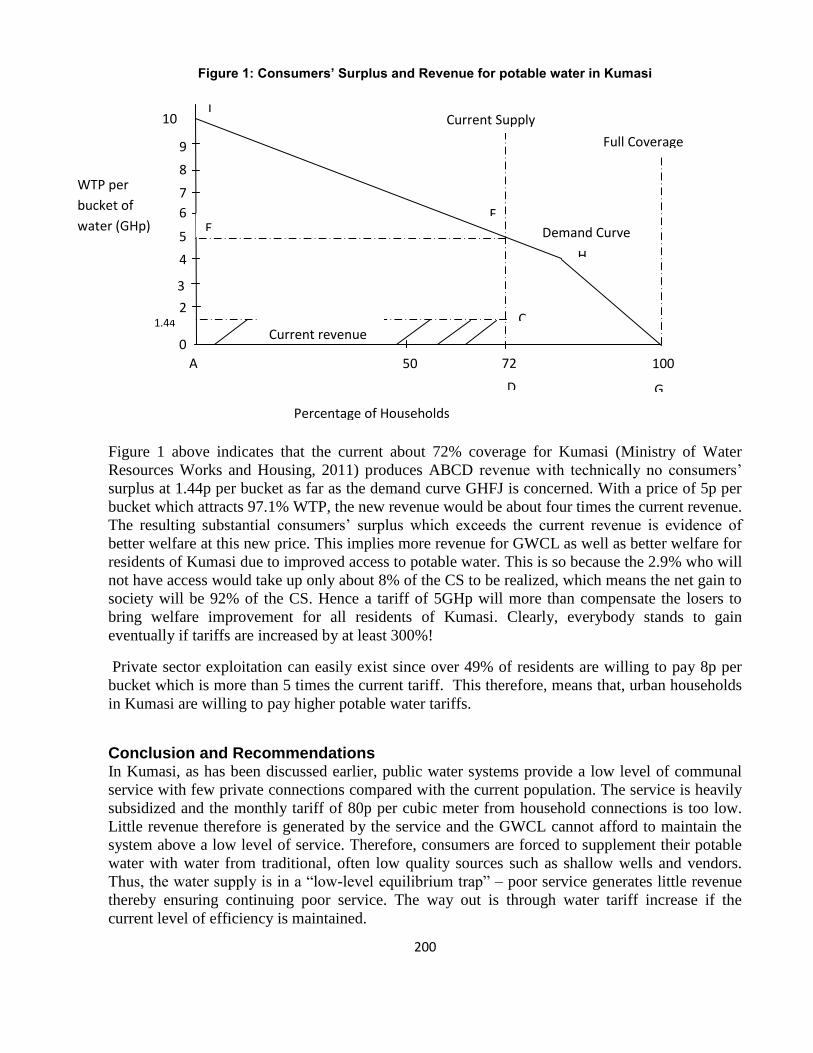
200
Figure 1: Consumers’ Surplus and Revenue for potable water in Kumasi
Figure 1 above indicates that the current about 72% coverage for Kumasi (Ministry of Water
Resources Works and Housing, 2011) produces ABCD revenue with technically no consumers’
surplus at 1.44p per bucket as far as the demand curve GHFJ is concerned. With a price of 5p per
bucket which attracts 97.1% WTP, the new revenue would be about four times the current revenue.
The resulting substantial consumers’ surplus which exceeds the current revenue is evidence of
better welfare at this new price. This implies more revenue for GWCL as well as better welfare for
residents of Kumasi due to improved access to potable water. This is so because the 2.9% who will
not have access would take up only about 8% of the CS to be realized, which means the net gain to
society will be 92% of the CS. Hence a tariff of 5GHp will more than compensate the losers to
bring welfare improvement for all residents of Kumasi. Clearly, everybody stands to gain
eventually if tariffs are increased by at least 300%!
Private sector exploitation can easily exist since over 49% of residents are willing to pay 8p per
bucket which is more than 5 times the current tariff. This therefore, means that, urban households
in Kumasi are willing to pay higher potable water tariffs.
Conclusion and Recommendations In Kumasi, as has been discussed earlier, public water systems provide a low level of communal
service with few private connections compared with the current population. The service is heavily
subsidized and the monthly tariff of 80p per cubic meter from household connections is too low.
Little revenue therefore is generated by the service and the GWCL cannot afford to maintain the
system above a low level of service. Therefore, consumers are forced to supplement their potable
water with water from traditional, often low quality sources such as shallow wells and vendors.
Thus, the water supply is in a “low-level equilibrium trap” – poor service generates little revenue
thereby ensuring continuing poor service. The way out is through water tariff increase if the
current level of efficiency is maintained.
72 50 100 A
0
4
5
6
7
8
9
10
1.44 2
J Current Supply
Full Coverage
Demand Curve
H
F
C
D G
E
Current revenue
Revenue
Percentage of Households
WTP per
bucket of
water (GHp)
3

201
It is recommended that Government should allow the GWCL to increase tariffs at least by 300%.
This would be the most equitable for society’s welfare in general if the efficiency status quo is
maintained. An alternative approach however would be to improve upon the efficiency of
production, transportation and distribution systems.
Private participation in the water sector must be regulated in terms of tariffs; otherwise the high
consumers’ surplus can be exploited to the detriment of residents of Kumasi. There is a small
percentage (about 2.9% for Kumasi) of urban dwellers that would still have to have free access to
potable water, subsidized through the revenue from the increased tariff.
________________________________________________________________________________
References 1. Briscoe, J. P., P. Furtado de Castro, C. Griffin, J. North and O. Olsen (1990) “Towards
Equitable and sustainable Rural Water Supplies: A contingent Valuation Study in Brazil”. The
World Bank Economic Review 4(2):115-134
2. Carruthers, I. and Brown, D. (1977) “The Economics of Community Water Supply” in R.
Feachem, M.Garry and D. Mora (eds). Water Wastes and Health in Hot Climates. Chichester:
John Wiley and Sons Limited.
3. Feachem, R. G. (1975) “Water Supply for Low-Income communities: Resource Situation” in
R. Feachem, M. McGarry and D. Mora (eds) Water Wastes and Health in Hot Climates.
Chichester: John Wiley and Sons Limited.
4. Ghana Statistical Service (2008) Ghana Living Standards Survey, Fifth Round GLSS 5. Accra.
5. Ghana Statistical Service, Quarterly Digest of Statistics, Various issues.
6. Ghana Water Company Limited (1995) Community Water and Sanitation Project.
Implementation manual of GWCL, Volume 3, Number 2. Accra.
7. Hanley, N. and C. L. Spash (1993) Cost-Benefit Analysis and the Environment, Aldershot:
Elgar Publishing Limited
8. Johansson, P.O. (1978) The Economic Theory and Measurement of Environmental Benefits.
Cambridge: Cambridge University Press.
9. Katz, M. L and H. S. Rosen (1998) Microeconomics 3rd Edition. Boston: McGraw-Hill
10. United Nations Organisation (2004) Freshwater country Profile. Ghana. Accessed at
http://www.un.org/esa/agenda 21/natlinfo/country/ghana/waterghana 04f.pdf on 25th August,
2011
11. Kaufman C and E. Pérard (2007) “Stocktaking of the water and sanitation sector and private
sector involment in selected African countries”. OECD. Background note for the regional
Roundtable on strengthening Investment Climate Assessment and Reform in NEPAD
countries, Lusaka, Zambia.
12. Ministry of Water Resources Works and Housing (2011),”Bagbin: Middle Income Status is
Bogus”, In The Chronicle, vol.20 no.057, Accra.

202
13. Nyarko, K. B., S. N Odai and K. B. Fosuhene (2006) “Optimizing social Inclusive Urban
Water supply in Ghana”. First SWITCH Scientific meeting, University of Birmingham, UK
14. Owusu, M. (2009) “Water Shortage hits Kumasi” Daily Guide. Western Publications Limited,
Accra.
15. Pearce, D.W. and R.K. Turner (1990) Economics of Natural Resource and the Environment.
Baltimore: The John Hopkins University Press
16. PURC (2005) Review of the performance of the Ghana Water Company Limited (1998-2003.)
Accra.
17. Ribando, M. O and D. Helterstein (1992) “Estimating Water Quality Benefits: Theoretical and
methodological Issues”. United States Department of Agriculture Economic Research Service.
Technical Bulleting Number 1808, Washington DC
18. Varian, H.r. (2006): Intermediate Economics: A modern Approach, 7th Edition, New York:
WW. Noston.
19. Whittington, D., D. T. Lauria, A. M. Wright, K. Choe, J. Hughes and V. Swarna (1992)
Household Demand for Improved Sanitation Services: A case study of Kumasi, Ghana. UNDP-
World Bank Water and Sanitation Programme. The World Bank, Washington, DC.
________________________________________________________________________________
Contact Details J. D. Quartey
Department of Economics
Kwame Nkrumah University of Science and Technology
Kumasi, Ghana
Mobile phone no. 0244206280
Email: [email protected] / [email protected]
________________________________________________________________________________

203
________________________________________________________________________________
3rd Ghana Water Forum, Accra, Ghana, 2011
Water and Sanitation Services Delivery in a Rapidly Changing Urban Environment
Impacts of Energy Price Changes on the Financial Sustainability of
Water Facilities: Case from Ghana
S. J. Tenkorang, S. N. Odai, F. O. Annor & K. A. Adjei
________________________________________________________________________________
Abstract Water is conveyed to consumers through systems that rely greatly on energy, which has become a
challenge after frequent variation in global oil prices. This paper focuses on the impacts of energy
price changes on the financial sustainability of water facilities in Ghana. It further investigates the
proportion of energy to the total costs of water supply and the effect of energy price changes on
the management of water facilities. The study is based on a field survey that targeted 5 small town
water systems. The results show that Energy (diesel and electricity) expenditure forms substantial
component of water production costs. The total operational cost and proportion of energy to total
costs for water supply for small towns are 1.19 US$/m3 and 31% respectively. The energy costs
per water supply using small town water systems is 0.40 US$/m3. Results further shows that diesel-
driven water systems are more sensitive to energy price changes than that of electricity-driven
systems; therefore making financial profits from diesel - driven systems highly elastic to diesel
price changes. This paper recommends that outcomes and methodologies be adopted and utilised
during reforms of water pricing policies and subsidies to the energy sector.
________________________________________________________________________________
Introduction Sustainable access to safe water is essential for human health and survival, and important for
economic growth (SIWI, 2005). Raw water abstracted from water bodies usually undergoes some
form of treatment before delivery to homes, institutions, industries, etc. The water systems which
perform the treatment processes and conveyance run on energy (diesel or electricity). In Ghana,
the energy dependent water systems can be categorised broadly into the Urban water systems and
Rural water systems.
Frequent variation in global oil prices coupled with exchange rate depreciation have impacted on
the domestic energy prices (Figure 1). Increments in domestic oil prices tend to affect the
management of the water systems whose operations depend on energy.
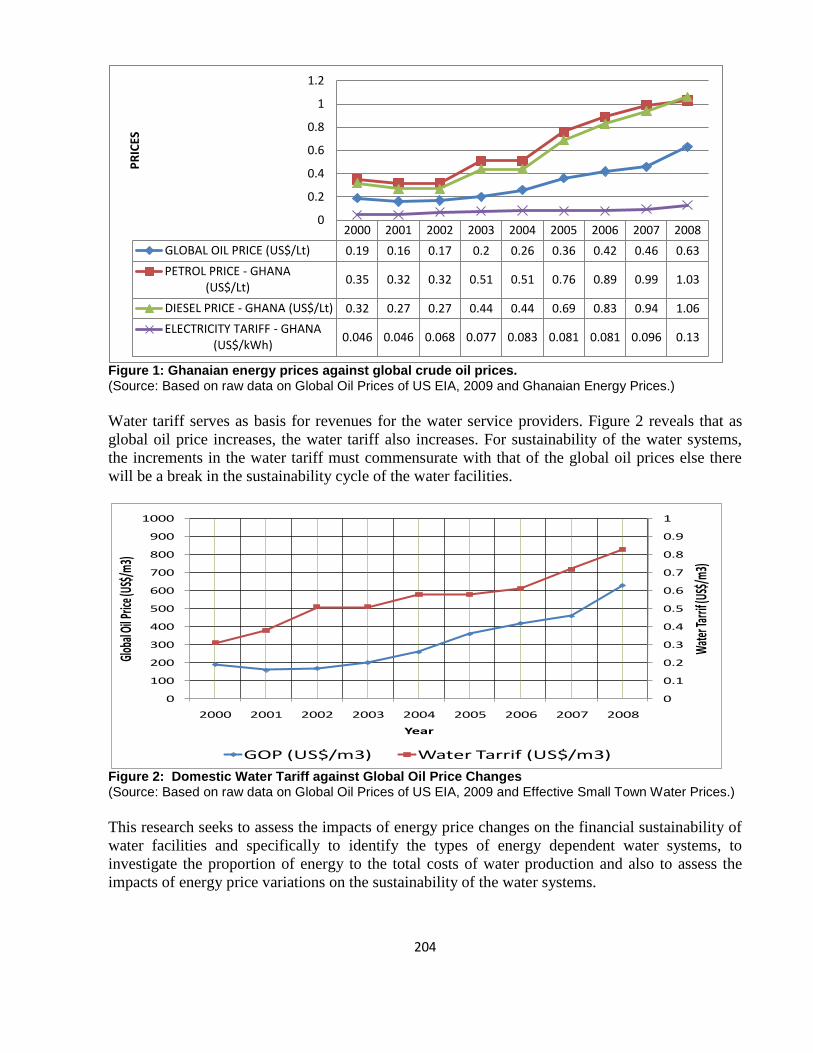
204
Figure 1: Ghanaian energy prices against global crude oil prices. (Source: Based on raw data on Global Oil Prices of US EIA, 2009 and Ghanaian Energy Prices.)
Water tariff serves as basis for revenues for the water service providers. Figure 2 reveals that as
global oil price increases, the water tariff also increases. For sustainability of the water systems,
the increments in the water tariff must commensurate with that of the global oil prices else there
will be a break in the sustainability cycle of the water facilities.
Figure 2: Domestic Water Tariff against Global Oil Price Changes (Source: Based on raw data on Global Oil Prices of US EIA, 2009 and Effective Small Town Water Prices.)
This research seeks to assess the impacts of energy price changes on the financial sustainability of
water facilities and specifically to identify the types of energy dependent water systems, to
investigate the proportion of energy to the total costs of water production and also to assess the
impacts of energy price variations on the sustainability of the water systems.
2000 2001 2002 2003 2004 2005 2006 2007 2008
GLOBAL OIL PRICE (US$/Lt) 0.19 0.16 0.17 0.2 0.26 0.36 0.42 0.46 0.63
PETROL PRICE - GHANA (US$/Lt)
0.35 0.32 0.32 0.51 0.51 0.76 0.89 0.99 1.03
DIESEL PRICE - GHANA (US$/Lt) 0.32 0.27 0.27 0.44 0.44 0.69 0.83 0.94 1.06
ELECTRICITY TARIFF - GHANA (US$/kWh)
0.046 0.046 0.068 0.077 0.083 0.081 0.081 0.096 0.13
0
0.2
0.4
0.6
0.8
1
1.2
PR
ICES
0
0.1
0.2
0.3
0.4
0.5
0.6
0.7
0.8
0.9
1
0
100
200
300
400
500
600
700
800
900
1000
2000 2001 2002 2003 2004 2005 2006 2007 2008W
ater
Tarri
f (US$
/m3)
Glob
al Oi
l Pric
e (US
$/m
3)
Year
GOP (US$/m3) Water Tarrif (US$/m3)

205
Water service provision is seen to be sustainable if water is delivered at the same rate and quality
all the time as designed and constructed. According to the Operation and Maintenance (O & M)
guidelines for Small Towns Water Systems in Ghana (CWSA, 2004), a water system is said to be
delivering water in a sustainable manner if:
1. The design quantity of water is produced over the design life of the system.
2. Water produced meets Ghana Standards Board Water Quality Standards.
3. Water is delivered in a cost effective manner.
4. Water is delivered in an uninterrupted manner (at least 95% of the time)
5. Planned routine and periodic maintenance are carried out for all electro mechanical equipment
and civil works.
Sustainability can only be guaranteed where sufficient money (or financing) is available to offset
necessary expenditure (Carter et al., 1999). Tariffs serve as means of recovering moneys expended
on the water systems in providing water to ensure long term sustainability (Nyarko et al., 2007).
Study Area Ghana can boast of two water sectors; Urban water sector under the mandate of Ghana Water
Company LTD (GWCL) and Rural Water Sector whose operations are facilitated by Community
Water and Sanitation Agency (CWSA) and operated by District Assemblies (DAs). A small town
is defined in the CWSA Act as “a community that is not rural but is a small urban community that
has decided to manage its own water and sanitation systems”. A further working definition used by
CWSA is “a community of between 2,000 and 50,000 inhabitants, who are prepared to manage
their water supply system”, even though the Small Towns Act goes on to define rural community
to be those with a population of less than 5000.
The main water supply technologies adopted for small towns’ water service delivery in Ghana
includes (CWSA, 2003):
Surface water piped system
Groundwater piped system
Rain water harvesting.
It is worth noting that, all the systems mentioned above directly or indirectly use energy as an
input in both abstraction, treatment and distribution purposes. Generally, energy sources for both
the small town and urban water systems include:
Grid electricity
Solar energy
Diesel generator
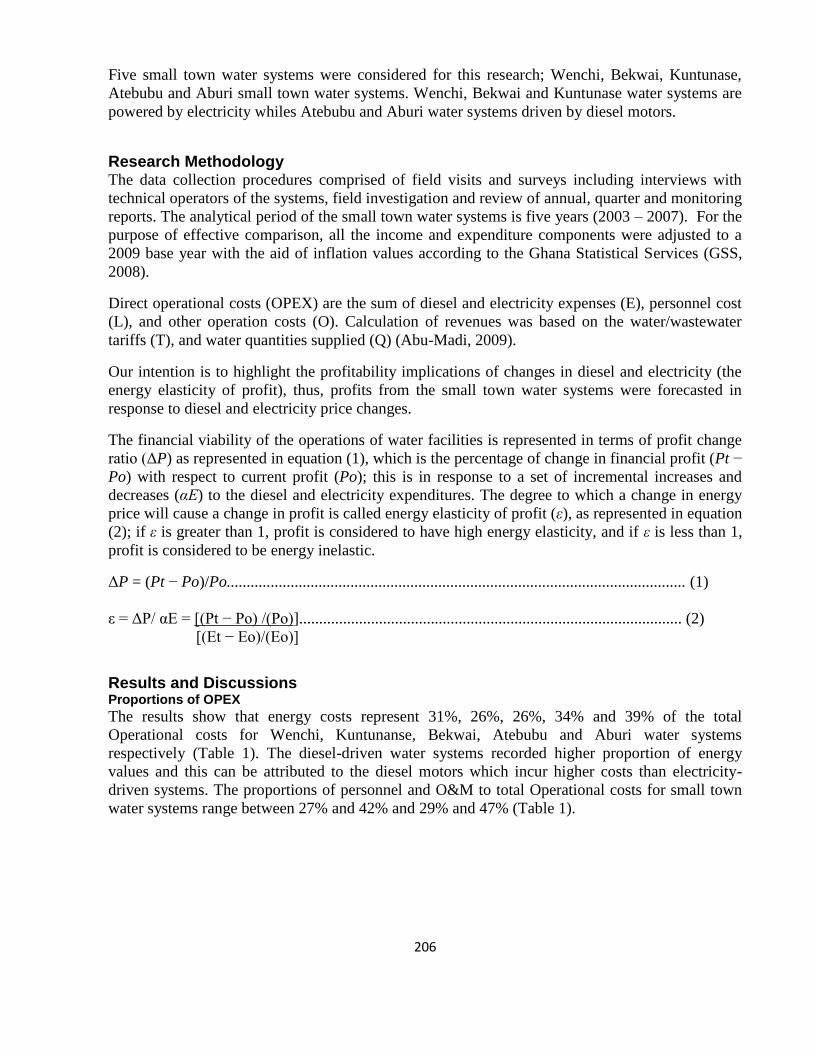
206
Five small town water systems were considered for this research; Wenchi, Bekwai, Kuntunase,
Atebubu and Aburi small town water systems. Wenchi, Bekwai and Kuntunase water systems are
powered by electricity whiles Atebubu and Aburi water systems driven by diesel motors.
Research Methodology The data collection procedures comprised of field visits and surveys including interviews with
technical operators of the systems, field investigation and review of annual, quarter and monitoring
reports. The analytical period of the small town water systems is five years (2003 – 2007). For the
purpose of effective comparison, all the income and expenditure components were adjusted to a
2009 base year with the aid of inflation values according to the Ghana Statistical Services (GSS,
2008).
Direct operational costs (OPEX) are the sum of diesel and electricity expenses (E), personnel cost
(L), and other operation costs (O). Calculation of revenues was based on the water/wastewater
tariffs (T), and water quantities supplied (Q) (Abu-Madi, 2009).
Our intention is to highlight the profitability implications of changes in diesel and electricity (the
energy elasticity of profit), thus, profits from the small town water systems were forecasted in
response to diesel and electricity price changes.
The financial viability of the operations of water facilities is represented in terms of profit change
ratio (ΔP) as represented in equation (1), which is the percentage of change in financial profit (Pt −
Po) with respect to current profit (Po); this is in response to a set of incremental increases and
decreases (αE) to the diesel and electricity expenditures. The degree to which a change in energy
price will cause a change in profit is called energy elasticity of profit (ε), as represented in equation
(2); if ε is greater than 1, profit is considered to have high energy elasticity, and if ε is less than 1,
profit is considered to be energy inelastic.
ΔP = (Pt − Po)/Po................................................................................................................... (1)
ε = ΔP/ αE = [(Pt − Po) /(Po)]................................................................................................ (2)
[(Et − Eo)/(Eo)]
Results and Discussions Proportions of OPEX
The results show that energy costs represent 31%, 26%, 26%, 34% and 39% of the total
Operational costs for Wenchi, Kuntunanse, Bekwai, Atebubu and Aburi water systems
respectively (Table 1). The diesel-driven water systems recorded higher proportion of energy
values and this can be attributed to the diesel motors which incur higher costs than electricity-
driven systems. The proportions of personnel and O&M to total Operational costs for small town
water systems range between 27% and 42% and 29% and 47% (Table 1).
207
Table 1: Proportions of OPEX from Small Town Water Systems
Income and OPEX (US$/Yr)
Electricity - Driven Diesel - Driven
Wenchi Kuntunase Bekwai Atebubu Aburi
Proportions of OPEX (%)
Energy Cost 31 26 26 34 39
Personnel Cost 36 42 27 37 32
Other O & M Cost 33 32 47 29 29
Operational Costs Ratios
Wenchi, Kuntunase, Bekwai, Atebubu and Aburi small town water systems recorded energy cost
per m3 of 0.21 US$/m³, 0.16 US$/m³, 0.18 US$/m³, 0.56 US$/m³ and 0.90 US$/m³ respectively
(Table 3). It can be seen from Table 2 that, total cost per cubic meter of water supply are relatively
higher for diesel-driven systems than for electricity-driven ones. It is therefore evident that diesel
driven systems incur higher unit production cost than electricity driven systems (Table 2). Table 2: O and M Cost for Small Town Water Systems
Electricity-Driven System Diesel - Driven System
Wenchi Kuntunase Bekwai Atebubu Aburi
Operational Ratios (US$/m³)
Total Cost per m³ of
Water Supplied 0.67 0.61 0.69 1.66 2.30
Energy cost per m³ of
Water Supplied 0.21 0.16 0.18 0.56 0.90
Sustainability of Water Facilities
Sustainability can only be guaranteed if operational cost (OPEX) and CapEx (depreciation) cost
are fully recovered. This study focused only on the OPEX and did not consider the CapEx. For
water systems to be sustained, operational income must be adequate enough to defray OPEX, and
the surplus is the profit (Pt) before depreciation and tax. The study sought to find out to what
extent energy increases would make the system unsustainable or breakeven (where revenue equals
Opex) The point one (1) on the horizontal axis is the current coefficient of energy (αE = 1) and it
serves as the reference point (base year) on all the figures below.
The results as depicted from the figure shows that currently, the small town water systems
powered by electricity motors are sustainable and can withstand up to 145% increments in the
current electricity prices when all other OPEX components are held constant (Figure 3). Any
further increment beyond the 145% mark will render the system unsustainable.
The results as depicted from the Figure 3 show that small town water systems powered by diesel
motors cannot withstand the current energy prices (Figure 4). For diesel-driven systems to recover
just their OPEX, there has to be a reduction of 25% in the current diesel prices. Reduction in
domestic energy prices is dependent on the variation of global oil prices, as such water tariff may
be reviewed and other challenges like high UFW tackled to save the burgeoning crisis associated
with the systems.

208
-0.15
-0.10
-0.05
-
0.05
0.10
0.15
0.20
0.25
0.30
0.35
0.8 1 1.2 1.4 1.6 1.8 2 2.2 2.4 2.6 2.8 3 Pro
fit,
Pt
Coefficients of Energy, αE
Pt = Billing – (E*αE + L + O)
Break-Even Point = 145%
Figure 3: Sustainability of Small Town Water Systems (Electricity-Driven)
Figure 4: Sustainability of Small Town Water Systems (Diesel-Driven)
Energy Elasticity of Profit
The effect of energy price changes (αE) on profit is expressed in terms of energy elasticity of
profit (ε) for each water system (Equation 2). The energy elasticity of profit values recorded by the
systesms show that Wenchi, Atebubu and Aburi small town water systems are sensitive to energy
price changes, therefore an elastic relationship exist between profit and energy price changes.
Again, the study reveals that profits from Kuntanse and Bekwai small town water systems are
inelastic to electricity price changes because they recorded absolute value of the energy elasticity
of profit is less than one (1).
Table 3: Energy Elasticity of Profit from Small Town Water Systems
Electricity – Driven Diesel – Driven
Wenchi Kuntunase Bekwai Atebubu Aburi
Energy Elasticity of Profit, ε -1.37 -0.19 -0.63 -1.64 2.54
-1.00
-0.80
-0.60
-0.40
-0.20
-
0.20
0.40
0.4 0.5 0.6 0.7 0.8 0.9 1 1.1 1.2 1.3 1.4 1.5 1.6 1.7 1.8 1.9 2
Pro
fits
, Pt
Coefficients of Energy, αE
Pt = Billing – (E*αE + L + O)
Break-Even Point = -25%

209
Conclusions and Recommendations Energy expenses have susbstantial impact on the financial profit from the water systems and form
a substantial component of the total money expended in providing water to consumers. Increased
energy prices reduce profits from the water systems and threaten their sustainabilities.
Additionally, electricity driven systems are more sustaianble to run than diesel driven systems
beacuse diesel driven systems are more susceptible to global oil price changes. This suggests
improvement of electricity infrastructure in areas of water systems and creating awareness on the
enormous payback of converting the diesel driven systems into electricity driven ones. Policy
makers may adopt the outcomes and methodologies of this study and utilise them during reform of
water pricing policies and subsidies to the energy sector. Continuity of this research in assessing
the impacts of the other variables (labour cost and O&M cost) on the sustainabilty of water
facilities may enhance the opeartions and efficiency of the water sector.
________________________________________________________________________________
Acknowledgement First of all, I owe this great gratitude to the Almighty God for guiding and directing me throughout
the entire duration of this study. My heartfelt gratitude is highly expressed to Professor S. N. Odai,
Mr. K. A. Adjei and Mr. F. O. Annor for their continuous guidance. My sincere thanks also go to
my twin brother, Tenkorang Somuah Senior and to my friends; Stephen Owusu Adjei and Jacinta
Carroll Osei Adutwumwaa. I appreciate in profoundness the support of my dad, Mr. Maxwell Rex
Tenkorang and my dear mum, Mercy Obeng for their encouragement for me to continuously
disseminate the output of this research.
________________________________________________________________________________
References 1. Abu-Madi, M. (2010). Impacts of changing energy prices on the financial viability of
agricultural groundwater wells in Tulkarm district- Palestine. International Journal of Water,
Vol 5, No. 3, pp 205-222, 2010.
2. Carter, R., Tyrrel, S. and Howsam, P. (1999). The impact of sustainability of community water
supply and sanitation programs in developing countries. J. Chartered Institute, Water
Environment Management, Vol. 13, pp 292-296.
3. CWSA (2003): Design Guidelines for Small Towns Water Systems. Community Water and
Sanitation Policy, Ministry of Water Resources, Works and Housing, pp 4-5.
4. CWSA (2004): Operations and Maintenance Guidelines for Small Towns Water Systems.
Community Water and Sanitation Policy, Ministry of Water Resources, Works and Housing pp
2-17.
5. Nyarko, K.B., Oduro-Kwarteng, S. and Adama, I. (2007): Cost recovery of community
managed piped water systems in Ashanti region, Ghana. Water and Environment Journal, Vol.
21, pp 92-99.
6. Stockholm International Water Institute (SIWI). (2005). Health, Dignity and Development:
What will it Take? Stockholm International Water Institute and United Nations Millennium
Project, New York.
210
________________________________________________________________________________
3rd Ghana Water Forum, Accra, Ghana, 2011
Water and Sanitation Services Delivery in a Rapidly Changing Urban Environment
The Urban Pro-Poor Water Services Delivery – The Access Dimension:
The Case of AVRL Tanker Service Supply
Benedict Tuffuor, Eugene Larbi & Anne Barendregt
_______________________________________________________________________________
Abstract In Ghana, JMP estimates that in 2008 only 30 percent of the urban population was served by
piped water into a dwelling, plot or yard and 60 percent by other improved sources. This is as a
result of historically low investment in new infrastructure, weak maintenance of existing facilities,
and poor management of water services. The present level of unaccounted for water in Ghana's
cities hovers around 50%. The urban poor are the worst affected by the current situation which
contributes significantly to their economic and social hardship. Unfortunately, efforts by
governments over the years have not improved significantly the plight of the poor who are mostly
the un-served/under-served. The paper looks at a Tanker Services Project implemented by the
Aqua Vitens Rand Limited15
(AVRL) in 2008/09 and makes case for the need to prioritise
improvements in water supply and management to the poor as a first important step in addressing
the problems the poor face with access to potable water.
________________________________________________________________________________
Introduction Access to water through direct connection into a dwelling, plot or yard is generally considered to
be the highest level of service. Globally, there have been significant increases in percentage of
people with direct household connection to tap water in the period 1990-2006, but the situation has
been different in Sub-Sahara Africa, where access to water through household connection and yard
taps has remained stagnant (UNICEF/WHO, 2010). Figures released for 2008 by the JMP showed
that, in Ghana, only 30 percent of the urban population was served by piped water into a dwelling,
plot or yard and 60 percent by other improved sources (public standpipe, borehole, etc.).
The general regularity and reliability of water supply by the GWCL in Accra is not assured
(SWITCH/RCN Ghana, 2011). This has resulted in some kind of rationing over the years. Water
service delivery to the poor (un-served and under-served) faces a lot of challenges - a situation
which is worsened by the notion at the level of GWCL that it is not profitable to serve such
population, but it is also related to GWCL's ability to provide these services. The utility is
technically challenged in providing service to the densely populated, unplanned areas, where many
of the urban poor reside. These areas, often located at some distance from the network, are the
most difficult areas to connect given that utilities normally face financial and human resource gap
and the incentive to address the needs of these areas. Additionally, the urban water delivery system
does not deliver adequate water due to reliance on ageing systems. These difficulties have
15
The national utility, Ghana Water Company Limited (GWCL), on behalf of the Government of Ghana entered into a 5-year management contract (2006-2011) with AVRL. AVRL was in-charge of production, distribution and tariff collection. The contract ended in June 2011 without renewal.
211
contributed to poor and unsatisfactory water supply services in most urban areas in Ghana,
especially Accra and Tema. In 2009, AVRL estimated it distributed about 372,000m3 of water a
day to the Accra-Tema Metropolitan Area (AVRL, 2009). This level of production was inadequate
given the demand level which was over 50% more than the production level.
In Accra and other urban areas in Ghana, available water is rationed to ensure equitable
distribution. The inhabitants of Accra do not receive water every day of the week. The rationing is
in some cases not predictable. Notwithstanding the efforts of GWCL/AVRL to manage the water
supply through rationing in such a way that people receive a fair amount of water on designated
days, some locations in Accra and its peri-urban areas still do not receive water at all. This
problem becomes more pronounced annually during the dry spell between January and March,
when there is no rain water to complement the piped water source. Due to the irregularity and
unreliability, households have resorted to storing water for later use. The situation has also led to a
thriving business of water vending in the under-served and un-served areas through tanker service.
Whilst the water vending has been under the circumstances of immense support to households
without connections, it has also contributed to exploitation of the poor. These vendors mostly
‘source’ their water from the urban pipe-borne network. There are essentially 2 types: large scale
enterprises requiring a capital outlay for purchase of tankers that supply water in large volumes to
richer households situated in water scarce neighbourhoods, and small scale vendors who buy water
from tankers and sell in smaller volumes to individual households at the community level.
Brief History of Tankers Services in Ghana Water Tanker services in Ghana has its history from the 1980s when it started as a way to meet the
ever increasing demand for water in the growing construction sector during that period, especially
in Accra. The continuous decline in the regularity and reliability of water supplied by the GWCL
gave impetus for some domestic consumers to develop business out of the situation. These were
mostly entrepreneurs with the interest who could afford to install tanks to store water for resale to
those who were not connected. The phenomenon developed to a stage where even those without
connections installed tanks and relied on tanker supplies for water to resell. The activities of water
tanker operators continued to grow over the years to the point that the GWCL had to give the
operators of tanker services recognition to curtail the tendencies where some operators were
drawing water illegally from the utility’s fire hydrants and unsafe sources. The tanker operators
were therefore given designated tanker service points where they could go and draw water legally
to sell.
The process developed and led to the initial establishment of a Tanker Operators’ Association to
serve as the mouth piece of the operators and protect members’ interest (Kariuki and Acolor 2000).
Since then, tanker services in the water sector have picked up and according to Sarpong and
Abrampah (2006: p.47), the number of tanker service associations has been increasing. An Accra
Mail report (27 March, 2008) on the launch of the Guideline for Tanker Operators by the Public
Utility Regulatory Commission, estimated the number of water tankers in the Accra and Tema
Metropolitan areas at 1000. The activities of these tanker operators are very prominent in the
Accra and Tema Metropolitan areas and constitute a key component of the water delivery system,
especially in areas of low pressure and un-served areas.

212
The Case of AVRL Tanker Services Intervention The AVRL, in collaboration with the GWCL and the Ministry of Water Resources Works and
Housing (MWRWH) adopted the Tanker Services as an interim measure to deal with acute water
shortages in various parts of Accra during the first half of the year 2008. The most affected
segment of the population was the poor. In response to the problem, the AVRL, in April 2008,
initiated a Tanker Services Project where 2 private tankers were resourced and commissioned to
supply water as an interim and auxiliary measure to selected water-poor areas in the Accra East
Region16
including parts of Osu, La, Teshie-Zongo, Adenta-Ashalley Botwe, Dome-Taifa and
Kwabenya and Dodowa, (Daily Graphic, 2008 and The Ghanaian Times, 2008). In these areas, 20
vantage points (selling points) were selected and AVRL installed storage tanks (averagely 2 per
site) where tankers supplied water for sale by an appointed vendor to consumers at a fixed rate
(GHp5/20litres). The intention was to run the service for about 6 month by which time the drought
would have ended and supply situation would have improved. However, the scheme was found to
be still in high demand by the affected communities even after one year of its operation. This was
because the supply situation had not improved much and for some of the areas supply through the
water mains was virtually non-existent. This paper focuses on the implementation of the project in
parts of Osu, La, Taifa, Dome and Kwabenya and relies a lot on information gathered from a
project evaluation conducted on the scheme by the AVRL in 2009.
Partners and Their Roles and Responsibilities
A summary of roles and responsibilities of partners in the implementation of the project according
to AVRL (2009) is presented below:
AVRL Head Office was to be in charge of the organisation and financing of the project.
AVRL Regional Office, Accra East was to be in charge of the supervision at the various
locations and the construction of the selling points together with the various District Offices of
AVRL.
The selection of the community was done by GWCL, MWRWH, AVRL Head Office and
Accra East Regional Office based on demands from communities and assemblymen.
In the concerned areas, the communities and assemblymen were involved in the selection of
the locations for the selling points, the construction of the platforms and the selection of the
vendors.
During the whole process a consultant from a local NGO was contracted to be responsible for
facilitating community involvement and education.
Operational and Management Arrangements
The AVRL through a consultant facilitated a community involvement process which led to the
selection of community representatives (referred to as Coordinators) to man the selling points in
their respective communities or areas. The Coordinators recruited and supervised vendors, and also
had the responsibility of financial management, and arranging for supply of the water. The
16
Accra East is one of the 12 Operational Regions in which AVRL operates. Each Region is divided into Operational
Districts.

213
coordinators played the oversight role over selling points. The proceeds from the operation went to
the coordinators and they were responsible for paying the vendors their commission and ordering
and paying for tanker supplies. It was arranged that the coordinators paid for the number of trips
being ordered directly at the AVRL Accra East District Office and were issued with waybills. The
coordinator would then, with the copy of the waybill, make requests for water supply from the
tanker operator/driver. The tanker driver would present a copy of the waybills before he would be
served at the filling point. The above notwithstanding, there were slight variations in the
management at different locations including:
Where an Assembly Member is the coordinator. He exercised oversight responsibility over the
running of the selling points including recruitment and supervision of the vendors. For
example, all selling points at La and two at Osu areas were under the respective assembly
members.
Where an opinion leader who showed commitment to the project is given a coordinator’s role
with the same oversight role as above. This arrangement was identified at three selling points
in Dome.
The third option is a situation where the coordinators were themselves the vendors and this was
found at Taifa (three selling points) and two at Osu.
The fourth option identified was where an identifiable local group or body is given the
responsibility of coordinating. In this case the Kwabenya Residents Association spearheaded
the project for the affected areas of the community and exercised the oversight responsibility.
The vendors were basically, in charge of selling the water and cleaning the site. There were very
few instances where the vendors happened to be the co-ordinators themselves as mentioned above.
Payment arrangements for vendors varied in two ways: commission (average of GHC4) on each
consignment of 15.75m3 or monthly fixed payments (average of GHC60). Customer-Vendor
relationship was found to be cordial. Operation periods (hours) of vendors varied slightly among
selling points and they were generally suitable for consumers. This was because vendors had over
the period scheduled their operational hours according to the demand trends in their areas.
Water was supplied by 2 private tankers, each with a capacity of 3500 gallons (15.75m3), hired by
AVRL. Whenever there was pressure, AVRL supported the supply with its own KIA truck fitted
with 2 storage tanks of 9m3 each. The tanker drivers were made to pack at the AVRL premises
when they were not in use to check abuse and also ensure that they were readily available
whenever needed. The tankers filled all locations depending on the request of the coordinators of
the selling points, which was found to be mostly daily or every other day. The mandate of the
tankers was to fill only the project selling points. Under the agreement with AVRL, the tanker
operators received an average of 180 litres of fuel per truck for every week. In addition, they were
paid GHC250 a day per tanker for their services.
AVRL funded the provision of the storage tanks and the raising of the platforms with communities
providing labour at the various selling points. Even though the facilities are solely managed by
people at the community level, the ownership of the storage tanks remained with AVRL and the
tanks were labelled as such. AVRL funded all the other costs (tankers service charges, fuel for
214
tankers, fees for software consultants). The project did not intend to recover the cost of
establishing the selling points.
The arrangement for selling points (20) management varied from one area to the other, and
generally differed from typical community managed schemes in small towns water supply. These
management arrangements, as described above, centred on local champions of the implementation
process in the different communities.
The Successes of the Intervention
Modest improvements in water supply: The project supplied, on average, 128.8m3 of water to
all the 20 selling points per day. The quantity to each area however, varied according to the
level of demand. For instance, the demand from La selling points was more than twice that
from selling points in Taifa. Notwithstanding the community variations, the intervention met a
felt need of the beneficiaries.
Cost saving for the household: The project supplied quality water (based on account of
AVRL) to the beneficiaries at a lower cost than water supplied by private tanker operators
within the communities (most of whom existed before the AVRL interventions started). 20
litres of water was sold at GHp5, compared to local private vendors who sold the commodity at
between GHp10 to GHp20. This means that the same amount of money that was used to buy a
certain quantity of water could now buy 2 to 4 times of the same quantity.
Time savings: The beneficiaries recounted that the turnaround time which used to be a
minimum of 30 minutes (even more in the dry season), drastically reduced to an average of 15
minutes. Queues were experienced only in the peak hours between 6am and 7.30am, and also
between 5pm and 6pm. “The perennial problem of carrying containers about in search of water
has stopped” said one respondent.
Perceived Water Quality: There was widespread consumer perception that the water from the
AVRL selling point was of good quality and would contribute to improved health. Therefore,
consumers who could not get enough for entire household needs would get enough quantity for
drinking from the AVRL selling points.
The Challenges of the Intervention
Bringing down the cost of water: One key objective, aside improving water supply to the
affected areas, was to bring down the prevailing prices of water in the communities which
ranged from 200% to 400% of the AVRL price of GHp5. However, this was not possible
because: the quantity of water supplied to the communities was far below their demand,
locations of the selling points were not convenient to all consumers due to distance, and also
the private vendors bought water at higher price than AVRL sold to the selling points.
Consumers preferred the arrangement where they could walk almost any time to buy from the
private vendor because they operate in the vicinity of their home.
The project had to run on huge subsidy which is not sustainable: In order to ensure that
consumers buy water at the rate of GHp5/20litres and also allow some margins for the
coordinators, AVRL sold water to the selling points at GHc18.00 per 15.75m3 of water by
215
absorbing the cost of engaging the water tanker which was estimated at GHc14,000.00 per
month. The same quantity was sold to the private vendors by private tanker operators at
GHc32.00. It worth noting that, the 20 litres of water would have cost GHp1.3 if consumers
were supplied through direct connection, based on the life-line tariff.
The tanker service was subsidy depended: The AVRL had to highly support the operations to
be able to purge the consumer buying price at official standpipe rate. Tanker service therefore,
is not a feasible option for delivering water at official rate to the urban poor without huge
subsidy support on sustainable basis. A comparative cost analysis of tanker supply and direct
piped supply showed clearly that generally, water tanker services are considerably more
expensive than piped systems.
The scheme is not attractive for private sector investment: Profitability analysis of operations,
under the subsidy and fixed selling price of GHp5, showed low level of profitability.
Coordinators could make a profit of GHc100.00 per month only if they were able to sell 25
trips of supply. With exception of selling points in La, most selling points sold about just 15
trips of supply.
Conclusion: The Case of Access (Supply) Generally, the intervention succeeded in making some improvements in the acute water shortage
situation in the affected communities to calm down the agitations. It met the needs of a section of
the population that led to the continuous demand for the service. It is however obvious that the
project could not make wide spread impact on prices of water in the affected communities. Again,
the low pricing did not change the patronage pattern in favour of the selling points against the
private vendors. There was no evidence of prices of water sold by private vendors being reduced
because of the introduction of the project. The demand for services of the private vendors was still
substantial. This was because consumers generally prioritised access/regularity, reliability and
convenience over the price of the service. In planning for a pro-poor intervention these
expectations should be adequately catered for. This paper does not write off the potentials of other
pro-poor mechanisms if they are well targeted, but emphasises the point that to achieve significant
impacts of pro-poor delivery interventions, water supply to the un-served and under-served areas
should increase significantly through the mains. The sustainability of the supply will require other
well targeted pro-poor mechanisms to ensure that poor actually benefit from the services.
_______________________________________________________________________________
References 1. Accra Mail (2008); Guideline for Tanker Operators:
(http://www.modernghana.com/news/161156/1/guidelines-for-tanker-operators.html)
2. AVRL (2009); Terms of Reference: Evaluation Study on Water Tanker Service Operations in
Accra by Aqua Vitens Rand Limited (AVRL)
3. Kariuki, M. and G. Acolor (2000); Delivery of Water Supply to Low-Income Urban
Communities through the Teshie Tanker Owners Association: a Case Study of Public-Private
Initiatives in Ghana. Conference Papers for “Infrastructure for Development: Private Solutions
and the Poor.” PPIAF, DFID and World Bank, Washington DC.
216
4. Sarpong, K. and K. M. Abrampah (2006); Small Water Enterprises in Africa 4: Ghana; A study
of Small Water Enterprises in Accra, A paper for Water, Engineering and Development Centre
(WEDC), Loughborough University, Leicestershire
_______________________________________________________________________________
Contact Details Benedict Tuffuor
TREND
P.O. Box CT 6135
Cantonments, Accra
Tel. +233 30 769552
Fax. +233 30 769583
Email: [email protected]
Eugene Larbi
TREND
P.O. Box CT 6135
Cantonments, Accra
Tel. +233 30 769552
Fax. +233 30 769583
Email: [email protected]
Anne Barendregt
_______________________________________________________________________________
217
________________________________________________________________________________
3rd Ghana Water Forum, Accra, Ghana, 2011
Water and Sanitation Services Delivery in a Rapidly Changing Urban Environment
Economic Efficiency of Water Storage Options: An Application of the Approach to Ghana
Stefanos Xenarios, Felix Asante & Matthew McCartney
________________________________________________________________________________
Abstract Water storage is widely promoted as an effective method for mitigating some of the adverse
impacts of climate change. Cost benefit analysis is one approach to evaluate which is the most
appropriate water storage type under any specific biophysical and socio-economic conditions.
However, this often results in loss of significant information for those characteristics which cannot
be easily assessed using monetary values. Against this background, the study reported in this
paper developed an outranking-based methodology, designed with threshold systems and
weighting values, in order to overcome some of the constraints of traditional cost-benefit analysis.
The method has been applied in three representative catchments in central and northern Ghana.
The results present a preponderance of upstream areas linked with small reservoirs because of the
considerably high income, the sufficient water supply, the low costs given for water related
illnesses and the low costs for domestic water use.
_______________________________________________________________________________
Introduction Procedures for water storage selection often resort to a form of cost-benefit analysis (CBA) to
identify the most appropriate option. However, in cases where imperfect market conditions exist
and non-market goods and services occur, CBA may lead to non-optimal results.
The first weakness of CBA arises from the strong comparability principle, which stems from the
monetization of heterogeneous goods and services (Hanley and Spash, 1998). The monetization of
all elements inevitably leads to reductionism and loss of information about the nature of each
factor (Munda, 1996). Second, the assumption of the absolute substitutability among goods and
services also causes errors, since in reality this is not always the case (Munda, 1996). For instance,
the revenues derived from the electricity sold by a hydro-electricity plant will often outweigh the
financial costs arising from the displacement of communities and the flooding of ancient forests.
Consequently, the option identified through CBA as the best option, should not necessarily go
ahead.
Another major constraint arises from the potential irreversibility of conditions associated with the
development of water storage. For example, the construction of a hydropower dam often results in
soil erosion due to deforestation, siltation of downstream areas and loss of wildlife (Mishan, 1981).
The issue of ecosystem complexity is another major issue that is poorly handled by the CBA
method. For example, the climate change projections for Sub-Saharan countries indicate the
likelihood of increased rainfall variability in many places (IPCC, 2007). If these climate change
scenarios occur it may drastically affect the costs and benefits over the lifetime of a planned water
storage project.

218
Institutional capture is another major impediment to CBA, mainly represented by inter-
generational inequities. The notion of a discount rate is often used to address trade-offs between
generations. In many instances, this is a highly arbitrary process associated with the identification
of a discount rate which is used to assign values to environmental goods and services that will be
inherited by future generations (Söderbaum, 2005). In relation to distributional aspects and intra-
generational issues, this is often a highly contested approach which is aligned with the core
concept of economic theory. The principles of economic theory are based on the identification of
the most efficient utility level on an individual basis without considering the distributional and
equity aspects of the efficiency (Munda, 1996).
To overcome the aforementioned constraints, we propose a method that is based on a multi-criteria
outranking approach (Roy, 1996). The suggested method assesses diverse indicators related to both
economic performance and environmental impacts of water storage schemes. The approach also
attempts to enumerate the gains and losses between different users. The suggested approach has
been tested by evaluating the performance of different small reservoirs and the effects to upstream
and downstream users in three catchments in central and northern Ghana.
The Outranking Based Approach Our concept is based on the principles of decision aiding approaches. These can be divided into
two types, “descriptive” and “constructive” (Vincke 1994). A descriptive approach focuses on the
identification of pre-existent preferences. This assumes that for whoever’s preference is sought,
they are predefined and pre-exist in a stable state. The descriptive approach forms the basis of the
development of a simple and comparable System of Preference Relations (SPR), which is based on
the strict preference and indifference conditions (Roy, 1996). In the descriptive approach, the most
efficient solution should be identified using trade-off processes between different criteria. The
descriptive approach delineates the concept of optimization usually through a single criterion. The
CBA method is a representative descriptive approach where the monetization of all results should
identify the best solution.
However, over the last two decades, the difficulty of adequately comparing and quantifying
heterogeneous criteria, such as the environmental and economic ones in water resource projects,
has steadily increased (Munda et al, 1994). As a result, the “constructive” approach has been
developed. In this approach, apart from the “strict preference” and “indifference” conditions, the
“weak preference” condition is introduced. In the “weak preference” situation, two possibilities
could prevail in which one criterion is weakly preferred to another or vice versa. Table 1 below
summarises each of the three preference conditions.

219
Table 1: Preference conditions through a constructive approach (Vincke 1994, adjusted by authors)
Conditions Definition
Strict
Preference
Corresponds to the existence of clear and positive reasons that justify
significant preference in favour of one (identified of the two actions).
Weak
preference
Corresponds to the existence of clear and positive reasons that
invalidate strict preference in favour of one (identified) of the two
actions. The reasons are insufficient to deduce either strict preference
in favour of the other action or indifference between the two actions,
thereby not allowing either of the two preceding situations to be
distinguished as appropriate.
Indifference Corresponds to the existence of clear and positive reasons that justify
equivalence between any two actions.
By adopting the above set of conditions, the proposed methodology attempts to establish an
outranking based approach that avoids the inherent constraints of traditional CBA. The
operationalisation of an outranking-based approach based on the constructive concept demands the
introduction of specific relations and values. To help clarify the basic concepts, the essential
components of the outranking approach are given below:
a, b = Alternatives of a proposed project (e.g. a= big reservoir, b= small reservoir)
j = A number of j criteria proposed for the ranking of the examined alternatives
p = strong preference threshold, q= indifference threshold
Initiating from the “strict preference” condition, a threshold value (p) establishes that a strict
preference occurs only when the difference between the examined alternatives is beyond the
defined value. In mathematical form, and assuming a maximization criterion without loss of
generality, this condition is expressed as below:
aPb (a is strongly preferred to b) , g(a)-g(b) > p (1)
Next, the “weak preference” condition is represented by the introduction of another threshold
value (q) which is added to the strict preference above. The condition is then presented through a
double threshold model, where a binary relation measures weak preference as below:
aQb (a is weakly preferred to b) q < g(a)- g(b) < p (2)
In effect, the thresholds q and p comprise the lowest and highest values that could ever occur
between the two alternatives. The weak preference should be determined within the range of these

220
two values. Finally, there is also the indifference condition where the preference of one alternative
(a) over another (b) is lower than the weak preference threshold and hence is considered as
nominal. The model of this condition is expressed as:
aIb (a is indifferent to b; and b to a) g(a) - g(b) < q (3)
The relations of strict, weak preference and indifference situations are operationalized as follows:
1 ( ) ( )
0 ( ) ( )( , )
( ) ( )( ) ( )
j j j
j j j
j
j j j
j j j j
j j
g a q g b
g a p g bc a b
p g a g bq g b g a p
p q
(4)
Where gj(a), gj(b) = the performances of alternative scenarios a and b respectively for each
criterion j , pj, qj = the preference and indifference thresholds respectively.
The values of 0, 1 and θ presented in equation (4), decipher the following messages:
a) 1 = when the difference between the two alternatives a and b for jth criterion is smaller than the
indifference threshold; b) 0 = when the difference between the two alternatives a and b for jth
criterion exceed the preference threshold; c) θ= when the difference between the two alternatives a
and b for jth criterion is between the indifference and preference thresholds
Through the operationalisation of the preference conditions, an outranking relationship (S)
between any two alternatives a and b can be constructed. The outranking relation can be
interpreted as ‘’a is at least as good as b (aSb)’’ or "a is not worse than b". It should be mentioned
that these relationships are applied to each of the j criteria; that is, aSjb means that "a is at least as
good as b with respect to the jth criterion” (Fülöp, 2008).
Many of the outranking-based approaches handle the distributional and significance related
concerns by introducing multipliers, commonly known as weighting factors (DTLR, 2002). To
this end, we introduced higher co-efficient to those criteria which better reflect the linkage of water
storage with livelihood status. The weighting assumptions are necessarily subjective and require
that the analysts should wisely judge the significance of the criteria in order to avoid bias in the
assessment process. However, weight factors are currently the most widely applied approach for
the consideration of distributional aspects (Seager, 2004).
We then calculate the findings of the outranking approach. Customarily, in most of the outranking
based approaches (Roy, 1991), a formula composed by the weighting factors is applied. Usually a
fraction is designed with nominator as the multiplication of weights and outranking results, and
with the denominator representing the sum of the weights:
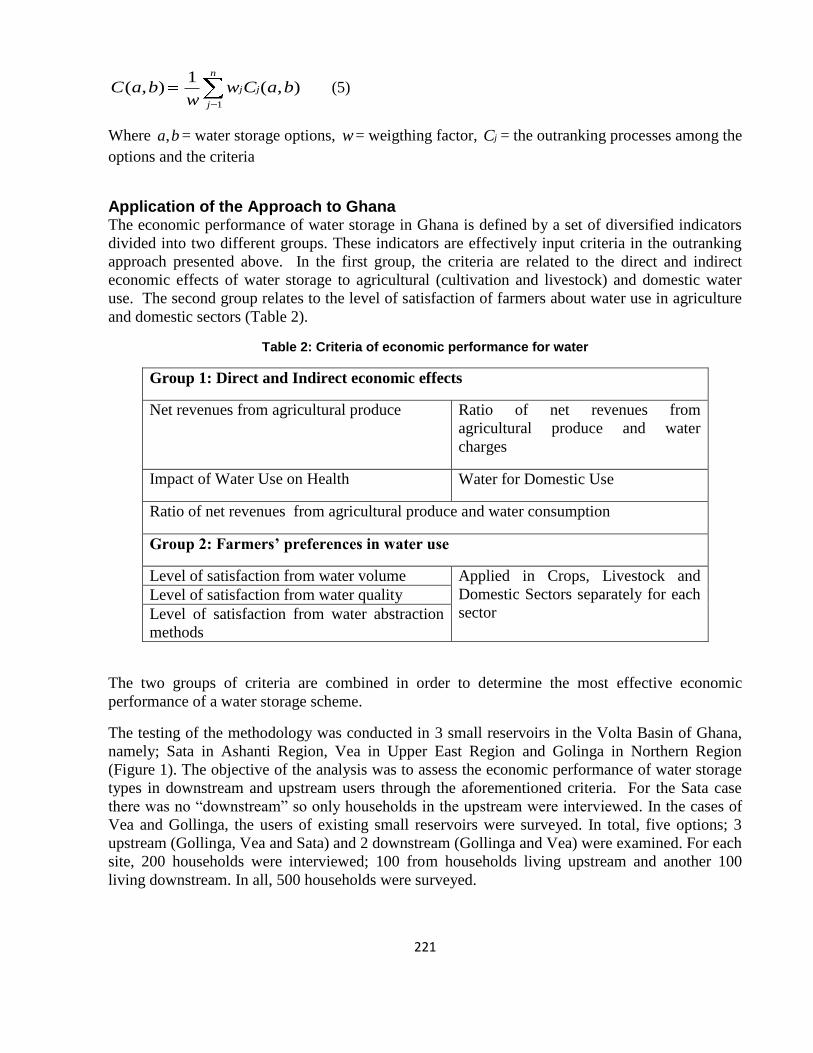
221
1
1( , ) ( , )
n
j j
j
C a b w C a bw
(5)
Where ,a b = water storage options, w= weigthing factor, jC = the outranking processes among the
options and the criteria
Application of the Approach to Ghana The economic performance of water storage in Ghana is defined by a set of diversified indicators
divided into two different groups. These indicators are effectively input criteria in the outranking
approach presented above. In the first group, the criteria are related to the direct and indirect
economic effects of water storage to agricultural (cultivation and livestock) and domestic water
use. The second group relates to the level of satisfaction of farmers about water use in agriculture
and domestic sectors (Table 2).
Table 2: Criteria of economic performance for water
Group 1: Direct and Indirect economic effects
Net revenues from agricultural produce Ratio of net revenues from
agricultural produce and water
charges
Impact of Water Use on Health Water for Domestic Use
Ratio of net revenues from agricultural produce and water consumption
Group 2: Farmers’ preferences in water use
Level of satisfaction from water volume Applied in Crops, Livestock and
Domestic Sectors separately for each
sector Level of satisfaction from water quality
Level of satisfaction from water abstraction
methods
The two groups of criteria are combined in order to determine the most effective economic
performance of a water storage scheme.
The testing of the methodology was conducted in 3 small reservoirs in the Volta Basin of Ghana,
namely; Sata in Ashanti Region, Vea in Upper East Region and Golinga in Northern Region
(Figure 1). The objective of the analysis was to assess the economic performance of water storage
types in downstream and upstream users through the aforementioned criteria. For the Sata case
there was no “downstream” so only households in the upstream were interviewed. In the cases of
Vea and Gollinga, the users of existing small reservoirs were surveyed. In total, five options; 3
upstream (Gollinga, Vea and Sata) and 2 downstream (Gollinga and Vea) were examined. For each
site, 200 households were interviewed; 100 from households living upstream and another 100
living downstream. In all, 500 households were surveyed.

222
Figure 1: Case studies from Middle and Northern Ghana
For the application of the outranking approach, a set of preference and indifference thresholds
were introduced while the weighting factors were also inserted. The calculation of the thresholds
and weights was conducted according to the relevant guidelines suggesting the relation between
the thresholds and co-efficient (Vincke, 1994).
Table 3: Thresholds and values
Criteria Net Rev. Rat. Net
Rev./Wtr
Imp. Wtr
Hlth
Wat.Do
m.
Rat. Net
Rev./Con.
Pref.
Cr.
Indif.
Thrs
100 100 30 5 6 1
Pref.
Thrs
150 150 60 10 12 2
Wgt. 1.2 1.3 1.1 1 1 1
Note: Net Rev. = Net revenues from agricultural produce, Rat. Net Rev./Wtr=Ratio of net revenues
from agricultural produce and water charges, Imp. Wtr Hlth. = Impact of Water Use on Health ,
Wat. Dom.= Water for Domestic Use, Rat. Net Rev./Con=Ratio of net revenues from agricultural
produce and water consumption, Pref. Cr. =Preference related criteria, Indif. Thrs.= Indifference
thresholds(q), ,Pref. Thrs.= Preference threshold (p), Wgt= Weights
The performances of the five alternative options in Vea, Gollinga and Sata were ranked for each
criterion in a pair-wise manner through equation (4) (e.g Vea Upstream Vs. Gollinga downstream,
for the criterion “Impact of Water Use on Health”). The aggregated performance of all criteria for
each pair-wise outranking was then assessed through equation (5). Finally, all the performances of
the pair-wise outranking combinations among the options produced a final scoring index as below
(Table 4):
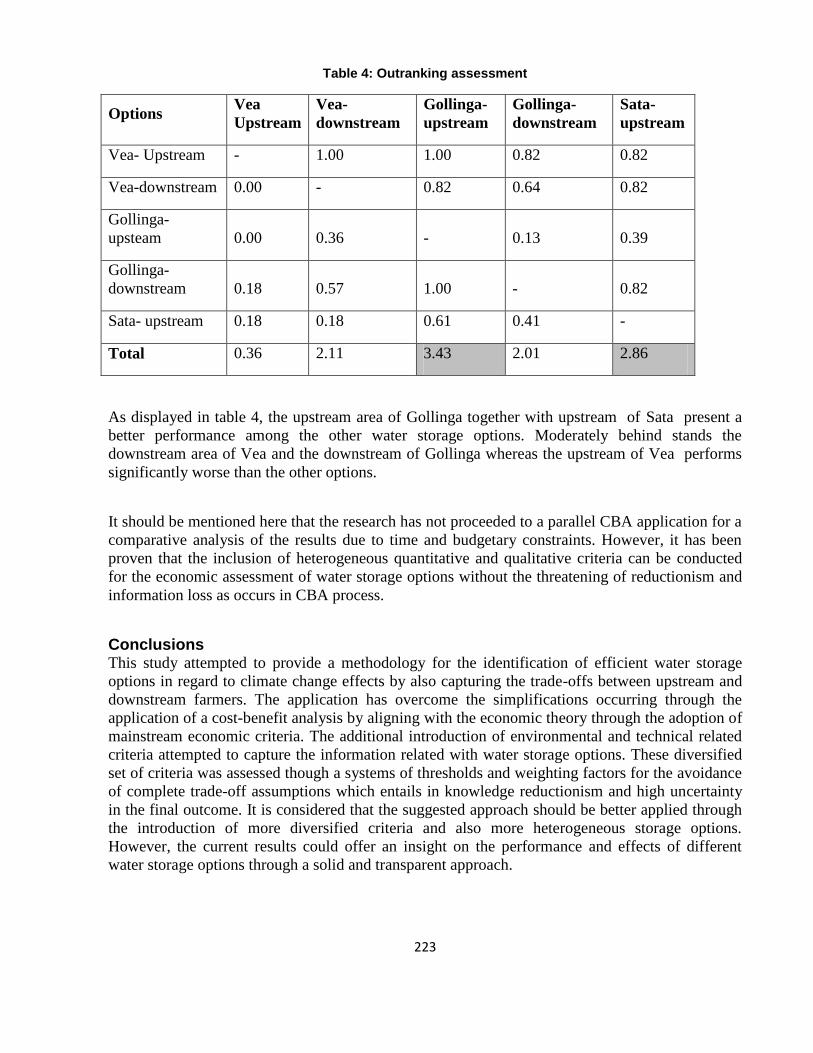
223
Table 4: Outranking assessment
Options Vea
Upstream
Vea-
downstream
Gollinga-
upstream
Gollinga-
downstream
Sata-
upstream
Vea- Upstream - 1.00 1.00 0.82 0.82
Vea-downstream 0.00 - 0.82 0.64 0.82
Gollinga-
upsteam 0.00 0.36 - 0.13 0.39
Gollinga-
downstream 0.18 0.57 1.00 - 0.82
Sata- upstream 0.18 0.18 0.61 0.41 -
Total 0.36 2.11 3.43 2.01 2.86
As displayed in table 4, the upstream area of Gollinga together with upstream of Sata present a
better performance among the other water storage options. Moderately behind stands the
downstream area of Vea and the downstream of Gollinga whereas the upstream of Vea performs
significantly worse than the other options.
It should be mentioned here that the research has not proceeded to a parallel CBA application for a
comparative analysis of the results due to time and budgetary constraints. However, it has been
proven that the inclusion of heterogeneous quantitative and qualitative criteria can be conducted
for the economic assessment of water storage options without the threatening of reductionism and
information loss as occurs in CBA process.
Conclusions This study attempted to provide a methodology for the identification of efficient water storage
options in regard to climate change effects by also capturing the trade-offs between upstream and
downstream farmers. The application has overcome the simplifications occurring through the
application of a cost-benefit analysis by aligning with the economic theory through the adoption of
mainstream economic criteria. The additional introduction of environmental and technical related
criteria attempted to capture the information related with water storage options. These diversified
set of criteria was assessed though a systems of thresholds and weighting factors for the avoidance
of complete trade-off assumptions which entails in knowledge reductionism and high uncertainty
in the final outcome. It is considered that the suggested approach should be better applied through
the introduction of more diversified criteria and also more heterogeneous storage options.
However, the current results could offer an insight on the performance and effects of different
water storage options through a solid and transparent approach.

224
_______________________________________________________________________________
References 1. Clawson and Knetsch, J.L., 1966. Economics of Outdoor Recreation. Baltimore, Maryland:
John Hopkins Press.
2. IPCC 2007. Climate Change, 2007. Fourth Assessment Report of the Intergovernmental Panel
on Climate Change (IPCC), Cambridge University Press, Cambridge, UK
3. Department of Transport, Local Government and Regions (DTLR) 2002, Economic Valuation
with Stated Preference Techniques, Edward Elgar, Cheltenham, UK.
4. Fülöp, J., 2008. Introduction to Decision Making Methods, Laboratory of Operations Research
and Decision Systems, Computer and Automation Institute, Hungarian Academy of Sciences
5. Hanley N. and Spash C., 1998. Cost Benefit Analysis and the Environment, Edwar Elgar Publ,
275pp
6. Mishan E.J., 1981. Introduction to Normative Economics, Publ. Oxford University Press
7. Munda, G., 1996. Cost-benefit analysis in integrated assessment: some methodological issues,
Ecological Economics 19, pp. 157-168
8. Roy, B., 1991. The outranking approach and the foundation of Electre Methods, Theory and
Decision 31: 49-73, 1991.
9. Roy, B., 1996. Multicriteria Methodology for Decision Aiding. Kluwer Academic Publisher,
Dordrecth.
10. Seager, T., P. 2004, Understanding industrial ecology and the multiple dimensions of
sustainability. In Strategic Environmental Management by O’Brien and Gere Engineers. New
York: John Wiley & Sons
11. Söderbaum, P. 2005. Democracy, decision-making, and sustainable development: dam-
construction as an example, Int. J. Water, Vol. 3, No. 2, 2005 107
12. Vincke, P., 1994. Multi Criteria Decision Aid Methods. Kluwer Publ., The Netherlands.
_______________________________________________________________________________
Keywords Water storage, climate change, outranking approach, thresholds, Ghana

225
______________________________________________________________________________
Contact Details Stefanos Xenarios
International Water Management Institute
East Africa & Nile Basin Office
PO Box 5689
Addis Ababa, Ethiopia
Email: [email protected]
Matthew McCartney
International Water Management Institute
East Africa & Nile Basin Office
PO Box 5689
Addis Ababa, Ethiopia
Email: [email protected]
Felix Asante
Institute of Statistical, Social & Economic Research
University of Ghana
P. O. Box LG 74, Legon
Accra, Ghana
Email: [email protected]
______________________________________________________________________________

226
Poster Presentation Abstracts
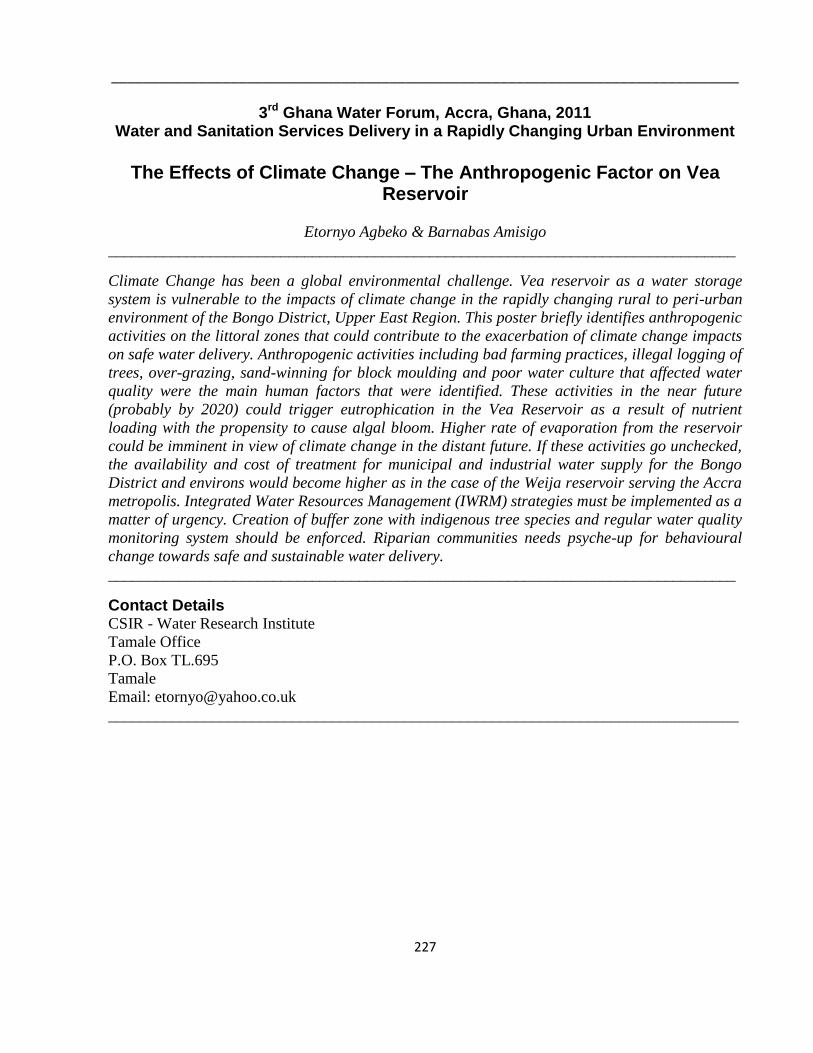
227
_______________________________________________________________________________
3rd Ghana Water Forum, Accra, Ghana, 2011 Water and Sanitation Services Delivery in a Rapidly Changing Urban Environment
The Effects of Climate Change – The Anthropogenic Factor on Vea
Reservoir
Etornyo Agbeko & Barnabas Amisigo
________________________________________________________________________________
Climate Change has been a global environmental challenge. Vea reservoir as a water storage
system is vulnerable to the impacts of climate change in the rapidly changing rural to peri-urban
environment of the Bongo District, Upper East Region. This poster briefly identifies anthropogenic
activities on the littoral zones that could contribute to the exacerbation of climate change impacts
on safe water delivery. Anthropogenic activities including bad farming practices, illegal logging of
trees, over-grazing, sand-winning for block moulding and poor water culture that affected water
quality were the main human factors that were identified. These activities in the near future
(probably by 2020) could trigger eutrophication in the Vea Reservoir as a result of nutrient
loading with the propensity to cause algal bloom. Higher rate of evaporation from the reservoir
could be imminent in view of climate change in the distant future. If these activities go unchecked,
the availability and cost of treatment for municipal and industrial water supply for the Bongo
District and environs would become higher as in the case of the Weija reservoir serving the Accra
metropolis. Integrated Water Resources Management (IWRM) strategies must be implemented as a
matter of urgency. Creation of buffer zone with indigenous tree species and regular water quality
monitoring system should be enforced. Riparian communities needs psyche-up for behavioural
change towards safe and sustainable water delivery.
________________________________________________________________________________
Contact Details CSIR - Water Research Institute
Tamale Office
P.O. Box TL.695
Tamale
Email: [email protected]
_______________________________________________________________________________

228
________________________________________________________________________________
3rd Ghana Water Forum, Accra, Ghana, 2011 Water and Sanitation Services Delivery in a Rapidly Changing Urban Environment
Enhancing Sustainability of Water and Sanitation Facilities
Through Mobile Phone Technology
Patrick Apoya & Aelaf Dafla
_______________________________________________________________________________
This poster shows a mobile phone based system developed to record the operational status of
community water and sanitation facilities and order spare parts when repair is needed. The system
is designed to improve monitoring of facilities by enabling community members to SMS the
operational status of the facilities. The system also allows spare parts to be ordered and be paid
for by community using SMS and mobile money provided by mobile network providers. One of the
Millennium Development Goals (MDGs) is to reduce the population without portable water and
sanitation by half. Many countries including Ghana are following Community Ownership and
Management (COM) approach as one of the strategies to achieve this goal. In this strategy
community members are given responsibility to operate, manage and maintain water and
sanitation facilities located in their locality. Studies have identified this method as a successful
approach, at the same time some problems in monitoring and evaluation have been identified. The
proposed system in this paper aims at addressing the challenge of monitoring facilities.
________________________________________________________________________________
Contact Details Patrick Apoya
CEO
SkyFox
Tel: 0244472784
Email: [email protected]
Aelaf Dafla
Lecturer
Ashesi University College
Tell: 0244175115
Email: [email protected] _______________________________________________________________________________________

229
________________________________________________________________________________
3rd Ghana Water Forum, Accra, Ghana, 2011
Water and Sanitation Services Delivery in a Rapidly Changing Urban Environment
Construction of Ferrocement Rain-Harvesting Tanks
L. Danso-Amoako & Herbert Attefuah
________________________________________________________________________________
Ferrocement tanks are used for storing water for domestic, industrial and agricultural purposes in
many parts of the world. The construction of the tanks was introduced into the country by
UNICEF.
Ferrocement tanks are built by hand trowelling a cement-rich mortar onto straight fencing wire
(mostly BRC mesh) with woven mesh (mostly chicken wire) wrapped around them. The thickness of
the tank wall varies from 3 to 10cm depending on its capacity.
Ferrocement tanks are preferred to concrete tanks for these reasons:
The Public Works Department of the Ministry of Water Resources, Works and Housing has
constructed over 50 Ferrocement tanks, listed below. Majority of the tanks are over 20 years, but
they are all functioning normally without any defects. The tanks are constructed by formidable
mobile gangs, some with over 24 years experience in tanks construction (Concrete and
Ferrocement Tanks).
Ferrocement Tank vs Other Tanks Item Ferrocement Tank
Capacity) : 20,000 litres
(Approx 5,000 gal
Concrete Tank
Capacity: 20,000 litres
(Approx 5000 gal)
Polymer Tanks
Capacity: 20,000 litres
(Approx 5000 gal)
Cost GH¢45,000 to GH¢50,000
Depending on location
GH¢120,000 to
GH¢150,000
Depending on
Configuration, wall
thickness and location
GH¢45,000 to
GH¢50,000
Depending on brand
Construction Period Can be constructed and ready
for use within a maximum of
15 days.
Can be constructed and
ready for use within a
maximum of 28 days.
Wall thickness Average 5cm (2 inches) Minimum 15cm (6
inches)
Basic
Materials
Cement
Sand
Mesh
Cement
Sand
Stones
Steel Rods
Product of Polymerization
Artisans Masons, Labourers Masons, Carpenters
Steel benders, Labourers
Transportability Can be transported Cannot be transported Can be transported
Others Attractive, easy to repair,
difficult to construct during
raining seasons. Mortar on
sugar sack can wash away.
Not Attractive, difficult to
repair.
Cracks easily by sun rays
when empty.
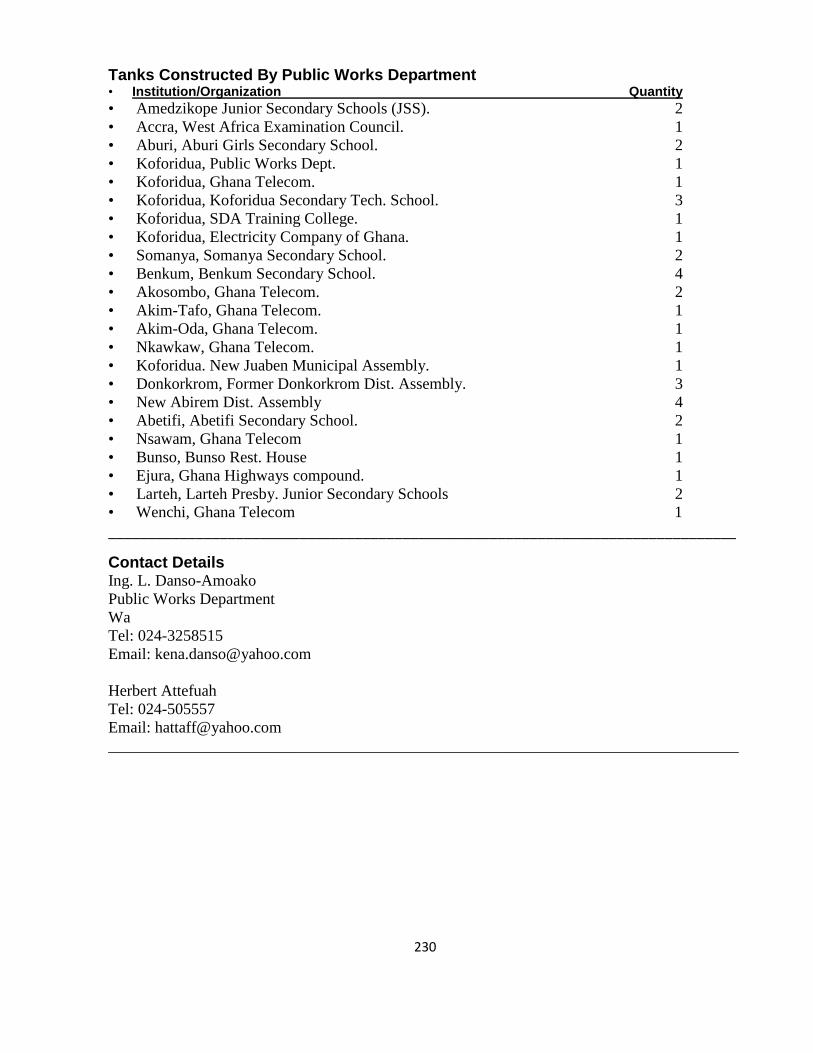
230
Tanks Constructed By Public Works Department • Institution/Organization Quantity
• Amedzikope Junior Secondary Schools (JSS). 2
• Accra, West Africa Examination Council. 1
• Aburi, Aburi Girls Secondary School. 2
• Koforidua, Public Works Dept. 1
• Koforidua, Ghana Telecom. 1
• Koforidua, Koforidua Secondary Tech. School. 3
• Koforidua, SDA Training College. 1
• Koforidua, Electricity Company of Ghana. 1
• Somanya, Somanya Secondary School. 2
• Benkum, Benkum Secondary School. 4
• Akosombo, Ghana Telecom. 2
• Akim-Tafo, Ghana Telecom. 1
• Akim-Oda, Ghana Telecom. 1
• Nkawkaw, Ghana Telecom. 1
• Koforidua. New Juaben Municipal Assembly. 1
• Donkorkrom, Former Donkorkrom Dist. Assembly. 3
• New Abirem Dist. Assembly 4
• Abetifi, Abetifi Secondary School. 2
• Nsawam, Ghana Telecom 1
• Bunso, Bunso Rest. House 1
• Ejura, Ghana Highways compound. 1
• Larteh, Larteh Presby. Junior Secondary Schools 2
• Wenchi, Ghana Telecom 1
_______________________________________________________________________________
Contact Details Ing. L. Danso-Amoako
Public Works Department
Wa
Tel: 024-3258515
Email: [email protected]
Herbert Attefuah
Tel: 024-505557
Email: [email protected]
_______________________________________________________________________________
231
_______________________________________________________________________________
3rd Ghana Water Forum, Accra, Ghana, 2011
Water and Sanitation Services Delivery in a Rapidly Changing Urban Environment
No Toilet at Home: Sanitation Strategies for Urban Dwellers
Adrien Mazeau
________________________________________________________________________________
In the context of a rapidly changing urban environment, provision of infrastructure and basic
services such as sanitation has to overcome a range of technological, institutional and social
challenges. Land tenure, space to build and low household income (or poverty) are often
recognized as barriers to the provision of private toilets. To overcome some of these barriers,
public and private providers have built blocks or individual toilets to serve more multiple families.
These shared facilities can be of many types but in the context of low-income and high density
areas, they remain one of the most used solutions for access to sanitation. Shared sanitation
facilities serve more than 50 % of the urban population of Ghana.
The poster presents pictures and initial results from an on-going study regarding the options
available to urban dwellers when selecting a sanitation facility. In Ashaiman, dwellers may have
access to public toilets managed by the municipal assembly, toilet blocks run by private entities,
single toilets belonging to neighbours or toilets managed by landlords. Facing this range of
facilities, residents of Ashaiman make a choice of which facility to use based on their perceptions
and past experiences and a set of parameters such as for instance proximity or price. The poster
suggests that a better understanding of user perceptions will help stakeholders identify the
circumstances under which different types of shared sanitation facilities would be acceptable for
urban dwellers. Acceptability of a facility is one of the key aspects ensuring the future use of the
facility.
Contact Details
Mr. Adrien Mazeau
PhD Scholar
WEDC
Loughborough University
Loughborough
Leics. LE11 3TU
Tel: (+44) 0759 892 8397
Email: [email protected]