minne lusa project capital improvements state of … of the...metropolitan utilities district...
TRANSCRIPT
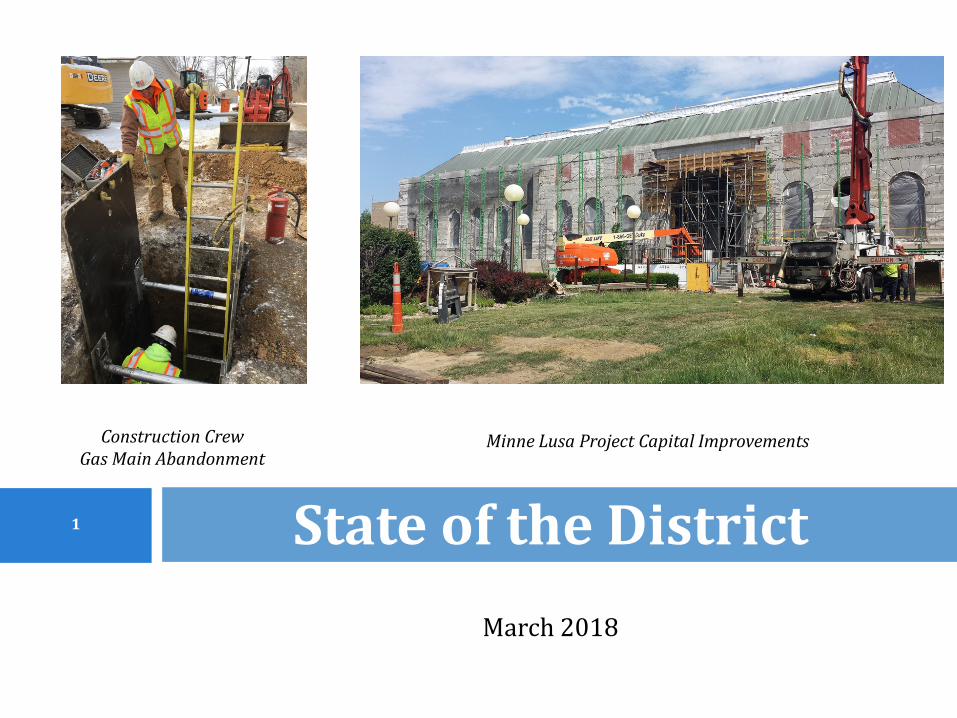
March 2018
State of the District 1
Construction Crew Gas Main Abandonment
Minne Lusa Project Capital Improvements
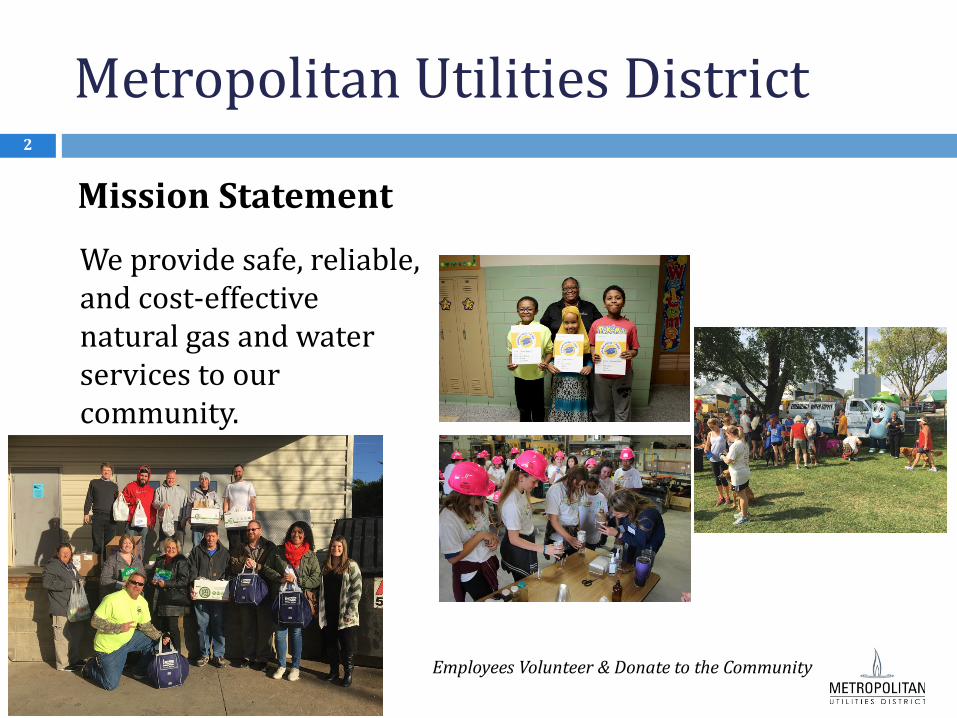
Metropolitan Utilities District
Mission Statement
We provide safe, reliable, and cost-effective natural gas and water services to our community.
2
Employees Volunteer & Donate to the Community
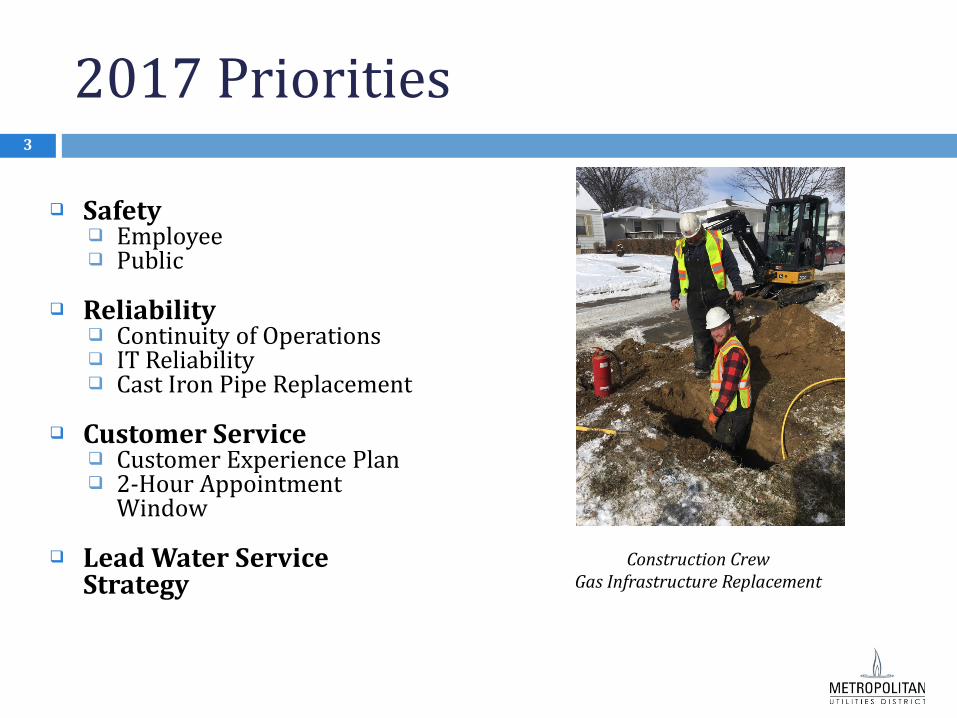
2017 Priorities Safety
Employee Public
Reliability
Continuity of Operations IT Reliability Cast Iron Pipe Replacement
Customer Service
Customer Experience Plan 2-Hour Appointment
Window
Lead Water Service Strategy
3
Construction Crew Gas Infrastructure Replacement

2018 Priorities Safety
Employee Public
Reliability
Continuity of Operations Infrastructure
Cast Iron Pipe Replacement Florence
Metering System Financial Stability
Long-term Growth
Customer Experience Delivering the Right
Customer Experience 100% of the Time
4
Business Continuity Exercise

District Vision Statement
To maintain our commitment to serve our community, while striving to become one of the nation's top utilities. This will be demonstrated by achieving industry leading performance in: Safety Reliability Customer Service Efficiency Regulatory
Compliance Financial Stability
5
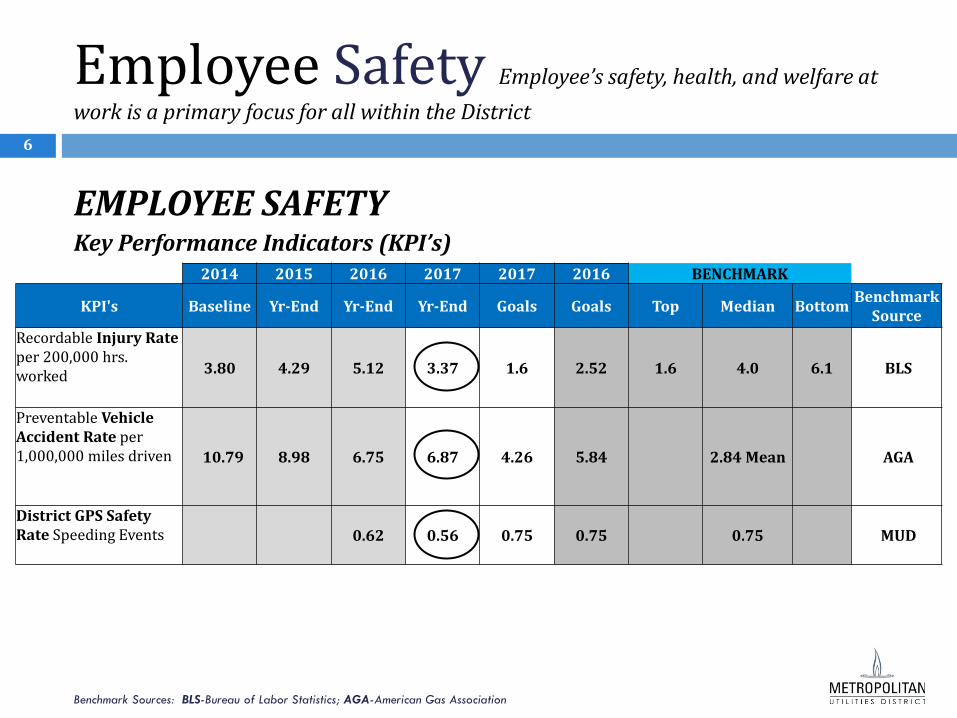
6
EMPLOYEE SAFETY Key Performance Indicators (KPI’s)
Employee Safety Employee’s safety, health, and welfare at work is a primary focus for all within the District
Benchmark Sources: BLS-Bureau of Labor Statistics; AGA-American Gas Association
2014 2015 2016 2017 2017 2016 BENCHMARK
KPI's Baseline Yr-End Yr-End Yr-End Goals Goals Top Median Bottom Benchmark Source
Recordable Injury Rate per 200,000 hrs. worked 3.80 4.29 5.12 3.37 1.6 2.52 1.6 4.0 6.1 BLS
Preventable Vehicle Accident Rate per 1,000,000 miles driven 10.79 8.98 6.75 6.87 4.26 5.84 2.84 Mean AGA
District GPS Safety Rate Speeding Events 0.62 0.56 0.75 0.75 0.75 MUD

7
Employee Safety: Incident Comparisons
10 Year Personal Injury Average 2006-2016: 51.9 incidents per year
65
80
61 5948 51
42 38 3540
47
30
0
10
20
30
40
50
60
70
80
90
2006 2007 2008 2009 2010 2011 2012 2013 2014 2015 2016 2017
Num
ber
of In
juri
es
10 Year Injury Trend
Median Annual Injury Rate 51.9
2017 = All-Time Low Rate of Recordable Injuries

Employee Safety: Personal Injuries 2017 had the lowest rate of workplace injuries on record
8
Workplace Injuries (30) 60% were the result of
“Conditions Beyond Control” (e.g. insect bites, routine activities, vehicle accidents, etc.)
23% were the result of “Unsafe Acts”
17% were the result of “Unsafe Conditions”
Leading Types of Injuries: 60% (18 total) of injuries are sprains and strains
1 1
2
1
2
5
18
1 Carpal Tunnel
1 Rash, Reaction
2 Animal Bite, Sting
1 Abrasion
2 Slips/Trips
5 Cuts, Lacerations, Puncture
18 Sprains, Strains

Employee Safety: Vehicle Accidents 9
Total Vehicle Accidents (32) 65% were preventable (PVA) (21)
Over 80% of Preventable Vehicle Accidents (PVAs) involved a collision with a fixed object resulting in the creation of the M.U.D. PVA Reduction Strategic Initiative for 2018
012345678
8 6 5
2
Preventable Vehicle Accident (PVA) Collision Location
2017
0 1 2 3 4 5 6 7 8 9 10 11 12 13 14 15
15
5
1
Preventable Vehicle Accident (PVA) Causes 2017
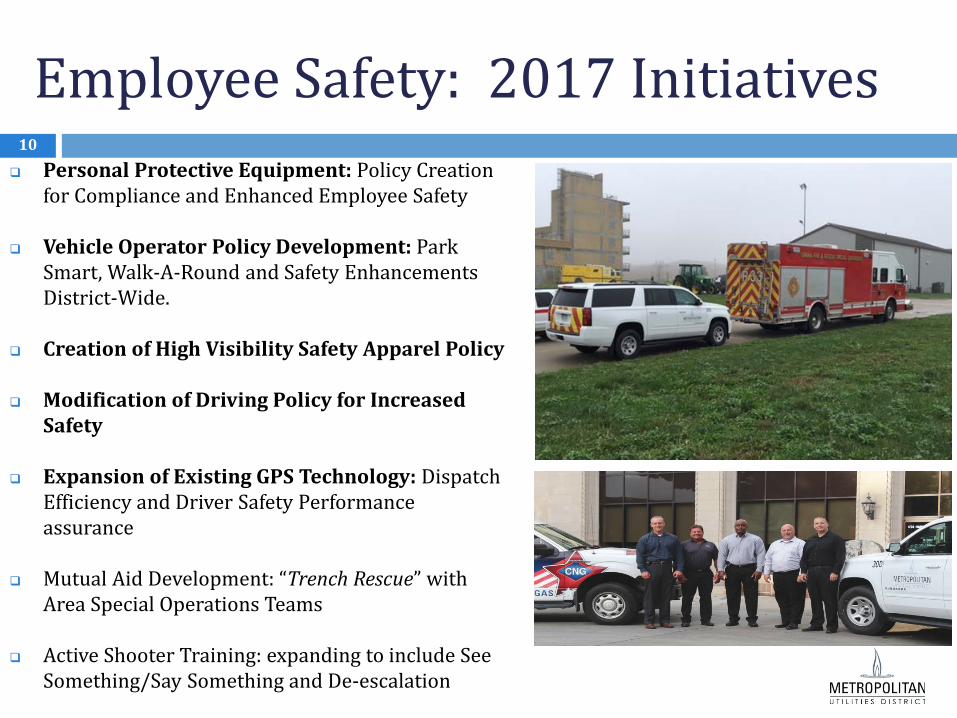
Employee Safety: 2017 Initiatives 10
Personal Protective Equipment: Policy Creation for Compliance and Enhanced Employee Safety
Vehicle Operator Policy Development: Park Smart, Walk-A-Round and Safety Enhancements District-Wide.
Creation of High Visibility Safety Apparel Policy
Modification of Driving Policy for Increased Safety
Expansion of Existing GPS Technology: Dispatch Efficiency and Driver Safety Performance assurance
Mutual Aid Development: “Trench Rescue” with Area Special Operations Teams
Active Shooter Training: expanding to include See Something/Say Something and De-escalation

Employee Safety: 2017 Initiatives 11
Active Outreach with City of Omaha for Traffic Safety Addition of Portable Rumble Strips to increase field
Safety Actively Participating with American Gas Association
to define best practices for gas operations, lone-worker safety, evacuations and gas emergency response
Supervisor safety training and performance metrics aimed at increased engagement
Commercial Drivers License (CDL) Training contracted to Metropolitan Community College
Intensive in-house driver training program (Safety employee certified as driver trainer in December, 2016)
Improved Safety and Security staff visibility 90 Comprehensive Site Safety Visits scheduled Monthly

Employee Safety: 2018 Initiatives 12
Preventable Vehicle Accident Rate Reduction Implement Vehicle Operator Policy Implement Preventable Vehicle Accident Policy
Work-place Injury Reduction Strategy
Implement High Visibility Safety Apparel Policy Deliver Safety Training through Learning Management System
Lone Worker Safety/Security Enhancement Strategy
De-escalation Training Risk Awareness, Identification and Reduction Strategy
Mass Communication System
Design, Budget and Implement System Global Employee Awareness Strategic Initiative
Increase Site Visits and Overall Safety Focus Personal Protective Equipment; Compliance and Review Enhanced Supervisor Safety Training
Cross Functional Team Development for Near-Miss Investigations
Using Root Cause Analysis to Identify Causation to Reduce Loss Representatives from across the District
Expanded Certification and Specialty Training Chemical Facility, Anti-Terrorism Compliance
13
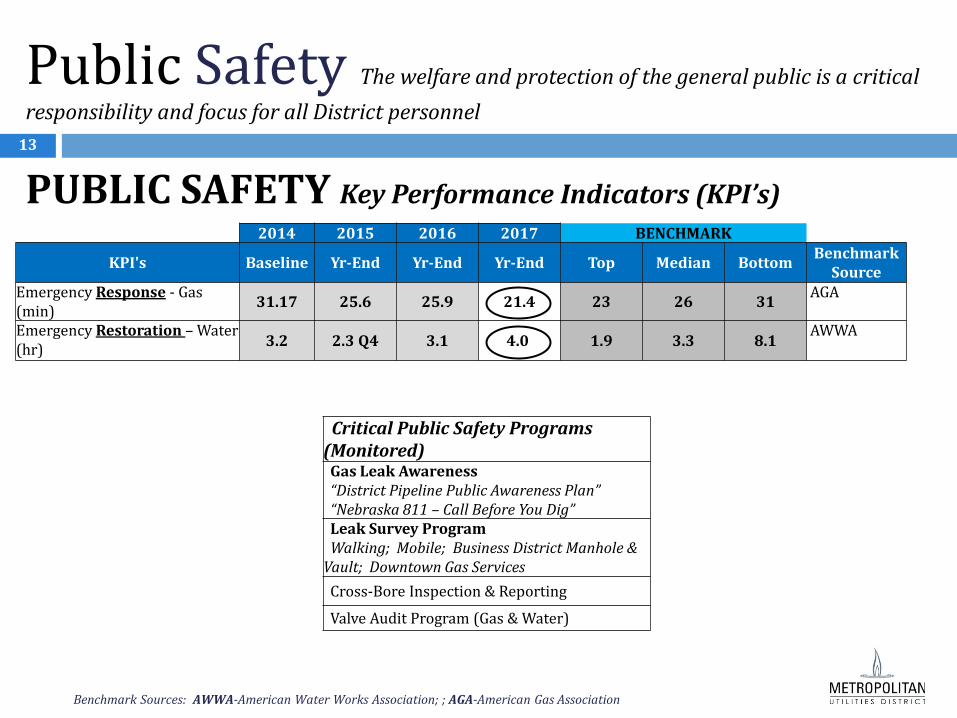
PUBLIC SAFETY Key Performance Indicators (KPI’s)
Public Safety The welfare and protection of the general public is a critical responsibility and focus for all District personnel
Critical Public Safety Programs (Monitored) Gas Leak Awareness “District Pipeline Public Awareness Plan” “Nebraska 811 – Call Before You Dig” Leak Survey Program Walking; Mobile; Business District Manhole & Vault; Downtown Gas Services Cross-Bore Inspection & Reporting
Valve Audit Program (Gas & Water)
Benchmark Sources: AWWA-American Water Works Association; ; AGA-American Gas Association
2014 2015 2016 2017 BENCHMARK
KPI's Baseline Yr-End Yr-End Yr-End Top Median Bottom Benchmark Source
Emergency Response - Gas (min) 31.17 25.6 25.9 21.4 23 26 31 AGA
Emergency Restoration – Water (hr) 3.2 2.3 Q4 3.1 4.0 1.9 3.3 8.1 AWWA

Public Safety: 2017 Initiatives Emergency Response: Completed & On-Going Created and Implemented New Gas-Filled Structure
Emergency Response Policy Emergency Response Roles Redefined:
Adopted and Expanded Incident Command System (ICS) Created Emergency Response and Incident Management Team
Emergency Response Vehicle Placed in Service
Improved Quality Assurance/Quality Control (QA/QC): Post-Incident Review Meetings Emergency Calls Locating Valve Audit Program
Applied Technology: Texting for Notifications and Valve Info Click/Work Manager Utility Viewer Ipad distribution GPS
Expanded ESChat Communications and Portable Radio use Added Portable Radios to Communication Plan
On Existing 911 Radio Framework
14
June 18th, 2017 9th & Dodge
July 31st, 2017 Creighton University
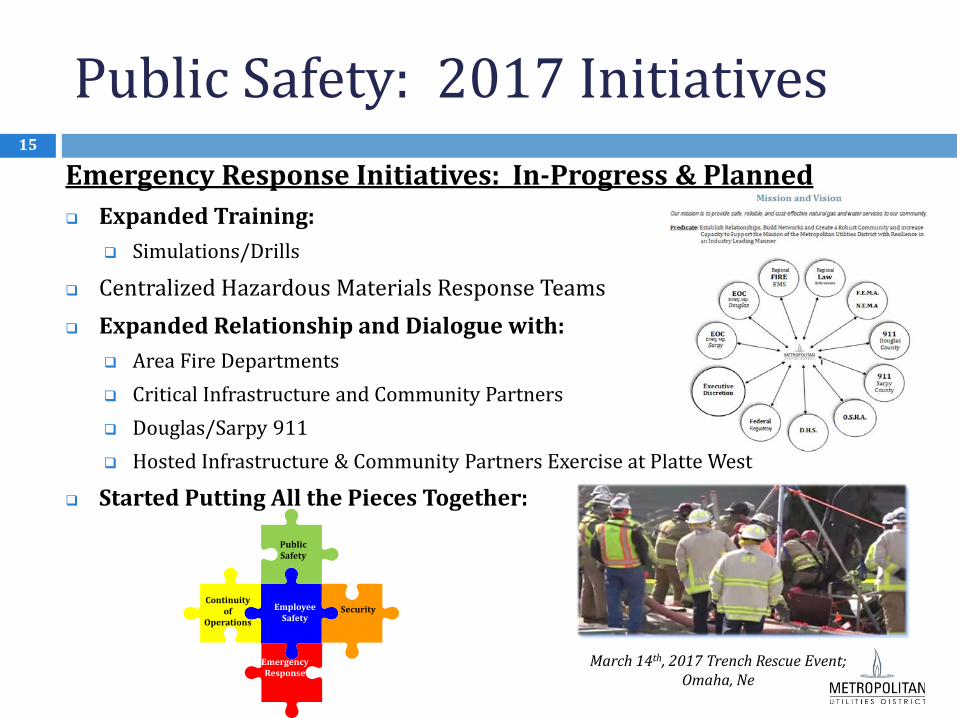
Public Safety: 2017 Initiatives Emergency Response Initiatives: In-Progress & Planned Expanded Training:
Simulations/Drills
Centralized Hazardous Materials Response Teams Expanded Relationship and Dialogue with:
Area Fire Departments Critical Infrastructure and Community Partners Douglas/Sarpy 911 Hosted Infrastructure & Community Partners Exercise at Platte West
Started Putting All the Pieces Together:
15
March 14th, 2017 Trench Rescue Event; Omaha, Ne
Employee Safety
Public Safety
Continuityof
OperationsSecurity
Emergency Response
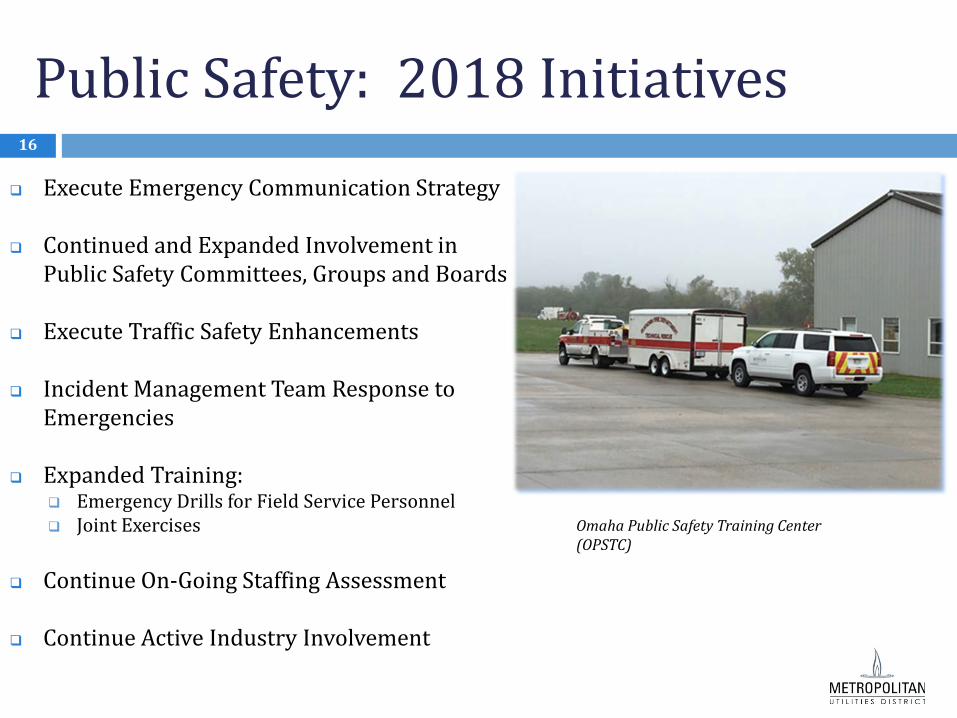
Public Safety: 2018 Initiatives 16
Execute Emergency Communication Strategy
Continued and Expanded Involvement in Public Safety Committees, Groups and Boards
Execute Traffic Safety Enhancements
Incident Management Team Response to Emergencies
Expanded Training: Emergency Drills for Field Service Personnel Joint Exercises
Continue On-Going Staffing Assessment
Continue Active Industry Involvement
Omaha Public Safety Training Center (OPSTC)

Reliability: District Water Plants 17
Florence Platte South
Platte West

18
Reliability Our customers can count on our service availability and support being provided in a fashion that aligns with the District’s values.
RELIABILITY Key Performance Indicators (KPI’s)
Benchmark Sources: SLA-Service Level Agreement
2015 2016 2017 BENCHMARK
KPI's Yr-End Yr-End Yr-End Top Median Bottom Benchmark Source
Uptime % for business critical systems (SAP, GIS, OpenText & Payment Systems)
99.90% 99.0% SAP target SLA for Cloud-Hosted Systems
Breaks per mile of pipes - Gas (Cast Iron) 0.25 0.16 0.18 0.10 0.19 0.27
AGA
Breaks per 100 miles of pipes - Water 13.3 15 16.7 3.5 7.4 16.3
AWWA
Unplanned Disruptions of Water Service < 4 Hrs (per 1000 accts) .37 Q4 2.54 3.2 0.46 0.92 2.13
AWWA
Total Unplanned Disruptions of Gas Service (per 1000 accts) 0.02 Q4 0.27 0.30 0.54 1.12 2.04
AGA

Reliability: 2017 Initiatives 19
Information Technology Data Center Moved to Private Cloud
Gas & Water Infrastructure Replacement
Florence Capital Improvement Plan (CIP)
Business Continuity Replaced boil-off compressors at
Liquefied Natural Gas (LNG) Plant Back-up Generator for
Construction Center & Compressed Natural Gas (CNG) Station
Completed 5th and final phase of Gas Distribution SCADA Master Plan
Data Center Move Team
Minne Lusa Refurbishment

Reliability: Gas & Water Infrastructure 20
7.7 9.2
23.019.3 20.2
26.430.7 32.0 34.0 34.9
405.45
5.5 3.96.6
9.4
3.9 4.18.3 9.1 10.6 9.2 11
1.9
0
5
10
15
20
25
30
35
40
45
2008 2009 2010 2011 2012 2013 2014 2015 2016 2017 2018 Budget
IR Program - Cast Iron ReplacementMiles of Main
Gas Cast Iron Gas Other Water Cast Iron Water Other

Reliability: Gas & Water Infrastructure 21
**Beginning in 2017 the definition of “Break” was refined with “leaks” and “hits” removed and tracked separately**
0
100
200
300
400
500
600
700
800
Annual Pipe Damage
Gas Hits
Gas Leaks
Gas Breaks
Water Hits
Water Leaks
Water Breaks

2017 Business Continuity Program (BCP) 22
Business Continuity Manager Added
Complete Safety (Public and Employee) initiatives started in 2017
Expand Public Safety Posture throughout service area with industry and community partners
Expand participation with Sarpy and Douglas County Emergency Management
Improved Safety, Security, Business Continuity and Emergency Response training to include in-house and District first responder simulations/drills/table-top exercises; BCP Tabletop occurred on November 8th, 2017.
Deployed Portable Radios for Emergency Scene Communications and created formal emergency
communications strategy on the 911 framework
Complete Business Continuity Plan Delivered March 1st, 2018
Business Continuity Plan Continuity of Operations

Business Continuity: 2018 Initiatives 23
Business Continuity Training & Activities: Conduct Two Scaled Exercises in CY 2018 Continue On-Going Staffing Assessment Execute comprehensive risk reduction strategy for
Construction Center and District Capital Assets
Business Continuity Plan: Test Draft 0 of Final BCP Deliver Final BCP Draft 1 to President Plan Updates Stress-Test Current Security Contract
Evolution of Emergency Drills for operations crews And Emergency Operation Plan Revisions Mass Communication System Adopted and
Deployed Q1 2018
M.U.D. Emergency Command Center

Reliability: 2018 Initiatives Major System Improvements
144th & W. Dodge to Pacific 36” Connection Main 148th – 156th W. Dodge Road 30” Main West Dodge Pump Station
Florence, Platte South CIPS 117th & Fort well casings inspection Replace 2nd boil off compressor at LNG Plant Gas & Water Infrastructure Replacement Information Technology:
Cyber Security SCADA Systems
Future of Downtown Building Metering Infrastructure:
Plan for Next 25 Years Advanced Metering Infrastructure (AMI) vs Existing
Encoder Receiver Transmitters (ERT’s)
24
Construction Crew Gas Infrastructure Replacement

25
Customer Service Customers can count on the District providing excellent services and an overall positive experience with every interaction.
CUSTOMER SERVICE Key Performance Indicators
Benchmark Sources: EEI-Edison Electric Institute; AWWA-American Water Works Association
2014 2015 2016 2017 2018 BENCHMARK
KPI's Baseline Yr-End Yr-End Yr-End Goals Top Median Bottom Benchmark Source
Appointments made; % adherence to 2-Hr window
TBD 93.0% 95% 99% 98% 90%
EEI-AGA DataSource
Billing - Corrected Bill Rate (per 10,000 billings)
16 12.5 6.7 6.0 Top Quartile 5.3 11.6 36.4
AWWA
Call Center - % Calls Answered 79% 95.5% 95.8% 94.6% 95% MUD Target
Call Center - Average Wait Time 4.2 1.6 1.4 1.7 < 2.0 MUD Target
QA Customer Accounting (Avg Score) 94%
95%
96%
95%
MUD target
QA Customer Service (Avg Score) 86.5%
90.4%
94%
95%
MUD target

Customer Service Initiatives
2017 Projects In-Process or
Completed
2-Hr Appointment Scheduling
Outbound Calling Capability/Campaigns
Recurring E-Checks Builder/Contractor
Online Self-Service
2018 Projects Budgeted
Recurring Credit Card
Payments Interactive Voice
Response (IVR) Enhancements
Self-Service Options Invoice Redesign
26

Launched Customer Experience - 2017
Annual Customer Satisfaction Survey created, released and incorporated into Geographic Information System (GIS)
Customer Service and Communication Training Initiated
District-Wide Customer Experience Committee formed
27
Customer Experience Committee – December, 2017

Customer Survey Results Summary 28
83% of Customers are either very satisfied (51%) or somewhat satisfied (32%) with MUD’s performance.

Customer Experience - 2018 Annual Customer Satisfaction Survey with GIS Creation and implementation of quarterly surveys
Emergency Response, Customer Service, Infrastructure Replacement, Technology
Customer Journey Mapping Customer Service Definitions District-Wide Customer Service Training Communication and Engagement
Customer Experience Vision Statement Our commitment:
Get it right the first time – Always! Excellence, Accuracy, Timeliness
29

30
Efficiency The District must effectively utilize its resources to accomplish its mission by maximizing productivity and demonstrating optimal performance.
EFFICIENCY Key Performance Indicators
2014 2015 2016 2017 BENCHMARK
KPI's Baseline Yr-End Yr-End Yr-End Top Median Bottom Benchmark Source
Total Customer Service Cost per Account
$47.69 $47.90 $45.59 $43.45 $22.71 $38.91 $51.84 AWWA
O&M expense per customer (Gas) excluding Cost of Natural Gas and 'gas peak shaving'
$212 $229 $233 $225
MUD target
O&M expense per customer (Water) $337 $360 $356 $360 $314 $396 $530
AWWA
HR-Employee Turnover Rate 5.8% 4.3% 4.3% 6.6% 6.0% 7.2% 12.2%
AWWA

Efficiency: BPI 2017 Initiatives Lean Six Sigma/Creighton
Partnership Training:
35 Yellowbelts (111 total) 12 Greenbelts
Certification: 18 Yellowbelts (67 total)
Benefit Opportunities Identified ~$5.6M Annual program-to-date
Business Process Improvement (BPI)
Final Meters-to-Cash Projects Completed (4)
Leadership Assigned – Water IR, GRM, NNG
31
Employee Recognition ‘17 Yellowbelt Lean Six Sigma Certification
Employee Recognition ‘17 Greenbelt Lean Six Sigma Certification
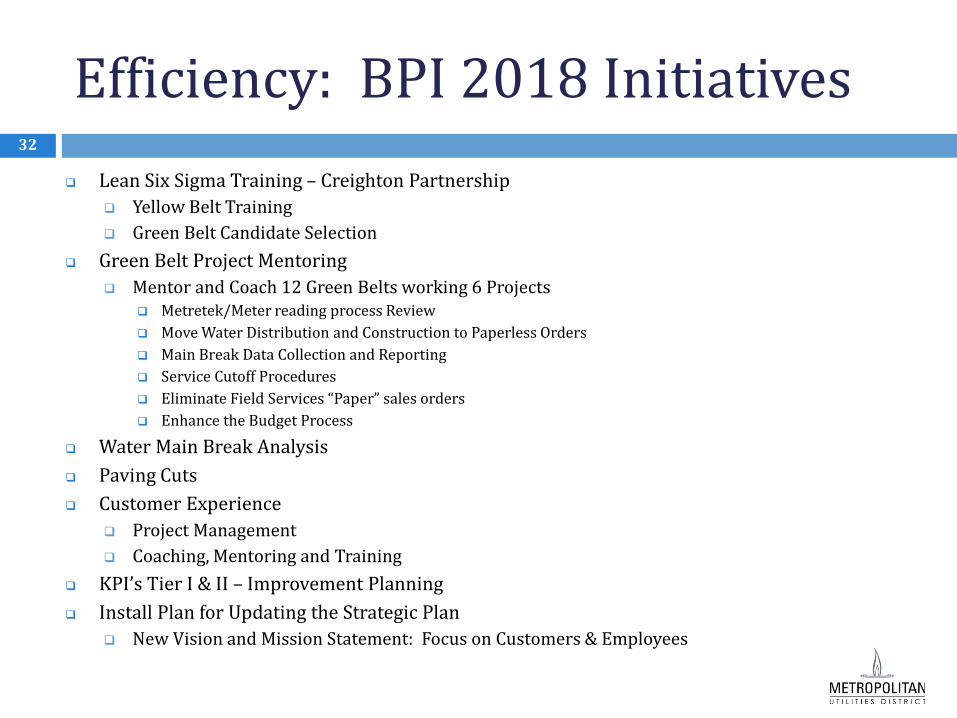
Efficiency: BPI 2018 Initiatives Lean Six Sigma Training – Creighton Partnership
Yellow Belt Training Green Belt Candidate Selection
Green Belt Project Mentoring Mentor and Coach 12 Green Belts working 6 Projects
Metretek/Meter reading process Review Move Water Distribution and Construction to Paperless Orders Main Break Data Collection and Reporting Service Cutoff Procedures Eliminate Field Services “Paper” sales orders Enhance the Budget Process
Water Main Break Analysis Paving Cuts Customer Experience
Project Management Coaching, Mentoring and Training
KPI’s Tier I & II – Improvement Planning Install Plan for Updating the Strategic Plan
New Vision and Mission Statement: Focus on Customers & Employees
32

33
Regulatory Compliance The District shall adhere to all applicable laws, regulations, guidelines, and specifications relevant to its business.
REGULATORY
Drinking Water Compliance Gas Operations Reporting Compliance Liquefied Natural Gas (LNG)
Operator Qualification Human Resource Reporting Compliance Taxes DOT / PHMSA PCI Industry Reporting Compliance Cyber Security Related Compliance (CFATS) Physical Security Related Compliance (CFATS and DOT) Distribution Integrity Management (PHMSA based reporting)
PCI-Payment Card Industry; DOT-Dept of Transportation; PHMSA-Pipeline & Hazardous Materials Safety Administration; CFATS-Chemical Facility Anti-Terrorism Standards

Regulatory Compliance: 2017 Performance
Maintained regulatory compliance for all primary and critical regulations
Above-average performance on the Chemical Facility Anti-Terrorism Standards (CFATS) compliance inspection
34
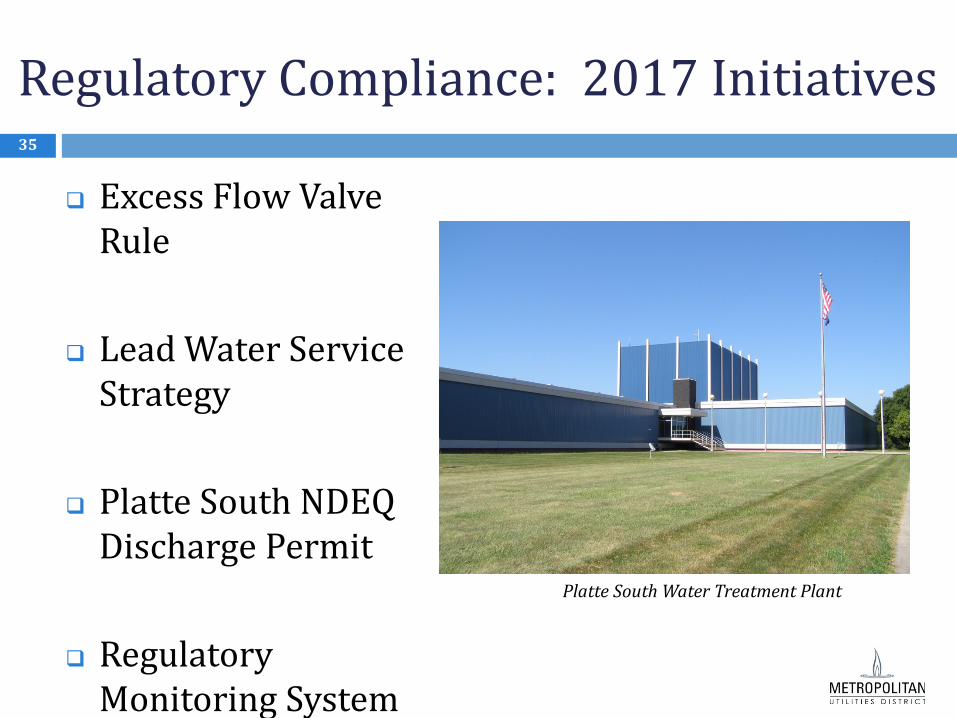
Liquefied Natural Gas (LNG) Plant
Regulatory Compliance: 2017 Initiatives
Excess Flow Valve Rule
Lead Water Service Strategy
Platte South NDEQ Discharge Permit
Regulatory Monitoring System
35
Platte South Water Treatment Plant

Regulatory Compliance: 2018 Initiatives 36
Platte South Nebraska Department of Environmental Quality (NDEQ) Discharge Permit
Chemical Facilities Antiterrorism Standards (CFATS)
Role of the Compliance Manager and the Law Department
Propane Air Plant

Financial Stability: 5 Critical Factors
1) Providing our customers with affordable gas and water service
2) Sustainable reinvestment in our infrastructure
3) Proper funding of our promises to our employees
4) Maintaining debt service coverage
5) Maintaining adequate cash reserves
37
Accounting Staff

38
Financial Stability
Key Performance Indicator
FINANCIAL
2014 2015 2016 2017 BENCHMARK
KPI's Baseline Yr-End Yr-End Yr-End Top Median Bottom Benchmark Source
Affordability - Gas (200 CCF) $144.74 $104.35
$111.89
$116.92 $144.98 $165.70 $209.91
MLGW
Affordability - Water (10 CCF) $27.81 $28.37 $29.23 $29.37 $24.16 $30.78 $42.75 MLGW
Debt Service Coverage - Water 2.56X 2.26x 3.02x 3.17x 1.2X Bond Agreement
Cash Reserves (days cash on hand) - Gas 216 249 215 180 MUD target
Cash Reserves (days cash on hand) - Water 139 235 357 180 MUD target
Sustainable Reinvestment - Gas Infrastructure $14.4M $16.3M $19.7M $19.2M MUD Budget
Sustainable Reinvestment - Water Infrastructure $11.4M $10.8M $12.4M $12.0M MUD Budget
Proper Funding of Promises to Employees - OPEB $5.0M $5.0M $7.0M $7.0M MUD Budget
Proper Funding of Promises to Employees - Pension 86% 87% 88% 100% 80% MUD Budget

$13.
71
$18.
36
$20.
05
$20.
14
$20.
27
$20.
43
$21.
61
$21.
77
$24.
57
$23.
76
$24.
16
$25.
54
$25.
60
$25.
65
$25.
85
$27.
37
$28.
00
$29.
01
$29.
37
$30.
08
$30.
44
$30.
78
$31.
64
$32.
10
$32.
32
$33.
41
$34.
32
$34.
51
$36.
70
$38.
10
$38.
22
$40.
41 $42.
75
$42.
80
$-
$5.00
$10.00
$15.00
$20.00
$25.00
$30.00
$35.00
$40.00
$45.00
Aver
age
Bill
Am
ount
(10
CC
F)
City, StateSource: MLGW (Memphis Light Gas & Water)
39
2017 Residential “Water” Bill Comparison

Source: MLGW (Memphis Light Gas & Water)
40
2017 Residential “Gas” Bill Comparison $8
5.57
$117
.33
$117
.33
$118
.80
$122
.88
$127
.68
$132
.56
$137
.65
$139
.28
$140
.22
$141
.97
$144
.50
$145
.46
$145
.60
$146
.86
$148
.86
$152
.76
$154
.24
$156
.31
$161
.41
$161
.71
$162
.98
$165
.02
$165
.70
$166
.03
$171
.46
$178
.01
$178
.21
$178
.98
$180
.83
$190
.62
$191
.92
$198
.00
$205
.71
$-
$50.00
$100.00
$150.00
$200.00
$250.00
Aver
age
Bill
Amou
nt (1
00 C
CF)
City, State
Financial Stability: Progress in 2017
Gas rates remain below national and Midwest averages 7th lowest out of 34 metro areas listed in the 2017 Memphis Light Gas & Water survey
Water rates trend mid-range nationally and regionally compared with other utilities 20th lowest out of 34 metro areas listed in the 2017 Memphis Light Gas & Water survey
Reinvesting in infrastructure $19.7 million invested in gas cast iron replacement, 40 miles of main abandoned $12.4 million invested in water cast iron replacement, 11 miles of main abandoned $11.2 million invested in Florence capital improvement projects
Funding promises to employees Pension plan 88% funded as of January 1st, 2018 Contributed $7 million to OPEB trust fund in 2017
Bond ratings: Water upgraded from A1 to Aa2 by Moody’s (AA- by S&P). Gas remains strong at Aa2 (AA by S&P).
Debt service coverage of 3.17x (1.2x required by bond agreement)
41
Financial Stability: Progress in 2017 cont.
Cash reserves exceed target of 180 days cash on hand (Gas=215; Water=357)
Completed Central Plains Energy Project (CPEP) #3 Refunding Transaction enabling CPEP to refund 2012 Bonds in 2022 with Lower Interest Rates $77 million increase in gas price discounts from 2022-2038
Entered into 30-year Prepay with Tennessee Energy Acquisition Corp.
$0.27/Dth discount for first 5 years resulting in $1.4 million savings
42

Prepay Estimated Discounts 43
– Discounts based on extending existing agreements as well as pending agreements over next 2 years
– Estimated $73M in savings over 10-yr Period – CPEP #1 volumes stop flowing on 10/31/20 reducing 2021 discounts. CPEP #3
discount increases from $0.35/Dth to $1.35/Dth in August, 2022.
$-
$0.050
$0.100
$0.150
$0.200
$0.250
$0.300
$0.350
$0.400
$-
$2,000,000
$4,000,000
$6,000,000
$8,000,000
$10,000,000
$12,000,000
2018 2019 2020 2021 2022 2023 2024 2025 2026 2027
PrePay Discounts
Est. Annual $ Est. $/Dth Total Sales
CPEP #1 vol. stops flowing
Pre-pay discounts increase from $5M to $10M in next 5 years
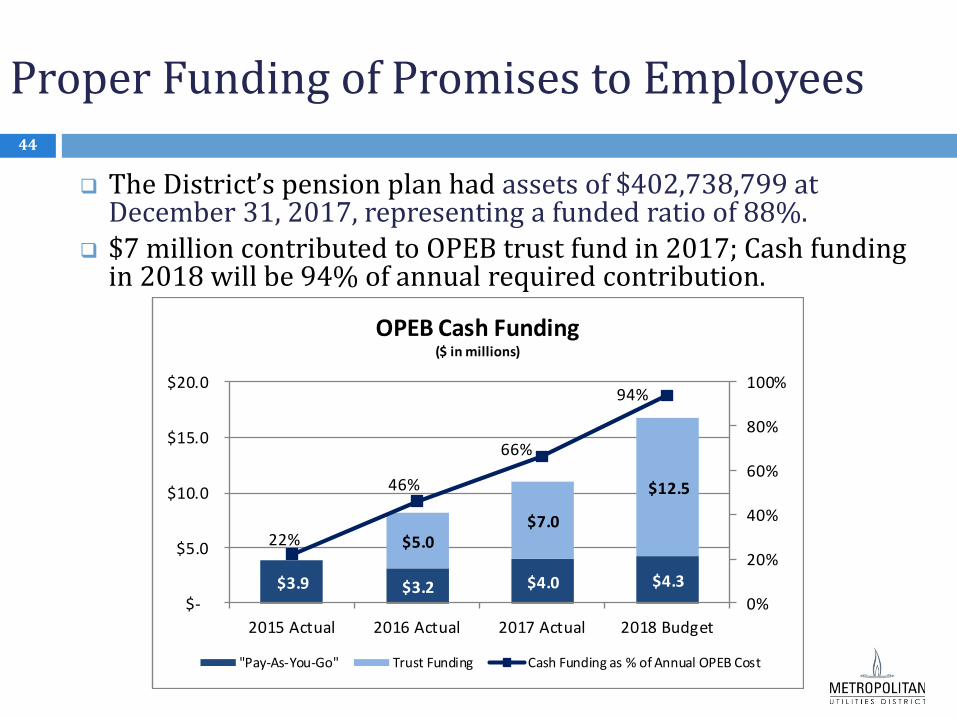
Proper Funding of Promises to Employees 44
The District’s pension plan had assets of $402,738,799 at December 31, 2017, representing a funded ratio of 88%.
$7 million contributed to OPEB trust fund in 2017; Cash funding in 2018 will be 94% of annual required contribution.
$3.9 $3.2 $4.0 $4.3
$5.0 $7.0
$12.5
22%
46%
66%
94%
0%
20%
40%
60%
80%
100%
$-
$5.0
$10.0
$15.0
$20.0
2015 Actual 2016 Actual 2017 Actual 2018 Budget
OPEB Cash Funding($ in millions)
"Pay-As-You-Go" Trust Funding Cash Funding as % of Annual OPEB Cost

Maintaining Adequate Cash Reserves 45
Cash reserves remain strong in both Gas and Water. Internal goal is to maintain an amount equal to six
months of operating expenses (180 days).

Financial Stability: 5-Year Rate Increase Trends 46
5.5%
5.0%
3.5%
2.5% 2.5%2.5%
0.0% 0.0%
1.0%
0.0%0.0%
1.0%
2.0%
3.0%
4.0%
5.0%
6.0%
2014 2015 2016 2017 2018
Rate Increases
Water Gas
**Water rate increases were to both service charge and commodity except 2018 where the increase was only to commodity**

Financial Stability: Priorities for 2018 Achieve bottom line budget targets in 2018 for Water and Gas,
while maintaining an appropriate balance in other aspects of the District’s operations, and adjusting spend rate to compensate for weather and other unknown factors.
Operate at 825 full-time employee level
Replace 40 miles of cast iron gas mains Replace 11 miles of water cast iron mains Increase OPEB trust funding to $12.5 million in 2018 Continue capital spend management
$32.6 million bond issuance planned in 2018 to fund portion of GIR spending through 2020 $38.7 million bond issuance planned in 2018 to fund Florence CIP through 2021 Major system improvements of $9.8 million planned in 2018 (West Farm development)
Continue marketing and expand economic development efforts
Long-term Water Supply Planning with City of Lincoln
47

Gas Sales (DTH)
Water Pumpage (MG)
Annual Sales Trends 48
48,000,000
53,000,000
58,000,000
63,000,000
68,000,000
73,000,000
78,000,000
10,000,000
15,000,000
20,000,000
25,000,000
30,000,000
35,000,000
40,000,000
Total Gas Sales (DTH) Water Pumpage (MG)
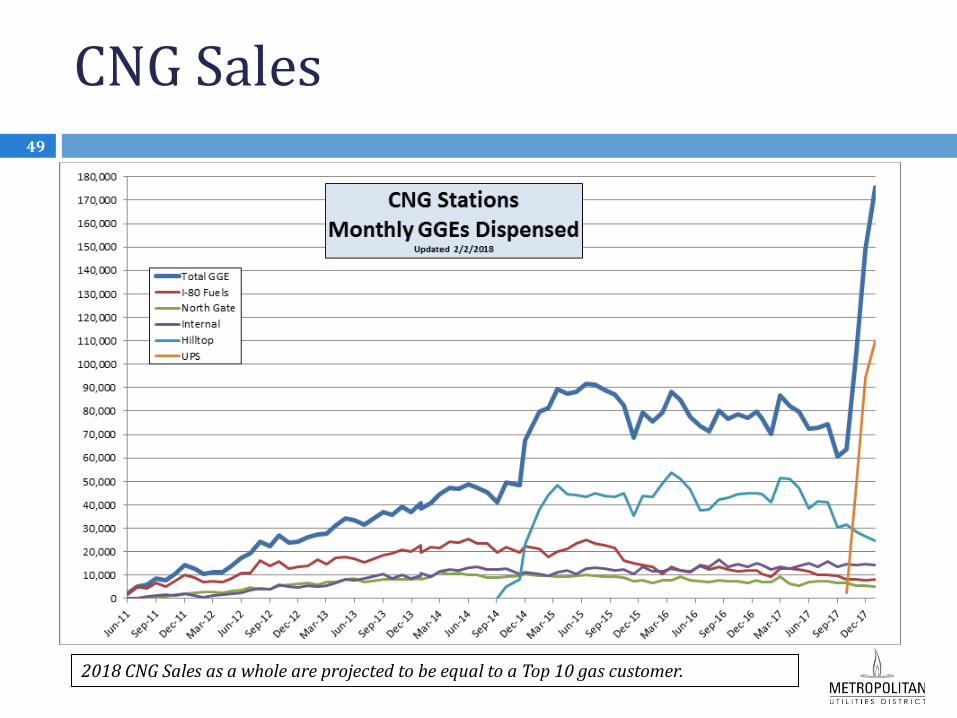
CNG Sales 49
2018 CNG Sales as a whole are projected to be equal to a Top 10 gas customer.
Austin, TX
Des Moines, IA
Kansas City, MO-KS
Nashville, TN
Omaha
Raleigh, NC
0
50
100
150
200
250
300
350
400
2001 2005 2010 2015 2020 2025 2030 2035 2040
Real GDP (in billions of chained 2009 dollars)
Austin, TX Des Moines, IA Recession
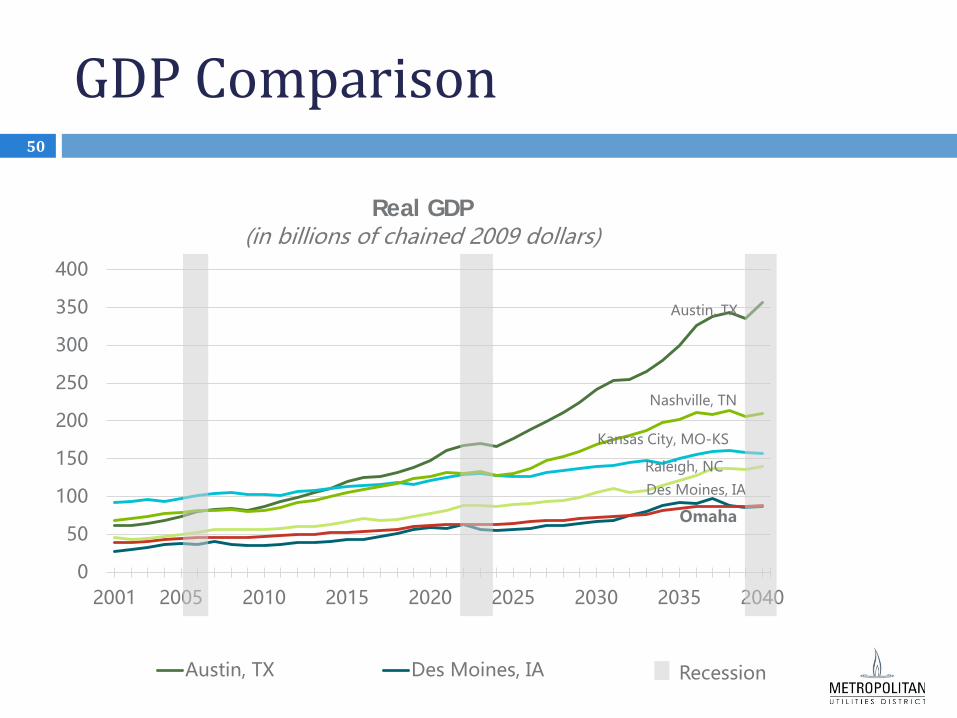
GDP Comparison 50
Austin, TX
Des Moines, IA
Kansas City, MO-KS
Nashville, TN
Omaha Raleigh, NC
0.0
0.5
1.0
1.5
2.0
2.5
3.0
3.5
4.0
4.5
2010 2015 2020 2025 2030 2035 2040
Population (in millions)
* * * *
Source: U.S. Census Bureau, Population Division * Projection
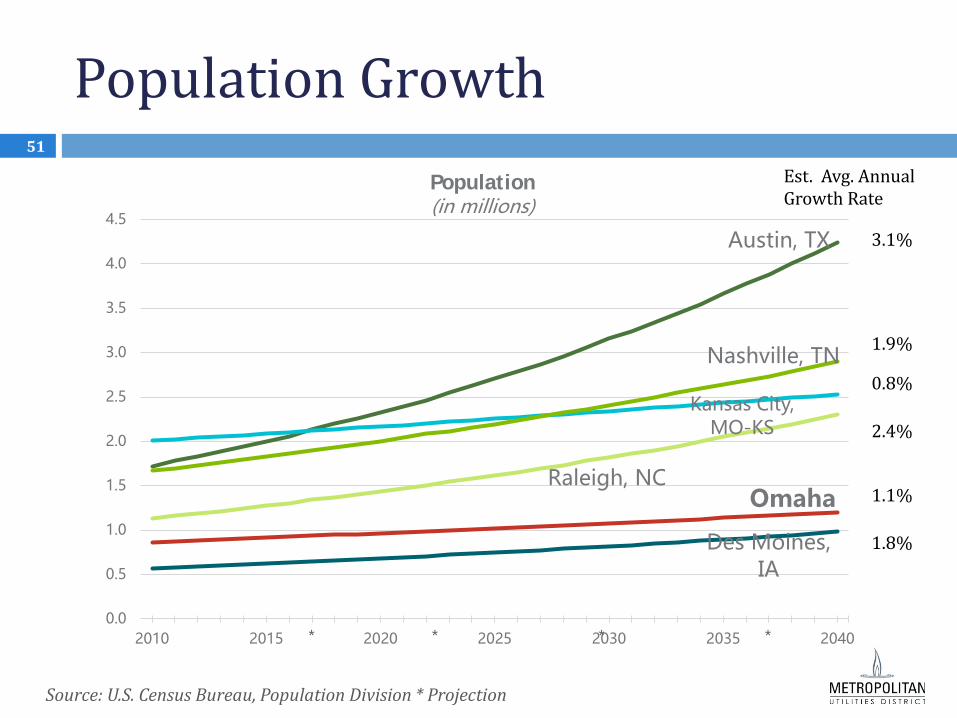
Population Growth 51
3.1%
1.9%
0.8%
2.4%
1.1%
1.8%
Est. Avg. Annual Growth Rate
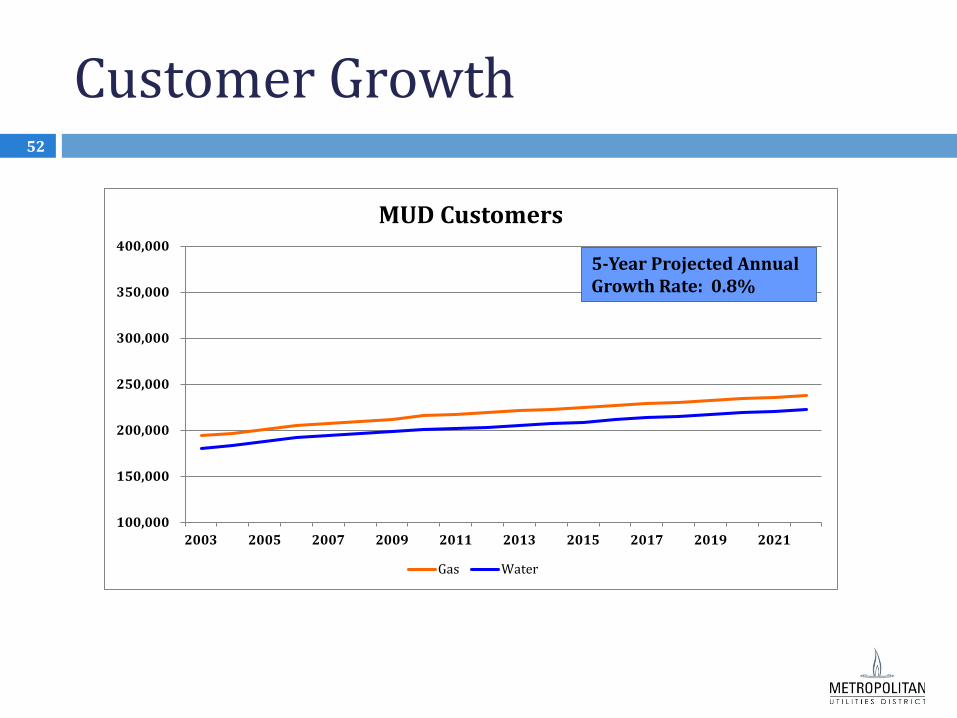
Customer Growth 52
100,000
150,000
200,000
250,000
300,000
350,000
400,000
2003 2005 2007 2009 2011 2013 2015 2017 2019 2021
MUD Customers
Gas Water
5-Year Projected Annual Growth Rate: 0.8%

Questions or Comments? 53