minnesota: 2030 - mnchamber.com
TRANSCRIPT

Minnesota:MinnesotaChamberFoundation2030
Minnesota: 2030A framework for economic growth
R E P O R T S U M M A R Y

Minnesota: 2030 investors
Minnesota:MinnesotaChamberFoundation2030
SusanMARVIN

Minnesota:MinnesotaChamberFoundation2030
MINNESOTA: 2030 — ECONOMIC OVERVIEW 1
Read the full report at mnchamber.com/minnesota2030
A message from the Board ............................2
In brief ..........................................................................3
Minnesota’s highly-developed economy ...................................................................4
Minnesota’s economy: slowing growth ......................................................7
Differences across regional economies and demographic groups .............................10
2020 impacts ........................................................12
Minnesota: 10-year economic forecast ............................................ 14
Minnesota: Nationally and globally ..........16
Minnesota: 2030 framework for growth ...............................................................18
Strategy 1: Build on strengths ...................19 Strategy 2: Leverage Minnesotans .......24 Strategy 3: Strengthen communities ...26
Minnesota: 2030 what’s next? ...................28
Table of contents —
2 MINNESOTA: 2030 — ECONOMIC OVERVIEW
A FRAMEWORK FOR ECONOMIC GROWTH
2 MINNESOTA: 2030 — ECONOMIC OVERVIEW
A FRAMEWORK FOR ECONOMIC GROWTH
innesota: 2030 outlines our position in the national and global economy with recommendations to help shape and foster stronger economic performance for Minnesota in the coming decade.
A private-sector project of the Minnesota Chamber Foundation, Minnesota: 2030 details economic strengths on which to build and potential hurdles we must work to overcome. We overview the macroeconomic factors shaping Minnesota’s economy and leverage projections to assess our economic future. The report analyzes how the state’s regions act and interact, assessing industry sectors, labor and demographic trends, even freight movements. Minnesota: 2030 advances three broad strategies for positively positioning Minnesota’s economy for better growth – with actionable recommendations and growth acceleration opportunities that would further strengthen Minnesota’s economy. The Minnesota Chamber Foundation is pleased to have the support of our sponsors, the guidance of our Board of Directors and the counsel of our Economic Advisors in this effort. Throughout the analysis, we’re also pleased to leverage the projections and insight of leading global economics firm IHS Markit, the macroeconomic consultant for the State of Minnesota and a regular contributor to the state’s biennial Budget and Economic Forecast report. We acknowledge and credit the input and qualitative insights of the hundreds of business and community leaders who participated in dozens of focus groups and individual interviews across the state helping craft this report and summary. We welcome the input of stakeholders statewide – inviting all Minnesotans to join us in making our economic future the best it can possibly be to 2030 and beyond.
A message from the BoardM
Jon Campbell Board Chair
Founder, Cedar Glenn Advisory Services LLC
Susan MarvinPast Board Chair
Chair of the Board,Marvin

MINNESOTA: 2030 — ECONOMIC OVERVIEW 3
Minnesota:MinnesotaChamberFoundation2030
MINNESOTA: 2030 — ECONOMIC OVERVIEW 3
Minnesota:MinnesotaChamberFoundation2030
Minnesota:MinnesotaChamberFoundation2030
innesota’s economy is highly developed. The state ranks high
across a range of metrics, with leading industry clusters, 16 Fortune 500 headquarters, high rates of innovation and one of the highest workforce participation rates in the nation.
Minnesota’s overall economic performance tells a different story, however. When comparing growth, Minnesota’s economy has been trailing its peers and the U.S. economy the past two decades. GDP and job growth ranked 36th and 45th nationally in 2019. Minnesota also continued to have uneven outcomes across demographic groups and regionally, with populations of color and non-metropolitan areas experiencing lower levels of economic well-being.
Then the COVID-19 pandemic upended economies locally and around the globe. The impact on Minnesota’s economy was significant, leading to unprecedented losses in employment and output. The pandemic not only changed Minnesota’s immediate economic outlook, but raised more fundamental questions related to remote work, supply chains, migration patterns and the future of urban centers.
Minnesota’s resiliency and diverse industry base allowed the state to mitigate some of the worst impacts of the pandemic-induced recession. By February 2021, the state’s unemployment rate ebbed to 4.3 percent and total employment reached 93 percent of pre-pandemic levels.
What lies beyond the immediate horizon? How is Minnesota poised to change – and how can businesses maximize the opportunities to advance and grow the state’s economy?
• Much remains unknown. The pandemic is not yet over, and the state may be in recovery mode through 2021 or beyond. Compelling trends can be projected with a fair amount of confidence nonetheless.
• Minnesota’s population and labor force growth will likely continue to slow.
• New technologies will reshape industries from manufacturing to health care to agriculture, shifting demand for skill sets in the workforce.
• Global demand for health care and food will continue to rise.
• Minnesota’s population will be more racially and ethnically diverse.
• Global megatrends like climate change and resource constraints will influence economic conditions.
What can Minnesota do to help its economy navigate these changes and
develop to its full potential? Minnesota: 2030 outlines three fundamental strategies: build on strengths, leverage Minnesotans and strengthen communities. Within each strategy, this report explores a range of topics, outlining the basic opportunities and challenges that lie ahead. The full Minnesota: 2030 report advances over 50 recommendations to help guide future growth efforts.
Minnesota: 2030 is the first step. Subsequent research will dive deeper into key areas. Additional ideas and more detailed prescriptions may be needed. The Minnesota Chamber Foundation will take on next steps where possible, working with partners to identify opportunities across the state to develop and grow Minnesota’s economy for years to come. Private and public sector leaders should join these Minnesota: 2030 advancement efforts.
In brief
A framework for growthThree strategies – with actionable recommendations and growth acceleration opportunities that would strengthen Minnesota’s economy.
Build on strengths: Further develop Minnesota’s diverse economic strengths while accelerating key growth areas, such as technology and health care.
Leverage Minnesotans: Beat labor force projections and equip Minnesotans with the skills needed to succeed in a changing economy.
Strengthen communities: Help communities thrive by strengthening core assets — housing, child care, connectivity — and embracing all Minnesotans, making inclusion a strength.
Minnesota: 2030M
4 MINNESOTA: 2030 — ECONOMIC OVERVIEW
A FRAMEWORK FOR ECONOMIC GROWTH
4 MINNESOTA: 2030 — ECONOMIC OVERVIEW
A FRAMEWORK FOR ECONOMIC GROWTH
innesota’s economy is highly developed, with a diverse base of industries, a hard working
educated workforce, industry-leading companies, high innovation rates and above-average incomes.
Data confirms that Minnesota is working from a strong base of core advantages that can be leveraged to advance the state’s economy for the next decade. Yet overemphasizing those strengths runs the risk of masking weaknesses and perpetuating the homespun narrative that Minnesota is above average at everything. That is not quite the case. Let’s break it down.
High per-capita income, GDP per capita and labor productivity
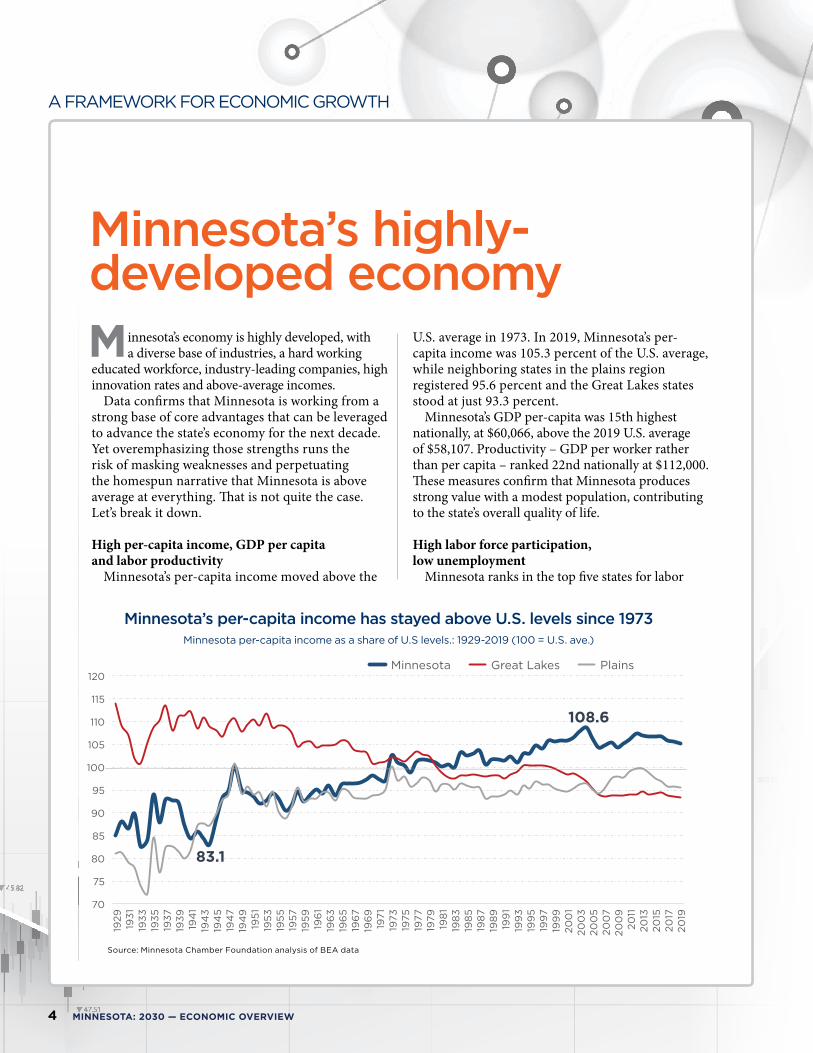
Minnesota’s per-capita income moved above the
U.S. average in 1973. In 2019, Minnesota’s per-capita income was 105.3 percent of the U.S. average, while neighboring states in the plains region registered 95.6 percent and the Great Lakes states stood at just 93.3 percent.
Minnesota’s GDP per-capita was 15th highest nationally, at $60,066, above the 2019 U.S. average of $58,107. Productivity – GDP per worker rather than per capita – ranked 22nd nationally at $112,000. These measures confirm that Minnesota produces strong value with a modest population, contributing to the state’s overall quality of life. High labor force participation, low unemployment
Minnesota ranks in the top five states for labor
Minnesota’s highly- developed economyM
83.1
108.6
70
75
80
85
90
95
100
105
110
115
120
1929
1931
1933
1935
1937
1939
194
119
43
194
519
47
194
919
5119
5319
5519
5719
5919
61
196
319
65
196
719
69
1971
1973
1975
1977
1979
198
119
83
198
519
87
198
919
91
199
319
95
199
719
99
200
120
03
200
520
07
200
920
1120
1320
1520
1720
19Minnesota Great Lakes Plains
Source: Minnesota Chamber Foundation analysis of BEA data
Minnesota’s per-capita income has stayed above U.S. levels since 1973Minnesota per-capita income as a share of U.S levels.: 1929-2019 (100 = U.S. ave.)
Source: Minnesota Chamber Foundation analysis of BEA data
MINNESOTA: 2030 — ECONOMIC OVERVIEW 5
Minnesota:MinnesotaChamberFoundation2030
MINNESOTA: 2030 — ECONOMIC OVERVIEW 5
Minnesota:MinnesotaChamberFoundation2030
force participation, contributing to higher income levels and measures of well-being. In 2019, Minnesota’s rate was 70.1 percent, 2nd in the nation. Thirty-four percent of Minnesota households are two-income households, compared to the national average of 28 percent. Minnesota has lower unemployment rates as a result. Pre-pandemic, unemployment was just 3.1 percent in Minnesota, below the U.S. rate of 3.5 percent. Even in the steep downturn throughout
spring and summer 2020, unemployment rose less than U.S. unemployment, and by February 2021, Minnesota again stood at 4.3 percent, well below the U.S. rate of 6.2 percent. Our labor force participation did drop, however, to 67.5 percent at year-end, our lowest level since 1978.
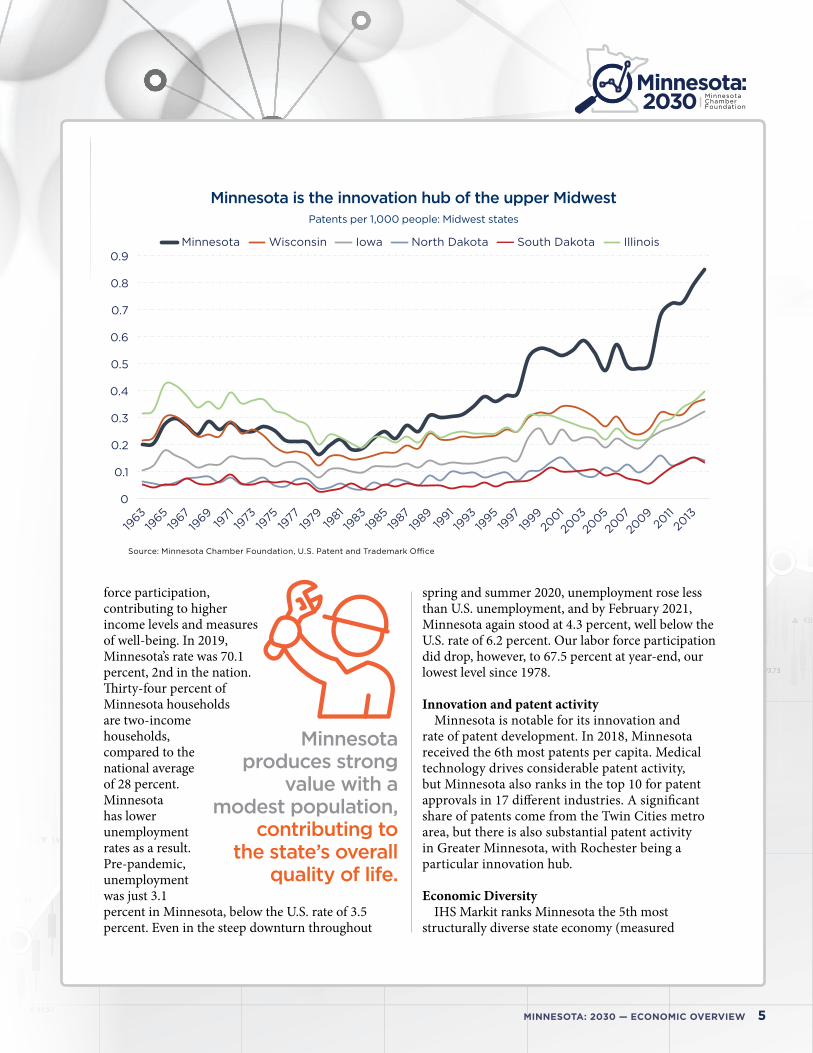
Innovation and patent activityMinnesota is notable for its innovation and
rate of patent development. In 2018, Minnesota received the 6th most patents per capita. Medical technology drives considerable patent activity, but Minnesota also ranks in the top 10 for patent approvals in 17 different industries. A significant share of patents come from the Twin Cities metro area, but there is also substantial patent activity in Greater Minnesota, with Rochester being a particular innovation hub.
Economic DiversityIHS Markit ranks Minnesota the 5th most
structurally diverse state economy (measured
Minnesota produces strong
value with a modest population,
contributing to the state’s overall
quality of life.
0
0.1
0.2
0.3
0.4
0.5
0.6
0.7
0.8
0.9Minnesota Wisconsin Iowa North Dakota South Dakota Illinois
Source: Minnesota Chamber Foundation, U.S. Patent and Trademark O�ce
Minnesota is the innovation hub of the upper MidwestPatents per 1,000 people: Midwest states
Source: Minnesota Chamber Foundation, U.S. Patent and Trademark Office

6 MINNESOTA: 2030 — ECONOMIC OVERVIEW
A FRAMEWORK FOR ECONOMIC GROWTH
6 MINNESOTA: 2030 — ECONOMIC OVERVIEW
A FRAMEWORK FOR ECONOMIC GROWTH
by 2018 share of employment across industries). Economists posit that a diverse economy may help moderate swings in business cycles and buffer against industry downturns, and that’s arguably been true for Minnesota. Yet structural diversity by itself does not guarantee strong economic performance. Minnesota should aim to maintain its diverse economy, while strengthening industries where the state has competitive advantages. Fortune 500 headquarters and industry-leading firms
Minnesota has an advantageous hub of large national and global corporate headquarters and industry-leading firms. The state has the highest concentration of management of companies (i.e.
headquarters) jobs in the nation and is home to 16 Fortune 500 and 24 Fortune 1000 companies, as well as leading privately-held entities such as Cargill and Mayo Clinic. Minnesota’s high per-capita income and innovation rates are linked to a degree to this historical anomaly of large companies in diverse industries, from health care, food and agriculture to retail, financial services and manufacturing.
Industry clusters in key sectorsThe combination of economic diversity and
leadership in advanced sectors is a strength. Minnesota has concentrations of employment in health care and medical technology, food
and agriculture, electronic control manufacturing, financial services, wood products and a variety of manufacturing industries.
The state’s leadership in global medical innovation is notable, but Minnesota also possesses leading institutions and high concentrations of employment in a range of medical subsectors, from health care services and medical device
manufacturing to insurance and health care data analytics, with growth in emerging digital health and biotechnology sectors as well.
Minnesota’s clusters have regional characteristics, with some spread broadly across the state and others concentrated only in certain regions. Food, health care and manufacturing span the state, while individual regions also possess characteristics and specialties that make their economic landscape distinct. Education levels and concentrations of high-skilled workers
Minnesota has an educated and skilled workforce. The state ranks 4th in the share of adults 25 and over with a 2-year degree or higher and ranks 5th in adults with a bachelor’s degree or higher. Minnesota has concentrations of talent in key areas of future need, such as IT, STEM, business services and high tech. Talent advantages are a key driver of Minnesota’s overall economic competitiveness.
High value Per-capita income, GDP per capita and labor productivity levels. Per-capita income is 105% of U.S. levels.
Hard working 2nd highest labor force participation and structurally lower unemployment rates than U.S. as a whole.
Educated and skilled workforce 4th highest share of adults with a 2-year degree or higher.
Innovation 6th most patents per capita in the U.S.
Corporate hub 16 Fortune 500 headquarters and the highest concentration of management of companies jobs in the U.S.
Diverse economy Jobs spread across major industry sectors. 5th most diverse economy in the U.S.
Industry clusters in key sectors Health care and med-tech, food and ag, headquarters, finance and insurance, high tech.
Characteristics of Minnesota’s highly-developed economy
1
2
3
45
6
7
Talent advantages are a key driver of Minnesota’s overall economic competitiveness.
MINNESOTA: 2030 — ECONOMIC OVERVIEW 7
Minnesota:MinnesotaChamberFoundation2030
MINNESOTA: 2030 — ECONOMIC OVERVIEW 7
Minnesota:MinnesotaChamberFoundation2030
2.92.6
2.4
1.7 1.7 1.71.5 1.5
1
Southwest Far West Rocky Mountain
Plains Southeast Minnesota New England
Mideast Great Lakes
Source: Minnesota Chamber Foundation analysis of BEA data
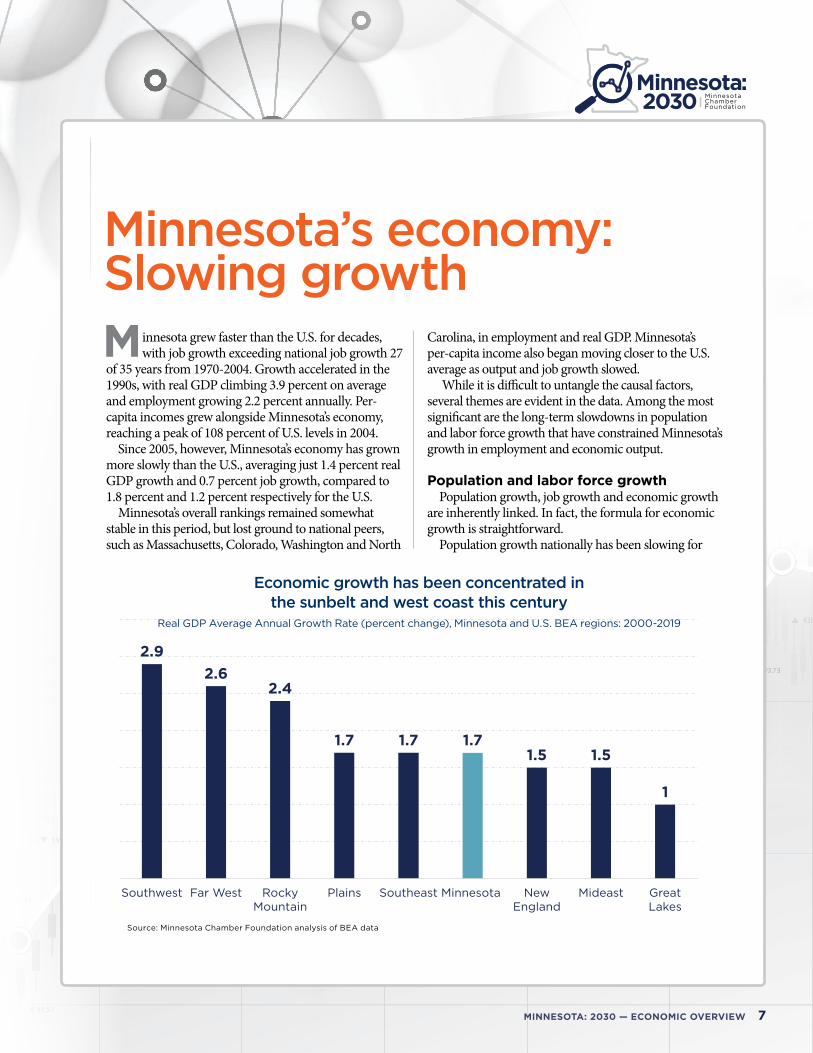
Economic growth has been concentrated in the sunbelt and west coast this century
Real GDP Average Annual Growth Rate (percent change), Minnesota and U.S. BEA regions: 2000-2019
Source: Minnesota Chamber Foundation analysis of BEA data
innesota grew faster than the U.S. for decades, with job growth exceeding national job growth 27
of 35 years from 1970-2004. Growth accelerated in the 1990s, with real GDP climbing 3.9 percent on average and employment growing 2.2 percent annually. Per-capita incomes grew alongside Minnesota’s economy, reaching a peak of 108 percent of U.S. levels in 2004.
Since 2005, however, Minnesota’s economy has grown more slowly than the U.S., averaging just 1.4 percent real GDP growth and 0.7 percent job growth, compared to 1.8 percent and 1.2 percent respectively for the U.S.
Minnesota’s overall rankings remained somewhat stable in this period, but lost ground to national peers, such as Massachusetts, Colorado, Washington and North
Carolina, in employment and real GDP. Minnesota’s per-capita income also began moving closer to the U.S. average as output and job growth slowed.
While it is difficult to untangle the causal factors, several themes are evident in the data. Among the most significant are the long-term slowdowns in population and labor force growth that have constrained Minnesota’s growth in employment and economic output.
Population and labor force growthPopulation growth, job growth and economic growth
are inherently linked. In fact, the formula for economic growth is straightforward.
Population growth nationally has been slowing for
Minnesota’s economy: Slowing growthM

8 MINNESOTA: 2030 — ECONOMIC OVERVIEW
A FRAMEWORK FOR ECONOMIC GROWTH
8 MINNESOTA: 2030 — ECONOMIC OVERVIEW
A FRAMEWORK FOR ECONOMIC GROWTH
decades, growing at the slowest rate since the 1930s. Minnesota, by contrast, was growing at a fast pace in the late 1980s and 1990s, but fell off sharply after 2000.
Population growth has three parts: natural growth, domestic migration and international migration. Natural growth— births subtracting deaths – continued Minnesota’s long-standing trend of decline in 2019, adding just 24,442 new Minnesotans net, according to U.S. Census Bureau estimates. Domestic migration – the number of residents attracted from other states minus the number of
Minnesotans moving elsewhere – tallied 15 years of consecutive net losses from 2002 to 2016, before registering net gains of 7,941 in 2017 and 6,769 in 2018. Domestic migration slumped to a net gain of just 65 new residents in 2019. International migration – the number of immigrants and new Americans arriving from other countries – slowed again in 2019 from post-recession highs, likely due to increased competition for workers and changes in federal immigration policies. Nearly 60 percent of new Minnesota residents, 10,718 people, were immigrants in 2018 – a growth factor for the
economy. That number slowed to just 9,113 new Minnesotans in 2019, according to Census Bureau estimates.
Minnesota’s labor force has long been a strength – and Minnesota’s labor force participation rate perennially ranks in the top five states.
The state’s labor force growth strongly outpaced the U.S. in the 1990s, reflecting population growth and strong participation across multiple age groups.
With population trends slowing in Minnesota around 2000, labor force and economic growth substantially followed suit. Labor force growth, like population growth, is currently projected to slow even further. This is an issue.
Increasing the number of people available and willing to be employed producing goods and services will be important to the vibrancy of our future economy.
Slowing labor force and population growth. Aging demographics and U.S. regional migration trends contributed to slowing population and labor force growth.
U.S. regional trends. Economic growth has been concentrated in a handful of sunbelt regions and coastal tech hubs this century.
Trailing in tech growth. Minnesota lost ground in high tech sectors as growth shifted to software and IT
Slow productivity growth. Minnesota has followed national trends of falling productivity growth rates.
4 Factors Driving Minnesota’s Slow Economic Growth
1
2
3
4
Since 2000, job growth in Minnesota has trailed the U.S. in 14 of the past 20 yearsAnnual job growth (percent change from the previous year): Minnesota win-loss record vs. United States
Minnesota’s W-L-T Record: 2000 to 20195 – 14 – 1
2000 2001 2002 2003 2004 2005 2006 2007 2008 2009 2010 2011 2012 2013 2014 2015 2016 2017 2018 2019
w w w w wL L L L L L L L L L L L L L
T
WINLOSS
TIE
Source: Minnesota Chamber Foundation analysis of BEA data
Source: Minnesota Chamber Foundation analysis of BEA data

MINNESOTA: 2030 — ECONOMIC OVERVIEW 9
Minnesota:MinnesotaChamberFoundation2030
MINNESOTA: 2030 — ECONOMIC OVERVIEW 9
Minnesota:MinnesotaChamberFoundation2030
Minnesota would have lost more people than it attracted if not for immigration this century
Minnesota net migration by type: 1991-2018
-15,000
-10,000
-5,000
0
5,000
10,000
15,000
20,000
25,000
30,000
1991
1992
1993
1994
1995
1996
1997
1998
1999
2000
2001
2002
2003
2004
2005
2006
2007
2008
2009
2010
2011
2012
2013
2014
2015
2016
2017
2018
Domestic netInternational net Total net migration
Source: Minnesota Demographic Center
Exhibit 8. Minnesota would have lost more people than it attracted if not for immigration this centuryTotal population growth by state (CAGR): 2020-2030
Source: Minnesota Demographic Center
0.0%
0.2%
0.4%
0.6%
0.8%
1.0%
1.2%
1.4%
1.6%
1.8%
198
219
83
198
419
85
198
619
87
198
819
89
199
019
91
199
219
93
199
419
95
199
619
97
199
819
99
200
020
01
200
220
03
200
420
05
200
620
07
200
820
09
2010
2011
2012
2013
2014
2015
2016
2017
2018
2019
Source: IHS Markit
Growth in core working age population is slowingAnnual percent change in core working age population (15-64 years old): Minnesota, 1982-2019
Source: IHS Markit
10 MINNESOTA: 2030 — ECONOMIC OVERVIEW
A FRAMEWORK FOR ECONOMIC GROWTH
10 MINNESOTA: 2030 — ECONOMIC OVERVIEW
A FRAMEWORK FOR ECONOMIC GROWTH
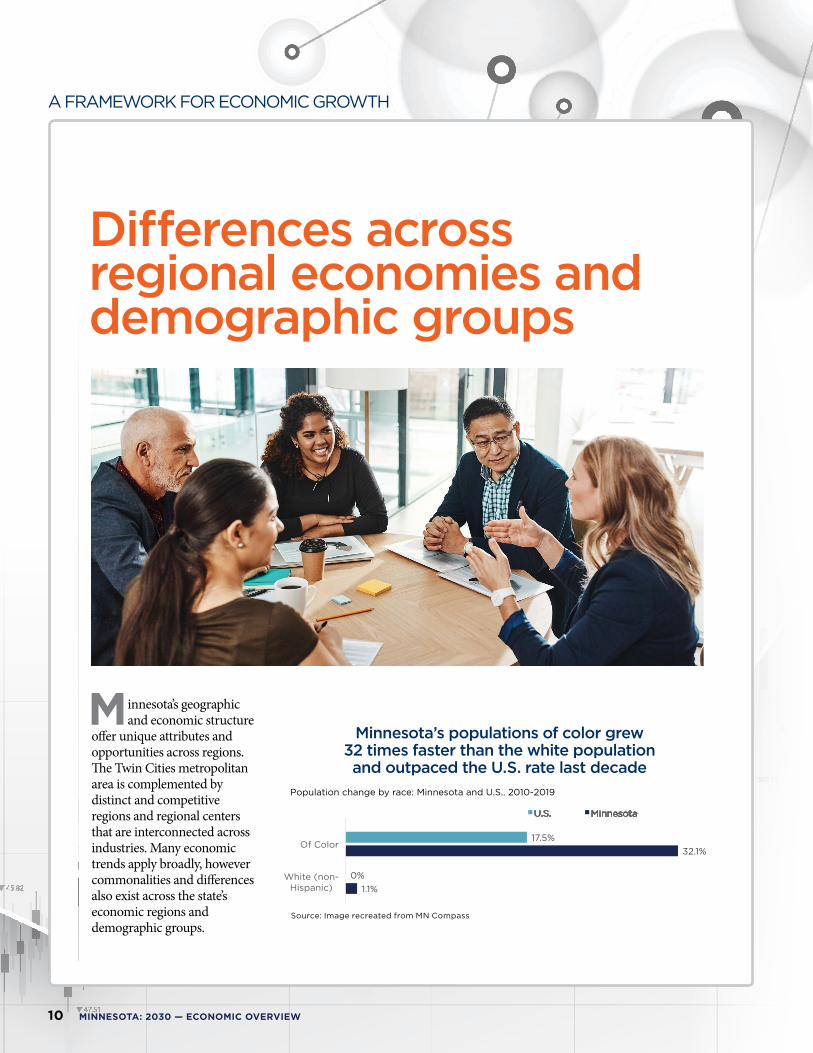
innesota’s geographic and economic structure
offer unique attributes and opportunities across regions. The Twin Cities metropolitan area is complemented by distinct and competitive regions and regional centers that are interconnected across industries. Many economic trends apply broadly, however commonalities and differences also exist across the state’s economic regions and demographic groups.
Differences across regional economies and demographic groups
MPopulation change by race: Minnesota and U.S.. 2010-2019
Source: Image recreated from MN Compass
1.1%
32.1%
0%
17.5%
White (non-Hispanic)
Of Color
U.S. Minnesota
Minnesota’s populations of color grew 32 times faster than the white population and outpaced the U.S. rate last decade
Source: Image recreated from MN Compass

MINNESOTA: 2030 — ECONOMIC OVERVIEW 11
Minnesota:MinnesotaChamberFoundation2030
MINNESOTA: 2030 — ECONOMIC OVERVIEW 11
Minnesota:MinnesotaChamberFoundation2030
Slowing population and labor force growth has impacted rural areas most. Minnesota’s population shifted toward urban counties in recent years, leaving more rural parts of the state with flat or declining populations. Seventy-plus percent of Minnesotans now live in urban geographies, with only eight percent in remote geographies. COVID-19 may influence this trend through changing migration patterns and telecommuting, but it was intensifying pre-pandemic.
Diversity and immigration have been an economic boost to regional economies; yet, racial disparities remain a top challenge across the state.
From 2010-2019, Minnesota populations of color grew 32.1 percent, while Minnesota’s white population grew just 1.1 percent. Much of this growth occurred in the Twin Cities, although a number of Greater Minnesota counties also grew their diverse populations, boosting local economies. Counties where diverse populations concentrate are typically the counties experiencing population gains in Greater Minnesota.
However, despite the economic contributions of diverse Minnesotans and new immigrants, the state
continues to see racial and ethnic disparities across a range of social and economic indicators. This remains a top challenge for communities around the state.
Manufacturing, health care, and food and agriculture tie the state’s regions together, while additional industry clusters present distinct opportunities and challenges.
Manufacturing, health care, and food and agriculture are significant economic sectors in nearly every region of the state. These sectors tie together the state’s diverse regions through trade and a shared exposure to the opportunities and threats brought about by changes in these sectors.
Each economic region of the state also possesses industry specializations not always reflected in the statewide data. The state’s share of jobs in mining, for example, is well below the U.S. average. Northeast Minnesota’s concentration of jobs in metal ore mining, however, boasts a location quotient of 96.7, meaning this industry is over 96 times the U.S. average in Minnesota’s Northeast. These types of regional specializations offer distinct opportunities and challenges – and should continue to be a central part of regional economic strategies.
Health care and social assistance employment by economic region in Minnesota
Source: IHS Markit
Health care and Social Assistance
Employment (2018)
Share of total regional employment
(2018)
Industry rank (private sector) within region
(2018)
LQ (2018) Job Growth CAGR
2007-2018
Twin Cities 264,185 14.20% 1 1.09 +2.80%
Southern 81,802 21.20% 1 1.62 +1.40%
Central 49,285 15.50% 1 1.18 +2.30%
Northland 33,302 21.30% 1 1.62 +1.50%
Southwest 21,510 14.30% 2 1.09 +1.90%
West Central 14,672 13.90% 1 1.06 +1.80%
Northwest 11,542 14.40% 1 1.1 +1.00%

12 MINNESOTA: 2030 — ECONOMIC OVERVIEW
A FRAMEWORK FOR ECONOMIC GROWTH
12 MINNESOTA: 2030 — ECONOMIC OVERVIEW
A FRAMEWORK FOR ECONOMIC GROWTH
he events of 2020 – most notably the COVID-19
pandemic – created shockwaves across the global economy. Minnesota experienced significant economic impacts amidst these circumstances, with employment and output declining at unprecedented rates in March and April before beginning a steep climb toward recovery in subsequent months. Minnesota also found itself at the center of a national reckoning with the killing of George Floyd and ensuing civil unrest.
Taken together, these events not only produced short-term challenges to overcome, but raised longer-term questions that must be thoughtfully addressed by businesses, policymakers and civil society. Some of these issues – such as remote working, talent mobility, commercial real estate activity in urban centers, and large-scale diversity and inclusion efforts – could signal deeper shifts in Minnesota’s economy. As addressed later in this report, Minnesota must carefully assess changing trends and respond effectively if the state is to achieve its full potential this decade. 2020 economic performance and impact
Minnesota reported its first case of the novel coronavirus on March 6th. Within weeks, Minnesota went into a statewide lockdown, and by the end of April – a mere seven weeks after the first reported case – Minnesota had lost over 13 percent of its total
employment and nearly 614,000 Minnesotans had filed claims for unemployment insurance, marking the steepest economic downturn in over 70 years.
Minnesota’s diverse economy and labor force strengths likely helped buffer some of the worst impacts of the downturn. Unemployment peaked at 9.9 percent in May and fell to 4.4 percent by December, remaining well below national unemployment levels throughout the year.
Overall, Minnesota’s changes in employment and
2020 impacts
T

MINNESOTA: 2030 — ECONOMIC OVERVIEW 13
Minnesota:MinnesotaChamberFoundation2030
MINNESOTA: 2030 — ECONOMIC OVERVIEW 13
Minnesota:MinnesotaChamberFoundation2030
GDP reflect national trends. The state’s total employment declined slightly less than the U.S. in April, falling to 86.8 percent of pre-covid (January 2020) levels. However, after six consecutive months of job recovery, Minnesota’s employment ticked down in November and December, leaving the state at 91.5 percent of full strength and trailing the U.S. recovery. By the end of 2020, Minnesota still needed to add 246,100 jobs to recover to 2019 levels.
Uneven impact, uneven recoveryThe COVID-19 recession impacted Minnesota’s economy broadly. However, losses were concentrated in certain industries and demographic groups. Local services, travel-oriented industries, young people and employees of color all experienced disproportionate impacts. Leisure and hospitality lost over half of its total jobs, with industries like full-service restaurants declining nearly 75 percent. Regions with greater shares of activity in these hard-hit industries were impacted significantly, such as Northeast Minnesota
where unemployment peaked at nearly double the rate of the state’s Southwest region.
By the end of December, some of the impacts across sectors, regions, and demographics began to lessen. Regional unemployment levels, for instance, converged modestly by the end of the year with the gaps closing to less than two percentage points between the highest and lowest unemployment rates. Gaps in unemployment
by race and ethnicity also closed considerably between May and December of 2020.
Other trends point in a more troubling direction. While the unemployment rate shrank for communities of color, some of that change is attributed to disproportionate declines in labor force participation. The number of women leaving the workforce over the last year is a particularly troubling trend. Additionally, though some hard-hit industries like retail, and health care and social assistance saw strong recovery in the second half of 2020, others like arts, entertainment, accommodation, and food service ended the year 40 to 60 percent below 2019 levels.
-61.7
-53.8
-28.1
-20.9
-11.5 -10.3
-59.7
-40.5
-13.5 -15.0
-0.2-4.1
678
698
6:8
6;8
6<8
6=8
6>8
8
Arts, Entertainment and Recreation
Accommodation and Food Service
Other Services Educational services
Retail Trade Health Care and Social Assistance
Apr-20 Dec-20
Source: Minnesota DEED, Bureau of Labor Statistics
Uneven recovery among Minnesota’s hardest-hit industries
Percent change in total employment (annualized) April 2020 and December 2020
3.2
9.9
4.43.6
14.7
6.7
0
2
4
6
8
10
12
14
16
Feb Mar Apr May Jun Jul Aug Sept Oct Nov Dec
Minnesota United States
Source: Minnesota DEED, Bureau of Labor Statistics
Minnesota unemployment rate remains below U.S. levels
Unemployment Rate (seasonally adjusted): Minnesota and U.S., February 2020-December 2020
Source: Minnesota DEED Bureau of Labor Statistics
Source: Minnesota DEED Bureau of Labor Statistics

14 MINNESOTA: 2030 — ECONOMIC OVERVIEW
A FRAMEWORK FOR ECONOMIC GROWTH
14 MINNESOTA: 2030 — ECONOMIC OVERVIEW
A FRAMEWORK FOR ECONOMIC GROWTH
he depth of job losses experienced in March and April of 2020 combined with continued
uncertainty surrounding business restrictions and vaccination efforts means that Minnesota is likely to remain in recovery mode in 2021 and into 2022. Looking to the long term, IHS Markit forecasts that Minnesota’s economy will continue to expand at a modest rate, with GDP averaging 2.2% annual growth through 2030. Below are some key findings from the state’s 10-year economic forecast.
Minnesota is projected to exceed pre-pandemic GDP levels by 2022 and reach full employment by early 2023, though uncertainty remains. IHS Markit’s February 2021 forecast (most recent at publication) projects that Minnesota’s GDP will recover fully in 2022. Unemployment will fall to a low of 3.1 percent in 2022, before rising slightly.
Slow population and labor force growth – and falling labor force participation – will continue
to constrain job growth this decade. Minnesota’s slow population and labor force growth is projected to continue, with Minnesota’s core working population, ages 15 to 64, growing just 0.1% annually through 2030. Labor force participation isn’t expected to return to 2019 levels this decade. This combination of macroeconomic factors is a hugely difficult challenge.
Productivity drives GDP growth, as employment growth slows. With job growth constrained, Minnesota will rely increasingly on productivity to drive economic growth. Innovation and human capital development will only be more important to a growing economy.
Most industries return to peak employment by 2022. Employment continues to shift toward technical, medical and service sectors. Six sectors are projected to reach pre-pandemic employment levels in 2021, with most industries returning to peak
10-year economic forecast
T

MINNESOTA: 2030 — ECONOMIC OVERVIEW 15
Minnesota:MinnesotaChamberFoundation2030
MINNESOTA: 2030 — ECONOMIC OVERVIEW 15
Minnesota:MinnesotaChamberFoundation2030
employment by 2022. Finance/insurance, retail and utilities all neared or exceeded pre-COVID levels by end of 2020, with several others remaining only 1-2 percent below peak.
The ten-year outlook also projects that employment will continue to shift toward professional and business services, health care and social assistance, and other service activities. Manufacturing projects to shed jobs even as sector output grows. Leisure and hospitality isn’t expected to reach full pre-pandemic employment levels through 2030, though this forecast is highly sensitive to changes in the pandemic outlook and should be viewed cautiously. Minnesota should consider what this means for our workforce and begin developing strategies now to capitalize on future opportunities, while mitigating negative impacts.
0.90
0.95
1.00
1.05
1.10
1.15
1.20
1.25
1.30
2019 2020 2021 2022 2023 2024 2025 2026 2027 2028 2029 2030
Employment, Total Non farm Real Gross State Product
Source: IHS Markit
Job growth CAGR 2019-2030= 0.3%
GDP CAGR2019-2030= 2.2%
Minnesota GDP projected to expand at a modestpace, while employment grows slowly
Employment and GDP Index (2019 = 1.00): Minnesota, 2019-2030 (forecasted)
Demand for health care and technical talent will growTop ten occupations with highest projected 10-year growth rate: (Median wage > $57,000)
Source: IHS Markit
Job Title Projected 10-year Growth Rate
Statisticians 32.70%
Actuaries 30.20%
Physician Assistants 28.40%
Information Security Analysts 27.70%
Marriage and Family Therapists 27%
Speech-Language Pathologists 24%
Operations Research Analysts 23.80%
Nurse Practitioners 22.80%
Computer Numerically Controlled Tool Programmers 22.60%
Software Developers and Software Quality Assurance Analysts and Testers 21.80%
Source: Minnesota DEED, Occupations in Demand

16 MINNESOTA: 2030 — ECONOMIC OVERVIEW
A FRAMEWORK FOR ECONOMIC GROWTH
16 MINNESOTA: 2030 — ECONOMIC OVERVIEW
A FRAMEWORK FOR ECONOMIC GROWTH
innesota’s competitiveness nationally and globally helps fuel – or constrain – the state’s
economy. Each year, the Minnesota Chamber of Commerce
analyzes and reports on Minnesota’s economic competitiveness in its Business Benchmarks report (mnchamber.com/benchmarks). In the context of
this report, it is important to note that Minnesota’s competitive position and competitive landscape influences the state’s economic potential.
Education: With 46.8 percent of adults having earned at least an associate degree, Minnesota ranks 4th for educational attainment. Success is not always
National and global competitiveness
M

MINNESOTA: 2030 — ECONOMIC OVERVIEW 17
Minnesota:MinnesotaChamberFoundation2030
MINNESOTA: 2030 — ECONOMIC OVERVIEW 17
Minnesota:MinnesotaChamberFoundation2030
broadly shared, however, and Minnesota lags on key measures. This includes the on-time high school graduation rate, ranking 34th at 83 percent, below the national average. Minnesota’s racial achievement gap is also the nation’s worst.
Economic performance: While Minnesota punches above its weight in absolute measures of economic output, its growth has trailed in recent years. At 1.1 percent, Minnesota’s GDP growth ranked 36th nationally in 2019, fourteen spots worse than 2018. Exports contracted 2.1 percent in 2019, moving the state thirteen spots lower to 26th. Minnesota’s job growth ranked 35th in 2020. Jobs contracted 6.8 percent, largely due to COVID, worse than the nation’s -6.4 percent but ten spots better than the state’s dismal ranking of 45th in 2019.
Taxes and cost of living: Affordability cuts both ways. Minnesota benefits from a relatively affordable cost of living, ranked 23rd across all states and below the U.S. average. However, Minnesota’s tax climate is decidedly less competitive than peer states. Minnesota’s tax index is 4th highest in the nation for small businesses and entrepreneurs. Minnesota’s top pass-through and individual income tax rate is 5th in the nation at 9.85 percent. The corporate income tax is 4th highest at 9.8 percent. Overall, Minnesota’s state and local taxes per capita rank 9th highest – at $6,176 – well above the national average of $5,073.
Innovation and entrepreneurship: Minnesota ranked 49th in entrepreneurship and business startup activity in 2019. The five-year business survival rate is strong, however, at 4th overall, and patents per capita ranks 6th.
Reputation: Competitiveness extends beyond taxes and GDP growth. Minnesota’s reputation is not currently measured – and that is a concern. The killing of George Floyd shone a bright light on longstanding social and economic inequities in Minneapolis and Minnesota – highlighting for the nation and world challenges we have struggled to address for much too long. Subsequent public safety concerns compound the challenge – and Minnesota remains under an unwelcome national spotlight. Minnesota enjoys its problem solving reputation. And while there is
reputational value in Minnesota finding solutions to the issues of social and economic inequity, the stakes are even higher. The promise of Minnesota: 2030 (and beyond) cannot be accomplished without it. Global megatrendsGlobal megatrends are also shaping our economy and influencing Minnesota’s future economic growth. Megatrends are large-scale social, economic, political, environmental or technological shifts driving change in global markets and impacting how people live and work. Because they affect so many and are not easily changed, megatrends are strategic forces shaping the future landscape.
Demographics: There will be 1 billion more people by 2030. The world’s population should reach 8.5 billion people by 2030, up from 7.3 billion in 2015.
Economic power: Shifting from west to east. Emerging economies will exert more influence as economic power rebalances.
Urbanization: Two-thirds of us will live in cities. Two-thirds of the world’s population will live in cities by 2030, producing as much as 80 percent of global GDP.
The individual: More empowered, more information, less privacy. Advances in education, health and technology will empower individuals as never before.
Climate change: The Earth continues to warm. The climate is changing. Globally, 2020 was the warmest year ever (tying 2016) and the decade just completed was the warmest in modern times.
Resource pressures: The world will confront constraints. Resource constraints and competition for resources will be intense in the next decade, especially for food, productive soil and arable farmland.
Clean power / Clean tech: Transformation will accelerate. Renewable energy and clean power grows, and by 2030 some project that there will effectively be no new generating capacity from fossil-based fuels without some form of carbon capture.
Technology: The Internet of Things will have won the day. Information and communications technologies will transform society with a wave of advances creating novel opportunities.
Global megatrends shape economic outcomes
1
2
3
4
5
6
7
8

18 MINNESOTA: 2030 — ECONOMIC OVERVIEW
A FRAMEWORK FOR ECONOMIC GROWTH
18 MINNESOTA: 2030 — ECONOMIC OVERVIEW
A FRAMEWORK FOR ECONOMIC GROWTH
ot all future changes in technologies, markets and individual business decisions can be predicted
with precision or built into standard forecasting models. Events like the COVID-19 pandemic are a case in point.
Some trends can be forecasted with a fair degree of confidence, however, giving everyone a better sense of how the economy is likely to change in coming years enabling thoughtful actions to steward the future benefitting all Minnesotans. For example, here are some safe bets about the next decade:• Minnesota’s population will continue to age
and the labor force will continue to grow only slowly, exacerbating already significant workforce challenges. The availability of talent will only increase as a key driver of economic competitiveness.
• Health care and technology advancements will play increasingly large roles in the economy. New technologies will continue to transform industries
and shift the skillsets demanded in the workforce. Likewise, global demand for health and wellness goods and services will increase in the face of aging populations in developed countries and raising living standards in emerging markets.
• Resilient economies able to adapt to change will be better equipped to absorb the shocks of unexpected events and shifting market forces.
• A growing economy will require strong communities with the underlying assets needed to serve residents and help businesses expand.
• Minnesota’s population will be more diverse, with communities of color making up a larger share of the workforce, consumer base and business community.
Global megatrends, such as water and resource constraints, climate change and rising global food demand, will also influence Minnesota’s economy and
Framework and strategies for growth
N

MINNESOTA: 2030 — ECONOMIC OVERVIEW 19
Minnesota:MinnesotaChamberFoundation2030
MINNESOTA: 2030 — ECONOMIC OVERVIEW 19
Minnesota:MinnesotaChamberFoundation2030
shape opportunities in the coming decade.
The objective of Minnesota: 2030 is to establish a strategic framework that acknowledges and prepares for such changes, helping Minnesota develop and grow to its full potential. This report lays out three fundamental strategies: Build on strengths, leverage Minnesotans and strengthen communities.
Each strategy is outlined in the Minnesota: 2030 report, with specific priorities and recommendations for ensuring an even brighter economic future for Minnesota and Minnesotans.
Build on strengths acknowledges Minnesota’s diverse strengths across a range of industries, including corporate headquarters, food and agriculture, manufacturing, health care and med-tech, to name a few. Continuing to diversify the economy while investing in high-growth areas like health care and technology will allow Minnesota to accelerate economic activity while remaining resilient.
Leverage Minnesotans addresses the foundational imperative to grow the workforce and help individuals develop the skills they need to succeed in a 21st century economy. This will require Minnesota to retain and attract talent, to increase workforce participation by ensuring no one is left on the economic sidelines, and to rethink how public- and private-sector stakeholders work together to respond to evolving skill and training needs.
Strengthen communities lays out two critical priorities. The first is to deliver necessary housing, child care and digital connectivity. These are foundational elements of community vitality and growth, and each area faces supply side challenges that must be addressed. The second priority is to embrace all Minnesotans and make inclusion a strength. Minnesota is strengthened by its diverse populations, but unacceptable disparities pose both a moral and economic imperative. Minnesota has immense advantages – not least its private sector businesses – that can turn diversity into a strength making Minnesota a leader in innovative practices
that help boost the economy by helping all Minnesotans flourish.
These three Minnesota: 2030 strategies rose repeatedly to the surface as this report assessed strengths, analyzed
Minnesota’s economic performance, and conferred with key stakeholders. Within each, recommendations and action plans are proposed.
Minnesota: 2030 is a framework for discussing and embracing what Minnesotans can do together to sustain and grow our economy to its fullest potential this decade.
Strategy one: Build on strengths
Minnesota has a diverse and resilient economy with industry strengths and natural resource advantages.
Measured by distribution of employment across industries, Minnesota has the 5th most diverse state economy, and the economy has only become increasingly diverse over time. The resiliency of the state’s diverse economy aided Minnesota in the recessions of 2007 and 2020 when unemployment rose less severely in Minnesota than in the U.S. Minnesota businesses also exhibit high levels of adaptability and longevity, with the 4th highest five-year business survival rate in the nation in 2019.
Minnesota has high sector concentrations in manufacturing, food and agriculture, management of companies, finance and insurance, and health care. It has strong regional clusters in industries such as metal ore mining, forestry products, tourism, recreation and specialized manufacturing. Some strengths are accidents of history, others leverage state endowments or natural resources not easily replicated. Synergies and compatibilities could also be leveraged for future development.
Take the state’s food and agriculture sector. Like its Midwestern neighbors, Minnesota is a major food producer. In fact, Minnesota was the 5th largest agricultural producer in the U.S. in 2019, trailing only California, Iowa, Nebraska and Texas.
What sets Minnesota apart, however, is that it is
Win growth investments. Secure and retain a greater share of business expansions from existing firms and rising stars.
Minnesota: 2030 strategy

20 MINNESOTA: 2030 — ECONOMIC OVERVIEW
A FRAMEWORK FOR ECONOMIC GROWTH
20 MINNESOTA: 2030 — ECONOMIC OVERVIEW
A FRAMEWORK FOR ECONOMIC GROWTH
also home to leading global food and agricultural headquarters companies driving food innovation and management, as well as specialized manufacturing and service industries producing new technologies and critical inputs for the food and ag sector. This is explored more deeply in the food and agriculture strategy section – and Minnesota clearly has considerable opportunity to continue to leverage these food and ag innovation strengths across the value chain this decade.
Building on Minnesota’s strengths includes:• Protecting and stewarding Minnesota’s
strengths as a priority. Minnesota should carefully steward its valuable economic assets and industries. Proactive retention strategies that address key needs and facilitate expansion and growth should be a priority.
• Helping industries adapt and capture new opportunities. The paradigmatic success story is the taconite industry, born out of University of Minnesota research in the 1940s and 1950s. Minnesota can leverage strengths with research institutions and tech transfer. The University of Minnesota, for instance, helped launch more than 165 new companies since 2006. These
Build on strengths
Food and agricultureMinnesota is the 5th largest ag producer in the US and is a hub for food innovation, management, supply chain and processing. Accelerating digital connectivity, developing new markets and leaning on innovation strengths will be key this decade.
Corporate and financialMinnesota has the highest concentration of headquarters jobs in the U.S., 5th highest share of banking jobs, and a fast growing prof/tech services sector. Talent, business climate improvements and targeted retention efforts are needed to help industry leaders and rising stars thrive.
ManufacturingProductivity and innovation will drive growth this decade. Yet, hiring challenges remain a constraint. Minnesota must modernize its economic development tools and equip workers for a higher tech future.
Hospitality and tourismCOVID-19 brought disproportionate impacts to this important sector. Minnesota must extend relief to hard-hit businesses in the short term, and help regions leverage natural/recreational strengths in a post-pandemic economy.
Regional innovationMinnesota’s regional economies must help core industries change and grow, while seeding the ground for future growth through entrepreneurship and business retention strategies.
MarketsMinnesota can help businesses connect to customers and suppliers in-state, and foster relationships beyond state lines. This builds on supply chain strengths while expanding access to fast growing markets.
Health care and med techNew technologies and aging populations will fuel opportunities in health care. But competition and challenges are rising. Minnesota should double down on its efforts to build on this immense strength. Minnesota must address workforce and regulatory barriers while advancing emerging growth opportunities and bringing global attention to Minnesota’s medical innovation.
TechnologyMinnesota has the 11th highest share of tech jobs with competitive advantages in emerging fields like IoT, FinTech and Digital Health. Further, new technologies will continue to reshape all industries and jobs. But growth is trailing U.S. peers. Increasing tech talent and shining a brighter spotlight on Minnesota’s tech strengths are top priorities to fuel growth.

MINNESOTA: 2030 — ECONOMIC OVERVIEW 21
Minnesota:MinnesotaChamberFoundation2030
MINNESOTA: 2030 — ECONOMIC OVERVIEW 21
Minnesota:MinnesotaChamberFoundation2030
strengths can be built upon to develop, accelerate and grow new industries and opportunities.
Growth Accelerator: Build on Minnesota’s health care and medical cluster
Minnesota is a global leader in health care. The state is home to health care giants such as Mayo Clinic, UnitedHealth Group and Medtronic, and boasts a diverse range of strengths, from medical devices to health care delivery and insurance. Additionally, emerging growth in biotechnology, pharmaceuticals and digital health points to a potentially new phase in Minnesota’s evolving health care landscape.
As the full report explores, the 2030 opportunity is to build on this strength to accelerate growth through innovation, retention and expansion strategies, start-up support and smart investments in infrastructure, policy change and talent initiatives. Doing so would strengthen Minnesota as a global leader in health care innovation and further ensure Minnesotans have access to high-quality health care services for years to come.
A suggestion 30 years ago that the state work to create the health and medical cluster Minnesota enjoys today would have been dismissed as outlandish. Yet look at the successes it illustrates today.
The future opportunity is even more significant. Health care will leap forward this decade. Technology advancements, consumer-driven care, digital health, coverage innovation, device innovation, remote care and telehealth are exciting new opportunities. Demographic change, rising costs and financial pressure will raise temperatures the other direction. This will challenge the stability of the state’s health care delivery sector, particularly in rural communities.
Yet Minnesota’s strengths in this sector position it exceptionally well to capitalize on opportunities and address future challenges, not least because of Minnesota’s enviable array of leaders in care delivery, insurance, consumer insights, data analytics, medical devices, pharmaceuticals and other new health technologies.
Success is not guaranteed. Minnesota’s health
and medical cluster faces challenges and competition from internet companies, retail giants and new entrants from Silicon Valley to Israel to China. Innovation and competition could
threaten Minnesota’s medical cluster – or embolden it. Stakeholders in Minnesota’s business community
and public sector should consider strategies to support, strengthen and grow this critical aspect of the state’s economy. Minnesota’s health care and medical cluster is a unique asset playing an outsized role in the economy. It will play an even bigger role in shaping Minnesota’s economic future to 2030 and beyond.
Growth Accelerator: Compete and succeed in the future technology economy Technology is changing the global economy – and the pace is only accelerating.
Minnesota was an early leader in tech but has trailed peer states and the U.S. in recent years. Indeed, sluggish growth in tech and tech occupations has been a major factor in Minnesota’s economic underperformance for almost a decade. Forecasts project an underwhelming future if Minnesota doesn’t change.
So why does Minnesota: 2030 advance “compete and succeed” in the future tech economy as a growth accelerator?
Because new technologies are transforming a wider set of industries and redefining what it means to be a “tech business.” In this landscape, Minnesota has strengths that position it for growth.
First, Minnesota has a high share of jobs in technology industries and occupations, with the 11th highest concentration of net tech employment (all jobs in tech industries and tech jobs in any industry). Minnesota also has above average tech talent concentrations, with 13 percent more IT professionals, 15 percent more STEM occupations and 14 percent more business services occupations than the U.S. average. Thus, Minnesota has bench strength in advanced industries and the tech talent needed to excel in tech this decade.
Second, Minnesota remains a leader in advanced fields, including health care and medical technology,
Build on the health care and medical sector. Sustain and grow this strength of Minnesota’s economy in both medical technology and health care delivery.
Minnesota: 2030 strategy

22 MINNESOTA: 2030 — ECONOMIC OVERVIEW
A FRAMEWORK FOR ECONOMIC GROWTH
22 MINNESOTA: 2030 — ECONOMIC OVERVIEW
A FRAMEWORK FOR ECONOMIC GROWTH
New entrants• “Best Buy CEO Eyes Health Care as Retailer’s ‘Next Big Thing” (Bloomberg, 2019)
• “Dr. David Katz Joins Forces With Anytime Fitness, Self Esteem Brands To Amplify How Fitness - As Lifestyle Medicine - Matters More Than Ever” (PR Newswire, 2020)
• “Sleep Number, the Leader in Sleep Innovation, Unveils the Future of Health and Wellness at CES 2018” (Sleep Number, 2018)
Major investments• Minnesota early stage health care companies raised a record breaking $1.4 B in 2020.
• Bright Health and Bind raised a combined $605 M in 2020, amounting to half of all funds raised by U.S. health plan companies (Medical Alley Association, 2020).
• Destination Medical Center – Mayo Clinic-driven initiative to invest $5.6 B over 20 years in Rochester, Minnesota.
• Health Village – Ryan Construction plans to develop 400 apartments, 150 units of rental senior housing and 1.1 million square feet of offices and specialty medical space to create a “healthy village” model in Maple Grove.
• Vision Northland—Essentia Health will invest $900 M new and renovated facilities in Duluth.
Making moves (Major investments and initiatives)
Industry Leaders (examples)• Mayo Clinic
• UnitedHealth Group/Optum
• Medtronic
• 3M
• Boston Scientific
• Abbott
• Starkey Hearing Technologies
Industry Concentration Relative to U.S. economy (location quotient)• Med devices ...................... 9.98x U.S. avg
• Med equip/supplies ..... 2.43x
• Insurance carriers .......... 2.37x
• Med equip wholesale .. 1.45x
• Hospitals ............................. 1.22x
Other Key Metrics(examples)• Optics/Medical goods are
#1 state export, valued at $4.6 B in 2019
• Ranked 3rd in U.S. for medical patents per 1 million ppl; ranked #1 in two sub-categories
• Ranked 1st nationwide in concentration of medical device manufacturing jobs
• Ranked 2nd nationwide in concentration of biomedical engineers
Established strengths
Emerging growth
Biotech and Pharma• Pharmaceutical exports grew 7x since
2002, 6th largest state export
• Pharmaceutical mfg employment grew at 7.8% a year from 2014-2019, 2nd fastest across the state’s medical portfolio
• $650 M raised by biotech companies in Minnesota since 2010 (Medical Alley Association, 2020)
Digital Health• Digital Health startups raised $664 M
in 2019, 1st across all categories (Medical Alley Association, 2019)
• Major digital health startups/rising stars include: Bind, Carrot Health, NovuHealth, Gravie, Revel, etc.
• “Why Minnesota is poised to be a hotbed for digital health startups” (VentureBeat, 2017)
Minnesota is well-positioned to lead in health care and medical innovation this decade

MINNESOTA: 2030 — ECONOMIC OVERVIEW 23
Minnesota:MinnesotaChamberFoundation2030
MINNESOTA: 2030 — ECONOMIC OVERVIEW 23
Minnesota:MinnesotaChamberFoundation2030
Fintech EdTech Digital Health
Global market size and forecast
$305 Billion by 2025 (20% CAGR) $285 Billion by 2027 (18.1% CAGR) $386 Billion by 2025 (24.6% CAGR)
Initiatives and support services
• Twin Cities Startup Week (BetaMN)• Minnesota Fintech Collective
(GreaterMSP)• UMN Fintech Bootcamp• gener8tor OnRamp Insurance
Accelerator
• EdNorth• Twin Cities Startup Week (BetaMN)• Education Technology
Innovations (UMN)• EdTech Team Minnesota Summit
• Medical Alley Association• gBETA Medtech• Mayo Clinic Business Accelerator• UnitedHealth Accelerator powered
by Techstars
Industry leaders (HQ or major operation)
• US Bancorp (HQ)• Ameriprise Financial (HQ)• Thrivent Financial (HQ)• Securian Financial (HQ)• Wells Fargo• RBC Wealth
• University of Minnesota• Edmentum (HQ)• Pearson VUE• Jostens (HQ)
• UnitedHealth Group/Optum (HQ)• Mayo Clinic (HQ)• Medtronic• 3M (HQ)• Boston Scientific• Smiths Medical (HQ)• Provation Medical (HQ)
Notable startups and fast growth firms
• Sezzle • Branch• Upsie • Total Expert• Apruve• ClickSWITCH
• Trinity 3 • Flyweel• Flipgrid • Kaleidoscope• Extempore • SayKid• Connexeo • Homi
• Bind • Gravie• Carrot Health • Zipnosis• Grandpad • Datica• NovuHealth • Revel
Food and Ag Tech
Smart Retail and Supply Chain Tech
(Other) IoT, Cybersecurity, Data Analytics, 3D Printing
Global market size and forecast
Food Tech: $250 Billion by 2022Ag Tech: $22 Billion by 2025
Smart Retail: $58 Billion by 2025Supply Chain Tech: $37 Billion by2027
Internet-of-Things (IoT): $1,319 Billion by 2026Cybersecurity: $111 Billion by 2025Data Analytics: $512 Billion by 20263D Printing: $52 Billion by 2026
Initiatives and support services
• Techstars Farm-to-Fork Accelerator• Grow North—Food/Ag/Ideas Week• Mbold
• Target/Metro Retail Accelerator • IoTFUSE• Minneanalytics• MN Cyber
Industry leaders (HQ or major operation)
• Cargill (HQ)• General Mills (HQ)• Hormel (HQ)• Land O’Lakes (HQ)• CHS (HQ)• American Crystal Sugar (HQ)• Rosen’s Diversified (HQ)
• Best Buy (HQ)• Target (HQ)• SPS Commerce (HQ)• Sleep Number (HQ)• CH Robinson (HQ)• UNFI (formerly SuperValu)
• Stratasys• IBM• Toro (HQ)• Tennant (HQ)• Code42 (HQ)• Digi-Key (HQ)• 3M (HQ)
Notable startups and fast growth firms
• Sentera • AgVend• Recombinetics • Rowbot• Conservis • Foodsby
• When I Work • Basketful• Inspectario • Proozy• Kidizen • Otrafy
• Protolabs • Arctic Wolf• 75F • Protocol 46• NimbeLink • FRSecure

24 MINNESOTA: 2030 — ECONOMIC OVERVIEW
A FRAMEWORK FOR ECONOMIC GROWTH
24 MINNESOTA: 2030 — ECONOMIC OVERVIEW
A FRAMEWORK FOR ECONOMIC GROWTH
financial services, corporate headquarters and machinery manufacturing, to name a few. Firms across these industries will be on the forefront of technology changes this decade, whether through digital transformation, data analytics, artificial intelligence, machine learning, Internet of Things (IoT), 3D printing, cybersecurity, block chain or automation.
Achieving full potential will require strengthening Minnesota’s underlying capacity for high-tech growth. This means increasing the availability of tech talent, including core technical workers, such as software and web developers, data scientists, engineers, and tech-equipped talent in diverse fields like nursing, manufacturing, transportation, financial services and more.
It will also require a more developed tech infrastructure to access and enable technologies across the state, as well as an alignment of economic development strategies to shine a brighter spotlight on its high-tech economy. Minnesota’s tech sector remains largely a hidden secret. The state needs to raise its profile to attract talent and ensure Minnesota is a place innovators want to be. Minnesota should put more weight behind efforts to accelerate the growth of the tech economy throughout this decade.
Strategy two: Leverage Minnesotans
Slowing population and labor force growth has been a constraint on Minnesota’s economy for two decades, and both are projected to slow even further. The state
demographer projects labor force growth of <0.1 percent a year from 2020-2025. That is simply not enough to fuel growth in the state’s economy.
While aging demographics are driving much of this trend, low net migration is also a
factor. Minnesota saw net gains in the 1990s, drawing domestic in-migration from other Midwest states to grow its population and workforce. After 2000, however, in-migration from neighboring states slowed, while losses to coastal hubs and the sunbelt accelerated. If not for international migration, Minnesota would have lost more people than it attracted this century.
By February 2021, unemployment in Minnesota had again fallen to 4.3 percent, with state Job Vacancy Surveys showing many jobs were going unfilled. Competition for talent is likely to continue being a top challenge for Minnesota this decade.
How can Minnesota address this foundational issue,
• Labor force participation fell sharply in 2020 and is not projected to return to pre-COVID levels this decade.
• Younger and older adults and communities of color are underrepresented in the workforce. The state must ensure full engagement for all Minnesotans to grow its workforce.
How many workers could Minnesota add by 2025? (estimates by Real Time Talent)
• Close racial/ethnic disparities = 65,000 more workers.
• Increase employment for older workers = 1,150 more workers.
• Increase youth employment = 15,200 more workers.
• Minnesota had 15 consecutive years of net domestic migration losses this century, driven primarily by:
• Slowing in-migration from neighboring states, particularly near bordering counties.
• Out-migration of adults 18-24 yrs old.
• Out-migration to sunbelt and western regions.
• Yet, the state does better when narrowing the focus to high skilled talent, and is a net gainer of adults in their late 20’s-30’s. Minnesota is a also a top state for dual income households.
• Minnesota must retain existing residents and leverage assets to attract top talent this decade.
Leave no one on the economic sidelines.
Retain and attract talent.
Compete in the tech economy. Strengthen Minnesota’s capacity for tech growth by increasing the availability of tech talent, and shining a brighter spotlight on Minnesota’s tech strengths.
Minnesota: 2030 strategy

MINNESOTA: 2030 — ECONOMIC OVERVIEW 25
Minnesota:MinnesotaChamberFoundation2030
MINNESOTA: 2030 — ECONOMIC OVERVIEW 25
Minnesota:MinnesotaChamberFoundation2030
ensuring the state has a growing and vibrant workforce for years to come?
First, Minnesota must beat labor force projections.
Minnesota’s underwhelming economic forecast next decade is heavily influenced by its slow population and slow labor force growth projections. No matter how you cut it, Minnesota needs workforce growth if it wants to grow. Aging demographics and falling birth rates are outside our control, but there are strategies that can help Minnesota increase its number of workers, improving its economic growth potential, specifically:• Retaining existing talent base (e.g. Decrease the
loss of younger Minnesotans, in particular, to other states),
• Improving talent attraction from other states,• Embracing and increasing international
immigration; and,• Ensuring no one is left on the economic sidelines.
As the Minnesota: 2030 report lays out, Minnesota can improve its economic outlook by retaining and attracting talent, and by bringing people into the workforce who may otherwise be on the sidelines. The state will not only grow our labor force, but also create stronger local communities and deliver greater equity for populations that have faced disadvantages.
Second, Minnesotans must have the skills to succeed.Minnesota must rethink how it helps adults
develop new skills. The days of performing the same job the same way for much of one’s career are over. Jobs and professions change and evolve quickly.
Minnesota should lead the way in rethinking how public and private sectors work together to provide tools and teach the skills necessary for workers to continually learn and thrive in a changing economy. Lifelong learning and development will be an ongoing career objective for many – and higher ed institutions must adapt and grow to respond to these changes. Not every job requires an advanced degree. Many skilled trades are and will continue to be in high demand. However, the skills deficit facing those
who don’t finish high school is only increasing, raising the stakes on successfully seeing students graduate.
This means the state’s ability to provide high quality K-12 education
to all Minnesota children, as well as quality higher educational and skills development opportunities for Minnesota adults will be absolutely imperative.
To continue to have a highly-skilled workforce as its economic cornerstone, Minnesota must ensure all students graduate high school prepared for the next phase of life, whether that be postsecondary education or a career. Minnesota students perform well on college entrance ACT scores, and rank 4th in the country in achieving two-year degrees or higher. However, the state’s high school graduation rate is below the national average – ranking 34th – and Minnesota has some of the largest achievement gaps by race, ethnicity and socioeconomic
status in the nation. This must be addressed.Minnesota employers remain committed to engaging
educational institutions and students in understanding, teaching and acquiring the skills needed to succeed in the high-demand jobs of tomorrow. Minnesota’s future in many ways depends on how this priority is executed.
Strategy three: Strengthen communities
It is no longer enough for regions to have diverse employment opportunities and high-quality education. Strong community assets and a welcoming culture that embraces all Minnesotans will define the strength of
Exceed labor force projections. Grow talent by better training, retaining and attracting key workers and key demographics.
Minnesota: 2030 strategy
The future of work will increasingly orient around higher cognitive, technological and relational/social-emotional skills. McKinsey estimates that by 2030, advanced technological skills will increase by 50% in the U.S., with IT and programming skills increasing by 90% and basic digital skills growing by 69% between 2016 and 2030 (Skill Shift: Automation and the Future of the Workforce, 2018).

26 MINNESOTA: 2030 — ECONOMIC OVERVIEW
A FRAMEWORK FOR ECONOMIC GROWTH
26 MINNESOTA: 2030 — ECONOMIC OVERVIEW
A FRAMEWORK FOR ECONOMIC GROWTH
growing communities and provide a competitive advantage economically.
A great career opportunity without reliable and affordable childcare or an affordable place to live is not a formula for economic growth. Communities that lack high-speed connectivity face a competitive disadvantage in attracting both business investment and residents. Their children may also suffer from fewer educational advantages as demonstrated during the COVID-19 pandemic.
To thrive, these issues must be addressed and diversity must be welcomed and embraced. Communities and neighborhoods must develop inclusive cultures and strategies to continue to attract and advance opportunities for populations of color including immigrants and refugees. It is essential to the fabric of our culture and communities – and to the state’s future economic growth.
Strengthen community assets – Child care
Minnesota’s child care conundrum is intensifying. Parents need safe, reliable care for children if one or both parents work. Children, who will become our future workforce, need quality early-learning opportunities, pre-K.
Child care is difficult to find and expensive if you can find it. It was already impacting workplaces and COVID-19 only compounded it. In a Minnesota Chamber poll, 62 percent of member businesses rank affordable child care as a barrier to finding workers – and data points to child care shortages as already impeding economic growth in many Minnesota communities.
Traditional child care models may not be broken entirely everywhere, but often only Band-Aids hold certain aspects together. Analysis is required to address the ability of private-sector supply in response to market demand, as well as the intersection of public program and child care funding.
Supply and demand solutions both seem necessary. Solutions could include additional funding and support of providers, higher reimbursement rates, and greater investment in early-learning scholarships.
Employer incentives could possibly address issues for a company or a community.
Innovatively addressing child care affordability and accessibility would give Minnesota an incredible
advantage in attracting and retaining workforce talent. It is a priority – and a growth opportunity.
Strengthen community assets – HousingOne of Minnesota’s economic assets, believe it or not, is
affordability, especially compared to the more expensive east and west coasts – and housing is a critical piece of that.
Unfortunately, Minnesota’s housing market is not producing enough affordable housing for entry-level homeowners. The 2018 Minnesota Governor’s Task Force on Housing report found Minnesota needs to enable private sector building of 300,000 new homes to stabilize prices and keep up with demand this decade.
New strategies are needed. State, regional and local policymakers should undertake a rigorous cost/benefit analysis to assess and streamline the many regulations impacting housing, including permitting, zoning, and construction codes to make building housing more affordable. Policymakers, non-profits, builders and communities are also coming together to spur new construction and preserve housing stock in certain communities. But more must be done.
The Housing Affordability Institute in 2019 finds: • New homes in Minnesota cost more than any
Midwest market. A comparable home in Hudson, Wisconsin, for example, costs $47,000 less than the same home in the east Twin Cities.
• The Twin Cities has one of the highest gaps between new and existing home prices in the nation.
• The disparity in homeownership rates between white and non-white Minnesotans is the highest in the nation.
• The Greater Minnesota Housing Fund continues to be a major driver of retaining and developing housing in Greater Minnesota, but the demand outpaces resources.
Strengthen community assets – ConnectivityConnectivity will only be more important in
Give workers skills to succeed. Ensure workers can adapt to rapid changes in technologies and industries, leaving no one on the sidelines.
Minnesota: 2030 strategy

MINNESOTA: 2030 — ECONOMIC OVERVIEW 27
Minnesota:MinnesotaChamberFoundation2030
M
MINNESOTA: 2030 — ECONOMIC OVERVIEW 27
Minnesota:MinnesotaChamberFoundation2030
the coming decade. Minnesota could take the lead supporting innovation in this area.
High-speed digital access is developing quickly in ways that may prove
more cost effective for underserved areas. As access grows, the “last mile” cost per connection may increase. Wireless and satellite connectivity should be explored to determine whether such methods can meet reliability needs. Incentives may be necessary to test deployment in different conditions. Rapid analysis of total cost, speeds, service reliability and subscription rates should follow within 12 months. If shown to be effective and competitive with traditional wired broadband at similar or lower costs, the state grant program should be modified to allow such solutions.
Progress on child care, housing and broadband must accelerate if Minnesota is to achieve its full economic potential this decade.
Embrace all Minnesotans: Make inclusion a strength
Closing the achievement gap and fixing our racial disparities is not just a moral imperative – it is also an economic imperative.
Minnesota has among the worst racial disparities in the country, ranging from employment to housing, health care to education and criminal justice to poverty. The importance of embracing all Minnesotans’ ability to contribute is obvious.
This conversation often focuses on “closing the gap” between white citizens and communities of color on a range of social and economic indicators. While necessary – and an appropriate goal of change – this suggests our work would somehow be done if we can get two lines to converge on a graph.
That’s too small a goal. The better objective would be to embrace all Minnesotans and make inclusion a strength. Because it would be wholly transformative.
If Minnesota embraced and valued the contributions of all – the economy would dramatically benefit. Making inclusion a strength would grow Minnesota’s economy like no other.
Are we close to that ideal? No. Far from it – as the data indicate.
But making Minnesota a state where people of all backgrounds can thrive, including people from diverse backgrounds around the world, could overcome many of our
most significant challenges.Increasing opportunities for communities of color
will boost our economy. Businesses could better recruit and welcome diverse talent from across the U.S. and internationally, adding richly to the talent of the workforce. Immigration has been a Minnesota strength. That can be leveraged as a positive experience.
Embracing all would be a mindset change for some; social challenges are rooted in every segment of society. But Minnesota’s business sector is innovative and committed – a powerful asset in driving change.
Even setting such a goal requires a dynamic, growing economy able to provide people of all backgrounds with tools and opportunities to pursue meaningful careers or start new businesses. Economic opportunity is the cornerstone of dynamism – and likely only happens with the sustained commitment of Minnesota’s private and public sectors.
Promising efforts are underway, with companies investing significantly in new models. Initiatives at scores of organizations are accelerating change and investing in Minnesota’s diverse talent pool. We detail examples in our full report. The breadth and scope is encouraging, and we believe such initiatives should be embraced as laboratories of inclusion and innovation. We will test, replicate and scale successful programs. We will promote our success in recruiting diverse talent from around the globe.
Rather than cover up Minnesota’s unacceptable disparities, we will address and correct them. But embracing inclusion as economic justice is a growth strategy as well.
Meaningful change requires that we change as Minnesotans. But it’s a powerful idea. Because embracing all Minnesotans and making inclusion a strength would be a powerful growth accelerator
Make inclusion a strength. Leverage and scale diversity and inclusion efforts statewide. Offer a clearinghouse of resources, along with direct assistance to help employers diversify their workforce.
Minnesota: 2030 strategy
28 MINNESOTA: 2030 — ECONOMIC OVERVIEW
A FRAMEWORK FOR ECONOMIC GROWTH
28 MINNESOTA: 2030 — ECONOMIC OVERVIEW
What’s next?
innesota’s economy is strong – but the economy also faces challenges.
Even emerging from the pandemic, Minnesota’s tight labor markets seem poised to return. Slow projected population growth and labor force growth suggest Minnesota’s future job growth will again be constrained.
Much can be done to strengthen Minnesota, and shape and strengthen its economic future.
This summary highlights the Minnesota: 2030 report, which we strongly recommend to readers, businesses and policymakers for the broader depth and full scope it provides.
The decade ahead will be an era of change.Technology, empowerment and AI/automation
will be major drivers. Travel, tourism and hospitality will work to rebound. Food and agriculture will only be more important, and water only more precious. Everywhere digitalization and IoT connectivity will reshape jobs, regions and entire sectors.
Minnesota: 2030 outlines strategies and growth accelerators that could help power stronger economic performance. It details strengths on which to build and hurdles to overcome – with recommendations that could strengthen Minnesota’s economy to 2030 and beyond.
Now the real work begins. The Minnesota Chamber Foundation will prioritize
recommendations, bring together key stakeholders and get to work. Some initiatives might be “one and done” projects, others may lead to greater research and yet other recommendations may include elevating work already underway.
We welcome the discussion and action Minnesota: 2030 will spur – and invite Minnesotans to join us in making Minnesota’s 2030 economy all that it can be.
Access the full Minnesota: 2030 report, industry focus chapters and supporting research at mnchamber.com/foundation.
M
A FRAMEWORK FOR ECONOMIC GROWTH

MINNESOTA: 2030 — ECONOMIC OVERVIEW 29
Minnesota:MinnesotaChamberFoundation2030
M
MINNESOTA: 2030 — ECONOMIC OVERVIEW 29
Minnesota:MinnesotaChamberFoundation2030
Thank you to our sponsors and leaders
Minnesota Chamber Foundation Board of DirectorsJon Campbell, Founder, Cedar Glen Advisory
Services LLC, ChairSusan Marvin, Chair of the Board, Marvin, Past ChairRick Bauerly, Managing Partner and CEO, Granite
PartnersJeff DeYoung, Managing Partner, Baker Tilly US, LLPKaren Himle, Senior Vice President of Corporate and
Government Affairs, ThriventHoyt Hsiao, President and CEO, Shaw LundquistJean Kane, CEO, Colliers Minneapolis St. PaulDoug Loon, President, Minnesota Chamber
of CommerceGinny Morris, Chair, Hubbard RadioJoe Nayquonabe, CEO, Mille Lacs Corporate VenturesTraci Tapani, Co-president, Wyoming MachineBret Weiss, President and CEO, WSB
Economic Advisory CouncilKelly Asche, Research Associate,
Center for Rural Policy and DevelopmentKing Banaian, Professor of Economics
and Dean, St. Cloud State UniversityChris Gudmastad, Vice President, Securian Asset
ManagementMary Jeffries, Chief Financial Officer, Starkey HearingJean Kane, CEO, Colliers Minneapolis St. PaulPhilip Kaufman, Chief Operating Officer,
UnitedHealthcareDale Kurschner, Executive Consultant,
The Platinum GroupMyles Shaver, Professor of Strategic Management
and Entrepreneurship, University of Minnesota’s Carlson School of Management
Michael Swanson, Agricultural Economist, Wells Fargo
Project StaffJennifer Byers, Executive Director,
Minnesota Chamber FoundationSean O’Neil, Director, Economic Research,
Minnesota Chamber of CommerceTom Forsythe, Principal, COO Communications, LLC
Wells Fargo
Susan Marvin Marvin Pohlad Family Foundation
Baker Tilly U.S., LLP Colliers InternationalGranite Partners WSB
ALLETE, Inc.BNSF RailwayGreat River EnergyIron Mining AssociationSecurian FinancialThriventTwin Metals Minnesota LLCUnitedHealth Group
Blandin FoundationInitiative FoundationNorthland FoundationNorthwest Minnesota FoundationSouthwest Initiative FoundationSouthern Minnesota Initiative Foundation

400 Robert Street North, Suite 1500, St. Paul, MN 55101 mnchamber.com/foundation