minnesota higher education coordinating board
TRANSCRIPT
STUDY OF POST-SECONDARY EDUCATION COSTS
,1
lrHECB
MINNESOTA HIGHER EDUCATION COORDINATING BOARD
M I N N E S O T A H I G H E R E D U C A T I O N
COORDINATING BOARD
MEMBERS
Alice Keller, Vinona, First Congressional District Maureen Johnson-Stores, Marshall, Second Congressional District Robert Ferguson, Eagan, Third Congressional District Thomas Auth, North St. Paul, Fourth Congressional District Mona Hintzman, Brooklyn Center, Fifth Congressional District Celeste O'Donnell, St. Paul, Sixth Congressional District Andy Hilger, St. Cloud, Seventh Congressional District Peter X. Fugina, Virginia, Eighth Congressional District Charles Neerland, Minneapolis, At-Large Duane C. Scribner, Minneapolis, At-Large Andrea Schmidt, Red Ving, At-Large
•

STUDY OF POST-SECONDARY EDUCATION COSTS
December 8, 1988
MINNESOTA HIGHER EDUCATION COORDINATING BOARD
MEMORANDUM
TO: COMMITTEE OF THE WHOLE
SUITE 400 CAPITOL SQUARE 550 CEDAR STREET SAINT PAUL 55101
(612) 2%-397-l
G
,/ !1 / r --....,.."t"'· I j ., G. , : ._1,. '-<--" .,,"---<'._ _ __:_ ·1./ I I I ~
FROM:
SUBJECT:
DATE:
KATHLEEN M. KIES, ACTING EXECUTIVE DIRECTOR
STUDY OF PUBLIC POST-SECONDARY COSTS
DECEMBER 8, 1988
~ ri)
The Coordinating Board's 1987-90 Management Plan included a study of post-secondary costs in public institutions. It is one of several studies on aspects of state financing for post-secondary education. This study addresses trends in costs and tuition rates and cost containment. The Average Cost Funding Task Force is currently addressing the issue of adequate funding for the public systems.
BACKGROUND
Several factors suggested the need for a study of instructional costs in Minnesota's public post-secondary systems. Both nationally and in Minnesota tuition and fee rates increased faster than the rate of inflation between 1971 and 1987. U.S. public post-secondary institutions' costs of instruction increased at a rate that was higher than that of the Consumer Price Index (CPI) between 1977 and 1986. The public perceives the cost of attending a post-secondary institution to be much higher than it is. Finally, Minnesota's ability to finance substantial increases in spending for public post-secondary education is uncertain. Since the costs of instruction in private institutions do not relate directly to state financing issues, they were not addressed in the study.
STUDY OBJECTIVES
The study of public post-secondary costs has four objectives:
o To describe the influences on post-secondary costs and tuition rates.
o To document the recent trends in Minnesota public postsecondary institutions' costs and tuition rates and to compare the trends to those of other public institutions in the United States.
o To explore the reasons for the recent trends in tuition and cost.
o To identify strategies that currently do or potentially could contain growth in costs and tuition rates.
AN EQUAL OPPORTUNITY EMPLOYER
COMMITTEE OF THE WHOLE DECEMBER 8, 1988 PAGE 2
The attached staff paper, Study of Post-Secondary Education Costs, reviews the influences on costs and tuition rates, recent trends in costs and tuition rates, and strategies for containing growth in costs and tuition rates.
FINDINGS AND CONCLUSIONS
The analysis in the paper found that post-secondary costs in the Minnesota public systems have decreased in constant dollars, but that tuition rates and financial aid awards have risen substantially in constant dollars. Several reasons for the trends are discussed. The impacts of the trends on the quality and amount of instructional and support services were not assessed. The primary findings and conclusions include the following:
Cost Trends
o Constant dollar costs per student in the public systems decreased between 1978 and 1983. The decreases were due primarily to state funding policies, the state's fiscal crises, and double digit inflation.
o Constant dollar costs per student in the public systems returned to 1978 levels by 1986. The increases appear to have been the result of a change in state financing policies and stable or declining enrollments.
o- Constant dollar costs per student in the public systems decreased in three systems after 1986. The decreases since 1986 apparently were caused by enrollment increases and the two year lag in the funding policy.
Tuition and Fee Trends
o Tuition rates in all four Minnesota public systems rose moderately in constant dollars between 1978 and 1983. The moderate increases were due to the state's fiscal crises.
o Tuition rates in all four systems rose substantially in constant dollars between 1983 and 1986. The substantial increases were the result of the new state tuition policy.
o Tuition rates in the public systems rose more slowly between 1986 and 1989 than during earlier periods and the increases varied by system and level of instruction. Variations in tuition rate changes between 1986 and 1989 were the result of enrollment increases, system tuition policies, and a change in state tuition policy for the Technical Institute System.
COMMITTEE OF THE WHOLE DECEMBER 8, 1988 PAGE 3
o Undergraduate financial aid rose much more rapidly in constant dollars than enrollments between 1980 and 1988. These increases reflected the redesign of the State Scholarship and Grant Program and the significant funding increase that were implemented in 1984 and 1985.
RECOMMENDATIONS
In light of the findings and review of strategies in the report and discussion with the Higher Education Advisory Council and other members of the post-secondary education community, I RECOMMEND THAT:
1. Minnesota retain its current mix of strategies for containing growth in post-secondary costs and tuition rates.
Rationale: The study found that post-secondary institutions' costs of providing instruction have decreased. Although tuition rates have increased significantly since the 1983 adoption of state financing policies, the rate of increase has slowed since 1986, and state and federal funding for financial aid has increased significantly. The review of cost containment strategies identified four broad strategies that could be used to contain growth in post-secondary costs and tuition rates. They include central planning and coordination, regulatory strategies, market strategies, and incentive strategies. Minnesota has a program or mechanism in place that uses each of the strategies identified. The Coordinating Board's program review and budget review responsibilities are examples of the central planning and coordinating strategy. The Board, however, does not currently exercise its review authority in the state's biennial budget process. The fiscal limitations contained in the state's average cost funding policy, an example of the regulatory approach, are probably the state's most effective method of influencing costs and tuition rates. The state's financial aid and tuition policies are examples of the market strategy. The incentive strategy of containing costs is embodied in the provision allowing systems to retain funds that remain unexpended at the end of each fiscal year. In light of recent trends in costs and tuition rates, there does not appear to be a need for exercising the Board's budget review authority or other cost containment strategies at present.
Impact: Since this recommendation reaffirms current practice, there are no impacts.
2. The Coordinating Board continue to monitor trends in costs of instruction and tuition rates.
Rationale: The study does not suggest the need for additional cost containment strategies. System requests for increased spending and the conflicting pressure to restrain levels of state spending and tuition rates, however, do
COMMITTEE OF THE WHOLE DECEMBER 8, 1988 PAGE 4
suggest the need for monitoring of trends in costs and tuition rates. The study also illustrated the fluctuations that occur in costs and tuition rates. Consequently, the Coordinating Board should continue its current practice of reporting data on trencs in post-secondary costs and tuition and required fee rates in its biennial report to the governor and legislature. Should the monitoring trends in costs and tuition rates suggest a need for further cost containment measures, the Board could consider implementation of budget review.
Impact: Since this recommendation reaffirms current practice, there are no impacts.
3. The Coordinating Board consider an evaluation of the state's finance and governance policies for post-secondary education as it develops its next management plan.
Rationale: Minnesota adopted a set of financing policies for post-secondary education in 1983. The policies included average cost funding, cost related tuition, the design for shared responsibility in financial aid, expanded system governance authority, and revised tuition reciprocity agreements. The policies were intended to promote four of the state's goals for post-secondary education. The four goals include:
o Preservation and enhancement of the quality of instructional programs;
o Efficient use of resources in the provision of instructional programs;
o Equity in the provision of state support for the public post-secondary systems; and
o Access to post-secondary education.
The interactions of the tuition and financial aid policies were assessed in two studies conducted in 1985. One study was prepared by University of Minnesota faculty and staff with the financial support of the Coordinating Board. The other study was part of the Coordinating Board's Report to the Governor and 1985 Legislature. The effectiveness of the set of finance and governance policies in promoting accomplishment of the state's goals, however, has not been evaluated. In addition, many concerns have been raised by members of the post-secondary education community in Minnesota regarding the impacts of the policies. Many changes have occurred in post-secondary education in the six years since adoption of the policies. Participation rates have changed as have the types of students enrolled. Increased support for economic development is expected of institutions, and there is an increased emphasis on the quality of instruction. All these factors suggest that an evaluation of the policies is appropriate.
COMMITTEE OF THE WHOLE DECEMBER 8, 1988 PAGE 5
Impact: An evaluation of the state's financing policies for post-secondary education could require a significant commitment of resources. The decision regarding whether to conduct an evaluation and the extent of that evaluation should be made in the context of the Board's Management Plan process. In this way, all potential projects can be considered and priorities established.
This report and the recommendations will be discussed at the December 15 Committee of the Whole meeting. No action on the recommendations is requested until the January Board meeting.
Attachment
- l -
EXECUTIVE SUMMARY
INTRODUCTION
Post-secondary institutions' costs of providing instruction
have come under close scrutiny in recent years. Concern regarding
rapid increases in tuition rates has become widespread. Increases
in the cost of providing instruction are commonly viewed as one of
the primary causes of tuition increases. This view has led to
calls for measures that would contain post-secondary costs. The
study of post-secondary education costs is designed to address
this issue for the Minnesota public post-secondary systems. Since
the costs of instruction in private institutions do not relate
directly to state financing issues, they are not addressed in the
study.
The study of public post-secondary costs has four objectives:
o To describe the influences on post-secondary costs and tuition rates.
o To document the recent trends in Minnesota public postsecondary institutions' costs and tuition rates and to compare the trends to those of other public institutions in the United States.
o To explore the reasons for the recent trends in tuition and cost.
o To identify strategies that currently do or potentially could contain growth in costs and tuition rates.
BACKGROUND
The terms cost and tuition are used to refer to two different
concepts in this study. Cost is used to refer to institutional
expenditures while tuition refers to the price students pay for
instruction. The term cost of instruction is defined for this
study as the expenditures incurred by a post-secondary institution
- ii -
to provide instruction. The cost of instruction includes both a
portion of operating and a portion of capital expenditures. The
operating cost of instruction includes th th, direct expendi-
tures for instruction and the indirec expen~ ures attril :abl
to instruction. The capital cost of instruction is the portion of
debt service payments for capital expenditures that is related to
the provision of instruction.
The costs of instruction are important in Minnesota's
financing policies for the public post-secondary systems. The
operating cost of instruction directly influences levels of
tuition revenue and state appropriations to the systems. The
capital cost of instruction for the public post-secondary educa
tion systems is financed primarily by the state, and, in some
instances, by school districts that operate technical institutes.
TRENDS IN COSTS AND TUITION RATES
Two objectives of this study were to examine recent trends in
post-secondary institutions' operating cost of instruction,
tuition rates, and financial aid and to explain the reasons for
the observed trends. The analysis found that post-secondary costs
in the Minnesota public systems have decreased in constant
dollars, but that tuition rates and financial aid awards have
risen substantially in constant dollars. Several reasons for the
trends were discussed. The impacts of the trends on the quality
and amount of instructional and support services were not
assessed. Specific findings and conclusions regarding cost and
tuition trends included the following:
- iii -
Cost Trends
o The prices of goods and services purchased by post-secondary institutions grew much faster than prices in the U. S. economy and slightly faster than the prices of consumer goods and services between 1978 and 1989.
o Minnesota per capita personal income grew more rapidly than the consumer and higher education prices between 1978 and 1989.
o Constant dollar costs per student in the public systems decreased between 1978 and 1983. The decreases were due primarily to state funding policies, the state's fiscal crises, and double digit inflation.
o Constant dollar costs per student in the public systems returned to 1978 levels by 1986. The increases appear to have been the result of a change in state financing policies and stable or declining enrollments.
o Constant dollar costs per student in the public systems decreased in three systems after 1986. The decreases since 1986 apparently were caused by enrollment increases and the two year lag in the funding policy.
o Minnesota public institutions generally had larger decreases in constant dollar expenditures per student than similar nonMinnesota institutions between 1978 and 1983. The larger decreases in Minnesota were probably due to the more severe effect of the recession on the state and a state funding policy that did not provide substantial additional state appropriations for enrollment growth.
o Expenditures for support programs including academic support, student services, institutional support, and physical plant operations, have constituted an increasing proportion of the operating cost of instruction in the State University System and Community College System.
o A national study found that post-secondary student services and institutional support costs rose more rapidly than educational and general costs. The provision of more and better services, the use of more sophisticated and specialized management and finance staff, and compliance with increased government requirements were reasons suggested to explain the increases.
o Debt service for the public systems constitutes a substantial proportion of the state's support for post-secondary education. Capital costs may increase more rapidly in the future as a result of deferred maintenance.
- iv -
Tuition and Fee Trends
o Tuition increases in all four public systems between 1971 and 1989 exceeded increases in Minnesota per capita personal income.
o Tuition rates: all four Minnesota publi~ systems rose moderately inc ~stant dollars between 1978 and 1983. The moderate increases were due to the state's fiscal crises.
o Tuition rates in all four systems rose substantially in constant dollars between 1983 and 1986. The substantial increases were the result of the new state tuition policy.
o Tuition rates in the public systems rose more slowly between 1986 and 1989 than during earlier periods and the increases varied by system and level of instruction. Variations in tuition rate changes between 1986 and 1989 were the result of enrollment increases, system tuition policies, and a change in state tuition policy for the Technical Institute System.
o Required fee rates in the Minnesota public post-secondary systems remained stable or decreased in constant dollars between 1978 and 1989. The decreases suggested that expenditures for student activities have risen more slowly than consumer prices.
o Minnesota public institutions had much larger increases than similar non-Minnesota institutions in constant dollar tuition and fee rates between 1982 and 1985. The larger increases in Minnesota institutions reflected the more severe impact of the recession on Minnesota and Minnesota's substantial increase in reliance on tuition revenue relative to other states.
o Undergraduate financial aid rose much more rapidly in constant dollars than enrollments between 1980 and 1988. These increases reflected the redesign of the State Scholarship and Grant Program and the significant funding increase that were implemented in 1984 and 1985.
o Constant dollar total awards in state scholarship and grant programs, both in Minnesota and in the United States, decreased b~tween 1979 and 1983. The d~· ,eases were likely the result f rapid inflation and the er :omic recession.
o Constant d lar total awards in state SCi. arship and grJnt programs, th in Minnesota and in the Unl _ed States, increased between 1983 and 1988. The increases were apparently due to state financial aid policy changes and significant funding increases in some state programs.
- V -
STRATEGIES FOR CONTAINING COSTS AND TUITION RATES
The analysis in this study found that per student costs in
three of the Minnesota public post-secondary systems are decreas
ing, and, while tuition rates grew rapidly from 1978 to 1986,
increased state and federal financial aid helped offset those
increases and the rate of increase in tuition has slowed since
1986. These trends do not suggest the need for additional state
measures to contain growth in costs and tuition rates.
Several factors do, however, suggest the need for a review of
strategies that are or could be used to contain growth in costs
and tuition rates. Continued upward pressure on costs is reason
ably certain. All four public systems are requesting increases in
their base spending levels. Meanwhile, there is continued
pressure to restrain increases in state spending and tuition.
Efforts to raise taxes meet with resistance. System and student
representatives argue against significant tuition rate increases.
Minnesota's current level of support for public post-secondary
education, relative to its available resources, ranks above the
national average. The state's level of support on a per student
basis, however, is equal to the national average and has decreased
in the last ten years. These conflicting trends suggest that
additional state revenue may not be sufficient to finance desired
spending increases.
Cost containment may be one way to provide expanded and/or
improved post-secondary education services if sufficient addition
al revenues are not available. Three broad strategies from the
health care experience suggest approaches to post-secondary
- Vl -
education cost containment. They include coordination and
planning, regulatory strategies, and market strategies. A fourth
strategy is t~e use of ncentives to encourage cost containment
efforts.
Minnesota has a program or mechanism in place that uses each
of the four strategies. The Coordinating Board's program review
process currently serves as a planning and coordination strategy
and its budget review process could serve a similar purpose. The
fiscal limitations that are part of the state's financing policy
for the public post-secondary systems, a regulatory strategy, is
probably the most effective method available to influence costs
and tuition rates. The state's financial aid and tuition policies
contain aspects of the market strategy for influencing costs and
tuition rates. Finally, the provision that allows systems to
retain unexpended funds is an example of the incentive strategy.
- vii -
CONTENTS
EXECUTIVE SUMMARY. . . . . . . . . . . . . . . . . . . . . . . . . . . . . . . . . . . . . . . . . . . . . i
CONTENTS ...................................................... vii
TABLE s . . . . . . . . . . . . . . . . . . . . . . . . . . . . . . . . . . . . . . . . . . . . . . . . . . . . . . . . i X
CHAPTER I . INTRODUCTION. . . . . . . . . . . . . . . . . . . . . . . . . . . . . . . . . . . . . . 1
ISSUES................................................... 1 Trends in Tuition and Fees.......................... 1 Trends in Instructional Costs....................... 2 Public Perception About the Cost of Attendance...... 3 Minnesota's Ability to Finance Increases in Spending............................... 4
STUDY OBJECTIVES. . . . . . . . . . . . . . . . . . . . . . . . . . . . . . . . . . . . . . . . . 4 CONTENTS OF THE PAPER. . . . . . . . . . . . . . . . . . . . . . . . . . . . . . . . . . . . 4 FOOTNOTES. . . . . . . . . . . . . . . . . . . . . . . . . . . . . . . . . . . . . . . . . . . . . . . . 5
CHAPTER I I • BACKGROUND. . . . . . . . . . . . . . . . . . . . . . . . . . . . . . . . . . . . . . . 7
DEFINITIONS.............................................. 7 Expenditures........................................ 7
Current Operating Expenditures................. 7 Capital Expenditures........................... 8
The Cost of Instruction............................. 9 Operating Cost of Instruction.................. 9 Capital Cost of Instruction .................... 10
Revenues. . . . . . . . . . . . . . . . . . . . . . . . . . . . . . . . . . . . . . . . . . . . 10 Tuition and Fees............................... 10 Government Appropriations ...................... 10 Other Sources.................................. 10
The Cost of Attendance.............................. 10 THE ROLE OF COSTS IN FINANCING PUBLIC POST-SECONDARY EDUCATION................................. 11
The Operating Cost of Instruction ................... 11 The Capital Cost of Instruction ..................... 12
INFLUENCES ON POST-SECONDARY COSTS ....................... 13 INFLUENCES ON POST-SECONDARY TUITION RATES ............... 16 FOOTNOTES . . . . . . . . . . . . . . . . . . . . . . . . . . . . . . . . . . . . . . . . . . . . . . . . 1 7
CHAPTER III. DATA SOURCES AND METHODS ........................ 19
ECONOMIC INDICES......................................... 19 POST SECONDARY COSTS..................................... 21
Operating Cost of Instruction ....................... 22 Systems' Instructional Expenditure Data ........ 22 HEGIS Instructional Expenditure Data ........... 25
Support Expenditures................................ 31
- viii -
Systems' Data.................................. 31 HEGIS Data..................................... 31
Capital Cost of Instruction ......................... 33 TUITION AND REQUIRED FEE RATES ........................... 35
Systems' Data....................................... 35 Tuition Rates.................................. 35 Required Fees. . . . . . . . . . . . . . . . . . . . . . . . . . . . . . . . . . 4 0
HEGIS Data .......................................... 40 Average Tuition Rates.......................... 40
F I NAN C I AL A I D . . . . . . . . . . . . . . . . . . . . . . . . . . . . . . . . . . . . . . . . . . . . 4 6 Coordinating Board Data............................. 46 National Association of State Scholarship and Grant Programs...................................... 46
FINDINGS AND CONCLUSIONS ................................. 50 Cost Trends......................................... 50 Tuition and Fee Trends.............................. 51
FOOTNOTES. . . . . . . . . . . . . . . . . . . . . . . . . . . . . . . . . . . . . . . . . . . . . . . . 5 3
CHAPTER IV. STRATEGIES FOR CONTAINING COSTS AND TUITION RATES .......................... 55
COST CONTAINMENT DEFINED ................................. 56 STRATEGIES FOR CONTAINING COSTS AND TUITION RATES ........ 57
Central Planning and Coordination .......•........•.. 57 Planning....................................... 58 Program Review................................. 58 Budget Review.................................. 59
Regulatory Strategy................................. 59 Fiscal Limitations............................. 59 Peer Reviews................................... 61 Mandated Cost Containment ...................... 61
Market Strategy..................................... 62 Financial Aid.................................. 62 Cost Related Tuition........................... 62
Incentive Strategy.................................. 63 CONCLUSIONS.............................................. 64 FOOTNOTES . . . . . . . . . . . . . . . . . . . . . . . . . . . . . . . . . . . . . . . . . . . . . . . . 6 4
APPENDIX A. INFLUENCES ON POST-SECONDARY COSTS AND TUITION RATES .......................... Al
APPENDIX B. DATA SOURCES AND METHODS ......................... Bl
- 1;( -
TABLES
TABLE 1. AVERAGE PERCENT CHANGE AND CUMULATIVE CHANGE, HIGHER EDUCATION PRICE INDEX, CONSUMER PRICE INDEX, GROSS NATIONAL PRODUCT IMPLICIT DEFLATOR, AND MINNESOTA PER CAPITA PERSONAL INCOME, FISCAL YEARS 1979-1989 ............. 20
TABLE 2. AVERAGE INSTRUCTIONAL EXPENDITURES PER FULL YEAR EQUIVALENT STUDENT, IN CURRENT AND CONSTANT DOLLARS FOR MINNESOTA PUBLIC SYSTEMS, FISCAL YEARS 1978, 1983, 1986, AND 1989 ............. 23
TABLE 3. AVERAGE ESTIMATED INSTRUCTIONAL EXPENDITURES PER FULL-TIME EQUIVALENT STUDENT IN CONSTANT DOLLARS, MINNESOTA PUBLIC INSTITUTIONS AND OTHER PUBLIC INSTITUTIONS IN THE UNITED STATES BY INSTITUTIONAL CLASSIFICATION, FISCAL YEARS 1 9 7 8 , 1 9 8 3 , AND 1 9 8 6 • • . . . . . • . . . . . . . . . . . . . . . . . . • . • . . . 2 6
TABLE 4. EDUCATION APPROPRIATIONS AND TUITION REVENUE AND EDUCATION APPROPRIATIONS PER FULL YEAR EQUIVALENT STUDENT IN CONSTANT DOLLARS, MINNESOTA PUBLIC INSTITUTIONS AND UNITED STATES PUBLIC INSTITUTIONS, FISCAL YEARS 1978, 1983, AND 1986................................ 28
TABLE 5. SUPPORT EXPENDITURES AS A PERCENT OF INSTRUCTIONAL EXPENDITURES AND CHANGE FROM 1978, Fiscal Years 1978, 1983, 1986, and 1989 ....... 32
TABLE 6. STATE DEBT SERVICE AND PERCENT OF OPERATING APPROPRIATIONS FOR THE PUBLIC POST SECONDARY EDUCATION SYSTEMS, FISCAL YEAR 1989 ................. 34
TABLE 7. FULL-TIME RESIDENT UNDERGRADUATE, GRADUATE AND PROFESSIONAL TUITION RATES IN CURRENT AND CONSTANT DOLLARS FOR MINNESOTA PUBLIC SYSTEMS, FISCAL YEARS 1971, 1978, 1983, 1986, AND 1989 ....... 36
TABLE 8. FULL-TIME UNDERGRADUATE REQUIRED STUDENT FEES IN CURRENT AND CONSTANT DOLLARS FOR MINNESOTA PUBLIC SYSTEMS, FISCAL YEARS 1978, 1983, 1986, AND 1989...................................... 41
TABLE 9. AVERAGE FULL-TIME RESIDENT UNDERGRADUATE AND GRADUATE TUITION AND REQUIRED FEES IN CONSTANT DOLLARS, MINNESOTA PUBLIC INSTITUTIONS AND OTHER PUBLIC INSTITUTIONS IN THE UNITED STATES BY INSTITUTIONAL CLASSIFICATION, FISCAL YEARS 1 9 7 8 , 1 9 8 2 , AND 1 9 8 5 . . . . . • . . . . . . . . . . . . . . . . . . . . . . . . . . 4 2
- X -
TABLE 10. COMBINED STATE SCHOLARSHIP AND GRANT AND PELL AWARDS, FALL UNDERGRADUATE HEADCOUNT ENROLLMENTS AND PERCENT CHANGE IN CONSTANT DOLLARS FOR MINNESOTA PUBLIC SYSTEMS, FISCAL YEARS 1979, 1983, 1986, AND 1988.................... 4 7
TABLE 11. TOTAL AWARDS AND NUMBER OF AWARDS FOR UNDERGRADUATE STATE SCHOLARSHIP AND GRANT PROGRAMS BASED ON NEED IN CONSTANT DOLLARS FOR MINNESOTA AND THE UNITED STATES, FISCAL YEARS 197 9 , 198 3 , 198 6 , AND 19 8 8 . . . . . . • . . . . . . . . . . . . . . . . . . . 4 9
CHAPTER I. INTRODUCTION
Post-secondary institutions' costs of providing instruction
have come under close scrutiny in recent years. Concern regarding
rapid increases in tuition rates has become widespread. This
concern has directed attention toward the causes of the tuition
increases. Increases in the cost of providing instruction are
commonly viewed as one of the primary causes of tuition increases.
This view has led to calls for measures that would contain post
secondary costs. The study of post-secondary education costs is
designed to address this issue for the Minnesota public post
secondary systems. Since the costs of instruction in private
institutions do not relate directly to state financing issues,
they are not addressed in the study.
ISSUES
Several factors suggest the need for a study of instructional
costs in Minnesota's public post-secondary systems. The factors
include recent increases in tuition and fees and in the costs of
instruction, the public's perception about the cost of attending a
post-secondary institution, and Minnesota's current level of
effort in financing public post-seconda·ry education.
Trends in Tuition and Fees
Nationally, tuition and fee rates increased faster than the
rate of inflation at u. S. public institutions between 1971 and
1987, according to Hauptman and Hartle (p. 5). The annual rate of
increase in tuition and fees exceeded those of the Consumer Price
-2-
Index (CPI) and disposable income since 1981. In Minnesota public
post-secondary in=~itutions, tuition and fee rates also increased
faster t ·n ~~e c~~, and in most instances, faster than per capita
personal .ncL .e be~ween 1971 and 1987.
Trends in Instructional Costs
U. S. public post-secondary institutions' costs of instruc
tion increased at a rate that was somewhat higher than the CPI,
according to a recent national study by Snyder and Galambos (p.
7). The study found that public institutions had decreases in
constant dollar spending per student in the early 1980s and
increases after 1983. The study also found that expenditures for
student services and institutional support rose as a percent of
educational and general expenditures between 1970 and 1985, (p.
34). Recent trends in the cost of instruction for Minnesota
public institutions have been similar in some respects to the
national trends. Although the pattern of change is similar, the
increases in most Minnesota systems have not exceeded the rate of
inflation.
Bowen (p. 38) found that increases in the costs of instruc
tion per student in all u. s. institutions of higher education
rose faster than the CPI between fiscal years 1950 and 1970 and
slower than the CPI between Fiscal Years 1930 and 1950 and between
Fiscal Years 1970 and 1978. The average annual rate of decrease
in constant dollars between 1930 and 1950 was .4 percent. Bowen
attributed this decrease to an increase in the proportion of
enrollments in public institutions. The average annual constant
dollar increase between 1950 and 1970 was 3.2 percent. This
-3-
growth, according to Bowen, was a result of society's willingness
to provide substantial increases in support for post-secondary
education. The comparable change in costs per student between
1970 and 1978 was -.4 percent. Bowen attributed the decrease to a
slowing in the growth of revenues.
Public Perception About the Cost of Attendance
The public perceives the cost of attending a post-secondary
institution to be much higher than it is, and these perceptions
may be affecting decisions to attend. The average estimate of
tuition, fees, books, supplies, room, board, transportation costs,
and personal expenses provided in response to a 1987 survey was
$9,120 at public four-year colleges and universities (Evangelauf,
1987, pp. Al, A70). The College Board estimated that the actual
average for the 1987-88 school year was $5,789 for state resi
dents. The public's estimate of similar costs at two-year insti
tutions was $4,500, $611 higher than the College Board estimate of
$3,889 for students living with their parents. A Coordinating
Board survey found that only 33 percent of parents could accurate
ly estimate the cost of attending a post-secondary institution
(MHECB 1988, p. 54) In response to a recent national survey of 13
to 21 year-olds, 48 percent said that "too expensive, can't afford
it," was the reason that more young people did not go to college
(CASE, p. 5). Twenty-eight percent of the high school graduates
who did not go to college gave "didn't have enough money" as the
reason for not attending.
-4-
Minnesota's Ability to Finance Increases in Spending
Minnesota's ability to finance substantial increases in
spe~ ing for public post-secondary education is uncertain. The
stat~'s current level of support for public post-secondary educa
tion, relative to its available resources, ranks above the
national average (Research Associat2s of Washington, 1988, p. 60).
The state's level of support on a per student basis, however, is
equal to the national average and has decreased in the last ten
years. The state's high level of taxation and the perennial
efforts to hold down taxes raise questions about the state's
ability to provide substantial increases in support.
STUDY OBJECTIVES
The study of public post-secondary costs has four objectives.
The first objective is to describe the influences on post
secondary costs and tuition rates. The second objective is to
document the recent trends in Minnesota public post-seconda~y
institutions' costs and tuition rates and to compare the trends to
those of other public institutions in the United States. The
third objective is to explore the reasons for the recent trends in
tuition and cost. The fourth objective is to identify strategies
that could contain costs and tuition rates.
CONTENTS OF THE PAPER
This paper includes four chapters and two appendices.
Chapter II defines the concepts and reviews the literature
regarding influences on post-secondary costs and tuition rates.
Chapter III reviews recent trends in costs and tuition rates and
-- -~~--~'------------- -·--
-5-
discusses reasons for the trends. Chapter IV identifies strate
gies that could influence costs and tuition rates. Appendix A
contains a more detailed description of the influences on post
secondary costs and tuition rates. Appendix B describes the data
sources and methods used to examine recent trends in costs and
tuition rates.
FOOTNOTES
Bowen, Howard R., The Costs of Higher Education. San Francisco: Jessey-Bass, 1980.
Council for Advancement and Support of Education (CASE), Survey of Participation in Higher Education Among Young People 13-21 Years of Age. Washington D. c. September 1988.
Evangelauf, Jean. "Many Americans Think College Costs Much More Than It Actually Does, A Chronicle Survey Finds," The Chronicle of Higher Education. September 2, 1987.--
Research Associates of Washington, State Profiles : Financing Public Higher Education 1978 to 1988. Washington D. C., July 1988a.
Hauptman, Arthur and Terry Hartle, Tuition Increases since 1970: A Perspective, Higher Education And National Affairs. American Council of Education, February 23, 1987.
Minnesota Higher Education Coordinating Board, Report on Survey of Parents of Eighth Graders. St. Paul, August 8, 1988.
Snyder, Thomas P. and Eva C. Galambos, Higher Education Administrative Costs: Continuing the Study. Office of Education Improvement, United States Department of Education, Washington, D. C., January, 1988.

-7-
CHAPTER II. BACKGROUND
The term cost is used to refer to tuition, the cost of
attending a post-secondary institution, and the institution's cost
of providing instruction. These multiple uses of the term often
create confusion. This chapter defines several concepts related
to post-secondary expenditures and revenues. State financing
policies for post-secondary education are described and literature
regarding the influences on costs and tuition rates is reviewed.
DEFINITIONS
The terms cost and tuition are used to refer to two quite
different concepts for this study. Cost is used to refer to
institutional expenditures while tuition refers to the price
students pay for instruction. These terms, as well as expendi
tures, revenues, and the cost of attendance are defined in this
subsection. The definitions of expenditures and revenues are
drawn from a publication entitled HEGIS Financial Reporting Guide:
1980 Edition (Allen, pp. 7-25).
Expenditures
Post-secondary institutions' expenditures can be classified
into two primary categories, current operating expenditures and
capital expenditures.
Current Operating Expenditures. Post-secondary institutions'
current operating expenditures are defined as the total cost of
the goods and services used in operating the institution during
the current fiscal year. Operating expenditures include broad
-8-
subcategories of educational and general expenditures, auxiliary
enterprise expenditures, hospital expenditures, and expenditures
for independent operations. Educational and general expenditures
are those that support the accomplishment of the institution's
missicn. They include direct expenditures for the primary func
tior of instruction, research, and public service as well as
indirect expenditures for functions that support the accomplish
ment of the three primary functions. The support functions
include academic support, libraries, student services, institu
tional support, and physical plant operations. Auxiliary
enterprise expenditures are for the operations of institutional
entities that provide goods and services to students and employ
ees. Examples of auxiliary enterprises include dormitories, food
services, and book stores. Hospital expenditures are those assoc
iated with patient care at hospitals operated by the institution.
Expenditures for independent operations are for those entities
that are unrelated to the primary mission of the institution.
A subset of current operating expenditures is the category of
state general fund expenditures. This category includes institu
tional expenditures that are supported by revenues included in the
state budget. State general fund expenditures are those supported
by state appropriations, tuition revenue, and several other minor
revenue categories. The state budget excludes most expenditures
supported by revenues from gifts, grants, contracts, endowments,
and the s a 1 e s 2 ... d s e r vi c e s o f i n s t i tut i on a 1 a c t iv i ti e s .
Capital Expenditures. The textbook definition of a capital
expenditure is one incurred to obtain an asset with a useful life
-9-
of more than one year. The term capital is used in this study to
refer to expenditures for fixed assets such as land, buildings,
and major equipment which are used for long periods of time. Such
capital acquisitions typically are financed by the sale of bonds.
As a consequence, a post-secondary institution's capital expendi
tures typically take the form of principal and interest payments
on bonds, or debt service.
The Cost of Instruction
The term cost of instruction is defined for this study as the
expenditures incurred by a post-secondary institution to provide
instruction. The cost of instruction includes both a portion of
operating and a portion of capital expenditures.
Operating Cost of Instructione The operating cost of
instruction is a subset of educational and general expenditures.
The subset includes both the direct expenditures for instruction
and the indirect expenditures attributable to instruction. Direct
expenditures are those incurred in providing classroom instruc
tion. They include categories such as faculty compensation,
supplies and materials. Indirect expenditures for instruction
include the component of expenditures for support functions that
is related to the provision of instruction. The component related
to the provision of instruction is typically determined through a
cost study. Support service expenditures are attributed to
instruction, research, and public service on the basis of measures
and judgments about the demand for those support services by each
of the three primary functions. Support expenditures not

-10-
considered part of the cost of instruction are allocated to
research a ?Ublic service.
Capita~ st 0 1 Instruction. The cap:tal cost of instruction
is the portioi f d t service payments f _ capitaL expenditures
that is related to the provision of instruction. A cost study
would be required to determine the portion of debt service expend
itures that is attributable to instruction.
Revenues
Public post-secondary institutions derive revenue from many
sources. They include tuition and fees, government appropria
tions, and other sources.
Tuition and Fees. Tuition and fees include revenues from
charges assessed students who attend an institution. Tuition
revenues typically are used for educational purposes. Fee reve
nues typically are used to support student services or activities.
Government Appropriations. Government appropriations include
revenues for current operations received from federal, state, or
local units of government. The appropriations may be available
for any operating purpose, or they may be restricted to use for
certain purposes.
Other Sources. This category includes revenues from govern
ment grants and contracts, private gifts, private grants and
contracts, endowment income, sales and services of educational
activities, auxiliary enterprises, and hospitals.
The Cost of Attendance
The cost of attendance is defined as the expenses a student
incurs to attend a post-secondary institution. It includes educa-
-11-
tional expenses and living expenses. Educational expenses are
those for purposes such as tuition, fees, books, and supplies.
Living expenses are those for housing, food, transportation,
clothing, and personal items incurred while a student is pursuing
a post-secondary education.
THE ROLE OF COSTS IN FINANCING PUBLIC POST-SECONDARY EDUCATION
The costs of instruction are important in Minnesota's
financing policies for the public post-secondary systems. The
operating cost of instruction directly influences levels of
tuition revenue and state appropriations to the systems. The
capital cost of instruction is financed almost exclusively by
state appropriations.
The Operating Cost of Instruction
Minnesota· uses an average cost funding formula to provide
appropriations for the operating cost of instruction in the public
post-secondary education systems. Levels of appropriations are
determined on the basis of the costs of providing instruction and
the volume of instruction provided. Cost is measured by the
average operating cost of instruction per student, and volume is
measured by full year equivalent or average daily membership
enrollments. The average costs are calculated for each level of
instruction -- lower division, upper division, graduate, and
professional -- and each of three program cost categories -- low,
medium, and high. The costs are multiplied by the corresponding
enrollment two years prior to the year being funded. The products
are added to obtain estimated instructional expenditures. Thus,
-12-
estimated instructional expenditures for Fiscal Year 1988 are
based on Fiscal Year 1986 enrollments and Fiscal Year 1988 costs.
The two year lag is intended to provide time for institutions to
adjust their spending levels to enrollment changes. Appropria
tions for instruction are equal to 67 percent of estimated
instructional expenditures for the University of Minnesota, the
State University System, and the Community College System. Appro
priations for instruction are equal to at least 67 percent of
estimated instructional expenditures for the Technical Institute
System.
The state tuition policy expects that 33 percent of estimated
instructional expenditures will be funded by students through
tuition revenue in the collegiate systems and at least 26 percent
will be funded by students in the Technical Institute System. The
expected tuition percentage applies only in the aggregate to each
public post-secondary education system. Each system governing
board has discretion in implementing the tuition policy. There is
no expectation that each student must pay a specified percentage
of the cost of instruction. Tuition rates may be uniform or they
may vary on the basis of the level of instruction, the program
cost, or other appropriate factors. Governing boards may raise
either more or less than the expected amount of tuition revenue.
Governing boards also set required fee rates.
The :apital Cost of Instruction
The capital cost of instruction for the public post-secondary
education systems is financed primarily by the state and, in some
instances, by school districts that operate technical institutes.
-13-
The state finances 100 percent of the capital cost of instruction
on projects it approves for consolidated technical institutes such
as Southwestern Technical Institute, the Community College System,
the State University System, and the University of Minnesota. The
state finances 85 percent of the capital cost of instruction on
projects it approves for other technical institutes, and the
school district operating the institute finances the remaining 15
percent. The University of Minnesota and the State University
System have the authority to bond for construction and do so
primarily for auxiliary enterprise facilities. Debt service on
these bonds is typically paid from user fees.
INFLUENCES ON POST-SECONDARY COSTS
There are many influences that affect post-secondary institu
tion's costs of instruction. Paul Brinkman of National Center for
Higher Education Management Systems developed a conceptual
framework that identifies three sources of influence on post
secondary costs (1988). The influences are those of the institu
tion itself, the higher education community, and the external
environment. He identifies cultural and material conditions
within each level of influence that affect costs. Culture repre
sents the predominant set of values, attitudes, and norms that
influence the operation of the institution. Material conditions
represent the physical state of affairs, the structures, and the
relationships within which the institution operates.
Influences within post-secondary institutions have the most
direct impact on costs, according to Brinkman. System influences
-14-
on institutions costs are treated as institutional influences. An
institution's values, attitudes and norms are a significant influ-
ence on c~sts. Brin an identifies the mission, the size and
nature o~ student bo
able, system and ins
the physical plant, the revenues av
:utional financing policies, system :er-
nance structures, ano nstitutional management practices as mater
ial conditions that influence costs. An institution's relat·
emphasis on instruction, research, and public service as well as
its specialization within each of these areas affects its costs.
An institution's costs of instruction are affected by the number
and mix of disciplines offered and the number and level of degree
and support programs offered. The size and nature of the student
body is an important influence on costs. The size, age, location,
and condition of an institution's physical plant affect its costs.
Bowen (pp. 17-23) argues that in the short run, an institution's
available revenues per student determine its costs. The cost per
student is a function of available revenue and enrollment, accor-
ding to this "revenue" theory of cost. System allocation policies
and institutional budgeting practices influence post-secondary
institutions' costs. System governance structures also influence
costs.
Post-secondary institutions are members of a community of
institutions and other post-secondary education organizations.
Values, attitudes, and norms espoused within the post-secondary
education community influence individual institution's costs.
Brinkman contends that a primary cultural influence of the
community is exerted through disciplines. Material conditions
-15-
such as the current knowledge base within disciplines, instruc
tional technologies, relations among institutions, and post
secondary education organizations affect institutions' costs,
according to Brinkman.
The environment external to post-secondary institutions and
the post-secondary education community also exerts significant
influence on post-secondary institutions' costs. Brinkman identi
fies two external cultural conditions that relate directly to
post-secondary education. They are expectations for post
secondary education and the value of post-secondary education. In
addition, Brinkman discusses several other conditions that affect
many sectors of society including post-secondary education.
Changes in society's expectations for post-secondary education
influence costs. The value of post-secondary education to
consumers, producers, and entities that finance it has significant
impacts on costs. Fundamental changes in society such as the
civil rights and women's movements influence post-secondary costs.
Many material conditions external to post-secondary education
that exert influence on post-secondary costs were identified by
Brinkman. Government's financing policies and regulatory practi
ces are its primary influences on post-secondary costs. The
political climate can have a substantial impact of costs. Econom
ic factors including inflation, unemployment, the condition of the
economy, and the demand for individuals with advanced training are
influences on post-secondary costs. Post-secondary costs also are
affected by demographic, technological, and social changes.
-16-
INFLUENCES ON POST-SECONDARY TUITION RATES
Several influences affect public post-secondary education
tuition rates. External influences probably are the most signi
ficant influenc~s on public post-secondary tuition rates. They
include state tuition policies, levels of state appropriations,
and external cultural conditions.
A review of the literature reveals four broad approaches used
by states in setting tuition rates for their public post-secondary
institutions (McKeown, p. 5 and Curry, p. 6). The first approach
consists of adjusting tuition rates based on the change in a
specified economic index. The index might be an index of prices
such as the Consumer Price Index, the Higher Education Price
Index, or a measure of changes in individual income. The second
approach consists of establishing tuition rates or levels of
tuition revenue in relationship to some measure of the cost of
providing instruction. The third approach consists of establish
ing tuition rates on the basis of the rates at benchmark insti
tutions. The fourth approach tends not to be as formally speci
fied as the other three. This approach is characterized as one
that sets tuition to generate all or most of the difference
between what the institutions believe they need and what the state
and/or local government appropriate.
The level of state appropriations appears to be a significant
influence on tuition rates (Wittstruck and Bragg, p. 21). This
relationship can be both negative and positive. In the short
term, higher increases in state appropriations have been
-17-
associated with smaller increases in tuition. Tuition rates also
increase with appropriations in the long term.
A state's collective values and attitudes regarding post
secondary education are a significant influence on tuition rates.
The extent to which a state values access to post-secondary educa
tion, and the way it chooses to promote access affect tuition
rates. The post-secondary community exerts influence on public
post-secondary institutions' tuition rates through competition.
System and institutional influences include both material and
cultural conditions. A system or institution's cost of instruc
tion influences its tuition rates. The nature of that role
depends in part upon the state tuition policy. The values, atti
tudes, and norms that a system or institution holds also influence
its tuition rates.
FOOTNOTES
Allen, Richard H., HEGIS Financial Reporting Guide: 1980 Edition. National Center for Higher Education Management Systems, 1980.
Bowen, Howard R., The Costs of Higher Education. San Francisco: Jessey-Bass, 1980.
Brinkman, Paul, The Cost of Providing Higher Education: A Conceptual Overview. Denver, State Higher Education Executive Officers, June, 1988.
Curry, Denis J., Tuition and Student Aid Policies: What Role For SHEEOS?. Denver, State Higher Education Executive Officers, June, 1988.
McKeown, Mary P., State Policies on Tuition and Fees for Public Higher Education. The Journal of Education Finance, Vol. 8, Summer, 1980.
Wittstruck, John R. and Stephen M. Bragg, Focus on Price Trends in Public Higher Education: Tuition and State Support. Denver, State Higher Education Executive Officers, June, 1988.

-19-
CHAPTER III. TRENDS IN COSTS AND TUITION RATES
The conventional wisdom is that costs and tuition rates have
increased significantly in recent years. This chapter examines
trends in several economic indices and trends in costs, tuition
rates, and financial aid that were prepared with data from Minne
sota's public post-secondary systems, Higher Education General
Information Survey (HEGIS), Research Associates of Washington,
Higher Education Coordinating Board, and The National Association
of State Scholarship and Grant Programs. Reasons for the observed
trends are discussed. The last section of the chapter presents
conclusions. Appendix B describes of the data sources,
limitations, definitions, and the methods of analysis used.
ECONOMIC INDICES
The prices of goods and services purchased by post-secondary
institutions grew much faster than prices in the United States
economy and slightly faster than the prices of consumer goods and
services between 1978 and 1989. The cumulative Higher Education
Price Index (HEPI) was 11.9 percentage points higher than the CPI
and 26.6 points higher than the Gross National Product (GNP)
Deflator for the 11-year period, as shown in Table 1. Growth in
the HEPI exceeded that of the GNP Deflater by 1.3 percent per year
and that of the Consumer Price Index (CPI) by .5 percent per year
between 1979 and 1989. The growth rate of the CPI, however,
exceeded that of the HEPI and the Deflater between 1979 and 1983.

-20-
Table 1 Average Percent Change and CUrrn.llative Change
Higher Education Price Index, Consurrer Price Index, Gross National Prcrluct Implicit Deflator, and
Minnesota Per capita Personal Incorre Fiscal Years 1979-1989
Year Higher Con51..lllEr Gross Minnesota Education Price National ?er capita
Price Index Prcrluct Personal Index Deflator Incorre
Average 01.ange
1971-1978
1979-1983
1984-1989
1979-1989
a.mulative Change
1971
1978
1983
1986
1989*
6.6%
8.9%
4.9%
6.7%
63.9
100.0
153.4
180.1
204.4
6.8%
9.4%
3.5%
6.2%
63.4
100.0
156.8
173.7
192.5
-
8.0%
3.3%
5.4%
100.0
146.8
161.5
177.8
sa.JRCE: HEPI, Research Associates of Washington; CPI, Bureau of LabJr Statistics, U.S. Departrrent of Labor; G'1P and Minnesota Per capita Disposable Incorre, Minnesota Departnent of Finance.
* HEPI and CPI inflation rates in 1989 ¼!ere assurred to be equal to the 1988 rates. Growth rates of the G'1P Deflater are those projected by the Departrrent of Finance.
9.6%
8.7%
6.3%
7.4%
52.7
100.0
152.0
187.2
219.3
-21-
Since 1983, the HEPI has risen more rapidly than the Deflater and
the CPI.
The fact that the HEPI has risen more rapidly than the CPI
since 1982 has generated some controversy. Given the differences
in the mix of goods and services that each is based on, however,
there is no particular reason why they should increase at similar
rates. The fact that the HEP! rose more slowly than the CPI prior
to 1982 often is cited one reason why the HEPI has risen more
rapidly since then. It is argued that expenditures for certain
items did not keep pace with inflation. Recent increases in costs
are attributed, in part, to attempts to recover the lost ground.
Minnesota per capita personal income grew more rapidly than
the three price indices between 1978 and 1989. It grew at rates
comparable to those of the price indices prior to 1983 and has
grown much more rapidly than the indices since 1983. This trend
reflects the strong, diverse nature of the state's economy.
POST-SECONDARY COSTS
Recent trends in post-secondary institutions' operating costs
of instruction, support expenditures, and the capital cost of
instruction are presented in this section. The Minnesota systems'
data are used to examine trends between 1978 and 1989. The HEGIS
data are used to compare trends for Minnesota institutions with
those of similar institutions in other states. The HEGIS data,
particularly the enrollment data, have several significant
limitations. The limitations are described in Appendix B.
-22-
Operating Cost of Instruction
This subsection presents data on the operating cost of
instruction. The systems' data on instructional expenditures per
full-year equivalent (FYE) enrollment are used to examine
Minnesota trends. HEGIS data on estimated instructional
expenditures per full-time equivalent (FTE) enrollment are used to
compare Minnesota trends to those of other U. S. public post
secondary institutions in each of the five institutional classifi
cations. The classifications are those developed by the National
Center for Higher Education Management Systems (NCHEMS). The
classifications are described and the Minnesota institutions in
each are listed in Appendix B.
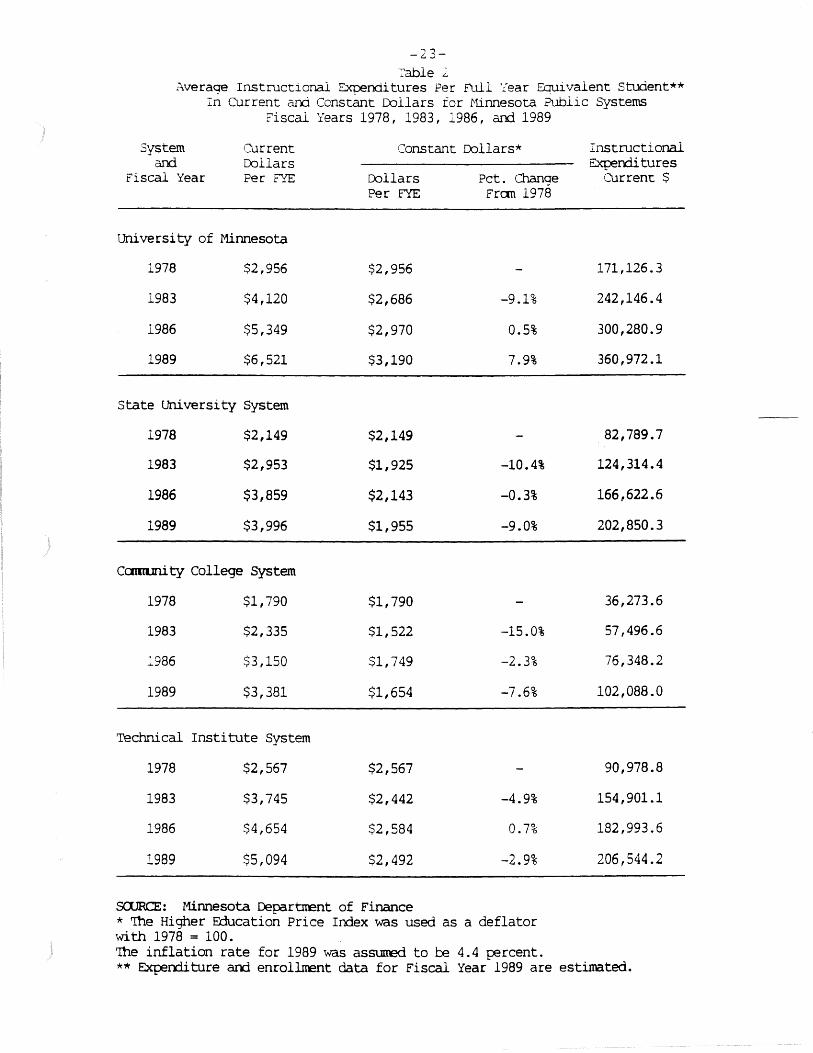
Systems' Instructional Expenditure Data. Three of the four
public systems have levels of spending per student in 1989 that
are lower than 1978 levels in constant dollar terms. All four
systems had decreases, some substantial, in constant dollar expen
ditures from 1978 to 1983, as shown in Table 2. Between 1983 and
1986, conversely, all systems had increases in per student
expenditures. Except for the University of Minnesota, all systems
had decreases between 1986 and 1989.
The constant dollar decreases in per student spending between
1978 and 1983 were primarily due to state funding policies, the
state's fiscal crises, and double digit inflation. The state
funding policy for the collegiate systems provided no state appro
priations for enrollment increases between 1978 to 1981. Small
additional state appropriations were provided for enrollment
increases in 1982 and 1983. The state's fiscal crises in the
-23-:::able ~
Average Instructional Expenditures Per Full Year Equivalent Student** In current and Constant Collars for ~tinnesota Public Systems
Fiscal Years 1978, 1983, 1986, and 1989
System and
Fiscal Year
current Collars Per FYE
university of Minnesota
1978 $2,956
1983 $4,120
1986 $5,349
1989 $6,521
State universicy System
1978 $2,149
1983 $2,953
1986 $3,859
1989 $3,996
Camuni ty College System
1978 $1,790
1983 $2,335
1.986 $3,150
1989 $3,381
Technical Institute System
1978 $2,567
1983 $3,745
1986 $4,654
1989 $5,094
Constant Dollars*
Collars Per FYE
$2,956
$2,686
$2,970
$3,190
$2,149
$1,925
$2,143
$1,955
$1,790
$1,522
$1,749
$1,654
$2,567
$2,442
$2,584
$2,492
Pct. Change Fran 1978
-
-9.1%
0.5%
7.9%
--10.4%
-0.3%
-9.0%
--15.0%
-2.3%
-7.6%
-
-4.9%
0.7%
-2.9%
saJRCE: Minnesota Depart:nent of Finance * 1:he Higher F.ducation Price Index was used as a deflater with 1978 = 100. 'Ihe inflation rate for 1989 was asSUitro to ce 4.4 i;:ercent.
Instructional Expenditures
Current$
171,126.3
242,146.4
300,280.9
360,972.1
82,789.7
124,314.4
166,622.6
202,850.3
36,273.6
57,496.6
76,348.2
102,088.0
90,978.8
154,901.1
182,993.6
206,544.2
** Experrliture arrl enrollrrent data for Fiscal Year 1989 are estimated.
-24-
early 1980s were precipitated by an economic recession and the
resulting decreases of revenues below expected levels. In
response to the crises, levels of state appropriations for all
purposes, including public post-seconddry education, were reduced
several times. Although the systems' tuition rates increased
signif:cantly, they were not able to recover all the lost appro
priations., Finally, prices throughout the economy escalated
rapidly between 1979 and 1983. The HEP! rose 34 percent during
this period and substantially exceeded inflationary adjustments in
funding. Since all four systems had enrollment growth between
1978 and 1983, the lack of proportional increases in state funding
together with reductions in state appropriations and the high rate
of inflation meant decreases in average spending per student.
The increases in constant dollar spending per student between
1983 and 1986 appear to be due to a change in state financing
policies in 1983 and stable or declining enrollments. The policy
provides funding on the basis of the costs of instruction and
enrollment two years earlier. A new tuition policy required
students to pay a larger share of the costs of instruction. The
net effect of the policies was higher levels of instructional
revenues. The revenue increases together with stable or declining
enrollments resulted in higher levels of constant dollar spending
per student in 1986 than was the case in 1983.
Enrollment increases and the two year lag in the funding
policy were apparently, in large part, the cause of decreases in
spending per student in three of the systems between 1986 and
1989. The State University System and the Community College
-25-
System have had dramatic enrollment increases since 1986. The two
year lag means that state appropriations for the additional
students are delayed. Some state appropriations were provided in
fiscal years 1988 and 1989 for enrollment increases not funded
under the two year lag. In spite of the additional appropria
tions, enrollment increases depressed levels of revenue and
consequently spending per student. Economies of scale also may
mean that somewhat lower levels of expenditures were needed to
provide instruction.
Enrollment decreases, the two year lag, and the University's
Commitment to Focus program were likely the causes of increases in
constant dollar spending per student at the University of Minne
sota between 1986 and 1989. The University had enrollment
decreases between 1986 and 1989. The two year lag means that
state appropriations decrease two years after enrollments.
Consequently revenues and spending per student, increase. The
University also has received some additional state funding for its
Commitment to Focus program.
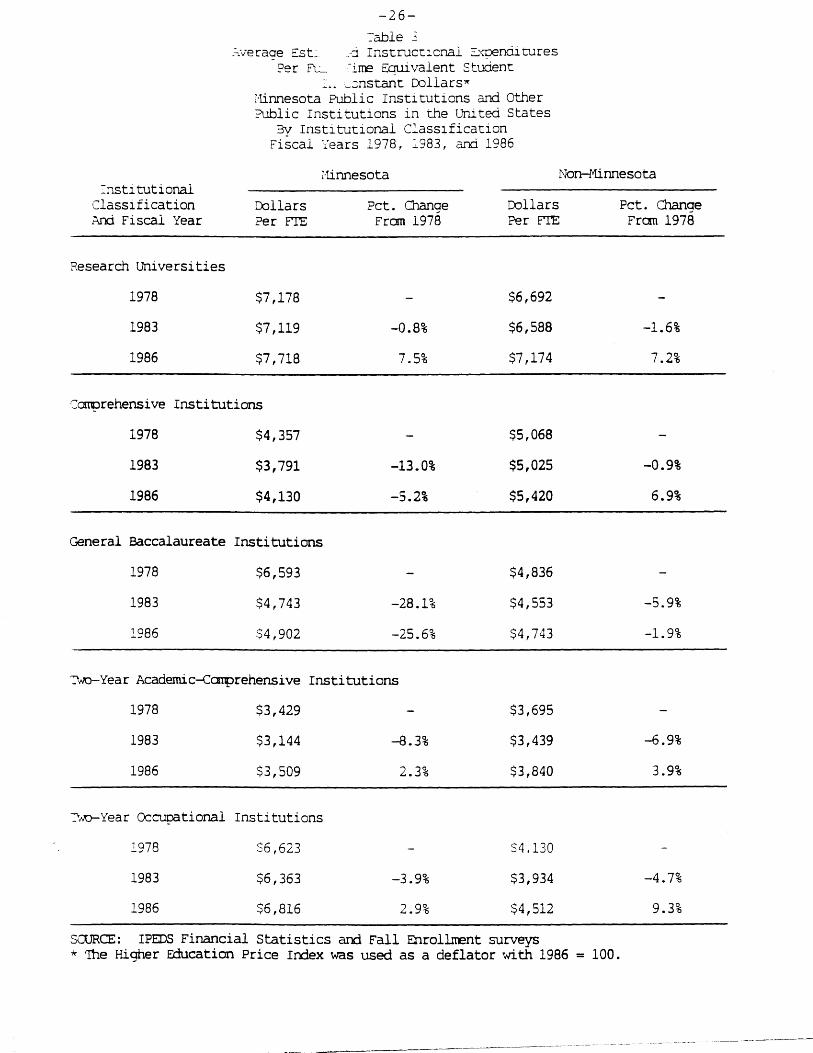
HEGIS Instructional Expenditure Data. Both Minnesota and
non-Minnesota institutions in all classifications had per student
constant dollar decreases between 1978 and 1983 and increases
between 1983 and 1986, as shown in Table 3. Minnesota public
post-secondary institutions had larger decreases in average
estimated constant dollar instructional expenditures per student
than similar non-Minnesota institutions between 1978 and 1983 in
three of five classifications examined. Minnesota institutions
had percentage increases similar to non-Minnesota institutions
-26--=-able .:
.=•.:veraoe Est~ .-:i Instruct:1.cnal :::.xr:::encii cures E'er fl.:_ ~iITE Eauivalent Student
~-• ~::nstant collars~ i'linnesota Public Institutions and other ?ublic Institutions in the United States
By Institutional Classification Fiscal Years 1978, :983, and 1986
7·linnesota Non-Minnesota =nstitutional
Classification Collars Pct. Change collars Pct. Change And Fiscal Year Per F'I'E From 1978 Per ITE Fran 1978
Research universities
1978 $7,178 - $6,692
1983 $7,119 -0.8% $6,588 -1.6%
1986 $7,718 7.5% $7,174 7.2%
·=~rehensi ve Institutions
1978 $4,357 - $5,068
1983 $3,791 -13.0% $5,025 -0.9%
1986 $4,130 -5.2% $5,420 6.9%
General Baccalaureate Institutions
1978 $6,593 - $4,836
1983 $4,743 -28.1% $4,553 -5.9%
1986 $4,902 -25.6% $4,743 -1.9%
T'wo-Year Acadernic-Carrprehensive Institutions
1978 $3,429 - $3,695
1983 $3,144 -8.3% $3,439 -6.9%
1986 $3,509 2.3% $3,840 3.9%
r...;o-Year Occupational Institutions
1978 S6,623 - S4,130
1983 $6,363 -3.9% $3,934 -4.7%
1986 $6,816 2.9% $4,512 9.3%
SCURCE: IPEDS Financial Statistics and Fall Enrollrrent surveys * 'Ihe Higher E'ducation Price Index was used as a deflator 'With 1986 = 100.
-27-
between 1983 and 1986. They did not, however, reach the same
percentage of 1978 levels as non-Minnesota institutions because of
the larger decreases between 1978 and 1983. The exception was the
research university classification in which the Minnesota trend
was virtually identical to that of similar non-Minnesota
institutions.
The constant dollar decreases in instructional expenditures
per student observed nationally between 1978 and 1983 appear to
be·, in large part, a consequence of rapid inflation and a reces
sion. The prices of post-secondary goods and services increased
more rapidly between 1980 and 1982 than during any other period
since 1961. Appropriations and tuition revenue per student did
not increase as rapidly as prices between 1978 and 1983, as shown
in Table 4. As a consequence, expenditures decreased in constant
dollars. The recession in the early 1980s affected many states,
leading to severe fiscal problems for public post-secondary
education. In response to a 1983 survey by the Education Commis-
sion of the States, 22 states reported that higher education
budget reductions occurred in 1982, and 34 reported that they
occurred in 1983 (ECS, p. 28). Actions taken to reduce expendi
tures included salary and staffing changes, enrollment limita
tions, termination of degree programs, delays in construction and
maintenance, and reductions in support services (ECS, pp. 32-7).
The national constant dollar increases in expenditures per
student between 1983 and 1986 likely were due to several factors:
the lingering effects of inflation, an increased emphasis on
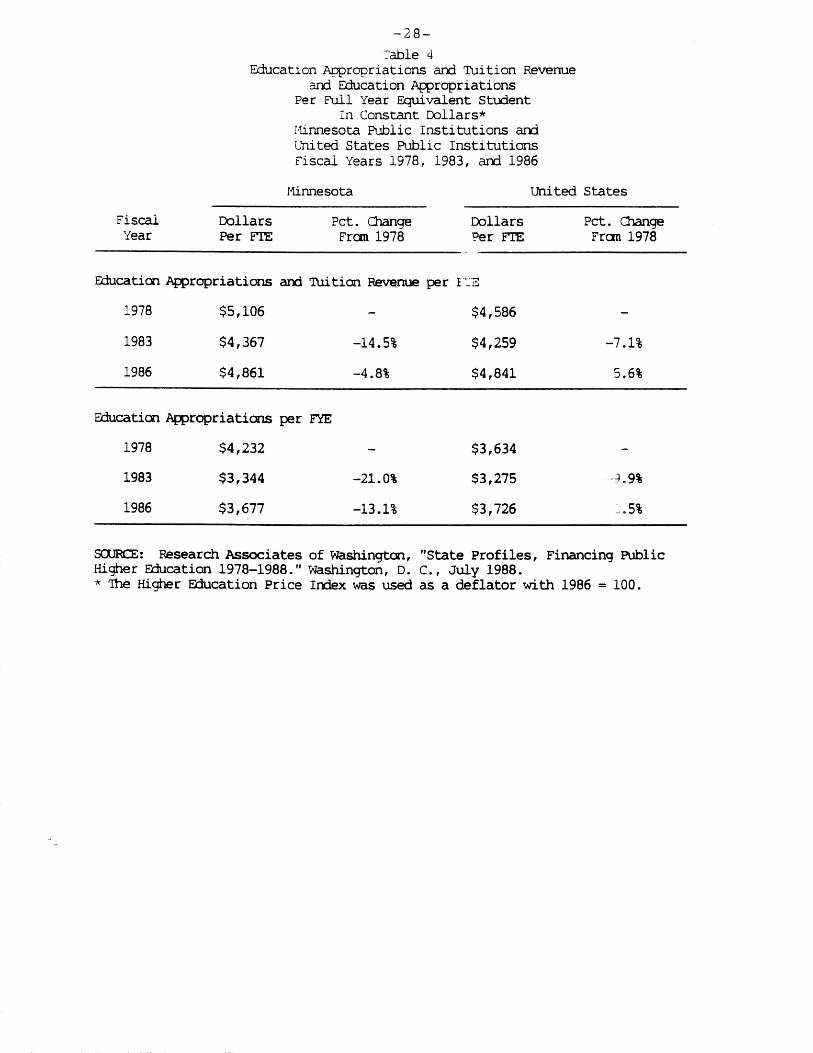
-28--=able 4
Education Appropriations and Tuition Revenue and Education Af:propriations
Per Full Year Equivalent Stt.rlent In Constant collars*
Minnesota Public Institutions and United States Public Institutions Fiscal Years 1978, 1983, and 1986
Minnesota united States
Fiscal Year
Dollars Per FTE
Pct. 01al1ge Fran 1978
Dollars Per FTE
Educatioo AR;)ropriations arrl 'Iuition Revenue per 1·-..:z
1978 $5,106 - $4,586
1983 $4,367 -14.5% $4,259
1986 $4,861 -4.8% $4,841
Educatioo AR;)ropriations per FYE
1978 $4,232 - $3,634
1983 $3,344 -21.0% $3,275
1986 $3,677 -13.1% $3,726
Pct. Cl1ange Fran 1978
-7.1%
5.6%
.9%
.5%
SCXJRCE: Pesearch Associates of washington, "State Profiles, Financing Public Higher Eiiucation 1978-1988." washington, D. c., July 1988. * 'Ihe Higher 0:lucation Price Irrlex was used as a deflater with 1986 = 100.
-29-
post-secondary institutions' quality and their role in economic
development, and the economic recovery.
The prices of some higher education goods and services have
increased more rapidly than others in recent years. Compensation
increases have exceeded non-personnel increases since 1982
(Research Associates of Washington, 1988b, pp. 12-3). During most
of the 1970s and early 1980s, compensation increased more slowly
than the CPI. Recent increases in expenditures can be attributed
in part to institutions' efforts to regain the lost employee
purchasing power. Collective bargaining and unionization of post
secondary employees also are likely to have resulted in higher
costs than otherwise would have been the case. The prices of
books and services also have increased more rapidly than other
goods and services in 13 of the last 18 years (Research Associates
of Washington, 1988b, pp. 12-3).
The quality of post-secondary education and role of post
secondary institutions in economic development have become the
focus of public attention and public policy in recent years.
Wittstruck and Bragg (p. 6) cited national and state efforts
addressing these issues.
concerns about quality.
Nationally, several reports have raised
In response to a 1985 survey, 16 of 20
states reported that endowed chairs or quality funding efforts
were being developed or had been established (Mingle and Walker,
pp. 1-11). The Commitment to Focus effort of the University of
Minnesota and the Coordinating Board's quality assessment effort
are Minnesota manifestations of the national trend toward quality
improvement. The Mingle and Walker survey also found 15 states
-30-
reporting efforts to develop applied research centers or higher
education-business linkages. Like other states, Minnesota has
increased basic and applied research and technology transfer,
established instructional programs that produce grad tes for new
and existing state industries, and developed training programs
tailored to the needs of specific firms.
The economic recovery has meant that states and localities
have had more revenues available to support higher costs, quality
improvement, and economic development efforts in post-secondary
education. The national average state and local appropriations
per student increased substantially in constant dollars between
1983 and 1986, as shown in Table 4.
Although three categories of Minnesota institutions had
larger decreases in spending per student than similar non
Minnesota institutions between 1978 and 1983, the Minnesota
increases between 1983 and 1986 were comparable to those of non
Minnesota institutions. The larger decreases in Minnesota were
probably due to the more severe effect of the recession on the
state and a state funding policy that did not provide substantial
additional state appropriations for enrollment growth. Minne
sota's post :condary education budget reductions were among the
largest rep~ ted in the 1983 ECS survey (ECS, pp. 27-8). As
indicated above, Minnesota's funding policy did not provide
significant additional state support for enrollment increases.
Although enrollment-related funding was not universal, it was the
predominant method of financing in the early 1980s. Twenty-nine
states reported using a state level enrollment-related funding
-31-
formula or guideline in response to a 1980 survey (McKeown,
pp. 280-1).
Support Expenditures
This subsection presents data on support expenditures for
instruction. The systems' data on instructional and support
expenditures are used to examine Minnesota trends. A recent
national study on trends in student services and institutional
support expenditures in U. S. public post-secondary institutions
is cited. This study used HEGIS data.
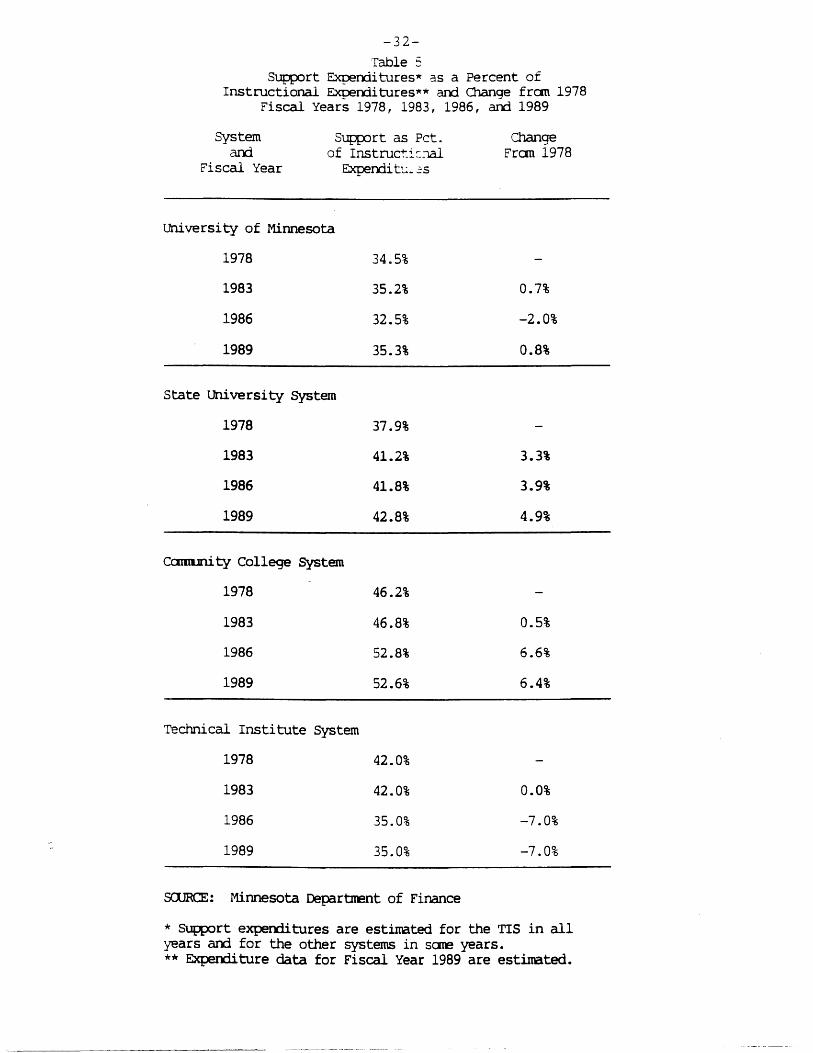
Systems' Data. The trends in support expenditures as a
percent of the instructional expenditures vary among the public
systems. Support expenditures include academic support, student
services, institutional support and physical plant operations.
The State University System and the Community College System had
increases of 4.9 and 6.4 percent between 1978 and 1989, as shown
in Table 5. The University of Minnesota remained stable, and the
Technical Institute System had a decrease.
HEGIS Data. Snyder and Galambos (p. 34) found that a portion
of post-secondary institutions' support expenditures, student
services and institutional support costs, had risen more rapidly
than educational and general expenditures. Student services and
institutional support costs rose from 12.5 percent of educational
and general expenditures in 1949-50 to 19.2 percent in 1984-85.
The increase in the proportion of expenditures for student
services and institutional support occurred primarily in the 1960s
and early 1970s with modest increases in the 1980s.
-32-Table 5
~rt Experrlitures~ as a Percent of Instructional Experrlitures** arrl Change fran 1978
Fiscal Years 1978, 1983, 1986, arrl 1989
System arrl
Fiscal Year
~rt as Pct. of Instructi:m
Experrli tt:_ 2 S
university of Minnesota
1978
1983
1986
1989
State university System
1978
1983
1986
1989
Camuni ty College System
1978
1983
1986
1989
Technical Institute System
1978
1983
1986
1989
34.5%
35.2%
32.5%
35.3%
37.9%
41.2%
41.8%
42.8%
46.2%
46.8%
52.8%
52.6%
42.0%
42.0%
35.0%
35.0%
SOJRCE: Minnesota Depart:nent of Finance
Change Fran 1978
0.7%
-2.0%
0.8%
3.3%
3.9%
4.9%
0.5%
6.6%
6.4%
0.0%
-7.0%
-7.0%
* ~rt experx:litures are estimated for the TIS in all years arrl for the other systems in sane years. ** Experxliture data for Fiscal Year 1989 are estinated.

-33-
Several reasons are advanced to explain the increases in
support and administrative expenses. Post-secondary institutions
are providing more and better services such as career guidance,
counseling, job placement, and health services. Institutions are
employing more sophisticated and specialized management and
finance staff. Finally, compliance with increased government
requirements such as environmental and employment regulations is
resulting in increased administrative costs.
Capital Cost of Instruction
This subsection presents data on the capital cost of instruc
tion. Minnesota state appropriations for post-secondary education
debt service are used to illustrate the magnitude of capital
costs. There are no comparable national data on capital expendi
tures available.
Debt service for the public systems constitutes a substantial
proportion of the state's support for post-secondary education.
Minnesota will spend more than $70 million in Fiscal Year 1989 for
post-secondary debt service, as displayed in Table 6. In rela-
tionship to each system's operating appropriations, debt service
ranges from 6.6 percent for the Technical Institute System to 10.8
percent for the Community College System. Additional debt service
is paid by school districts that oper~te technical institutes.
Capital costs may increase more rapidly in the future. Many
maintenance, repair, and renovation projects were postponed during
the high inflationary years. In response to a recent survey,
60 percent of college planners reported that the need for new or
modernized facilities on their campuses was "extremely urgent" or
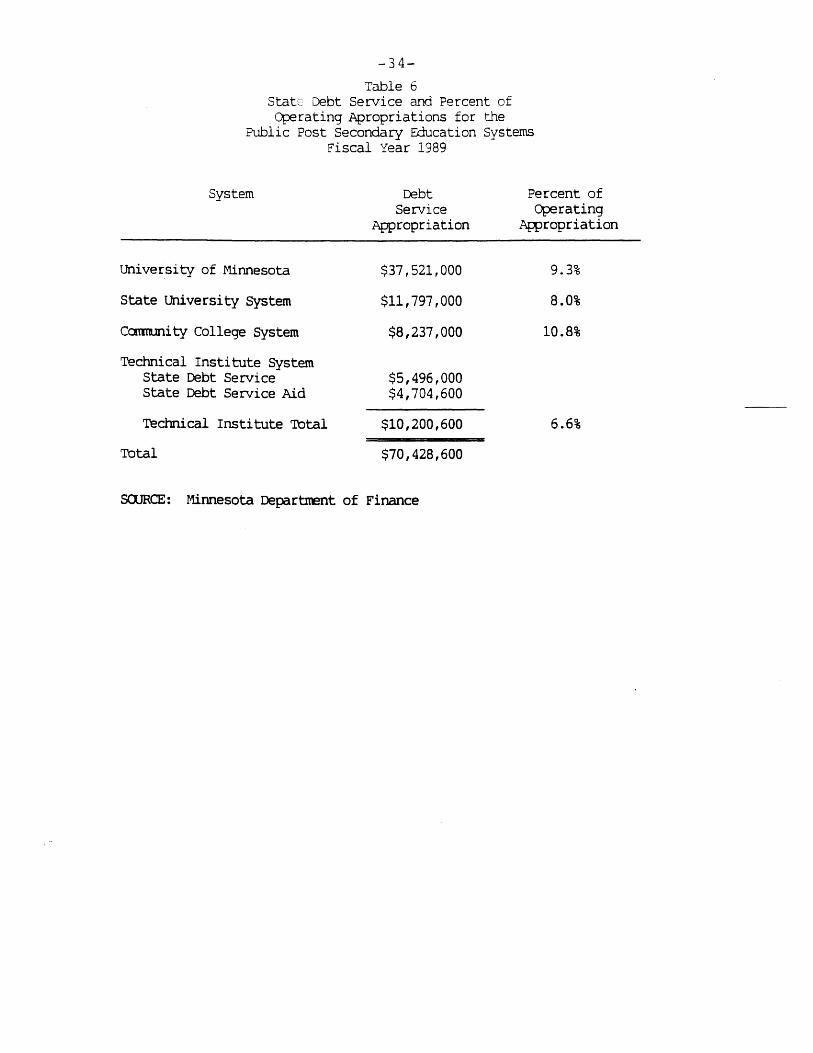
-34-
Table 6 Stat~2 Debt Service and Percent of Cperating Apropriations for the
Public Post Secondary Education Systems Fiscal Year 1989
System Debt Service
Appropriation
Percent of Operating
.Af:propriation
University of Minnesota
State University System
Ccmm.mity College System
Technical Institute System State Debt Service State Debt Service Aid
Technical Institute Total
Total
$37,521,000
$11,797,000
$8,237,000
$5,496,000 $4,704,600
$10,200,600
$70,428,600
SClJRCE: Minnesota Departnent of Finance
9.3%
8.0%
10.8%
6.6%
-35-
"very urgent" (Evangelauf, pp. 1, 20). As a result of the delays,
many institutions will need extensive capital improvements, as
well as increased spending for maintenance. Ninty-nine percent of
the planners responding to the above survey reported that their
institutions would start major construction or renovation projects
in the next five years.
TUITION AND REQUIRED FEE RATES
Recent trends in post-secondary institutions' tuition and
required fee rates are presented in this section. The possible
causes of the trends also are discussed. The Minnesota systems'
data are used to examine trends between 1971 and 1989. The HEGIS
data are used to compare trends for Minnesota institutions with
those of similar institutions in other states.
Systems' Data
This subsection presents data on selected tuition rates and
required fee rates in Minnesota public post-secondary institu
tions.
Tuition Rates. Tuition rates in all four public systems rose
substantially in constant dollars between 1971 and 1989. The
State University and Community College Systems had decreases, and
the University of Minnesota had an increase in constant dollar
tuition rates between 1971 and 1978, as shown in Table 7.
Increases were moderate between 1978 and 1983 and substantial
between 1983 and 1986 in all four public systems. Between 1986
and 1989 the State University and Community College Systems had
slight changes in constant dollar tuition rates while the
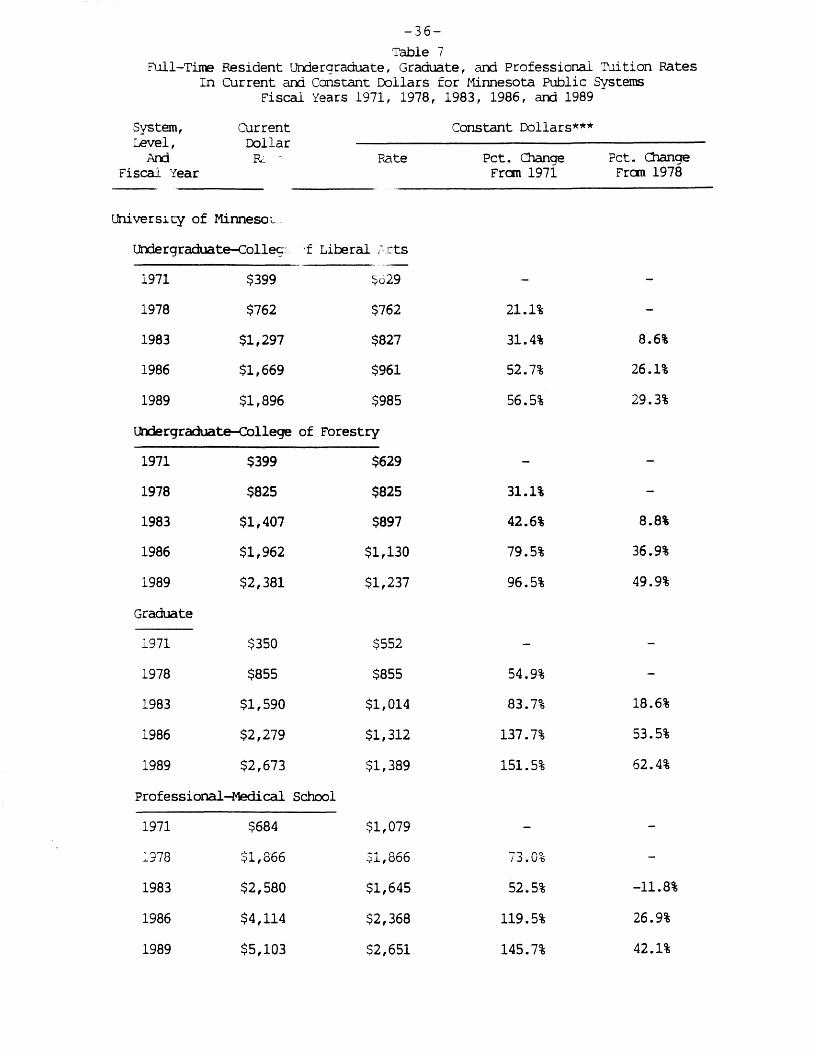
-36-Table 7
Full-Time Resident Urrlergraduate, Graduate, arrl Professional Tuition Fates In current arri Constant Dollars for Minnesota Public Systems
Fiscal Years 1971, 1978, 1983, 1986, arrl 1989
System, Current Constant Dollars*** Level, Dollar
Arrl R,: - Rate Pct. Change Pct. 01.ange Fiscal Year Fran 1971 Fran 1978 -
uni ve rsi cy of Minneso L _
urrlergraduate-colles-· ·f Liberal i- rts
1971 $399 ~o29
1978 $762 $762 21.1%
1983 $1,297 $827 31.4% 8.6%
1986 $1,669 $961 52.7% 26.1%
1989 $1,896 $985 56.5% 29.3%
U"rlergraduate-college of Forestry
1971 $399 $629
1978 $825 $825 31.1%
1983 $1,407 $897 42.6% 8.8%
1986 $1,962 $1,130 79.5% 36.9%
1989 $2,381 $1,237 96.5% 49.9%
Graduate
1971 $350 $552
1978 $855 $855 54.9%
1983 $1,590 $1,014 83.7% 18.6%
1986 $2,279 $1,312 137.7% 53.5%
1989 $2,673 $1,389 151.5% 62.4%
Professional-Medical School
1971 $684 $1,079
:_973 $1,866 $1,866 73.0%
1983 $2,580 $1,645 52.5% -11.8%
1986 $4,114 $2,368 119.5% 26.9%
1989 $5,103 $2,651 145.7% 42.1%
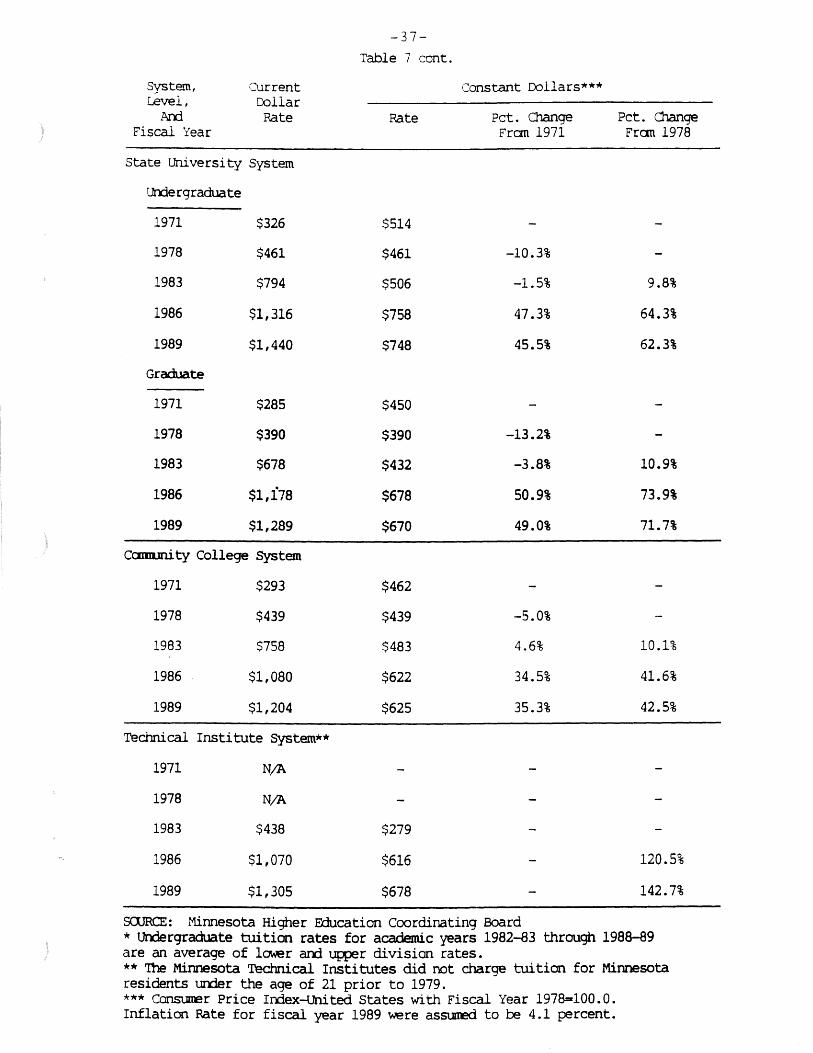
-37-Table 7 cont.
System, current Constant Dollars*** Level, Collar
Arrl Rate Rate Pct. Change Pct. Change Fiscal Year Fran 1971 Fran 1978
State university System
urrlergraduate --1971 $326 $514
1978 $461 $461 -10.3%
1983 $794 $506 -1.5% 9.8%
1986 $1,316 $758 47.3% 64.3%
1989 $1,440 $748 45.5% 62.3%
Graduate
1971 $285 $450
1978 $390 $390 -13.2%
1983 $678 $432 -3.8% 10.9%
1986 $1,i78 $678 50.9% 73 .. 9%
1989 $1,289 $670 49.0% 71.7%
CCIIID.Jru. ty College System
1971 $293 $462
1978 $439 $439 -5.0%
1983 $758 $483 4.6% 10.1%
1986 $1,080 $622 34.5% 41.6%
1989 $1,204 $625 35.3% 42.5%
Technical Institute System**
1971 N,I.A
1978 N,1.A
1983 $438 $279
1986 $1,070 $616 - 120.5%
1989 $1,305 $678 - 142.7%
sa.JRCE: Minnesota Higher Frlucation Coordinating Board * t.Jooergraduate tuition rates for academic years 1982-83 through 1988-89 are an average of lower arrl ~r di vision rates. ** 'Ihe Minnesota Technical Institutes did not charge tuition for Minnesota residents un:ier the age of 21 prior to 1979. *** ~r Price Irrlex-united States with Fiscal Year 1978=:zlOO.O. Inflation Fate for fiscal year 1989 were asSt.m:!d to be 4.1 percent.
-38-
University of Minnesota and the Technical Institute System had
moderate increases.
The tuition increases in all but on'" ~ublic system exceeded
increases in Minnesota per capita perE _ income between 1971 and
1989. Per capita personal income re ~7.0 percent in constant
dollars during that period. The tu ~on increase of 35.3 percent
in the Community College System was slightly less than the
increase in income. Undergraduate increases in other systems
exceeded income by 8.5 to 59.5 percent. Graduate and professional
increases exceeded income by 12.0 to 114.5 percent.
State University and Community College System tuition
decreases between 1971 and 1978 appear to have been the result of
constant dollar increases in the level of stat~ appropriations per
student (MHEC_ 1978, p. A16). The increases in state appropria-
tions allowed ,ending levels to increase while tuition rates
decreased in constant dollars.
Moderate constant dollar increases in tuition rates between
1978 and 1983 in all four public systems were likely due to the
state's fiscal crises. The systems increased tuition at rates
that were higher than inflation in response to several reductions
in appropriations during the early 1980s. In Fiscal Year 1982,
tuition rates in some systems were increased during the academic
year in response to a mid-,,ear appropriations reduction. The
tuition increases allowed he systems to recover some of the lost
revenue. Technical institute tuition rates were first established
in 1979 for state residents under 21 years of age.
-39-
The new state tuition policy caused substantial constant
dollar tuition increases between 1983 and 1986 in all four
systems. The policy called for students in each system to finance
a higher and more uniform percentage of the operating cost of
instruction. The additional tuition revenue allowed higher system
instructional spending levels.
The size of the increases between 1983 and 1986 varied among
the systems and by level of instruction as a result of previous
differences in the proportion of instructional costs financed by
tuition and in system tuition policies. The State University
System and the Technical Institute System had smaller percentages
of instruction financed by tuition than the other systems in 1983.
As a consequence, these systems had to raise their tuition rates
more to reach expected levels of tuition revenue. The University
of Minnesota adopted a system tuition policy that moves tuition·
rates for all collegiate units toward the system relationship of
tuition to instructional cost. The consequence has been higher
tuition increases in units with higher costs of instruction.
Differences in constant dollar tuition rate changes between
1986 and 1989 resulted from enrollment increases, system tuition
policies, and a change in state tuition policy. The enrollment
increases in the State University System and Community College
System allowed those systems to adopt smaller increases in tuition
rates and still generate the expected level of tuition revenue.
Some undergraduate, graduate and professional rates at the
University of Minnesota have increased more rapidly than others
because of the system tuition policy discussed above. Tuition
-40-
rates in the Technical Institute System increased in constant
dollars between 1986 and 1989 as a result of an increase in the
percentage of instruction expected to be financed by tuition
revenue.
Required Fees. Undergraduate required fee rates decreased in
constant dollars between 1971 and 1989. The decreases ranged from
6.7 percent to 44.6 percent, as shown in Table 8. These fees
generally finance expenditures for student activities or services
that are not part of the operating cost of instruction. Examples
of functions supported by required fees include student unions,
student health services, student publications, and recreational
sports. The decreases in required fees suggest that expenditures
for student activities have risen more slowly than consumer
prices.
HEGIS Data
This subsection presents data on trends in average undergrad
uate and graduate tuition and fee rates for Minnesota and other
u. S. public post-secondary institutions in each of five classifi
cations.
Average Tuition Rates. Public tuition and fee rates in
Minnesota and similar non-Minnesota institutions decreased in
constant dollars between 1978 and 1982, as shown in Table 9. The
decreases in Minnesota institutions ranged from 2.8 to 11.1
percent. The non-Minnesota decreases ranged from 3.4 to 12.3
percent.
Although tuition and fee rates for all Minnesota and non
Minnesota classifications rose in constant dollars between 1982
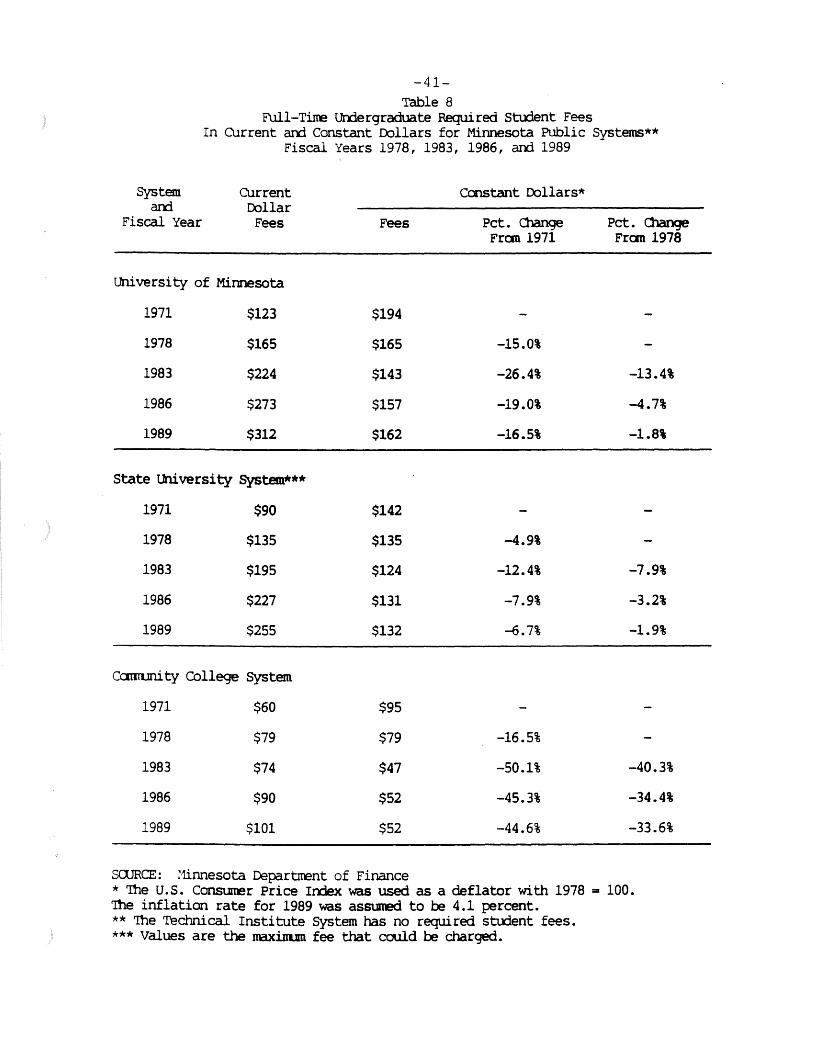
-41-Table 8
F\I.11-Tirre Urxiergraduate Required St:u:ient Fees In current arrl Constant D:>llars for Minnesota Public Systems**
Fiscal Years 1978, 1983, 1986, arx:i 1989
System current coostant D:>llars* arrl D:>llar
Fiscal Year Fees Fees Pct. Cl1ange Pct. Cl1ange Fran 1971 Fran 1978
university of Minnesota
1971 $123 $194
1978 $165 $165 -15.0%
1983 $224 $143 -26.4% -13.4%
1986 $273 $157 -19.0% -4.7%
1989 $312 $162 -16.5% -1.81
State lruversity System"**
1971 $90 $142
1978 $135 $135 -4.9%
1983 $195 $124 -12.4% -7.9%
1986 $227 $131 -7.9% -3.2%
1989 $255 $132 -6.7% -1.9%
Ccnm.mity College System
1971 $60 $95
1978 $79 $79 -16.5%
1983 $74 $47 -50.1% -40.3%
1986 $90 $52 -45.3% -34.4%
1989 $101 $52 -44.6% -33.6%
sa.JRCE: Minnesota Depart:nent of Finance * 1he U.S. COI1Sl.lller Price Irxiex was used as a deflater with 1978 = 100. 1he inflation rate for 1989 was assuned to be 4.1 percent. ** 'Ihe Technical Institute System has no required stu:ient fees. *** Values are the maxinum fee that could be charged.

-42-Table 9
Average Full-Time Resident Un:iergraduate arrl Graduate 'I\Jition and Required Fees
In Constant D:>llars* Minnesota Public Institutions arrl Other Public Institutions in the United States
By Institutional Classification Fiscal Years 1978, 1982, and 1985
Minnesota Ncn-Minnesota Institutiooal Classificatioo
AD:i Fiscal Year 'l\J.i ti 00
arrl Fees
RESEMOi lNIVERSITIES-U'rlergraduate
1978
1982
1985
$1,566
$1,420
$1,800
RESEMOi t.NIVERSITIES-Graduate
1978
1982
1985
$1,723
$1,670
$2,412
CCJ'1PREHENSIVE INSI'I'IUI'ICNS-U'ldergraduate
1978 $1,101
1982 $979
1985 ..;,l,490
CCJ'1PREHENSIVE INSI'I'IUI'ICN.S-Graduate
1978 $1,169
1982 $1,055
1985 $1,503
Pct. C ··ange Fran ~.978
-9.3%
15.0%
-3.1%
40.0%
-
-11.1%
35.3%
-
-9.7%
28.6%
GENERAL~ INSTI'IUI'ICNS-Urx:lergraduate
1978
1982
1985
$1,128
$1,029
$1,495
-8.8%
32.5%
'I\litioo an:i Fees
$1,243
$1,164
$1,423
$1,365
$1,300
$1,636
$1,005
$897
$1,072
$1,140
$1,000
$1,207
$1,039
$966
$1,143
Pct. <llange Fran 1978
-6.4%
14.5%
-4.8%
19.9%
-10.8%
6.7%
-12.3%
5.9%
-7.0%
10.0%
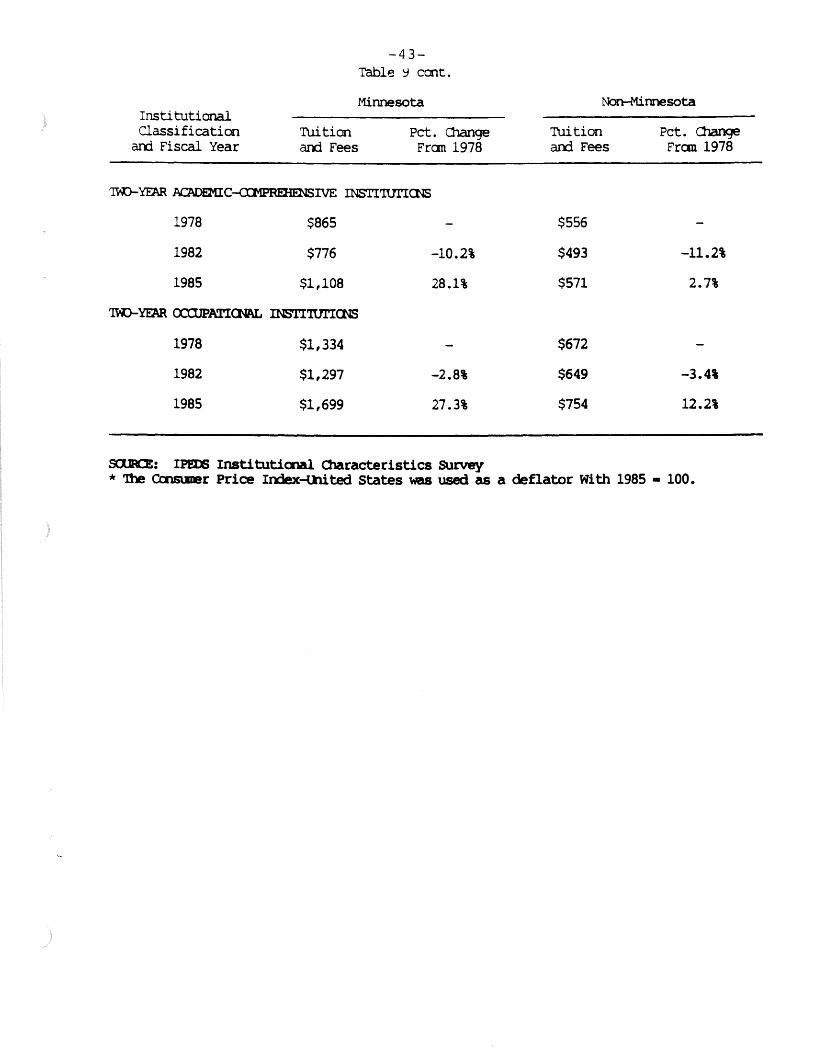
-43-Table '3 cont.
Minnesota Institutional Classification
arrl Fiscal Year Tuition arrl Fees
Pct. Cl1ange Fran 1978
'IID-~ ACADEMIC--a:J1PREHENSIVE INSTI'IUI'ICNS
1978 $865 -
1982 $776 -10.2%
1985 $1,108 28.1%
'IID-YFAR CXXl.JPATirnM, INSI'I'IUl'ICNS
1978 $1,334 -1982 $1,297 -2.8%
1985 $1,699 27.3%
sa.Kl!:: IPl!nS Institutiooal <llaracteristics survey
Non-Minnesota
Tuition arrl Fees
$556
$493
$571
$672
$649
$754
Pct. 01ange Fran 1978
-11.2%
2.7%
-3.4%
12.2%
* 'Ihe Coos\loer Price In:lex-u:li ted states was used as a deflater With 1985 • 100.
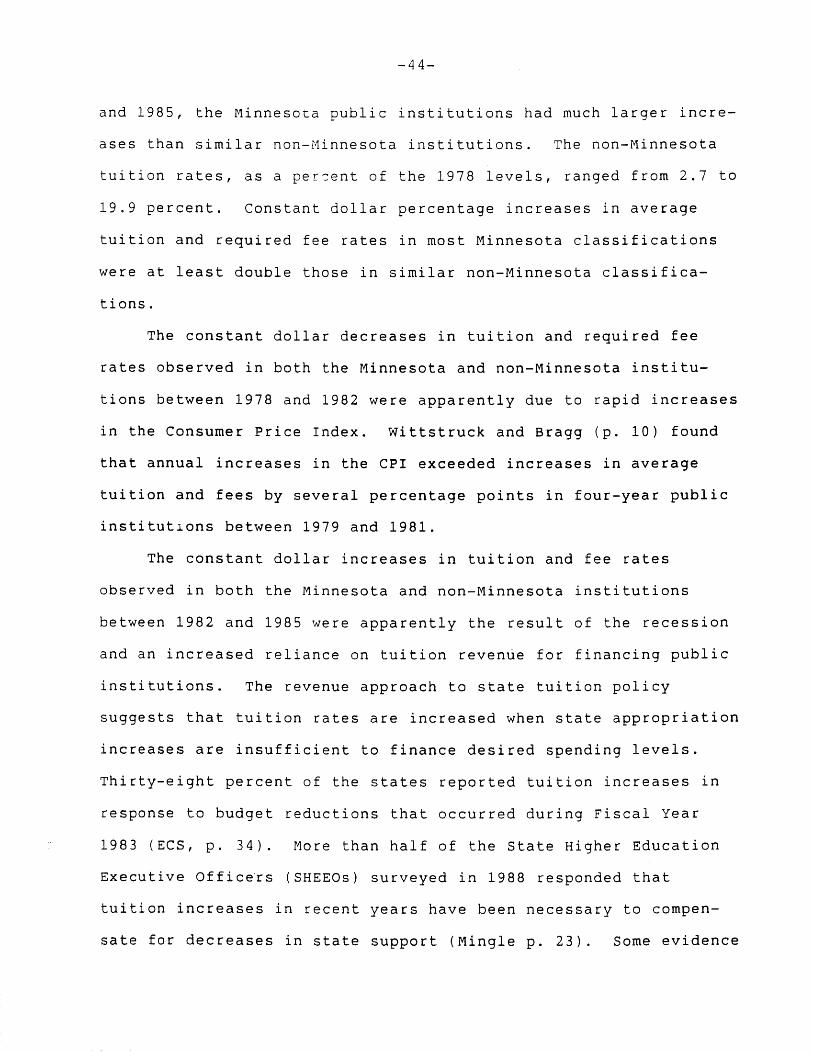
-44-
and 1985, the Minnesota public institutions had much larger incre
ases than similar non-Minnesota institutions. The non-Minnesota
tuition rates, as a per~ent of the 1978 levels, ranged from 2.7 to
19.9 percent. Constant dollar percentage increases in average
tuition and required fee rates in most Minnesota classifications
were at least double those in similar non-Minnesota classifica
tions.
The constant dollar decreases in tuition and required fee
rates observed in both the Minnesota and non-Minnesota institu
tions between 1978 and 1982 were apparently due to rapid increases
in the Consumer Price Index. Wittstruck and Bragg (p. 10) found
that annual increases in the CPI exceeded increases in average
tuition and fees by several percentage points in four-year public
institutions between 1979 and 1981.
The constant dollar increases in tuition and fee rates
observed in both the Minnesota and non-Minnesota institutions
between 1982 and 1985 were apparently the result of the recession
and an increased reliance on tuition revenue for financing public
institutions. The revenue approach to state tuition policy
suggests that tuition rates are increased when state appropriation
increases are insufficient to finance desired spending levels.
Thirty-eight percent of the states reported tuition increases in
response to budget reductions that occurred during Fiscal Year
1983 (ECS, p. 34). More than half of the State Higher Education
Executive Office·rs (SHEEOs) surveyed in 1988 responded that
tuition increases in recent years have been necessary to compen
sate for decreases in state support (Mingle p. 23). Some evidence
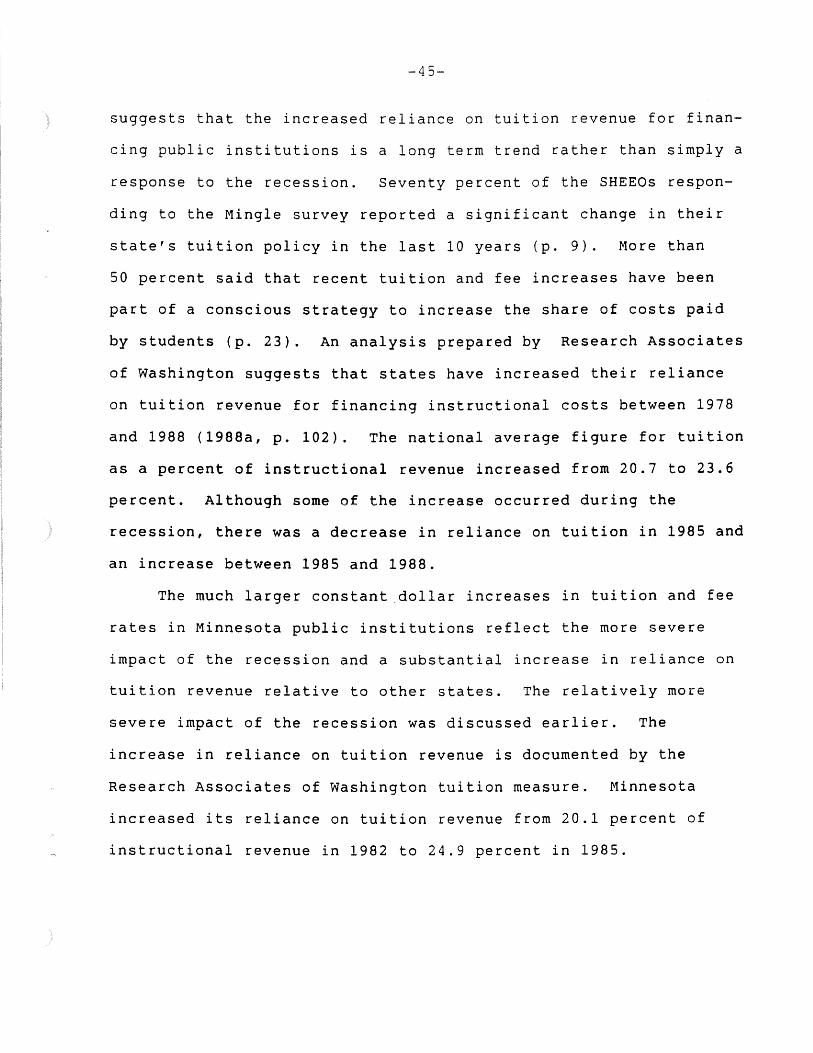
-45-
suggests that the increased reliance on tuition revenue for finan
cing public institutions is a long term trend rather than simply a
response to the recession. Seventy percent of the SHEEOs respon
ding to the Mingle survey reported a significant change in their
state's tuition policy in the last 10 years (p. 9). More than
50 percent said that recent tuition and fee increases have been
part of a conscious strategy to increase the share of costs paid
by students (p. 23). An analysis prepared by Research Associates
of Washington suggests that states have increased their reliance
on tuition revenue for financing instructional costs between 1978
and 1988 (1988a, p. 102). The national average figure for tuition
as a percent of instructional revenue increased from 20.7 to 23.6
percent. Although some of the increase occurred during the
recession, there was a decrease in reliance on tuition in 1985 and
an increase between 1985 and 1988.
The much larger constant _dollar increases in tuition and fee
rates in Minnesota public institutions reflect the more severe
impact of the recession and a substantial increase in reliance on
tuition revenue relative to other states. The relatively more
severe impact of the recession was discussed earlier. The
increase in reliance on tuition revenue is documented by the
Research Associates of Washington tuition measure. Minnesota
increased its reliance on tuition revenue from 20.1 percent of
instructional revenue in 1982 to 24.9 percent in 1985.
-46-
FINANCIAL AID
~ecent trends in undergraduate need-based financial aid are
esented in this section. Coore ating Board data were used to
~- 1mine trends between Fiscal Ye~._ 1979 and 1988. Data collected
by the National Association of State Scholarship and Grant Pro
grams (NASSGP) were used to compare trends in the Minnesota State
Scholarship and Grant Program with trends in all state programs.
Coordinating Board Data
The constant dollar increase in aggregate undergraduate
financial aid awards greatly exceeded enrollment increases between
Fiscal Years 1979 and 1988. The increases in awards ranged from
42.2 to 205.6 percent while changes in undergraduate fall head
count enrollments ranged from -3.4 to 117.3 percent, as shown in
Table 10. The financial aid increases reflect the redesign of the
State Scholarship and Grant Program and the significant funding
increases that were implemented in 1984 and 1985 to offset tuition
increases. As a consequence of these changes, the initial tuition
increases were offset for most full-time undergraduate students
from lower and lower middle income families (MHECB, 1985, pp.
81-8). The net effect of the change in tuition and financial aid
policies was to expect students from middle and upper income
families to pay a larger share of the operating cost of instruc
tion.
National Association of State Scholarship and Grant Programs Data
Constant dollar total awards in state scholarship and grant
programs, both in Minnesota and in the United States, decreased
between 1979 and 1983 and increased between 1983 and 1988.
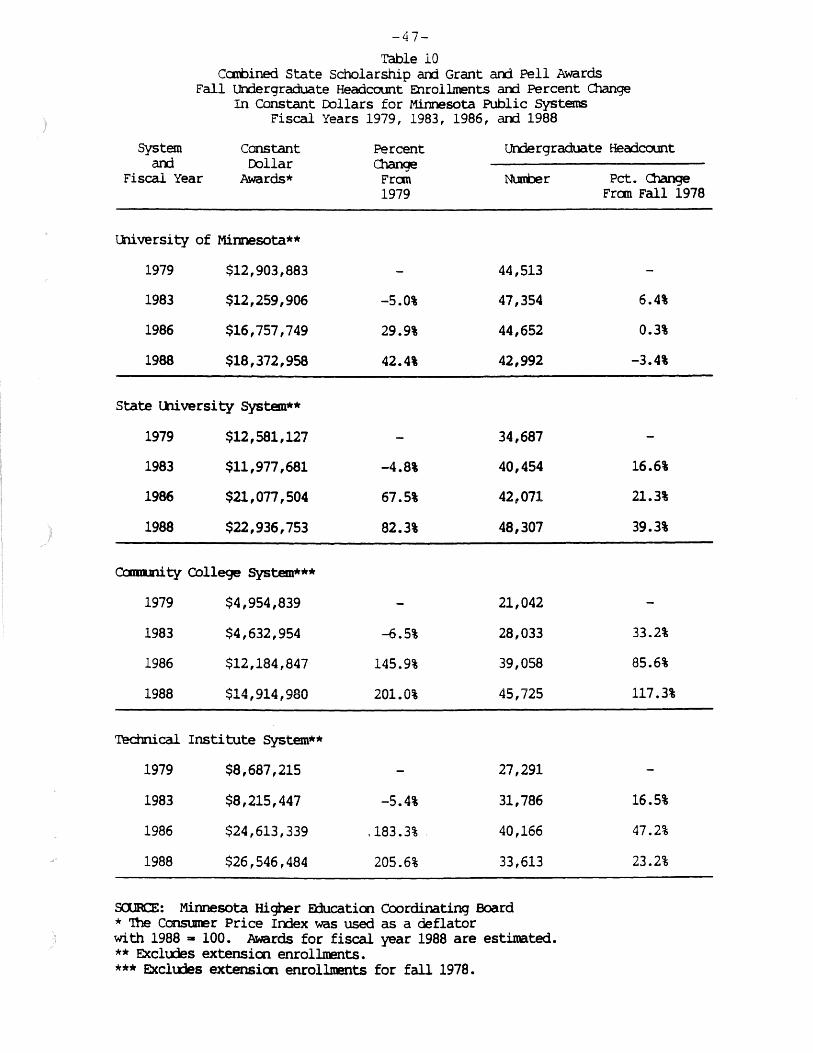
-47-
Table 10 CCIIt)ined State Scholarship arrl Grant arrl Pell Awards
Fall Urrlergraduate HeadCOlll'lt Enrollments arxi Percent Cl1ange In Constant Ix>llars for Minnesota Public Systems
Fiscal Years 1979, 1983, 1986, arxi 1988
System arx:i
Fiscal Year
Constant tx>llar
Awards*
Percent urrlergraduate Headcount
Uliversity of Minnesota**
1979 $12,903,883
1983 $12,259,906
1986 $16,757,749
1988 $18,372,958
State Uliversity System**
1979 $12,581,127
1983 $11,977,681
1986 $21,077,504
1988 $22,936,753
CcmllJni.ty College System***
1979 $4,954,839
1983 $4,632,954
1986 $12,184,847
1988 $14,914,980
Technical Institute System**
1979 $8,687,215
1983 $8,215,447
1986 $24,613,339
1988 $26,546,484
Cl1ange Fran 1979
--5.0%
29.9%
42.4%
--4.8%
67.5%
82.3%
--6.5%
145.9%
201.0%
-
-5.4%
.183.3% .
205.6%
Nurrt)er
44,513
47,354
44,652
42,992
34,687
40,454
42,071
48,307
21,042
28,033
39,058
45,725
27,291
31,786
40,166
33,613
sa.JRCE: Minnesota Higher Fducatioo Coordinating Board * '!he Consuner Price Index was used as a deflater with 1988 =- 100. Awards for fiscal year 1988 are estimated. ** Excluies extensioo enrollments. *** Excluies extensioo enrollnents for fall 1978.
Pct. Olange Fran Fall 1978
6.4%
0.3%
-3.4%
16.6%
21.3%
39.3%
33.2%
85.6%
117.3%
16.5%
47.2%
23.2%
-48-
Between 1979 and 1983, total awards in Minnesota decreased by 8.0
percent while total u. s. awards decreased by 15.2 percent, as
shown in Table 11. Minnesota total awards increased significantly
between 1983 and 1988, reaching 60.0 percent of the 1979 level.
Total u. S. awards rose substantially from the low point in 1983,
reaching 6.4 per~ent above 1979 levels by 1988.
The number of awards in state ~cholarship and grant programs,
rose dramatically in Minnesota and modestly in the United States
between 1979 and 1988. Minnesota awards rose by 117.4 percent
while U. S. awards rose by 7.9 percent.
The trends observed in state scholarship and grant programs
between 1979 and 1988 were likely the result of rapid inflation,
the economic recession, state financial aid policy changes, and
significant funding increases in some state programs. The
constant dollar decreases in total awards between 1979 and 1983
were probably due to the effects of the recession on state
spending and the rapid inflation that occurred between 1979 and
1982. The significant increases in number of awards and total
awards in Minnesota resulted from the redesign of the state
program and the increases in funding discussed above. The growth
observed in United States total awards between 1983 and 1989
appears to be, in part, the result of significant growth in
several of the largest state programs. Nine of the 13 largest
state programs grew by 84 percent between 1983 and 1988 (Reeher
and Davis, p. 134).
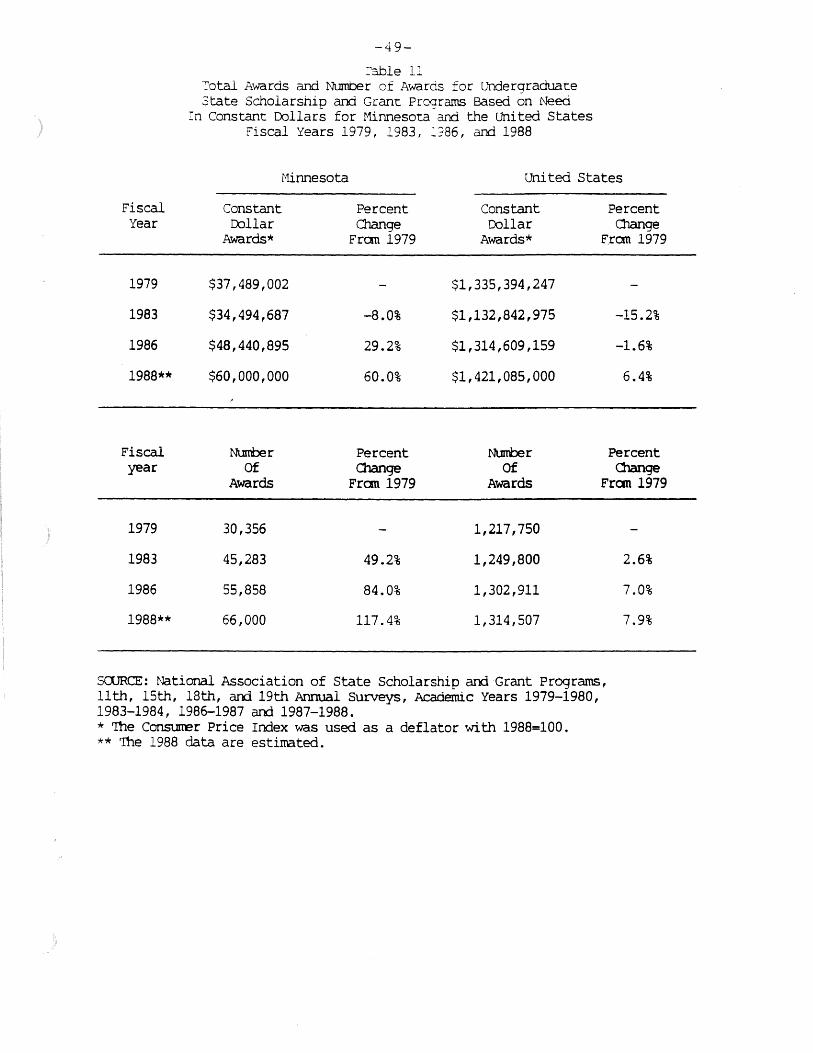
-49-
-=:'3.ble 11 -:'.:'otal Awards and Number of Awards for Undergraduate 3tate Scholarship and Grant Pro:;rams Based on Need
:=n Constant collars for Minnesota and the United States Fiscal Years 1979, 1983, :?86, and 1988
Minnesota united States
Fiscal Constant Percent Constant Percent Year collar Ola11ge Dollar Change
Awards* Fran 1979 Awards* F.rcm 1979
1979 $37,489,002 - $1,335,394,247
1983 $34,494,687 -8.0% $1,132,842,975 -15.2%
1986 $48,440,895 29.2% $1,314,609,159 -1.6%
1988** $60,000,000 60.0% $1,421,085,000 6.4%
Fiscal Number Percent Nurrt.er Percent year Of dlange Of 01ange
Awards Fran 1979 Awards Fran 1979
1979 30,356 - 1,217,750
1983 45,283 49.2% 1,249,800
1986 55,858 84.0% 1,302,911
1988** 66,000 117.4% 1,314,507
saJRCE: National Association of State Scholarship and Grant Programs, 11th, 15th, 18th, ar-rl 19th Annual surveys, Academic Years 1979-1980, 1983-1984, 1986-1987 and 1987-1988. * 'Ihe Consurrer Price Index was used as a deflator with 1988=100. ** 'Ihe 1988 data are estimated..
2.6%
7.0%
7.9%

-50-
FINDINGS AND CONCLUSIONS
Two objectives cf this study were to examine recent trends in
post-secondary instit tions' operating cost of instruction,
tuition rates, and financial aid and to explain the reasons for
the observed trends. The analysis found that post-secondary costs
in Minnesota public systems have decreased in constant dollars,
and that tuition rates and financial aid awards increased substan
tially in constant dollars. Several reasons for the trends were
discussed. The impacts of the trends on the quality and amount of
instructional and support services were not assessed. Specific
findings and conclusions regarding cost and tuition trends
included the following:
Cost Trends
o The prices of goods and services purchased by post-secondary institutions grew much faster than prices in the U. S. economy and slightly faster than the prices of consumer goods and services between 1978 and 1989.
o Minnesota per capita personal income grew more rapidly than the consumer and higher education prices be ~een 1978 and 1989.
o Constant dollar costs per student in the Minnesota public systems decreased between 1978 and 1983. The decreases were due primarily to state funding policies, the state's fiscal crises, and double digit inflation.
o Constant dollar costs per student in the public systems returned to 1978 levels by 1986. The increases were apparently the result of a change in state financing policies and stable or declining enrollments.
o Constant dollar costs per student in the public systems decreased in three systems after 1986. The decreases since 1986 apparently were caused by enrollment increases and the two year lag in the funding policy.
o Minnesota public institutions generally had larger decreases in constant dollar expenditures per student than similar nonMinnesota institutions between 1978 and 1983. The larger

-51-
decreases in Minnesota were probably due to the more severe effect of the recession on the state and a state funding policy that did not provide substantial additional state appropriations for enrollment growth.
o Expenditures for support programs including academic support, student services, institutional support, and physical plant operations, have constituted an increasing proportion of the operating cost of instruction in the State University System and Community College System.
o A national study found that post-secondary student services and institutional support costs rose more rapidly than educational and general costs. The provision of more and better services, the use of more sophisticated and specialized management and finance staff, and compliance with increased government requirements were reasons suggested to explain the increases.
o Debt service for the public systems constitutes a substantial proportion of the state's support for post-secondary education. Capital costs may increase more rapidly in the future as a result of deferred maintenance.
Tuition and Fee Trends
o Tuition increases in all four public systems between 1971 and 1989 exceeded increases in Minnesota per capita personal income.
o Tuition rates in all four Minnesota public systems rose moderately in constant dollars between 1978 and 1983. The moderate increases were due to the state's fiscal crises.
o Tuition rates in all four systems rose substantially in constant dollars between 1983 and 1986. The substantial increases were the result of the new state tuition policy.
o Tuition rates in the public systems rose more slowly between 1986 and 1989 than during earlier periods and the increases varied by system and level of instruction. Variations in tuition rate changes between 1986 and 1989 were the result of enrollment increases, system tuition policies and a change in state tuition policy for the Technical Institute System.
o Required fee rates in the Minnesota public post-secondary systems remained stable or decreased in constant dollars between 1978 and 1989. The decreases suggested that expenditures for student activities rose more slowly than consumer prices.
o Minnesota public institutions had much larger increases than similar non-Minnesota institutions in constant dollar tuition and fee rates between 1982 and 1985. The larger increases
-52-
in Minnesota institutions reflected the more severe impact of the recession on Minnesota and Minnesota's substantial increase in reliance on tuition revenue relative to other states.
o Undergraduate financial aid rose much more rapidly in constant dollars than enrollments between 1980 and 1988. These increases reflected the redesign of the State Scholarship and Grant Program and the significant funding increase that were implemented in 1984 and 1985 to offset tuition increases.
o Constant dollar total awards in state scholarship and grant programs, both in Minnesota and in the United States, decreased between 1979 and 1983. The decreases were likely the result of rapid inflation and the economic recession.
o Constant dollar total awards in state scholarship and grant programs, both in Minnesota and in the United States, increased between 1983 and 1988. The increases were apparently due to state financial aid policy changes and significant funding increases in some state programs.
-33-
FOOTNOTES
Education Commission of the States, Working Paper No. 1, The Effect of State Budget Reductions on Higher Education, Fiscal Year 1982-83. Denver, December 1983.
Evangelauf, Jean, "Construction Boom Seen on Campuses over Next 5 Years," The Chronicle of Higher Education. July 29, 1987.
McKeown, Mary P., Education." 1982.
"The Use of Formulas for State Funding of Higher Journal of Education Finance, Vol. 7, Winter
Mingle, James R. and Catherine Walker, State Incentive Programs for Graduate Education: A Survey of States. State Higher Education Executive Officers, Denver, December 1985.
Minnesota Higher Education Coordinating Board, A Review of Tuition Alternatives for Minnesota Post-Secondary Education. St. Paul, August 18, 1978.
Minnesota Higher Education Coordinating Board, Report to the Governor and 1985 Legislature. St. Paul, 1985.
Reeher, Kenneth R. and Jerry s. Davis, National Association of State Scholarship and Grant Programs 19th Annual Survey Report, 1987-88 Academic Year. Pennsylvania Higher Education Assistance Agency, Harrisburg, January 1988.
Research Associates of Washington, Higher Education Prices and Price Indexes: 1988 Update. Washington, D. C., September, 1988b.
Research Associates of Washington, State Profiles: Financing Public Higher Education 1978 to 1988. Washington, D. C., July, 1988a.
Snyder, Thomas P. and Eva C. Galambos, Higher Education Administrative Costs: Continuing the Study. Office of Education Improvement, United States Department of Education, Washington, D. c., January, 1988.
Wittstruck, John R. and Stephen M. Bragg, Focus on Price Trends in Public Higher Education: Tuition and State Support. Denver, State Higher Education Executive Officers, June, 1988.

-55-
CHAPTER IV. STRATEGIES FOR CONTAINING COSTS AND TUITION RATES
The analysis in this study suggested two broad conclusions.
First, per student costs in three of the Minnesota public post
secondary systems have decreased. Second, although tuition rates
grew rapidly from 1978 to 1986, increased state and federal
financial aid helped offset those increases, and the rate of
increase in tuition has slowed since 1986. These trends do not
suggest the need for additional state measures to contain growth
in costs and tuition rates.
Several factors do, however, suggest the need for a review of
strategies that are or could be used to contain growth in costs
and tuition rates. Continued upward pressure on costs is reason
ably certain. All four public systems are requesting increases,
some substantial in their base spending levels. They cite reasons
such as the need to regain lost spending power in faculty salar
ies, the need to provide more and better instructional and support
services to a more diverse student body, and the need to upgrade
instructional equipment. Meanwhile, there is continued pressure
to restrain increases in state spending and tuition. Efforts to
raise taxes meet with resistance. System and student representa
tives argue against significant tuition rate increases. The
state's current level of support for public post-secondary educa
tion, relative to its available resources, ranks above the nation
al average (Research Associates of Washington, 1988b, p. 60). The
state's level of support on a per student basis, however, is equal
to the national average and has decreased in the last ten years.
-56-
The state's high level of taxation and the perennial efforts to
hold down taxes raise questions about the state's ability to
provide substantial increases in support. These conflicting trends
s u g g e s t that ad .... ~ t i on, :.. r even u e s may n c c be s u f f i c i en t to f i nan c e
desired spending increases.
This chapter identifies several strategies that the state and
in some instances, the systems and institutions currently do use
or could use to contain growth in post-secondary costs and tuition
rates.
COST CONTAINMENT DEFINED
Cost containment may be one way to provide expanded and/or
improved post-secondary education services if sufficient addition-
al revenues ~re not available. Cost containment is defined in
this paper as the operation of an activity with a lower level of
expenditures than was previously the case, without altering the
volume or quality of the activity. The lower expenditures are the
result of changes in the way the activity is conducted. The lower
level of expenditures resulting from a cost containment activity
may mean that the institution, system, or state spends less in
total than it otherwise would have spent. Alternatively, the
revenues made available by lower spending for one purpose may be
used for other post-secondary education purposes within the
institution, the system, or the state. The restraining influence
of cost containment on expenditures also would be reflected in
tuition rates.
-S7-
STRATEGIES FOR CONTAINING COSTS AND TUITION RATES
The health care sector of the economy has made extensive
efforts to contain costs. Morgan argues that the health care cost
containment experience provides insights that are useful for post
secondary education (p. 279). He cites similarities between post
secondary institutions and hospitals in organization, goals, and
incentives. Morgan identifies three broad strategies used in
health care cost containment that may suggest approaches to post
secondary education cost containment. They include coordination
and planning, regulatory strategies, and market strategies. A
fourth strategy is the use of incentives to encourage cost
containment efforts (Ohio Board of Regents, p. 9). The strategies
can be pursued through several programs or efforts, some with the
specific objective of influencing costs and others with broader
objectives. Although the strategies are discussed in terms of
state level application, many also could be pursued at system or
institutional levels. The strategies are described and examples
of how they are or might be pursued are discussed in this subsec
tion.
Central Planning and Coordination
This strategy uses central planning and coordination to
influence post-secondary costs and ultimately tuition rates. The
objective is to alter patterns of resource use and the nature,
extent, number, and distribution of post-secondary instructional
and support programs. Planning, program review, and budget review
are examples of efforts that could be used to pursue this
strategy.
/fl
-58-
Planning. Central planning in the health care sector consis
ted of developing statewide policies and priorities, which served
as a guic•line for preparation and review of regional plans. The
regional la1 in turn were used in r; wing proposed capital
expenditures. The objectives of the nning process were to
avoid duplication of facilities and c equently promote cost
containment (Morgan, pp. 244-5). As ,nilar state level planning
process could be added to the capital budgeting process for the
public post-secondary systems. Existing system level reviews of
capital budget requests could be coordinated with the state plan.
To the extent that the process reduced duplication and improved
resource use, capital costs, operating costs, and ultimately
tuition rates could be contained. According to Morgan, however,
planning has had limited success containing health care costs and
consequently is losing favor as a cost containment approach (p.
291).
Program Review. State level post-secondary program review
typically consists of a process that examines proposed or current
academic instructional programs. The process usually is organized
under a state coordinating board. The Coordinating Board's
program review function examines, and approves or disapproves
proposed and existing instructi7nal progr3ms. The process deter
mines if the programs duplicate others and if they are consistent
with the system or institution's capabilities and mission. System
governing boards review and must give tentative approval to
proposed programs prior to their submission to the Coordinating
Board's process. Advocates of program review contend that the

-59-
process helps to reduce program duplication and therefore contain
post-secondary costs. Its effectiveness may not come as much
through program decisions as through the effect that the existence
of the process has on system and institutional planning.
Budget Review. State level post-secondary budget review
typically consists of a formal role for the state coordinating
board in the state budget process. The role may be advisory or it
may be the development of the executive budget recommendations for
post-secondary education. In many ways, the state level budget
review role is analogous to the system board's role. The primary
objective of a budget review function is to influence gubernator
ial and legislative funding decisions and ultimately the levels
and distribution of system funding. One outcome of this influence
could be more effective resource use and cost containment.
Although the Coordinating Board has budget review authority, it
has not exercised this authority in the context of the state's
biennial budget process. The effectiveness of budget review in
constraining post-secondary costs is uncertain.
Regulatory Strategy
This strategy uses mandates and regulations to influence
post-secondary costs and consequently tuition rates. Fiscal
limitations, peer reviews, and mandated cost containment efforts
are examples of regulatory strategies.
Fiscal Limitations. Fiscal limitations influence or mandate
maximum levels of or maximum changes in post-secondary expendi
tures or funding. The limits may be applied in the aggregate or
at some level of disaggregation. They are typically part of a

-60-
funding policy and serve to limit funding liability. Such limita
tions also could be used by the systems on institutional spending
and by institutions on unit spending.
The amount of state appropriations for instruction provided
by the legislature to the Minnesota public systems has substantial
influence over the level of instructional spending and conse
quently tuition revenue and rates. The level of appropriations
for instruction is determined by the average cost funding policy
and decisions on other instructional spending requests. The level
of state appropriations together with expected tuition revenue
establishes an instructional spending level. That level is the
maximum that will be recognized for funding in the following
biennium. The policy takes that maximum as a starting point and
allows certain expenditure changes. The changes are those that
result from changes in the volume and mix of instruction by level
and program cost category and changes in price. Additional
changes in the level of expenditures must be justified separately.
This limitation clearly serves to contain growth in public post
secondary costs that are funded by the state. The limitation's
effects on total costs and tuition rates are less direct.
Although additional instructional expenditures may be incurred,
other sources of revenue must be secured to finance them. Tuition
revenue may be raised in excess of expected levels, but there
could be adverse political consequences if such increases became a
routine practice.
Incremental appropriation reductions are another means of
influencing levels of post-secondary spending. Minnesota used
-61-
this strategy during its fiscal crises in the early 1980s.
Although the incremental reductions did contain or reduce
expenditures, they also shifted more responsibility for funding
expenditures to students.
Peer Reviews. This approach would call for reviews of
resource allocation decisions by a group of peers. The objective
is to contain costs and ultimately tuition rates by influencing
resource use. Peer review was used extensively for cost
containment in health care. Peers would review decisions about
the type and extent of health care provided by hospitals. Morgan
suggested the accreditation process and peer involvement in
program review as prototypes for a peer based review of post
secondary programs and costs. Such reviews may risk conflict with
system, institutional, and faculty prerogatives.
Mandated Cost Containment. This approach would require post
secondary systems or institutions to develop and implement efforts
to contain their costs. The mandate might specify the dedication
of resources to develop containment efforts. Alternatively, the
mandate might specify amounts of savings to be generated. A third
option would be to specify specific measures to be implemented.
While this approach conceivably could contain costs, it is not
consistent with generally accepted views of state and system roles
in Minnesota post-secondary education. The state role is primar
ily funding and establishing policy. The system and institutional
role is managing institutional operations.
-62-
Market Strategy
This strategy calls for the use of increased market forces on
post-secondary institutions in order to influe~ce their costs.
The strategy seeks to increase competition among post-secondary
institutions by increasing the number of students who are able to
enroll, expanding their choices among institutions, and making
them more sensitive to price. Examples include financial aid and
cost related tuition.
Financial Aid. Need-based financial aid provides access to
post-secondary education for more individuals and allows them
greater choice among public and private institutions and programs.
This expansion in the number of students and in their opportuni
ties increases the competitive forces on institutions. The insti
tutions have increased incentives to offer the best possible
programs for the best prices. The federal Pell Grant Program and
Minnesota's Scholarship and Grant Program are examples of the use
of financial aid to increase market forces on institutions. The
effectiveness of financial aid in constraining costs and tuition
rates is uncertain. Some even argue that the result of financial
aid is higher post-secondary costs and tuition rates, since
increases can more easily be passed along.
Cost Related Tuition. This approach calls for students in
public institutions to pay a larger share of the cost of providing
instruction and for tuition rates to more accurately reflect
differences in the cost of providing instruction. Paying a larger
share of the costs makes students more sensitive to price. Rela
ting price to cost helps students compare the relative benefits of
~-----------------------------------------------

-63-
programs with their relative costs. This greater sensitivity to
price and price differences presumably provides systems and insti
tutions an incentive to restrain growth in costs and consequently
tuition. Minnesota's tuition policy relates price to cost at the
system level and expects students to pay a larger share of costs
than they did previously. The University of Minnesota Board of
Regents has implemented a similar policy for individual collegiate
units. The effectiveness of this tuition policy in constraining
growth in costs and tuition rates in the long run is uncertain.
Some also might argue that the increased competition may lead to
higher costs as a result of additional programs and services added
by institutions in order to compete.
Incentive Strategy
This strategy calls for the provision of incentives, usually
financial, to encourage systems and institutions to engage in cost
containment efforts. The incentive may take the form of funds
provided for the support of cost containment efforts in general or
to support specific projects. Alternatively, systems and institu
tions might be allowed to retain savings generated through cost
containment efforts. The latter provision is part of the state's
financing policy for the public post-secondary systems. The
systems retain funds left unexpended at the end of a biennium.
Some systems have extended this provision to the institutional
level. The effectiveness of this strategy in constraining growth
in costs and tuition rates in the long run is uncertain.

-64-
CONCLUSIONS
Four broad strategies to contain post-secondary costs and
tuition rates have been described. Minr.:sota has a program or
mechanism in place that uses each strat~JY• The Coordinating
Board's program review process serves as a planning and coordina
tion strategy, and its budget review process could serve a similar
purpose. The fiscal limitations that are part of the state's
financing policy for the public post-secondary systems, a regula
tory strategy, is probably the most effective method available to
influence costs and tuition rates. The state's financial aid and
tuition policies contain aspects of the market strategy for
influencing costs and tuition rates. Finally, the provision that
allows systems to retain unexpended funds is an example of the
incentive strategy.
FOOTNOTES
Morgan, Anthony w., "Cost as a Policy Issue." Journal of Higher Education, 54, May/June 1983.
Ohio Board of Regents, A Cost Containment Strategic Study. Deloitte, Haskins and Sells, 1978.
Research Associates of Washington, Higher Education Prices and Price Indexes: 1988 Update. Washington, D. C., September, 1988b.
APPENDIX A. INFLUENCES ON POST-SECONDARY COSTS AND TUITION RATES
This appendix contains a detailed discussion of the influen
ces on post-secondary costs and tuition rates that was summarized
in Chapter II.
INFLUENCES ON POST-SECONDARY COSTS
There are many influences that affect post-secondary institu
tions' costs of instruction at many levels. This section contains
a discussion of those influences. A paper by Paul Brinkman of the
National Center for Higher Education Management Systems serves as
the basis for the review. The paper was prepared for the State
Higher Education Executive Officers.
Brinkman developed a conceptual framework that is useful in
understanding the influences on costs. At the most basic level,
post-secondary costs are a product of the mix, volume, and the
price of inputs. Brinkman identifies three sources of influence
on the mix, volume, and price of post-secondary inputs. The
influences are those of the institution itself, the higher
education community, and the external environment. He identifies
cultural and material conditions within each level of influence
that affect costs. Culture represents the predominant set of
values, attitudes, and norms that influence the operation of the
institution. Material conditions represent the physical state of
affairs, the structures, and the relationships within which the
institution operates. This subsection contains a description of
Brinkman's framework, influences identified by Brinkman, and
-A.2-
examples from Minnesota public post-secondary education that
illustrate influences on costs.
Institutional Influences
Influences within post-secondary institutions he e the most
direct impact on costs, according to Brinkman. System influences
on institutions costs are treated as institutional influences.
Institutional Cultural Conditions. An institution's values,
attitudes, and norms can influence its costs. Institutions that
place a high value on equality of educational opportunity may have
high recruitment and/or financial aid costs. An institution that
aspires to achieve high national ranking in a particular program
is likely to have higher than average costs in that program.
Institutional Material Conditions. Brinkman identified the
mission, the size and nature of student body, the physical plant,
the revenues available, system and institutional financing poli
cies, system governance structures, and institutional management
practices as material conditions that influence costs.
An institution's relative emphasis on instruction, research,
and public service as well as its specialization within each of
these areas affects its costs. Institutions engaging heavily in
~esearch, such as the University of Minnesota, tend to be more
.2nsive while those focusing primarily on lower division aca
demic instruction, such as some Minnesota community colleges, tend
to be less expensive. The difference is due in part to the number
and type of faculty employed. The research expectation is
typically reflected in the type of faculty employed, in their
instructional workloads, and in their salaries.

-A3-
An institution's costs of instruction are affected by the
number and mix of disciplines offered and the number and level of
degree and support programs offered. Some disciplines are more
expensive to offer because of factors such as equipment require
ments or market conditions for faculty. Instruction at the
graduate level tends to require smaller classes and consequently
more faculty per student than does the undergraduate level. The
type and number of support services offered also is a significant
influence on cost. The size of library holdings, the extent of
counseling and guidance services, and the number of administrative
staff vary significantly and affect costs.
The size and nature of the student body influence costs
according to Brinkman. Larger enrollments generally mean lower
costs per student as a result of economies of scale. A more
diverse student body has had cost impacts on the Minnesota public
systems. Students who have not taken college preparatory
instruction in high school usually need such instruction before
taking college level courses. More support services usually are
required for students from disadvantaged backgrounds and for older
students who may never have attended a post-secondary institution
or who are returning after a long absence. The additional support
services typically mean higher costs.
The size, age, location, and condition of an institution's
physical plant affect its costs. Larger and older plants tend to
be more expensive to operate. Minnesota's climate, for example,
means that institutions have higher heating and snow removal costs
than many other institutions in the United States. As many insti-
-A4-
tutions are now discovering, the level of maintenance or lack of
it can dramatically affect operating and capital costs.
Bowen (pp. 17-23) argues that in the short run, an institu
tion's available revenues per student determine its costs. The
cost per student is a function of available revenue and enrollment
according to this "revenue" theory of cost. Since institutions
tend tc maximize revenue from all sources, their costs are deter
mined by their success in raising revenue, according to Bowen.
Consequently, costs are determined by students, federal, state and
local governments, private entities, and individuals who contri
bute to institutions. Public institutions' costs are determined
primarily by state and local government decisionmakers. The
factors identified by Brinkman that influence costs would act on
the revenue providers, according to Bowen's theory. As a result
of the widely dispersed influence on revenues, no single entity
controls post-secondary costs.
System allocation policies and institutional budgeting prac
tices influence a post-secondary institution's costs. The
Community College System and the State University System
allocation policies, for example, provide a minimum allocation to
each institution, regardless of its enrollments. The Community
College System allocation policy also provides fewer instructional
staff for each additional increment of students. These features
result in allocations per student and consequently costs per
student in large institutions that are smaller than those in small
institutions. Similarly, institutional budgeting practices
-AS-
influence costs by determining the amount of revenue available to
each campus unit.
System governance structures also influence costs. The
Minnesota Technical Institute System provides an example of how a
governance structure can influence costs. Although the system is
governed by a state board, the institutes are operated by local
school districts. The school districts typically negotiate a
collective bargaining agreement that covers elementary, secondary,
and technical institute faculty. Compensation increases tend to
be related to increases in state aid for elementary and secondary
education. State aid, however, has increased more rapidly than
state appropriations for public post-secondary education. Conse
quently, technical institutes' faculty compensation is rising
faster than their available revenues.
Post-Secondary Community Influences
Post-secondary institutions are members of a community of
institutions and other post-secondary education organizations.
The community influences institutions' costs.
Community Cultural Conditions. Values, attitudes, and norms
espoused within the post-secondary education community influence
individual institution's costs. Brinkman contends that a primary
cultural influence of the community is exerted through disci
plines. Faculty members trained in a particular discipline typi
cally adopt the common values and attitudes of that discipline
regarding what should be taught and how it should be taught.
These common values and attitudes tend to exert influence on the
organization and content of instruction in that discipline and
-A6-
consequently its costs, wherever it is offered. The extent of
influence depends upon other cultural influences within the insti
tution and'· ·e type of institution. Doctoral research institu-
tions are likely to have stronger discipline relat, influence
than institutions offering lower division transfer instruction.
Accrediting agencies, in fields where they exist, often exert
influence similar to that of disciplines. A final post-secondary
community influence identified by Brinkman is that of norms for
working conditions. Teaching and research expectations, and
consequently costs, are influenced by the post-secondary
community.
Community Material Conditions. Material conditions such as
the current knowledge base within disciplines, instructional
technologies, relations among institutions, and post-secondary
education organizations affect institution's costs, according to
Brinkman. An increase in the knowledge base within a discipline
may mean new courses and additional faculty. Changes in instruc
tional technology could mean increases or decreases in costs,
depending on the nature of the change and how it is implemented.
The current state of relations among post-secondary institutions
is best characterized by competition. Minnesota's financing poli
cies for post-secondary education encourage competition through
enrollment related funding, a cost related tuition policy, and a
large need-based financial aid program. Competition provides
incentives for institutions to expand programs and services and/or
improve their caliber and consequently increase costs. Faculty
unions are the prime example of the impact of post-secondary
-A7-
organizations on institution's costs. Collective bargaining is
the predominant means by which the terms and conditions of faculty
employment are established in Minnesota public post-secondary
education.
External Influences
The environment external to post-secondary institutions and
the post-secondary education community also exerts significant
influence on post-secondary institutions' costs.
External Cultural Conditions. Brinkman identifies two exter
nal cultural conditions that relate directly to post-secondary
education. They are expectations for post-secondary education and
the value of post-secondary education. In addition, Brinkman
discusses several other conditions that affect many sectors of
society, including post-secondary education.
Changes in society's expectations for post-secondary educa
tion influence costs. The expectation that a larger proportion of
the population should benefit from post-secondary education is a
prime example. The need to offer remedial and skills development
instruction and expanded support services, such as assessment and
guidance, tend to result in higher costs. Expectations that post
secondary institutions will support state economic development
efforts also will tend to result in higher costs.
The value of post-secondary education to consumers, produ
cers, and entities that finance it has a significant impact on
costs. The value that individual consumers place on post
secondary education determines whether they participate and the
extent of their participation. Higher participation might result
-A8-
in higher post-secondary costs due to expansion of programs and
services or lower costs due to economies of scal2 or the inability
of revenue sourr s to support increased partic: ation. The
increase in par :ipation r lative to populati n in Minnesota
public post-secondary education during the last decade appears to
have contributed to a decrease is the level of state appropria
tions and tuition revenue per student (Research Associates of
Washington, 1988b, pp. 80-2). e relatively high level of effort
that Minnesota makes to support )Ublic post-secondary education
presumably reflects the high value it places on this endeavor.
Public post-secondary education costs in Minnesota are higher than
they would otherwise be as a result of this effort.
Fundamental changes in society such as the civil rights and
women's movements influence post-secondary costs. Here again,
added services or administrative requirements may increase costs
while added enrollments may reduce costs through economies of
scale.
External Material Conditions. Many material conditions
external to post-secondary education exert influence on post
secondary costs. The most significant of these, according to
Brinkman, are government, politics, and changes in the economy,
demography, and technology.
Government's financing policies and regulatory practices are
its primary influences on post-secondary costs. Minnesota's aver
age cost funding policy for the public post-secondary sector has
several influences on institution's costs. The enrollment related
feature of the policy provides an incentive for higher enrollments
-A9-
and higher aggregate costs. The two year lag in funding lowers
costs per student as enrollments are increasing and increases them
as enrollments are decreasing. The recognition of level of
instruction and program cost in the policy changes costs as the
distribution of students changes. Federal and state financial aid
programs affect institutional costs through administrative expen
ditures and by influencing enrollment decisions. Federal and
state environmental protection and occupational safety laws are
examples of government regulations that influence institutions'
costs. The Coordinating Board's program review responsibility is
another example of a state regulatory function that can affect
post-secondary costs by influencing which programs are initiated.
The political climate can have a substantial impact on costs.
The predispositions of the party in power to support post-second
ary education are likely to affect both the revenues available and
the distribution of those revenues among sectors and institutions.
Economic factors including inflation, unemployment, the
condition of the economy and the demand for individuals with
advanced training are influences on post-secondary costs. The
period of high inflation from the mid 1970s to the early 1980s
clearly affected post-secondary costs. Changes in the unemploy
ment rate tend to have a direct impact on enrollments. The
Technical Institute System and, to a lesser extent, the Community
College System have tended to have enrollment decreases when the
unemployment rate decreases and enrollment increases when it
increases. These enrollment changes in turn affect costs through
changes in economies of scale and in revenues. The recession of

-AlO-
the early 1980s and the resulting state fiscal crises provide a
vivid example of the impact that the condition of the economy can
have on costs. Several reductions in state appropriations to the
Minnesota public post-secondary systems during a three year period
significantly reduced their costs. Recently, increased demand for
individuals with advanced tra :ing in some primarily technical
fields has necessitated higher levels of compensation in order to
attract and retain faculty in these fields.
Post-secondary costs also are affected by demographic, tech
nological, and social changes, according to Brinkman. The smaller
number of individuals in the age group that post-secondary insti
tutions traditionally have drawn from has meant enrollment
decreases for some institutions. The decreases can affect costs
through the loss of economies of scale. ot., r institutions have
maintained or increased enrollments by serving individuals from
other age groups with new programs that may mean higher costs.
Technological changes must be incorporated into instructional and
research programs in order to produce graduates with the most
current knowledge of their field. Such changes generally mean
higher costs. On the other hand, technological changes applied to
support functions, like the automation of student records or
library catalogues, may mean lower costs.
INFLUENCES ON POST-SECONDARY TUITION
There are many influences on public post-secondary education
tuition rates at several levels. A framework analogous to Brink-
man's is used to discuss the influences. This section contains a
-All-
discussion of the external, community, and system and/or institu
tional influences.
External Influences
External influences probably have the most significant impact
on public post-secondary tuition rates. They include state
tuition policies, levels of state appropriations, and external
cultural conditions.
State Tuition Policies. A review of the literature reveals
four broad approaches used by states in setting tuition rates for
their public post-secondary institutions. McKeown (p. 5) identi
fied three approaches that typically use a predetermined relation
ship between tuition and another factor. The relationship often
is specified in law or a formally adopted policy, although in some
instances it is applied informally. The three approaches are the
use of economic indices, the cost of instruction, and tuition
rates at benchmark institutions to set public institution tuition
rates. Curry (p. 6) describes a fourth approach as the revenue
method. The distinctions between the approaches are not always
clear in practice, and some states employ more than one approach.
Economic Index Approach. The first approach consists of
adjusting tuition rates based on the change in a specified eco
nomic index. The index might be an index of prices such as the
Consumer Price Index or the Higher Education Price Index.
Alternatively, the index might measure changes in individual
income such as per capita personal or disposable income. The use
of such an index, if applied uniformly to all tuition rates,
serves to perpetuate the relationships that existed among the
-Al2-
rates when the policy was adopted. In response to a 1988 survey,
14 states reported using the Consumer Price Index, 12 reported
using the Hi~her Education Price Index, and 7 reported using a
measure of personal income either formally or informally in
setting tuition rates (Mingle, p. 7).
Cost Approach. The second approach consists of establishing
tuition rates or levels of tuition revenue in relationship to some
measure of the cost of providing instruction. The relationship
between tuition and cost and the measure of cost varies. The
relationship between tuition and cost may be uniform for all
students, institutions, or groups of institutions. Alterna-
tively, the relationship may vary by level of instruction,
residence status, and/or type of institution, as it does for the
Minnesota systems. Some states use instructional cost and others
use state appropriations as the cost measure. McKeown (p. 5)
found that the cost measure typically includes direct instruc
tional costs as well as some portion of support costs. The cost
approach has the advantage of assigning specific responsibilities
to students and the state for financing post-secondary costs. It
also can serve to reduce or eliminate inequities in state subsi
dies. According to Mingle (p. 5), eight states have policies that
relate tuition revenue and four have policies that relate tuition
rates to the cost of instruction or the level of state appropria
tions.
Benchmark Approach. The third approach consists of estab
lishing tuition rates on the basis of the rates at benchmark
institutions. The benchmark institutions are typically those that
-Al3-
compete for students. They may be in the same geographic region
or located throughout the country. While this approach may help
maintain competitive tuition rates, it also places the institu
tional pricing decision in the hands of other institutions.
Mingle (p. 7) reported that tuition levels at peer or competing
institutions played a formal or informal role in 33 states' tui
tion setting decisions.
Revenue Approach. The fourth approach tends not to be as
formally specified as the other three. This approach may employ
several objective and subjective factors in setting tuition.
Marks (p. 13) characterized this approach as one that sets tuition
"to generate all or most of the difference between what the insti
tutions believed they needed and what state government appropria
ted." Mingle (p. 5) reported that 25 states view tuition as the
difference between institutional needs and state appropriations.
State Appropriations. The level of state appropriations
appears to be a significant influence on tuition rates. Sixty-two
percent of State Higher Education Executive Officers (SHEEOs)
surveyed recently agreed that public tuition and fee rates "are
driven primarily by the amount of state appropriations available
in a given year" (Mingle, p. 23). This relationship can be either
negative or positive.
Wittstruck and Bragg (p. 21) found that in the short term,
higher increases in state appropriations were associated with
smaller increases in tuition and that the reverse also was true
between 1973 and 1988. One-third of the SHEEOs said increases in
appropriations often are used as a rationale for "holding the
-Al4-
line" on tuition increases (Mingle, p. 26). This relationship
appears consistent with the state tuition policy characterized as
the revenue approach. When state appropriations do not increase
sufficiently to finance desired spending levels, larger tuition
rate increases are used to achieve the desired level of
expenditures.
Wittstruck and Bragg (p. 36) also concluded, however, that
tuition rates increase with appropriations in the long term. This
finding is consistent with a cost or appropriation indexed tuition
policy. Increases in state appropriations are matched by tuition
increases.
Cultural Conditions. A state's collective values and
attitudes regarding post-secondary education are a significant
influence on tuition rates. The extent to which a state values
access to post-secondary education and the way it chooses to
promote access affect tuition rates. Some states choose to
promote access by maintaining tuition rates as low as possible.
Others have higher tuition rates and promote access through
financial aid. States' attitudes regarding the relative benefits
of post-secondary education to the student and society clearly
have an affect on tuition. States that consider society's bene-
fits to be more significant are likely to have lower tuition rates
than those that consider the student's benefits to be more
significant.
Post-Secondary Community Influences
The post-secondary community exerts influence on public post
secondary institution's tuition rates through competition. Many
-Al'.:-
institutions compete regionally or nationally for students. As a
consequence, tuition rates charged at competing institutions are
an explicit or implicit influence on an institution's tuition
rates.
System and Institutional Influences
System and institutional influences include both material and
cultural conditions.
System and Institutional Material Conditions. A system or
institution's cost of instruction influences its tuition rates.
The nature of that role depends in part upon the state tuition
policy. The revenue approach, for example, calls for students to
finance cost increases not financed by the state or local govern-
ments. The cost or appropriation index approach calls for the
state and the students to share responsibility for financing
increases in cost. The mission of the institution, to the extent
that it affects costs, also affects tuition rates. The wide range
of undergraduate, graduate, and professional programs offered by
the University of Minnesota, for example, affects its costs. As a
consequence of the range of programs and their costs, undergrad
uate students pay higher tuition rates than they would if those
programs did not exist.
System and Institutional Cultural Conditions. The values,
attitudes, and norms that a system or institution holds also
influence its tuition rates. The Minnesota public system
governing boards have the authority to establish tuition rates,
including those charged non-residents. The University of Minne
sota Board of Regents, for example, has taken the position that
-i'.\l 6-
tuition rates charged in each collegiate unit should be adjusted
in a manner that moves them toward the systemwide average of
tuition as a percent of instructional co· This policy reflects
the bel~ef that subsidies across units Juld be reduced. The
governing boards of the other public sy cems, however, charge a
uniform tuition rate for all state residents at each level of
instruction. This policy reflects the belief that subsidies
across programs and institutions are appropriate. All four public
systems charge higher tuition rates for non-residents than for
state residents. These differentials vary among systems and
within systems. They reflect system values and attitudes regar
ding the desirability of non-resident students and the benefits
that the non-resident students receive.
-Al7-
FOOTNOTES
Bowen, Howard R., The Costs of Higher Education. San Francisco: Jossey-Bass, 1980.
Brinkman, Paul, The Cost of Providing Higher Education: A Conceptual Overview. Denver: State Higher Education Executive Officers, June, 1988.
Curry, Denis J., Tuition and Student Aid Policies: What Role For SHEEOS?. Denver: State Higher Education Executive Officers, June, 1988.
McKeown, Mary P., State Policies on Tuition and Fees for Public Higher Education. The Journal of Education Finance, Vol. 8, Summer, 1980.
Marks, Joseph. "Tuition and Fee Rates in the SREB States: Trends and Issues," Financing Higher Education, Number 31. Atlanta: Southern Regional Education Board, 1987.
Mingle, James R. Survey on Tuition Policy, Costs and Student Aid. Denver: State Higher Education Executive Officers, June, 1988.
Research Associates of Washington, State Profiles: Financing Public Higher Education 1978 to 1988. Washington, D. C., July, 1988b.
Wittstruck, John R. and Stephen M. Bragg, Focus on Price Trends in Public Higher Education: Tuition and State Support. Denver: State Higher Education Executive Officers, June, 1988.

--- ---- -------------
APPENDIX B. DATA SOURCES AND METHODS
Several sources of data were used to examine trends in post
secondary institutions' costs, tuition rates, and available finan
cial aid. In addition, information on several price indices is
used in examining trends over time. This appendix describes the
data and the methods of analysis used.
DATA SOURCES
The data sources include the Minnesota public post-secondary
systems, the United States Education Department's Higher Education
General Information Survey (HEGIS), Research Associates of
Washington, the Coordinating Board, and the National Association
of State Scholarship and Grant Programs (NASSGP). Each source is
described in this section.
Systems' Data
Data on the public systems' aggregate general fund instruc
tional expenditures, full-year equivalent or average daily member
ship enrollments, state supported debt service, and tuition rates
were used to examine trends in their post-secondary costs and tui
tion rates. Although aggregate expenditure data are available for
research and public service activities, there are no generally
accepted volume measures that would allow an examination of per
unit expenditures. Consequently, this study focuses exclusively
on expenditures for instruction.
These data were obtained directly or indirectly from the
systems. The expenditure, enrollment, and debt service data were
-B2-
obtained from the Minnesota Department of Finance. The staff of
each system prepare these data as part of their system's biennial
budget request. Department of Finance staff assembled a data base
in Fall 1988 that contains the e~penditure, revenue, and enroll
ment data for each system. The Department of Finance is respon
sible for mak.~g the state's debt service payments. The data on
tuition and required fee rates are collected annually from the
systems by Coordinating Board staff.
Definition. The expenditure and enrollment data were used to
calculate each systems' operating cost of instruction per student.
Total instructional expenditures were divided by full-year equiva
lent and average daily membership enrollments.
The amount of instructional expenditures in a given year is
determined by conducting a cost study or estimated using the
results of a cost study from another year. General fund instruc
tional expenditures are the portion of a systems' operating cost
of instruction that is included in the state's accounting system
and funded by the state's funding policy. In general, this cate
gory includes instructional expenditures that are supported by
state appropriations and tuition revenue. Instructional expen
ditures supported by other sources of revenue are usually exclu
ded. One exception is that a portion of instructional expendi
tures supported by federal revenue is included for the Minnesota
Technical Institute System. The instructional expenditures for
fiscal year 1989 are estimated.
Full-year equivalent and average daily membership enrollments
are the measures of the volume of degree or certificate creditable
-B3-
instruction that are used in the state's funding policy. Full-
year equivalent enrollment equals the total number of student
credit hours generated during a fiscal year divided by theoretical
fiscal year full time load for each level of student. Undergrad
uate and professional credit hours are divided by 45 and graduate
credit hours are divided by 30 to obtain full-year equivalent
enrollments. Average daily membership enrollment equals the total
number of hours of enrollment in Minnesota Technical Institutes
divided by 1050. The denominator is the number of hours that a
full time student would enroll for during three quarters. The
enrollment data for fiscal year 1989 are estimated.
State debt service payments are used as an estimate of post
secondary institutions' capital cost of instruction. The avail
able data on state debt service, however, include payments for all
state financed facilities. This includes facilities that support
the instruction, public service and, where relevant, research
missions of the public institutions. Nor do the debt service data
represent the total amount incurred by or for the public post
secondary systems. Finally, historical data on debt service are
not available.
The tuition rates are the amount that a Minnesota resident
student would pay if he or she enrolled for a full-time load of 15
credits at the undergraduate level or 10 credits at the graduate
level in each of the three quarters during an academic year. The
State University System, the Community College System, and the
Technical Institute System charge one tuition rate for all resi
dent undergraduate students. The University of Minnesota charges

-B4~
several tuition rates for resident undergraduate students. The
rates used were an average of the lower and upper division rates
for the unit with the lowest and highest upper division rates on
the Twin Cities campus. The required fee rates are those that
full-time undergraduates would pay during three quarters of an
academic year.
HEGIS Data
Data on United States post-secondary institutions' expendi
tures, enrollments, and tuition rates were used to compare trends
in costs and tuition rates for Minnesota public institutions with
the trends for institutions in other states. These data are
collected by the u. s. Education Department through HEGIS. HEGIS
consists of several surveys that collect data on enrollments,
finances, sta~fing, degrees granted, and institutional character
istics from post-secondary institutions in the United States.
Data on institutions expenditures were obtained from the "Finan
cial Statistics of Institutions of Higher Education" survey for
fiscal years 1978, 1983, and 1986. The enrollment data were
obtained from the "Fall Enrollment in Institutions of Higher
Education" survey for 1977, 1982, and 1985. Data on tuition rates
were obtained from the "Institutional Characteristics" survey for
academic years 1977-78, 1982-83, and 1985-86.
Definition. The HEGIS expenditure and enrollment data were
used to estimate the operating cost of instruction per student for
all public institutions in the HEGIS universe.
The operating cost of instruction was estimated by summing
expenditures for direct instruction and student support services
-BS-
and a portion of expenditures for academic support, institutional
support and physical plant operations. The portion of these
support program expenditures attributed to instruction was equal
to expenditures for direct instruction as a proportion of total
expenditures for direct instruction, research and public service.
This calculation only approximates the operating cost of instruc
tion. The average costs presented are a weighted average for all
institutions in the category.
Full time equivalent (FTE) enrollment was estimated by adding
fall term full-time headcount to one-third of fall term part-time
headcount. Headcount refers to the number of individuals enrolled
at a point in time. This calculation is a crude approximation of
FTE since assumes that all students reported as full-time average
a full-time load and that all students reported as part time
average one-third of a full time load. The estimated operating
cost of instruction is based on total fiscal year expenditures and
fall term enrollments.
The undergraduate and graduate tuition and required fees are
intended to represent typical rates as defined by the institution
staff completing the HEGIS survey. The average tuition and
required fee rates presented are a simple average of the rates
reported by all institutions in the category.
Universe of Institutions. The HEGIS universe of institutions
excludes the Minnesota Technical Institutes and most public and
private post-secondary vocational institutions in the other
states. The Education Department began implementation of the
Integrated Postsecondary Education Data System (IPEDS) surveys in
-B6-
1986 and completed implementation in 1987. The IPEDS surveys
replace the HEGIS surveys. The IPEDS universe of institutions
includes all public post-secondary vocational institutions as well
as all institutions included in the HEGIS universe. The majority
of the data used for this study, however, were collected only for
institutions in the HEGIS universe. Consequently, all Minnesota
Technical Institutes are excluded from the analysis that compares
cost and tuition trends in Minnesota institutions with those of
institutions in other states.
Limitations. The HEGIS data have several limitations,
including the universe of institutions, reporting problems, and
funding differences (Maryland State Board for Higher Education,
p. 1) .
There are major differences among institutions in the func
tions that are included in the HEGIS universe. Some institutions
for example, include medical schools while others report them
separately. Some institutions report financial statistics for
agriculture experiment stations, extension services, and research
laboratories while others exclude them. System office expendi
tures are not reported consistently. The HEGIS universe of
institutions excludes most public and private vocational and
technical institutions.
Reporting practices vary from institution to institution and
from state to state. HEGIS surveys allow institutions to choose
one of several definitions for reporting certain items. The
definitions also are subject to differing interpretations. These
differences in reporting are a particular problem with enrollment
-B7-
data. Institutions do not report the same universe of students.
Some institutions, for example, report extension enroll~ents while
others do not. Some report enrollments in courses taught under
contract while others do not. Institutions' classifications of
students by level of instruction also may differ. The reporting
differences also affect the financial data. Some institutions, as
a result of their data reporting practices, are required to do
several calculations in order to satisfy the requirements on the
HEGIS form.
States differ in their funding practices. One state may fund
certain programs directly through the institutions, while similar
programs in other states may be funded from a central agency. In
some states, including Minnesota, most student aid is distributed
directly to students while in others it flows through institu
tions. Aid that flows through institutions will be reported in
the HEGIS financial surveys. Some institutions fund debt service
directly while others, including Minnesota, use a central agency.
Fringe benefits for employees are funded through institutional
accounts in some states, including Minnesota, and centrally in
others. Such differences in funding practices result in incon
sistent reporting of expenditures. Minnesota's post-secondary
expenditures for financial aid and debt service are under reported
and expenditures for fringe benefits are fully reported.
Christal, Firnberg, and Lacour, (p. 15) found three types of
differences among institutions that affect comparisons of expendi
tures and revenues per student. First, average expenditures and
revenues per full-time equivalent (FTE) student differed
-88-
significantly depending on the definition of FTE used. The
problem results from estimating FTE on the basis of headcount
enrollment. Second, t ~ assigr ?nt of (pendi tures o functional
categories differed amc .. g inst: _utions Third, - .ings of
institutions differed with the definitLms and , .L1..culations used
in providing the data.
Despite these problems, the HEGIS data were used because they
are the only data available for higher education institutions in
t;:e United States.
Research Associates of Washington
Data on average state and local appropriations and tuition
revenue per full-year equivalent student for public post-secondary
education were used to compare Minnesota revenue trends to those
occurring nationally. These data were obtained from a publication
by Research Associates of Washington entitled State Profiles:
Financing Public Higher Education 1978 to 1987. This annual
publication describes state efforts in financing public post
secondary education and presents only state level data.
Definition. The data on educational appropriations per
student include all state and local appropriations for public
post-secondary education but exclude identifiable appropriations
for research, public service, and medical, dental and veterinary
schools. An amount equal to appropriations for financial aid has
been subtracted from the tuition revenue since it is included in
the appropriations figure. Thus, tuition revenue per student is
reduced by an amount equal to state funded financial aid. The
-B9-
full-year equivalent enrollments are calculated using student
credit hours, student contact hours, and the appropriate divisors.
Coordinating Board
Data on combined State Scholarship and Grant Program and
Federal Pell Grant Program awards were used to examine trends in
need-based financial aid available to undergraduates. These data
were obtained from the spending summaries published in the
Coordinating Board's biennial reports. The financial aid trends
were compared to trends in undergraduate headcount enrollment.
The enrollment data were obtained from the Coordinating Board
annual Basic Data Series enrollment reports for Fall Term 1979,
1982, 1985, and 1987. The headcount data exclude extension
enrollments in all four systems for fall 1979 and in all but the
Community College System for fall 1982, 1985, and 1987.
Definition. The data on combined State Scholarship and Grant
Program and Federal Pell Grant Program awards represent all state
awards plus an estimate of the Pell awards received by state grant
recipients. They do not represent all Pell grant awards. Data on
awards from both programs are presented because the two programs
are coordinated. The amount of the Pell award received by a state
award recipient plays a significant role in determining the amount
of the state award.
National Association of State Scholarship and Grant Programs
Data on total awards and number of awards for state financial
aid programs were used to compare trends in the Minnesota State
Scholarship and Grant Program to trends in similar programs in the
United States. These data were obtained from a report published
-B10-
annually for the National Association of State Scholarship and
Grant Programs.
Definition. The United States and Minnesota ( . on total
awards and nuL._._.2r of awards are for undergraduate need-based
competitive and non-competitive state financial aid programs.
ANALYSIS
This section describes the analytic approach, the timeframe,
and the institutional classification systems used in examining
trends in the operating cost of instruction and tuition and fee
rates.
Analytic Approach
The purpose of this study is to examine trends over time in
post-secondary costs and tuition rates. The intent is not to
examine levels of spending per student or to compare spending
levels among institutions.
Two estimates of instructional expenditures and tuition rates
are used to examine trends. The trends for the Minnesota public
post-secondary systems are examined using the systems' data.
These estimates of costs and the tuition and fee rates should be
considered reasonably accurate. Minnesota trends are compared
with those of public institutions in other states using the HEGIS
data. These estimates of costs should be considered approxima
tions because of the method of calculation and the limitations of
the HEGIS data. As a result of differences in the methods and
data sets used, one cannot compare the costs derived by the two
methods.
-B11-
Time frame
The timeframe chosen for a trend analysis has a significant
influence on the trends observed. A difference of a few years can
alter the trend dramatically. The timeframe for this study was
determined primarily on the basis of data availability. Minnesota
systems' data were not available for fiscal years prior to 1978
and consequently, that year became the base year. Fiscal year
1971 was chosen as a base year for the Minnesota tuition and fee
data because of a readily available set of data. Although HEGIS
data were available for earlier years, 1978 was chosen as a base
year to be consistent with the base year for the Minnesota
systems' data. Fiscal year 1986 was the most recent HEGIS data
available when the data tapes were orderede After receipt of the
HEGIS data, it was discovered that the information on tuition
rates for fiscal years 1983 and 1986 was actually for fiscal years
1982 and 1985 respectively. Consequently, these years are used in
the comparisons of trends in Minnesota tuition rates to those in
similar non-Minnesota institutions. Fiscal years 1979 and 1988
are the earliest and most recent fiscal years, respectively, for
which data on combined state and Pell awards are available.
Consequently, data for these years are used in examining trends in
financial aid.
Institutional Classification Systems
Two different institutional classification systems are used
in examining trends. One is that of the Minnesota governance
structure, the four public systems. Since governance structures
differ significantly among states, a second institutional
-B12-
classification system was used for the analysis of the HEGIS data.
This second classification system was developed by the National
Center for Higher Education Management Systems (NC~EMS). It has
10 institutional categories that range fr m research university to
two-year occupational institution. It is used to control for
differences among institutions in the types of degrees offered and
the mix of study fields. This section describes the NCHEMS class
ification system. A list of the Minnesota public institutions in
each category of the NCHEMS classification system is at the end of
this appendix.
Description. The classification system used in the study was
developed by the staff of the National Center for Higher Educ~~ion
Management Systems (NCHEMS). The system contains the following
classifications (Christal, Brinkman, and Parker, 1986):
1. Research Universities - These institutions have a significant commitment to doctoral-level education and extensive research activities. A research university confers at least 30 doctoral-level degrees in three or more program areas on an annual basis. In addition, it must rank in the top 75 institutions in research expenditures.
2. Universities - These institutions fulfill the criteria for a university, but they are not as heavily involved in research activities.
3. Comprehensive Institutions - These institutions have diverse post baccalaureate program offerings, but not significant doctoral-level education. The number of doctorates awarded is under 30 annually or there exist fewer than three doctoral level programs which are offered. These institutions must provide a minimum of 30 post baccalaureate degrees and either grant degrees in three or more post baccalaureate programs or have an interdisciplinary program at the baccalaureate level.
4. Two-Year Institutions - These institutions confer fewer than 25 percent of their degrees at the baccalaureate level or post baccalaureate level. They also confer 75 percent of their degrees for two years of work or less. Institutions in this category may be either academic/comprehensive or occupa-
-B13-
tional in nature. A two year institution is considered academic/comprehensive if 80 percent of the degrees awarded are in an academic area, otherwise it is occupational.
5. Health Professional Institutions - These institutions confer 60 percent or more of their degrees in health science fields.
6. Other Professional and Specialized Institutions - This category includes other health science institutions, education schools, engineering schools, divinity institutions, business and management schools, art, music and design schools, law schools, u. s. Service Schools and other specialized schools.
ECONOMIC INDICES
Several economic indices are used in this study. The Higher
Education Price Index is used in the analyses of post-secondary
costs to control for changes in price. The Consumer Price Index
is used in the analyses of tuition rates to control for changes in
price. Changes in costs also are compared to the Gross National
Product Implicit Price Deflater, and changes in tuition are
compared to an index of changes in Minnesota Personal Income.
Definitions
The objective of a price index is to measure changes in
prices over time. Indices are constructed in an attempt to elim-
inate the effects of all other factors on changes in spending.
The quality and mix of goods and services are held constant. In
measuring changes in prices only, indices measure changes in the
purchasing power of a given level of spending.
The Higher Education Price Index (HEPI) measures changes in
the prices of a fixed set of goods and services purchased by
colleges and universities. The HEPI measures changes in the
prices of professional and non-professional personnel compensa
tion, services, supplies, equipment, books and periodicals, and
-814-
utilities (Research Associates of Washington, 1988a, p. 12). It
does not measure changes in the prices of goods and services for
sponsored research or auxiliary enterrrises.
The HEPI, as do most other inJ~ces, has some limitations.
The use of a fixed set of goods and services means that changes in
the actual mix will make the index less reflective of post
secondary institutions' costs. The HEPI teasures price changes
for colleges and universities and, consequently, may not be
entirely appropriate for examining costs in the Minnesota
Technical Institute System. Another criticism is that many
colleges and universities have some influence over the prices they
pay for personnel compensation and, consequently, some influence
over the index. Despite these limitations, the HEP! is the best
measure of change in the prices faced by post-secondary institu
tions.
The Consumer Price Index (CPI) measures change in the prices
of a set of consumer goods and services. The type and quantity of
goods and services are fixed and were established in 1967 for a
typical urban family. The index measures changes in the prices of
food, clothing, transportation, fuel, household supplies, health
services and materials, recreational goods and events, and
shelter. The CPI is used to deflate changes in tuition and
required fee rates. Tuition and fee changes are thus viewed in
contrast to changes in the prices of other goods and services
purchased by consumers.
The Gross National Product (GNP) Implicit Price Deflater
measures the average price change from a base year in the total
-815-
United States output of goods and services (Ohara and Sicignano,
p. 73). The Deflator in not a true price index since changes in
the components of the Gross National Product are weighted by their
proportion of the GNP each year, rather than by a fixed propor
tion. Hence, changes in the Deflator also reflect changes in the
mix of goods and services that make up the GNP. The Deflater is
used as a broad measure of inflation in the U. s. economy.
An index of change in Minnesota personal income also will be
used. It measures changes in current income received by indivi
duals and certain private funds in Minnesota. It includes income
from all sources minus payments for social insurance. It is used
in examining changes in tuition and required fee rates.
FOOTNOTES
Christal, Melodie E., Paul T. Brinkman and Ronald G. Parker, Higher Education Financing in the Fifty state, Interstate Comparisons, Fiscal Year 1984. Boulder, National Center for Higher Education Management Systems, August 1986.
Christal, Melodie E., James w. Firnberg and Maries. Lacour, Using HEGIS Data in Interinstitutional Comparisons. A paper presented at the Forum of the Association for Institutional Research, Fort Worth, April 1984.
Maryland State Board for Higher Education, The Utility of HEGIS Data in Making Institutional Comparisons. Anapolis, August 30, 1988.
O'Hara, Frederick M., Jr. and Robert Sicignano, Handbook of United States Economic and Financial Indicators, Greenwood Press, Westport and London, 1985.
Research Associates of Washington, Higher Education Prices and Price Indexes: 1988 Update. Washington D. C., September 1988b.

-Bl6-
MINNESOTA PUBLIC INSTITUTIONS IN NCHEMS CLASSIFICATION
Research Universities
University of Min· 3ota Minneapc:is-S~int ?aul
Comprehensive Instituti0ns
Bemidji State University Mankato State University Moorhead State University Saint Cloud State University University of Minnesota Duluth Winona State University
General Baccalaureate Institutions
Metropolitan State University Southwest State University University of Minnesota Morris
Two-Year Academic and Comprehensive Institutions
All Minnesota Community Colleges
Two-Year Occupational Institutions
University of Minnesota Crookston University of Minnesota Waseca
Minnesota Higher Education Coordinating Board
Suite 400, Capjtol Square Building 550 Cedar Street St. Paul, Minnesota 55101 612-296-3974
HUMAN RIGHTS STATEMENT "The Minnesota Higher Education Coordinating Board has
committed itself to the policy that there shall be no discrimination on the basis of race, creed, color, sex, age, handicap or national origin in its programs, activities or employment policies as required by Title IX of the Education Amendments of 1972, Rehabilitation Act of 1973, and other applicable laws, regulations and Executive Orders.
Inquiries regarding compliance may be directed to Office of Personnel and Affirmative Action, Minnesota Higher Education Coordinating Board, 400 Capitol Square, 550 Cedar Street, St. Paul, MN 55101, (612) 296-3974, or to the Director of the Office of Civil Rights, Department of Health, Education and Welfare, Washington, D.C. 20201."