minnesota perpetual pavement analysis and review perpetual pavement analysis and review daniel e....
TRANSCRIPT

Minnesota Perpetual PavementAnalysis and Review
Daniel E. WegmanMohammadreza Sabouri
Braun Intertec Corporation
July 2016
Research ProjectFinal Report 2016-33

To request this document in an alternative format, such as braille or large print, call 651-366-4718 or 1-800-657-3774 (Greater Minnesota) or email your request to [email protected]. Please request at least one week in advance.
Technical Report Documentation Page 1. Report No. 2. 3. Recipients Accession No. MN/RC 2016-33 4. Title and Subtitle 5. Report Date
Minnesota Perpetual Pavement Analysis and Review July 2016 6.
7. Author(s) 8. Performing Organization Report No. Daniel E. Wegman, PE Mohammadreza Sabouri, PhD 9. Performing Organization Name and Address 10. Project/Task/Work Unit No. Braun Intertec Corporation 11001 Hampshire Ave S Bloomington, Mn 55438
11. Contract (C) or Grant (G) No.
12. Sponsoring Organization Name and Address 13. Type of Report and Period Covered Minnesota Department of Transportation Research Services & Library 395 John Ireland Boulevard, MS 330 St. Paul, Minnesota 55155-1899
Final Report 14. Sponsoring Agency Code
15. Supplementary Notes http:// mndot.gov/research/reports/2016/201633.pdf 16. Abstract (Limit: 250 words) MnDOT currently owns the record for the most award winners and has received an award every year from 2002 through 2015. This study reviews all the award winning roadways in Minnesota to determine common material, design factors and considerations which may have contributed to the roadways extended life, often exceeding 50 years despite the harsh Minnesota climate. For these projects, all the available information for the 14 award winners and any pertinent supporting information were reviewed including MnDOT Highway Pavement Management Application (HPMA) data and performance histories as well as the construction histories and plans. Findings from this study showed that a combination of many different factors may have contributed to the outstanding performance of these award winning roadways. These factors include constructing the roadways over a longer period of time, performing major subgrade corrections at the time of construction, use of a select granular backfill material which enhanced drainage, use of non-frost susceptible base and subbase materials in underlying layers, placing a layer of prime coat over the aggregate base before placing the asphalt layer(s), use of a staged construction which allowed the foundation to go through seasonal cycles potentially enhancing the overall pavement structural stability, use of a stabilized base in the initial construction which may provide a flexible, fatigue resistant foundation for overlay construction and provides a bound layer which may have reduced the tensile strain levels at the bottom of the upper asphalt layers and therefore increased the pavement fatigue life. Findings also showed a similar resilient modulus of asphalt mixtures at low temperatures which is the dominant temperature condition for much of the year in the state of Minnesota.
17. Document Analysis/Descriptors 18. Availability Statement Perpetual pavements, Minnesota, analysis, SHRP R23, rePave No restrictions. Document available from:
National Technical Information Services, Alexandria, Virginia 22312
19. Security Class (this report) 20. Security Class (this page) 21. No. of Pages 22. Price Unclassified Unclassified 151

Minnesota Perpetual Pavement Analysis and Review
Final Report
Prepared by:
Daniel E. Wegman, PE
Mohammadreza Sabouri, PhD
Braun Intertec Corporation
July 2016
Published by:
Minnesota Department of Transportation
Research Services & Library
395 John Ireland Boulevard, MS 330
St. Paul, Minnesota 55155-1899
This report represents the results of research conducted by the authors and does not necessarily represent the views
or policies of the Minnesota Department of Transportation and/or Braun Intertec. This report does not contain a
standard or specified technique.

ACKNOWLEDGMENTS
The authors would like to acknowledge the expertise and financial support from the Minnesota
Department of Transportation (MnDOT) and the Federal Highway Administration (FHWA).

TABLE OF CONTENTS
Chapter 1: Introduction ................................................................................................................... 1
Chapter 2: Perpetual Pavements ..................................................................................................... 4
2.1 Mechanistic-Empirical Method ............................................................................................ 4
2.2 Materials ............................................................................................................................... 5
2.3 Construction .......................................................................................................................... 6
2.4 Performance Monitoring ....................................................................................................... 7
2.5 Perpetual Pavement Programs .............................................................................................. 7
2.5.1 rePave ............................................................................................................................. 7
2.5.2 PerRoad .......................................................................................................................... 9
2.6 PerRoadXpress 1.0 .............................................................................................................. 11
Chapter 3: Minnesota Award Winners ......................................................................................... 14
3.1 Interstate 35 (2002 winner) ................................................................................................. 15
3.1.1 I-35 Traffic Analysis .................................................................................................... 18
3.2 Trunk Highway 71 (2003 winner) ...................................................................................... 19
3.2.1 TH 71 Traffic Analysis ................................................................................................ 22
3.3 Trunk Highway 10 (2004 winner) ...................................................................................... 24
3.3.1 TH 10 Traffic Analysis ................................................................................................ 27
3.4 Trunk Highway 18 (2005 Winner) ..................................................................................... 29
3.4.1 TH 18 Traffic Analysis ................................................................................................ 32
3.5 Trunk Highway 61 (2006 Winner) ..................................................................................... 34
3.5.1 TH 61 Traffic Analysis ................................................................................................ 37
3.6 Trunk Highway 71 (2007 Winner) ..................................................................................... 39
3.6.1 TH 71 Traffic Analysis ................................................................................................ 42
3.7 Trunk Highway 36 (2008 Winner) ..................................................................................... 44

3.7.1 TH 36 Traffic Analysis ................................................................................................ 47
3.8 Trunk Highway 10 (2009 Winner) ..................................................................................... 49
3.8.1 TH 10 Traffic Analysis ................................................................................................ 52
3.9 Trunk Highway 61 (2010 Winner) ..................................................................................... 54
3.9.1 TH 61 Traffic Analysis ................................................................................................ 57
3.10 Trunk Highway 71 (2011 Winner) ................................................................................... 58
3.10.1 TH 71 Traffic Analysis .............................................................................................. 61
3.11 Trunk Highway 61 (2012 Winner) ................................................................................... 63
3.11.1 TH 61 Traffic Analysis .............................................................................................. 66
3.12 Trunk Highway 95 (2013 Winner) ................................................................................... 68
3.12.1 TH 95 Traffic Analysis .............................................................................................. 71
3.13 Trunk Highway 47 (2014 Winner) ................................................................................... 73
3.13.1 TH 47 Traffic Analysis .............................................................................................. 77
3.14 Trunk Highway 71 (2015 Winner) ................................................................................... 78
3.14.1 TH 71 Traffic Analysis .............................................................................................. 82
3.15 Summary and Discussion .................................................................................................. 83
Chapter 4: In-depth Analysis & Evaluation (Metro) .................................................................... 85
4.1 Field Testing ....................................................................................................................... 85
4.1.1 Coring and Hand Auger ............................................................................................... 85
4.1.2 DCP testing .................................................................................................................. 88
4.2 Laboratory Testing .............................................................................................................. 91
4.2.1 Core Densities and Asphalt Contents .......................................................................... 91
4.2.2 Extracted Gradations .................................................................................................... 93
4.2.3 Resilient Modulus Test ................................................................................................ 97
4.3 rePave Program ................................................................................................................. 101

4.3.1 Existing Pavement Conditions ................................................................................... 101
4.3.2 rePave Traffic Calculation ......................................................................................... 103
4.3.3 rePave Results ............................................................................................................ 104
4.3.4 rePave Sensitivity Analysis........................................................................................ 109
4.4 Summary and Discussion .................................................................................................. 112
Chapter 5: Summary and Conclusions ........................................................................................ 114

LIST OF FIGURES
Figure 1-1 MnDOT’s Record 14 APA Perpetual Pavement Award Winners ................................ 3
Figure 2-1 Simplified Flowchart of perpetual pavement Design [1] .............................................. 5
Figure 2-2 Three layer concept of a perpetual pavement asphalt layer [13] .................................. 6
Figure 2-3 rePave sample program output ...................................................................................... 8
Figure 2-4 M-E Design Process [15] ............................................................................................ 10
Figure 2-5 PerRoad sample program output ................................................................................. 11
Figure 2-6 PerRoadXpress sample program output ...................................................................... 13
Figure 3-1 I-35 from Willow River to Carlton/Pine County Line ................................................ 16
Figure 3-2 I-35 in Pine County ..................................................................................................... 17
Figure 3-3 I-35 mainline typical section (1964 construction plan) ............................................... 17
Figure 3-4 PQI vs. year for I-35.................................................................................................... 18
Figure 3-5 ADT vs. year and compound growth fit for I-35 ........................................................ 18
Figure 3-6 HCAADT vs. year for I-35 ......................................................................................... 19
Figure 3-7 HCAADT (%) vs. year for I-35 .................................................................................. 19
Figure 3-8 TH 71 from South Hubbard County Line to Park Rapids ........................................... 21
Figure 3-9 TH 71 in Hubbard County........................................................................................... 21
Figure 3-10 TH 71 mainline typical section (1959 construction plan) ......................................... 22
Figure 3-11 PQI vs. year for TH 71 .............................................................................................. 22
Figure 3-12 ADT vs. year and compound growth fit for TH 71 .................................................. 23
Figure 3-13 HCAADT vs. year for TH 71 .................................................................................... 23
Figure 3-14 HCAADT (%) vs. year for TH 71 ............................................................................. 24
Figure 3-15 TH 10 in Anoka County ............................................................................................ 26
Figure 3-16 TH 10 in Anoka County ............................................................................................ 26
Figure 3-17 TH 10 mainline typical section (1964 construction plan) ......................................... 27

Figure 3-18 PQI vs. year for TH 10 .............................................................................................. 27
Figure 3-19 ADT vs. year and compound growth fit for TH 10 .................................................. 28
Figure 3-20 HCAADT vs. year for TH 10 .................................................................................... 28
Figure 3-21 HCAADT (%) vs. year for TH 10 ............................................................................. 29
Figure 3-22 TH 18 from Brainerd to Garrison.............................................................................. 31
Figure 3-23 TH 18 in Crow Wing County .................................................................................... 31
Figure 3-24 TH 18 mainline typical section (1955 construction plan) ......................................... 32
Figure 3-25 PQI vs. year for TH 18 .............................................................................................. 32
Figure 3-26 ADT vs. year and compound growth fit for TH 18 .................................................. 33
Figure 3-27 HCAADT vs. year for TH 18 .................................................................................... 33
Figure 3-28 HCAADT (%) vs. year for TH 18 ............................................................................. 34
Figure 3-29 TH 61 from Wabasha to Kellogg .............................................................................. 36
Figure 3-30 TH 61 in Wabasha County ........................................................................................ 36
Figure 3-31 TH 61 mainline typical section (1969 construction plan) ......................................... 37
Figure 3-32 PQI vs. year for TH 61 .............................................................................................. 37
Figure 3-33 ADT vs. year and compound growth fit for TH 61 .................................................. 38
Figure 3-34 HCAADT vs. year for TH 61 .................................................................................... 38
Figure 3-35 HCAADT (%) vs. year for TH 61 ............................................................................. 39
Figure 3-36 TH 71 from near New London north to Stearns County Line .................................. 41
Figure 3-37 TH 71 in Kandiyohi County ...................................................................................... 41
Figure 3-38 TH 71 mainline typical section (1967 construction plan) ......................................... 42
Figure 3-39 PQI vs. year for TH 71 .............................................................................................. 42
Figure 3-40 ADT vs. year and compound growth fit for TH 71 .................................................. 43
Figure 3-41 HCAADT vs. year for TH 71 .................................................................................... 43
Figure 3-42 HCAADT (%) vs. year for TH 71 ............................................................................. 44

Figure 3-43 TH 36 south of Stillwater .......................................................................................... 46
Figure 3-44 TH 36 in Washington County ................................................................................... 46
Figure 3-45 TH 36 mainline typical section (1958 construction plan) ......................................... 47
Figure 3-46 PQI vs. year for TH 36 .............................................................................................. 47
Figure 3-47 ADT vs. year and compound growth fit for TH 36 .................................................. 48
Figure 3-48 HCAADT vs. year for TH 36 .................................................................................... 48
Figure 3-49 HCAADT (%) vs. year for TH 36 ............................................................................. 49
Figure 3-50 TH 10 from east of Detroit Lakes to Perham ............................................................ 51
Figure 3-51 TH 10 near Perham in Becker County ...................................................................... 51
Figure 3-52 TH 10 mainline typical section (1973 construction plan) ......................................... 52
Figure 3-53 PQI vs. year for TH 10 .............................................................................................. 52
Figure 3-54 ADT vs. year and compound growth fit for TH 10 .................................................. 53
Figure 3-55 HCAADT vs. year for TH 10 .................................................................................... 53
Figure 3-56 HCAADT (%) vs. year for TH 10 ............................................................................. 54
Figure 3-57 TH 61 north of Silver Bay ......................................................................................... 55
Figure 3-58 TH 61 in Lake County............................................................................................... 56
Figure 3-59 TH 61 mainline typical section (1967 construction plan) ......................................... 56
Figure 3-60 PQI vs. year for TH 61 .............................................................................................. 57
Figure 3-61 ADT vs. year and compound growth fit for TH 61 .................................................. 57
Figure 3-62 HCAADT vs. year for TH 61 .................................................................................... 58
Figure 3-63 HCAADT (%) vs. year for TH 61 ............................................................................. 58
Figure 3-64 TH 71 from Sauk Centre to Long Prairie .................................................................. 60
Figure 3-65 TH 71 in Todd County .............................................................................................. 60
Figure 3-66 TH 71 mainline typical section (1956 construction plan) ......................................... 61
Figure 3-67 PQI vs. year for TH 71 .............................................................................................. 61

Figure 3-68 ADT vs. year and compound growth fit for TH 71 .................................................. 62
Figure 3-69 HCAADT vs. year for TH 71 .................................................................................... 62
Figure 3-70 HCAADT (%) vs. year for TH 71 ............................................................................. 63
Figure 3-71 TH 61 from Kellogg to Minnesota City .................................................................... 65
Figure 3-72 TH 61 in Wabasha County and Winona County ....................................................... 65
Figure 3-73 TH 61 mainline typical section (1966 construction plan) ......................................... 66
Figure 3-74 PQI vs. year for TH 61 .............................................................................................. 66
Figure 3-75 ADT vs. year and compound growth fit for TH 61 .................................................. 67
Figure 3-76 HCAADT vs. year for TH 61 .................................................................................... 67
Figure 3-77 HCAADT (%) vs. year for TH 61 ............................................................................. 68
Figure 3-78 TH 95 from south of Stillwater to Bayport ............................................................... 70
Figure 3-79 TH 95 in Washington County ................................................................................... 70
Figure 3-80 TH 95 mainline typical section (1959 construction plan) ......................................... 71
Figure 3-81 PQI vs. year for TH 95 .............................................................................................. 71
Figure 3-82 ADT vs. year and compound growth fit for TH 95 .................................................. 72
Figure 3-83 HCAADT vs. year for TH 95 .................................................................................... 72
Figure 3-84 HCAADT (%) vs. year for TH 95 ............................................................................. 73
Figure 3-85 TH 47 from Columbia Heights to Fridley ................................................................. 75
Figure 3-86 TH 47 in Anoka County ............................................................................................ 75
Figure 3-87 TH 47 mainline typical section (1964 construction plan) ......................................... 76
Figure 3-88 PQI vs. year for TH 47 .............................................................................................. 76
Figure 3-89 ADT vs. year and compound growth fit for TH 47 .................................................. 77
Figure 3-90 HCAADT vs. year for TH 47 .................................................................................... 77
Figure 3-91 HCAADT (%) vs. year for TH 47 ............................................................................. 78
Figure 3-92 TH 71 north of Bemidji ............................................................................................. 80

Figure 3-93 TH 71 in Beltrami County......................................................................................... 80
Figure 3-94 TH 71 mainline typical section (1975 construction plan) ......................................... 81
Figure 3-95 PQI vs. year for TH 71 .............................................................................................. 81
Figure 3-96 ADT vs. year and compound growth fit for TH 71 .................................................. 82
Figure 3-97 HCAADT vs. year for TH 71 .................................................................................... 82
Figure 3-98 HCAADT (%) vs. year for TH 71 ............................................................................. 83
Figure 4-1 Coring Plan Layout ..................................................................................................... 86
Figure 4-2 DPI versus penetration depth for TH 10 (2004 winner) ............................................. 88
Figure 4-3 DPI versus penetration depth for TH 36 (2008 winner) ............................................. 89
Figure 4-4 DPI versus penetration depth for TH 95 (2013 winner) ............................................. 89
Figure 4-5 DPI versus penetration depth for TH 47 (2014 winner) ............................................. 90
Figure 4-6 DPI versus penetration depth comparison for all the tested roadways ....................... 90
Figure 4-7 Extracted gradation; TH 10 (2004 winner) ................................................................. 94
Figure 4-8 Extracted gradation; TH 36 (2008 winner) ................................................................. 94
Figure 4-9 Extracted gradation; TH 95 (2013 winner) ................................................................. 95
Figure 4-10 Extracted gradation; TH 47 (2014 winner) ............................................................... 95
Figure 4-11 Extracted gradation; all Metro sections with Superpave control points ................... 96
Figure 4-12 Extracted gradation; all Metro sections with MnDOT Type B control points .......... 96
Figure 4-13 TH 10 (2004) cores used for RM (Cores 2, 6, and 8) ............................................... 97
Figure 4-14 TH 36 (2008) cores used for RM (Cores 20, 22, and 24) ......................................... 98
Figure 4-15 TH 95 (2013) cores used for RM (Cores 26, 29, and 32) ......................................... 98
Figure 4-16 TH 47 (2014) cores used for RM (Cores 11, 14, and 17) ......................................... 99
Figure 4-17 rePave output for TH 10 (2004) – FDR and overlay .............................................. 105
Figure 4-18 rePave output for TH 10 (2004) – SFDR and overlay ............................................ 105
Figure 4-19 rePave output for TH 10 (2004) – Full depth mill and overlay .............................. 106

Figure 4-20 rePave output for TH 95 (2013) – FDR and overlay .............................................. 106
Figure 4-21 rePave output for TH 95 (2013) – SFDR and overlay ............................................ 106
Figure 4-22 rePave output for TH 95 (2013) – Full depth mill and overlay .............................. 107
Figure 4-23 rePave output for TH 47 (2014) – FDR and overlay .............................................. 107
Figure 4-24 rePave output for TH 47 (2014) – SFDR and overlay ............................................ 107
Figure 4-25 rePave output for TH 47 (2014) – Full depth mill and overlay .............................. 108
Figure 4-26 rePave output for TH 36 (2008) – Mill and overlay ............................................... 108
Figure 4-27 Pavement thickness vs. base modulus at different subgrade modulus values for: a)
TH 10 and b) TH 36, TH 95, and TH 47 .................................................................................... 111
Figure 4-28 Pavement thickness vs. subgrade modulus at different base modulus values for: a)
TH 10 and b) TH 36, TH 95, and TH 47 .................................................................................... 112

LIST OF TABLES
Table 1.1 MnDOT’s Record 14 APA Perpetual Pavement Award Winners .................................. 2
Table 4.1 Metro District projects core thickness data................................................................... 87
Table 4.2 Metro District projects core densities ........................................................................... 92
Table 4.3 Extracted gradations ..................................................................................................... 93
Table 4.4 Resilient Modulus testing results ................................................................................ 100
Table 4.5 Existing Pavement Conditions .................................................................................... 101
Table 4.6 Estimated ESALs for Metro award winners – design in the current year (2016) ....... 103
Table 4.7 Estimated ESALs for Metro award winners – design in the year of the first overlay 104
Table 4.8 rePave sensitivity analysis on TH 10 .......................................................................... 109
Table 4.9 rePave sensitivity analysis on TH 36, TH 95, and TH 47 .......................................... 110

EXECUTIVE SUMMARY
A perpetual pavement is an asphalt pavement designed and built to last longer than 50 years
without requiring major structural rehabilitation or reconstruction, and needing only periodic
surface renewal in response to distresses confined to the top of the pavement. The Asphalt
Pavement Alliance (APA) created the Perpetual Pavement Award program in 2001 to recognize
state agencies and other pavement owners for designing and constructing pavements that meet
the APA’s definition of Perpetual Pavement. This program requires that the roadway has at least
35 years of service at the time of award and had experienced no structural failures. In addition,
the program limits candidate roadways to those that have not received more than four inches of
new asphalt nor have been resurfaced at a frequency exceeding 13 years.
MnDOT currently owns the record for the most award winners and has received an award every
year from 2002 through 2015. This study reviews all the award winning roadways in Minnesota
to determine common material, design factors and considerations which may have contributed to
the roadways extended life, often exceeding 50 years despite the harsh Minnesota climate. For
these projects, all the available information for the 14 award winners and any pertinent
supporting information were reviewed including MnDOT Highway Pavement Management
Application (HPMA) data and performance histories as well as the construction histories and
plans.
A more in-depth analysis was performed on the four project locations within the Metro District.
To further investigate and characterize these sites, coring and hand auger borings were
performed in cracked and un-cracked areas along with Dynamic Cone Penetrometer (DCP)
which was performed in selected core holes. The cores were then used to measure thicknesses,
densities, and asphalt contents, and to perform extracted gradations and resilient modulus testing
at low and intermediate temperatures. The laboratory testing data were used to further refine the
Metro award winner information by performing data analysis using the rePave program. This
program was developed under SHRP 2 R23 study which provides much-needed guidance for the
use of existing pavement in roadway renewal projects.
Findings from this study showed that a combination of many different factors may have
contributed to the outstanding performance of these award winning roadways. These factors
include constructing the roadways over a longer period of time, performing major subgrade
corrections at the time of construction, use of a select granular backfill material which enhanced
drainage, use of non-frost susceptible base and subbase materials in underlying layers, placing a
layer of prime coat over the aggregate base before placing the asphalt layer(s), use of a staged
construction which allowed the foundation to go through seasonal cycles potentially enhancing
the overall pavement structural stability, use of a stabilized base in the initial construction which
may provide a flexible, fatigue resistant foundation for overlay construction and provides a
bound layer which may have reduced the tensile strain levels at the bottom of the upper asphalt
layers and therefore increased the pavement fatigue life. Findings also showed a similar resilient
modulus of asphalt mixtures at low temperatures which is the dominant temperature condition
for much of the year in the state of Minnesota.
1
CHAPTER 1: INTRODUCTION
The Asphalt Pavement Alliance (APA) originally introduced the concept of Perpetual
Pavements in 2000 and defined them as:
“an asphalt pavement designed and built to last longer than 50 years without requiring major
structural rehabilitation or reconstruction, and needing only periodic surface renewal in response
to distresses confined to the top of the pavement”[1].
Many asphalt pavements constructed long before 2000 function as Perpetual Pavements, and as a
result, the APA created the Perpetual Pavement Award program in 2001. The award program
was primarily intended to recognize state agencies and other pavement owners for designing and
constructing pavements that met the APA’s definition of Perpetual Pavement.
According to the APA, the Perpetual Pavement Award program has acknowledged 100 long-life
pavements in 30 U.S. states and one Canadian province [2]. The program requires that the
roadways has at least 35 years of service at the time of award and had experienced no structural
failures. In addition, the program limits candidate roadways to those that have not received more
than four inches of new asphalt nor have been resurfaced at a frequency exceeding 13 years.
MnDOT owns the record for award winners and have received an award every year from 2002
through 2015. Table 1.1 presents all the MnDOT perpetual pavement award winners. MnDOT’s
winning project locations cover the state (Figure 1-1).
The purpose of this study is to review all the award winning roadways in Minnesota to determine
common material, design factors, and considerations which may have contributed to the
roadways extended life, often exceeding 50 years despite the harsh Minnesota climate. For these
projects, all the available information and any pertinent supporting information are reviewed
including MnDOT Highway Pavement Management Application (HPMA) data and performance
histories as well as the construction histories and plans.

2
Table 1.1 MnDOT’s Record 14 APA Perpetual Pavement Award Winners
Year of award District Highway Original
Construction
2002 1 I-35 1966
2003 2 USTH 71 1964
2004 Metro USTH 10 1966
2005 3 TH 18 1959
2006 6 USTH 61 1969
2007 8 USTH 71 1970
2008 Metro TH 36 1960
2009 4 USTH 10 1973
2010 1 USTH 61 1969
2011 3 USTH 71 1962
2012 6 USTH 61 1969
2013 Metro TH 95 1961
2014 Metro TH 47 1966
2015 2 TH 71 1977

3
Figure 1-1 MnDOT’s Record 14 APA Perpetual Pavement Award Winners

4
CHAPTER 2: PERPETUAL PAVEMENTS
A perpetual pavement concept has been considered as one of the options to help increase
pavement life. These pavements are typically designed to last 40 to 50 years without structural
failure and only the surface asphalt layer requires rehabilitation or replacement when necessary.
It has shown that the perpetual pavements provide high cost-effectiveness and sustainability [3,
4]. These pavements also have the following benefits [5]:
Providing a more efficient design which eliminates costly overly conservative pavement
sections.
Eliminating reconstruction costs (by not exceeding a pavement’s structural capacity.
Reducing user delay costs due to roadway repair/rehabilitation.
Reducing the use of non-renewable resources (aggregates and asphalt).
Diminishing energy costs while the pavement is in service.
Reducing the overall life-cycle costs of the pavement network.
2.1 Mechanistic-Empirical Method
The idea behind perpetual pavements comes from the general belief that if the imposed traffic
loads produce responses that are below a certain threshold value, then the structural damage does
not accumulate [6]. These pavements are usually designed to resist bottom-up cracking by
incorporating thick hot mix asphalt (HMA) layers. This reduces the tensile strain at the bottom of
the HMA layer below a threshold value, called the endurance limit (EL).
Early on, Monismith et al. [7] proposed an EL of 70 microstrain, which would result in
approximately five million cycles to failure. Later, Powell et al. [8] defined the EL strain level
such that failure occurred at around 50 million cycles. They assumed that the maximum number
of equivalent single-axle loads for highway pavements should be 50 million cycles over a 40-
year period. With this assumption, by considering a shift factor of 10 for correlating the beam
fatigue failure in the laboratory with the field observations, five million cycles can be considered
an acceptable threshold value for EL definition. More recent laboratory test data indicate the EL
value may range from 70 to 100 microstrain [9]. However, to run a single fatigue test with this
definition, more than 50 days is needed considering the facilities in most typical asphalt
laboratories. Therefore, laboratory testing time is a major challenge in finding EL value for a
given mixture. More advanced explorations regarding the concept of EL and the required testing
time have been conducted by other researchers in the context of viscoelastic continuum damage
(VECD) theory [10-12].
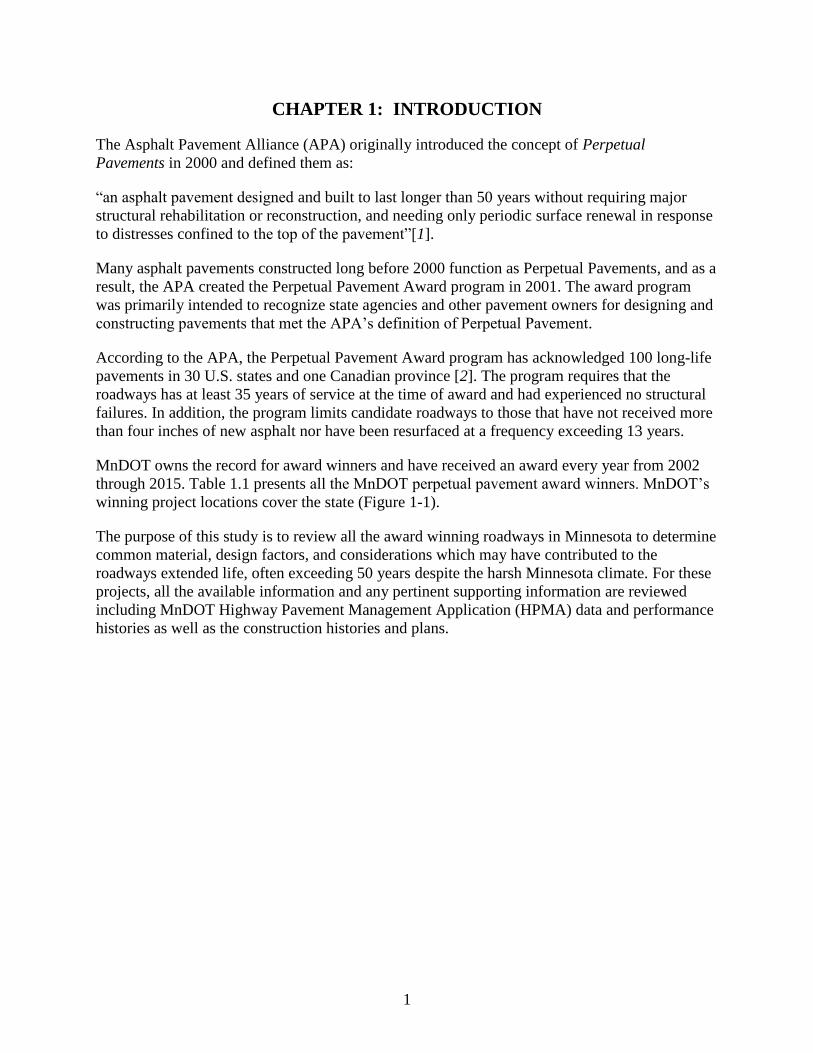
This mechanistic-empirical method uses the elements of a rational engineering analysis of the
reaction of the pavement in terms of stresses, strains, and displacements in the context of a
pavement’s expected life. According to perpetual pavement concept, there are limiting strains
below which damage does not occur, and therefore, damage is not accumulated [1]. Figure 2-1
shows this concept.
5
Figure 2-1 Simplified Flowchart of perpetual pavement Design [1]
2.2 Materials
Similar to conventional asphalt pavements, having a strong foundation is a key factor in
construction and performance of perpetual pavements. The foundation provides a working
platform which supports construction equipment for placing the asphalt layers and also the
compactors. This will also help in reaching the desired density in the asphalt layers. Throughout
the pavement performance period, the foundation provides support to the traffic loads and is
crucial to reducing variability from season to season due to freeze-thaw and moisture changes.
Also, when dealing with wet-dry cycles in expansive clays and freeze-thaw cycle in frost-
susceptible soils, the proper design and construction of the foundation is the key factor in
preventing volume changes [1]. Therefore, the perpetual pavement foundation must meet some
minimum requirements for stiffness. Sometimes this requirement will not be satisfied unless the
subgrade soils or base course materials go through a mechanical or chemical stabilization.
Perpetual pavement asphalt layer is usually consists of three layers: the surface layer, the
intermediate layer, and the base layer. Each layer serves specific functions:

6
The surface layer should be a high quality hot mix asphalt (HMA), or stone mastic
asphalt (SMA), or open graded friction course/bonded wearing course (OGFC)/(BWC)
which is designed to withstand the traffic load. This layer should be resistant to fatigue,
rutting, and low temperature cracking. It also needs to provide high friction.
The intermediate layer should provide both durability (moisture resistance) and rutting
resistance.
The base layer experiences the maximum tensile strain from bending under repeated
traffic load. This layer must provide excellent durability and the resistance to fatigue
cracking. Using a higher designed asphalt content in this layer is a common practice. A
higher binder content, lowers the air void content (typically to 2 to 3 percent air voids)
and increases the density, thus improving the durability and fatigue resistance.
In general, there are two options in order to limit base related rutting to the upper few inches of
the pavements: 1) increasing the structure's thickness or 2) increasing the stiffness of the
materials. Both options will help the vertical load get more widely distributed before reaching
the subgrade.
The three layer concept of a perpetual pavement asphalt layer is illustrated in Figure 2-2. Various
thicknesses and materials have been used in these layers for different perpetual pavement
designs. Ongoing research continues to review various examples of different three layer design
concepts for achieving a perpetual pavement.
Figure 2-2 Three layer concept of a perpetual pavement asphalt layer [13]
2.3 Construction
Construction of a perpetual pavement does not differ considerably from conventional asphalt
pavements, but it does require great attention to detail and a commitment to build it with quality
from the bottom up [1]. The following key points should also be considered:

7
High quality compaction is a critical factor (starting with foundation and including all
layers).
Optimum density and air void contents should be achieved.
Longitudinal joint issues related to low density should be minimized to prevent moisture
infiltration and damage.
Segregation (temperature segregation within the mixture and/or separation of fine and
coarse aggregate during production, transport, and placement) should be avoided.
Good bonding between layers should be achieved.
Normal quality control procedures (periodic testing and data analysis with good quality
control and inspection techniques) should be followed
2.4 Performance Monitoring
In the perpetual pavement concept all the associated distresses such as top-down fatigue
cracking, low temperature cracking, permanent deformation (rutting), and surface wear and
raveling should be confined in the top few inches of the pavement. Thus, a periodic monitoring
and assessment of pavement condition is a key factor to ensure a long pavement life.
Upon discovering such surface distresses, they should be properly addressed, so they do not turn
into structural defects. Mill and fill and/or thin overlay are usually good repair candidates for
perpetual pavements.
2.5 Perpetual Pavement Programs
There are a few programs available for design or renewal of perpetual pavements. A brief
introduction of these programs are provided in the following sections. The rePave program will
also be used to analyze the Metro District projects in Chapter 4. These analyses will determine
the alternatives that can be done to keep these long-lived perpetual pavements to serve for
another extended period of time, up to 50 years.
2.5.1 rePave
rePave is an interactive web-based pavement design scoping tool provides much-needed
guidance for deciding where and under what conditions to use existing pavement as part of
roadway renewal projects. It includes approaches for utilizing existing pavements to ensure
longer service life for roadways using asphalt, concrete, and innovative materials. The product
also identifies new alternatives to renewal approaches; and examines the advantages and
disadvantages of each approach, the circumstances under which each should be considered,
different construction techniques, and methods for integrating recycled materials with adjacent
materials and road structures [14].
The rePave program helps transportation agencies make better decisions with regard to pavement
renewal projects by using existing pavement as part of the design. As a result, the transportation
agencies, drivers, highway workers, contractors, and taxpayers will benefit from time savings
based on rapid reuse of existing materials, reduced costs for new pavement, and an accelerated
construction process.

8
This approach delivers long-lasting value by promoting durable and dependable roads, while
requiring less new pavement. As an example, Washington DOT has utilized the
recommendations offered in this guide, and has realized a 30 percent cost savings and a 50
percent reduction in user delay costs over the life of the new pavement [14].
In summary, rePave benefits include:
Saving materials (less new pavements).
Shorter construction time, which results in reduced exposure of travelers and construction
workers to work zone hazards.
A better return on investment based on longer pavement service life.
rePave inputs are as follows:
Project Info: name, route, and location
Existing section: pavement type, number of through lanes, thicknesses, and year of
construction of each layer
Proposed section: design period, Subgrade resilient modulus (MR), ESALs, growth rate,
current ADT, number of through lanes, and height restrictions
Exiting pavement conditions (current distresses):
o Fatigue cracking: % low, % medium, and % high
o Patching: % wheelpath area, and type of cracking (surface and/or full depth)
o Rutting: average rut depth
o Transverse cracking: # of cracks per 100 feet
o Stripping
Figure 3-5 shows a sample output of rePave program.
Figure 2-3 rePave sample program output

9
2.5.2 PerRoad
PerRoad uses the mechanistic-empirical design philosophy. The program couples layered elastic
analysis with a statistical analysis procedure (Monte Carlo simulation) to estimate stresses and
strains within a pavement. In order to predict the strains which would prove detrimental for
fatigue cracking or structural rutting, PerRoad requires the following inputs:
Seasonal pavement moduli and annual coefficient of variation (COV)
Seasonal resilient moduli of unbound materials and annual COV
Thickness of bound materials and COV
Thickness of unbound materials
Load spectrum for traffic
Location for pavement response analysis
Magnitude of limiting pavement responses
Transfer functions for pavement responses exceeding the user-specified level for
accumulating damage
PerRoad generally follows the M-E design process described in Figure 2. The Monte Carlo
simulation is a simple way of incorporating variability into the analysis to more realistically
characterize the pavement performance. the output for PerRoad consists of an evaluation of the
percentage of load repetitions lower than the limiting pavement responses specified in the input,
an estimate of the amount of damage incurred per single axle load, and a projected time to when
the accumulated damage is equal to 0.1 (damage of 1.0 is considered failure). On high volume
pavements, the critical parameter is the percentage of load repetitions below the limiting strains.
It is generally recommended that the designer strive for a value of 90 percent or more on high
volume roads [1].
The Mechanistic-Empirical Pavement Design Guide (MEPDG) and PerRoad computer programs
are both capable of conducting fatigue-based perpetual design for flexible pavements. Though
both programs utilize M-E concepts that incorporate similar types of material and traffic
characterization, they have fundamental differences in their level of detail pertaining to design
and the treatment of reliability. M-E design process is shown in Figure 2-4.
Timm and Davis [15] demonstrated that despite some significant differences in their design
approaches, the two programs can result in remarkably similar pavement cross-sections for
perpetual design. Also, the differences appeared to diminish as the fatigue endurance limit
increased. Figure 2-5 presents a sample output of PerRoad program.

10
Figure 2-4 M-E Design Process [15]

11
Figure 2-5 PerRoad sample program output
2.6 PerRoadXpress 1.0
PerRoadXpress is an easy-to-use, all-on-one-screen program for designing Perpetual Pavements
for low- and medium-volume roads (with AADT of less than 5,000) and parking lots. This
program was developed in response to requests by public works officials and owners of
commercial property. The program was developed by running a large number of low to medium
volume pavement design cases in PerRoad.

12
In the first step the user chooses a type of asphalt cement. The user then can input the actual
values for traffic and soils properties, or to use the program default values if they are unknown.
Granular base thicknesses from 0 to 10 inches are included. The software then quickly provides
the user with a recommendation for the total thickness of asphalt pavement needed for a
particular situation.
The single input screen simply consists of:
Functional classification of the road (urban or rural collector)
Two-way Annual Average Daily traffic
The anticipated traffic growth
The soil classification and/or soil modulus
The aggregate base thickness
The asphalt mixture modulus
It should be noted that in the case of low-volume roads, the perRoad 3.3 approach of using
limiting strains would result in overly thick pavements because a low number of heavy vehicles
such as garbage trucks and delivery vans would dictate the design [1]. Instead, the
PerRoadXpress designs were determined by limiting the damage occurring over a 30-year period
to a value of 0.1 or less (D=1.0 is the point of failure). The output of the required asphalt layer
thickness appears on the same screen as the input.
Figure 2-6 shows a sample output of PerRoadXpress program.

13
Figure 2-6 PerRoadXpress sample program output
Traffic Data
Soil Data
Agg. Base Data
HMA Data and
Design Thickness

14
CHAPTER 3: MINNESOTA AWARD WINNERS
In this chapter all the available information from the award winner roadways are gathered and
summarized in the following sections. Information from the following sources were reviewed:
Asphalt Pavement Alliance (APA) website (http://www.asphaltroads.org/)
Minnesota Asphalt Pavement Association (MAPA) records on Minnesota’s award
winners
MnDOT Highway Pavement Management Application (HPMA)
MnDOT 2007 Roadway History files by District
MnDOT Pavement Performance data
Construction plans
Also, traffic analysis was performed on available Average Daily Traffic (ADT) and Heavy
Commercial Annual Average Daily Traffic (HCAADT) data. The analysis included fitting the
available AADT data with a compound growth function to estimate the traffic at any given time
including the time of construction. The growth function is presented below:
𝐴𝐷𝑇 = 𝐴𝐷𝑇0 × (1 − 𝑟100⁄ )𝑛−1
where,
ADT0 : traffic at the time of construction,
r : growth rate (%), and
n : number of years.
It should be noted that since the available traffic data were mostly from the current years (after
1990), the growth rates do not consider any likely bumps that have happened in traffic volumes
prior to 1990, so the traffic volume at the time of construction (ADT0) calculated from the
present data should be over predicted in most of the cases and have been provided for
informational purposes only in this report.
The following sections present the award winners information from 2002 to 2015. This
information includes:
The location of the roadway
The construction history
The mainline typical section at the time of construction
Maintenance activities performed
Available ADT data
Available HCAADT data
Calculated percentage of HCAADT for the available data
Fitted compound growth function
Calculated traffic at the time of construction (ADT0) and the growth rate (r)
Pavement performance data in the year of award and in 2015, including:

15
o Ride Quality Index (RQI) for assessing the pavement roughness, on a scale of 0
(very poor) to 5 (very good)
o Surface Rating (SR) for assessing pavement distresses, on a scale of 0 to 4
o Pavement Quality Index (PQI) which is the overall pavement quality on a scale of
0 to 4.5
o International Roughness Index (IRI) in inches per mile
o Average rut depth in inches
3.1 Interstate 35 (2002 winner)
This roadway is a 7-mile section of I-35 in Pine County, from the Willow River to the
Carlton/Pine County Line (Figure 3-1 and Figure 3-2). It was built in 1966 by Minnesota Valley
Improvement Company during the time when MnDOT was changing its road construction
strategy, moving away from the use of thinner asphalt surface treatments to deep-strength asphalt
pavement. Figure 3-3 shows I-35 mainline typical section available from 1964 construction plan.
Figure 3-4 shows PQI versus time for this section.
Control Section: 5880
Reference Point (RP): 206+00.483 to 213+00.334
Construction history:
Year State Project
Number (SP) Description
2011 5880-176 8 inches of concrete pavement from 211+00.534 to
213+00.334 (1.830 miles)
1998(1) 5880-159 3 inches mill and 4.5 inches overlay (with 15% RAP) – from
206+00.483 to 211+00.534 (5.051 miles)
1989(2) 5880-126 2 inches mill and 3.5 inches overlay (with 20% RAP) – from
206+00.483 to 211+00.534 (5.051 miles)
1967 5880-62
- 4 inches HMA surface
- 4 inches plant-mixed bituminous base
- 4 inches bituminous treated gravel base
1966 5880-49
- 12 inches select granular subbase with the upper 3 inches
treated with bituminous material
- subgrade corrections up to 3 feet, backfilled with granular
material from adjacent cuts (1)9 years after the first overlay (2)22 years after the initial construction

16
Other information in 2002:
Total HMA thickness in 2002: 11 inches
Traffic load to date of 4.2 million ESALs
Pavement performance data:
o RQI= 4.2 (very good)
o SR= 3.6 (very good)
o PQI= 3.9 (good)
o IRI= 38 inches/mile
o Average rut depth= 0.2 inches
Pavement performance data in 2015:
RQI= 3.0 (fair)
SR= 3.4 (good)
PQI= 3.2 (good)
IRI= 103 inches/mile
Rut depth= 0.1 inches
Figure 3-1 I-35 from Willow River to Carlton/Pine County Line

17
Figure 3-2 I-35 in Pine County
Figure 3-3 I-35 mainline typical section (1964 construction plan)

18
Figure 3-4 PQI vs. year for I-35
3.1.1 I-35 Traffic Analysis
Figure 3-5 shows ADT vs. year for the available I-35 traffic data as well as the best-fit line using
compound growth model. Using the model, the traffic in 1966 was calculated to be
approximately 10,100 ADT with an increase rate of 0.96%. Figure 3-6 and Figure 3-7 present
HCAADT and HCAADT%, respectively. The average HCAADT% was 8.5% from 1994 to
2012.
Figure 3-5 ADT vs. year and compound growth fit for I-35
0
1
2
3
4
5
1970 1980 1990 2000 2010 2020
PQ
I
Year
1st OL 2nd OL
0
2,000
4,000
6,000
8,000
10,000
12,000
14,000
16,000
18,000
1990 1995 2000 2005 2010 2015
AD
T
Year
Award Year

19
Figure 3-6 HCAADT vs. year for I-35
Figure 3-7 HCAADT (%) vs. year for I-35
3.2 Trunk Highway 71 (2003 winner)
The 2003 award winner is a 9-mile section of TH 71 from the South Hubbard County Line to
Park Rapids (Figure 3-8 and Figure 3-9). It was built in 1960 by Duininck Brothers/Gilchrist
Company. Some subgrade corrections; excavation and backfilling with select granular material
0
200
400
600
800
1,000
1,200
1,400
1,600
1,800
1990 1995 2000 2005 2010 2015
HC
AA
DT
Year
Award Year
0
2
4
6
8
10
12
14
1990 1995 2000 2005 2010 2015
HC
AA
DT
(%)
Year
Award Year

20
was performed. Initial construction also included a 1.5 inch road-mixed bituminous surface over
the aggregate base. Figure 3-10 shows TH 71 mainline typical section available from 1959
construction plan. Figure 3-11 shows PQI versus time for this section.
Control Section: 2904
Reference Point (RP): 251+00.366 to 260+00.660
Construction history:
Year State Project
Number (SP) Description
2009 2904-16 full depth reclamation (FDR) with 6 inches overlay
1998 2904-13 chip seal
1994(1) 2904-12 1.5 inches overlay
1964 2904-09 3 inches plant-mixed bituminous surface
1960 2904-08
- 1.5 inches road-mixed bituminous surface
- 4.5 inches of aggregate base
- some subgrade corrections; excavation and backfilling with
select granular material (1)30 years after the initial construction
Other information in 2003:
Total HMA thickness: 6 inches
Traffic load to date: 2 million ESALs
Pavement performance data:
o RQI= 3.2 (very good)
o SR= 3.1 (good)
o PQI= 3.1 (good)
o IRI= 101 inches/mile
o Average rut depth= 0.2 inches
Pavement performance data in 2015:
RQI= 3.8 (good)
SR= 3.8 (very good)
PQI= 3.8 (good)
IRI= 54 inches/mile
Rut depth= 0.2 inches

21
Figure 3-8 TH 71 from South Hubbard County Line to Park Rapids
Figure 3-9 TH 71 in Hubbard County

22
Figure 3-10 TH 71 mainline typical section (1959 construction plan)
Figure 3-11 PQI vs. year for TH 71
3.2.1 TH 71 Traffic Analysis
Figure 3-12 shows ADT vs. year for the available TH 71 traffic data as well as the best-fit line
using the compound growth model. Using the model, the traffic in 1964 was approximately
5,300 ADT with an increase rate of 0.71%. Figure 3-13 and Figure 3-14 present HCAADT and
HCAADT%, respectively. The average HCAADT% was 7.8% from 1994 to 2012.
0
1
2
3
4
5
1960 1970 1980 1990 2000 2010 2020
PQ
I
Year
1st OL Reclaim

23
Figure 3-12 ADT vs. year and compound growth fit for TH 71
Figure 3-13 HCAADT vs. year for TH 71
0
1,000
2,000
3,000
4,000
5,000
6,000
7,000
8,000
9,000
10,000
1990 1995 2000 2005 2010 2015
AD
T
Year
Award Year
0
100
200
300
400
500
600
700
800
900
1990 1995 2000 2005 2010 2015
HC
AA
DT
Year
Award Year

24
Figure 3-14 HCAADT (%) vs. year for TH 71
3.3 Trunk Highway 10 (2004 winner)
This section is a 3-mile section of TH 10 in Anoka County (Figure 3-15 and Figure 3-16). There
was one swamp section on this alignment, approximately 400 feet in length, containing a
maximum depth of 7 feet of unstable organic material which was excavated and filled with
uniform select granular material. Figure 3-17 shows TH 10 mainline typical section available
from 1964 construction plan. Figure 3-18 shows PQI versus time for this section.
Control Section: 0215
Reference Point (RP): 224+00.015 to 227+00.898
0
2
4
6
8
10
12
1990 1995 2000 2005 2010 2015
HC
AA
DT
(%)
Year
Award Year

25
Construction history:
Year State Project
Number (SP) Description
2013(1) 0202-94 5/8 inches ultrathin bonded wearing course (UTBWC)
2013(1) 0215-74 2 inches mill and 2 inches overlay
1994(2) 0215-47 2 inches mill and 3.5 inches overlay
1978(3) 0215-29 3/4 inches overlay
1966
0215-08
0215-09
0215-10
- 1 inch of bituminous wearing course
- 3 inches of bituminous binder course
- 3 inches of plant-mixed bituminous base
- 6 inches of aggregate base
- 18 inches of select granular subbase, upper 3 inches treated
with bituminous
- limited subgrade correction, excavation and backfilling with
select granular material (1)19 years after the second overlay (2)16 years after the first overlay (3)12 years after the initial construction
Other information in 2004:
Total HMA thickness: 9.25 inches
Traffic load to date: 13.5 million ESALs
Pavement performance data:
o RQI= 3.4 (good)
o SR= 3.6 (very good) –from 2003 data
o PQI= 3.5 (good)
o IRI= 79 inches/mile
o Average rut depth= 0.1 inches
Pavement performance data in 2015:
RQI= 3.8 (good)
SR= 3.9 (very good)
PQI= 3.8 (good)
IRI= 61 inches/mile
Rut depth= 0.1 inches

26
Figure 3-15 TH 10 in Anoka County
Figure 3-16 TH 10 in Anoka County

27
Figure 3-17 TH 10 mainline typical section (1964 construction plan)
Figure 3-18 PQI vs. year for TH 10
3.3.1 TH 10 Traffic Analysis
Figure 3-12 shows ADT vs. year for the available TH 10 traffic data as well as the best-fit line
using the compound growth model. Using the model, the traffic in 1966 was approximately
52,500 ADT with an increase rate of 0.66%. Figure 3-13 and Figure 3-14 present HCAADT and
HCAADT%, respectively. The average HCAADT% was 4.7% from 1998 to 2012.
0
1
2
3
4
5
1960 1970 1980 1990 2000 2010 2020
PQ
I
Year
1st OL 2nd OL 3rd OL

28
Figure 3-19 ADT vs. year and compound growth fit for TH 10
Figure 3-20 HCAADT vs. year for TH 10
0
10,000
20,000
30,000
40,000
50,000
60,000
70,000
80,000
1995 2000 2005 2010 2015
AD
T
Year
Award Year
0
500
1,000
1,500
2,000
2,500
3,000
3,500
4,000
1995 2000 2005 2010 2015
HC
AA
DT
Year
Award Year

29
Figure 3-21 HCAADT (%) vs. year for TH 10
3.4 Trunk Highway 18 (2005 Winner)
This section is an 18-mile stretch of TH 18 between Brainerd and Garrison in Crow County
(Figure 3-22 and Figure 3-24). In this section swamp areas were cut and filled with select
granular material. Also, because of existence high water table, the road was built with a frost-free
design to help facilitate drainage. It was built in 1958 by W. Hodgman & Sons Inc. Figure 3-24
shows TH 18 mainline typical section available from 1955 construction plan. Figure 3-25 shows
PQI versus time for this section.
Construction of this section was staged over a year, so the subgrade moisture content reaches
equilibrium. This allowed the foundation to go through settling in the cycle of seasons and
enhanced the overall pavement structure stability. Initial construction also included a 1.5 inch
road-mixed bituminous surface over gravel base.
Control Section: 1803
Reference Point (RP): 002+00.327 to 020+00.502
0
1
2
3
4
5
6
1995 2000 2005 2010 2015
HC
AA
DT
(%)
Year
Award Year

30
Construction history:
Year State Project
Number (SP) Description
2006(1) 1803-35 2 inches mill and 3.5 inches overlay
1993(2) 1803-32 1.5 inches overlay
1982(3) 1803-24 2.5 inches overlay
1967 N/A seal coat
1959 1803-15 3 inches of surface HMA
1958 1803-08
- 1.5 inches of road-mixed bituminous base
- 4.5 inches of gravel base
- 10 inches of select granular subbase
- subgrade correction, excavation and backfilling with select
granular material (1)13 years after the second overlay (2)11 years after the first overlay (3)23 years after the initial construction
Other information in 2005:
Total HMA thickness: 8.5 inches
Traffic load to date: 1 million ESALs
Pavement performance data:
o RQI= 3.0 (fair)
o SR= 2.9 (fair) – from 2004 data
o PQI= 3.0 (fair)
o IRI= 109 inches/mile
o Average rut depth= 0.2 inches
Pavement performance data in 2015:
RQI= 3.8 (good)
SR= 3.5 (good) – from 2014 data
PQI= 3.6 (good)
IRI= 56 inches/mile
Rut depth= 0.1 inches

31
Figure 3-22 TH 18 from Brainerd to Garrison
Figure 3-23 TH 18 in Crow Wing County

32
Figure 3-24 TH 18 mainline typical section (1955 construction plan)
Figure 3-25 PQI vs. year for TH 18
3.4.1 TH 18 Traffic Analysis
Figure 3-26 shows ADT vs. year for the available TH 18 traffic data as well as the best-fit line
using the compound growth model. Using the model, the traffic in 1959 was approximately
5,500 ADT with an increase rate of 0.69%. Figure 3-27 and Figure 3-28 present HCAADT and
HCAADT%, respectively. The average HCAADT% was 4.8% from 1994 to 2011.
0
1
2
3
4
5
1970 1980 1990 2000 2010 2020
PQ
I
Year
1st OL 2nd OL 3rd OL

33
Figure 3-26 ADT vs. year and compound growth fit for TH 18
Figure 3-27 HCAADT vs. year for TH 18
0
1,000
2,000
3,000
4,000
5,000
6,000
7,000
8,000
9,000
1990 1995 2000 2005 2010 2015
AD
T
Year
Award Year
0
100
200
300
400
500
600
700
1990 1995 2000 2005 2010 2015
HC
AA
DT
Year
Award Year

34
Figure 3-28 HCAADT (%) vs. year for TH 18
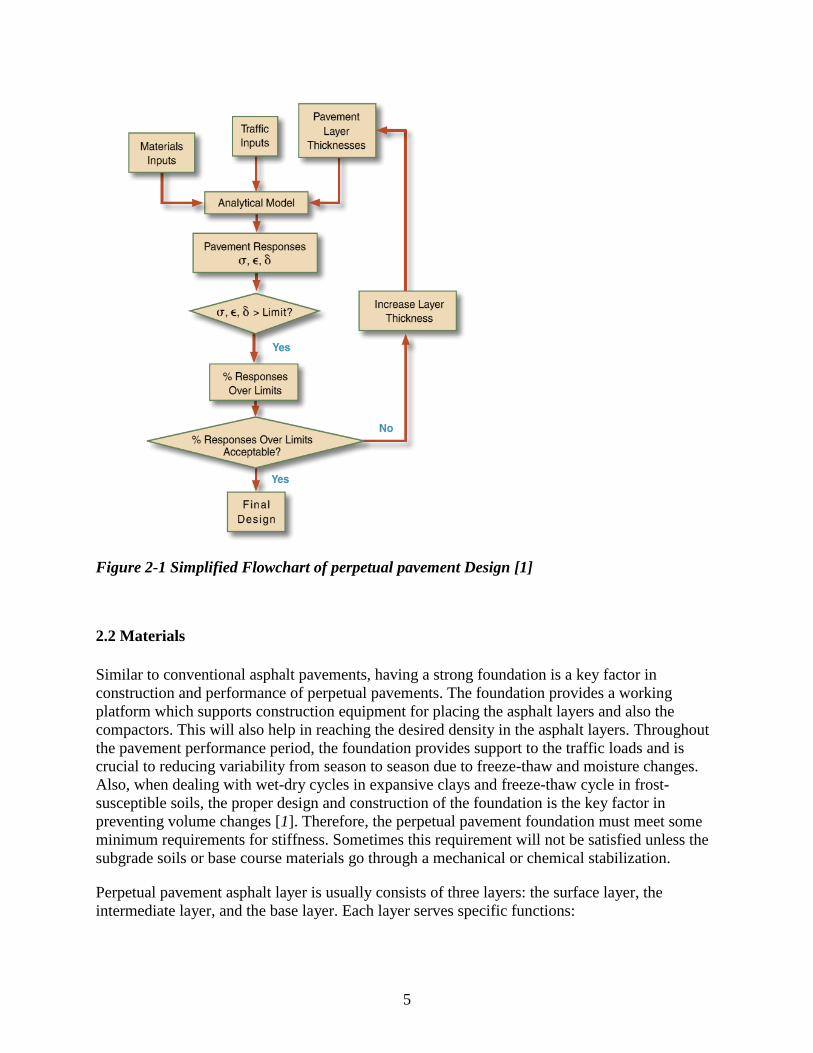
3.5 Trunk Highway 61 (2006 Winner)
This section is an 8-mile stretch of TH 61 south bound extended between Wabasha and Kellogg
in Wabasha County (Figure 3-29 and Figure 3-30). The initial construction began in 1969 and
was completed 3 years later. This staging construction allowed the foundation to go through
seasonal cycles which enhanced the overall pavement structural stability. A select granular
backfill material was used to create a drainable, strong construction platform to pave against.
Also, using a thin HMA overlay has prolonged the service of the roadway. Figure 3-31 shows
TH 61 mainline typical section available from 1969 construction plan. Figure 3-37 shows PQI
versus time for this section.
Control Section: 7905
Reference Point (RP): 053+00.979 to 061+00.868
0
1
2
3
4
5
6
7
8
1990 1995 2000 2005 2010 2015
HC
AA
DT
(%)
Year
Award Year

35
Construction history:
Year State Project
Number (SP) Description
2006 8826-51 chip seal
2000(1) 7905-19 1.5 inches mill and 3 inches overlay
1988(2) 7905-15 2 inches overlay
1973 7905-08 3 inches of plant-mixed asphalt wearing course
1969 7905-06
- 2 inches of plant-mixed asphalt binder course
- 6 inches of aggregate base
- 12 inches of select granular subbase
- some subgrade corrections (1)12 years after the first overlay (2)15 years after the initial construction
Other information in 2006:
Total HMA thickness: 8.5 inches
Traffic load to date: 3 million ESALs
Pavement performance data:
o RQI= 3.8 (good)
o SR= 3.6 (very good) – from 2005 data
o PQI= 3.7 (good)
o IRI= 56 inches/mile
o Average rut depth= 0.3 inches
Pavement performance data in 2015:
RQI= 3.0 (fair)
SR= 3.2 (good)
PQI= 3.1 (good)
IRI= 96 inches/mile
Rut depth= 0.2 inches

36
Figure 3-29 TH 61 from Wabasha to Kellogg
Figure 3-30 TH 61 in Wabasha County
37
Figure 3-31 TH 61 mainline typical section (1969 construction plan)
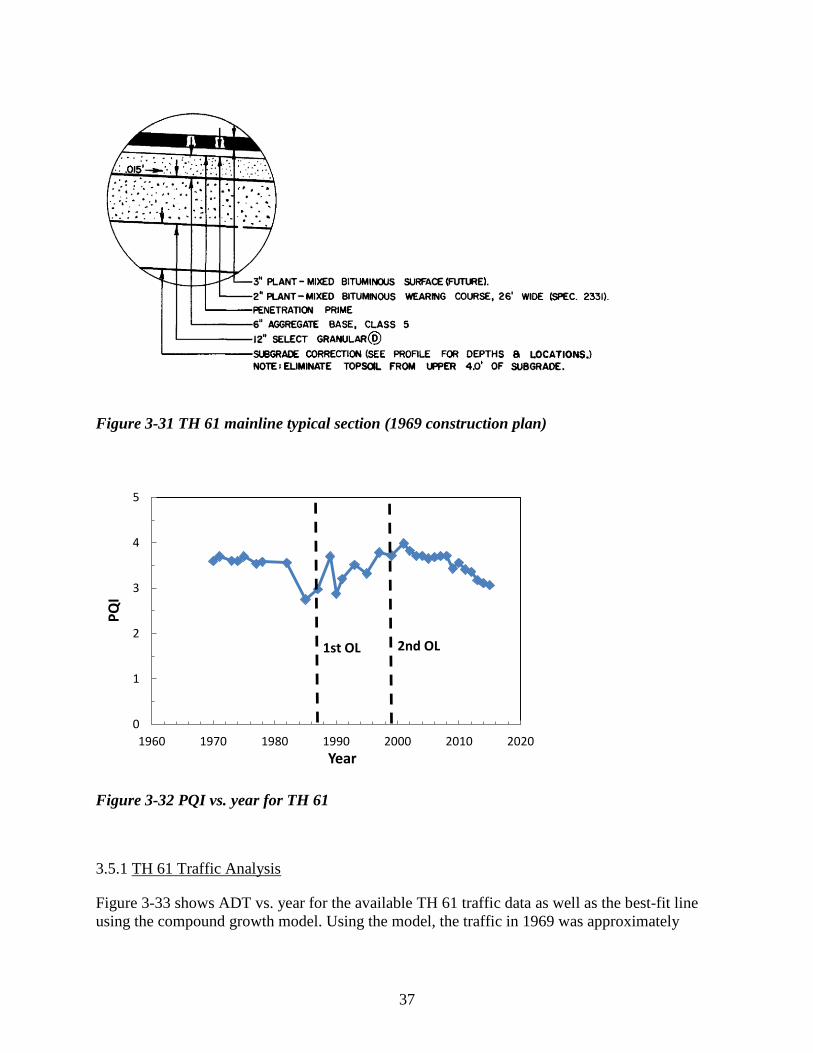
Figure 3-32 PQI vs. year for TH 61
3.5.1 TH 61 Traffic Analysis
Figure 3-33 shows ADT vs. year for the available TH 61 traffic data as well as the best-fit line
using the compound growth model. Using the model, the traffic in 1969 was approximately
0
1
2
3
4
5
1960 1970 1980 1990 2000 2010 2020
PQ
I
Year
1st OL 2nd OL

38
5,300 ADT with an increase rate of 0.38%. Figure 3-34 and Figure 3-35 present HCAADT and
HCAADT%, respectively. The average HCAADT% was 10.7% from 1994 to 2012.
Figure 3-33 ADT vs. year and compound growth fit for TH 61
Figure 3-34 HCAADT vs. year for TH 61
0
1,000
2,000
3,000
4,000
5,000
6,000
7,000
1990 1995 2000 2005 2010 2015
AD
T
Year
Award Year
0
100
200
300
400
500
600
700
800
900
1990 1995 2000 2005 2010 2015
HC
AA
DT
Year
Award Year

39
Figure 3-35 HCAADT (%) vs. year for TH 61
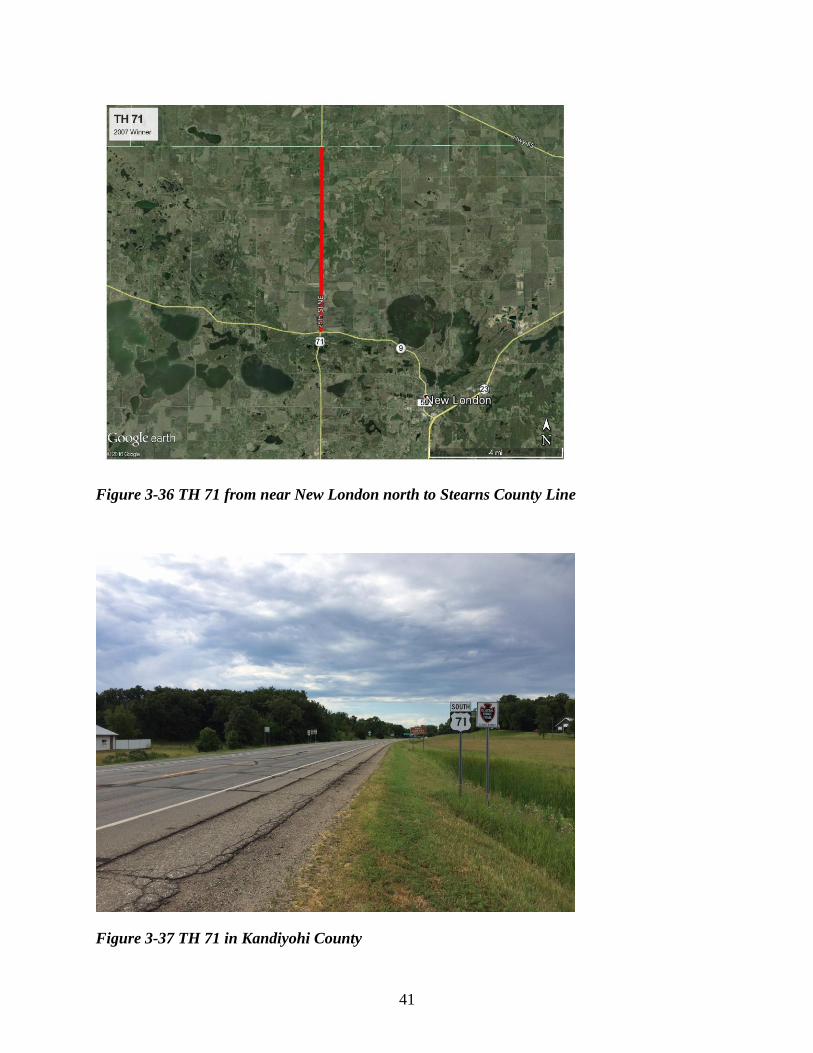
3.6 Trunk Highway 71 (2007 Winner)
This is a 6-mile section of TH 71 from Highway 9 near New London north to the Stearns County
line (Figure 3-36 and Figure 3-37). The initial construction was completed in 1970. During the
construction of this section, a subgrade correction was made to the upper four feet to eliminate
topsoil and to increase the uniformity of compacted materials. A select granular backfill material,
which was stabilized in some places, was then used to create a drainable, strong construction
platform to pave on. Initial construction also included a 1 inch road-mixed bituminous surface
over the aggregate base. Figure 3-36 shows TH 71 mainline typical section available from 1967
construction plan. Figure 3-39 shows PQI versus time for this section.
Control Section: 3414
Reference Point (RP): 138+00.732 to 144+00.273
0
2
4
6
8
10
12
14
16
1990 1995 2000 2005 2010 2015
HC
AA
DT
(%)
Year
Award Year

40
Construction history:
Year State Project
Number (SP) Description
2013 8828-143 chip seal and fog seal
2005(1) 3414-14 2 inches mill and 4 inches overlay
1991(2) 3414-13 1.5 inches overlay
1967 3414-09
- 1.5 inches of plant-mixed bituminous wearing course
- 1.5 inches of plant-mixed bituminous binder course
- 1 inch of road-mixed bituminous base course
- 5 inches of aggregate base
- 12 inches of select granular subbase
- subgrade corrections in the upper 4 feet (1)14 years after the first overlay (2)22 years after the initial construction
Other information in 2007:
Total HMA thickness: 6.5 inches
Traffic load to date: 2 million ESALs
Pavement performance data:
o RQI= 3.9 (good)
o SR= 3.8 (very good) – from 2006 data
o PQI= 3.8 (good)
o IRI= 51 inches/mile
o Average rut depth= 0.1 inches
Pavement performance data in 2015:
RQI= 3.4 (good)
SR= 3.3 (good) – from 2014 data
PQI= 3.3 (good)
IRI= 79 inches/mile
Rut depth= 0.1 inches
41
Figure 3-36 TH 71 from near New London north to Stearns County Line
Figure 3-37 TH 71 in Kandiyohi County

42
Figure 3-38 TH 71 mainline typical section (1967 construction plan)
Figure 3-39 PQI vs. year for TH 71
3.6.1 TH 71 Traffic Analysis
Figure 3-40 shows ADT vs. year for the available TH 71 traffic data as well as the best-fit line
using the compound growth model. Using the model, the traffic in 1970 was approximately
0
1
2
3
4
5
1960 1970 1980 1990 2000 2010 2020
PQ
I
Year
1st OL 2nd OL

43
2,600 ADT with an increase rate of 0.90%. Figure 3-41 and Figure 3-42 present HCAADT and
HCAADT%, respectively. The average HCAADT% was 13.1% from 1994 to 2012.
Figure 3-40 ADT vs. year and compound growth fit for TH 71
Figure 3-41 HCAADT vs. year for TH 71
0
500
1,000
1,500
2,000
2,500
3,000
3,500
4,000
4,500
5,000
1990 1995 2000 2005 2010 2015
AD
T
Year
Award Year
0
100
200
300
400
500
600
700
1990 1995 2000 2005 2010 2015
HC
AA
DT
Year
Award Year

44
Figure 3-42 HCAADT (%) vs. year for TH 71
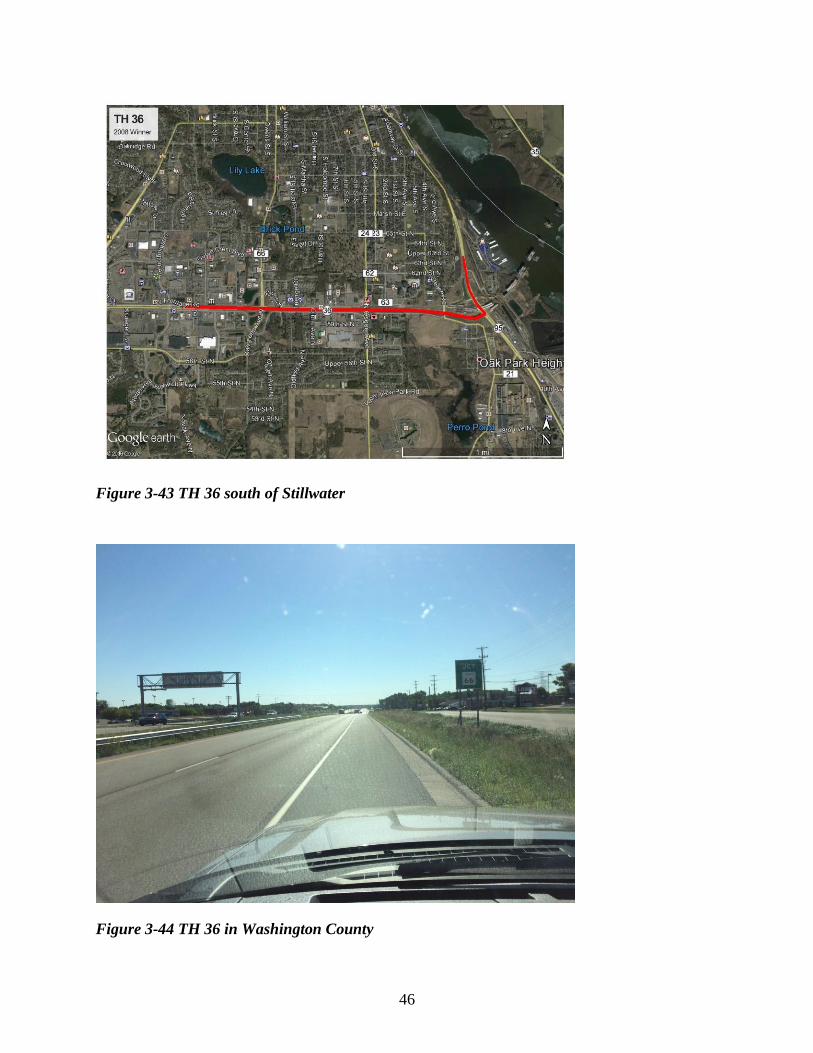
3.7 Trunk Highway 36 (2008 Winner)
This is a 2-mile section of TH 36 south of Stillwater in Washington County (Figure 3-43 and
Figure 3-44). The initial construction was completed in 1960. During the construction of this
section, one to three feet of unsuitable material was excavated and adverse subsoil conditions
were corrected which led to an increase in the uniformity of compacted materials. A select
granular backfill material was then used to create a drainable, strong construction platform to
pave against. Initial construction also included a 1 inch road-mixed bituminous surface over the
aggregate base. Figure 3-45 shows TH 36 mainline typical section available from 1958
construction plan. Figure 3-46 shows PQI versus time for this section.
Control Section: 8214
Reference Point (RP): 202+00.120 to 204+00.290
0
2
4
6
8
10
12
14
16
18
1990 1995 2000 2005 2010 2015
HC
AA
DT
(%)
Year
Award Year
45
Construction history:
Year State Project
Number (SP) Description
2015 8214-114
reconstruction as a part of St. Croix Crossing project:
- 4 inches wear course mixture
- 2.5 inches non-wear course mixture
- 6 inches of aggregate base
- 12 inches of select granular subbase
- 36 inches of granular material
2008 8825-282 microsurfacing
2000(1) 8214-133 1.5 inches mill and 1.5 inches overlay
1987(2) 8214-97 1.5 inches mill and 1.5 inches overlay
1960 8214-13
- 1.5 inches of plant-mixed bituminous wearing course
- 1.5 inches of plant-mixed bituminous binder course
- 1 inch of road-mixed bituminous base course
- 12 to 20 inches of aggregate base
- 12 to 36 inches of select granular subbase
- subgrade corrections in the upper one to three feet (1)13 years after the first overlay (2)27 years after the initial construction
Other information in 2008:
Total HMA thickness: 4 inches
Traffic load to date: 13.5 million ESALs
Pavement performance data:
o RQI= 3.3 (good)
o SR= 3.3 (good) – from 2007 data
o PQI= 3.2 (good)
o IRI= 87 inches/mile
o Average rut depth= 0.3 inches
Pavement performance data in 2015:
RQI= 3.4 (good)
SR= 3.9 (very good)
PQI= 3.6 (good)
IRI= 81 inches/mile
Rut depth= 0.1 inches
46
Figure 3-43 TH 36 south of Stillwater
Figure 3-44 TH 36 in Washington County

47
Figure 3-45 TH 36 mainline typical section (1958 construction plan)
Figure 3-46 PQI vs. year for TH 36
3.7.1 TH 36 Traffic Analysis
Figure 3-47 shows ADT vs. year for the available TH 36 traffic data as well as the best-fit line
using the compound growth model. Using the model, the traffic in 1960 was approximately
24,100 ADT with an increase rate of 0.41%. Figure 3-48 and Figure 3-49 present HCAADT and
HCAADT%, respectively. The average HCAADT% is 3.7% from 1998 to 2012.
0
1
2
3
4
5
1970 1980 1990 2000 2010 2020
PQ
I
Year
1st OL 2nd OL

48
Figure 3-47 ADT vs. year and compound growth fit for TH 36
Figure 3-48 HCAADT vs. year for TH 36
0
5,000
10,000
15,000
20,000
25,000
30,000
35,000
1995 2000 2005 2010 2015
AD
T
Year
Award Year
0
200
400
600
800
1,000
1,200
1,400
1995 2000 2005 2010 2015
HC
AA
DT
Year
Award Year

49
Figure 3-49 HCAADT (%) vs. year for TH 36
3.8 Trunk Highway 10 (2009 Winner)
This is a 15.5-mile section of TH 10 from east of Detroit Lakes to Perham in Becker County
(Figure 3-50 and Figure 3-51). The initial construction was completed in 1973. During the
construction of this section, one foot of unsuitable material was excavated and adverse subsoil
conditions were corrected which led to an increase in the uniformity of compacted materials. A
select granular backfill material was then used to create a drainable, strong construction platform
to pave against and to provide long-lasting foundation. Figure 3-52 shows TH 10 mainline
typical section available from 1973 construction plan. Figure 3-53 shows PQI versus time for
this section.
Control Section: 5607
Reference Point (RP): 056+00.144 to 071+00.741
0
1
1
2
2
3
3
4
4
5
1995 2000 2005 2010 2015
HC
AA
DT
(%)
Year
Award Year

50
Construction history:
Year State Project
Number (SP) Description
2001(1) 5607-36
5606-40 2 inches mill and 3.5 inches overlay
1993(2) 5607-32 1.5 inches mill and 1.5 inches overlay (west bound)
1973 5607-22
5606-20
- 1.5 inches of plant-mixed bituminous wearing course
- 2 inches of plant-mixed bituminous binder course
- 6 inch of plant-mixed bituminous base course
- 12 inches of select granular subbase with stabilized upper
one inch
- subgrade corrections in the upper one foot (1)8 years after the first overlay (2)20 years after the initial construction
Other information in 2009:
Total HMA thickness: 11 inches
Traffic load to date: 9 million ESALs
Subgrade soils vary between sandy loam to sand
Pavement performance data:
o RQI= 3.7 (good)
o SR= 3.5 (good) – from 2008 data
o PQI= 3.6 (good)
o IRI= 57 inches/mile
o Average rut depth= 0.1 inches
Pavement performance data in 2015:
RQI= 3.3 (good)
SR= 3.4 (good)
PQI= 3.4 (good)
IRI= 85 inches/mile
Rut depth= 0.1 inches

51
Figure 3-50 TH 10 from east of Detroit Lakes to Perham
Figure 3-51 TH 10 near Perham in Becker County

52
Figure 3-52 TH 10 mainline typical section (1973 construction plan)
Figure 3-53 PQI vs. year for TH 10
3.8.1 TH 10 Traffic Analysis
Figure 3-54 shows ADT vs. year for the available TH 10 traffic data as well as the best-fit line
using the compound growth model. Using the model, the traffic in 1973 was approximately
3,900 ADT with an increase rate of 2.0% over 40 years. Figure 3-55 and Figure 3-56 present
HCAADT and HCAADT%, respectively. The average HCAADT% was 10.3% from 1994 to
2011.
0
1
2
3
4
5
1970 1980 1990 2000 2010 2020
PQ
I
Year
1st OL 2nd OL

53
Figure 3-54 ADT vs. year and compound growth fit for TH 10
Figure 3-55 HCAADT vs. year for TH 10
0
1,000
2,000
3,000
4,000
5,000
6,000
7,000
8,000
9,000
1990 1995 2000 2005 2010 2015
AD
T
Year
Award Year
0
100
200
300
400
500
600
700
800
1990 1995 2000 2005 2010 2015
HC
AA
DT
Year
Award Year

54
Figure 3-56 HCAADT (%) vs. year for TH 10
3.9 Trunk Highway 61 (2010 Winner)
This is a 5-mile section of TH 61 in Lake County (Figure 3-57 and Figure 3-58). The initial
construction was completed in 1969. During the construction of this section, four feet of
unsuitable material was excavated and adverse subsoil conditions were corrected which led to an
increase in the uniformity of compacted materials. A select granular backfill material was then
used to create a drainable, strong construction platform to pave against and to provide long-
lasting foundation. Figure 3-59 shows TH 10 mainline typical section available from 1967
construction plan. Figure 3-60 shows PQI versus time for this section.
Control Section: 3807
Reference Point (RP): 057+00.591 to 062+00.523
Construction history:
Year State Project
Number (SP) Description
2001(1) 8821-46 2 inches mill and 3.5 inches overlay
1969 3807-23
- 1.5 inches of plant-mixed bituminous wearing course
- 2.5 inches of plant-mixed bituminous binder course
- 6 inches of aggregate base with stabilized upper 1.5 inches
- subgrade corrections in the upper four feet (1)32 years after the initial construction
0
2
4
6
8
10
12
14
16
1990 1995 2000 2005 2010 2015
HC
AA
DT
(%)
Year
Award Year

55
Other information in 2010:
Total HMA thickness: 5.5 inches
Traffic load to date: 1 million ESALs
Pavement performance data:
o RQI= 3.5 (good)
o SR= 3.6 (very good) – from 2009 data
o PQI= 3.6 (good)
o IRI= 67 inches/mile
o Average rut depth= 0.3 inches
Pavement performance data in 2015:
RQI= 2.9 (fair)
SR= 3.2 (good)
PQI= 3.1 (good)
IRI= 100 inches/mile
Rut depth= 0.2 inches
Figure 3-57 TH 61 north of Silver Bay

56
Figure 3-58 TH 61 in Lake County
Figure 3-59 TH 61 mainline typical section (1967 construction plan)

57
Figure 3-60 PQI vs. year for TH 61
3.9.1 TH 61 Traffic Analysis
Figure 3-61 shows ADT vs. year for the available TH 61 traffic data as well as the best-fit line
using the compound growth model. Using the model, the traffic in 1969 was approximately
2,800 ADT with an increase rate of 0.47%. Figure 3-62 and Figure 3-63 present HCAADT and
HCAADT%, respectively. The average HCAADT% was 10.3% from 1994 to 2012.
Figure 3-61 ADT vs. year and compound growth fit for TH 61
0
1
2
3
4
5
1960 1970 1980 1990 2000 2010 2020
PQ
I
Year
1st OL
0
500
1,000
1,500
2,000
2,500
3,000
3,500
4,000
1990 1995 2000 2005 2010 2015
AD
T
Year
Award Year

58
Figure 3-62 HCAADT vs. year for TH 61
Figure 3-63 HCAADT (%) vs. year for TH 61
3.10 Trunk Highway 71 (2011 Winner)
This is a 17-mile section of TH 71 from Sauk Centre to Long Prairie in Stearns County and Todd
County (Figure 3-64 and Figure 3-65). TH 71 is part of the international route which connects
southern Louisiana to Canadian border. The initial construction was completed in 1962 by
Duininck Construction and BAB Construction. During construction, 12 inches of sand fill was
placed in some areas to replace existing soil that was unsuitable for construction. Initial
0
50
100
150
200
250
300
350
400
450
1990 1995 2000 2005 2010 2015
HC
AA
DT
Year
Award Year
0
2
4
6
8
10
12
14
16
1990 1995 2000 2005 2010 2015
HC
AA
DT
(%)
Year
Award Year

59
construction also included a 1.5 inch road-mixed bituminous surface over the aggregate base.
Figure 3-66 shows TH 71 mainline typical section available from 1956 construction plan.
Figure 3-67 shows PQI versus time for this section.
Control Section: 7707
Reference Point (RP): 169+00.035 to 185+00.744
Construction history:
Year State Project
Number (SP) Description
2008 8823-120 seal coat
2002(1) 7319-34 2 inches mill and 3.5 inches overlay
1987(2) 7319-22 1.5 inches overlay
1967 NA chip seal
1962 7707-13 3 inches of plant-mixed bituminous wearing course
1957 7707-09
- 1.5 inches of road-mixed bituminous base
- 5 inches of aggregate base
- some subgrade corrections (1)15 years after the first overlay (2)25 years after the initial construction
Other information in 2011:
Total HMA thickness: 6 inches
Traffic load to date: 1.5 million ESALs
Pavement performance data:
o RQI= 3.9 (good)
o SR= 3.6 (very good) – from 2010 data
o PQI= 3.7 (good)
o IRI= 54 inches/mile
o Average rut depth= 0.1 inches
Pavement performance data in 2015:
RQI= 3.6 (good)
SR= 3.4 (good) – from 2014 data
PQI= 3.5 (good)
IRI= 68 inches/mile
Rut depth= 0.2 inches

60
Figure 3-64 TH 71 from Sauk Centre to Long Prairie
Figure 3-65 TH 71 in Todd County

61
Figure 3-66 TH 71 mainline typical section (1956 construction plan)
Figure 3-67 PQI vs. year for TH 71
3.10.1 TH 71 Traffic Analysis
Figure 3-68 shows ADT vs. year for the available TH 71 traffic data as well as the best-fit line
using the compound growth model. Using the model, the traffic in 1962 was approximately
7,600 ADT with an increase rate of 0.52%. Figure 3-69 and Figure 3-70 present HCAADT and
HCAADT%, respectively. The average HCAADT% is 9.6% from 1994 to 2012.
0
1
2
3
4
5
1970 1980 1990 2000 2010 2020
PQ
I
Year
1st OL 2nd OL

62
Figure 3-68 ADT vs. year and compound growth fit for TH 71
Figure 3-69 HCAADT vs. year for TH 71
0
2,000
4,000
6,000
8,000
10,000
12,000
1990 1995 2000 2005 2010 2015
AD
T
Year
Award Year
0
200
400
600
800
1,000
1,200
1,400
1990 1995 2000 2005 2010 2015
HC
AA
DT
Year
Award Year

63
Figure 3-70 HCAADT (%) vs. year for TH 71
3.11 Trunk Highway 61 (2012 Winner)
This is a 20-mile section of TH 61 from Kellogg to Minnesota City in Wabasha County and
Winona County (Figure 3-71 and Figure 3-72). The initial construction was completed in 1969.
During the construction of this section, two to three feet of unsuitable material was excavated
and adverse subsoil conditions were corrected which led to an increase in the uniformity of
compacted materials. A select granular backfill material was then used to create a drainable,
strong construction platform to pave against and to provide long-lasting foundation. Figure 3-73
shows TH 61 mainline typical section available from 1966 construction plan. Figure 3-74 shows
PQI versus time for this section.
Control Section: 7904
Reference Point (RP): 034+00.352 to 053+00.979
0
2
4
6
8
10
12
14
1990 1995 2000 2005 2010 2015
HC
AA
DT
(%)
Year
Award Year

64
Construction history:
Year State Project
Number (SP) Description
2009(1) 7904-39
8506-68
mill and overlay (variable depths): 3 inches mill and 3 inches
overlay in urban sections. 1.5 to 2 inches mill and 3 to 3.5
inches overlay in rural sections.
2005 8826-38 seal coat
2000(2) 7904-38 2 inches mill and 3 inches overlay (south bound)
1990(3) 8506-57 1 inch mill and 3 inches overlay (north bound)
1988(4) 7904-31 2.5 inches overlay (south bound)
1969 7904-18
8506-37
- 5 inches of plant-mixed bituminous
- 7 inches of aggregate base
- 12 inches of select granular subbase
- subgrade corrections in the upper 2 to 3 feet (1)19 years after the north bound first overlay, 9 years after the south bound second overlay (2)12 years after the first overlay (south bound) (3)21 years after the initial construction (4)19 years after the initial construction
Other information in 2012:
Total HMA thickness: ~7 to 10 inches
Traffic load to date: 3.5 million ESALs
Pavement performance data:
o RQI= 3.9 (good)
o SR= 3.7 (very good) – from 2010 and 2011 data
o PQI= 3.8 (good)
o IRI= 51 inches/mile
o Average rut depth= 0.1 inches
Pavement performance data in 2015:
RQI= 3.6 (good)
SR= 3.6 (very good)
PQI= 3.6 (good)
IRI= 62 inches/mile
Rut depth= 0.1 inches

65
Figure 3-71 TH 61 from Kellogg to Minnesota City
Figure 3-72 TH 61 in Wabasha County and Winona County

66
Figure 3-73 TH 61 mainline typical section (1966 construction plan)
Figure 3-74 PQI vs. year for TH 61
3.11.1 TH 61 Traffic Analysis
Figure 3-75 shows ADT vs. year for the available TH 61 traffic data as well as the best-fit line
using the compound growth model. Using the model, the traffic in 1969 was approximately
5,100 ADT with an increase rate of 0.91%. Figure 3-76 and Figure 3-77 present HCAADT and
HCAADT%, respectively. The average HCAADT% was 9.4% from 1994 to 2011.
0
1
2
3
4
5
1960 1970 1980 1990 2000 2010 2020
PQ
I
Year
1st OL 2nd OLSB only
3rd OL

67
Figure 3-75 ADT vs. year and compound growth fit for TH 61
Figure 3-76 HCAADT vs. year for TH 61
0
1,000
2,000
3,000
4,000
5,000
6,000
7,000
8,000
9,000
1990 1995 2000 2005 2010 2015
AD
T
Year
Award Year
0
100
200
300
400
500
600
700
800
1990 1995 2000 2005 2010 2015
HC
AA
DT
Year
Award Year

68
Figure 3-77 HCAADT (%) vs. year for TH 61
3.12 Trunk Highway 95 (2013 Winner)
This is a 5-mile section of TH 95 from south of Stillwater to Bayport in Washington County
(Figure 3-78 and Figure 3-82). The initial construction was completed in 1960. During the
construction of this section, in certain areas, the in-place material was subcut and backfilled with
select granular material to an unknown depth to improve drainage in the structure. Initial
construction also included a prime coat and 1.5 inch road-mixed bituminous surface over the
aggregate base. Figure 3-80 shows TH 95 mainline typical section available from 1959
construction plan. Figure 3-94 shows PQI versus time for this section.
Control Section: 8209
Reference Point (RP): 105+00.389 to 110+00.360
0
2
4
6
8
10
12
1990 1995 2000 2005 2010 2015
HC
AA
DT
(%)
Year
Award Year

69
Construction history:
Year State Project
Number (SP) Description
2000(1) 8209-41 2 inches mill and 2 inches overlay
1992(2) NA 3 inches overlay
1961 8209-18 3 inches of plant-mixed bituminous wearing course
1960 8209-17
- 1.5 inches of road-mixed bituminous base
- 7.5 inches of aggregate base
- 12 inches of select granular subbase
- some subgrade corrections (1)8 years after the first overlay (2)31 years after the initial construction
Other information in 2013:
Total HMA thickness: 6 inches
Traffic load to date: 2 million ESALs
Pavement performance data:
o RQI= 3.1 (good)
o SR= 2.8 (fair) – from 2005 data
o PQI= 3.0 (fair)
o IRI= 101 inches/mile
o Average rut depth= 0.1 inches
Pavement performance data in 2015:
RQI= 3.0 (fair)
SR= 2.8 (fair)
PQI= 2.8 (fair)
IRI= 104 inches/mile
Rut depth= 0.1 inches

70
Figure 3-78 TH 95 from south of Stillwater to Bayport
Figure 3-79 TH 95 in Washington County

71
Figure 3-80 TH 95 mainline typical section (1959 construction plan)
Figure 3-81 PQI vs. year for TH 95
3.12.1 TH 95 Traffic Analysis
Figure 3-82 shows ADT vs. year for the available TH 95 traffic data as well as the best-fit line
using the compound growth model. Using the model, the traffic in 1961 was approximately
9,400 ADT with an increase rate of 0.66%. Figure 3-83 and Figure 3-84 present HCAADT and
HCAADT%, respectively. The average HCAADT% is 5.6% from 1998 to 2012.
0
1
2
3
4
5
1970 1980 1990 2000 2010 2020
PQ
I
Year
1st OL 2nd OL
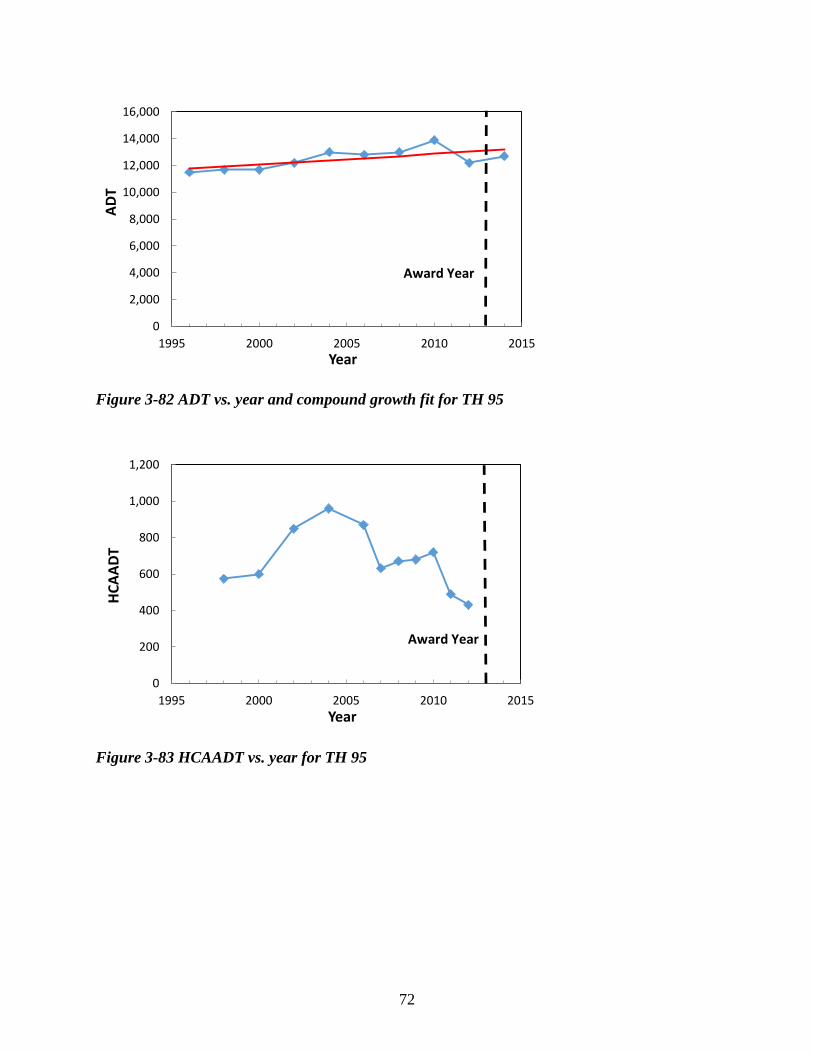
72
Figure 3-82 ADT vs. year and compound growth fit for TH 95
Figure 3-83 HCAADT vs. year for TH 95
0
2,000
4,000
6,000
8,000
10,000
12,000
14,000
16,000
1995 2000 2005 2010 2015
AD
T
Year
Award Year
0
200
400
600
800
1,000
1,200
1995 2000 2005 2010 2015
HC
AA
DT
Year
Award Year

73
Figure 3-84 HCAADT (%) vs. year for TH 95
3.13 Trunk Highway 47 (2014 Winner)
This is a 5-mile section of TH 47 from Columbia Heights to Fridley in Anoka County
(Figure 3-85 and Figure 3-86). The initial construction was completed in 1966. During the
construction of this section, 12 to 36 inches of the in-place material was subcut and backfilled
with select granular material to provide better drainage. Figure 3-87 shows TH 47 mainline
typical section available from 1964 construction plan. Figure 3-88 shows PQI versus time for
this section.
Control Section: 0205
Reference Point (RP): 005+00.900 to 010+00.642
0
1
2
3
4
5
6
7
8
1995 2000 2005 2010 2015
HC
AA
DT
(%)
Year
Award Year

74
Construction history:
Year State Project
Number (SP) Description
2009(1) 0205-84 mill and overlay the same depth (2 to 6 inches)
1989
(1991)
(1994)(2)
0205-56
(0205-59)
(0205-67)
2 inches mill and 3 to 3.5 inches overlay
1972 0205-41 seal coat
1966
(1967)
0205-15
(0205-18)
- 1 inch of asphalt wearing course
- 3 inches of asphalt binder course
- 3 inches of plant-mixed bituminous base
- 18 inches of granular subbase with upper 6 inches treated
with bituminous
- subgrade corrections in the upper one to three feet (1)15 to 20 years after the first overlay (2)22 to 27 years after the initial construction
Other information in 2014:
Total HMA thickness: 8 to 8.5 inches
Traffic load to date: 3.4 million ESALs
Pavement performance data:
o RQI= 3.6 (good)
o SR= 3.5 (good)
o PQI= 3.5 (good)
o IRI= 61 inches/mile
o Average rut depth= 0.3 inches
Pavement performance data in 2015:
RQI= 3.5 (good)
SR= 3.5 (good) – from 2014 data
PQI= 3.5 (good)
IRI= 64 inches/mile
Rut depth= 0.1 inches

75
Figure 3-85 TH 47 from Columbia Heights to Fridley
Figure 3-86 TH 47 in Anoka County

76
Figure 3-87 TH 47 mainline typical section (1964 construction plan)
Figure 3-88 PQI vs. year for TH 47
0
1
2
3
4
5
1960 1970 1980 1990 2000 2010 2020
PQ
I
Year
1st OL 2nd OL

77
3.13.1 TH 47 Traffic Analysis
Figure 3-89 shows ADT vs. year for the available TH 47 traffic data as well as the best-fit line
using the compound growth model. Using the model, the traffic in 1966 was approximately
33,400 ADT with an increase rate of 0.31%. Figure 3-90 and Figure 3-91 present HCAADT and
HCAADT%, respectively. The average HCAADT% is 3.4% from 1998 to 2012.
Figure 3-89 ADT vs. year and compound growth fit for TH 47
Figure 3-90 HCAADT vs. year for TH 47
0
5,000
10,000
15,000
20,000
25,000
30,000
35,000
40,000
45,000
1995 2000 2005 2010 2015
AD
T
Year
Award Year
0
100
200
300
400
500
600
700
800
900
1995 2000 2005 2010 2015
HC
AA
DT
Year
Award Year

78
Figure 3-91 HCAADT (%) vs. year for TH 47
3.14 Trunk Highway 71 (2015 Winner)
This is a 3.2-mile section of TH 71 north of Bemidji in Beltrami County (Figure 3-92 and
Figure 3-93). The initial construction was completed in 1975. During the construction of this
section, in-place material was subcut to various depths and then backfilled with select granular
material to provide better drainage in some areas to allow for better drainage and stability.
Figure 3-94 shows TH 71 mainline typical section available from 1975 construction plan.
Figure 3-95 shows PQI versus time for this section.
Control Section: 0410
Reference Point (RP): 317+00.313 to 320+00.518
0
1
2
3
4
5
1995 2000 2005 2010 2015
HC
AA
DT
(%)
Year
Award Year
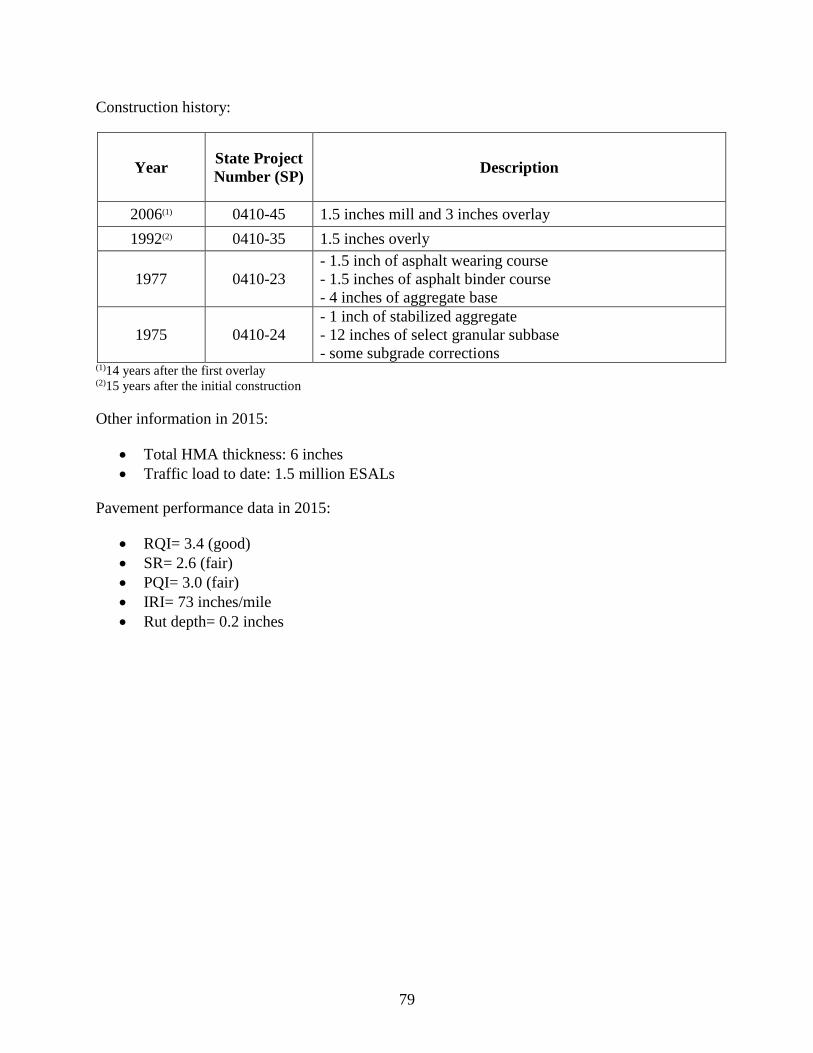
79
Construction history:
Year State Project
Number (SP) Description
2006(1) 0410-45 1.5 inches mill and 3 inches overlay
1992(2) 0410-35 1.5 inches overly
1977 0410-23
- 1.5 inch of asphalt wearing course
- 1.5 inches of asphalt binder course
- 4 inches of aggregate base
1975 0410-24
- 1 inch of stabilized aggregate
- 12 inches of select granular subbase
- some subgrade corrections (1)14 years after the first overlay (2)15 years after the initial construction
Other information in 2015:
Total HMA thickness: 6 inches
Traffic load to date: 1.5 million ESALs
Pavement performance data in 2015:
RQI= 3.4 (good)
SR= 2.6 (fair)
PQI= 3.0 (fair)
IRI= 73 inches/mile
Rut depth= 0.2 inches

80
Figure 3-92 TH 71 north of Bemidji
Figure 3-93 TH 71 in Beltrami County

81
Figure 3-94 TH 71 mainline typical section (1975 construction plan)
Figure 3-95 PQI vs. year for TH 71
0
1
2
3
4
5
1970 1980 1990 2000 2010 2020
PQ
I
Year
1st OL 2nd OL

82
3.14.1 TH 71 Traffic Analysis
Figure 3-96 shows ADT vs. year for the available TH 71 traffic data as well as the best-fit line
using the compound growth model. Using the model, the traffic in 1966 was approximately
2,700 ADT with an increase rate of 0.91%. Figure 3-97 and Figure 3-98 present HCAADT and
HCAADT%, respectively. The average HCAADT% is 8.4% from 1998 to 2010.
Figure 3-96 ADT vs. year and compound growth fit for TH 71
Figure 3-97 HCAADT vs. year for TH 71
0
500
1,000
1,500
2,000
2,500
3,000
3,500
4,000
1990 1995 2000 2005 2010 2015 2020
AD
T
Year
Award Year
0
50
100
150
200
250
300
350
1995 2000 2005 2010 2015 2020
HC
AA
DT
Year
Award Year

83
Figure 3-98 HCAADT (%) vs. year for TH 71
3.15 Summary and Discussion
From reviewing the Minnesota perpetual pavement award winner sections, the following
common factors were identified:
Most of the sections were constructed in the 1960s when the rate of construction was
probably low. This might have resulted in better compaction, and therefore, performance
improvements.1
In most of the cases subgrade corrections were performed. Unsuitable material was
excavated and adverse subsoil conditions were corrected. This could have led to an
increase in the uniformity of compacted materials.
After subgrade excavation, a select granular backfill material was used in subgrade
correction areas which created a drainable, strong construction platform to pave against
and provided long-lasting foundations.
Use of non-frost susceptible base and subbase materials in underlying layers have
improved the drainage resulting in improved performance.
In some cases the upper portion of the granular subbase or aggregate base was treated
with bituminous which has strengthened the foundation.
1 Comment made by a Technical Advisory Panel member, Thomas Wood.
0
1
2
3
4
5
6
7
8
9
10
1995 2000 2005 2010 2015 2020
HC
AA
DT
(%)
Year
Award Year

84
In some cases a layer of prime coat was placed over the aggregate base before placing the
asphalt layer(s). This has increased the integrity of the granular base and can reduce dust
during construction.2
In some cases the construction was extended over a year or more. This staged
construction may have allowed the foundation to go through seasonal cycles and thus
enhanced the overall pavement structural stability.
Even though these projects were not designed as perpetual pavements, several projects
had a road-mixed bituminous base material providing a flexible fatigue resistant base
layer called for in the three layer perpetual pavement design. Road-mixed base could
provide similar characteristics as current emulsion base stabilization materials used at
MnRoad and various other projects throughout the state that have shown exceptional
performance. Base stabilization not only provides a strong foundation for construction of
perpetual pavements, but also creates a bound layer, thus transferring the maximum
tensile strains deeper into the pavement structure which has shown to reduce the strain
levels at the bottom of the upper HMA layers. Research has demonstrated that reduction
of stress and strain to below a certain level at the bottom of the HMA layer increases the
pavement fatigue life.
The above considerations in conjunction with good inspection and construction practices in the
field at the time of placement, have enabled the award winner projects to service to the public for
many years.
2 According to a Technical Advisory Panel member, Jill Thomas, placing a prime coat was making the construction
process difficult and was discontinued later.

85
CHAPTER 4: IN-DEPTH ANALYSIS & EVALUATION (METRO)
This chapter focuses on the four project locations within the Metro District (District 5). These
projects were selected because their information was expected to be more readily available and
also for their ease of access for field sampling. These projects include:
TH 10, 2004 winner
TH 36, 2008 winner
TH 95. 2013 winner
TH 47, 2014 winner
To further investigate and characterize these sites and refine the rePave data analysis, the
following field and laboratory testing were performed on these projects:
Field testing: coring, hand auger borings, and Dynamic Cone Penetrometer (DCP) test in
the selected core holes
Laboratory testing:
o Thickness and density
o Asphalt content
o Extracted gradation o Resilient Modulus (ASTM D 7369)
4.1 Field Testing
4.1.1 Coring and Hand Auger
Three sets of cores were taken from each roadway resulting in a total of 12 sets of cores from all
the Metro District projects. Each core set contained three cores with different location
characteristics:
Cracked, wheelpath (CWP)
Uncracked, wheelpath (UCWP)
Uncracked, non-wheelpath (UNWP)
Figure 4-1 presents the coring plan layout at each coring location.

86
Figure 4-1 Coring Plan Layout
Among the Metro District projects TH 36, which was reconstructed in 2015, was in good
condition and did not have any surface cracks in the wheelpath area in the proximity of the
coring locations, so the core sets from this project had two cores from the uncracked locations
only (UNWP and UCWP).
Table 4.1 presents the individual cores thicknesses, as well as the averages core thicknesses for
each core set and each project. A total of 33 cores were obtained in this study. The individual
core photos can be found in Appendix A of this report. As the core photos show, the core
bottoms are generally in good physical condition even though they were in service for 40+ years.
The average core thicknesses in Table 4.1 are very close to the expected HMA thicknesses from
the construction plans and maintenance histories presented in Chapter 3:
TH 10 (2004): 9.9 inches from the plans, 9.9 inches from coring
TH 36 (2008): 6.5 inches from the plans, 6.5 inches from coring
TH 95 (2013): 6 inches from the plans, 5.4 inches from coring
TH 47 (2014): 8 to 8.5 inches from the plans, 7.9 inches from coring
UNWP
UCWP
CWP

87
Table 4.1 Metro District projects core thickness data
Roadway Set # Core # Core
Location
Thickness
(in.)
Avg.
Thickness
(in.)
Avg.
Thickness
(in.)
TH 10
(2004 winner)
Set 1
1 CWP 10
10.3
9.9
2 UNWP 10 3/4
3 UWP 10
Set 2
4 CWP 6
8.7 5 UWP 10
6 UNWP 10
Set 3
7 CWP 10 1/4
10.8 8 UNWP 11 1/4
9 UWP 10 3/4
TH 36
(2008 winner)
Set 4 19 UWP 7
6.9
6.5
20 UNWP 6 3/4
Set 5 21 UWP 6 1/2
6.5 22 UNWP 6 1/2
Set 6 23 UWP 6 1/4
6.3 24 UNWP 6 1/4
TH 95
(2013 winner)
Set 7
25 CWP 5
5.0
5.4
26 UNWP 5 1/4
27 UWP 4 3/4
Set 8
28 CWP 6 1/4
6.3 29 UNWP 6 1/2
30 UWP 6
Set 9
31 CWP 4
5.0 32 UNWP 5
33 UWP 6
TH 47
(2014 winner)
Set 10
10 CWP 8 1/2
8.8
7.9
11 UNWP 9 1/2
12 UWP 8 1/4
Set 11
13 CWP 5 1/2
6.5 14 UNWP 8
15 UWP 6
Set 12
16 CWP 8
8.3 17 UNWP 8
18 UWP 9

88
4.1.2 DCP testing
Three DCP tests were performed in each Metro District project to measure the strength of in-situ
materials. DCP tests were performed in selected core holes (one test per coring location).
DCP test results are usually expressed in terms of Dynamic Penetration Index (DPI), defined as
the vertical movement of the DCP cone produced by one drop of hammer, expressed in inch per
blow. Figure 4-2 through Figure 4-4 show the DPI versus penetration depth for the four tested
sections. As these graphs show, in almost all the cases, the DPI values are less than 0.3
inch/blow which is an indication of the in-situ materials being strong. The DCP penetration
depth ranges between 5 to 11 inches, with an average of 8 inches.
Figure 4-6 compares the averaged DPI versus penetration depth for all the four projects on the
same graph. As this graph suggests, the roadways are very similar in terms of in-situ material’s
strength with TH 47 being slightly weaker than the others.
Figure 4-2 DPI versus penetration depth for TH 10 (2004 winner)
0
2
4
6
8
10
12
0 0.5 1 1.5 2
Pen
etra
tio
n (
inch
)
DPI (inch/blow)
Core 3
Core 5
Core 8

89
Figure 4-3 DPI versus penetration depth for TH 36 (2008 winner)
Figure 4-4 DPI versus penetration depth for TH 95 (2013 winner)
0
2
4
6
8
10
12
0 0.5 1 1.5 2P
enet
rati
on
(in
ch)
DPI (inch/blow)
Core 19
Core 22
Core 24
0
2
4
6
8
10
12
0 0.5 1 1.5 2
Pen
etra
tio
n (
inch
)
DPI (inch/blow)
Core 25
Core 29
Core 33

90
Figure 4-5 DPI versus penetration depth for TH 47 (2014 winner)
Figure 4-6 DPI versus penetration depth comparison for all the tested roadways
DPI can be converted to California Bearing Ratio (CBR) using the formula suggested by US
Army Corps of Engineers (for CBR’s greater than 10):
𝐶𝐵𝑅 =292
𝐷𝑃𝐼1.12
where,
DPI= Penetration Index in mm/blow.
0
2
4
6
8
10
12
0 0.5 1 1.5 2P
enet
rati
on
(in
ch)
DPI (inch/blow)
Core 12
Core 14
Core 17
0
2
4
6
8
10
12
0.0 0.5 1.0 1.5 2.0
Pen
etra
tio
n (
inch
)
DPI (inch/blow)
TH 10 (2004)
TH 36 (2008)
TH 95 (2013)
TH 47 (2014)

91
Using the average DPI value for each roadway and the above formula, CBR can be calculated for
each project:
TH 10 (2004): CBR=100
TH 36 (2008): CBR=100
TH 95 (2013): CBR=100
TH 47 (2014): CBR=84
As expected, all the projects resulted in high CBR values.
4.2 Laboratory Testing
4.2.1 Core Densities and Asphalt Contents
UWP and UNWP core densities were measured which Table 4.2 presents the results. The
densities were measured on the whole cores. The CWP cores were cracked and crumbled in most
of the cases, so their densities could not be measured.
As Table 4.2 shows, the individual densities generally range from 92 to 95%. Also, the average
densities are very similar among the projects and range between 93 to 94%.
For each project a representative sample of asphalt mixture was tested for asphalt content.
Surprisingly, the binder content was 5.3% for all the four projects. The theoretical maximum
densities (Rice densities) were as follows:
TH 10 (2004): 2.505
TH 36 (2008): 2.538
TH 95 (2013): 2.527
TH 47 (2014): 2.506

92
Table 4.2 Metro District projects core densities
Roadway Set # Core # Core
Location
Relative
Density (%)
Avg.
Density (%)
Avg.
Density (%)
TH 10
(2004)
Set 1
2A(1) UNWP 93.6
92.6
93.3
2B(1) UNWP 91.5
3 UWP 92.6
Set 2 5 UWP 93.2
93.1 6 UNWP 92.9
Set 3
8 UNWP 94.6
94.4 9A(1) UWP 96.0
9B(1) UWP 92.6
TH 36
(2008)
Set 4 19 UWP 94.2
93.5
93.4
20 UNWP 92.8
Set 5 21 UWP 93.5
92.7 22 UNWP 91.8
Set 6 23 UWP 94.4
94.2 24 UNWP 93.9
TH 95
(2013)
Set 7 26 UNWP 95.0
95.3
93.9
27 UWP 95.6
Set 8 29 UNWP 92.8
93.8 30 UWP 94.7
Set 9 32 UNWP 92.4
92.7 33 UWP 93.0
TH 47
(2014)
Set 10 11 UNWP 93.8
94.2
94.0
12 UWP 94.5
Set 11 14 UNWP 93.7
94.1 15 UWP 94.5
Set 12 17 UNWP 93.3
93.8 18 UWP 94.3
(1)two-piece core
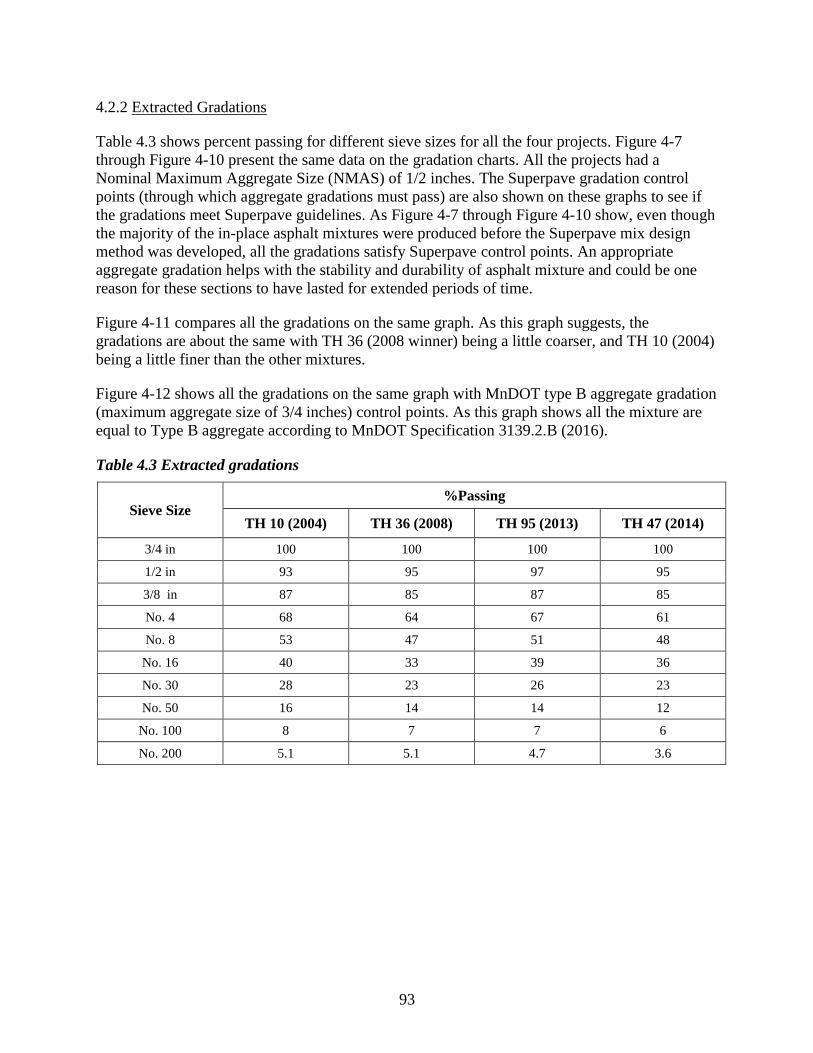
93
4.2.2 Extracted Gradations
Table 4.3 shows percent passing for different sieve sizes for all the four projects. Figure 4-7
through Figure 4-10 present the same data on the gradation charts. All the projects had a
Nominal Maximum Aggregate Size (NMAS) of 1/2 inches. The Superpave gradation control
points (through which aggregate gradations must pass) are also shown on these graphs to see if
the gradations meet Superpave guidelines. As Figure 4-7 through Figure 4-10 show, even though
the majority of the in-place asphalt mixtures were produced before the Superpave mix design
method was developed, all the gradations satisfy Superpave control points. An appropriate
aggregate gradation helps with the stability and durability of asphalt mixture and could be one
reason for these sections to have lasted for extended periods of time.
Figure 4-11 compares all the gradations on the same graph. As this graph suggests, the
gradations are about the same with TH 36 (2008 winner) being a little coarser, and TH 10 (2004)
being a little finer than the other mixtures.
Figure 4-12 shows all the gradations on the same graph with MnDOT type B aggregate gradation
(maximum aggregate size of 3/4 inches) control points. As this graph shows all the mixture are
equal to Type B aggregate according to MnDOT Specification 3139.2.B (2016).
Table 4.3 Extracted gradations
Sieve Size %Passing
TH 10 (2004) TH 36 (2008) TH 95 (2013) TH 47 (2014)
3/4 in 100 100 100 100
1/2 in 93 95 97 95
3/8 in 87 85 87 85
No. 4 68 64 67 61
No. 8 53 47 51 48
No. 16 40 33 39 36
No. 30 28 23 26 23
No. 50 16 14 14 12
No. 100 8 7 7 6
No. 200 5.1 5.1 4.7 3.6
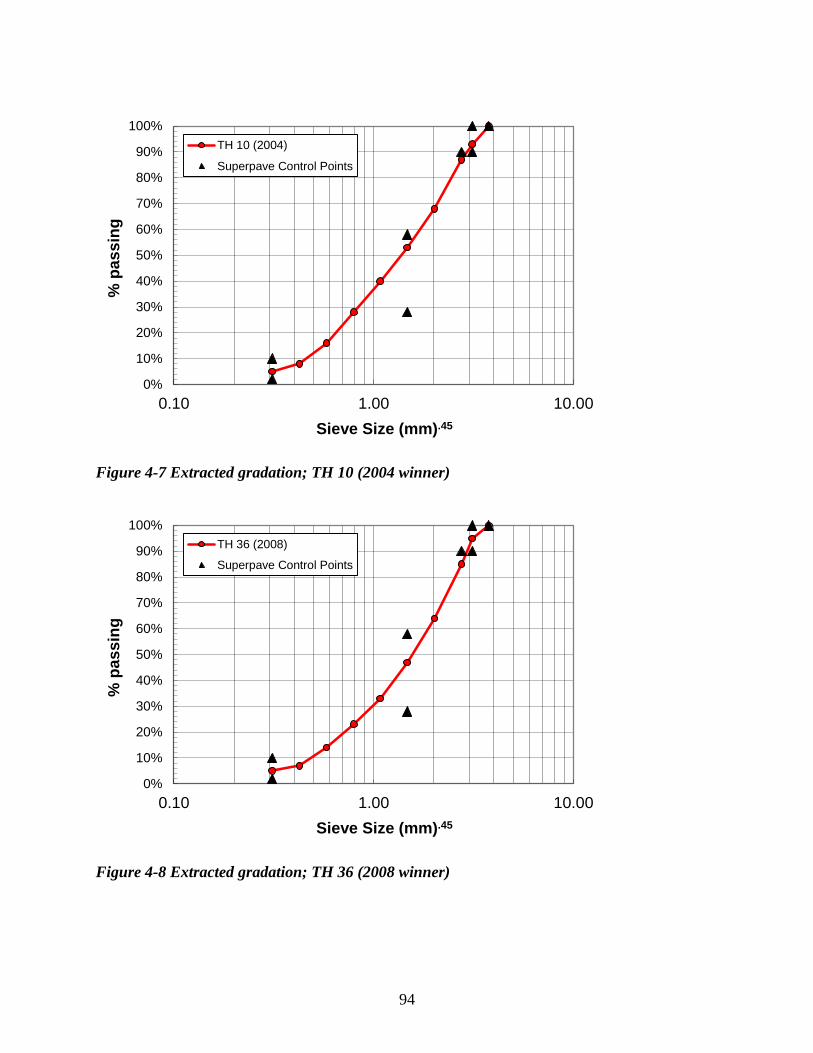
94
Figure 4-7 Extracted gradation; TH 10 (2004 winner)
Figure 4-8 Extracted gradation; TH 36 (2008 winner)
0%
10%
20%
30%
40%
50%
60%
70%
80%
90%
100%
0.10 1.00 10.00
% p
as
sin
g
Sieve Size (mm).45
TH 10 (2004)
Superpave Control Points
0%
10%
20%
30%
40%
50%
60%
70%
80%
90%
100%
0.10 1.00 10.00
% p
as
sin
g
Sieve Size (mm).45
TH 36 (2008)
Superpave Control Points

95
Figure 4-9 Extracted gradation; TH 95 (2013 winner)
Figure 4-10 Extracted gradation; TH 47 (2014 winner)
0%
10%
20%
30%
40%
50%
60%
70%
80%
90%
100%
0.10 1.00 10.00
% p
as
sin
g
Sieve Size (mm).45
TH 95 (2013)
Superpave Control Points
0%
10%
20%
30%
40%
50%
60%
70%
80%
90%
100%
0.10 1.00 10.00
% p
as
sin
g
Sieve Size (mm).45
TH 47 (2014)
Superpave Control Points

96
Figure 4-11 Extracted gradation; all Metro sections with Superpave control points
Figure 4-12 Extracted gradation; all Metro sections with MnDOT Type B control points
0%
10%
20%
30%
40%
50%
60%
70%
80%
90%
100%
0.10 1.00 10.00
% p
as
sin
g
Sieve Size (mm).45
TH 10 (2004)
TH 36 (2008)
TH 95 (2013)
TH 47 (2014)
Superpave Control Points
0%
10%
20%
30%
40%
50%
60%
70%
80%
90%
100%
0.10 1.00 10.00
% p
as
sin
g
Sieve Size (mm).45
TH 10 (2004)
TH 36 (2008)
TH 95 (2013)
TH 47 (2014)
MnDOT Agg B Control Points

97
4.2.3 Resilient Modulus Test
Resilient Modulus (RM) tests were performed on the pucks obtained from the bottom of the un-
cracked non-wheelpath cores (UNWP). These materials were in place for a long time and ideally,
have been made from durable, fatigue resistance HMA as they have withstood the maximum
tensile strain, which happens at the bottom of the asphalt layer, for an extended period of time.
Figure 4-13 through Figure 4-16 show the side view of the UNWP cores after the bottom
existing stripping were trimmed off.
Figure 4-13 TH 10 (2004) cores used for RM (Cores 2, 6, and 8)

98
Figure 4-14 TH 36 (2008) cores used for RM (Cores 20, 22, and 24)
Figure 4-15 TH 95 (2013) cores used for RM (Cores 26, 29, and 32)

99
Figure 4-16 TH 47 (2014) cores used for RM (Cores 11, 14, and 17)
ASTM D 7369 requires the RM test be performed at 25°C, but since all these sections have
survived Minnesota’s long winters for an extended period of time, RM tests were also performed
at a low temperature of -5°C. The spread of 30 degree Celsius could show how different the
materials perform at different temperatures. Table 4.4 presents the RM testing results.

100
Table 4.4 Resilient Modulus testing results
Roadway Core # Temp. (°C) RM (ksi) Avg. RM at
25°C (ksi)
Avg. RM at
-5°C (ksi) RM ratio(1)
TH 10
(2004)
2 25 680
707 2,415 3.4
-5 2,155
6 25 882
-5 2,532
8 25 558
-5 2,558
TH 36
(2008)
20 25 NA(2)
260 2,316 8.9
-5 NA(2)
22 25 208
-5 2,093
24 25 312
-5 2,539
TH 95
(2013)
26 25 359
488 2,755 5.6
-5 2,427
29 25 630
-5 3,423
32 25 476
-5 2,415
TH 47
(2014)
11 25 509
362 2,490 6.9
-5 3,098
14 25 292
-5 2,178
17 25 285
-5 2,193
(1)ratio of RM at -5°C to RM at 25°C (2)sample broke during testing
As Table 4.4 shows the RM value at 25°C ranges approximately between 250 and 700 ksi which
suggests there are noticeable differences in the material’s behavior at medium temperatures. It is
interesting to note that at the low temperature of -5°C, these differences appear to be much less
pronounced, as the RM value ranges approximately between 2,300 and 2,750 ksi. In other words,
at low temperatures, different mixtures appear to perform similarly. This could be one reason for
the similar long-life behavior of theses pavements, as they have been subjected to the low
temperature condition in a substantial portion of a year (up to 5 to 6 months) in the state of
Minnesota.

101
4.3 rePave Program
The rePave program was utilized to analyze Metro District projects. This program provides
guidance for deciding where and under what conditions to use existing pavement as part of
roadway renewal projects and identifies new alternatives to renewal approaches. These
alternatives determine what needs to be done at the time of analysis, to keep these long-lived
perpetual pavements to serve for another extended period of time, up to 50 years.
The rePave analysis was performed twice for each project: 1) in the current year (2016), and 2)
in the year which the first overlay was performed.
The following assumptions were made in running the rePave program:
The coring information was used for the total HMA thickness in 2016. Underlying layer
thicknesses (base and subbase) and the HMA thickness in the year of the first overlay
were obtained from the construction plans information presented in Chapter 3.
No height restriction was assumed.
The design period was assumed to be 30 years in all the cases.
An existing base modulus of 50,000 psi was assumed due to high CBR values from the
field DCP tests.
Due to the subgrade corrections which were performed during the initial construction in
majority of the projects, a resilient modulus of 20,000 psi (CBR of 13%) was assumed for
the subgrade soils.
To evaluate the sensitivity of rePave program to the assumed base and subgrade modulus values,
a sensitivity analysis was performed which is presented in Section 4.3.4 of this report.
4.3.1 Existing Pavement Conditions
The MnDOT pavement condition data was used to determine rePave inputs for the existing
pavement conditions. Table 4.5 shows how the MnDOT distress types were converted to the
required inputs.
Table 4.5 Existing Pavement Conditions
rePave Input MnDOT Distress Type
Fatigue cracking (%) Sum of the longitudinal cracking (%) and the longitudinal joint
deterioration (%) and block cracking (%)
Patching (%) Sum of patching (%) and alligator cracking (%)
Rutting (in) Average rut depth (in)
Transverse cracking (per 100 feet) Transverse cracking (%) was converted to the number of cracks
Stripping Assumed to be present where raveling was reported

102
The measured pavement distresses (percentages) in 2015 were as follows:
TH 10 (in 2015):
Transverse cracking (Low severity): 32%
Longitudinal Joint Deterioration (Low severity): 25%
TH 36 (in 2015):
Transverse cracking (Low severity): 1%
Longitudinal Joint Deterioration (Low severity): 12%
TH 95 (in 2015):
Transverse cracking (Low severity): 13%
Transverse cracking (Medium severity): 5%
Longitudinal cracking (Low severity): 8%
Block cracking: 42%
Rutting: 1%
Longitudinal Joint Deterioration (Low severity): 69%
TH 47 (in 2015):
Transverse cracking (Low severity): 24%
Longitudinal cracking (Low severity): 2%
Longitudinal Joint Deterioration (Low severity): 92%
The measured pavement distresses (percentages) before the first overlay was performed were as
follows:
TH 10 (in 1976):
Transverse cracking (Low severity): 97%
Longitudinal cracking (Low severity): 24%
Block cracking: 9%
Alligator cracking: 1%
Patching: 4%
TH 36 (in 1984):
Transverse cracking (Low severity): 16%
Transverse cracking (High severity): 22%
Longitudinal cracking (Low severity): 21%
Block cracking: 13%
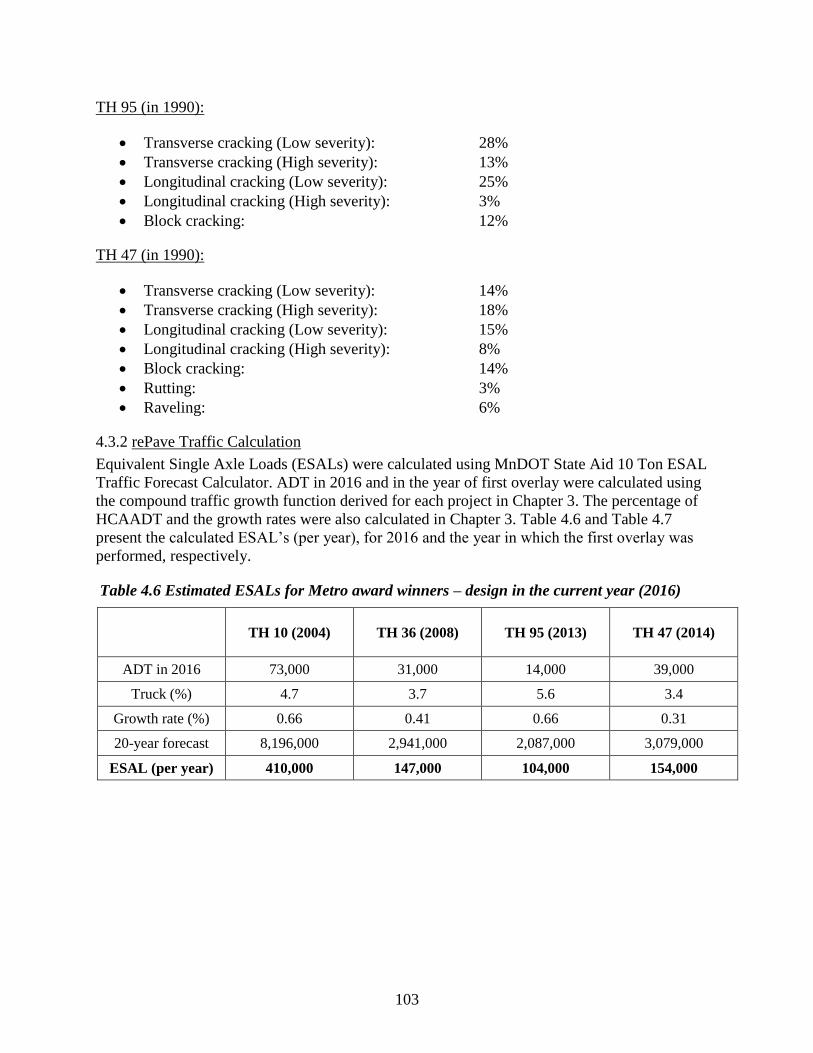
103
TH 95 (in 1990):
Transverse cracking (Low severity): 28%
Transverse cracking (High severity): 13%
Longitudinal cracking (Low severity): 25%
Longitudinal cracking (High severity): 3%
Block cracking: 12%
TH 47 (in 1990):
Transverse cracking (Low severity): 14%
Transverse cracking (High severity): 18%
Longitudinal cracking (Low severity): 15%
Longitudinal cracking (High severity): 8%
Block cracking: 14%
Rutting: 3%
Raveling: 6%
4.3.2 rePave Traffic Calculation
Equivalent Single Axle Loads (ESALs) were calculated using MnDOT State Aid 10 Ton ESAL
Traffic Forecast Calculator. ADT in 2016 and in the year of first overlay were calculated using
the compound traffic growth function derived for each project in Chapter 3. The percentage of
HCAADT and the growth rates were also calculated in Chapter 3. Table 4.6 and Table 4.7
present the calculated ESAL’s (per year), for 2016 and the year in which the first overlay was
performed, respectively.
Table 4.6 Estimated ESALs for Metro award winners – design in the current year (2016)
TH 10 (2004) TH 36 (2008) TH 95 (2013) TH 47 (2014)
ADT in 2016 73,000 31,000 14,000 39,000
Truck (%) 4.7 3.7 5.6 3.4
Growth rate (%) 0.66 0.41 0.66 0.31
20-year forecast 8,196,000 2,941,000 2,087,000 3,079,000
ESAL (per year) 410,000 147,000 104,000 154,000

104
Table 4.7 Estimated ESALs for Metro award winners – design in the year of the first overlay
TH 10 (2004) TH 36 (2008) TH 95 (2013) TH 47 (2014)
Year of the first
overlay 1978 1987 1992 1989
ADT in the year of
first overlay 57,000 27,000 12,000 36,000
Truck (%) 4.7 3.7 5.6 3.4
Growth rate (%) 0.66 0.41 0.66 0.31
20-year forecast 6,410,000 2,620,000 1,739,000 2,851,000
ESAL (per year) 321,000 131,000 87,000 143,000
4.3.3 rePave Results
rePave program renewal options is directly related to whether or not transverse cracking (thermal
cracking) are present. When transverse cracking is present, the renewal options will include Full
Depth Reclamation (FDR) or full depth removal (remove and replace), regardless of what the
other distresses show. Transverse cracking is expected to be present in most of Minnesota’s
pavement since it is located in a cold region. The following three repair options are suggested by
rePave for sections with transverse cracking:
1) Full Depth Reclamation (FDR) and overlay: HMA overlay over pulverized existing
pavement: pulverize existing flexible pavement to eliminate all cracking and materials
related damage and overlay with HMA.
2) Stabilized Full Depth Reclamation (SFDR) and overlay: HMA overlay over
pulverized existing flexible pavement: pulverize existing flexible pavement to eliminate
all cracking and treat pulverized material to produce treated base and overlay with HMA.
3) Full Depth Mill and overlay: HMA overlay after removing and replacing existing HMA
where needed: remove and replace existing HMA because of stripping or other materials
related distress then overlay with HMA. For stripping this may be limited for the stripped
layers and for the top-down cracking it will be limited to the top 2 inches of HMA.
When transverse cracking is not present, the renewal options can also include:
1) Patch and overlay: Patch existing HMA where fatigue cracking or top-down cracking is
less than 10%, then overlay with HMA.
2) Mill and overlay: Remove and replace existing HMA because of stripping or any other
materials related distress then overlay with HMA. For stripping this may be limited to the
stripped layers and for the top-down cracking it will be limited to the top 2 inches of
HMA.

105
4.3.3.1 rePave recommendations in the current year (2016)
For TH 10, TH 95, and TH 47 where transverse cracking was present, the rePave repair
recommendation were FDR and overlay, SFDR and overlay, and full depth mill and overlay.
Figure 4-17 through Figure 4-25 present the rePave outputs for these three options for TH 10,
TH 96, and TH 47.
For TH 36, most of which was reconstructed for a new bridge alignment in 2015, the transverse
cracking percentage in 2015 was only 1%, so no transverse cracking was assumed for this
section. For TH 36 the rePave renewal recommendation was to mill the top 2 inches and overlay
with 3 inches of HMA. Figure 4-26 shows the repave output for this project.
From the rePave results, the total recommended new pavement thickness for the Metro District
projects in 2016 are as follows:
TH 10 (2004): 8.5 inches
TH 36 (2008): 3 inches
TH 95 (2013): 7.5 inches
TH 47 (2014): 7.5 inches
Figure 4-17 rePave output for TH 10 (2004) – FDR and overlay
Figure 4-18 rePave output for TH 10 (2004) – SFDR and overlay

106
Figure 4-19 rePave output for TH 10 (2004) – Full depth mill and overlay
Figure 4-20 rePave output for TH 95 (2013) – FDR and overlay
Figure 4-21 rePave output for TH 95 (2013) – SFDR and overlay

107
Figure 4-22 rePave output for TH 95 (2013) – Full depth mill and overlay
Figure 4-23 rePave output for TH 47 (2014) – FDR and overlay
Figure 4-24 rePave output for TH 47 (2014) – SFDR and overlay

108
Figure 4-25 rePave output for TH 47 (2014) – Full depth mill and overlay
Figure 4-26 rePave output for TH 36 (2008) – Mill and overlay
4.3.3.2 rePave recommendations in the year of the first overlay
In the year in which the first overlay was performed, all the sections had transverse cracking, so
rePave repair recommendation was remove and replace (FDR and overlay, SFDR and overlay,
and full depth mill and overlay) for all the projects.
The required pavement thicknesses were as follows:
TH 10 (2004): 8.5 inches
TH 36 (2008): 7.5 inches
TH 95 (2013): 7.5 inches
TH 47 (2014): 7.5 inches
None of these recommendations were actually performed on these sections in the year of the first
overlay; TH 10 and TH 95 received an overlay and TH 36 and TH 47 received a partial depth
mill and overlay in that year.
It is interesting to note that the required pavement thicknesses from the above remove and
replace rePave runs are fairly close to the actual pavement thicknesses (Table 4.1) which
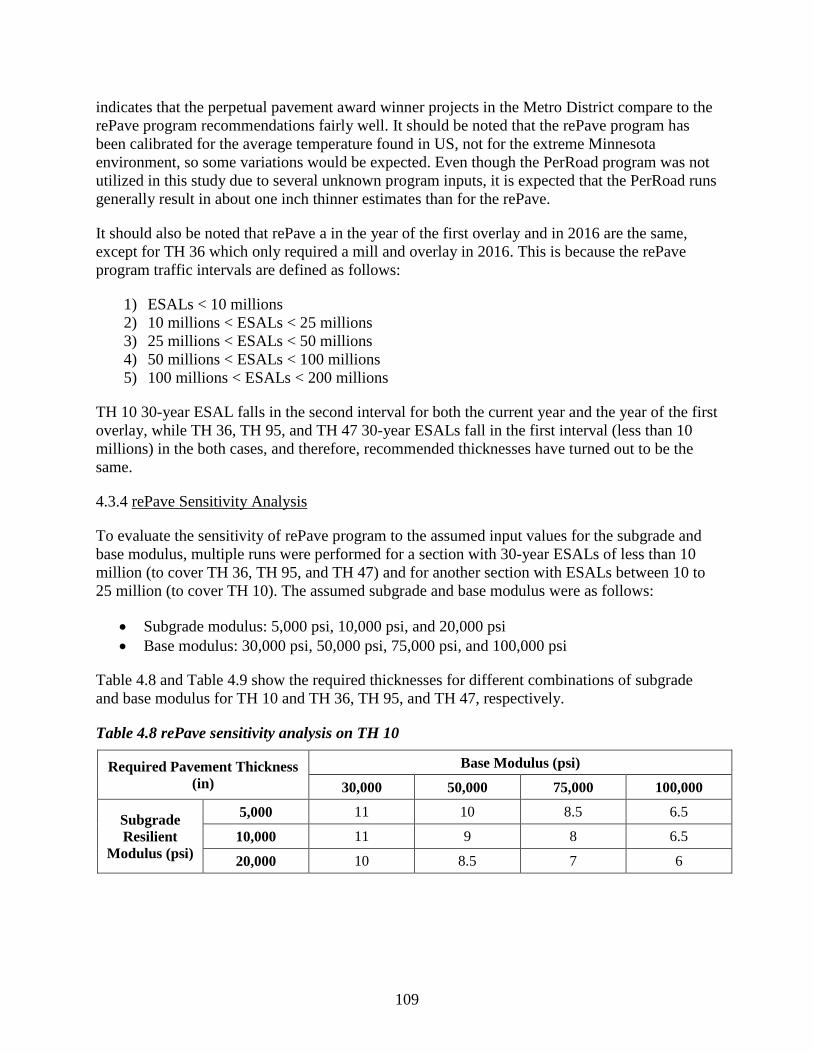
109
indicates that the perpetual pavement award winner projects in the Metro District compare to the
rePave program recommendations fairly well. It should be noted that the rePave program has
been calibrated for the average temperature found in US, not for the extreme Minnesota
environment, so some variations would be expected. Even though the PerRoad program was not
utilized in this study due to several unknown program inputs, it is expected that the PerRoad runs
generally result in about one inch thinner estimates than for the rePave.
It should also be noted that rePave a in the year of the first overlay and in 2016 are the same,
except for TH 36 which only required a mill and overlay in 2016. This is because the rePave
program traffic intervals are defined as follows:
1) ESALs < 10 millions
2) 10 millions < ESALs < 25 millions
3) 25 millions < ESALs < 50 millions
4) 50 millions < ESALs < 100 millions
5) 100 millions < ESALs < 200 millions
TH 10 30-year ESAL falls in the second interval for both the current year and the year of the first
overlay, while TH 36, TH 95, and TH 47 30-year ESALs fall in the first interval (less than 10
millions) in the both cases, and therefore, recommended thicknesses have turned out to be the
same.
4.3.4 rePave Sensitivity Analysis
To evaluate the sensitivity of rePave program to the assumed input values for the subgrade and
base modulus, multiple runs were performed for a section with 30-year ESALs of less than 10
million (to cover TH 36, TH 95, and TH 47) and for another section with ESALs between 10 to
25 million (to cover TH 10). The assumed subgrade and base modulus were as follows:
Subgrade modulus: 5,000 psi, 10,000 psi, and 20,000 psi
Base modulus: 30,000 psi, 50,000 psi, 75,000 psi, and 100,000 psi
Table 4.8 and Table 4.9 show the required thicknesses for different combinations of subgrade
and base modulus for TH 10 and TH 36, TH 95, and TH 47, respectively.
Table 4.8 rePave sensitivity analysis on TH 10
Required Pavement Thickness
(in)
Base Modulus (psi)
30,000 50,000 75,000 100,000
Subgrade
Resilient
Modulus (psi)
5,000 11 10 8.5 6.5
10,000 11 9 8 6.5
20,000 10 8.5 7 6

110
Table 4.9 rePave sensitivity analysis on TH 36, TH 95, and TH 47
Required Pavement Thickness
(in)
Base Modulus (psi)
30,000 50,000 75,000 100,000
Subgrade
Resilient
Modulus (psi)
5,000 10 9 8 6
10,000 10 8 7 6
20,000 9.5 7.5 6.5 5.5
Figure 4-27 presents the required pavement thickness versus base modulus at different subgrade
modulus levels of 5,000, 10,000, and 20,000 psi. As these graphs suggest, when the subgrade
modulus is constant, the required pavement thickness decreases approximately 0.3 inches for
every 5000 psi increase in the base modulus.
Figure 4-28 presents the required pavement thickness versus subgrade modulus at different base
modulus levels of 30,000, 50,000, 75,000, and 100,000 psi. As these graphs suggest, when the
base modulus is constant, the required pavement thickness decreases approximately between 0.2
to 0.5 inches for every 5000 psi increase in the subgrade modulus.

111
Figure 4-27 Pavement thickness vs. base modulus at different subgrade modulus values for: a)
TH 10 and b) TH 36, TH 95, and TH 47
0
2
4
6
8
10
12
0 25,000 50,000 75,000 100,000 125,000
Thic
knes
s (i
n.)
Base Modulus (psi)
Subgrade MR of 5,000 psi
Subgrade MR of 10,000 psi
Subgrade MR of 20,000 psi
TH 10(a)
0
2
4
6
8
10
12
0 25,000 50,000 75,000 100,000 125,000
Thic
knes
s (i
n.)
Base Modulus (psi)
Subgrade MR of 5,000 psi
Subgrade MR of 10,000 psi
Subgrade MR of 20,000 psi
TH 36, TH 95, TH 47(b)

112
Figure 4-28 Pavement thickness vs. subgrade modulus at different base modulus values for: a)
TH 10 and b) TH 36, TH 95, and TH 47
4.4 Summary and Discussion
The following conclusions can be made from the laboratory tests performed on the Metro
District projects:
Most of the test results were similar among all the projects. It could be because all the
projects have shown excellent performance despite their long ages. In other words
comparing the test results from these projects essentially means comparing a “good”
pavement against another “good” pavement.
0
2
4
6
8
10
12
0 5,000 10,000 15,000 20,000 25,000
Thic
knes
s (i
n.)
Subgrade Modulus (psi)
Base Modulus of 30,000 psi
Base Modulus of 50,000 psi
Base Modulus of 75,000 psi
Base Modulus of 100,000 psi
(a) TH 10
0
2
4
6
8
10
12
0 5,000 10,000 15,000 20,000 25,000
Thic
knes
s (i
n.)
Subgrade Modulus (psi)
Base Modulus of 30,000 psi
Base Modulus of 50,000 psi
Base Modulus of 75,000 psi
Base Modulus of 100,000 psi
(b) TH 36, TH 95, TH 47
113
Coring of the projects resulted in HMA thicknesses similar to the expected thicknesses
from the construction plans and maintenance histories. Average core densities and asphalt
binder contents were about the same in all the sections.
DCP testing results indicated that the in-situ materials were strong with high CBR values
in all the tested sections.
The extracted aggregate gradations from different projects, satisfied the Superpave
control points. This was while the majority of the in-place asphalt mixtures were
produced before the Superpave mix design method was developed. Having appropriate
aggregate gradations should have helped with the stability and durability of asphalt
mixtures which eventually have extended the life of these pavements.
Resilient Modulus testing showed that the asphalt mixtures from different Metro sections
perform different at medium temperatures, but this difference is much less pronounced at
low temperatures. In other words, at low temperatures, different mixtures appear to
perform similarly. This could be one reason for the similar long-life behavior of theses
pavements, as they have been subjected to the low temperature condition in a substantial
portion of a year (up to 5 to 6 months) in the state of Minnesota.
rePave analysis was performed twice for each project: once in the current year (2016) and
the other in the year which the first overlay was performed. rePave renewal
recommendations to keep these long-lived perpetual pavements to serve for another
extended period of time were included Full Depth Reclamation (FDR) and overlay,
Stabilized Full Depth Reclamation (SFDR) and overlay, and mill and overlay (either full
depth or in the top few inches). The recommended new pavement thicknesses were found
to be the same in the current year and in the year of the first overlay, since the 30-year
ESALs were falling in the same pre-defined traffic intervals of the rePave program.
The required pavement thicknesses from the remove and replace rePave runs were fairly
close to the actual pavement thicknesses. This indicates that the perpetual pavement
award winner projects in Metro District compare to the rePave program
recommendations fairly well.
The rePave sensitivity analysis showed that when the subgrade modulus is fixed, the
required pavement thickness decreases approximately 0.3 inches for every 5000 psi
increase in the base modulus. Also, when the base modulus is fixed, the required
pavement thickness decreases approximately between 0.2 to 0.5 inches for every 5000 psi
increase in the subgrade modulus.

114
CHAPTER 5: SUMMARY AND CONCLUSIONS
In this study, all the perpetual pavement award winner roadways in Minnesota were reviewed to
determine the common material and design factors and considerations which have led these
roadways to last for an extended period of time, often exceeding 50 years, despite the harsh
Minnesota climate. In order to achieve this goal, all the available information for the 14 award
winners and any pertinent supporting information were reviewed including MnDOT Highway
Pavement Management Application (HPMA) data and performance histories as well as the
construction histories and plans.
Moreover, an in-depth analysis was performed on the four projects located within the Metro
District. To further investigate and characterize these sites, coring and hand auger borings were
performed in cracked and un-cracked areas along with Dynamic Cone Penetrometer (DCP)
which was performed in selected core holes. The cores were then used to measure thicknesses,
densities, and asphalt contents, and to perform extracted gradations and resilient modulus testing
at low and intermediate temperatures. The laboratory testing data were used to further refine the
Metro award winner information to perform data analysis using rePave program. This program
was developed under SHRP 2 R23 study which provides guidance for deciding where and under
what conditions to use existing pavement in roadway renewal projects.
The findings from this study are as follows:
Most of the sections were constructed in the 1960s when the rate of construction was low
which might have resulted in better compaction, and therefore, performance
improvements.
In most of the cases subgrade corrections were performed which included excavation of
unstable materials and correction of adverse subsoil conditions which may have increased
the uniformity of the compacted materials. The excavated areas were backfilled with a
select granular backfill material which created a drainable, strong construction platform
to pave against and provided long-lasting foundations.
Use of non-frost susceptible base and subbase materials in underlying layers have
improved the drainage resulting in improved performance.
In some cases the upper portion of the granular subbase or aggregate base was treated
with bituminous which has strengthened the foundation. In some other cases, a layer of
prime coat was placed over the aggregate base before placing the asphalt layer(s). This
has increased the integrity of the granular base and has reduce dust during construction.
In some cases the construction was extended over a year or more. This staged
construction may have allowed the foundation to go through seasonal cycles and thus
enhanced the overall pavement structural stability.
Several projects had a road-mixed bituminous base material providing a flexible fatigue
resistant base layer called for in the three layer perpetual pavement design. Road-mixed

115
base could provide similar characteristics as current emulsion base stabilization materials
used at MnRoad and various other projects throughout the state that have shown
exceptional performance. Base stabilization not only provides a strong foundation for
construction of perpetual pavements, but also creates a bound layer, thus transferring the
maximum tensile strains deeper into the pavement structure which has shown to reduce
the strain levels at the bottom of the upper HMA layers. Research has demonstrated that
reduction of stress and strain to below a certain level at the bottom of the HMA layer
increases the pavement fatigue life.
HMA thicknesses from coring data were similar to the expected thicknesses from the
construction plans and maintenance histories, except for one section. Average core
densities and asphalt binder contents were about the same in all the sections. Also, field
DCP testing indicated that the in-situ materials were strong with high CBR values in all
the tested sections.
Even though the majority of the in-place asphalt mixtures were produced before the
Superpave mix design method was developed, they satisfied the Superpave control
points. An appropriate aggregate gradation will increase the stability and durability of
asphalt mixtures and eventually extends the life of these pavements.
Resilient Modulus testing showed that the asphalt mixtures from different Metro sections
perform different at medium temperatures, but this difference is much less pronounced at
low temperatures. In other words, at low temperatures, different mixtures appear to
perform similarly. This could be one reason for the similar long-life behavior of theses
pavements, as they have been subjected to the low temperature condition in a substantial
portion of a year (up to 5 to 6 months) in the state of Minnesota.
rePave analysis was performed twice for each project: once in the current year (2016) and
the other in the year which the first overlay was performed. These analyses suggested
three main renewal options to keep these long-lived perpetual pavements to serve for
another extended period of time: 1) Full Depth Reclamation (FDR) and overlay, 2)
Stabilized Full Depth Reclamation (SFDR) and overlay, and 3) mill and overlay (either
full depth or in the top few inches).
The perpetual pavement award winner projects in Metro District compared to the rePave
program recommendations fairly well, as the required pavement thicknesses from the
remove and replace rePave runs (in the year of the first overlay) were fairly close to the
actual pavement thicknesses.
A sensitivity analysis was performed on rePave program to determine the effect of
change of base and subgrade modulus values on the recommended overlay thicknesses.
This analysis showed that when the subgrade modulus is fixed, the required pavement
thickness decreases approximately 0.3 inches for every 5000 psi increase in the base
modulus. Also, when the base modulus is fixed, the required pavement thickness
decreases approximately between 0.2 to 0.5 inches for every 5000 psi increase in the
subgrade modulus.

116
A combination of the above design factors and considerations in conjunction with likely good
inspection and construction practices in the field at the time of placement, have enabled the
award winner projects to service to the public for many years.
117
REFERENCES
[1] Newcomb D., Willis R., and Timm D. (2010) “Perpetual Asphalt Pavements, A Synthesis
This mechanistic,” Asphalt Pavement Alliance.
[2] Asphalt Pavement Alliance Announces Perpetual Pavement Award Winners,
www.asphaltroads.org/perpetual-pavement/award-winners/, accessed May 5, 2016.
[3] Amini A.A., Mashayekhi M., and Ziari H. (2012) “Life Cycle Cost Comparison of Highways
with Perpetual and Conventional Pavements,” International Journal of Pavement Engineering
13 (6), pp 553-568.
[4] Sakhaeifar M., Brown R., Tran N., and Dean J. (2013) “Evaluation of Long-Lasting
Perpetual Asphalt Pavement with Life-Cycle Cost Analysis,” Transporting Research Record,
Vol. 2368, pp. 3-11.
[5] Timm D. and Newcomb D. (2006) “Perpetual Pavement Design for Flexible Pavements in
the US,” International Journal of Pavement Engineering, Vol 7. No. 2, pp. 111-119.
[6] Zeiada W., et al. (2014) “Endurance limit for HMA based on Healing Concept Using
Uniaxial Tension-Compression Fatigue Test,” Journal of Materials in Civil Engineering, Vol.
26, Issue 8.
[7] Monismith C.L., et al. (1977) “Design considerations for asphalt pavements,” California,
Report No. TE, 77–1.
[8] Powell W., Potter J., Mayhew H., and Nunn M. (1984) “The Structural Design of Bituminous
Roads,” Transportation and Road Research Laboratory, Report No. 1132.
[9] Carpenter S., Ghuzlan K., and Shen S. (2009) “Fatigue Endurance Limit for Highway and
Airports Pavements,” Journal of Transportation Research Board.
[10] Underwood S. and Kim Y.R. (2009) “Analytical Techniques for Determining the Endurance
Limit of Hot Mix Asphalt Concert,” The International Conference on Perpetual Pavements,
Columbus.
[11] Norouzi A., Sabouri M., and Kim Y.R. (2016) “Fatigue life and endurance limit prediction
of asphalt mixtures using energy-based failure criterion,” International Journal of Pavement
Engineering.
[12] Cao W., Norouzi A., and Kim Y.R. (2016) “Application of viscoelastic continuum damage
approach to predict fatigue performance of Binzhou perpetual pavements,” International
Journal of Pavement Engineering.
[13] Newcomb D., Buncher M., and Huddleston I. (2000) “Concepts of Perpetual Pavements,”
Transportation Research Circular No. 503. Transportation Research Board. Washington, DC.
pp. 4-11.

118
[14] SHRP2 Pavement Renewal Solutions,
https://www.fhwa.dot.gov/goshrp2/Solutions/All/R23/Pavement_Renewal_Solutions ,
accessed May 9, 2016.
[15] Timm D. and Davis K. (2006) “Perpetual Pavement Design Using the MEPDG and
PerRoad,” The International Conference on Perpetual Pavements, Columbus.
[16] Zubeck H. and Doré G. (2009) “Introduction to Cold Regions Pavement Engineering,” Cold
Regions Engineering 2009: pp. 337-345.

A-1
APPENDIX A
CORE PHOTOS
Figure A-1 Core 1; TH 10 (2004), cracked, wheelpath

A-2
Figure A-2 Core 2, TH 10 (2004), un-cracked, non-wheelpath
Figure A-3 Core 3, TH 10 (2004), un-cracked, wheelpath

A-3
Figure A-4 Core 4, TH 10 (2004), cracked, wheelpath
Figure A-5 Core 5, TH 10 (2004), un-cracked, non-wheelpath

A-4
Figure A-6 Core 6, TH 10 (2004), un-cracked, wheelpath
Figure A-7 Core 7, TH 10 (2004), cracked, wheelpath

A-5
Figure A-8 Core 8, TH 10 (2004), un-cracked, non-wheelpath
Figure A-9 Core 9, TH 10 (2004), un-cracked, wheelpath

A-6
Figure A-10 Core 19, TH 36 (2008), un-cracked, non-wheelpath
Figure A-11 Core 20, TH 36 (2008), un-cracked, wheelpath

A-7
Figure A-12 Core 21, TH 36 (2008), un-cracked, non-wheelpath
Figure A-13 Core 22, TH 36 (2008), un-cracked, wheelpath

A-8
Figure A-14 Core 23, TH 36 (2008), un-cracked, non-wheelpath
Figure A-15 Core 24, TH 36 (2008), un-cracked, wheelpath

A-9
Figure A-16 Core 25; TH 95 (2013), cracked, wheelpath
Figure A-17 Core 26, TH 95 (2013), un-cracked, non-wheelpath

A-10
Figure A-18 Core 27, TH 95 (2013), un-cracked, wheelpath
Figure A-19 Core 28, TH 95 (2013), cracked, wheelpath

A-11
Figure A-20 Core 29, TH 95 (2013), un-cracked, non-wheelpath
Figure A-21 Core 30, TH 95 (2013), un-cracked, wheelpath

A-12
Figure A-22 Core 31, TH 95 (2013), cracked, wheelpath
Figure A-23 Core 32, TH 95 (2013), un-cracked, non-wheelpath

A-13
Figure A-24 Core 33, TH 95 (2013), un-cracked, wheelpath
Figure A-25 Core 10; TH 47 (2014), cracked, wheelpath

A-14
Figure A-26 Core 11, TH 47 (2014), un-cracked, non-wheelpath
Figure A-27 Core 12, TH 47 (2014), un-cracked, wheelpath

A-15
Figure A-28 Core 13, TH 47 (2014), cracked, wheelpath
Figure A-29 Core 14, TH 47 (2014), un-cracked, non-wheelpath

A-16
Figure A-30 Core 15, TH 47 (2014), un-cracked, wheelpath
Figure A-31 Core 16, TH 47 (2014), cracked, wheelpath

A-17
Figure A-32 Core 17, TH 47 (2014), un-cracked, non-wheelpath
Figure A-33 Core 18, TH 47 (2014), un-cracked, wheelpath