minnesota simulations dan hennessy, peter litchfield, leon mualem improvements to the minnesota...
TRANSCRIPT

Minnesota Simulations
Dan Hennessy, Peter Litchfield, Leon Mualem
Improvements to the Minnesota analysis
Comparison with the Stanford analysis
Optimisation of the cell size
Optimisation of the off-axis position in the TA detector
8 GeV beam

decays decays are detectable through late hits near the end of tracks.
Look for hits later than 300ns after the first hits in the event
eosc ebeam
cc nc
Number of decay hits
z distance from track end (cm)
Reject events where the prime track has a late hit less than 12cm in z from the track end

0 rejectionThe Hough track finding has been extended to find extra tracks after the prime track (most hits)
By scanning the second track is quite often a reasonable track
The third and subsequent tracks are mostly rubbish
Limit analysis to three tracks
If the Hough analysis finds more than one track and the prime track passes the electron cuts, combine the extra tracks to form a 0 (assuming both are )
Evidence for 0 in nc events
Cut events with 0 mass2<0.1
eosc ebeam
cc nc
0 mass2 (GeV/c2)2

Improved gap recognition
Electrons are characterised by the presence of gaps in the track
Previously this was not being calculated optimally for the TA detector
Find the maximum plane gap within the prime track
Reject events where the maximum gap is 1
eosc ebeam
cc nc
Maximum gap (planes)
Flat energy generation
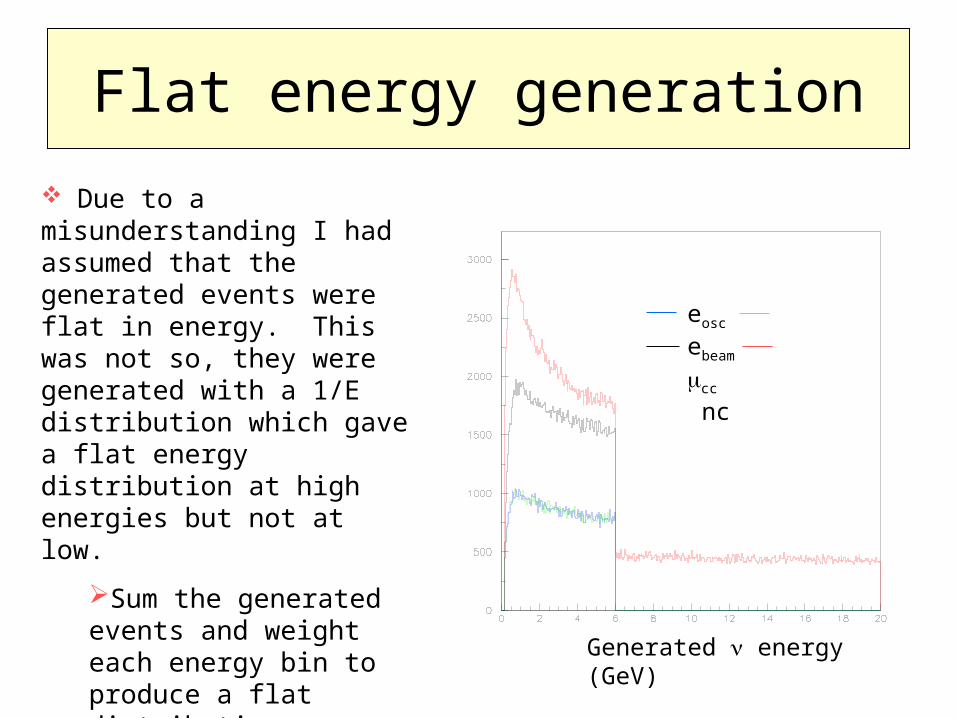
Due to a misunderstanding I had assumed that the generated events were flat in energy. This was not so, they were generated with a 1/E distribution which gave a flat energy distribution at high energies but not at low.
Sum the generated events and weight each energy bin to produce a flat distribution.
In my analysis flattening the distribution reduced the FOM by ~0.3
Generated energy (GeV)
eosc ebeam
cc nc

Other cuts

Results test passed cc nc eback eosc back fom
generated events 193626.00 371058.00 100000.00 100000.00
beam weighted 7481.66 3441.16 98.15
beam weighted + osc 1278.04 3441.16 98.15 310.19 4817.35 4.47
reconstructed events 1251.88 2427.40 94.51 299.53 3773.79 4.88
containment volume 880.56 2037.75 75.58 245.53 2993.90 4.49
event length 539.43 1879.90 74.34 244.54 2493.66 4.90
total pulse height 328.79 407.98 29.03 217.64 765.79 7.86
decay hits 184.58 393.40 28.70 215.63 606.68 8.75
hough track gap 65.43 298.94 26.22 195.96 390.59 9.92
hough hits/plane 58.44 288.13 26.05 194.36 372.62 10.07
hough track hit fraction 1.31 21.84 11.90 99.64 35.05 16.83
hough beam angle 1.31 21.84 11.90 99.64 35.05 16.83
pizero cut 1.21 20.36 11.69 98.27 33.27 17.04
likelihood cut 0.48 5.82 6.59 73.31 12.90 20.41
error 0.10 0.36 0.09 1.14 0.39 0.44
raw events remaining 28.00 826.00 5178.00 5154.00
Results My current best results from a test sample are;
FOM=20.40.5
73.3 signal, 12.9 background, signal efficiency 24%
Training sample gave a FOM of 21.6
Very disappointing. My previous FOM before all the “improvements” was ~20.3
The new cuts are particularly strong on the cc background. This is now essentially zero.
Nothing much seems to improve the nc background
Reinforces my conclusion from previous optimizations and from my scan analysis that the FOM is essentially saturated. There are statistical fluctuations of ~0.5-1.0 but it is difficult to make a systematic improvement.

Comparison with Stan Stan sent Dan Hennessy what we thought was his code but we find now is that of his student from last summer. Dan has now got it working and we have tried to compare the Minnesota and Stanford analyses.
Almost everything is different…. maybe surprising we are as close as we are
With the code we have and running on the same generated data sample the Stanford best FOM is 21.6 for the test and 22.0 for the training sample (c.f. 20.4, 21.6 for my analysis and ~24 which Stan reported at the October meeting)
Stan has a less restrictive fiducial region, using his definition increases my FOM by ~0.3
The test and training samples are defined differently, there are statistical differences ~0.5
I was prepared to declare them the same but Stan says he has now updated his analysis and gets a better FOM

Cell size optimisation
Leon has generated detectors with different cell sizes.
Widths (perpendicular to beam) of 3.8, 5.2 and 7.9 cm
Depths (along the beam) of 4.5, 6.0 and 9.0 cm
Two hypotheses for the readout light level
1) Keep the same number of pe collected/cm of track
2) Renormalise the light level to 35 pe at the far end of the cell
The first gives the most direct comparison of the selection and pattern recognition, many tests are to first order unchanged under different cell configurations. All of the generated conditions compared in these conditions
The second is what we would probably do to save money in building the detector. The 9.0cm depths compared this way.
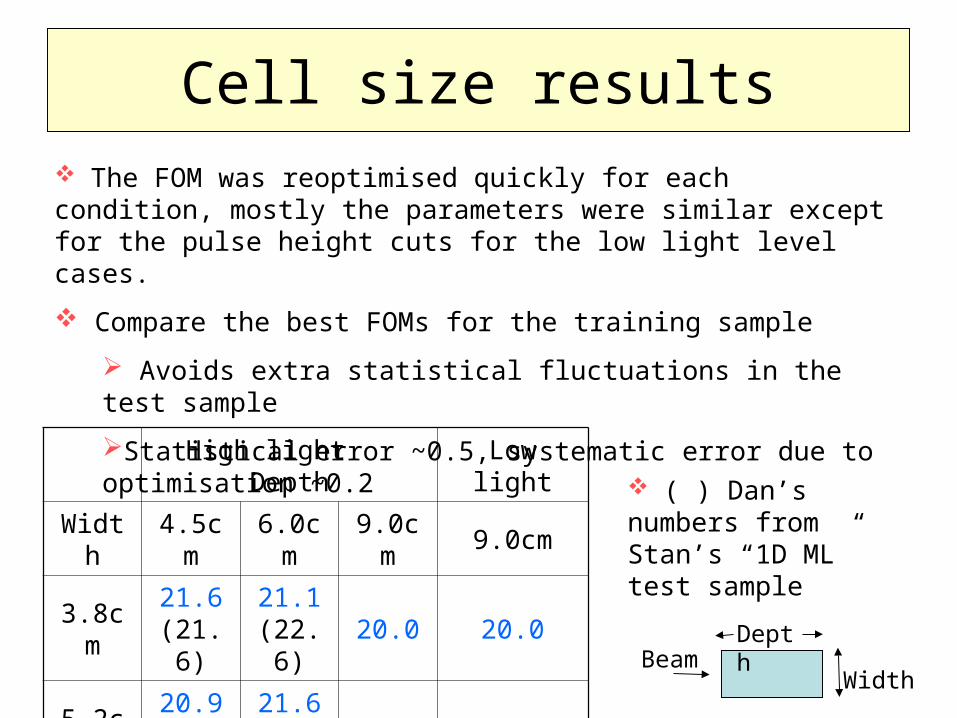
Cell size results The FOM was reoptimised quickly for each condition, mostly the parameters were similar except for the pulse height cuts for the low light level cases.
Compare the best FOMs for the training sample
Avoids extra statistical fluctuations in the test sample
Statistical error ~0.5, systematic error due to optimisation ~0.2
High light Depth Low light
Width 4.5cm 6.0cm 9.0cm 9.0cm
3.8cm21.6
(21.6)21.1
(22.6)20.0 20.0
5.2cm20.9
(20.5)21.6
(21.1)
7.9cm 21.0 20.5 20.5
Depth
WidthBeam
( ) Dan’s numbers from Stan’s “1D ML” test sample

Cell size results
Expected effects are seen.
Fewer hits/plane in the wider cells.
Smaller gaps in the longer cells.
Total pulse height slightly larger in the bigger cells, less inert material.
Half the total pulse height in the low light sample
Very little overall difference in the FOM.
Could be worth scanning a sample of the larger cell sizes to see if one can tell by eye whether the pattern recognition would be significantly worse
Cell size will probably be set by mechanics?
Save money on the cell size and put it into more mass.

Off-axis position optimisation
Need to repeat the optimisation as a function of offaxis position as was done for the wood detector.
Include the background in the beam and do the opposite sign beam
Just started, another ~1-2 weeks
Inclusion of background reduces the FOM by ~1

8 Gev beam
Doug Michael has proposed a using the proposed Fermilab proton driver to power a new beam complex consisting of off-axis 120GeV beams plus a low energy beam similar to the MiniBoone beam pointing at the Homestake mine (1290 km).
Either a 125kton liquid argon or 0.5Mton water cherenkov detector would be the detectors.
The objective is to combine the advantages of off-axis and on-axis beams to cover the first and second oscillation maxima in a similar (but possibly better) way than the Brookhaven proposal.
What could an upgraded 8GeV Miniboone beam do, pointed at Noa, to cover the second maxima in the same detector?
Assume 1023 protons on target (5 year run?) into the 25kton TASD detector at 810 km from Fermilab

Beam spectra
Unoscillated and nc truth energy spectra. Intrinsic e spectrum taken as 0.005* spectrum
Oscillated spectrum
m2=0.0025 eV2
sin2223=1.0
sin2213=0.1
No matter or CP effects
eosc ebeam
cc nc
8 Gev Beam
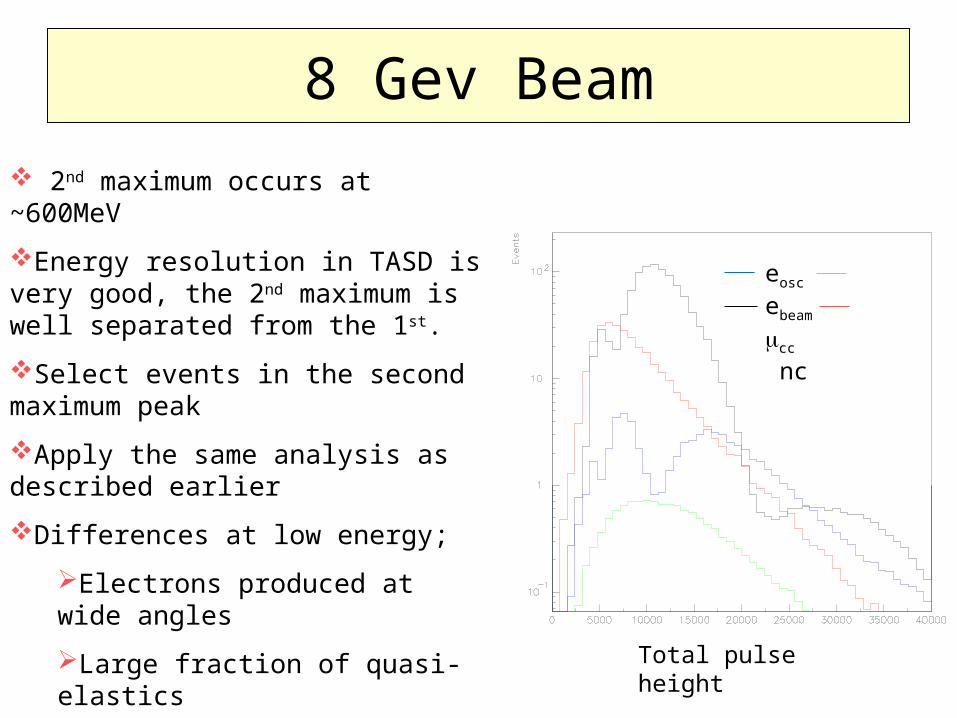
2nd maximum occurs at ~600MeV
Energy resolution in TASD is very good, the 2nd maximum is well separated from the 1st.
Select events in the second maximum peak
Apply the same analysis as described earlier
Differences at low energy;
Electrons produced at wide angles
Large fraction of quasi-elastics
Need the decay flag to reduce cc background
Total pulse height
eosc ebeam
cc nc

Analysis
Reject event if
100cm<event length <800cm
6000< ph <11000
Any late decay hit
Maximum plane gap 1
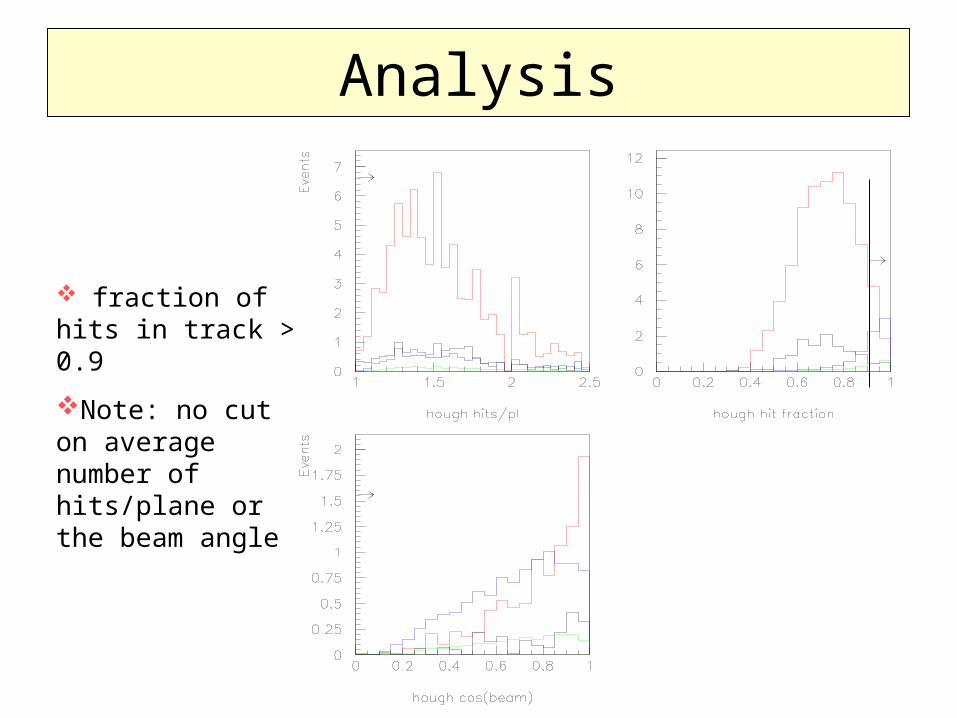
Analysis
fraction of hits in track > 0.9
Note: no cut on average number of hits/plane or the beam angle

Analysis
Reject events with log likelihood ratios:
eosc/cc < 2.0
eosc/nc < 2.0
eosc/ebeam <-5.0
Note that there is almost no remaining cc background before the likelihood cut
Note the strong overlap of nc and eosc likelihoods

Results test passed cc nc e beam e osc background fom
generated events 98240.00 99236.00 51623.00 51589.00
beam weighted 3323.95 1273.33 16.62
beam osc 1568.08 1273.33 16.62 87.76 2858.04 1.64
reconstructed events 402.56 402.04 15.39 81.48 1819.99 1.91
Containment volume 1224.27 370.21 13.63 71.17 1608.10 1.77
event length 990.48 305.37 12.52 65.46 1308.38 1.81
total ph 425.65 147.91 4.11 18.19 577.67 0.76
# mu decay hits 96.53 124.46 3.36 16.23 224.35 1.08
maximum gap 12.63 80.42 2.38 11.32 95.42 1.16
hough hit/plane 12.63 80.42 2.38 11.32 95.42 1.16
hough fraction 1.87 8.71 1.68 8.85 12.26 2.53
hough beam angle 1.87 8.71 1.68 8.85 12.26 2.53
pizero cut 1.87 8.70 1.67 8.84 12.25 2.53
likelihood 0.30 1.71 0.66 4.88 2.67 2.99
error 0.14 0.19 0.02 0.17 0.23 0.17
raw events 9.00 147.00 892.00 922.00

Energy acceptance
Truth energy of accepted events
eosc ebeam
cc nc

Is it any good? Find 4.9 events with 2.7 background. Not very interesting…..
BUT the beam is maybe not optimum
More beam? Doug’s scheme had 2MW from the driver on the 8Gev beam and 2 MW on the NuMI beam. Everything on the 8 Gev beam? X2?
Better beam? An off-axis 8Gev beam could have more events at 600 MeV (x3-4?) and less high energy nc events, less background.
Better intrinsic e simulation, less background
30-40 events with less than 10 background?
Detector is maybe not optimum
Noa TASD acceptance ~30%, a detector with 90% acceptance would have x3 events (~100 events). 25kton liquid argon?
OR build another 25 kton of TASD (60-80 events)