minnesota statewide heavy vehicle safety plan
TRANSCRIPT

Minnesota Statewide Heavy Vehicle Safety Plan
Executive Summary
Background This Statewide Heavy Vehicle Safety Plan is intended to be a companion document to the previously adopted Minnesota Comprehensive Highway Safety Plan (CHSP). Both documents have the same goal (reducing fatal and life changing injury crashes), share a common ancestry (heavy vehicles are one of the key emphasis areas in AASHTO’s Strategic Highway Safety Plan and the NCHRP Series 500 reports), and have a similar development process (based on outreach to safety partners plus being driven by an analysis of relevant crash data). Additionally, both plans present a comprehensive approach and set of strategies (enforcement, engineering and education) for addressing the identified safety needs.
The CHSP established a goal to reduce the number of traffic fatalities from approximately 650 annually to 500 or fewer by 2008, a first step in moving Towards Zero Deaths. However, the CHSP’s top five Critical Emphasis Areas did not specifically address fatal and life changing injury crashes involving heavy vehicles because the data driven screening process found that the number of severe truck crashes was not high enough to be in Minnesota’s top five list. Even though some of the strategies in the CHSP can reduce the number of heavy vehicle crashes, no provisions were made to address the key issues related to heavy vehicles.
In order to provide a focus on fatal and life changing heavy vehicle crashes, the Office of Freight and Commercial Vehicle Operations at Mn/DOT and the Commercial Vehicle Enforcement section of the Minnesota State Patrol have joined to develop the Minnesota Statewide Heavy Vehicle Safety Plan (SHVSP).
Minnesota’s Crash Reduction Goal A review of historic crash data form Minnesota found that the total number of truck crashes (about 6,000 annually) and fatal truck crashes (about 75 annually) has remained relatively constant since the early 1990’s. This data matches the national trend, which AASHTO and FHWA suggest is a call for a new focus on system wide safety, the use of proven strategies, a better balance between reactive and proactive measures, and better integration among agencies responsible for safety enforcement/engineering/education and finally adoption of an aggressive safety goal. Consistent with these initiatives, the Federal Motor Carrier Safety Administration (FMCSA) has established a goal to reduce the number of truck crash related fatalities by 25%. Minnesota’s Departments of Public Safety and Transportation have endorsed this effort and have adopted a goal of reducing annual truck related fatalities to 70 or fewer by 2008.
Truck Crash Facts The analysis of Minnesota’s truck crash data revealed the following:
• Trucks are involved in crashes at about the same rate as for all vehicles.
• The truck fatality rate is twice as high as the overall fatality rate.
ii June 30, 2005
Minnesota Statewide Heavy Vehicle Safety Plan
• In fatal multiple vehicle crashes, at least 75% were caused by the passenger car driver.
• 76% of fatal truck crashes occur in rural areas.
• 61% of heavy vehicle fatal crashes occur on two-lane roads.
• The most common types of fatal truck crashes are right-angle, followed by head-on. As a comparison, the most common type of fatal crash involving a passenger car is a single vehicle road departure.
• Weather, road surface and light condition were factors in only a small number of fatal truck crashes.
• Alcohol was a factor in about 15% of fatal heavy vehicle crashes. As a comparison, alcohol was a factor in 36% of all fatal crashes.
• Truck drivers are using seat belts at about the same rate as all vehicle occupants in Minnesota (approximately 82%), and this is almost twice the national average. However, a higher percentage of people wearing seat belts re killed in collisions with heavy vehicles than in collisions only involving passenger cars.
Implementation The AASHTO and NCHRP documents encourage agencies to develop their own safety plans based on the following seven guiding principles:
• Comprehensive • Data Driven • Systematic • Proactive
• Integrated • Substantive • Stakeholder Involved
The Minnesota Statewide Heavy Vehicle Safety Plan did in fact start with these principles and then made adjustments based on the input form a variety of safety partners (approximately 50 professionals representing law enforcement, the insurance industry, courts, research universities, driver training schools, private industry, FMCSA and local, state and federal highway agencies participated in a workshop that focused on strategic prioritization) and Minnesota’s crash records databases. The final result of this effort is a prioritized list of ten Critical Strategies that address enforcement, engineering and educational issues, including:
1. Law Enforcement and Inspector Resources – present a greater on-road presence of commercial vehicle law enforcement, resulting in an increase in the number of heavy vehicle inspections.
2. Cost Effective Road and Roadside Improvements – proactive deployment of proven safety strategies such as center and edge line rumble strips, paving shoulders and constructing off-road truck inspection sites.
iii June 30, 2005
Minnesota Statewide Heavy Vehicle Safety Plan
3. Strengthen Commercial Drivers Licensing – adopting minimum training requirements for driving schools, random re-tests for veteran drivers and limiting commercial drivers to the vehicles they were tested in.
4. Passenger Vehicle Driver Education – undertake a public information/education campaign aimed at raising the safety awareness of the drivers of passenger vehicles that cause over 70% of the fatal crashes involving a heavy vehicle.
5. Four-Cable Median Barrier – proactively install 4-cable barrier (certified for use in redirecting heavy vehicles) to prevent head-on crashes on divided roadways.
6. Automatic Notification of Driver Convictions – implement a program where carriers would receive automatic notification of any driving conviction (off-duty, different jurisdiction, etc.) for any driver that works for them.
7. Demonstration Corridor – identify a demonstration corridor based on high levels of heavy vehicle usage and over representation of crashes and implement a comprehensive set of safety strategies to address enforcement, engineering, education and emergency response and health issues.
8. Work Zones – improve the design, maintenance and operation of work zones to better accommodate the needs of heavy vehicles.
9. Targeted Enforcement – focus limited enforcement resources on roadway segments with a history of heavy vehicle crashes and supplement State Patrol staff through partnerships with local law enforcement agencies.
10. Improve Data Systems – integrate the multiple heavy vehicle crash data bases maintained by multiple agencies in order to improve accuracy and the availability of heavy vehicle data to support problem driver, carrier or location identification and program evaluation.
The greatest challenge facing traffic safety professionals in Minnesota is the need to acknowledge that the effort to reduce fatal and life changing injuries associated with crashes involving heavy vehicles is tied to implementing the prioritized strategies. The guiding principles suggest that the most effective implementation likely involves doing things differently from what has been done in the past. This includes investing in more enforcement and having the enforcement focused in the corridors with the greatest needs based on truck volumes, speed profiles, number of citations and number of truck crashes.
Final Thoughts The process of developing this plan combined with comments provided by the safety partners identified a number of additional items that Mn/DOT and DPS should consider. These items are outside of the context of the ten Critical Strategies or were omitted from the list because they are either part of ongoing programs or they simply couldn’t be linked to numbers of fatal crashes. However, these items were found to be important enough to warrant follow up by the Departments.
iv June 30, 2005
Minnesota Statewide Heavy Vehicle Safety Plan
• There has been little or no effort to document the effectiveness of current safety initiatives, as a result, little is known about their actual ability to address identified safety deficiencies. Conducting a thorough evaluation of these initiatives would provide insight about whether they should be continued, revised or terminated.
• Of the ten critical strategies, only two (both engineering related) are considered proven, the rest are considered either tried or experimental. In other words, the actual safety effectiveness of most of the strategies is not thoroughly documented at this time. In order to help generate the information necessary to document effectiveness, implementing agencies need to consider deployments of all safety strategies (particularly those related to enforcement, education and emergency response) as projects – by designating a project manager, establishing schedules, documenting “before” data, conducting an analysis of “after” conditions and finally identifying the effect of implementation.
• The level of detail provided in the current crash records database did not allow the analysis key heavy vehicle characteristics such as commodity, driver fatigue, hours of service, level of experience, and driver’s previous record (i.e., crash history or citations). This type of information is collected but is not included in the crash records database (which is the information generally available to highway traffic safety engineers), but is instead accessible by enforcement agencies. Integrating some or all of this information with Minnesota’s location based crash records system would allow analysts to do a more thorough job of documenting the factors contributing to crashes involving heavy vehicles.
• Given the limitations in the crash records system noted above, specific strategies relating to fatigue, driver training and roll over crashes did not make it through the data driven screening process. However, recent national research suggests that increasing the supply of public truck parking spaces, increasing the awareness of young passenger car drivers of the hazards of driving near heavy vehicles and supporting research investigating the application of technology to reduce roll over crashes should be considered.
• In order to help refine the strategies in this Plan and to generate support for implementation, the Departments are encouraged to reach out to industry, private carriers and the Minnesota Trucking Association.
The strategies and partnerships identified in this Statewide Heavy Vehicle Safety Plan present the Sate of Minnesota the greatest opportunity to achieve the aggressive safety goal of reducing heavy vehicle related fatalities to fewer than 70 by 2008, to support the CHSP goal of fewer than 500 fatalities statewide by 2008 and to take the initial steps in moving Towards Zero Deaths.
This plan was prepared for the Minnesota Departments of Transportation and Public Safety by .
v June 30, 2005

Minnesota Statewide Heavy Vehicle Safety Plan
Common Acronyms
AASHTO American Association of State Highway and Transportation Officials
CDL commercial driver's license
CHSP Comprehensive Highway Safety Plan
CMV commercial motor vehicles
CVISN Commercial Vehicle Information Systems and Networks
DPS Minnesota Department of Public Safety
FHWA Federal Highway Administration
FMCSA Federal Motor Carrier Safety Administration
GVWR gross vehicle weight rating
HCADT heavy commercial average daily traffic
MCSAP Motor Carrier Safety Assistance Program
Mn/DOT Minnesota Department of Transportation
NCHRP National Cooperative Highway Research Program
SHSP Strategic Highway Safety Plan
SHVSP Statewide Heavy Vehicle Safety Plan
VMT vehicle miles traveled
vi June 30, 2005
Minnesota Statewide Heavy Vehicle Safety Plan
Table of Contents 1. BACKGROUND & PURPOSE .........................................................................................................................1
1.1 DEFINITION OF A HEAVY VEHICLE FOR THE SHVSP ............................................................................................1 1.2 EFFECT OF HEAVY VEHICLE CRASHES..................................................................................................................1
2. EXISTING SAFETY PROGRAMS AND INTERVIEW RESULTS.............................................................4 2.1 FEDERAL COMMERCIAL VEHICLE SAFETY PROGRAMS .......................................................................................4
2.1.1 Technological ............................................................................................................................................4 2.1.2 Public Information and Education Programs (PI&E)...............................................................................5 2.1.3 Enforcement...............................................................................................................................................7 2.1.4 Emergency Services.................................................................................................................................11
2.2 STATE COMMERCIAL VEHICLE SAFETY PROGRAMS .........................................................................................13 2.2.1 Education.................................................................................................................................................13 2.2.2 Engineering .............................................................................................................................................14 2.2.3 Enforcement.............................................................................................................................................15
2.3 INDUSTRY INITIATIVES .....................................................................................................................................18 2.4 SAFETY PROGRAM EFFECTIVENESS ..................................................................................................................21 2.5 INTERVIEW RESULTS.........................................................................................................................................21
2.5.1 Summary of Interview Responses ............................................................................................................25
3. HEAVY VEHICLE CRASH REVIEW ..........................................................................................................27 3.1 DEFINITION OF A HEAVY VEHICLE AND CRASH DATA SOURCE ........................................................................27 3.2 CRASH FREQUENCY AND RATE.........................................................................................................................27 3.3 CRASH SEVERITY..............................................................................................................................................27 3.4 CRASH TYPE .....................................................................................................................................................30 3.5 DAY-OF-WEEK AND TIME-OF-DAY...................................................................................................................33 3.6 ROAD AND WEATHER CONDITIONS...................................................................................................................34 3.7 ROUTE TYPE AND ROADWAY DESIGN...............................................................................................................35 3.8 DRIVER AGE AND CONTRIBUTING FACTOR.......................................................................................................39 3.9 VEHICLE TYPE ..................................................................................................................................................42 3.10 CARRIER DOMICILE AND INTRASTATE VERSUS INTERSTATE.............................................................................43 3.11 IMPACT OF ALCOHOL INVOLVEMENT AND SEAT BELT USE ..............................................................................43 3.12 SUMMARY.........................................................................................................................................................45 3.13 DEMONSTRATION CORRIDOR IDENTIFICATION .................................................................................................46
4. GOALS AND PERFORMANCE MEASURES .............................................................................................49 4.1 PERFORMANCE MEASURES ...............................................................................................................................49 4.2 FATAL CRASH GOAL.........................................................................................................................................50
5. STRATEGY IDENTIFICATION AND PRIORITIZATION.......................................................................52
6. CRITICAL STRATEGY ACTION PLANS...................................................................................................62
7. DEPLOYMENT PLAN....................................................................................................................................81 7.1 EFFECTIVENESS SPREADSHEET .........................................................................................................................81 7.2 IMPORTANCE OF A MULTI-DISCIPLINARY DEPLOYMENT ..................................................................................84 7.3 DEMONSTRATION CORRIDORS ..........................................................................................................................85
vii June 30, 2005

Minnesota Statewide Heavy Vehicle Safety Plan
8. KEY CONCLUSIONS ...................................................................................................................................111 8.1 MINNESOTA’S CRASH REDUCTION GOAL .......................................................................................................111 8.2 CONNECTION TO MINNESOTA’S CHSP ...........................................................................................................111 8.3 TRUCK CRASH FACTS .....................................................................................................................................111 8.4 IMPLEMENTATION...........................................................................................................................................112 8.5 ADDITIONAL ITEMS FOR CONSIDERATION.......................................................................................................113
REFERENCES APPENDIX I
APPENDIX II
APPENDIX III
APPENDIX IV
APPENDIX V
viii June 30, 2005
Minnesota Statewide Heavy Vehicle Safety Plan
1. Background & Purpose
In a coordinated effort to reduce the number of traffic fatalities and life changing crashes in Minnesota, the Departments of Public Safety and Transportation are partnering in two initiatives; Towards Zero Death and the Minnesota Comprehensive Highway Safety Plan (CHSP). (1) Both efforts are an inter-disciplinary, comprehensive approach to saving lives, bringing together representatives from engineering, enforcement, education, and emergency medical/health services (Four Safety Es). The development of the CHSP was based on national guidance established by the American Association of State Highway and Transportation Officials’ (AASHTO) Strategic Highway Safety Plan (SHSP) (2) and the National Cooperative Highway Research Program (NCHRP) Report 500 series (3), which is a series of guides created to help state and local agencies implement the SHSP.
In the CHSP, Mn/DOT and DPS set a goal to reduce the number of traffic fatalities from approximately 650 annually to 500 or fewer by 2008, the first step in Towards Zero Death. However, in the CHSP’s five Critical Emphasis Areas, fatal and life changing crashes involving heavy vehicle are not directly addressed because the data driven screening process found that the number of severe truck crashes was not high enough to make Minnesota’s priority emphasis areas. Even though some of the strategies in the CHSP can reduce the number of heavy vehicle crashes, no provisions were made to address the specific issues related to heavy vehicles. To address fatal and life changing heavy vehicle crashes, the Office of Freight & Commercial Vehicle Operations at Mn/DOT and the Commercial Vehicle Enforcement Section of the Minnesota State Patrol have joined to develop the Minnesota Statewide Heavy Vehicle Safety Plan (SHVSP). As was done in the CHSP, the SHVSP follows the guidance in AASHTO’s SHSP and the NCHRP Report 500 series. The plan’s recommendations was also shaped with the aid of Minnesota’s safety partners, including representatives from Federal Motor Carrier Safety Administration (FMCSA), Federal Highway Administration (FHWA), local engineering and law enforcement agencies, private industry, Minnesota Supreme Court, research universities, driver training schools, and insurance companies.
1.1 Definition of a Heavy Vehicle for the SHVSP Within the FMCSA and other organizations, a heavy vehicle is defined as having a gross vehicle weight rating (GVWR) of 10,001 pounds or more. However, Minnesota categorizes vehicles as “heavy” if the GVWR is 26,000 pounds and higher. For the purpose of this study, the national classification of 10,001 pounds and higher was used.
1.2 Effect of Heavy Vehicle Crashes Crashes involving heavy vehicles in Minnesota have a substantial impact on the lives of those involved as well as the general population. They can have a disproportionate impact with respect to loss of life, property damage, infrastructure damage and the movement of goods and products through out Minnesota and the Nation.
1 June 30, 2005
Minnesota Statewide Heavy Vehicle Safety Plan
Fatalities (National): Statistics from the Fatality Analysis Reporting System (FARS) in 2001 shows that 42,116 people were killed in motor vehicle crashes in the United States. Of those fatalities, 5,082 (12.1%) involved heavy trucks. Of those, most involved large trucks with a GVWR greater than 26,000 pounds. Heavy trucks have continued to account for between 12 and 13 percent of all traffic fatalities, with the largest proportion being persons outside the truck (mostly occupants of other vehicles, but also non-occupants, e.g., pedestrians and bicyclists) because heavier vehicles have the clear safety advantage in two-vehicle collisions. Although large-truck involvement in fatal crashes has decreased from 5.0 per hundred vehicle-miles traveled (VMT) in 1980 to 2.1 per 100 million VMT in 2001, this rate is still much higher than that for passenger vehicles, which was 1.3 per 100 million VMT in 2001. (3A)
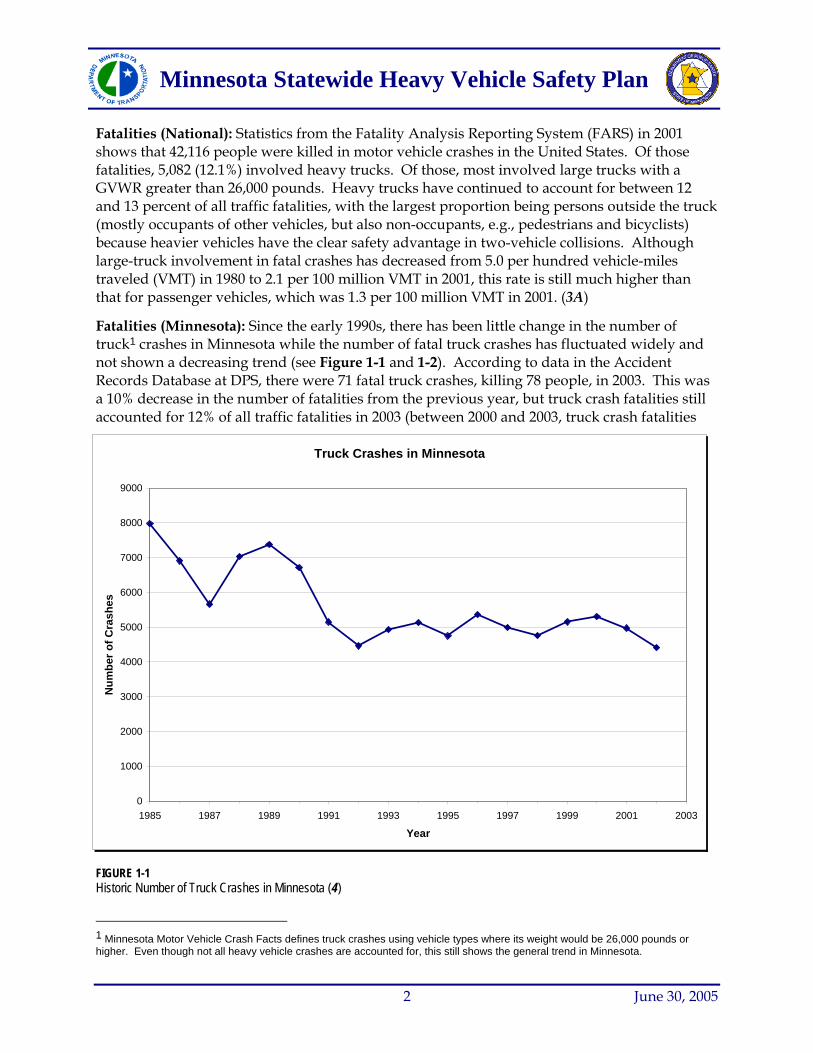
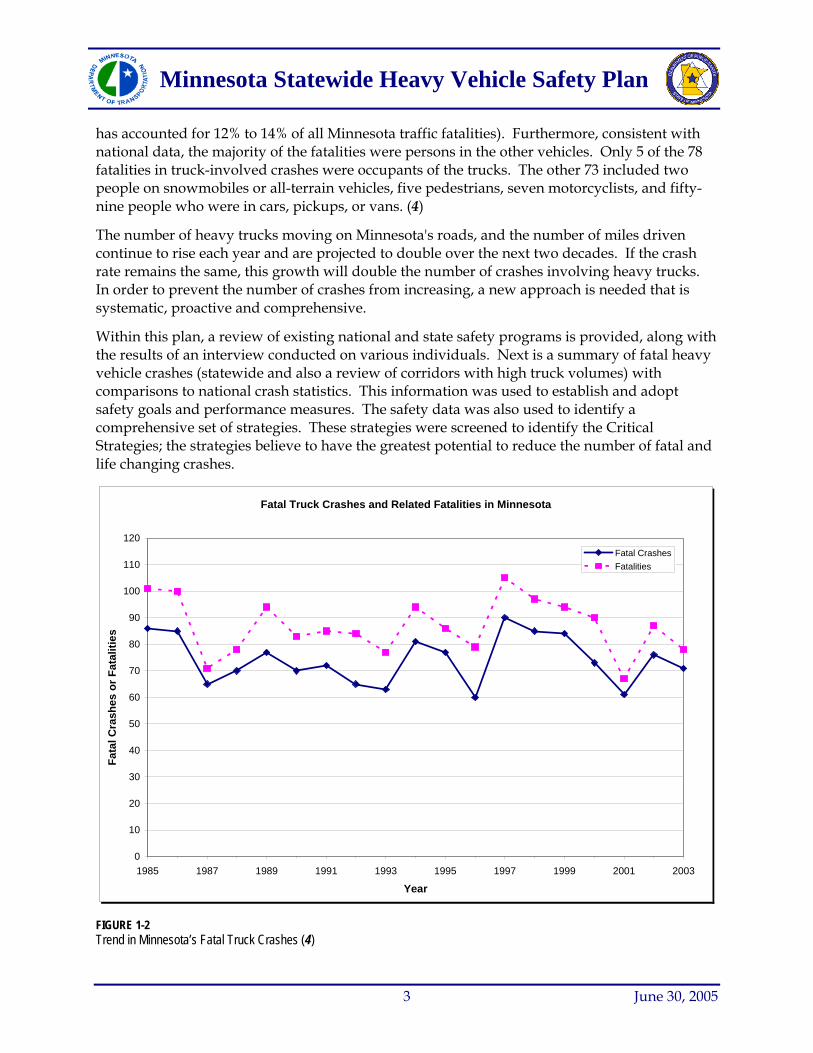
Fatalities (Minnesota): Since the early 1990s, there has been little change in the number of truck1 crashes in Minnesota while the number of fatal truck crashes has fluctuated widely and not shown a decreasing trend (see Figure 1-1 and 1-2). According to data in the Accident Records Database at DPS, there were 71 fatal truck crashes, killing 78 people, in 2003. This was a 10% decrease in the number of fatalities from the previous year, but truck crash fatalities still accounted for 12% of all traffic fatalities in 2003 (between 2000 and 2003, truck crash fatalities
Truck Crashes in Minnesota
0
1000
2000
3000
4000
5000
6000
7000
8000
9000
1985 1987 1989 1991 1993 1995 1997 1999 2001 2003
Year
Num
ber o
f Cra
shes
FIGURE 1-1 Historic Number of Truck Crashes in Minnesota (4)
1 Minnesota Motor Vehicle Crash Facts defines truck crashes using vehicle types where its weight would be 26,000 pounds or higher. Even though not all heavy vehicle crashes are accounted for, this still shows the general trend in Minnesota.
2 June 30, 2005
Minnesota Statewide Heavy Vehicle Safety Plan
has accounted for 12% to 14% of all Minnesota traffic fatalities). Furthermore, consistent with national data, the majority of the fatalities were persons in the other vehicles. Only 5 of the 78 fatalities in truck-involved crashes were occupants of the trucks. The other 73 included two people on snowmobiles or all-terrain vehicles, five pedestrians, seven motorcyclists, and fifty-nine people who were in cars, pickups, or vans. (4)
The number of heavy trucks moving on Minnesota's roads, and the number of miles driven continue to rise each year and are projected to double over the next two decades. If the crash rate remains the same, this growth will double the number of crashes involving heavy trucks. In order to prevent the number of crashes from increasing, a new approach is needed that is systematic, proactive and comprehensive.
Within this plan, a review of existing national and state safety programs is provided, along with the results of an interview conducted on various individuals. Next is a summary of fatal heavy vehicle crashes (statewide and also a review of corridors with high truck volumes) with comparisons to national crash statistics. This information was used to establish and adopt safety goals and performance measures. The safety data was also used to identify a comprehensive set of strategies. These strategies were screened to identify the Critical Strategies; the strategies believe to have the greatest potential to reduce the number of fatal and life changing crashes.
Fatal Truck Crashes and Related Fatalities in Minnesota
0
10
20
30
40
50
60
70
80
90
100
110
120
1985 1987 1989 1991 1993 1995 1997 1999 2001 2003
Year
Fata
l Cra
shes
or F
atal
ities
Fatal CrashesFatalities
FIGURE 1-2 Trend in Minnesota’s Fatal Truck Crashes (4)
3 June 30, 2005
Minnesota Statewide Heavy Vehicle Safety Plan
2. Existing Safety Programs and Interview Results
The Minnesota Statewide Heavy Vehicle Safety Plane defines a system, organization, and process for managing the attributes of the road, the driver, and the vehicle to achieve the highest level of highway safety by integrating the work of disciplines and agencies involved. These disciplines include the four E’s:
1. Engineering (the planning, design, construction, operation, and maintenance of the roadway infrastructure; injury prevention and control
2. Emergency/Health Medical Services (prevention of , response to, and treatment of crash fatalities and injuries
3. Education (health education and those disciplines involved in modifying road user behaviors)
4. Enforcement (consistent and visible enforcement of traffic laws for all vehicle types)
This chapter reports on existing heavy vehicle safety programs that are being used across the Nation. These safety programs will help point to means to achieve the level of integration necessary to meet the highest levels of safety. By reviewing other safety plans the authors hope to define the formal management process that will direct the activities of the Departments of Transportation and Public Safety in a manner that will efficiently achieve the mission and vision.
This chapter also reports on the interviews that were conducted with the safety professionals in Minnesota. The information gathered in these interviews help to describe methods of flexibility to customize the structure and process according to external and internal factors. It is anticipated that the Minnesota Heavy Vehicle Safety plan periodically will be updated and revised.
2.1 Federal Commercial Vehicle Safety Programs
2.1.1 Technological a) CVISN-Commercial Vehicle Information Systems and Networks
CVISN is a collection of information systems and communications networks, owned and operated by government agencies, motor carriers, and other stakeholders, that support Commercial Vehicle Operations (CVO). The CVISN program provides a framework or "architecture" that enables government agencies, the motor carrier industry, and other parties engaged in CVO administrative, safety assurance, and regulatory activities to exchange information and conduct business transactions electronically. Minnesota was a pilot state engaged in these efforts.
4 June 30, 2005
Minnesota Statewide Heavy Vehicle Safety Plan
b) Other Technology Programs
Performance Based Brake Testers-The Federal Motor Carrier Safety Administration (FMCSA) issued a final rule establishing pass/fail criteria for use with performance-based brake testers (PBBTs). These devices measure the braking performance of commercial motor vehicles (CMVs). The final rule allows motor carriers and federal, state and local enforcement officials to use this new technology to determine whether a truck or bus complies with brake performance safety standards. PBBTs are expected to save time and their use could increase the number of CMVs that can be inspected in a given time. The final rule represents the culmination of agency research that began in the early 1990s.
2.1.2 Public Information and Education Programs (PI&E) a) New Entrants Program
All new entrant motor carriers must complete an application package consisting of a motor carrier identification report and application, the MCS-150, and MCS-150A. These application documents may also be completed on-line at http://safer.fmcsa.dot.gov , or by contacting FMCSA headquarters office at (800) 832-5660 and requesting an application mail. Once the application package is completed, the carrier will be granted new entrant registration (USDOT number). After being issued a new entrant registration, the carrier will be subject to an 18-month safety-monitoring period. During this safety-monitoring period, the carrier will receive a safety audit and have their roadside crash and inspection information closely evaluated. The carrier will be required to demonstrate it has the necessary systems in place to ensure basic safety management controls. Failure to demonstrate basic safety management controls may result in the carrier having their new entrant registration revoked. In the federal fiscal year 2004, 1,133 new entrants audits were conducted in Minnesota.
b) No Zone Campaign
A safety initiative sponsored by FMCSA is to teach people about the blind spots or "No-Zones" around trucks and buses. The Campaign was created in 1994 to educate motorists about how to safely share the road with trucks and buses (CMVs). Its goal is to increase awareness of the No-Zones -- danger areas like blind spots, around commercial vehicles, in which cars "disappear" from the view of the truck or bus driver. No-Zones are areas where crashes are more likely to occur. Educating drivers about the No-Zones may reduce deaths, injuries, and property damage from these kinds of crashes.
Working closely with law enforcement agencies and professional associations, as well as other highway safety groups and carriers, FMCSA developed a broad-based strategy to increase public recognition about truck and bus limitations in an effort to influence the motoring public's driving behavior. A series of television, radio, and print public service announcements (PSAs) and pertinent Share-the-Road materials were developed in coordination with the State of Maryland under a Motor Carrier Safety Assistance Program (MCSAP) public education grant. As a result, Campaign materials have been distributed and widely used throughout the country.
5 June 30, 2005
Minnesota Statewide Heavy Vehicle Safety Plan
c) Share the Road Campaign
The FMCSA Share the Road Safely Program provides an opportunity for Commercial Motor Vehicle drivers to set the example for other drivers on how to share the road safely. At the same time, it offers the truck and bus drivers the chance to improve their professional image while they are behind the wheel. Surveys indicate that many highway users are intimidated by the mere size of a truck or bus. When this perception is combined with a highway crash and the resulting roadway congestion, and possible fatal or life-changing injuries, the public image of the motor carrier industry takes a beating no matter who caused the crash. By driving safely to prevent crashes, it is hoped that professional drivers can improve that image and save time, money, and most importantly lives. The coalition consists of FMCSA, National Highway Traffic Safety Administration (NHTSA),American Association of Motor Vehicle Administrators (AAMVA), the American Driver and Traffic Safety Education Association (ADTSEA), state and local governments, law enforcement, motor carriers, industry trade associations, insurance companies, and highway safety organizations. FMCSA public information and education programs have spearheaded the initiative.
The FMCSA believes that the more people know about how to share the road safely, the fewer number of injuries and fatalities will be caused by crashes with large trucks or buses. The campaign centers on the following rules of the road: Drive defensively, give them plenty room, and expect the unexpected.
d) Fatigue- Examining the Issues of Driver Fatigue
FMCSA is undertaking an extensive examination of driver fatigue. The Fatigue Management Program (FMP) for commercial motor carriers is one of the priorities for the agency. FMCSA and Transport Canada are developing a comprehensive North American Fatigue Management Program for Motor Carriers. The program is currently completing pilot testing in two Canadian provinces and a US pilot test with a Texas carrier has begun. The FMP represents a comprehensive approach to driver fatigue. The next phase will be the implementation of a revised one-year evaluation program based on the results of the pilot testing.
Furthermore, FMCSA is conducting three other fatigue related studies:
i. Fatigue management technologies pilot test to study the potential benefits derived from fatigue monitoring technologies combined with fatigue management training.
ii. An investigation of the recovery period required for commercial vehicle drivers with cumulative fatigue to determine the minimum duration of off-duty periods.
iii. A drowsy driver detection system using neural networks using driver performance measures, to develop an algorithm to determine when a driver begins to become fatigued.
e) Driver Wellness Program
FMCSA conducted a study to determine the extent of wellness program in the industry. The program is intended to provide strategies to give drivers opportunities for
6 June 30, 2005
Minnesota Statewide Heavy Vehicle Safety Plan
improved health, benefiting the individual, the company, and the industry. The participants in the wellness program received information, both written and audio, mailed directly to their homes for the 4 months of the study. The informative materials were designed to be interactive; for example, each written chapter had worksheets to be completed. The materials addressed the following four topics:
• Refueling — healthy eating habits; • Relating — value of relationships with family and friends; • Rejuvenating — health benefits of exercise; and • Relaxing — managing stress issues.
The program had a positive health impact on the participants measured both initially and at follow-up. This was shown in both lifestyle habits and physical lifestyle data. The most significant improvements were made in the area of exercise and fitness; this is important because this is the area where drivers needed to make the most improvements.
2.1.3 Enforcement a) Seat Belt Use
The Federal Motor Carrier Safety Regulations (FMCSR) require commercial motor vehicle drivers to wear safety belts. Section 392.16 of the FMCSR (49 CFR 392.16) states, "A commercial motor vehicle which has a safety belt assembly installed at the driver's seat shall not be driven unless the driver has properly restrained himself/herself with the safety belt assembly."
Furthermore, the equipment regulations of the FMCSR require that seatbelts be installed in the vehicle. Section 393.93 of the FMCSR (49 CFR 393.93) requires seat belts on trucks, truck tractors, and buses manufactured on or after January 1, 1965. For vehicles built on or after January 1, 1965, but before July 1, 1971, the seat belts must comply with the FMCSR in effect on the date of manufacture. For vehicles built on or after July 1, 1971, the seat belts must comply with the applicable National Highway Traffic Safety Administration's Federal Motor Vehicle Safety Standards concerning seat belts (49 CFR 571.208, 571.209, and 571.210).
b) Alcohol and Drug Rules
The USDOT requires alcohol and drug testing of persons in safety sensitive positions, across all modes of transportation. The FMCSA regulations require employer-based alcohol and drug testing of drivers, who are required to have a Commercial Driver’s License (CDL). The USDOT rules also include detailed procedures for urine drug testing and breath-alcohol testing. Urine drug testing rules were first issued in December 1989. In 1994, the rules were amended to add breath alcohol testing procedures. In the years following the implementation of the drug and alcohol testing requirements, a number of factors including changes in testing technology, and the issuance of a number of written interpretations, required the Office of Secretary of Transportation (OST) to review and revise the rules. In December of 2000, OST
7 June 30, 2005
Minnesota Statewide Heavy Vehicle Safety Plan
published final rules that incorporated these factors, as well as input from the public sector, into the existing drug and alcohol testing regulations. In August of 2001, the FMCSA revised modal specific drug and alcohol testing regulations published in 49 Code of Federal Regulations Part 382 to reflect the revisions made by OST.
In the case of alcohol, an on-duty CDL driver is in violation of FMCSA regulations when his or her blood alcohol content is equal to 0.02 grams per 210 liters of breath, or higher. If the driver tests at a concentration of 0.04 or higher, he or she also must undergo referral, evaluation, and treatment, pursuant to Part 382, subpart F. The alcohol violation rate for the industry (published annually by the FMCSA and used to evaluate required motor carrier testing rates) is based on this latter 0.04 cutoff level. For drugs (marijuana, cocaine, opiates, amphetamines, and PCP), the cutoff levels for identifying use are based on guidelines set by the Department of Health and Human Services.
As part of the Compliance Review process, Minnesota ensures that the motor carriers and hazardous materials shippers are complying with these regulations Minnesota also adopted these regulations for motor carriers operating in intrastate commerce in Minnesota. In Fiscal Year 2004, Minnesota initiated 62 enforcement actions against motor carriers for violations of the controlled substances testing regulations.2
c) Compliance Reviews
The single largest activity within the FMCSA is the compliance review program. According to FMCSA, Federal and State enforcement personnel conducted approximately 11,344 compliance reviews in FY 2004. In Minnesota, 396 compliance reviews were completed by state personnel. A compliance review is an on-site examination of the motor carrier's records and operations to determine whether the carrier meets the safety fitness standard. The review may include an examination of the following aspects of the motor carrier's operations:
• Alcohol and controlled substance testing • Driver's hours of service • Driver qualification • Vehicle inspection and maintenance • Financial responsibility • Crashes • Hazardous materials • Other safety and transportation records • Roadside vehicle out-of-service rate.
A compliance review is conducted to investigate potential safety violations, to investigate complaints, or is in response to a carrier's request for a change in safety rating. The result of the compliance review provides a safety rating for the company and/or may result in the initiation of an enforcement action. Through these combined efforts of education and technical assistance, heightened awareness of safety programs,
2 From Motor Carrier Management Information Systems (MCMIS)
8 June 30, 2005
Minnesota Statewide Heavy Vehicle Safety Plan
and enforcement action, it is anticipated that the motor carriers will improve their safety performance and reduce crash rates.
d) MCSAP – Motor Carrier Safety Assistance Program- Funding and Training to States for vehicle inspections, carrier reviews, hazardous materials enforcement.
To receive program funds, a state must adopt and enforce state laws that are compatible with the Federal Motor Carrier Safety Regulations and Federal Hazardous Materials Regulations. The state must also obligate a 20 percent share of funds to match the federal grant. Furthermore, a state must prepare a Commercial Vehicle Safety Plan that reflects a performance based program and must maintain a level of effort as prescribed by 49 CFR 350.
Program elements of the MCSAP program include
• Driver/vehicle inspections • Compliance Reviews • Traffic Enforcement • Public Education and Awareness • Data Collection
e) PRISM- Performance and Registration Information Systems Management.
The Performance and Registration Information Systems Management, (PRISM), enables state enforcement agencies to access safety data from the U.S. Department of Transportation and participating states when a motor carrier registers a commercial vehicle.
PRISM began in 1991, when Congress mandated a study to explore the use of commercial vehicle registration as a safety enforcement tool. Minnesota was one of the pilot states. The pilot program proved conclusively that linking the registration process to compliance could serve as an enforcement tool in federal and state motor carrier safety programs.
PRISM requires that anyone registering a commercial vehicle must provide the state with an individual who will be responsible for the safety of that vehicle. If a vehicle has a poor safety record, state and federal officials will work with the motor carrier to locate problem areas and identify solutions. If the motor carrier continues to be non-compliant, a range of sanctions can be taken against them, including the revocation of the vehicle's registration (license plates).
f) Load & Cargo Securement
The FMCSA published new cargo securement rules and motor carriers operating in interstate commerce had to comply with the new requirements beginning January 1, 2004. The new rules are based on the North American Cargo Securement Standard Model Regulations, reflecting the results of a multi-year research program to evaluate U.S. and Canadian cargo securement regulations; the motor carrier industry’s best practices; and recommendations presented during a series of public meetings involving
9 June 30, 2005
Minnesota Statewide Heavy Vehicle Safety Plan
U.S. and Canadian industry experts, Federal, State and Provincial enforcement officials, and other interested parties. The new rules require motor carriers to change the way they use cargo securement devices to prevent articles from shifting on or within, or falling from commercial motor vehicles. The changes may require motor carriers to increase the number of tie-downs. The FMCSA has adopted new performance requirements concerning deceleration in the forward direction, and acceleration in the rearward and lateral directions, that cargo securement systems must withstand.
g) Virtual Weigh Stations
Another method of gaining safety compliance is the use of Virtual Weigh Stations (VWS). A VWS uses weigh-in-motion scales (WIMs) in conjunction with a set of highly focused commercial vehicle enforcement strategies to improve truck weight compliance, such as video imagery, license plate reader, and over dimension sensors. Each states’ remote virtual weigh station (VWS) sites enables their enforcement personnel to screen for possible excessively loaded trucks without disturbing the majority of legal vehicles. Downstream enforcement vehicles are equipped with computers to provide real time information (including images) on suspected violators. Officers will then conduct roadside inspections using certified portable scales. This system enhances the screening process and improves the probability of detecting overweight vehicles, particularly on off-mainline routes.
Presently, VWS are deployed in Indiana, Kentucky, and Alaska. In addition to weight compliance screening, the VWS can include screening for other safety and security related factors. For example, the use of infrared technology to identify defective tire/brake systems before they fail, or the use of “sniffer” detection equipment to identify radioactive emissions, contraband or chemical emissions.
h) Commercial Drivers’ License- ensuring licensing standards
Driving a commercial motor vehicle requires special skills and knowledge. Prior to implementation of the CDL Program, there were no established nationwide standards or license classification system for the issuance of commercial license. The Commercial Motor Vehicle Safety Act of 1986 set out to improve highway safety by ensuring that drivers of large trucks and buses are qualified to operate those vehicles and to remove unsafe and unqualified drivers from the highways. The Act established minimum national standards that States must meet when licensing CMV drivers. Since April 1, 1992 drivers have been required to have a CDL in order to drive a commercial motor vehicle. FHWA developed and issued standards for the testing and licensing CMV drivers. Among other things, the standards require states to issue CDLs to their CMV drivers only after the driver passes knowledge and skills tests administered by the state related to the type of vehicle to be operated. The FMCSA is also engaged in a project to develop specifications and pilot test an anti-fraud system for CDL third party testing activities. The issuance of fraudulent CDLs is a nationwide problem. The DOT’s Office of Inspector General (OIG) issued a report in May 2002 stating that suspected criminal activities had been identified in 16 State’s CDL
10 June 30, 2005
Minnesota Statewide Heavy Vehicle Safety Plan
programs. While Minnesota was not identified as one of the sixteen states, Minnesota must be able identify problem drivers when they are operating within Minnesota.
The FMCSA is also issuing a Driver Violation Notification Service Feasibility Study that will assess the safety and economic impacts of state-based systems that notify truck and bus company managers when one of the drivers has a traffic conviction on their driving record. Existing regulations require driver self reporting of violations and employers to follow up on those reports. Presently, the employer is required to verify the driving record of each of their drivers at least once every twelve (12) months.
To identify potentially problem drivers, Minnesota utilizes a problem driver pointer system or PDPS. The PDPS is a central repository of information regarding problem drivers throughout the country. Its primary function is to support the driving license issuing process.
i) Commercial Vehicle Driver Seat Belt Partnership
Following the release of a study that found that only 48 percent of all commercial drivers wear safety belts, U.S. Transportation Secretary Norman Y. Mineta announced a new national public-private partnership - the Commercial Motor Vehicle Safety Belt Partnership to combat low safety belt use among the nation's commercial motor vehicle drivers. The Partnership now includes representatives from the motor carrier safety community.
Nationally, 80 percent of passenger vehicle drivers wear safety belts. In comparison, the low number of truck drivers buckling up has taken a severe toll. In 2003, of the 620 commercial drivers killed in crashes almost half (309) were not wearing safety belts. Of the 171 drivers who were ejected from their trucks, almost 80 percent of them were not wearing safety belts.
On April 1, 2005, Secretary Mineta announced a new national education safety belt campaign message, “Be Ready. Be Buckled.”
2.1.4 Emergency Services a) Homeland Security – Highway Watch Program
The Highway Watch program is a nationwide partnership between the American Trucking Associations, motor carriers, the FMCSA and the Department of Homeland Security to utilize the skills, experiences, and "road smarts" of America's transportation workers to help protect the nation's critical infrastructure and the transportation of goods, services, and people.
Highway Watch® participants - transportation infrastructure workers, commercial and public truck and bus drivers, and other highway sector professionals - are specially trained to recognize potential safety and security threats and avoid becoming a target of terrorists. The Highway Watch® effort seeks to prevent terrorists from using large vehicles or hazardous cargoes as weapons.
11 June 30, 2005

Minnesota Statewide Heavy Vehicle Safety Plan
Highway Watch® training provides Highway Watch® participants with the observational tools and the opportunity to exercise their expert understanding of the transportation environment to report safety and security concerns rapidly and accurately to the authorities. In addition to matters of homeland security - stranded vehicles or crashes, unsafe road conditions, and other safety related situations are reported eliciting the appropriate emergency responders.
b) Hazardous Materials Security Plans
Following the terrorist attacks of September 11, 2001, and subsequent attacks on the transportation system, the FMCSA issued rules for shippers and transporters of certain types of hazardous materials. Hazardous materials in transportation are vulnerable to sabotage or misuse and in the wrong hands pose a significant security threat. The security of hazardous materials in transportation poses unique challenges as compared to security at fixed facilities because of the changing environment surrounding a moving vehicle. Since hazardous materials are frequently transported in large quantities, once mobile they are particularly vulnerable to theft, interception, detonation, or release. When transported in proximity to large population centers, accidental or intentional acts could have serious consequences.
The Federal Motor Carrier Safety Administration (FMCSA) conducted over 30,000 Security Sensitivity Visits (SSVs) between October 2001 and April 2002. The SSVs consisted of face-to-face meetings between FMCSA or state investigators and top carrier officials to assess security vulnerabilities and identify countermeasures that can improve security. FMCSA then began including SSVs as part of all compliance reviews on hazardous materials (HM) carriers to encourage a high level of vigilance within the industry.
The Department of Transportation's Research and Special Programs Administration (RSPA) issued new regulations under Docket No. HM-232 intended to enhance the security of hazardous materials transportation. These new regulations impose security plan and security training requirements on certain hazardous materials shippers and carriers.
The HM-232 regulations require persons who offer certain types and quantities of hazardous materials (hazmat) for transportation or transport in commerce to develop and implement security plans by September 25, 2003. In addition, all hazmat employees, as defined in the Hazardous Materials Regulations (HMR, 49 CFR Parts 171-180), must receive training that provides an awareness of security risks associated with hazmat transportation and methods designed to enhance hazmat transportation security.
12 June 30, 2005
Minnesota Statewide Heavy Vehicle Safety Plan
2.2 State Commercial Vehicle Safety Programs
2.2.1 Education a) Michigan Center for Truck Safety, Mobile Classroom
The Michigan Center for Truck Safety (MCTS) is a grant –funded, non-profit organization, founded in 1990, dedicated to increasing highway safety through safer truck travel. The Center is to develop a comprehensive statewide safety program for the trucking industry. The Center does this by providing Michigan's trucking industry with a variety of free and low-cost safety programs for company managers and commercial drivers. The Center also tries to educate the driving public on how to share the road safely with trucks. Funding for the Center comes from registration fees on heavy vehicles.
The Michigan State Police Motor Carrier Division also developed a listserve (an email group list) for press releases specific to commercial vehicle issues. The intent of the group list is to create a communication link between the trucking industry and the enforcement community.
b) CHP- I15 “Be Aware & Share” Campaign
In 1992, the California Highway Patrol began receiving federal grant funding from the California Office of Traffic Safety to establish task forces comprised of representatives from city, county, regional, state, and federal government agencies, and the private sector. The mission of each task force is to assess a high-collision highway, truck, and/or pedestrian corridor, make recommendations to improve traffic safety on the identified roadway or pedestrian site, and implement, if economically feasible, those recommendations. For truckers, the I-15 Freeway in San Bernardino County and State Route 99 in Kern County. Recently Completed: I-5 in Sacramento and Yolo Counties and I-580 in Alameda County.
The information campaign consists of the following recommendations:
• Don't drive drowsy - get plenty of sleep, eat well and watch your hours. An alert driver is a safe driver.
• Maintain a safe vehicle - inspect your vehicle before each trip and check your brakes regularly.
• Watch for trouble ahead - take advantage of your driving height and avoid emergency braking situations.
• Drive carefully in work zones - expect the unexpected. • Be the professional - notify authorities of unsafe conditions. • Always buckle up - it's the law. • In minor, non-injury collisions - pull over at the nearest exit to exchange
driver/insurance information.
13 June 30, 2005
Minnesota Statewide Heavy Vehicle Safety Plan
c) CVSA (Commercial Vehicle Safety Alliance)-Distance Learning Program
To better meet the needs of its constituency, beginning in January 2005, the CVSA expanded its safety training to the commercial vehicle industry by using the Internet and teleconferencing technology (webinars) for distance learning. Each "webinar" training session will last about two hours.
The opening seminar - North American Cargo Securement Standard - provided information to help the commercial vehicle industry understand the reasoning behind the new standards for cargo securement. Knowing the specifics of the standards will make sure drivers and vehicles are prepared to transport cargo safely on the highways. Seminar participants gain the knowledge they need to comply with the federal regulations through the seminar's various scenarios and examples on how the standard applies.
d) Iowa Department of Transportation
A unique program that the Iowa DOT participates in is the Ride Along Program. Once a year, the Motor Vehicle Enforcement (MVE) allows personnel from the motor carrier industry to ride along with an officer for part of his or her shift. This allows both parties to gain a different perspective of each others’ duties and allows time for an exchange of views while on the road. This program is coordinated through the Iowa Motor Truck Association (IMTA).
e) New York State, Annual Motor Carrier Safety Conference
New York State Department of Transportation hosts an annual conference with enforcement and industry to discuss federal and state safety trends with industry partners. Topics generally include discussion of new rules, commercial vehicle crash statistics, new federal and state initiatives, security updates, and methods of maintaining compliance with the regulations.
2.2.2 Engineering a) Lane restriction
One method employed to improve safety on the highways is to enact truck lane restrictions. Lane restrictions are those that restrict trucks of specific size and configuration from traveling in specified lanes of a roadway. There are several variations of truck lane restriction strategies, typically either mandated or voluntary. Normally, in freeways with three or more lanes, trucks have been restricted from using the left lanes, and are required to travel only in the right hand lanes. For example, the Virginia Department of Transportation implemented lane restrictions that prohibit trucks and tractor-trailer combinations from operating in the median (left) lanes. The State of Georgia also restricts tractor-trailer combinations to the right lanes of intestate highways on its rural interstates. The State of Texas studied the effects of lane restrictions on safety on I-10 near Houston. The early results of the study found that there was a reduction in truck crashes; however, there was a strong enforcement
14 June 30, 2005
Minnesota Statewide Heavy Vehicle Safety Plan
presence during the study. Other studies have found limited safety benefits in this strategy as well. (5)
b) Speed differential for passenger cars and heavy vehicles
At least 11 states have different speed limits for passenger cars and heavy vehicles on their road ways. For example, Arkansas has set the speed limit for passenger cars at 70 mph and 65 mph for trucks. In Illinois the speed limits are set at 65 mph for cars and 55 mph for trucks. Other states with differential speed limits for passenger cars and heavy trucks include Michigan, Montana, North Carolina, Ohio, Virginia, and Washington. While differential speed limits have been shown to reduce the speeds of trucks relative to passenger cars, there has been little evidence shown that speed limit differential contributes to reducing crashes.
2.2.3 Enforcement a) Minnesota Relevant Evidence Law
A unique practice used in Minnesota that could be used to improve the effectiveness of other State enforcement programs is its “relevant evidence,” law. This law has been used in Minnesota since 1980. Minnesota allows bills of lading, weight tickets, and other documents that indicate the weight of a truck to be used as evidence in a civil proceeding to establish overweight violations. Enforcement is through an audit, generally of shipper or freight forwarder files; and civil action can be taken against the driver, the shipper, the owner, or the lessee for all or part of the fine, depending on the degree of responsibility for causing the overweight movement. The audit also provides a means to enforce multi-trip permit use, determine how frequently they are used, and recover damage costs. Enforcement personnel interviewed believe the program has been a great success and are strong supporters of the approach. The findings of a 1985 program effectiveness audit by Minnesota DOT and State Patrol indicated that, as part of a comprehensive weight enforcement system, relevant evidence proved to be extremely successful in restricting the operation of illegally overweight vehicles.
In 1993, FHWA initiated a three-year pilot project to assist Iowa, Louisiana, Mississippi, and Montana in adopting relevant evidence laws. However, none of the States succeeded in passing legislation. Indications are that industry opposition contributed to defeat of the proposed bills. Several States have expressed a renewed interest in relevant evidence laws, which may be a viable option for the future.
Using a different approach, Georgia DOT adjudicates all weight citations through an administrative process rather than through a court system. In theory, this should increase the probability of collecting fines. The process is quite similar to the way in which tax audits are processed, that is, the citation is issued, and the fine must be paid within a period of time or a hearing requested. Failure to pay results in the initiation of a collection process by the DOT investigative unit. This may include impoundment of the vehicle, suspension of its registration, or placement of a lien on the vehicle.
15 June 30, 2005
Minnesota Statewide Heavy Vehicle Safety Plan
b) Oregon DOT, Green Light Electronic Clearance Program, Trusted Carrier Program
The Oregon Green Light system is a truck weigh station "preclearance" system. Weigh in Motion (WIM) Scales in the roadway weigh trucks in-motion at high speed as they approach the station while automatic vehicle identification (AVI) devices look for signals from a palm-size transponder mounted inside truck cab. The transponder contains only a 10-digit number that is used to identify the carrier and specific truck. A computer takes in all the information, verifies truck size and weight, checks the carrier's registration and safety records, and sends a green light signal back to the transponder if the truck is "good to go" past the station. Green Light is a free service available to any company with trucks that frequently stop at Oregon weigh stations. Oregon Green Light is a member of the North American Preclearance and Safety System (NORPASS) program.
Green Light provides Oregon with enormous efficiencies as it increases weigh station capacity without physically expanding them. But the program provides the trucking industry with even more tangible benefits. According to the Oregon Department of Transportation Motor Carrier Transportation Division, operating a heavy truck is estimated to cost $1.24 per minute and stopping at a weigh station can take five minutes. On that basis, because Green Light allowed trucks to avoid 5 million stops at weigh stations, trucking companies saved $31 million in operating costs and 416,667 hours of travel time since 1999.
For motor carriers who wish to participate in Oregon’s Trusted Carrier Program, the steps are as follows:
• Enroll in Green Light • Meet bypass criteria • Pass a 12-month History of Operations Review
- No Oregon suspensions. - No IFTA tax license revocations. - No carrier-related civil monetary penalty actions. - No more than one late carrier-related tax report. - No more than one repayment plan to discharge a liability with ODOT.
• Pass a Carrier Safety Record Review - Driver and vehicle out-of-service percentage is at or below national average. - No serious safety violations, such as violating an out-of-service order or driver
found Driving Under Influence.
Benefits
• Weigh station preclearance privileges. • Trusted Carrier Partner vanity license plate. • Waiver of ODOT tax bond. • Trusted Carrier Partners are NOT subject to random safety inspections unless
warranted. • Trusted Carrier Partners are NOT subject to safety compliance reviews unless
warranted.
16 June 30, 2005
Minnesota Statewide Heavy Vehicle Safety Plan
Oregon DOT believes this program to be a win-win for both the trucking and enforcement communities. While the trucking companies benefit from not having to pull into weigh stations after being “cleared” by the system, enforcement officers benefit by being able to focus on other potentially non-compliant carriers.
c) Kentucky Division of Motor Carriers
The Commonwealth of Kentucky allows truck drivers safe havens at weigh stations if the driver needs to pull over and rest. Also, Kentucky is a member of NORPASS weigh station electronic clearance program.
Kentucky DMC also employs, the IriSystem-Infra-Red Brake Screening Vehicle. This device allows us to screen for inoperative brakes, under or over inflated tires, bad wheel bearings and exhaust leaks while vehicles are traveling at normal highway speeds, using infra-red technology. The old process of checking these possible violations has been totally random.
d) Iowa DOT TraCS: Traffic and Criminal Software National Model
The system allows law enforcement officers and others to collect, validate, print, and receive information in the squad car using a notebook or pen-based computer. This information can be transferred to central databases for reporting, analyses, and retrieval. TraCS has reduced time requirements for data collection and entry, increased accuracy, and made safety data rapidly available for analysis and action. It is being licensed to numerous other states for various applications. While not developed specifically for truck applications, TraCS employs the Vehicle Safety Inspection System (VSIS), which is similar to the federal program ASPEN. Both systems incorporate the vehicle inspection data.
e) California and Pennsylvania - Strengthen CDL Testing Procedures
Many states monitor and audit testing procedures for the CDL program. Pennsylvania uses covert observations of its third party testers to detect fraud in the system. This program, while effective is expensive.
California operates an employer testing program (ETP), since only third-party testers affiliated with a commercial driver employer are certified to give the test to their applicants. Approximately 1,000 ETP providers operate in California and roughly 7 percent of all commercial drivers are tested by ETP providers. These ETP providers frequently offer training, which means that the trainer and test examiner are not always independent and can be the same person. Pennsylvania licenses 60 percent of its truck drivers through third party testers, but the third-party testers do not have to be employers; most of Pennsylvania’s third-party testers also provide the training.
17 June 30, 2005
Minnesota Statewide Heavy Vehicle Safety Plan
2.3 Industry Initiatives Many motor carrier companies have internally implemented safety programs for their employees. These programs may take on many different forms, and are often tailored to meet the needs of individuals industries, business, and drivers. A sample of these programs follows.
a) How’s My Driving Program
There are numerous industry supported programs that use decals to take calls from the general public about the operator’s driving. One of the more successful programs is Driver’s Alert, which began in 1989. The Driver’s Alert program not only supplies the decal with the toll-free number, but monitors the calls and provides the member company with trend analysis, fleet reports, incident types, and time of day information. This program also provides management reports that include information on calls responded to and actions taken so that management can monitor the program. Great West Casualty monitored 78 companies using this program and found that
• 51% improvement in loss ratio • 53% improvement in accident frequency • 67% improvement in DOT reportables3
b) Driver Simulators
A $1-million system was recently purchased by the Texas Motor Transportation Association. This system is used to allow experienced truck drivers to safely experience dangerous situations such as a veering car, a tire blowout, or dense fog. The full-motion simulator is built into a 53-ft trailer and uses an authentic truck cab that moves in response to a driver’s inputs when viewing driving scenarios on a large screen. The trailer also contains a small classroom with six computers that provide interactive lessons on topics such as space management and securing loads. The association will rent the unit to carriers for $1,000 per day. No data regarding the effectiveness of this training tool was found in this review.
c) Computer Based Training
Computer-based training is a means of providing companywide job consistency and reducing training costs (Kahaner, 2001). UPS, which has been using CD- and web-based programs since 1998, states that they are much more efficient and yield better results than paper manuals. A computer-based training program that has been implemented by Smithway Motor Xpress of Ft. Dodge, IA to teach load securement procedures has reduced training costs from $1,000 per driver to $150 per driver. It has been associated with a reduction of claims in that area of 87%. Most of the cost saving results from a reduction in the time it takes drivers to learn the material when presented using computers compared with classroom lecture and on-the-job training. Drivers learn at their own pace and can take laptops with them on the road and study the coursework in their down-time.
3 www.gwccnet.net
18 June 30, 2005
Minnesota Statewide Heavy Vehicle Safety Plan
d) Hands – On Training
At Contract Freighters, Inc. (CFI) of Joplin, MO, the training that the company provides to newly hired drivers is quite extensive. CFI’s trainers are company drivers who undergo a 36-hour in-house course that includes methods of motivation, constructive criticism, and mental aspects of the job (teaching drivers why they should do something in addition to what they should do). Prospective trainers observe each others’ driving performance and provide constructive criticism before they begin training new hires. Once a trainer begins working with new hires, he or she undergoes a management review every 6 months. Before they go on the road, new drivers undergo a week-long orientation which includes meeting department managers, attending presentations on equipment maintenance and safety, and federally mandated physical and road testing.
Drivers employed by Schneider National of Green Bay, WI who have not yet logged 30,000 miles are divided into two categories. The first group consists of drivers who have attended a driving school and have a CDL. They are trained for 1 week (3 days classroom and 4 days over the road). Upon passing the company road test, they spend a minimum of 2 weeks with a training engineer. The training engineer does not sleep while the student drives and limits his or her own driving for demonstration purposes to less than 25% of the miles driven during training. The second group of drivers consists of drivers with no experience or CDL. They attend a basic course for a minimum of weeks and must pass both CDL tests and the company road test before moving on to the training engineer stage. Trainees are later teamed with another driver for the next 4 to 6 weeks. Schneider has an on-going program of driver training to ensure up-to-date skills. Annual recertification in hazardous materials and brake adjustment is required. (6)
Other examples of company based training for entry-level drivers include the following:
• Robert Hansen Trucking, Inc. of Delevan, WI for drivers with 10,000 to 30,000 miles of hands-on training with a company driver trainer-finisher are required after the trainee has completed a 12-week, full-time truck driving program (classroom, lab, range, and on-street) covering the PTDI (Professional Truck Driving Institute) curriculum.
• ROCOR International of Oklahoma City, OK: After a candidate completes a PTDI-certified driving school program, trainees without any prior experience are placed with a driver-trainer for a period of 8 to 10 weeks before being assigned their own truck. Trainees with more than 3 months but less than 6 months of experience must complete the apprentice program of 6 weeks with the driver–trainer. Trainees with more than 6 months but less than 12 months of driving experience must complete 3 weeks with the driver-trainer.
• CRST of Cedar Rapids, IA: Its new drivers must spend a minimum of 50,000 miles on the road with a driver–trainer after graduating from one of seven PTDI–certified training schools.
e) North American Transportation Management Institute.
19 June 30, 2005
Minnesota Statewide Heavy Vehicle Safety Plan
NATMI is a professional development organization for transportation industry professionals. NATMI offers seminars nationwide on safety management, maintenance management, federal regulatory compliance, human resources, crash investigation, and transportation security. NATMI also offers professional credentials in the areas of motor fleet safety, security, maintenance, and driver training. NATMI partners with state trucking associations and is overseen by the Truckload Carriers Association.
f) Insurance Company Programs
Many of the insurance carriers specializing in covering the trucking industry play an active role in promoting safety education and provide resources to the trucking companies to implement these safety programs.
One prominent insurance carrier for the motor carrier industry is Great West Casualty Co. Great West has an extensive library, both printed and video materials, available for its insured to take advantage of. Great West also provides safe driver award materials that can be awarded to the qualified drivers.
Great West is presently providing a program called “Stop Critical Crash”. This program that includes both video and classroom instruction, reviews rear end collisions, right turn squeeze collision, and backing crashes with drivers. Instruction kits are provided to the insured carriers.
Training help is also provided for carriers transporting hazardous materials. Great West has materials and information available for developing a hazardous materials safety and security plan, qualifying, screening, and training drivers, and general materials handling.
The Sentry group of insurance companies also provides training materials for its insured companies. Sentry also has an extensive on-line training program for its insured. The on-line training program offers modules in:
• Drivers’ records of duty status (logs) • Crash Investigation • Resource Conservation and Recovery Act (RCRA) – Hazardous Wastes storage,
transportation, handling, and disposal requirements. • Substance Abuse Awareness • Dimensions of Safe Driving
To better serve its clients Sentry also provides its insured carriers with consulting services. These services include crash reviews, safety audits, and fleet safety awards.
The Lancer group of insurance companies also provides training materials for its insured companies. Lancer calls its program Safe Truck Plus, which is available to all policy holders. The materials consist of videos, brochures, and manuals. The program focuses rear end collisions, backing, and right turn squeeze crashes. Lancer also provides a crash kit to be placed in the truck that contains forms for the driver to obtain all the pertinent information following a crash. The kit also contains a single use camera for the driver to take pictures of the crash scene.
20 June 30, 2005
Minnesota Statewide Heavy Vehicle Safety Plan
Almost all of the safety programs identified specific tools and techniques that, if broadly implemented, appear likely to yield safety benefits. However, there are overarching needs and requirements to promote the effectiveness of CMV safety programs that cannot be overlooked. For example, beyond the federally mandated programs such as compliance reviews, there are no standardized curricula for entry-level driver training and remedial training for problem drivers (Zacharia and Richards, 2002). Without standardization, poor-performing drivers could easily slip through the cracks and be given responsibility of a heavy vehicle.
The interview was designed for any organization that is responsible for or involved in traffic safety. Within the interview seven agencies or divisions within each of the safety agencies and members of the private sector, are identified along with those questions relative to each agency. From February through the middle of March (2005), key individuals at each of the seven agencies and members of the motor carrier industry, were asked to answer a series of questions regarding heavy vehicle safety in Minnesota. The individuals that participated in the interview process are listed in Table 2-2.
For the Minnesota Heavy Vehicle Safety Plan, several safety officials, from both the public and private sectors, were interviewed to determine areas of emphasis and implementation for their organizations. A questionnaire was developed to evaluate their respective agency’s practices in heavy vehicle safety promotion and to develop and identify areas where there is room for improvement.
2.5 Interview Results
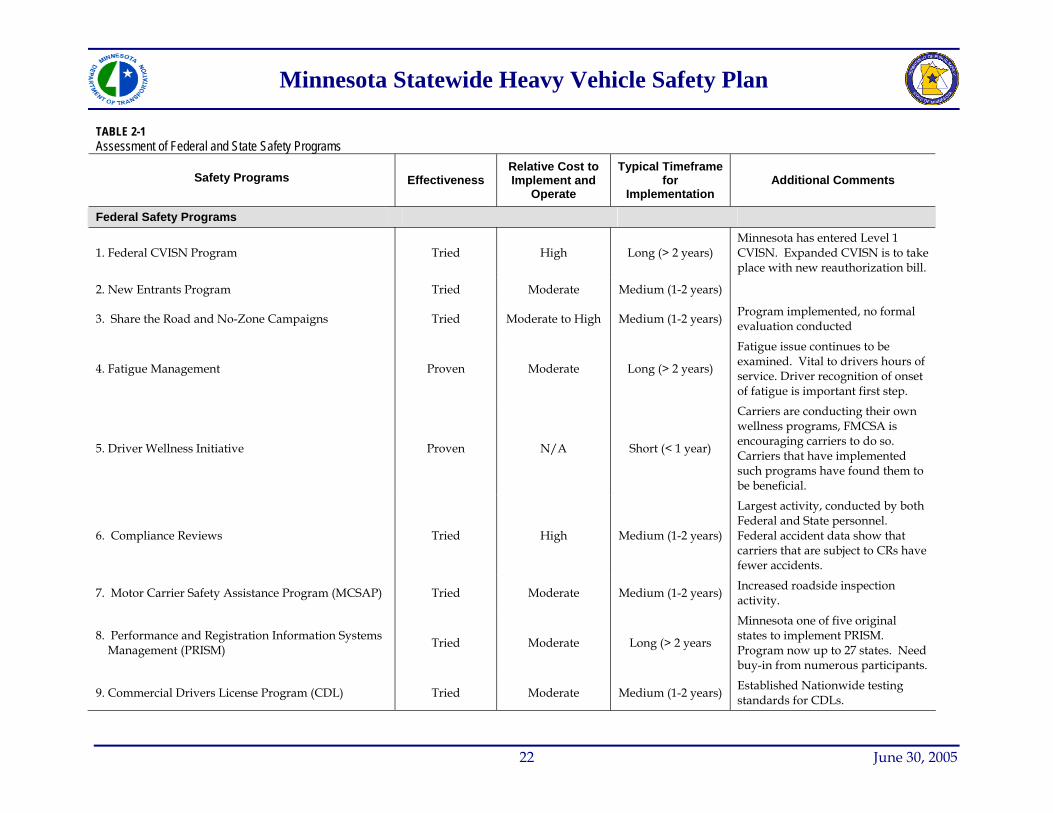
This section of the report focuses upon effectiveness of the safety programs previously discussed. The purpose is to identify those commercial motor vehicle (CMV) safety programs that have greatest potential to improve CMV safety. The safety programs are summarized in the Table 2-1, with technical information as well as comments gathered from a variety of sources including from the trucking and motorcoach industries.
2.4 Safety Program Effectiveness
Table 2-1 lists the safety program, its effectiveness (Proven – tested and found to be effective; Tried – implemented but has not be rigorously tested, results are inconclusive, etc.; and Experimental – new program that has recently been implemented), how costly it is to implement, the time frame for implementation, and any additional comments, such as if there has been a formal evaluation of the program.
In addition to providing insurance coverage for property carriers, Lancer also insures passenger carriers. Lancer provides the passenger carriers all of the relevant safety materials that it provides to the property carriers, with the focus on passenger safety. Furthermore, Lancer provides its insured passenger carriers with numerous safe driving award packages and produces a driver safety newsletter.
21 June 30, 2005
Minnesota Statewide Heavy Vehicle Safety Plan
TABLE 2-1 Assessment of Federal and State Safety Programs
Safety Programs Effectiveness Relative Cost to Implement and
Operate
Typical Timeframe for
Implementation Additional Comments
Federal Safety Programs
1. Federal CVISN Program Tried High Long (> 2 years) Minnesota has entered Level 1 CVISN. Expanded CVISN is to take place with new reauthorization bill.
2. New Entrants Program Tried Moderate Medium (1-2 years)
3. Share the Road and No-Zone Campaigns Tried Moderate to High Medium (1-2 years) Program implemented, no formal evaluation conducted
4. Fatigue Management Proven Moderate Long (> 2 years)
Fatigue issue continues to be examined. Vital to drivers hours of service. Driver recognition of onset of fatigue is important first step.
5. Driver Wellness Initiative Proven N/A Short (< 1 year)
Carriers are conducting their own wellness programs, FMCSA is encouraging carriers to do so. Carriers that have implemented such programs have found them to be beneficial.
6. Compliance Reviews Tried High Medium (1-2 years)
Largest activity, conducted by both Federal and State personnel. Federal accident data show that carriers that are subject to CRs have fewer accidents.
7. Motor Carrier Safety Assistance Program (MCSAP) Tried Moderate Medium (1-2 years) Increased roadside inspection activity.
8. Performance and Registration Information Systems Management (PRISM) Tried Moderate Long (> 2 years
Minnesota one of five original states to implement PRISM. Program now up to 27 states. Need buy-in from numerous participants.
9. Commercial Drivers License Program (CDL) Tried Moderate Medium (1-2 years) Established Nationwide testing standards for CDLs.
22 June 30, 2005
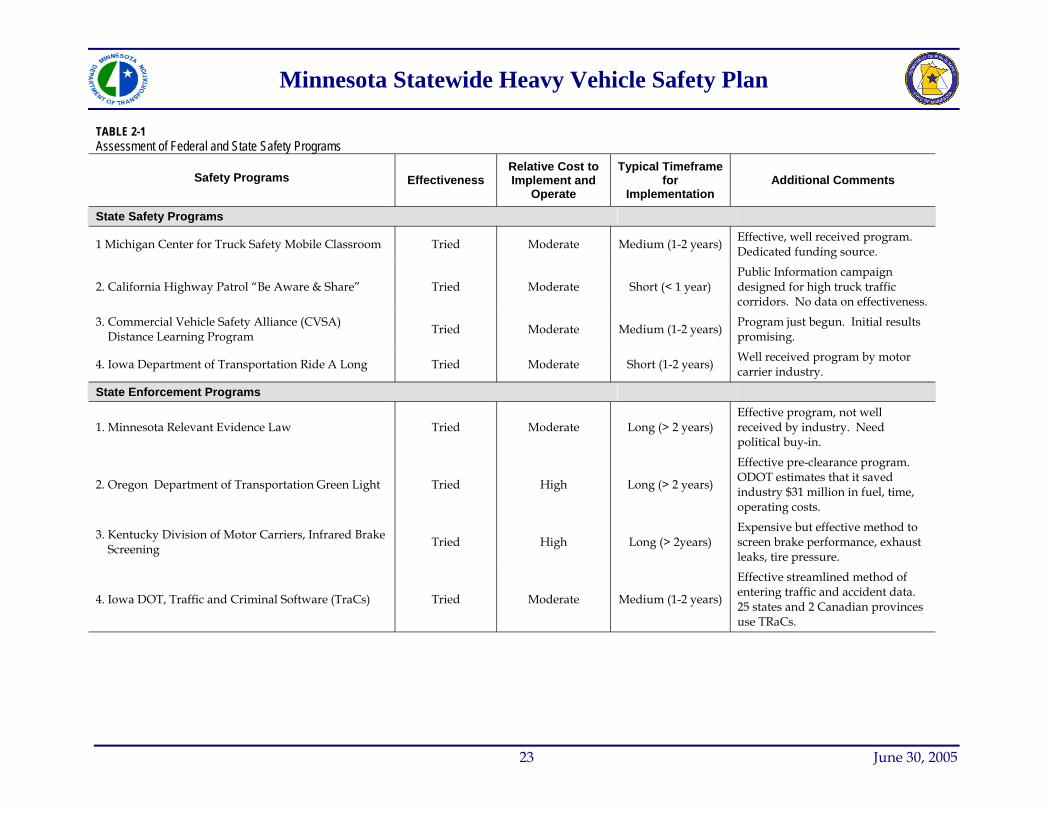
Minnesota Statewide Heavy Vehicle Safety Plan
TABLE 2-1 Assessment of Federal and State Safety Programs
Safety Programs Effectiveness Relative Cost to Implement and
Operate
Typical Timeframe for
Implementation Additional Comments
State Safety Programs
1 Michigan Center for Truck Safety Mobile Classroom Tried Moderate Medium (1-2 years) Effective, well received program. Dedicated funding source.
2. California Highway Patrol “Be Aware & Share” Tried Moderate Short (< 1 year) Public Information campaign designed for high truck traffic corridors. No data on effectiveness.
3. Commercial Vehicle Safety Alliance (CVSA) Distance Learning Program Tried Moderate Medium (1-2 years)
Program just begun. Initial results promising.
4. Iowa Department of Transportation Ride A Long Tried Moderate Short (1-2 years) Well received program by motor carrier industry.
State Enforcement Programs
1. Minnesota Relevant Evidence Law Tried Moderate Long (> 2 years) Effective program, not well received by industry. Need political buy-in.
2. Oregon Department of Transportation Green Light Tried High Long (> 2 years)
Effective pre-clearance program. ODOT estimates that it saved industry $31 million in fuel, time, operating costs.
3. Kentucky Division of Motor Carriers, Infrared Brake Screening Tried High Long (> 2years)
Expensive but effective method to screen brake performance, exhaust leaks, tire pressure.
4. Iowa DOT, Traffic and Criminal Software (TraCs) Tried Moderate Medium (1-2 years)
Effective streamlined method of entering traffic and accident data. 25 states and 2 Canadian provinces use TRaCs.
23 June 30, 2005
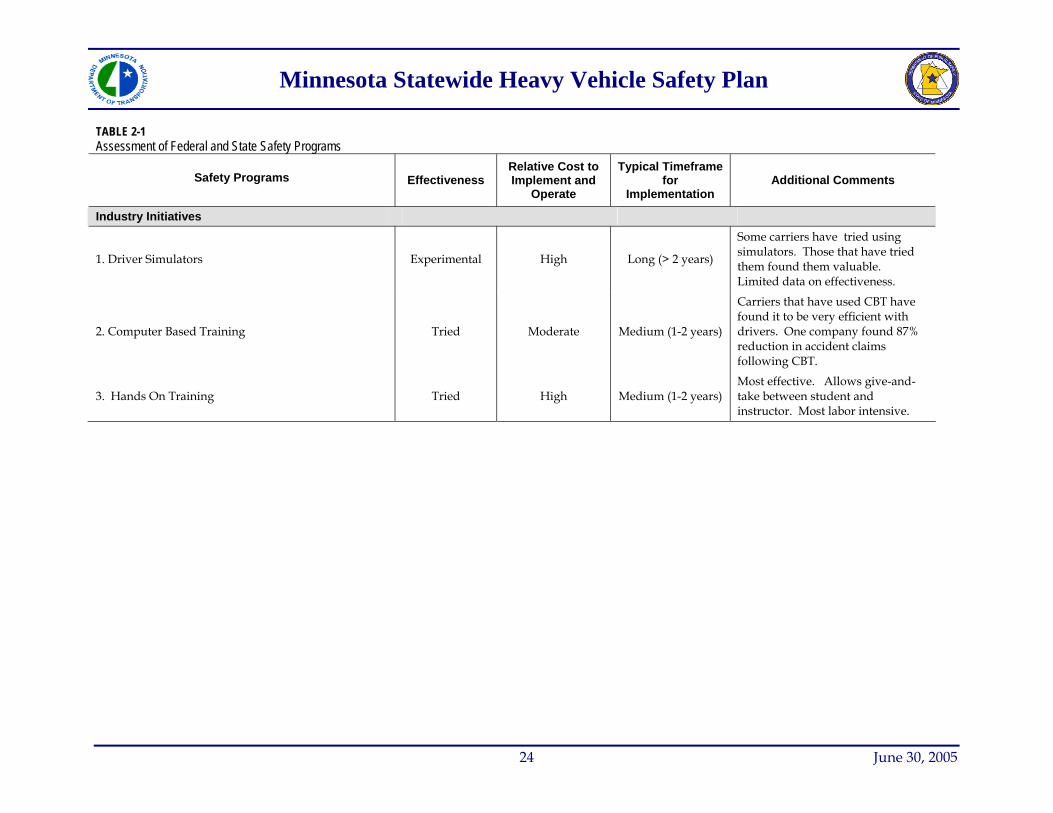
005
Minnesota Statewide Heavy Vehicle Safety Plan
TABLE 2-1 Assessment of Federal and State Safety Programs
24 June 30, 2
Safety Programs Effectiveness Relative Cost to Implement and
Operate
Typical Timeframe for
Implementation Additional Comments
Industry Initiatives
1. Driver Simulators Experimental High Long (> 2 years)
Some carriers have tried using simulators. Those that have tried them found them valuable. Limited data on effectiveness.
2. Computer Based Training Tried Moderate Medium (1-2 years)
Carriers that have used CBT have found it to be very efficient with drivers. One company found 87% reduction in accident claims following CBT.
3. Hands On Training Tried High Medium (1-2 years) Most effective. Allows give-and-take between student and instructor. Most labor intensive.
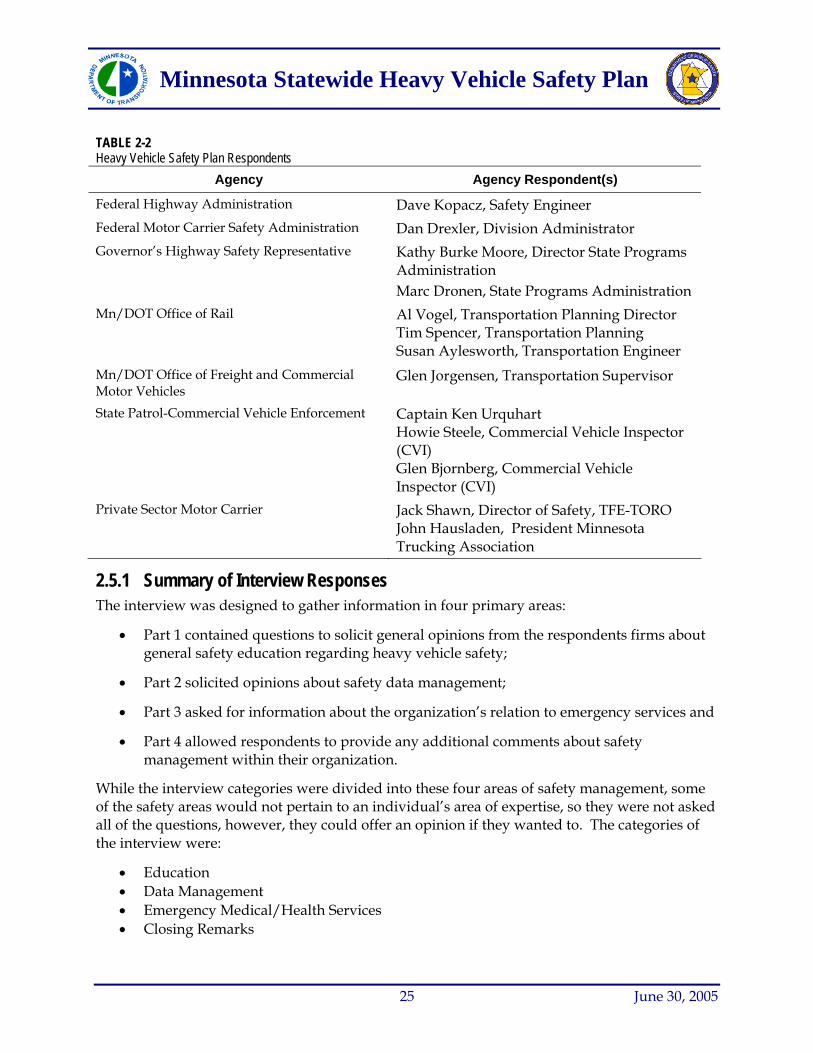
Minnesota Statewide Heavy Vehicle Safety Plan
TABLE 2-2 Heavy Vehicle Safety Plan Respondents
Agency Agency Respondent(s)
Federal Highway Administration Dave Kopacz, Safety Engineer Federal Motor Carrier Safety Administration Dan Drexler, Division Administrator Governor’s Highway Safety Representative Kathy Burke Moore, Director State Programs
Administration Marc Dronen, State Programs Administration
Mn/DOT Office of Rail Al Vogel, Transportation Planning Director Tim Spencer, Transportation Planning Susan Aylesworth, Transportation Engineer
Mn/DOT Office of Freight and Commercial Motor Vehicles
Glen Jorgensen, Transportation Supervisor
State Patrol-Commercial Vehicle Enforcement Captain Ken Urquhart Howie Steele, Commercial Vehicle Inspector (CVI) Glen Bjornberg, Commercial Vehicle Inspector (CVI)
Private Sector Motor Carrier Jack Shawn, Director of Safety, TFE-TORO John Hausladen, President Minnesota Trucking Association
2.5.1 Summary of Interview Responses The interview was designed to gather information in four primary areas:
• Part 1 contained questions to solicit general opinions from the respondents firms about general safety education regarding heavy vehicle safety;
• Part 2 solicited opinions about safety data management;
• Part 3 asked for information about the organization’s relation to emergency services and
• Part 4 allowed respondents to provide any additional comments about safety management within their organization.
While the interview categories were divided into these four areas of safety management, some of the safety areas would not pertain to an individual’s area of expertise, so they were not asked all of the questions, however, they could offer an opinion if they wanted to. The categories of the interview were:
• Education • Data Management • Emergency Medical/Health Services • Closing Remarks
25 June 30, 2005
Minnesota Statewide Heavy Vehicle Safety Plan
The last category, “Closing Remarks,” was given to the respondents as a “what if?” question. The respondents were given the opportunity to use their imaginations to develop ideas to improve heavy vehicle safety without the constraints of budgets, personnel, etc.
There were wide-ranging responses to the interview questions, garnering unique perspectives from the respondents. The respondents offered many suggestions to improve their respective safety programs. Some suggestions are already realized (such as), some are not. A summary of their responses is provided in Appendix I.
In summary, the recurring themes throughout the interview process were the need for increased education, improved communication, training, and the need to focus on fatigue management. All of those interviewed stressed the need for continued education and training in commercial vehicle safety. Many also stressed the need for recurrent training for commercial drivers as well as increased education for passenger car drivers.
Almost all of those that were interviewed stated that operator fatigue, for both truck and car drivers, is a real problem. Whether it is the result of a 24/7 society, there is the perception that many vehicle operators are driving while tired and causing crashes. There is a tremendous need to understand the effects of fatigue and develop programs for companies to manage it.
One suggestion was to create a demonstration project for a corridor with a high number of heavy vehicle crashes. In such a project, the goal would be to implement a comprehensive set of strategies addressing enforcement, engineering, and possibly driver education and emergency response. In other states, similar projects were found to be eligible for Federal safety funding.
Finally, the interviews indicated the willingness by those involved to work together to improve the data sharing capabilities that all parties can use in their safety programs. While all the mechanisms are not presently in place to do so, the participants stated that the data that are being collected, (crashes, traffic violations, equipment violations, etc.) should be readily available and shared with all the parties involved.
26 June 30, 2005
Minnesota Statewide Heavy Vehicle Safety Plan
3. Heavy Vehicle Crash Review
3.1 Definition of a Heavy Vehicle and Crash Data Source For the SHVSP, a heavy vehicle was defined as any vehicle with a gross weight over 10,000 pounds. However, the crash record database provided by Mn/DOT’s Office of Traffic, Security and Operations does not include the weight of the vehicles involved in a crash. Instead of the vehicle’s weight, the vehicle type was used to determine if the crash involved a heavy vehicle. The vehicle types identified as a heavy vehicle included:
• Bus with 16 or more seats • Single unit truck with 2 axles – 6 tires • Single unit truck with 3 axles • Single unit truck with trailer • Truck tractor with no trailer • Truck tractor with semitrailer • Truck tractor with 2 trailers • Truck tractor with 3 trailers • Heavy truck of unknown type
The crash database provided by Mn/DOT included all crashes that occurred between January 1, 2000 and December 31, 2003 and involved at least one heavy vehicle. For Minnesota’s 2003 crash records, it was earlier discovered that many problems exist with the data, especially the coded location and injury data. However, a majority of the analysis did not look at the crash location and was also focused on fatal crashes. Both DPS and Mn/DOT acknowledged that of the 2003 crash records, the fatality information is the only reliable data. For these reasons, fatality information was kept in much of the analysis.
3.2 Crash Frequency and Rate Since 2000, the statewide number of heavy vehicle crashes has shown a steady downward trend (see Table 3-1). However, the number of fatal and serious injury heavy vehicle crashes has not experienced a similar trend, instead the crash totals have fluctuated around 75 fatal crashes per year and 140 serious injury crashes per year. During this same period, the miles of heavy vehicle travel on the State’s trunk highway system has seen a steady increase, this combined with the decreasing number of heavy vehicle crashes has resulted in a decreasing crash rate (see Table 3-2). While the overall crash rate experienced a decrease, the fatal crash rate fluctuated around the four-year average and was not found to follow a similar pattern.
3.3 Crash Severity Because of the data quality issues regarding non-fatal crashes in Minnesota, the number of crashes by crash severity was not known for Minnesota. Therefore, the crash severity comparisons were limited to the years 2000 – 2002.
The percentage of Minnesota’s heavy vehicle crashes that resulted in a fatality (1.2%) was slightly higher than the national percentage (1.0%) (see Figure 3-1) (7). Similarly, the State’s
27 June 30, 2005
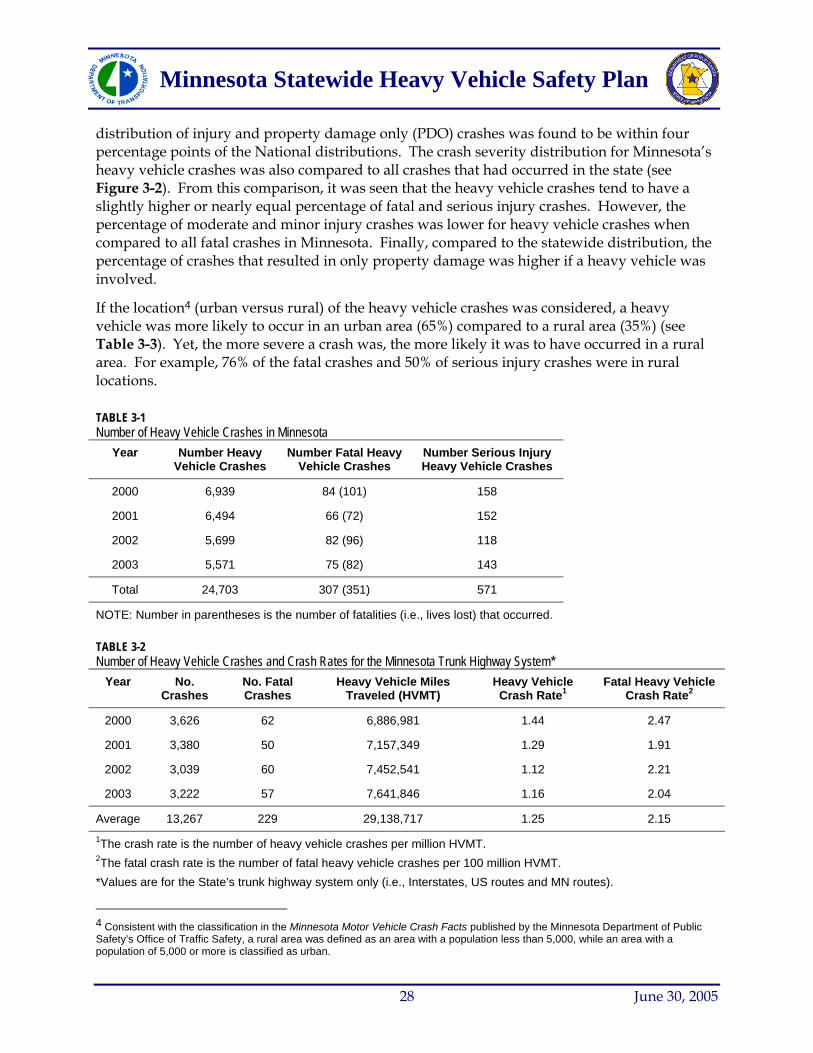
Minnesota Statewide Heavy Vehicle Safety Plan
distribution of injury and property damage only (PDO) crashes was found to be within four percentage points of the National distributions. The crash severity distribution for Minnesota’s heavy vehicle crashes was also compared to all crashes that had occurred in the state (see Figure 3-2). From this comparison, it was seen that the heavy vehicle crashes tend to have a slightly higher or nearly equal percentage of fatal and serious injury crashes. However, the percentage of moderate and minor injury crashes was lower for heavy vehicle crashes when compared to all fatal crashes in Minnesota. Finally, compared to the statewide distribution, the percentage of crashes that resulted in only property damage was higher if a heavy vehicle was involved.
If the location4 (urban versus rural) of the heavy vehicle crashes was considered, a heavy vehicle was more likely to occur in an urban area (65%) compared to a rural area (35%) (see Table 3-3). Yet, the more severe a crash was, the more likely it was to have occurred in a rural area. For example, 76% of the fatal crashes and 50% of serious injury crashes were in rural locations.
TABLE 3-1 Number of Heavy Vehicle Crashes in Minnesota
Year Number Heavy Vehicle Crashes
Number Fatal Heavy Vehicle Crashes
Number Serious Injury Heavy Vehicle Crashes
2000 6,939 84 (101) 158
2001 6,494 66 (72) 152
2002 5,699 82 (96) 118
2003 5,571 75 (82) 143
Total 24,703 307 (351) 571
NOTE: Number in parentheses is the number of fatalities (i.e., lives lost) that occurred. TABLE 3-2 Number of Heavy Vehicle Crashes and Crash Rates for the Minnesota Trunk Highway System*
Year No. Crashes
No. Fatal Crashes
Heavy Vehicle Miles Traveled (HVMT)
Heavy Vehicle Crash Rate1
Fatal Heavy Vehicle Crash Rate2
2000 3,626 62 6,886,981 1.44 2.47
2001 3,380 50 7,157,349 1.29 1.91
2002 3,039 60 7,452,541 1.12 2.21
2003 3,222 57 7,641,846 1.16 2.04
Average 13,267 229 29,138,717 1.25 2.15 1The crash rate is the number of heavy vehicle crashes per million HVMT. 2The fatal crash rate is the number of fatal heavy vehicle crashes per 100 million HVMT. *Values are for the State’s trunk highway system only (i.e., Interstates, US routes and MN routes).
4 Consistent with the classification in the Minnesota Motor Vehicle Crash Facts published by the Minnesota Department of Public Safety’s Office of Traffic Safety, a rural area was defined as an area with a population less than 5,000, while an area with a population of 5,000 or more is classified as urban.
28 June 30, 2005
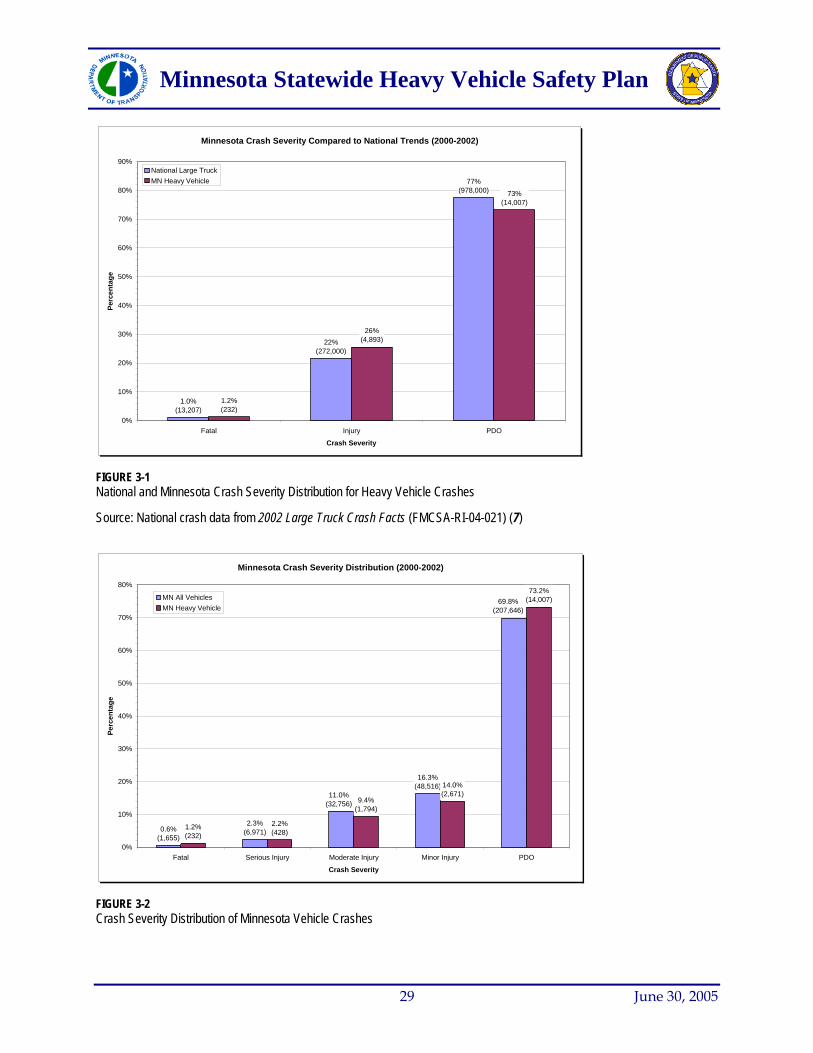
Minnesota Statewide Heavy Vehicle Safety Plan
Minnesota Crash Severity Compared to National Trends (2000-2002)
77%(978,000)
22%(272,000)
1.0%(13,207)
73%(14,007)
26%(4,893)
1.2%(232)
0%
10%
20%
30%
40%
50%
60%
70%
80%
90%
Fatal Injury PDO
Crash Severity
Perc
enta
ge
National Large TruckMN Heavy Vehicle
FIGURE 3-1 National and Minnesota Crash Severity Distribution for Heavy Vehicle Crashes
Source: National crash data from 2002 Large Truck Crash Facts (FMCSA-RI-04-021) (7)
Minnesota Crash Severity Distribution (2000-2002)
69.8%(207,646)
16.3%(48,51
80%
6)11.0%
,756)(32
2.3%(6,971)0.6%
)(1,655
73.2%(14,007)MN All Vehicles
MN Heavy Vehicle
50%
60%
70%
14.0%(2,671)
9.4%(1,794)
2.(42
2%8)
1.2%(232)
0%
10%
20%
30%
Fatal Serious Injury Moderate Injury Minor Injury PDO
Crash Severity
age
40%
rcen
tPe
FIGURE 3-2 Crash Severity Distribution of Minnesota Vehicle Crashes
29 June 30, 2005
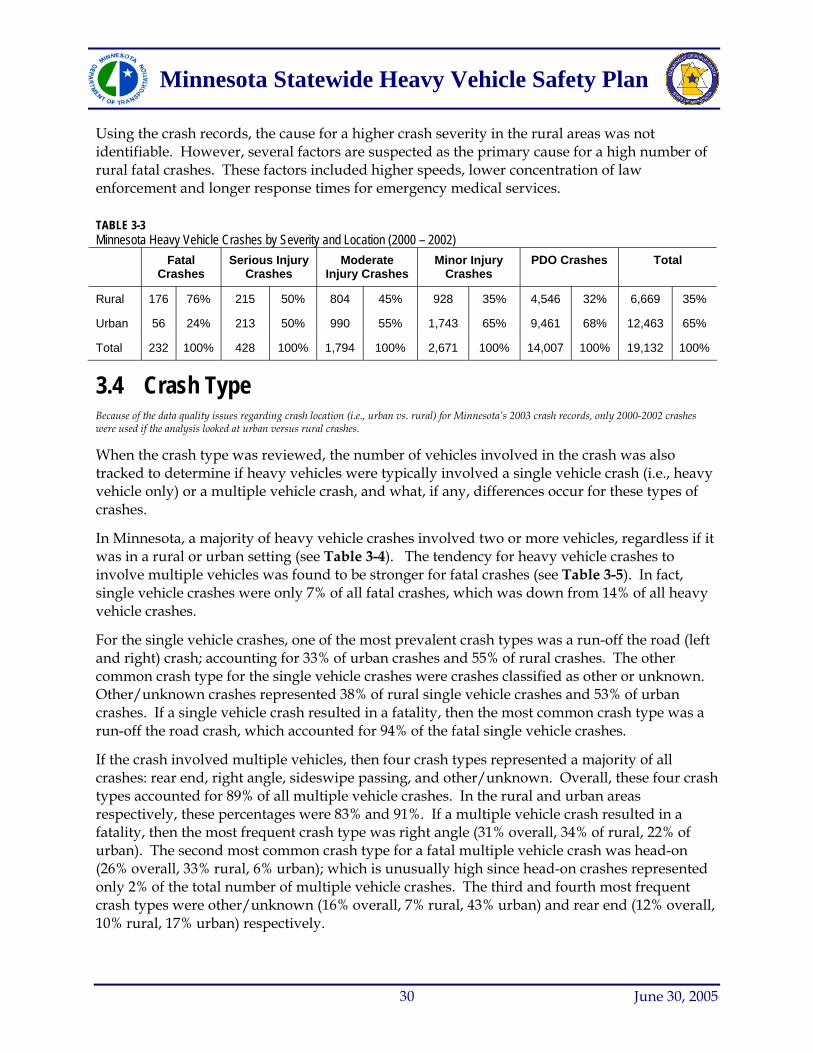
Minnesota Statewide Heavy Vehicle Safety Plan
30 June 30, 2005
Using the crash records, the cause for a higher crash severity in the rural areas was not identifiable. However, several factors are suspected as the primary cause for a high number of rural fatal crashes. These factors included higher speeds, lower concentration of law enforcement and longer response times for emergency medical services.
TABLE 3-3 Minnesota Heavy Vehicle Crashes by Severity and Location (2000 – 2002) Fatal
Crashes Serious Injury
Crashes Moderate
Injury Crashes Minor Injury
Crashes PDO Crashes Total
Rural 176 76% 215 50% 804 45% 928 35% 4,546 32% 6,669 35%
Urban 56 24% 213 50% 990 55% 1,743 65% 9,461 68% 12,463 65%
Total 232 100% 428 100% 1,794 100% 2,671 100% 14,007 100% 19,132 100%
3.4 Crash Type Because of the data quality issues regarding crash location (i.e., urban vs. rural) for Minnesota’s 2003 crash records, only 2000-2002 crashes
For the single vehicle crashes, one of the most prevalent crash types was a run-off the road (left and right) crash; accounting for 33% of urban crashes and 55% of rural crashes. The other common crash type for the single vehicle crashes were crashes classified as other or unknown. Other/unknown crashes represented 38% of rural single vehicle crashes and 53% of urban crashes. If a single vehicle crash resulted in a fatality, then the most common crash type was a run-off the road crash, which accounted for 94% of the fatal single vehicle crashes.
If the crash involved multiple vehicles, then four crash types represented a majority of all crashes: rear end, right angle, sideswipe passing, and other/unknown. Overall, these four crash types accounted for 89% of all multiple vehicle crashes. In the rural and urban areas respectively, these percentages were 83% and 91%. If a multiple vehicle crash resulted in a fatality, then the most frequent crash type was right angle (31% overall, 34% of rural, 22% of urban). The second most common crash type for a fatal multiple vehicle crash was head-on (26% overall, 33% rural, 6% urban); which is unusually high since head-on crashes represented only 2% of the total number of multiple vehicle crashes. The third and fourth most frequent crash types were other/unknown (16% overall, 7% rural, 43% urban) and rear end (12% overall, 10% rural, 17% urban) respectively.
were used if the analysis looked at urban versus rural crashes.
When the crash type was reviewed, the number of vehicles involved in the crash was also tracked to determine if heavy vehicles were typically involved a single vehicle crash (i.e., heavy vehicle only) or a multiple vehicle crash, and what, if any, differences occur for these types of crashes.
In Minnesota, a majority of heavy vehicle crashes involved two or more vehicles, regardless if it was in a rural or urban setting (see Table 3-4). The tendency for heavy vehicle crashes to involve multiple vehicles was found to be stronger for fatal crashes (see Table 3-5). In fact, single vehicle crashes were only 7% of all fatal crashes, which was down from 14% of all heavy vehicle crashes.
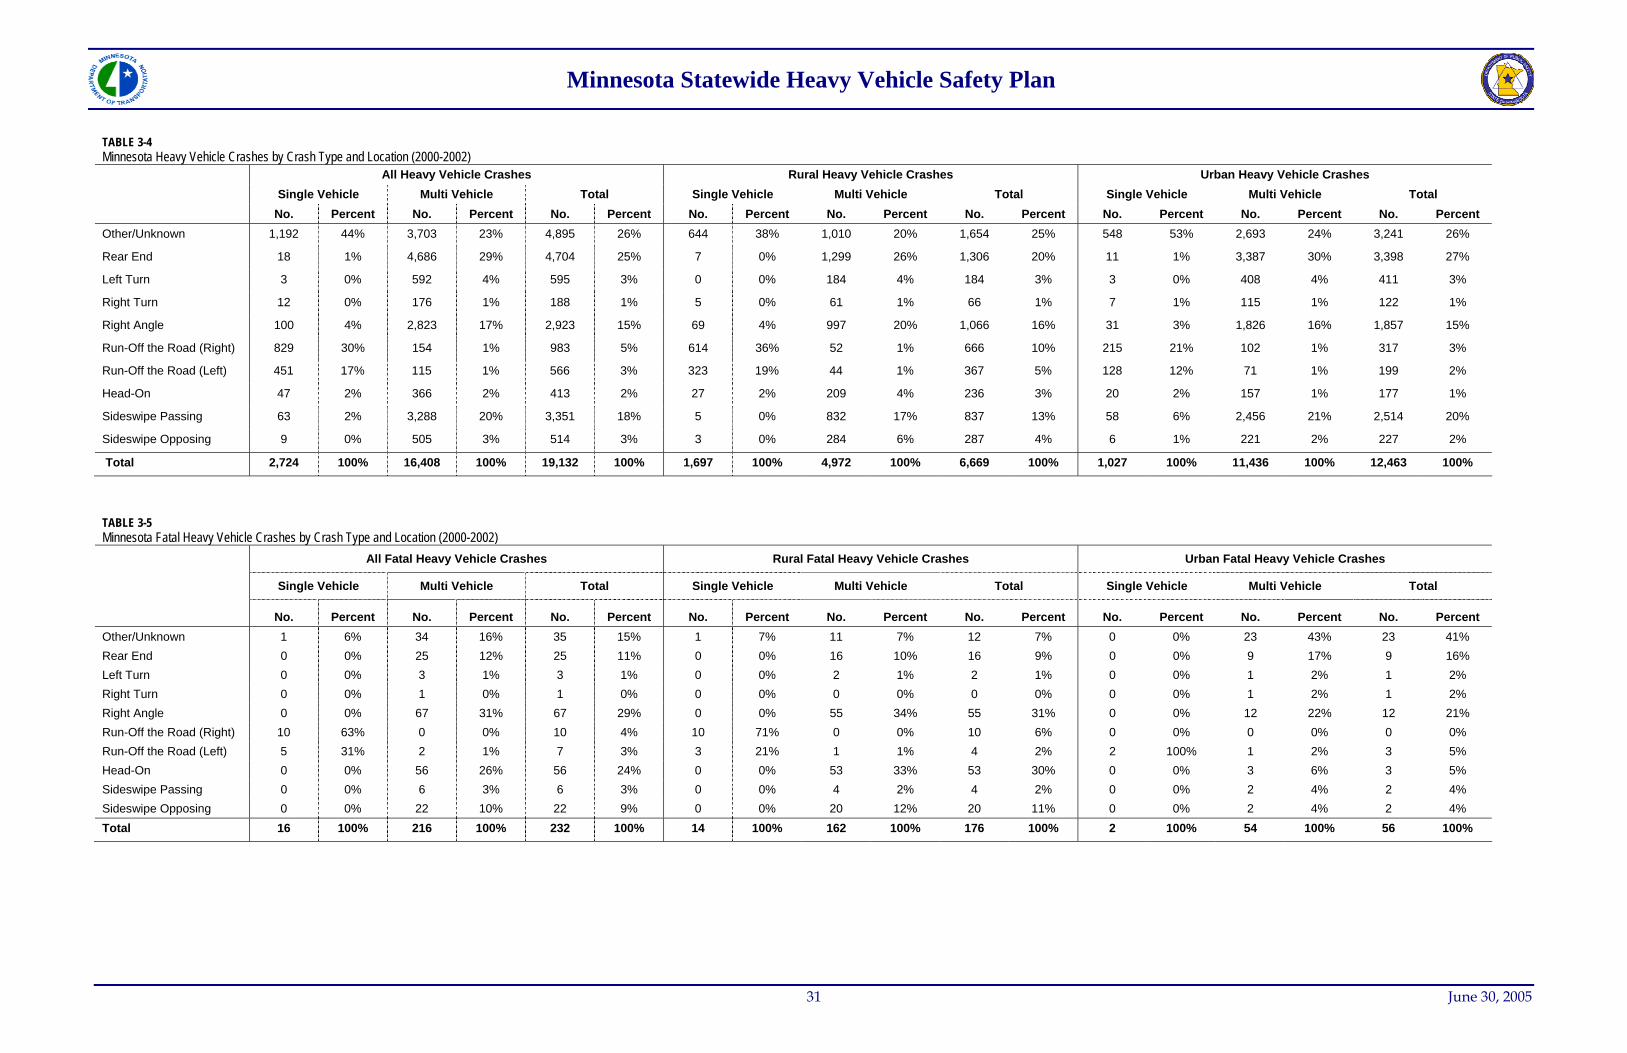
005
Minnesota Statewide Heavy Vehicle Safety Plan
31 June 30, 2
TABLE 3-5 Minnesota Fatal Heavy Vehicle Crashes by Crash Type and Location (2000-2002)
All Fatal Heavy Vehicle Crashes Rural Fatal Heavy Vehicle Crashes Urban Fatal Heavy Vehicle Crashes
Single Vehicle Multi Vehicle Total Single Vehicle Multi Vehicle Total Single Vehicle Multi Vehicle Total
No. Percent No. Percent No. Percent No. Percent No. Percent No. Percent No. Percent No. Percent No. PercentOther/Unknown 1 6% 34 16% 35 15% 1 7% 11 7% 12 7% 0 0% 23 43% 23 41%Rear End 0 0% 25 12% 25 11% 0 0% 16 10% 16 9% 0 0% 9 17% 9 16%Left Turn 0 0% 3 1% 3 1% 0 0% 2 1% 2 1% 0 0% 1 2% 1 2%Right Turn 0 0% 1 0% 1 0% 0 0% 0 0% 0 0% 0 0% 1 2% 1 2%Right Angle 0 0% 67 31% 67 29% 0 0% 55 34% 55 31% 0 0% 12 22% 12 21%Run-Off the Road (Right) 10 63% 0 0% 10 4% 10 71% 0 0% 10 6% 0 0% 0 0% 0 0%Run-Off the Road (Left) 5 31% 2 1% 7 3% 3 21% 1 1% 4 2% 2 100% 1 2% 3 5%Head-On 0 0% 56 26% 56 24% 0 0% 53 33% 53 30% 0 0% 3 6% 3 5%Sideswipe Passing 0 0% 6 3% 6 3% 0 0% 4 2% 4 2% 0 0% 2 4% 2 4%Sideswipe Opposing 0 0% 22 10% 22 9% 0 0% 20 12% 20 11% 0 0% 2 4% 2 4%Total 16 100% 216 100% 232 100% 14 100% 162 100% 176 100% 2 100% 54 100% 56 100%
TABLE 3-4 Minnesota Heavy Vehicle Crashes by Crash Type and Location (2000-2002)
All Heavy Vehicle Crashes Rural Heavy Vehicle Crashes Urban Heavy Vehicle Crashes Single Vehicle Multi Vehicle Total Single Vehicle Multi Vehicle Total Single Vehicle Multi Vehicle Total No. Percent No. Percent No. Percent No. Percent No. Percent No. Percent No. Percent No. Percent No. Percent
Other/Unknown 1,192 44% 3,703 23% 4,895 26% 644 38% 1,010 20% 1,654 25% 548 53% 2,693 24% 3,241 26%
Rear End 18 1% 4,686 29% 4,704 25% 7 0% 1,299 26% 1,306 20% 11 1% 3,387 30% 3,398 27%
Left Turn 3 0% 592 4% 595 3% 0 0% 184 4% 184 3% 3 0% 408 4% 411 3%
Right Turn 12 0% 176 1% 188 1% 5 0% 61 1% 66 1% 7 1% 115 1% 122 1%
Right Angle 100 4% 2,823 17% 2,923 15% 69 4% 997 20% 1,066 16% 31 3% 1,826 16% 1,857 15%
Run-Off the Road (Right) 829 30% 154 1% 983 5% 614 36% 52 1% 666 10% 215 21% 102 1% 317 3%
Run-Off the Road (Left) 451 17% 115 1% 566 3% 323 19% 44 1% 367 5% 128 12% 71 1% 199 2%
Head-On 47 2% 366 2% 413 2% 27 2% 209 4% 236 3% 20 2% 157 1% 177 1%
Sideswipe Passing 63 2% 3,288 20% 3,351 18% 5 0% 832 17% 837 13% 58 6% 2,456 21% 2,514 20%
Sideswipe Opposing 9 0% 505 3% 514 3% 3 0% 284 6% 287 4% 6 1% 221 2% 227 2%
Total 2,724 100% 16,408 100% 19,132 100% 1,697 100% 4,972 100% 6,669 100% 1,027 100% 11,436 100% 12,463 100%
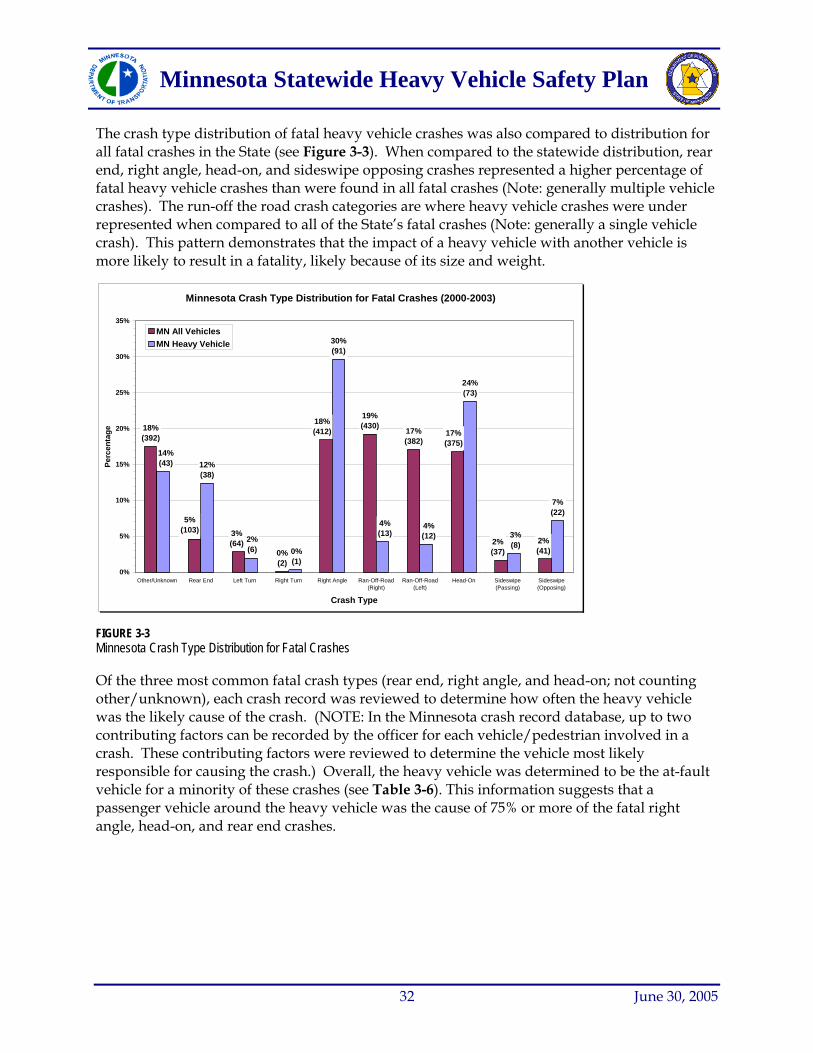
Minnesota Statewide Heavy Vehicle Safety Plan
The crash type distribution of fatal heavy vehicle crashes was also compared to distribution for all fatal crashes in the State (see Figure 3-3). When compared to the statewide distribution, rear end, right angle, head-on, and sideswipe opposing crashes represented a higher percentage of fatal heavy vehicle crashes than were found in all fatal crashes (Note: generally multiple vehicle crashes). The run-off the road crash categories are where heavy vehicle crashes were under represented when compared to all of the State’s fatal crashes (Note: generally a single vehicle crash). This pattern demonstrates that the impact of a heavy vehicle with another vehicle is more likely to result in a fatality, likely because of its size and weight.
Minnesota Crash Type Distribution for Fatal Crashes (2000-2003)
2%(41)
2%(37)
17%(375)
17%(382)
19%(430)18%
(412)
0%(2)
3%(64)
5%(103)
18%(392)
7%(22)
3%(8)
24%(73)
4%(12)
4%(13)
30%(91)
0%(1)
2%(6)
12%(38)
14%(43)
0%
5%
10%
15%
20%
25%
30%
35%
Other/Unknown Rear End Left Turn Right Turn Right Angle Ran-Off-Road(Right)
Ran-Off-Road(Left)
Head-On Sideswipe(Passing)
Sideswipe(Opposing)
Crash Type
Perc
enta
ge
MN All VehiclesMN Heavy Vehicle
FIGURE 3-3 Minnesota Crash Type Distribution for Fatal Crashes
Of the three most common fatal crash types (rear end, right angle, and head-on; not counting other/unknown), each crash record was reviewed to determine how often the heavy vehicle was the likely cause of the crash. (NOTE: In the Minnesota crash record database, up to two contributing factors can be recorded by the officer for each vehicle/pedestrian involved in a crash. These contributing factors were reviewed to determine the vehicle most likely responsible for causing the crash.) Overall, the heavy vehicle was determined to be the at-fault vehicle for a minority of these crashes (see Table 3-6). This information suggests that a passenger vehicle around the heavy vehicle was the cause of 75% or more of the fatal right angle, head-on, and rear end crashes.
32 June 30, 2005
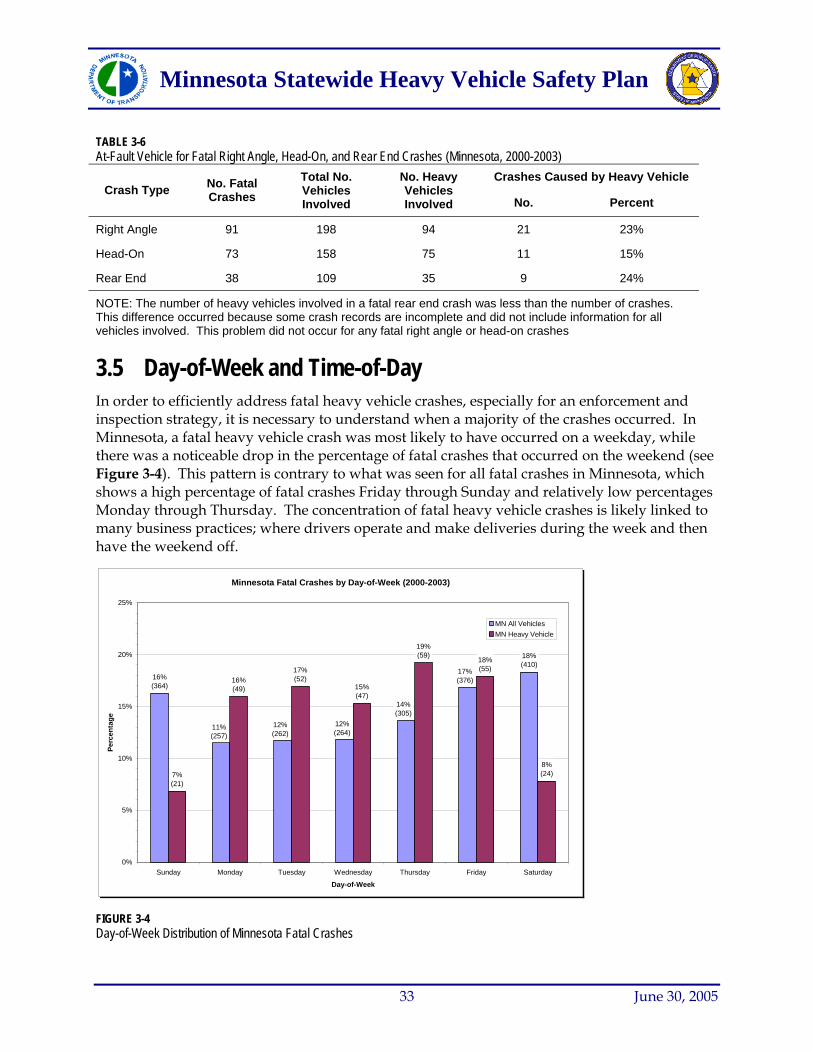
Minnesota Statewide Heavy Vehicle Safety Plan
TABLE 3-6 At-Fault Vehicle for Fatal Right Angle, Head-On, and Rear End Crashes (Minnesota, 2000-2003)
Crashes Caused by Heavy Vehicle Crash Type No. Fatal
Crashes Total No. Vehicles Involved
No. Heavy Vehicles Involved No. Percent
Right Angle 91 198 94 21 23%
Head-On 73 158 75 11 15%
Rear End 38 109 35 9 24%
NOTE: The number of heavy vehicles involved in a fatal rear end crash was less than the number of crashes. This difference occurred because some crash records are incomplete and did not include information for all vehicles involved. This problem did not occur for any fatal right angle or head-on crashes
3.5 Day-of-Week and Time-of-Day In order to efficiently address fatal heavy vehicle crashes, especially for an enforcement and inspection strategy, it is necessary to understand when a majority of the crashes occurred. In Minnesota, a fatal heavy vehicle crash was most likely to have occurred on a weekday, while there was a noticeable drop in the percentage of fatal crashes that occurred on the weekend (see Figure 3-4). This pattern is contrary to what was seen for all fatal crashes in Minnesota, which shows a high percentage of fatal crashes Friday through Sunday and relatively low percentages Monday through Thursday. The concentration of fatal heavy vehicle crashes is likely linked to many business practices; where drivers operate and make deliveries during the week and then have the weekend off.
Minnesota Fatal Crashes by Day-of-Week (2000-2003)
16%(364)
11%(257)
12%(262)
12%(264)
14%(305)
17%(376)
18%(410)
7%(21)
16%(49)
17%(52)
15%(47)
19%(59) 18%
(55)
8%(24)
0%
5%
10%
15%
20%
25%
Sunday Monday Tuesday Wednesday Thursday Friday Saturday
Day-of-Week
Perc
enta
ge
MN All VehiclesMN Heavy Vehicle
FIGURE 3-4 Day-of-Week Distribution of Minnesota Fatal Crashes
33 June 30, 2005

Minnesota Statewide Heavy Vehicle Safety Plan
The time distribution of fatal heavy vehicle crashes also differed from all fatal crashes in Minnesota (see Figure 3-5). Specifically, heavy vehicle fatal crashes were over represented during the day (6:00 AM to 3:00 PM) and were noticeably underrepresented during the evening and early morning (6:00 PM to 3:00 AM); when compared to all fatal crashes in Minnesota. Overall, over 70% of fatal heavy vehicle crashes occurred between 6:00 AM and 6:00 PM. This data suggests that the need for heavy vehicles to travel during business hours has an influence on when the fatal crashes occurred.
Minnesota Fatal Crashes by Time-of-Day (2000-2003)
13%(282)
15%(342)
18%(403)
13%(277)
10%(232)
11%(244)
7%(148)
13%(286)
7%(23)
10%(32)
17%(51)
18%(54)
21%(64)
16%(48)
5%(16)
6%(19)
0%
5%
10%
15%
20%
25%
12:00 AM-3:00 AM 3:00 AM-6:00 AM 6:00 AM-9:00 AM 9:00 AM-12:00 PM 12:00 PM-3:00 PM 3:00 PM-6:00 PM 6:00 PM-9:00 PM 9:00 PM-12:00 AM
Time-of-Day
Perc
enta
ge
MN All VehiclesMN Heavy Vehicle
FIGURE 3-5 Time-of-Day Distribution of Minnesota Fatal Crashes
3.6 Road and Weather Conditions Heavy vehicle fatal crashes, like all fatal crashes in Minnesota, tended to have occurred on dry pavements (73%), during the daylight (66%), and not during precipitation (82%) (i.e., no rain, snow, sleet, etc.) (see Figures 3-6, 3-7, and 3-8). Even though the percentage of fatal heavy vehicle crashes on snowy pavements (5%) was nearly equal to the percentage for all fatal crashes (4%), it was observed that the number of fatal crashes reported to have occurred while it was snowing was approximately double for heavy vehicle crashes (10% versus 5%). It is not known for sure why there is a higher percentage of heavy vehicle fatal crashes during snow storms, but it may be related to a drivers need to keep driving during a snow storm in order to meet a schedule.
34 June 30, 2005
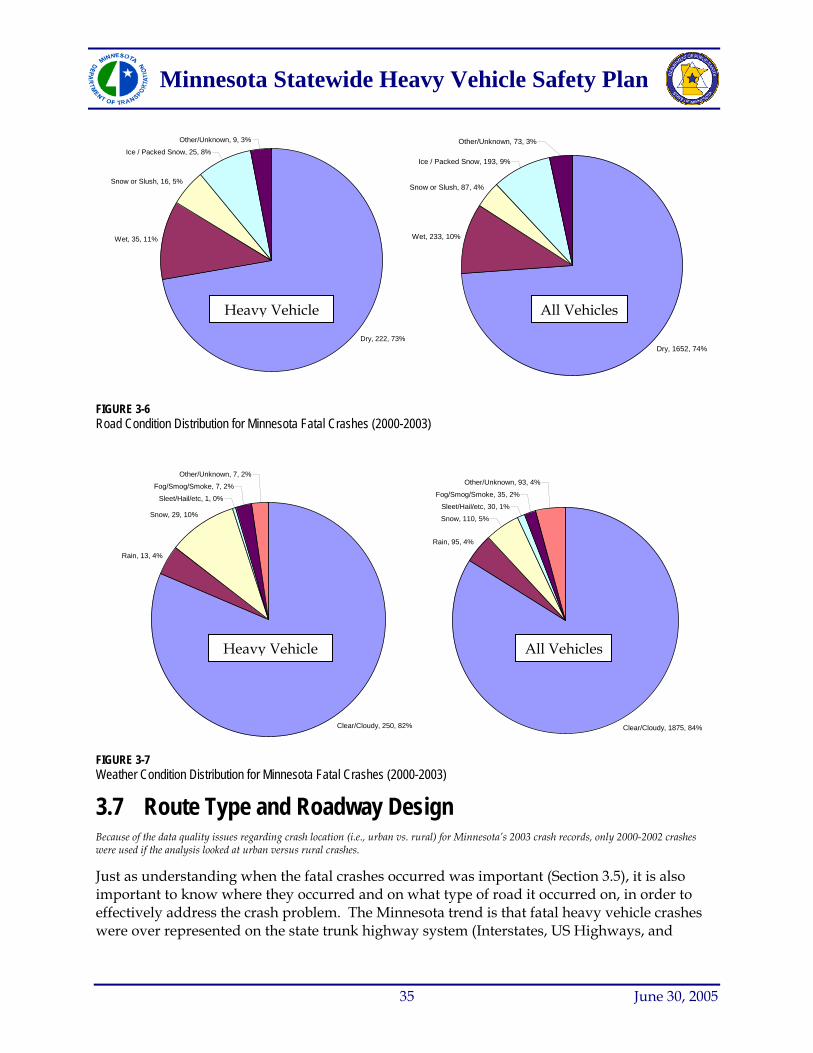
Minnesota Statewide Heavy Vehicle Safety Plan
Dry, 222, 73%
Wet, 35, 11%
Snow or Slush, 16, 5%
Ice / Packed Snow, 25, 8%
Other/Unknown, 9, 3%
Dry, 1652, 74%
Wet, 233, 10%
Snow or Slush, 87, 4%
Ice / Packed Snow, 193, 9%
Other/Unknown, 73, 3%
All Vehicles Heavy Vehicle
FIGURE 3-6 Road Condition Distribution for Minnesota Fatal Crashes (2000-2003)
FIGURE 3-7 Weather Condition Distribution for Minnesota Fatal Crashes (2000-2003)
Clear/Cloudy, 250, 82%
Rain, 13, 4%
Snow, 29, 10%
Sleet/Hail/etc, 1, 0%
Fog/Smog/Smoke, 7, 2%
Other/Unknown, 7, 2%
Rain, 95, 4%
Snow, 110, 5%
Sleet/Hail/etc, 30, 1%
Fog/Smog/Smoke, 35, 2%
Other/Unknown, 93, 4%
All Vehicles Heavy Vehicle
Clear/Cloudy, 1875, 84%
3.7 Route Type and Roadway Design Because of the data quality issues regarding crash location (i.e., urban vs. rural) for Minnesota’s 2003 crash records, only 2000-2002 crashes were used if the analysis looked at urban versus rural crashes.
Just as understanding when the fatal crashes occurred was important (Section 3.5), it is also important to know where they occurred and on what type of road it occurred on, in order to effectively address the crash problem. The Minnesota trend is that fatal heavy vehicle crashes were over represented on the state trunk highway system (Interstates, US Highways, and
35 June 30, 2005

Minnesota Statewide Heavy Vehicle Safety Plan
Minnesota State Highways) (see Figure 3-9), which is consistent with a higher than expected number of fatal crashes on roadways with a freeway or divided design (see Figure 3-10). This is an indication that most of the heavy vehicle travel in Minnesota, and related fatal crashes, are occurring on roads with high daily traffic volumes and high functional classification. Even though freeway and multi-lane divided highways were over represented, the road design with the greatest number of heavy vehicle fatal crashes was still the two-lane road (61%), but was approximately 3 percentage points below the statewide percentage. Also, 21% of the fatal crashes occurred on County State Aid Highways (CSAH) (which accounts for a greater number of fatal crashes than was on the Interstate system), even though this was down from 33% for all fatal crashes in Minnesota.
Dawn, 64, 3%
Dusk, 75, 3%
Dark/Street Lights On, 278, 12%
Dark, 657, 29%
Other/Unknown, 45, 2%
Daylight, 1119, 51%
All Vehicles
Dawn, 14, 5%
Dusk, 6, 2%
Dark/Street Lights On, 25, 8%
Dark, 54, 18%
Daylight, 206, 66%
Other/Unknown, 2, 1%
Heavy Vehicle
FIGURE 3-8 Light Condition Distribution for Minnesota Fatal Crashes (2000-2003)
A majority of the fatal crashes were also segment crashes (64%), but the heavy vehicle percent was slightly below the statewide percentage (74%) for segment fatal crashes (see Figure 3-11). Of the intersection crashes, STOP or YIELD controlled intersections (25%) were the leading intersection type for fatal crashes.
The distribution of fatal heavy vehicle crashes by route type was also compared to the route type distribution for all heavy vehicle crashes (see Tables 3-7 and 3-8). This comparison also made evident the concentration of fatal crashes on the state highway system since 53% of all heavy vehicle crashes occurred on the state highway system, whereas 74% of the fatal crashes were on the state highway system. This general pattern was also found true for crashes when separated by rural (66% of all crashes, 78% of fatal crashes) and urban (46% of all crashes, 60% of fatal crashes).
Looking at specific route types, US Highways and Minnesota State Highways each had an increase in the percentage of crashes when all crashes were compared to fatal crashes (US: 14% of all, 28% of fatal; MN: 18% of all, 32% of fatal). In contrast, the percentage of fatal heavy vehicle crashes for interstates and local roads was much lower than for all crashes (Interstate: 21% of all, 14% of fatal; Local: 24% of all, 3% of fatal).
36 June 30, 2005
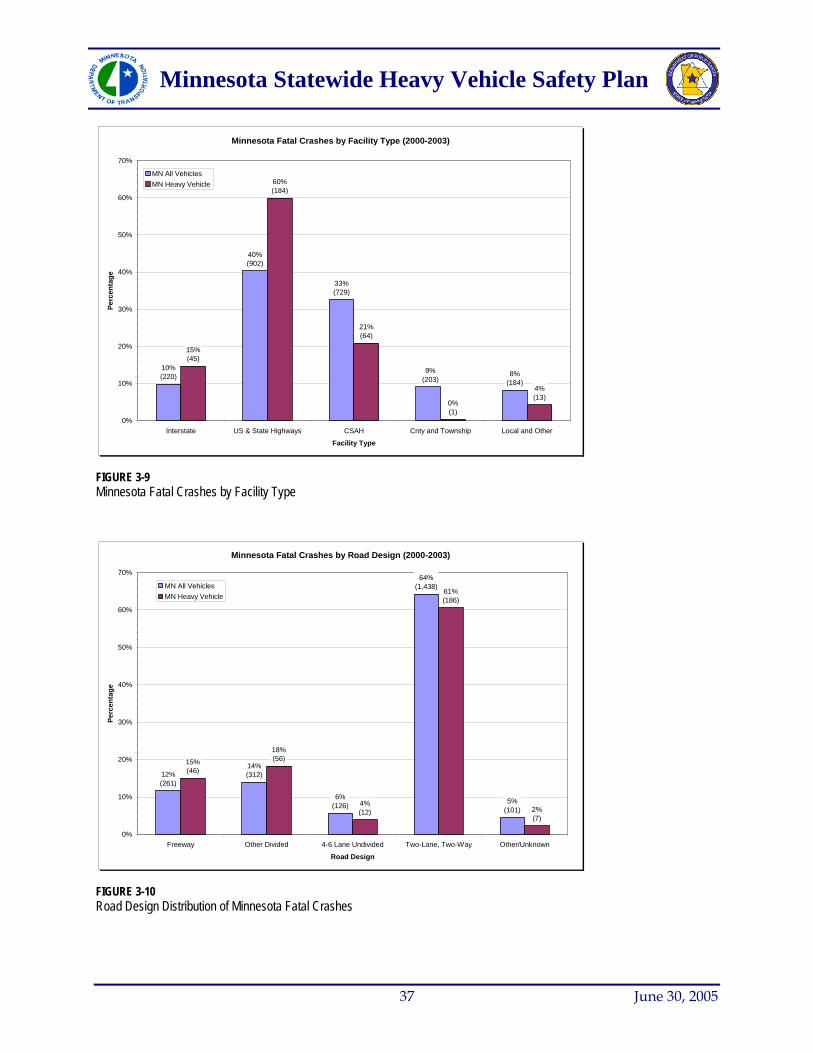
Minnesota Statewide Heavy Vehicle Safety Plan
Minnesota Fatal Crashes by Facility Type (2000-2003)
8%(184)
9%(203)
33%(729)
40%(902)
10%(220)
4%(13)
0%(1)
21%(64)
37 June 30, 2005
60%(184)
15%(45)
0%
10%
20%
30%
40%
50%
60%
Interstate US & State Highways CSAH Cnty and Township Local and Other
Facility Type
Perc
enta
ge
70%
MN All VehiclesMN Heavy Vehicle
FIGURE 3-9 Minnesota Fatal Crashes by Facility Type
Minnesota Fatal Crashes by Road Design (2000-2003)
5%(101)
64%(1,438)
6%(126)
14%(312)12%
(261)
2%(7)
61%(186)
4%(12)
18%(56)15%
(46)
0%
10%
20%
30%
40%
50%
60%
Freeway Other Divided 4-6 Lane Undivided Two-Lane, Two-Way Other/Unknown
Road Design
Perc
enta
ge
70%
MN All VehiclesMN Heavy Vehicle
FIGURE 3-10 Road Design Distribution of Minnesota Fatal Crashes
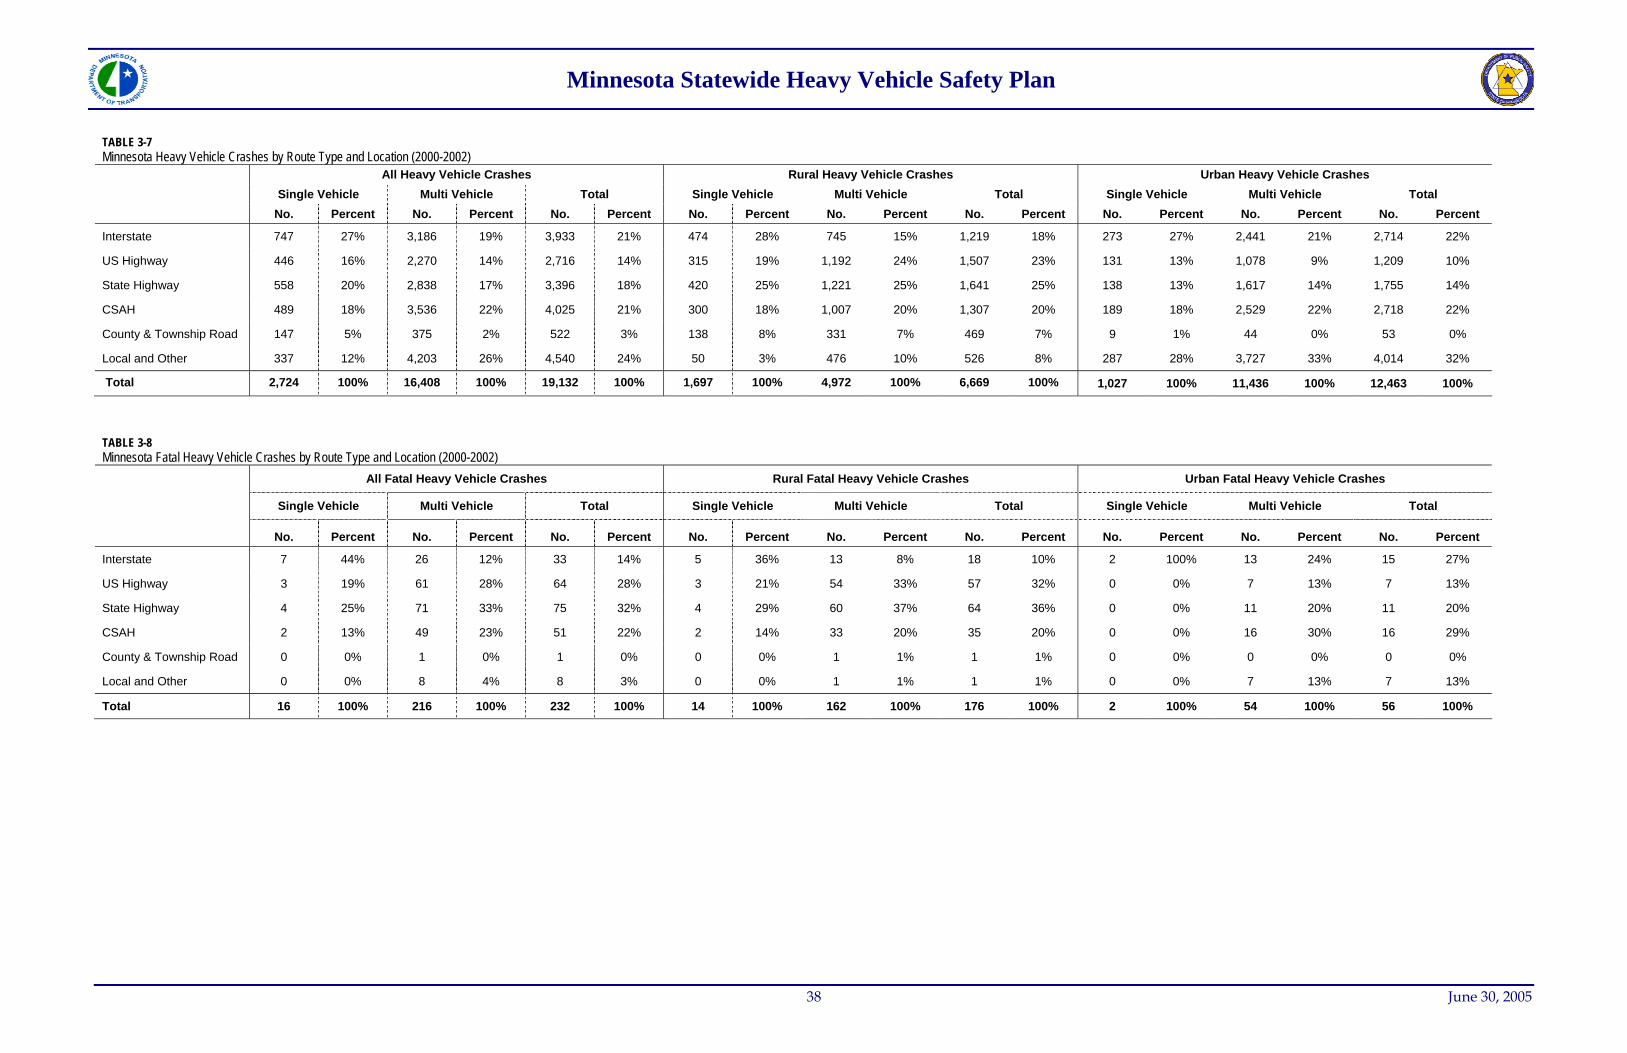
005
Minnesota Statewide Heavy Vehicle Safety Plan
38 June 30, 2
TABLE 3-8 Minnesota Fatal Heavy Vehicle Crashes by Route Type and Location (2000-2002)
All Fatal Heavy Vehicle Crashes Rural Fatal Heavy Vehicle Crashes Urban Fatal Heavy Vehicle Crashes
Single Vehicle Multi Vehicle Total Single Vehicle Multi Vehicle Total Single Vehicle Multi Vehicle Total
No. Percent No. Percent No. Percent No. Percent No. Percent No. Percent No. Percent No. Percent No. Percent
Interstate 7 44% 26 12% 33 14% 5 36% 13 8% 18 10% 2 100% 13 24% 15 27%
US Highway 3 19% 61 28% 64 28% 3 21% 54 33% 57 32% 0 0% 7 13% 7 13%
State Highway 4 25% 71 33% 75 32% 4 29% 60 37% 64 36% 0 0% 11 20% 11 20%
CSAH 2 13% 49 23% 51 22% 2 14% 33 20% 35 20% 0 0% 16 30% 16 29%
County & Township Road 0 0% 1 0% 1 0% 0 0% 1 1% 1 1% 0 0% 0 0% 0 0%
Local and Other 0 0% 8 4% 8 3% 0 0% 1 1% 1 1% 0 0% 7 13% 7 13%
Total 16 100% 216 100% 232 100% 14 100% 162 100% 176 100% 2 100% 54 100% 56 100%
TABLE 3-7 Minnesota Heavy Vehicle Crashes by Route Type and Location (2000-2002)
All Heavy Vehicle Crashes Rural Heavy Vehicle Crashes Urban Heavy Vehicle Crashes Single Vehicle Multi Vehicle Total Single Vehicle Multi Vehicle Total Single Vehicle Multi Vehicle Total No. Percent No. Percent No. Percent No. Percent No. Percent No. Percent No. Percent No. Percent No. Percent
Interstate 747 27% 3,186 19% 3,933 21% 474 28% 745 15% 1,219 18% 273 27% 2,441 21% 2,714 22%
US Highway 446 16% 2,270 14% 2,716 14% 315 19% 1,192 24% 1,507 23% 131 13% 1,078 9% 1,209 10%
State Highway 558 20% 2,838 17% 3,396 18% 420 25% 1,221 25% 1,641 25% 138 13% 1,617 14% 1,755 14%
CSAH 489 18% 3,536 22% 4,025 21% 300 18% 1,007 20% 1,307 20% 189 18% 2,529 22% 2,718 22%
County & Township Road 147 5% 375 2% 522 3% 138 8% 331 7% 469 7% 9 1% 44 0% 53 0%
Local and Other 337 12% 4,203 26% 4,540 24% 50 3% 476 10% 526 8% 287 28% 3,727 33% 4,014 32%
Total 2,724 100% 16,408 100% 19,132 100% 1,697 100% 4,972 100% 6,669 100% 1,027 100% 11,436 100% 12,463 100%
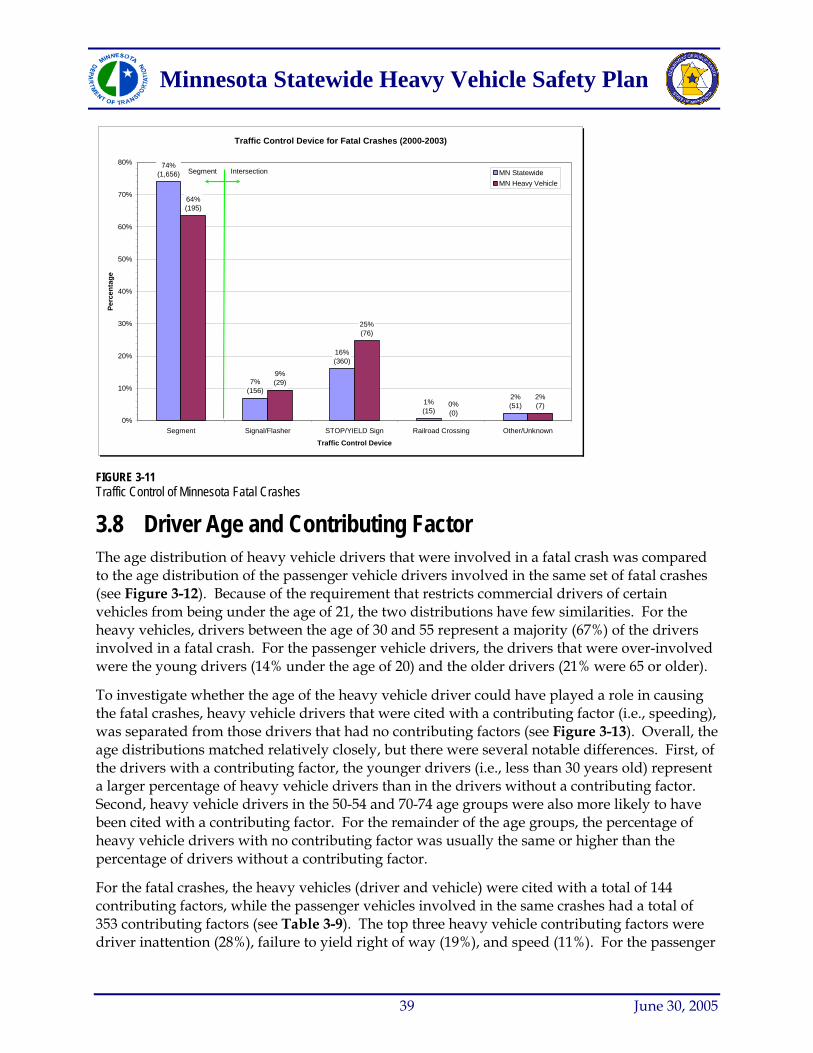
Minnesota Statewide Heavy Vehicle Safety Plan
Traffic Control Device for Fatal Crashes (2000-2003)
80% 74%(1,656)
2%(51)1%
(15)
16%(360)
7%(156)
2%(7)0%
(0)
25%(76)
9%(29)
64%(195)
%
70%
0%
10%
Segment Signal/Flasher STOP/YIELD Sign Railroad Crossing Other/Unknown
Traffic Control Device
20%
30%
40%
50%
Perc
enta
ge
60
MN StatewideMN Heavy Vehicle
Segment Intersection
FIGURE 3-11 Traffic Control of Minnesota Fatal Crashes
3.8 Driver Age and Contributing Factor The age distribution of heavy vehicle drivers that were involved in a fatal crash was compared
shes
involved in a fatal crash. For the passenger vehicle drivers, the drivers that were over-involved were the young drivers (14% under the age of 20) and the older drivers (21% were 65 or older).
To investigate whether the age of the heavy vehicle driver could have played a role in causing the fatal crashes, heavy vehicle drivers that were cited with a contributing factor (i.e., speeding), was separated from those drivers that had no contributing factors (see Figure 3-13). Overall, the age distributions matched relatively closely, but there were several notable differences. First, of the drivers with a contributing factor, the younger drivers (i.e., less than 30 years old) represent a larger percentage of heavy vehicle drivers than in the drivers without a contributing factor. Second, heavy vehicle drivers in the 50-54 and 70-74 age groups were also more likely to have been cited with a contributing factor. For the remainder of the age groups, the percentage of heavy vehicle drivers with no contributing factor was usually the same or higher than the percentage of drivers without a contributing factor.
For the fatal crashes, the heavy vehicles (driver and vehicle) were cited with a total of 144 contributing factors, while the passenger vehicles involved in the same crashes had a total of 353 contributing factors (see Table 3-9). The top three heavy vehicle contributing factors were driver inattention (28%), failure to yield right of way (19%), and speed (11%). For the passenger
to the age distribution of the passenger vehicle drivers involved in the same set of fatal cra(see Figure 3-12). Because of the requirement that restricts commercial drivers of certain vehicles from being under the age of 21, the two distributions have few similarities. For the heavy vehicles, drivers between the age of 30 and 55 represent a majority (67%) of the drivers
39 June 30, 2005
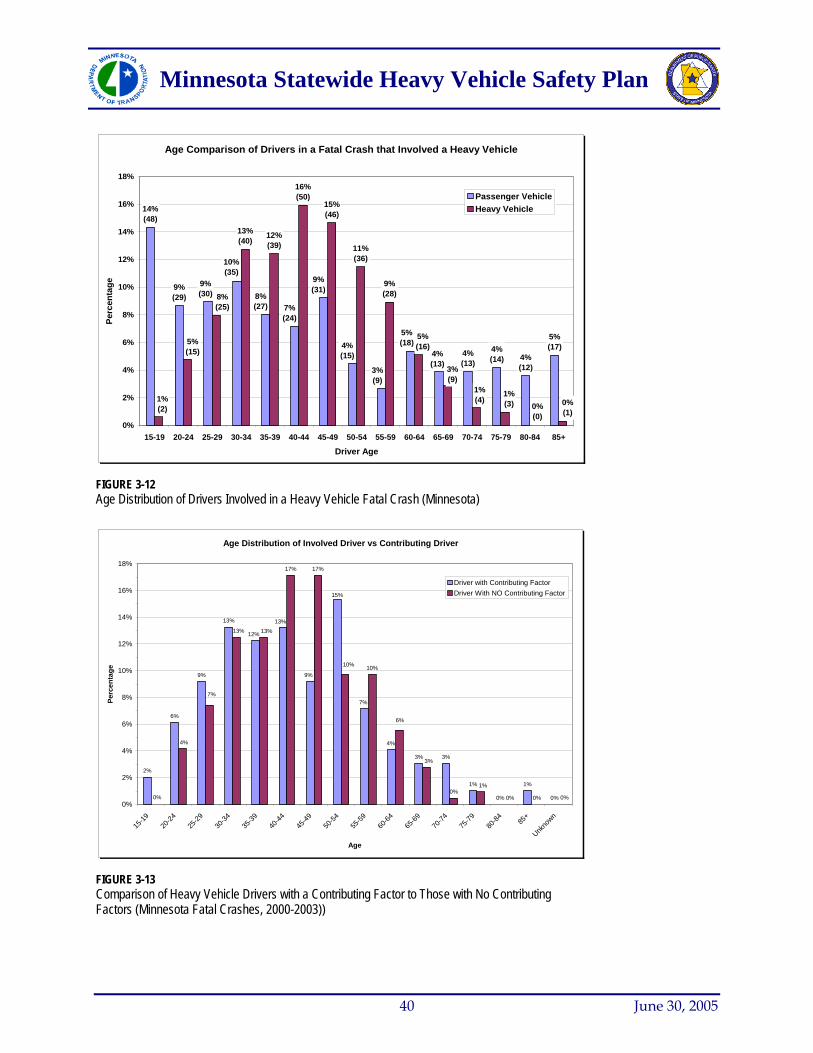
Minnesota Statewide Heavy Vehicle Safety Plan
Age Comparison of Drivers in a Fatal Crash that Involved a Heavy Vehicle
5%(17)
4%(12)
4%(14)
4%(13)
4%(13)
5%(18)
3%(9)
4%(15)
9%(31)
7%(24)
8%(27)
10%(35)
9%(30)
9%(29)
14%(48)
5%(15)
1%(2)
8%(25)
13%(40)
12%(39)
16%(50)
15%(46)
11%(36)
9%(28)
5%(16)
3%(9)
1%(4)
1%(3) 0%
(0)
0%(1)
0%
2%
4%
6%
8%
10%
12%
14%
16%
18%
15-19 20-24 25-29 30-34 35-39 40-44 45-49 50-54 55-59 60-64 65-69 70-74 75-79 80-84 85+
Driver Age
Perc
enta
ge
Passenger VehicleHeavy Vehicle
Age Distribution of Involved Driver vs Contributing Driver
2%
6%
9%
13%
3% 3%
1%
0%
1%
0%
17% 17%
10%
0%
12%
13%
9%
15%
7%
4%
0%
6%
0% 0%0%
1%
3%
10%
13%13%
7%
4%
0%
2%
4%
6%
8%
10%
12%
14%
16%
18%
15-19
20-24
25-29
30-34
35-39
40-44
45-49
50-54
55-59
60-64
65-69
70-74
75-79
80-84 85
+
Unkno
wn
Age
Perc
enta
ge
Driver with Contributing FactorDriver With NO Contributing Factor
FIGURE 3-12 Age Distribution of Drivers Involved in a Heavy Vehicle Fatal Crash (Minnesota)
FIGURE 3-13 Comparison of Heavy Vehicle Drivers with a Contributing Factor to Those with No Contributing Factors (Minnesota Fatal Crashes, 2000-2003))
40 June 30, 2005
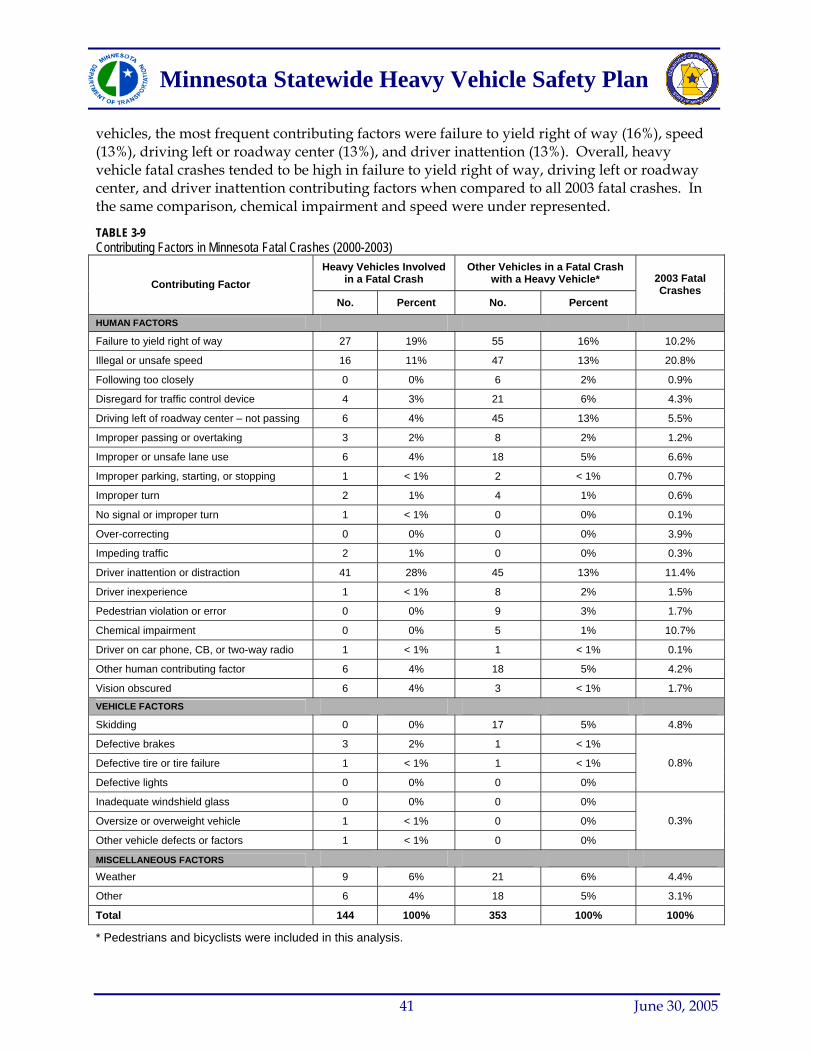
Minnesota Statewide Heavy Vehicle Safety Plan
vehicles, the most frequent contributing factors were failure to yield right of way (16%), speed (13%), driving left or roadway center (13%), and driver inattention (13%). Overall, heavy vehicle fatal crashes tended to be high in failure to yield right of way, driving left or roadway center, and driver inattention contributing factors when compared to all 2003 fatal crashes. In the same comparison, chemical impairment and speed were under represented.
TABLE 3-9 Contributing Factors in Minnesota Fatal Crashes (2000-2003)
Heavy Vehicles Involved in a Fatal Crash
Other Vehicles in a Fatal Crash with a Heavy Vehicle* Contributing Factor
No. Percent No. Percent
2003 Fatal Crashes
HUMAN FACTORS Failure to yield right of way 27 19% 55 16% 10.2%
Illegal or unsafe speed 16 11% 47 13% 20.8%
Following too closely 0 0% 6 2% 0.9%
Disregard for traffic control device 4 3% 21 6% 4.3%
Driving left of roadway center – not passing 6 4% 45 13% 5.5%
Improper passing or overtaking 3 2% 8 2% 1.2%
Improper or unsafe lane use 6 4% 18 5% 6.6%
Improper parking, starting, or stopping 1 < 1% 2 < 1% 0.7%
Improper turn 2 1% 4 1% 0.6%
No signal or improper turn 1 < 1% 0 0% 0.1%
Over-correcting 0 0% 0 0% 3.9%
Impeding traffic 2 1% 0 0% 0.3%
Driver inattention or distraction 41 28% 45 13% 11.4%
Driver inexperience 1 < 1% 8 2% 1.5%
Pedestrian violation or error 0 0% 9 3% 1.7%
Chemical impairment 0 0% 5 1% 10.7%
Driver on car phone, CB, or two-way radio 1 < 1% 1 < 1% 0.1%
Other human contributing factor 6 4% 18 5% 4.2%
Vision obscured 6 4% 3 < 1% 1.7%
VEHICLE FACTORS Skidding 0 0% 17 5% 4.8%
Defective brakes 3 2% 1 < 1%
Defective tire or tire failure 1 < 1% 1 < 1%
Defective lights 0 0% 0 0%
0.8%
Inadequate windshield glass 0 0% 0 0%
Oversize or overweight vehicle 1 < 1% 0 0%
Other vehicle defects or factors 1 < 1% 0 0%
0.3%
MISCELLANEOUS FACTORS Weather 9 6% 21 6% 4.4%
Other 6 4% 18 5% 3.1%
Total 144 100% 353 100% 100%
* Pedestrians and bicyclists were included in this analysis.
41 June 30, 2005
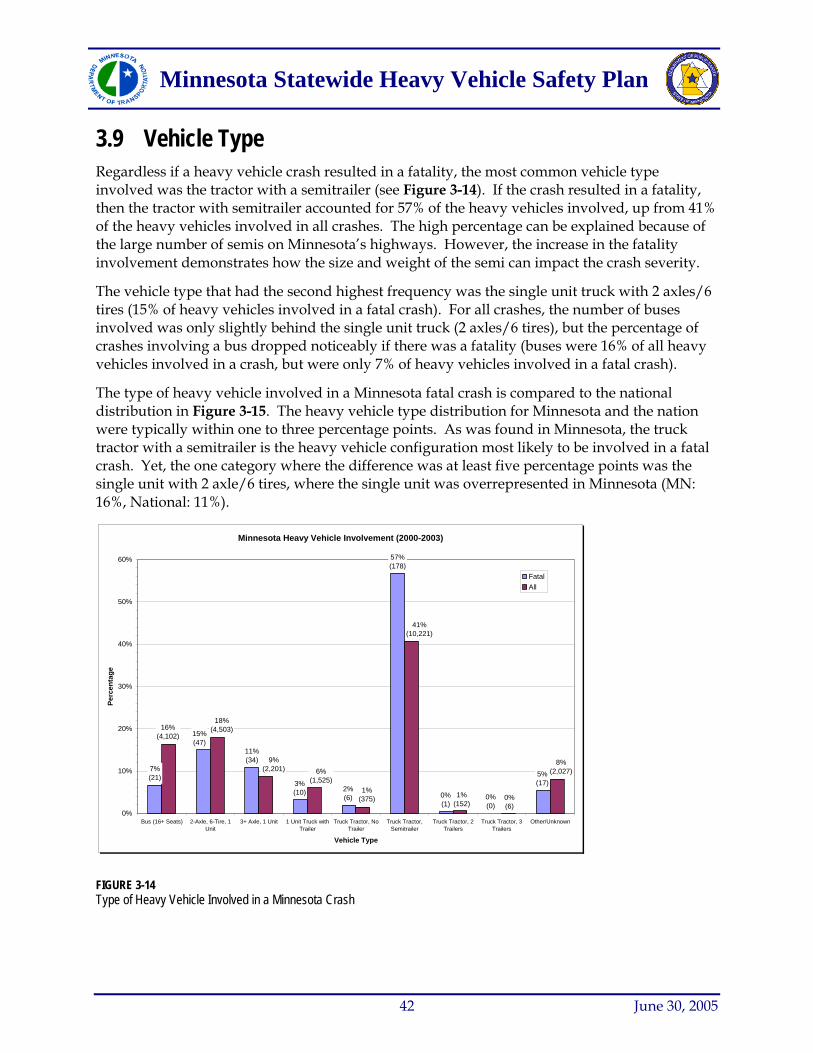
Minnesota Statewide Heavy Vehicle Safety Plan
3.9 Vehicle Type Regardless if a heavy vehicle crash resulted in a fatality, the most common vehicle type involved was the tractor with a semitrailer (see Figure 3-14). If the crash resulted in a fatality, then the tractor with semitrailer accounted for 57% of the heavy vehicles involved, up from 41% of the heavy vehicles involved in all crashes. The high percentage can be explained because of the large number of semis on Minnesota’s highways. However, the increase in the fatality involvement demonstrates how the size and weight of the semi can impact the crash severity.
The vehicle type that had the second highest frequency was the single unit truck with 2 axles/6 tires (15% of heavy vehicles involved in a fatal crash). For all crashes, the number of buses involved was only slightly behind the single unit truck (2 axles/6 tires), but the percentage of crashes involving a bus dropped noticeably if there was a fatality (buses were 16% of all heavy vehicles involved in a crash, but were only 7% of heavy vehicles involved in a fatal crash).
The type of heavy vehicle involved in a Minnesota fatal crash is compared to the national distribution in Figure 3-15. The heavy vehicle type distribution for Minnesota and the nation were typically within one to three percentage points. As was found in Minnesota, the truck tractor with a semitrailer is the heavy vehicle configuration most likely to be involved in a fatal crash. Yet, the one category where the difference was at least five percentage points was the single unit with 2 axle/6 tires, where the single unit was overrepresented in Minnesota (MN: 16%, National: 11%).
Minnesota Heavy Vehicle Involvement (2000-2003)
7%(21)
15%(47)
11%(34)
3%(10) 2%
(6)
57%(178)
0%(1)
0%(0)
5%(17)
0%(6)
16%(4,102)
18%(4,503)
9%(2,201) 6%
(1,525)1%
(375)
41%(10,221)
1%(152)
8%(2,027)
0%
10%
20%
30%
40%
50%
60%
Bus (16+ Seats) 2-Axle, 6-Tire, 1Unit
3+ Axle, 1 Unit 1 Unit Truck withTrailer
Truck Tractor, NoTrailer
Truck Tractor,Semitrailer
Truck Tractor, 2Trailers
Truck Tractor, 3Trailers
Other/Unknown
Vehicle Type
Perc
enta
ge
FatalAll
FIGURE 3-14 Type of Heavy Vehicle Involved in a Minnesota Crash
42 June 30, 2005
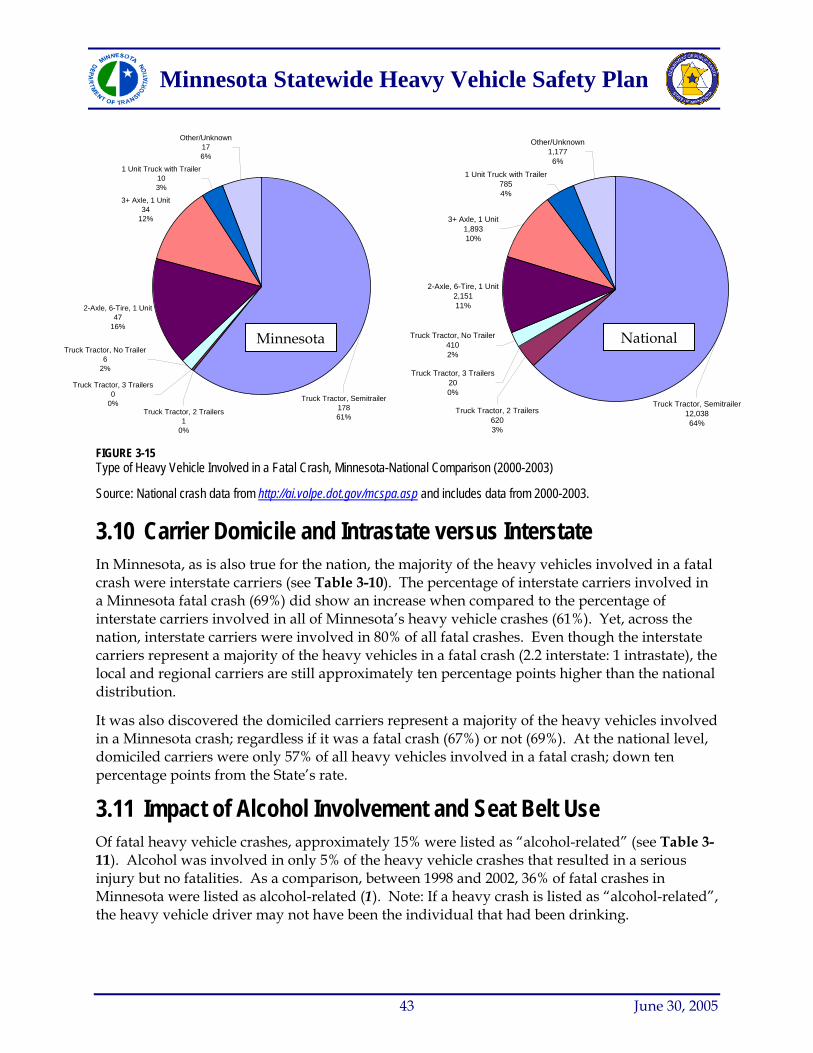
Minnesota Statewide Heavy Vehicle Safety Plan
FIGURE 3-15 Type of Heavy Vehicle Involved in a Fatal Crash, Minnesota-National Comparison (2000-2003)
Source: National crash data from http://ai.volpe.dot.gov/mcspa.asp and includes data from 2000-2003.
2-Axle, 6-Tire, 1 Unit2,15111%
1 Unit Truck with Trailer7854%
Other/Unknown1,1776%
Truck Tractor, No Trailer4102%
Truck Tractor, 3 Trailers200%
Truck Tractor, 2 Trailers6203%
Truck Tractor, Semitrailer12,03864%
3+ Axle, 1 Unit1,89310%
2-Axle, 6-Tire, 1 Unit47
16%
3+ Axle, 1 Unit34
12%
1 Unit Truck with Trailer103%
Other/Unknown176%
Truck Tractor, Semitrailer17861%
Truck Tractor, 3 Trailers0
0%Truck Tractor, 2 Trailers
10%
Truck Tractor, No Trailer6
2%
Minnesota National
3.10 Carrier Domicile and Intrastate versus Interstate In Minnesota, as is also true for the nation, the majority of the heavy vehicles involved in a fatal crash were interstate carriers (see Table 3-10). The percentage of interstate carriers involved in a Minnesota fatal crash (69%) did show an increase when compared to the percentage of interstate carriers involved in all of Minnesota’s heavy vehicle crashes (61%). Yet, across the nation, interstate carriers were involved in 80% of all fatal crashes. Even though the interstate carriers represent a majority of the heavy vehicles in a fatal crash (2.2 interstate: 1 intrastate), the local and regional carriers are still approximately ten percentage points higher than the national distribution.
It was also discovered the domiciled carriers represent a majority of the heavy vehicles involved in a Minnesota crash; regardless if it was a fatal crash (67%) or not (69%). At the national level, domiciled carriers were only 57% of all heavy vehicles involved in a fatal crash; down ten percentage points from the State’s rate.
3.11 Impact of Alcohol Involvement and Seat Belt Use Of fatal heavy vehicle crashes, approximately 15% were listed as “alcohol-related” (see Table 3-11). Alcohol was involved in only 5% of the heavy vehicle crashes that resulted in a serious injury but no fatalities. As a comparison, between 1998 and 2002, 36% of fatal crashes in Minnesota were listed as alcohol-related (1). Note: If a heavy crash is listed as “alcohol-related”, the heavy vehicle driver may not have been the individual that had been drinking.
43 June 30, 2005
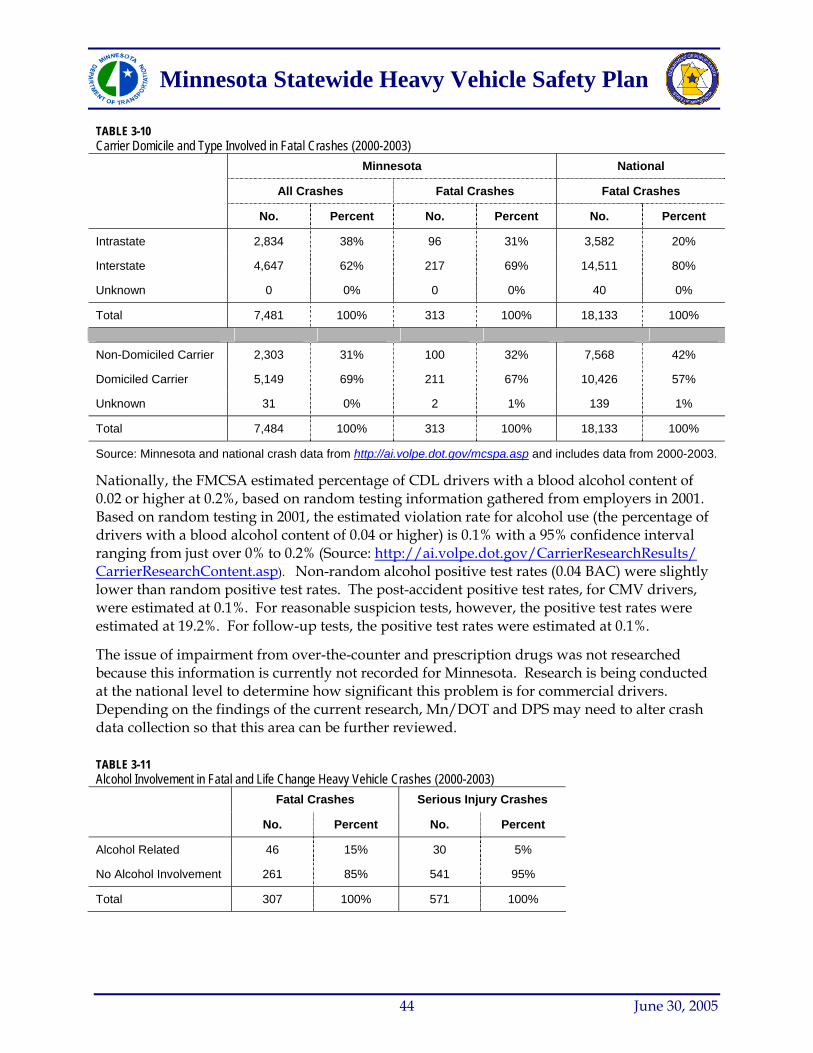
Minnesota Statewide Heavy Vehicle Safety Plan
TABLE 3-10 Carrier Domicile and Type Involved in Fatal Crashes (2000-2003)
Minnesota National
All Crashes Fatal Crashes Fatal Crashes
No. Percent No. Percent No. Percent
Intrastate 2,834 38% 96 31% 3,582 20%
Interstate 4,647 62% 217 69% 14,511 80%
Unknown 0 0% 0 0% 40 0%
Total 7,481 100% 313 100% 18,133 100% Non-Domiciled Carrier 2,303 31% 100 32% 7,568 42%
Domiciled Carrier 5,149 69% 211 67% 10,426 57%
Unknown 31 0% 2 1% 139 1%
Total 7,484 100% 313 100% 18,133 100%
Source: Minnesota and national crash data from http://ai.volpe.dot.gov/mcspa.asp and includes data from 2000-2003.
Nationally, the FMCSA estimated percentage of CDL drivers with a blood alcohol content of 0.02 or higher at 0.2%, based on random testing information gathered from employers in 2001. Based on random testing in 2001, the estimated violation rate for alcohol use (the percentage of drivers with a blood alcohol content of 0.04 or higher) is 0.1% with a 95% confidence interval ranging from just over 0% to 0.2% (Source: http://ai.volpe.dot.gov/CarrierResearchResults/ CarrierResearchContent.asp). Non-random alcohol positive test rates (0.04 BAC) were slightly lower than random positive test rates. The post-accident positive test rates, for CMV drivers, were estimated at 0.1%. For reasonable suspicion tests, however, the positive test rates were estimated at 19.2%. For follow-up tests, the positive test rates were estimated at 0.1%.
The issue of impairment from over-the-counter and prescription drugs was not researched because this information is currently not recorded for Minnesota. Research is being conducted at the national level to determine how significant this problem is for commercial drivers. Depending on the findings of the current research, Mn/DOT and DPS may need to alter crash data collection so that this area can be further reviewed.
TABLE 3-11 Alcohol Involvement in Fatal and Life Change Heavy Vehicle Crashes (2000-2003)
Fatal Crashes Serious Injury Crashes
No. Percent No. Percent
Alcohol Related 46 15% 30 5%
No Alcohol Involvement 261 85% 541 95%
Total 307 100% 571 100%
44 June 30, 2005

Minnesota Statewide Heavy Vehicle Safety Plan
Between 1998 and 2002, approximately 53% of all vehicle occupants killed in a crash were unbelted or not using the safety belt properly (1). In fatal heavy vehicle crashes, only 41% of vehicle occupants killed were unbelted or using the seat belt improperly (see Table 3-12). The increase in the percentage of vehicle occupant killed despite using a seat belt indicates how the size and weight of a heavy vehicle can influence the severity of a crash.
Of all vehicle occupants involved in a fatal or serious injury heavy vehicle crash, 21% were unbelted, but this same group of people accounted for 41% for vehicle occupants killed. Furthermore, only 7% of vehicle occupants that sustained no injuries during these crashes were unbelted. The discrepancy in seat belt use between persons that were killed and the persons that sustained no injuries highlights the importance a seat belt can have on reducing injuries.
At the national level, a FMCSA observational study found that only 48% of all commercial drivers wear seat belts (8). The FMCSA study also found the 620 commercial motor vehicle drivers died in a truck crash, of which 309 were not wearing safety belts (135 of these drivers were also ejected from the vehicle). Of the heavy vehicle drives killed in a Minnesota traffic crash, 41% were reported as not wearing a seat belt. However, of all heavy vehicle drivers involved in a fatal or serious injury crash, 85% reported they were wearing their seat belt during the crash. A portion of the Minnesota-National discrepancy may be due to regional differences, but is also possible that the heavy vehicle drivers involved in these crashes were simply reporting to have been wearing a seat belt when they actually were unbelted. More research is needed in Minnesota to determine the actual seat belt compliance of heavy vehicle drivers in the State.
TABLE 3-12 Seat Belt Use in Fatal and Life Change Heavy Vehicle Crashes (2000-2003)
Unbelted Vehicle Occupants
Belted Vehicle Occupants
No. Percent No. Percent
All Occupants 489 21% 1,859 79%
Uninjured Occupants 70 7% 871 93%
Occupants Killed 126 41% 182 59%
All Heavy Vehicle Drivers 126 15% 731 85%
Heavy Vehicle Drivers Killed 11 41% 16 59%
3.12 Summary From the review of the heavy vehicle crashes in Minnesota, the following has been learned:
• Between 2000 and 2003, Minnesota averaged 75 fatal and 140 serious injury crashes per year involving a heavy vehicle.
• The percentage of crashes involving a heavy vehicle that resulted in a fatality (1.2%) was twice the rate for all crashes in Minnesota (0.6%).
• Of fatal crashes, 93% involved multiple vehicles, and the common crash types were right angle, head-on, other/unknown and rear end.
45 June 30, 2005

Minnesota Statewide Heavy Vehicle Safety Plan
• Based on the reported contributing factors for fatal right angle, head-on, and rear end crashes, the heavy vehicle driver was responsible for less than 25% of the crashes.
• Fatal heavy vehicle crashes were concentrated during the weekdays and also between 6:00 AM and 3:00 PM.
• Weather, road surface, and daylight conditions were typically a factor in less 35% of fatal crashes.
• 75% of fatal heavy vehicle crashes were on Interstate, US Highway, or Minnesota State Highway routes. Also, 61% of the fatal crashes were on roadways classified as two-lane, two-way.
• Most fatal crashes were not intersection related (64%), but 25% were at a STOP or YIELD controlled intersection while 9% were at a traffic signal or overhead flasher.
• 17% of heavy vehicle drivers involved in a fatal crash and cited with a contributing factor were under the age of 30. If the heavy vehicle driver was involved in a fatal crash but not cited with a contributing factor, then only 11% were under the age of 30.
• For passenger vehicle drivers in a fatal crash involving a heavy vehicle, drivers under the age of 20 (14%) and 65 years and older (21%) were overrepresented
• The truck tractor with a semi trailer was the predominate heavy vehicle involved in a fatal crash.
• A majority of the heavy vehicles involved in a fatal crash were interstate carriers and/or domiciled within Minnesota.
• The involvement of alcohol was below Minnesota statewide averages for fatal crashes. • A national observational study found only 48% of heavy vehicle drivers use safety belts,
but 85% of heavy vehicle drivers involved in a fatal or life changing crash reported to the officer that they were using their safety belt at the time of the crash.
3.13 Demonstration Corridor Identification As a new approach to addressing heavy vehicle safety, it was suggested during one of the interviews that a demonstration corridor project could be developed so that it is potentially eligible for federal funding. Such a project would be to apply a set of comprehensive strategies (enforcement, engineering, education, and EMS strategies) based on the deficiencies of a corridor that has an unusually high number or high severity of heavy vehicle crashes.
To identify candidate corridors for a demonstration project, the first criteria identified was that the corridor should be rural since 76% of fatal crashes and 50% of serious injury crashes are located in rural areas (see Table 3-3). The second criteria was that candidate corridors should be a trunk highway (i.e., Interstate, US Highway, MN State Highway) with relatively high volumes of heavy vehicles. The heavy commercial average daily traffic (HCADT) counts collected by Mn/DOT were used to select routes with a relatively high HCADT (e.g., greater than or 500 HCADT for expressways and two-lane roadways). The next step was to find portions of the routes, also referred to as segments, where the heavy vehicles are concentrated. In addition to HCADT, the segment endpoints were also selected to be consistent with logical breakpoints, such as city limits or intersections with major routes. In total, four interstate segments, eight expressway segments, ten two-lane roadway segments, and four segments that are a combination of expressway and two-lane roadway were identified. In addition, three segments of MN 23 were also selected since the State Patrol had identified the corridor as
46 June 30, 2005
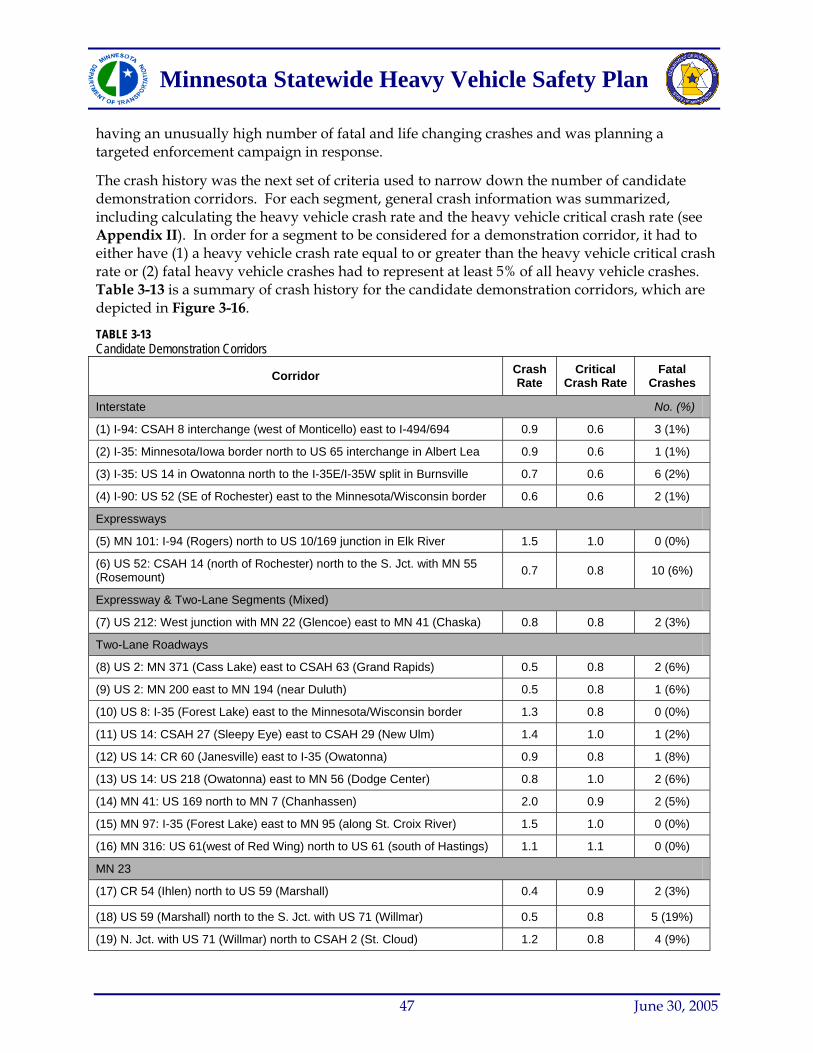
Minnesota Statewide Heavy Vehicle Safety Plan
having an unusually high number of fatal and life changing crashes and was planning a targeted enforcement campaign in response.
The crash history was the next set of criteria used to narrow down the number of candidate demonstration corridors. For each segment, general crash information was summarized, including calculating the heavy vehicle crash rate and the heavy vehicle critical crash rate (see Appendix II). In order for a segment to be considered for a demonstration corridor, it had to either have (1) a heavy vehicle crash rate equal to or greater than the heavy vehicle critical crash rate or (2) fatal heavy vehicle crashes had to represent at least 5% of all heavy vehicle crashes. Table 3-13 is a summary of crash history for the candidate demonstration corridors, which are depicted in Figure 3-16.
TABLE 3-13 Candidate Demonstration Corridors
Corridor Crash Rate
Critical Crash Rate
Fatal Crashes
Interstate No. (%)
(1) I-94: CSAH 8 interchange (west of Monticello) east to I-494/694 0.9 0.6 3 (1%)
(2) I-35: Minnesota/Iowa border north to US 65 interchange in Albert Lea 0.9 0.6 1 (1%)
(3) I-35: US 14 in Owatonna north to the I-35E/I-35W split in Burnsville 0.7 0.6 6 (2%)
(4) I-90: US 52 (SE of Rochester) east to the Minnesota/Wisconsin border 0.6 0.6 2 (1%)
Expressways
(5) MN 101: I-94 (Rogers) north to US 10/169 junction in Elk River 1.5 1.0 0 (0%)
(6) US 52: CSAH 14 (north of Rochester) north to the S. Jct. with MN 55 (Rosemount) 0.7 0.8 10 (6%)
Expressway & Two-Lane Segments (Mixed)
(7) US 212: West junction with MN 22 (Glencoe) east to MN 41 (Chaska) 0.8 0.8 2 (3%)
Two-Lane Roadways
(8) US 2: MN 371 (Cass Lake) east to CSAH 63 (Grand Rapids) 0.5 0.8 2 (6%)
(9) US 2: MN 200 east to MN 194 (near Duluth) 0.5 0.8 1 (6%)
(10) US 8: I-35 (Forest Lake) east to the Minnesota/Wisconsin border 1.3 0.8 0 (0%)
(11) US 14: CSAH 27 (Sleepy Eye) east to CSAH 29 (New Ulm) 1.4 1.0 1 (2%)
(12) US 14: CR 60 (Janesville) east to I-35 (Owatonna) 0.9 0.8 1 (8%)
(13) US 14: US 218 (Owatonna) east to MN 56 (Dodge Center) 0.8 1.0 2 (6%)
(14) MN 41: US 169 north to MN 7 (Chanhassen) 2.0 0.9 2 (5%)
(15) MN 97: I-35 (Forest Lake) east to MN 95 (along St. Croix River) 1.5 1.0 0 (0%)
(16) MN 316: US 61(west of Red Wing) north to US 61 (south of Hastings) 1.1 1.1 0 (0%)
MN 23
(17) CR 54 (Ihlen) north to US 59 (Marshall) 0.4 0.9 2 (3%)
(18) US 59 (Marshall) north to the S. Jct. with US 71 (Willmar) 0.5 0.8 5 (19%)
(19) N. Jct. with US 71 (Willmar) north to CSAH 2 (St. Cloud) 1.2 0.8 4 (9%)
47 June 30, 2005
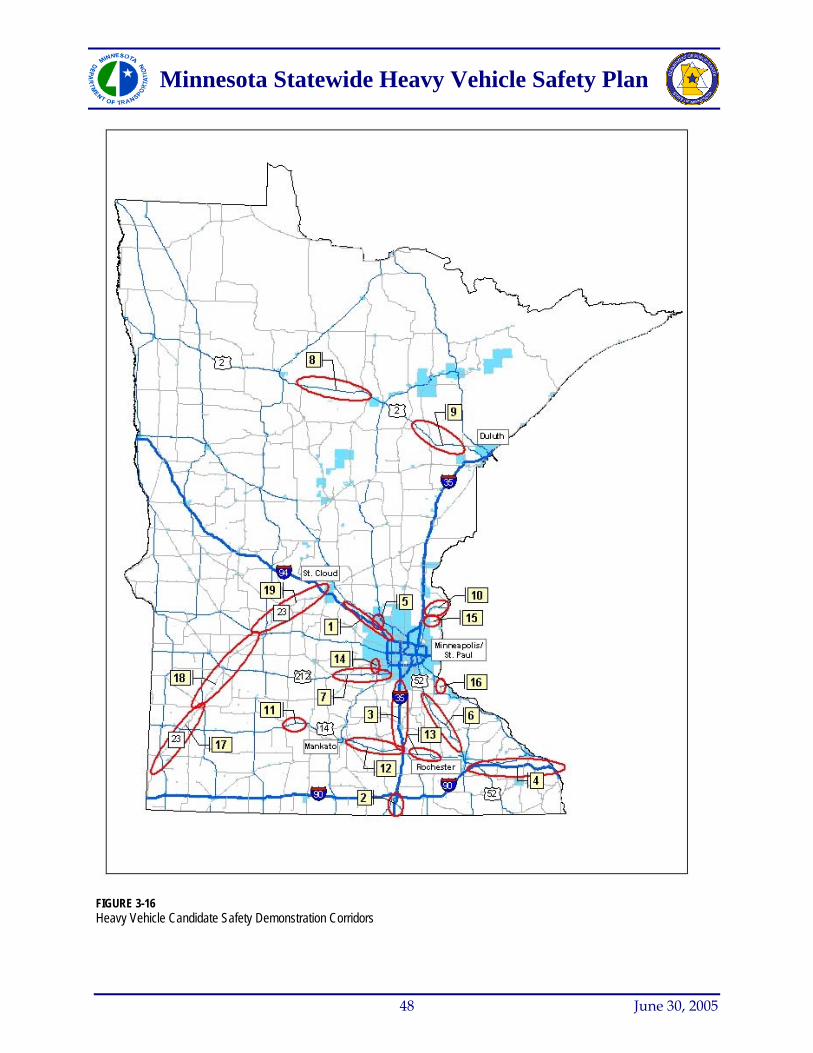
Minnesota Statewide Heavy Vehicle Safety Plan
FIGURE 3-16 Heavy Vehicle Candidate Safety Demonstration Corridors
48 June 30, 2005
Minnesota Statewide Heavy Vehicle Safety Plan
4. Goals and Performance Measures
Within AASHTO’s Strategic Highway Safety Plan (SHSP) and the NCHRP Report 500, Volume 13, national objectives have been identified as important to reducing the number of truck crashes. These objectives provide the State with a framework as to where safety efforts may be needed at the state level. The objectives focused specifically on trucks in the SHSP are listed as (2):
• Refocus commercial vehicle programs and regulations to achieve crash reductions rather than focusing on enforcement actions,
• Reduce the number of commercial vehicle crashes resulting from loss of alertness and driver fatigue,
• Implement traffic controls and address highway design problems to reduce the most prevalent truck crashes on Interstate and major highways, and
• Enhance the safe operating condition of trucks and buses.
The objectives for improving truck safety within the NCHRP Report 500: Volume 13 are listed as (3A):
• Reduce truck driver fatigue, • Strengthen commercial driver’s license (CDL) requirements and enforcement, • Increase public knowledge about sharing the road, • Improve maintenance of heavy trucks, • Identify and correct unsafe roadway and operational characteristics, • Improve and enhance truck safety data, and • Promote industry safety initiatives.
4.1 Performance Measures Within the national framework and based on the finding of the crash data review, the performance measures for Minnesota were established. These performance measures are intended to assist the State with measuring its progress in implementing the Critical Strategies in the SHVSP and the Critical Strategies in the CHSP that may be relevant to heavy vehicle safety. Performance measures related to evaluating the outcome of implementing the Critical Strategies (i.e., projects) are discussed in the individual action plans in Chapter 6 (refer to field “Appropriate Measures and Data”) and is also covered by the effectiveness spreadsheet in Chapter 7. Note: See the following chapter for more information on the Critical Strategies. The CHSP Critical Strategies are summarized in Appendix III.
Enforcement
Enf - 1. Number of heavy vehicles weighed/inspected along with an increase in the partnership with local law enforcement.
Enf - 2. Number of heavy vehicle drivers cited. Enf - 3. Number of passenger vehicle drivers cited for traffic violations near or around
heavy vehicles.
49 June 30, 2005
Minnesota Statewide Heavy Vehicle Safety Plan
Enf - 4. Number of targeted saturation patrols. (CHSP Critical Strategy #11) Enf - 5. Number of drivers wearing seat belts. (CHSP Critical Strategy #2)
Engineering
Eng - 1. Number of corridor roadway safety audits performed. (CHSP Critical Strategy #13) Eng - 2. Number of “demonstration” corridors projects completed for corridors identified
as having high levels of truck related crashes. Eng - 3. Number of roadside pull-offs constructed for truck inspection. Eng - 4. Number of miles of shoulders paved, rumble strips installed, and 4-cable median
barrier installed. Eng - 5. Number of work zones reviewed and improved to better accommodate needs of
heavy vehicles.
Education
Ed - 1. Number of law enforcement officers educated and trained to perform vehicle inspections and to collect appropriate data on heavy vehicle crashes.
Ed - 2. Number of CDL testers specially trained to handle testing of heavy vehicle drivers. Ed - 3. Number of new truck drivers trained based on minimum training requirements. Ed - 4. Number of veteran truck drivers and/or new residents re-tested and re-trained. Ed - 5. Number of novice and experienced passenger vehicle drivers trained about truck
issues. Ed - 6. Number of passenger vehicle drivers educated about risky driving behavior
around heavy vehicles through a hard-hitting, reality based public education campaign.
Emergency Medical/Health Services
EMS - 1. Reduction in time for emergency service providers responding to crashes involving trucks.
EMS - 2. Training for emergency service providers. (CHSP Critical Strategy #15)
Administrative
Adm - 1. Strengthen CDL restrictions to limit heavy vehicle drivers to operating vehicles no larger than the size in which they tested.
Adm - 2. Improve the timeliness in which carriers and owners learn about traffic convictions for their drivers receive.
Adm - 3. Improve data systems, the collection of crash data and share the data collected with all those impacted to better support the decision making process and increase ability to evaluate the effectiveness of various programs.
4.2 Fatal Crash Goal An integral part of the comprehensive safety planning process is setting a goal for the reduction in the number of fatal crashes and/or traffic fatalities. For the safety planning process, the generally accepted preference is to establish a goal for the number of lives lost, as the number of people killed is much more important than simply the number of fatal crashes that occurred.
50 June 30, 2005
Minnesota Statewide Heavy Vehicle Safety Plan
However, because of the size and weight of heavy vehicles, a few crashes that involve a full car or a bus can significantly increase the number of lives lost. Although unfortunate, this does not paint an accurate picture of the problem. Therefore, the goal for the SHVSP will be based on fatal crashes and not traffic fatalities. Yet, it is still important to keep in mind the real goal is to save lives by reducing the number of traffic fatalities.
For Minnesota, two statewide goals for the number of fatal crashes or fatalities have already been set. FMCSA has set a fatal crash goal specifically for heavy vehicles, while the CHSP established a goal for the overall number of traffic fatalities.
In 2003, the national fatal crash rate for heavy vehicles was 2.2 fatal crashes per 100 million truck vehicle miles traveled (100M TVMT). The FMCSA has an established goal to reduce the fatal crash rate to 1.65 fatal crashes per 100M TVMT. If the national fatal crash rate goal is achieved in Minnesota, then FMCSA projected that there would be 73 fatal crashes in Minnesota in 2008. However, the Minnesota heavy vehicle crash rate is currently below the national average. With this in consideration, FMCSA estimated that the number of fatal heavy vehicle crashes in Minnesota needs to be reduced to 56 or fewer per year in order to contribute to the overall national reduction.
In addition to the fatal crash rate goal set by FMCSA, the CHSP established an overall goal of 500 or fewer traffic fatalities per year by 2008, which would be approximately 450 fatal crashes per year. Since heavy vehicle crash have represented approximately 14% of Minnesota’s fatal crashes since 2000, a companion goal is that the number of fatal heavy vehicle crashes needs to be reduced to approximately 60 or fewer per year by 20085.
This plan endorses the more aggressive FMCSA fatal crash goal, but to be consistent with Minnesota’s CHSP, the official fatal crash goal adopted by this plan is 60 fatal crashes or fewer by 2008.
5 Between 2000 and 2003, 351 lives were lost in 307 fatal heavy vehicle crashes. At this ratio, 60 fatal crashes would be expected to result in approximately 70 fatalities.
51 June 30, 2005

Minnesota Statewide Heavy Vehicle Safety Plan
5. Strategy Identification and Prioritization
The ability to reduce the number of fatal and life changing crashes greatly depends on the strategies the State employs for heavy vehicle safety. Recognizing that resources must be used efficiently, a workshop with over 40 of the State’s safety partners was held on March 11, 2005 (see Table 5-1). At this workshop, the participants first were provided with background information about existing safety programs, interview results, crash data, and performance measures. Afterwards, the participants were broken out into small groups where the discussion was focused on a specific aspect of the heavy vehicle safety (drivers, vehicles, engineering & road, and data management & information systems). Much of the group discussion focused on a set of initial strategies that were provided. The initial strategies were primarily taken from NCHRP Report 500, Volume 13, adapted from the Pennsylvania Unified Truck Safety Strategy, or suggested during the interviews. The task teams were given the task to revise the strategies. The task teams were allowed to modify the initial strategies to be more specific to Minnesota, delete strategies if they were not applicable in Minnesota, and suggest new strategies not part of the initial list (see Appendix IV for the revised set of 62 strategies).
After editing the strategies, the task team then ranked each strategy as a high, medium, or low priority strategy, based on their ability to address the safety issues in Minnesota (see the 33 high priority strategies in Tables 5-2, 5-3, 5-4 and 5-5). In the afternoon, the task team leaders presented the high priority strategies to the entire group, after which the participants were given 12 votes to divide between the high priority strategies they felt were the most important and would be the most effective.
The Steering Committee made the final screen using the feedback from the workshop. In addition to the voting results, the Committee also considered factors such as relative cost to implement and operate, estimated time to implement, and expected effectiveness in moving towards the goal. For the relative cost, all strategies were ranked as low, moderate, or high. In order to address heavy vehicle safety across all of Minnesota, it was important to identify several strategies that are low cost, so that they can be widely deployed. In the same respect, it was also necessary to identify several strategies that can be deployed quickly since the fatal crash reduction goal is set for 2008. Finally, the strategies’ expected effectiveness were also rated as proven (documented to be effective), tried (accepted as effective but with little to no supporting research), and experimental (a strategy that hasn’t had opportunity to be tested). In order to ensure the State is efficiently using its resources, it is important to make sure some strategies selected are proven.
Using these criteria, the Steering Committee identified the ten Critical Strategies in Table 5-6. These ten strategies are the strategies that were considered to be best suited to broadly address the safety issues facing heavy vehicles. In order to meet the fatal crash reduction goal, it is important to implement these strategies as soon as possible and also across a large part of Minnesota. By adopting the Critical Strategies, it is not the intent of the Steering Committee to suggest that all existing programs should be stopped and replaced with the Critical Strategies. It is only because of the existing programs that the annual number of fatal heavy vehicle crashes is as low as 76. Instead, the Critical Strategies should be implemented in addition to the work
52 June 30, 2005
Minnesota Statewide Heavy Vehicle Safety Plan
that is already being done or in place of safety programs that are found to be ineffective at reducing the number of crashes. Also, selecting the Critical Strategies does not infer that the remaining strategies listed in Appendix IV could not potentially be successful. If a problem is identified within a specific industry, region, or corridor that can be directly addressed through another strategy, then that option should be carefully considered.
The one high priority strategy that did receive a relatively high number of votes, but is not incorporated into the SHVSP is to establish a statewide trauma system. This strategy was not selected because it is Critical Strategy #15 in the CHSP and there is no aspect of the strategy that needs to be modified to address heavy vehicle issues. Even though a trauma system was not adopted as an official Critical Strategy for the SHVSP, this Plan still supports the creation of the statewide trauma system.
The strategies reviewed at the workshop and subsequently led to the Critical Strategies also do not address the area of alcohol and seat belt use. The reason for this is the strict regulations that prohibit a heavy commercial vehicle driver from operating his/her vehicle after using alcohol or illegal drugs. In the same manner, heavy commercial vehicle drivers are also required to where a seat belt when operating their vehicle. What is important is enforcing these laws, which is addressed by Critical Strategy #11 in the CHSP.
53 June 30, 2005
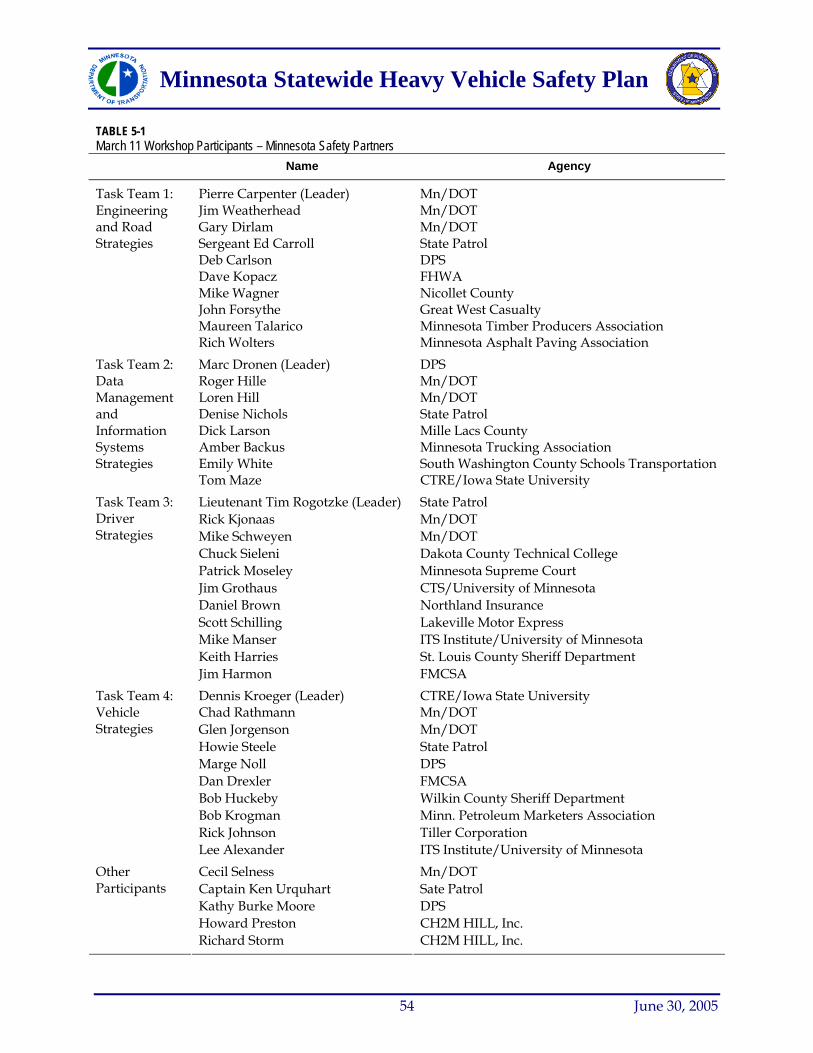
Minnesota Statewide Heavy Vehicle Safety Plan
54 June 30, 2005
TABLE 5-1 March 11 Workshop Participants – Minnesota Safety Partners
Name Agency
Pierre Carpenter (Leader)
Task Team 2: Data Management and Information Systems Strategies
Mn/DOT Jim Weatherhead Mn/DOT Gary Dirlam Mn/DOT Sergeant Ed Carroll State Patrol Deb Carlson DPS Dave Kopacz FHWA Mike Wagner Nicollet County John Forsythe Great West Casualty Maureen Talarico Minnesota Timber Producers Association
Task Team 1: Engineering and Road Strategies
Rich Wolters Minnesota Asphalt Paving Association
Marc Dronen (Leader) DPS Roger Hille Mn/DOT Loren Hill Mn/DOT Denise Nichols State Patrol Dick Larson Mille Lacs County Amber Backus Minnesota Trucking Association Emily White South Washington County Schools Transportation Tom Maze CTRE/Iowa State University
Lieutenant Tim Rogotzke (Leader) State Patrol Rick Kjonaas Mn/DOT Mike Schweyen Mn/DOT Chuck Sieleni Dakota County Technical College Patrick Moseley Minnesota Supreme Court Jim Grothaus CTS/University of Minnesota Daniel Brown Northland Insurance Scott Schilling Lakeville Motor Express Mike Manser ITS Institute/University of Minnesota Keith Harries St. Louis County Sheriff Department
Task Team 3: Driver Strategies
Jim Harmon FMCSA
Dennis Kroeger (Leader) CTRE/Iowa State University Chad Rathmann Mn/DOT Glen Jorgenson Mn/DOT Howie Steele State Patrol Marge Noll DPS Dan Drexler FMCSA Bob Huckeby Wilkin County Sheriff Department Bob Krogman Minn. Petroleum Marketers Association Rick Johnson Tiller Corporation
Task Team 4: Vehicle Strategies
Lee Alexander ITS Institute/University of Minnesota
Cecil Selness Mn/DOT Captain Ken Urquhart Sate Patrol Kathy Burke Moore DPS Howard Preston CH2M HILL, Inc.
Other Participants
Richard Storm CH2M HILL, Inc.
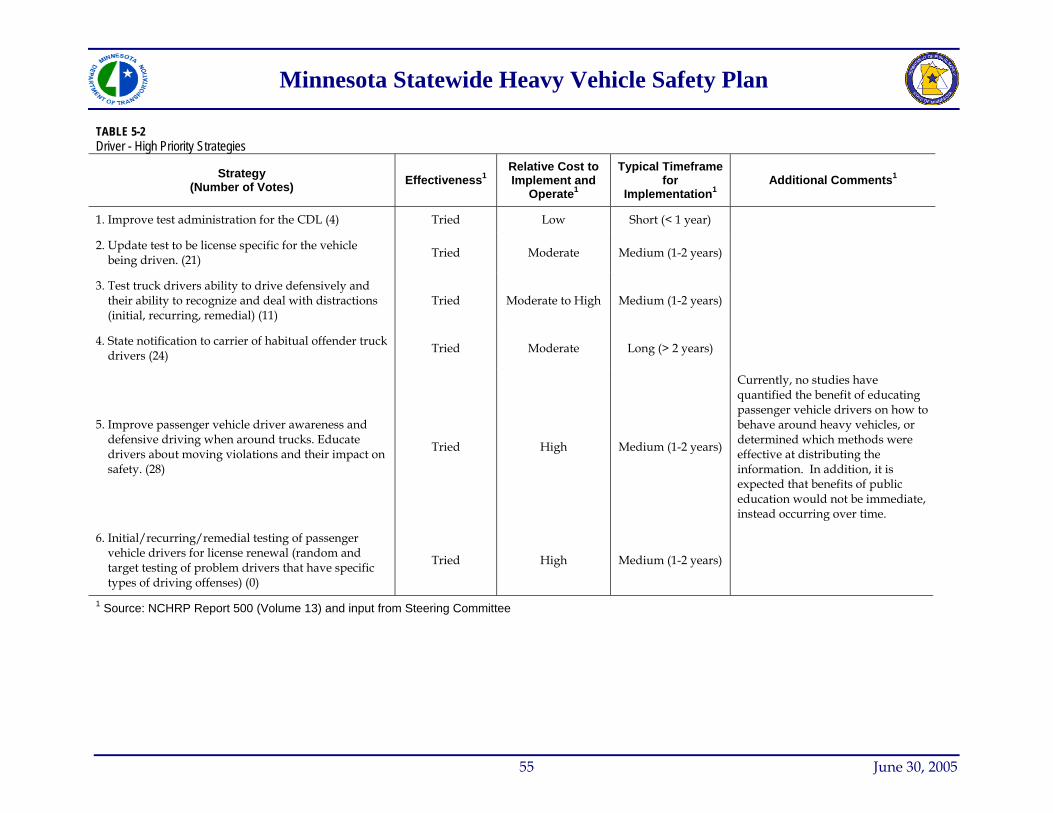
Minnesota Statewide Heavy Vehicle Safety Plan
TABLE 5-2 Driver - High Priority Strategies
Strategy (Number of Votes) Effectiveness1
Relative Cost to Implement and
Operate1
Typical Timeframe for
Implementation1Additional Comments1
1. Improve test administration for the CDL (4) Tried Low Short (< 1 year)
2. Update test to be license specific for the vehicle being driven. (21) Tried Moderate Medium (1-2 years)
3. Test truck drivers ability to drive defensively and their ability to recognize and deal with distractions (initial, recurring, remedial) (11)
Tried Moderate to High Medium (1-2 years)
4. State notification to carrier of habitual offender truck drivers (24) Tried Moderate Long (> 2 years)
5. Improve passenger vehicle driver awareness and defensive driving when around trucks. Educate drivers about moving violations and their impact on safety. (28)
Tried High Medium (1-2 years)
Currently, no studies have quantified the benefit of educating passenger vehicle drivers on how to behave around heavy vehicles, or determined which methods were effective at distributing the information. In addition, it is expected that benefits of public education would not be immediate, instead occurring over time.
6. Initial/recurring/remedial testing of passenger vehicle drivers for license renewal (random and target testing of problem drivers that have specific types of driving offenses) (0)
Tried High Medium (1-2 years)
1 Source: NCHRP Report 500 (Volume 13) and input from Steering Committee
55 June 30, 2005
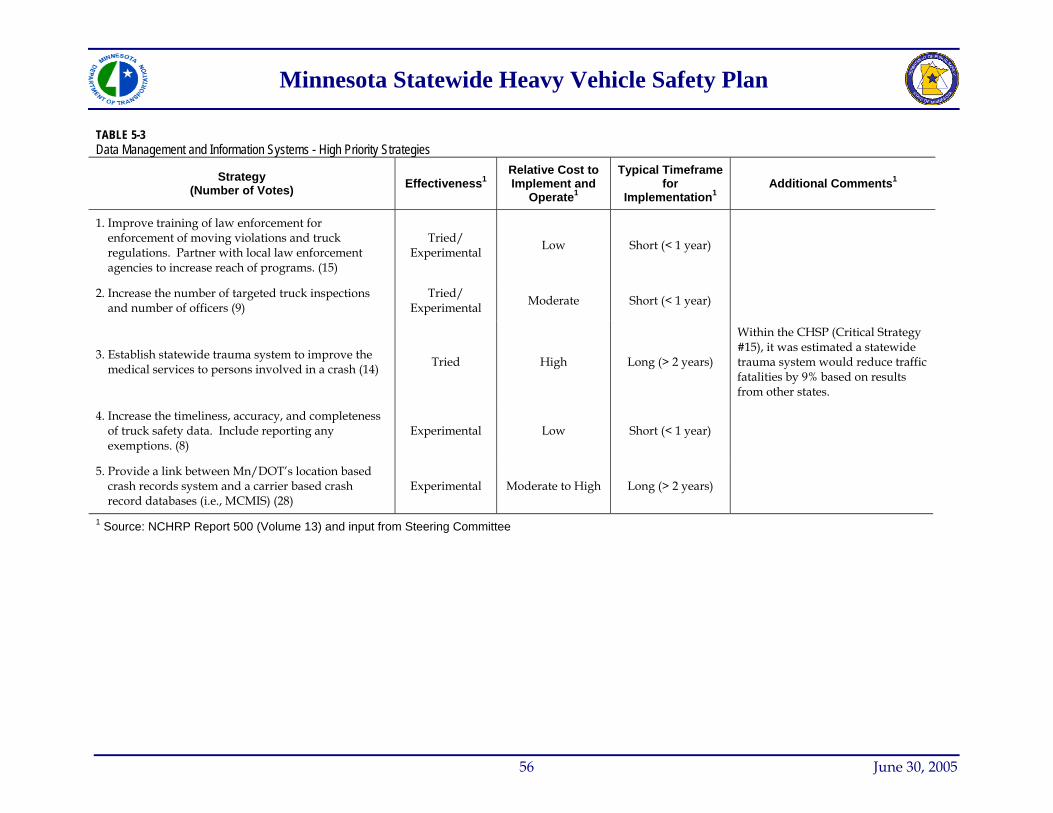
Minnesota Statewide Heavy Vehicle Safety Plan
TABLE 5-3 Data Management and Information Systems - High Priority Strategies
Strategy (Number of Votes) Effectiveness1
Relative Cost to Implement and
Operate1
Typical Timeframe for
Implementation1Additional Comments1
1. Improve training of law enforcement for enforcement of moving violations and truck regulations. Partner with local law enforcement agencies to increase reach of programs. (15)
Tried/ Experimental Low Short (< 1 year)
2. Increase the number of targeted truck inspections and number of officers (9)
Tried/ Experimental Moderate Short (< 1 year)
3. Establish statewide trauma system to improve the medical services to persons involved in a crash (14) Tried High Long (> 2 years)
Within the CHSP (Critical Strategy #15), it was estimated a statewide trauma system would reduce traffic fatalities by 9% based on results from other states.
4. Increase the timeliness, accuracy, and completeness of truck safety data. Include reporting any exemptions. (8)
Experimental Low Short (< 1 year)
5. Provide a link between Mn/DOT’s location based crash records system and a carrier based crash record databases (i.e., MCMIS) (28)
Experimental Moderate to High Long (> 2 years)
1 Source: NCHRP Report 500 (Volume 13) and input from Steering Committee
56 June 30, 2005
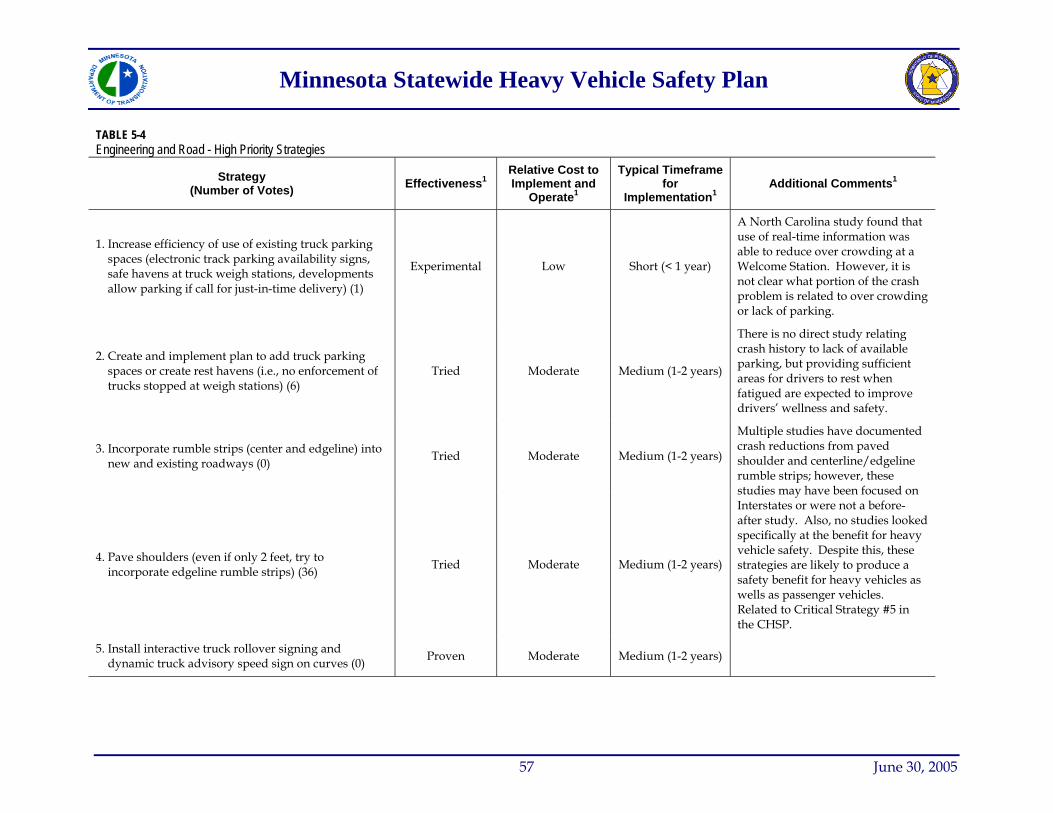
Minnesota Statewide Heavy Vehicle Safety Plan
TABLE 5-4 Engineering and Road - High Priority Strategies
Strategy (Number of Votes) Effectiveness1
Relative Cost to Implement and
Operate1
Typical Timeframe for
Implementation1Additional Comments1
1. Increase efficiency of use of existing truck parking spaces (electronic track parking availability signs, safe havens at truck weigh stations, developments allow parking if call for just-in-time delivery) (1)
Experimental Low Short (< 1 year)
A North Carolina study found that use of real-time information was able to reduce over crowding at a Welcome Station. However, it is not clear what portion of the crash problem is related to over crowding or lack of parking.
2. Create and implement plan to add truck parking spaces or create rest havens (i.e., no enforcement of trucks stopped at weigh stations) (6)
Tried Moderate Medium (1-2 years)
There is no direct study relating crash history to lack of available parking, but providing sufficient areas for drivers to rest when fatigued are expected to improve drivers’ wellness and safety.
3. Incorporate rumble strips (center and edgeline) into new and existing roadways (0)
Tried Moderate Medium (1-2 years)
4. Pave shoulders (even if only 2 feet, try to incorporate edgeline rumble strips) (36)
Tried Moderate Medium (1-2 years)
Multiple studies have documented crash reductions from paved shoulder and centerline/edgeline rumble strips; however, these studies may have been focused on Interstates or were not a before-after study. Also, no studies looked specifically at the benefit for heavy vehicle safety. Despite this, these strategies are likely to produce a safety benefit for heavy vehicles as wells as passenger vehicles. Related to Critical Strategy #5 in the CHSP.
5. Install interactive truck rollover signing and dynamic truck advisory speed sign on curves (0) Proven Moderate Medium (1-2 years)
57 June 30, 2005
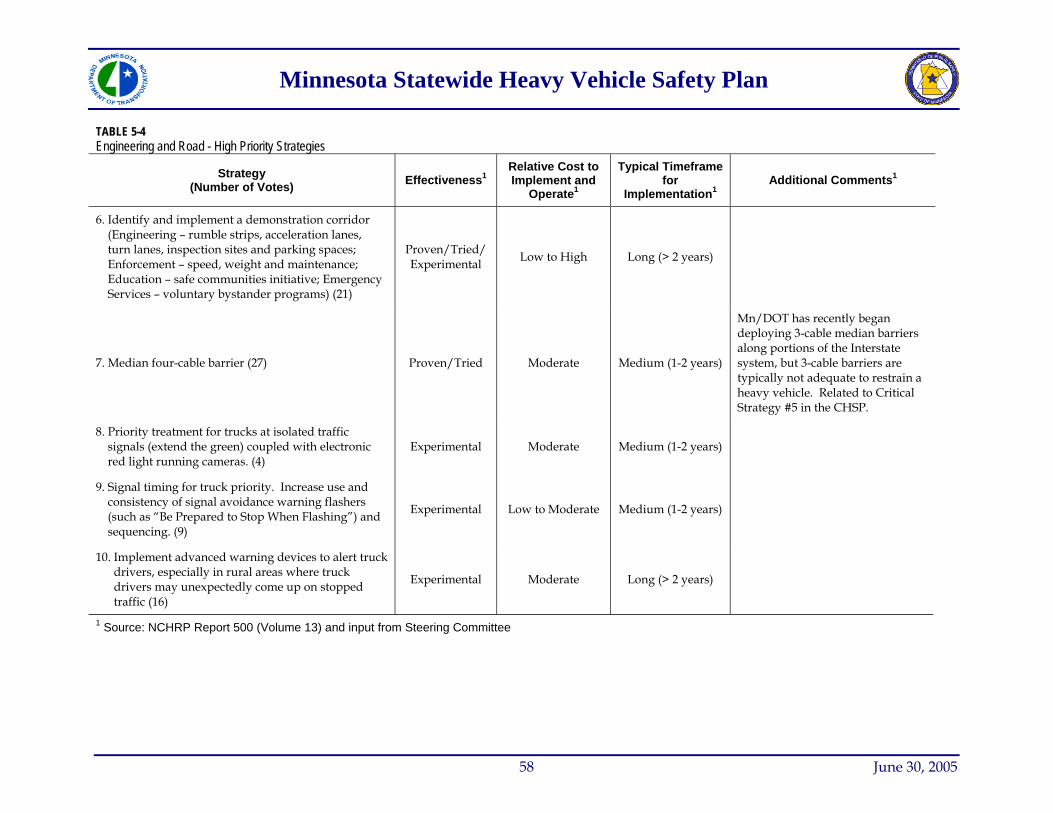
Minnesota Statewide Heavy Vehicle Safety Plan
TABLE 5-4 Engineering and Road - High Priority Strategies
Strategy (Number of Votes) Effectiveness1
Relative Cost to Implement and
Operate1
Typical Timeframe for
Implementation1Additional Comments1
6. Identify and implement a demonstration corridor (Engineering – rumble strips, acceleration lanes, turn lanes, inspection sites and parking spaces; Enforcement – speed, weight and maintenance; Education – safe communities initiative; Emergency Services – voluntary bystander programs) (21)
Proven/Tried/Experimental Low to High Long (> 2 years)
7. Median four-cable barrier (27) Proven/Tried Moderate Medium (1-2 years)
Mn/DOT has recently began deploying 3-cable median barriers along portions of the Interstate system, but 3-cable barriers are typically not adequate to restrain a heavy vehicle. Related to Critical Strategy #5 in the CHSP.
8. Priority treatment for trucks at isolated traffic signals (extend the green) coupled with electronic red light running cameras. (4)
Experimental Moderate Medium (1-2 years)
9. Signal timing for truck priority. Increase use and consistency of signal avoidance warning flashers (such as “Be Prepared to Stop When Flashing”) and sequencing. (9)
Experimental Low to Moderate Medium (1-2 years)
10. Implement advanced warning devices to alert truck drivers, especially in rural areas where truck drivers may unexpectedly come up on stopped traffic (16)
Experimental Moderate Long (> 2 years)
1 Source: NCHRP Report 500 (Volume 13) and input from Steering Committee
58 June 30, 2005
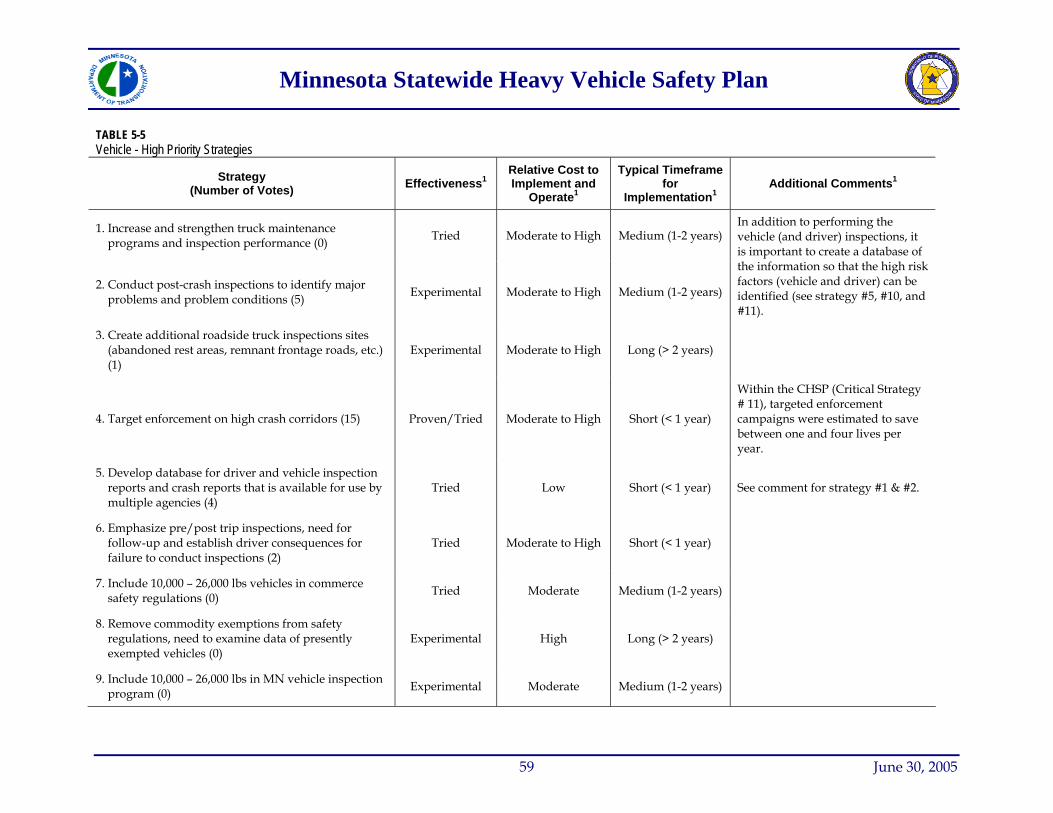
Minnesota Statewide Heavy Vehicle Safety Plan
TABLE 5-5 Vehicle - High Priority Strategies
Strategy (Number of Votes) Effectiveness1
Relative Cost to Implement and
Operate1
Typical Timeframe for
Implementation1Additional Comments1
1. Increase and strengthen truck maintenance programs and inspection performance (0) Tried Moderate to High Medium (1-2 years)
2. Conduct post-crash inspections to identify major problems and problem conditions (5) Experimental Moderate to High Medium (1-2 years)
In addition to performing the vehicle (and driver) inspections, it is important to create a database of the information so that the high risk factors (vehicle and driver) can be identified (see strategy #5, #10, and #11).
3. Create additional roadside truck inspections sites (abandoned rest areas, remnant frontage roads, etc.) (1)
Experimental Moderate to High Long (> 2 years)
4. Target enforcement on high crash corridors (15) Proven/Tried Moderate to High Short (< 1 year)
Within the CHSP (Critical Strategy # 11), targeted enforcement campaigns were estimated to save between one and four lives per year.
5. Develop database for driver and vehicle inspection reports and crash reports that is available for use by multiple agencies (4)
Tried Low Short (< 1 year) See comment for strategy #1 & #2.
6. Emphasize pre/post trip inspections, need for follow-up and establish driver consequences for failure to conduct inspections (2)
Tried Moderate to High Short (< 1 year)
7. Include 10,000 – 26,000 lbs vehicles in commerce safety regulations (0) Tried Moderate Medium (1-2 years)
8. Remove commodity exemptions from safety regulations, need to examine data of presently exempted vehicles (0)
Experimental High Long (> 2 years)
9. Include 10,000 – 26,000 lbs in MN vehicle inspection program (0) Experimental Moderate Medium (1-2 years)
59 June 30, 2005
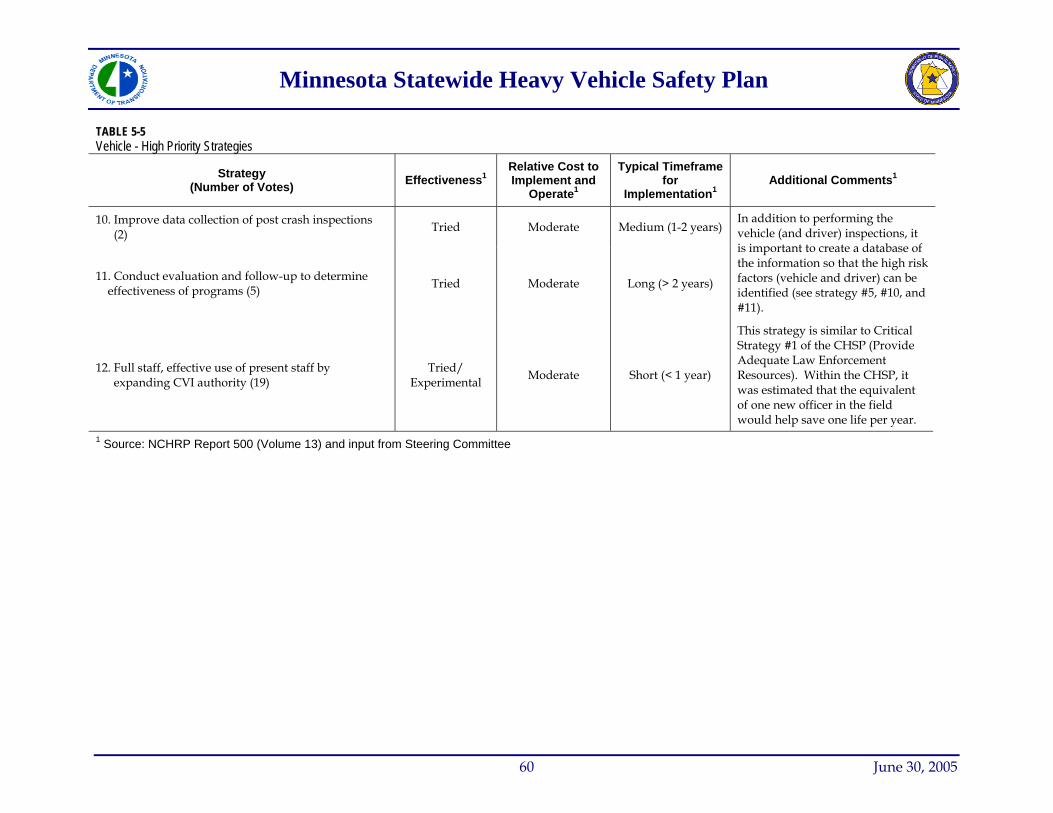
Minnesota Statewide Heavy Vehicle Safety Plan
TABLE 5-5 Vehicle - High Priority Strategies
Strategy (Number of Votes) Effectiveness1
Relative Cost to Implement and
Operate1
Typical Timeframe for
Implementation1Additional Comments1
10. Improve data collection of post crash inspections (2)
Tried Moderate Medium (1-2 years)
11. Conduct evaluation and follow-up to determine effectiveness of programs (5) Tried Moderate Long (> 2 years)
In addition to performing the vehicle (and driver) inspections, it is important to create a database of the information so that the high risk factors (vehicle and driver) can be identified (see strategy #5, #10, and #11).
12. Full staff, effective use of present staff by expanding CVI authority (19)
Tried/ Experimental Moderate Short (< 1 year)
This strategy is similar to Critical Strategy #1 of the CHSP (Provide Adequate Law Enforcement Resources). Within the CHSP, it was estimated that the equivalent of one new officer in the field would help save one life per year.
1 Source: NCHRP Report 500 (Volume 13) and input from Steering Committee
60 June 30, 2005
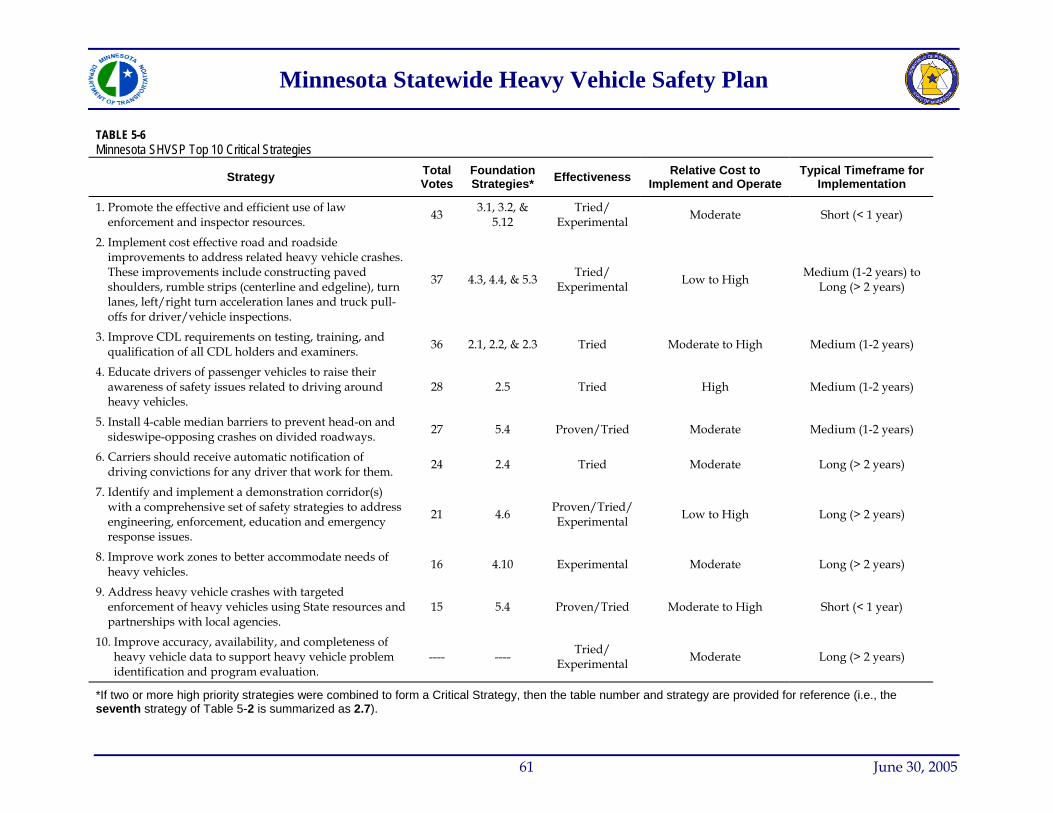
005
Minnesota Statewide Heavy Vehicle Safety Plan
61 June 30, 2
TABLE 5-6 Minnesota SHVSP Top 10 Critical Strategies
Strategy Total Votes
Foundation Strategies* Effectiveness Relative Cost to
Implement and Operate Typical Timeframe for
Implementation
1. Promote the effective and efficient use of law enforcement and inspector resources. 43
3.1, 3.2, & 5.12
Tried/ Experimental Moderate Short (< 1 year)
2. Implement cost effective road and roadside improvements to address related heavy vehicle crashes. These improvements include constructing paved shoulders, rumble strips (centerline and edgeline), turn lanes, left/right turn acceleration lanes and truck pull-offs for driver/vehicle inspections.
37 4.3, 4.4, & 5.3 Tried/
Experimental Low to High Medium (1-2 years) to
Long (> 2 years)
3. Improve CDL requirements on testing, training, and qualification of all CDL holders and examiners. 36 2.1, 2.2, & 2.3 Tried Moderate to High Medium (1-2 years)
4. Educate drivers of passenger vehicles to raise their awareness of safety issues related to driving around heavy vehicles.
28 2.5 Tried High Medium (1-2 years)
5. Install 4-cable median barriers to prevent head-on and sideswipe-opposing crashes on divided roadways. 27 5.4 Proven/Tried Moderate Medium (1-2 years)
6. Carriers should receive automatic notification of driving convictions for any driver that work for them. 24 2.4 Tried Moderate Long (> 2 years)
7. Identify and implement a demonstration corridor(s) with a comprehensive set of safety strategies to address engineering, enforcement, education and emergency response issues.
21
4.6Proven/Tried/ Experimental Low to High Long (> 2 years)
8. Improve work zones to better accommodate needs of heavy vehicles. 16 4.10 Experimental Moderate Long (> 2 years)
9. Address heavy vehicle crashes with targeted enforcement of heavy vehicles using State resources and partnerships with local agencies.
15 5.4 Proven/Tried Moderate to High Short (< 1 year)
10. Improve accuracy, availability, and completeness of heavy vehicle data to support heavy vehicle problem identification and program evaluation.
---- ----Tried/
Experimental Moderate Long (> 2 years)
*If two or more high priority strategies were combined to form a Critical Strategy, then the table number and strategy are provided for reference (i.e., the seventh strategy of Table 5-2 is summarized as 2.7).
Minnesota Statewide Heavy Vehicle Safety Plan
6. Critical Strategy Action Plans
The interview of the State’s Safety Partners, review of fatal crash data for heavy vehicles, and the March 11th workshop, which are described in the previous chapters, led to the identification of the ten Critical Strategies. These Critical Strategies are the centerpiece of the SHVSP’s goal to reduce fatal heavy vehicle crashes to 60 or fewer by 2008. The ten critical strategies can be summarized in the following:
1. Law enforcement and inspector resources
2. Cost effective road and roadside improvements
3. Strengthen CDL 4. Passenger vehicle driver education 5. Four-cable median barrier
6. Automatic notification of driver convictions
7. Demonstration corridor 8. Work zones 9. Targeted enforcement 10. Improve data systems
The Critical Strategies for the SHVSP does not include creating a statewide trauma system, even though this strategy received a high number of votes at the March 11th workshop. Omitting a statewide trauma system for the SHVSP’s Critical Strategies was done because it is already addressed by Critical Strategy #15 in the CHSP. Furthermore, there is no aspect of a statewide trauma system that needs to be addressed differently for heavy vehicle crashes. The issue of alcohol use and seat belts is also not addressed by the SHVSP’s Critical Strategies since strict regulations already exist for commercial drivers (see Chapter 2). The problems associated with alcohol use and not wearing seat belts can be effectively addressed through enforcement programs, which is covered by Critical Strategy #11 in the CHSP. Even though not adopted as Critical Strategies within the SHVSP, this Plan endorses the related Critical Strategies within Minnesota’s CHSP.
In order to develop the implementation plan for Minnesota, additional information, particularly as it relates to targets/goals, expected effectiveness, cost of implementation and organizational issues are required. This Chapter presents the detailed descriptions of each of the 10 Critical Strategies. In addition to the goals, effectiveness, and costs, each action plan also reviews areas such as keys to success, responsible agency, and legislative needs, to name a few. The action plans also link the Critical Strategies with the crash data presented in Chapter 3 and the performance measures listed in Chapter 4 and repeated in the following.
Enforcement
Enf - 1. Number of heavy vehicles weighed/inspected along with an increase in the partnership with local law enforcement.
Enf - 2. Number of heavy vehicle drivers cited. Enf - 3. Number of passenger vehicles cited for traffic violations near or around heavy
vehicles. Enf - 4. Number of targeted saturation patrols. Enf - 5. Number of drivers wearing seat belts.
62 June 30, 2005
Minnesota Statewide Heavy Vehicle Safety Plan
Engineering
Eng - 1. Number of corridor roadway safety audits performed. Eng - 2. Number of “demonstration” corridors projects completed for corridors identified
as having high levels of truck related crashes. Eng - 3. Number of roadside pull-offs constructed for truck inspection. Eng - 4. Number of miles of shoulders paved, rumble strips installed, and 4-cable median
barrier installed. Eng - 5. Number of work zones reviewed and improved to better accommodate needs of
heavy vehicles.
Education
Ed - 1. Number of law enforcement officers educated and trained to perform vehicle inspections and proper data collection for crashes.
Ed - 2. Number of CDL testers specially trained to handle testing of heavy vehicle drivers. Ed - 3. Number of new truck drivers trained based on minimum training requirements. Ed - 4. Number of veteran truck drivers or new residents re-tested and re-trained. Ed - 5. Number of new and veteran small vehicle drivers trained about truck issues. Ed - 6. Number of passenger vehicle drivers educated about risky driving behavior
around heavy vehicles through a hard-hitting, reality based educational program.
Emergency Medical/Health Services
EMS - 1. Reduction in time for emergency service providers responding to crashes involving trucks.
EMS - 2. Training for emergency service providers.
Administrative
Adm - 1. Strengthen CDL to limit heavy vehicle drivers to driving vehicles no larger than the size in which they took the test.
Adm - 2. Improve the timeliness in which carriers and owners learn about traffic convictions for their drivers receive.
Adm - 3. Improve data systems, the collection of crash data and share the data collected with all those impacted to better support the decision making process and increase ability to evaluate effectiveness of various programs.
One of the key pieces of information in the effectiveness spreadsheet and within the following action plans is the expected effectiveness for each of the strategies. Using the same convention in the NCHRP Report 500 series, the level of confidence in the reported effectiveness has been classified into one of the following three categories.
• Proven – The effectiveness of these strategies has been documented through properly designed studies. In some cases, more than one study has been done confirming the effectiveness of the strategy.
• Tried – These strategies may be commonly used and believed to be effective, but the true effectiveness of the strategy is not known. The effectiveness is unknown
63 June 30, 2005
Minnesota Statewide Heavy Vehicle Safety Plan
because the strategy has not been studied, the studies performed were not properly designed, or the studies had a wide variety of results.
• Experimental – Some of these strategies are new ideas while others have already been tried. In either case, the effectiveness of these strategies is undocumented. The effectiveness of these strategies was estimated by consulting with national and/or state professionals who are experienced in these strategies.
Strategy 1. Law Enforcement and Inspector Resources
Definition Promote the effective and efficient use of law enforcement and inspector resources.
Technical
Description A primary need for the state is for a greater on-road presence of commercial vehicle law enforcement, resulting in an increase in the number of heavy vehicle inspections. The level (level 1, 2 or 3) of additional inspections can vary by location/districts depending on the available resources (i.e., time and safe location) and the major problems within the area (i.e., fatigued drivers versus poor equipment). Also important is for the additional on-road enforcement to keep watch over passenger cars that are near and around heavy vehicles. Efficient placement of current and additional resources should be based on crash data that indicates where problems exist. To be effective and efficient with the current resources, it also important to have the proper balance between enforcement officers and inspectors, and that each are fully and properly trained to handle a variety of responsibilities. For example, the current situation generally requires that both a CVE and CVI officer be on site when a crash involves a heavy vehicle. By cross-training enforcement officers to handle vehicle inspection duties and/or providing inspectors with increased authority can allow current staff to be more efficient.
Target(s) This strategy seeks to prevent crashes by correcting driver behavior through an increased presence of law enforcement. In addition to improving the behavior of the heavy vehicle drivers, the increase in law enforcement presence is also to target and improve the behavior of passenger vehicle drivers that are near and around heavy vehicles. In order to increase the efficiency of law enforcement, one important aspect is to cross train CVE and CVI officers so that multiple personnel are not needed at a crash scene or an inspection site.
Goal Increasing enforcement levels applies to all fatal crashes; therefore, the goal for this strategy is to reduce the number of fatal crashes to 60 or fewer by 2008.
Reactive and Proactive Plans
A reactive deployment of this strategy would be to target counties, cities, corridors, neighborhoods, etc. where this is an unusually high number of heavy vehicle crashes. As a proactive approach, public education and outreach can be used to inform the general public about the increased enforcement and how it has led to an increased number of citations.
Expected Effectiveness
(Tried/Experimental) For the Minnesota’s CHSP, a law enforcement panel from Minnesota estimated that one additional full-time officer could prevent one traffic fatality each year. Since heavy vehicle crashes account for approximately 15% of Minnesota’s traffic fatalities, the effectiveness was reduced proportionately for heavy vehicle crashes.
Keys to Success It is important to educate law enforcement, Courts, policy makers, the trucking industry, and the general public so that they have a clear understanding of the benefits that result from increased law enforcement.
Potential Difficulties/Risks
If more efficient use of resources is unable to offset the cost of increased law enforcement, then there will be competing priorities for available funds.
64 June 30, 2005
Minnesota Statewide Heavy Vehicle Safety Plan
Strategy 1. Law Enforcement and Inspector Resources
Appropriate Measures and Data
Determining the direct reduction in the number of crashes resulting from an increased presence of law enforcement presence is very difficult. The best measure would be to track the change in crashes (especially crashes involving heavy vehicles) in the areas where enforcement was increased. It is also important to quantify/measure the amount of additional enforcement that was done in an area (i.e., increase in the number of patrol hours, the number of citations given to heavy vehicle and passenger vehicle drivers, the number of heavy vehicle inspections performed, etc.), and then look for correlations between the change in the number crashes and increase in enforcement.
Related Performance Measures
Enforcement #1-#5, Engineering #2, and Education #1
Related Fatal Crash Data
Increased enforcement of heavy vehicles and surrounding passenger vehicles has the ability to address all crashes involving a heavy vehicle.
Organizational and Institutional
Champion Commercial Vehicle Enforcement Section of the State Patrol and local communities that provide law enforcement.
Organizational, Institutional, and Policy Issues
The State Patrol needs to evaluate the division in the number of CVE and CVI officers and in their responsibilities in order to determine how current resources can be used more efficiently.
Issues Affecting Implementation Time
Implementation and cross training can only occur once the State Patrol decides what roles and responsibilities each group will be given. If additional funding is needed to still provide additional enforcement, this will have to wait until more funding can be appropriated in the next fiscal year.
Costs Involved The cost associated with adding one 8-hour shift of patrol is approximately $875 to cover labor and related overhead and vehicle costs. However, the efficient use of law enforcement resources (partnering with local law enforcement, cross training CVE and CVI officers) can help offset the cost of additional patrol.
Training and Other Personnel Needs
CVE and CVI officers will need additional training so that they are prepared to handle a broader set of responsibilities. Officers must also understand that the success and benefit of a traffic enforcement program is greatly dependent upon traffic stops and citations.
Legislative Needs Action by the Minnesota State Legislature is needed to provide the State Patrol with increased funding. Local governments will also need to take action to increase the funding provided to city police and county sheriffs.
65 June 30, 2005
Minnesota Statewide Heavy Vehicle Safety Plan
Strategy 2. Cost Effective Road and Roadside Improvements
Definition Implement cost effective road and roadside improvements to address related heavy vehicle crashes. These improvements include constructing paved shoulders, rumble strips (centerline and edgeline), turn lanes, left/right turn acceleration lanes and truck pull-offs for driver/vehicle inspections.
Technical
Description The road and roadside improvements (centerline rumble strips, edgeline rumble strips, paved shoulders, turn lanes, and left/right turn acceleration lanes) are intended to assist heavy vehicles and passenger vehicles to stay in their lane or provide separate areas for turning and slow moving heavy vehicles (Note: related to Critical Strategy #5 in the CHSP). Both centerline and edgeline rumble strips can alert drivers when they unknowingly leave the travel lane, helping to prevent run-off the road, head-on, and sideswipe-opposing crashes. Paving shoulders to move shoulder drop-offs further from the edge of the travel lane will essentially increase the driver’s “margin of error”. Paved shoulders may make it easier for a driver to maintain control of their vehicle in they leave the travel lane, thereby preventing run-off the road crashes. Paved shoulders can also address sideswipe or head-on crashes by preventing drivers from overcorrecting when on the shoulder and thereby entering opposing lanes. Ideally, paved shoulders would meet guidelines in the Minnesota Design Manual; however, it is recommended that shoulder should be paved as long as there is a minimum paved shoulder width of two feet. Constructing turn lanes and acceleration lanes at appropriate locations can remove slow moving or stopped heavy vehicles from through lanes. Constructing truck pull-offs are intended to provide law enforcement with convenient and safe areas to conduct truck inspections. Preferably, these areas should be outside of the recommended clear zone and also be designed to accommodate acceleration and deceleration needs.
Target(s) This strategy is primarily intended to address lane departure crashes or crashes that may have been prevented if an officer had a safe place to perform a vehicle and driver inspection. Paved shoulders can help drivers maintain control of their vehicle if they veer onto the shoulder, preventing run-off the road crashes and head-on/sideswipe opposing crashes on undivided roadways (drivers may over correct when on the shoulder sending their vehicle into oncoming traffic). Edgeline and centerline rumble strips are intended to alert drivers when they are leaving the travel lane. Constructing pull-offs for truck inspections give officers safer options to perform truck inspections on busy streets and highways, especially if there if the road has narrow shoulders.
Goal Ran-off the road, head-on, and sideswipe opposing account for approximately 39% of heavy vehicle fatal crashes (or 30 fatal crashes per year). If the number of fatal crashes per year was reduced to 60 or fewer, than these crash types would need to be reduced to 24 (or less) fatal crashes per year.
Reactive and Proactive Plans
These strategies can be reactively deployed along corridors where this is a high volume of heavy vehicles or a high frequency of heavy vehicle crashes. Deploying along these corridors first is also an important part of creating a prioritized plan for the strategy. Proactively, constructing paved shoulders, edgeline and centerline rumble strips, should be done on all highways were justified by volumes (passenger vehicle and heavy vehicle) and truck pull-offs should be constructed along corridors where there are high HCADT, even if there has not been a crash history problem.
66 June 30, 2005
Minnesota Statewide Heavy Vehicle Safety Plan
Strategy 2. Cost Effective Road and Roadside Improvements
Expected Effectiveness
(Tried/Experimental) The effectiveness will depend upon the specific strategy chosen and whether the strategy was used in an appropriate location. Past studies have found varying results for most strategies, but some general guidance regarding expected effectiveness follows. • Centerline rumble strips on two-way roadways = 30% crash reduction • Shoulder rumble strips = Some studies have found a 20 – 30% reduction in the
number of run-off the road crashes on freeways. The effectiveness on two-lane roadways has been reported as unstudied.
For detailed information regarding the effectiveness for these strategies, more information is available in NCHRP Report 500 Volume 4 (A Guide for Addressing Head-On Collisions) and Volume 6 (A guide for Addressing Run-Off-Road Collisions).
Keys to Success Since the location of crashes can generally be described as random, it is necessary to have a widespread deployment of this strategy. However, beginning with corridors that have experienced a high frequency of crashes would be part of a prioritized plan. Due to the random location of crashes, implementation at a specific location is response to a few number of crashes (especially high profile crashes) is unlikely to be effective.
Potential Difficulties/Risks
A typical issue for many agencies is the associated maintenance and will need to consider that maintenance cost over time since the rumble strips or paved shoulders may need to be rehabilitated or replaced. Installing edgeline/centerline rumble strips on narrow roadways (travel lanes less than 11 feet) may make the roadway feel narrow and result in making drivers uncomfortable. Truck inspection areas will also require maintenance (snow removal, paving, signing) to keep useable.
Appropriate Measures and Data
Effectiveness of the strategy can be determined by monitoring crash data for lane departure crashes. Also along corridors where truck inspection sites were constructed, the number of inspections performed and citations should also be tracked to make sure the inspections sites are being utilized.
Related Performance Measures
Enforcement #1 - #2 and Engineering #1 - #4
Related Fatal Crash Data
Between 2000 and 2003, there were 25 run-off the road, 73 head-on, and 22 sideswipe opposing crashes involving a heavy vehicle that resulted in a fatality.
Organizational and Institutional
Champion Mn/DOT, county and city highway agencies
Organizational, Institutional, and Policy Issues
Paving shoulders and installing edgeline/centerline rumble strips are relatively easy to implement and will typically not require coordination among multiple agencies, purchase of additional right-of-way, reconstruction, or extensive modification of the roadside. Constructing pull-offs for truck inspections will require the highway and enforcement agencies to work together so that the inspections sites are constructed in areas most beneficial for officers but minimize the need for right-of-way, reconstruction, and signing.
Issues Affecting Implementation Time
Paving shoulder and edgeline/centerline rumble strips can typically be implemented within a one or two year time frame. Constructing truck inspection sites may require a longer timeframe if the purchase of right-of-way is needed or the surrounding topography or land use make it difficult to find suitable locations.
Costs Involved The cost will vary depending upon the specific strategy and size of the project. Coordinating implementation of this strategy with scheduled roadway maintenance activities (i.e., asphalt overlay) may make implementation more cost effective & proactive.
Training and Other Personnel Needs
Training of engineers on identifying the appropriate strategy for the local conditions would be needed.
Legislative Needs None identified.
67 June 30, 2005
Minnesota Statewide Heavy Vehicle Safety Plan
Strategy 3. Strengthen CDL
Definition Improve CDL requirements on testing, training, and qualification of all CDL holders and examiners.
Technical
Description For the test administrators, it is key that they be knowledgeable of and well trained in the issues facing heavy vehicle drivers. Ideally, the CDL test administrators would be able to focus solely on heavy vehicle tests. However, understanding that limited resources exist and those resources must be used efficiently, the test administrators should be specially trained in the area of heavy vehicle needs. The CDL training requirements could also be strengthened to require that driving schools must meet minimum training requirements (i.e., number of training hours, curriculum) before eligible for a CDL. Also, new residents that held a CDL in another state should be retested before they can be issued a Minnesota CDL, that veteran drivers are randomly retested, and target retesting of problem drivers (retesting of in-vehicle skills, not retesting of the written exam). Finally, a graduated CDL is needed such that a driver is only eligible to drive a vehicle as large as or smaller than the vehicle they tested in.
Target(s) Addressing the training, testing, and authorization which vehicle types drivers allowed to operate is meant to address the crashes were the heavy vehicle driver was at-fault. Even though a majority of crashes may have been the result of the action of the passenger vehicle, approximately 20 to 30% are the result of the heavy vehicle driver’s actions. Furthermore, a well trained and attentive heavy vehicle driver may be able to reduce the severity of a collision or even avoid the collision altogether when another diver’s actions lead to a collision.
This strategy will address drivers with a Minnesota CDL, who may be working at an interstate carrier domiciled within the State of Minnesota or for an intrastate carrier. (Note: the domiciled and intrastate carriers were found to be over represented in heavy vehicle crashes.)
Goal In approximately 20% to 25% of fatal heavy vehicle crashes involving two or more vehicles, a heavy vehicle driver was considered to be at-fault (this is approximately 15 to 20 fatal crashes per year). Plus, there are approximately five additional fatal crashes each year involving a single heavy vehicle. If the annual number of fatal crashes is reduced to sixty, than the related number of fatal crashes should be reduced to 16 to 20 per year.
Reactive and Proactive Plans
Establishing minimum training requirements for new drivers and retesting of new residents would proactively address all newly licensed heavy vehicle drivers. To address the existing drivers, skill testing can be done randomly of veteran drivers (proactively) and/or targeted at problem drivers (reactively).
Expected Effectiveness
(Tried) If one additional veteran or problem driver was required to retake a driving skills test each weekday (approximately 250 days per year) to identify drivers that need additional safety related training, it has been estimated that one fatal crash could be prevented in a five year period. Similarly, implementing a graduated CDL or requiring and enforcing minimum training requirements for driver schools was each estimated to be able to prevent one fatal crash in a five year period.
Keys to Success In order to have a positive effect on the number of heavy vehicle crashes, it will be important to address the training, testing and retesting of a large portion of the heavy vehicle drivers. It will also be necessary to convince most businesses and carriers that driver training and the impact it has on safety is an important issue.
68 June 30, 2005

Minnesota Statewide Heavy Vehicle Safety Plan
Strategy 3. Strengthen CDL
Potential Difficulties/Risks
The cost to administer the program (focused testers, retesting drivers, and monitoring driving schools) will be in competition with other programs for funding. Also, random testing of veteran drivers should be established so that drivers who recently completed training (i.e., less than four years) are unlikely to be selected, whereas drivers who have not received training for a considerable time (i.e., 12 years or more) have a higher probability of being selected.
Appropriate Measures and Data
The number of veteran, problem, or new resident truck drivers that are retested should be recorded as well as the number of new truck drivers that graduated from a program meeting new training requirements. Once the program has reached a large portion of heavy vehicle drivers, then researches should look to see if there has been a reduction in the number of crashes where the heavy vehicle driver was the primary contributing driver.
Related Performance Measures
Education #2 - #4, Administrative #1
Related Fatal Crash Data
It has been estimated that 15 to 20 fatal crashes each year are related to contributing factors of the heavy vehicle drivers and five fatal crashes each year involving only the heavy vehicle.
Organizational and Institutional
Champion Driver & Vehicles Services Division (DVS) of the Department of Public Safety.
Organizational, Institutional, and Policy Issues
DVS will need to identify potential issues related to implementation and coordinate with other agencies (i.e., State Patrol, Mn/DOT) that may be either affected or need to provide assistance with implementation.
Issues Affecting Implementation Time
Fiscal budgets established for the current year may not be able to accommodate suggested changes. Any action that requires authorization from the Minnesota State Legislature can only be implemented after the Legislature has taken appropriate measures.
Costs Involved Most of these strategies could be accommodated at little or no cost (i.e., placing a note on license identifying classes of heavy vehicles licensed to drive) by using existing staff and procedures. However, depending on the increase in the number of skills test, additional test administrators may be needed.
Training and Other Personnel Needs
CDL test administrators may require additional training or the number may need to be increased if many new veteran, problem, and new resident drivers are required to re-take a driving skills test.
Legislative Needs Action by the Minnesota State Legislature is needed to provide the DVS with increased funding to conduct the programs. Also, legislation is needed to establish curriculum requirements for driving schools and also compel new residents and veteran drivers to submit to retesting of driving skills.
69 June 30, 2005
Minnesota Statewide Heavy Vehicle Safety Plan
Strategy 4. Passenger Vehicle Driver Education
Definition Educate drivers of passenger vehicles to raise their awareness of safety issues related to driving around heavy vehicles.
Technical
Description As many as 70% or more of fatal crashes involving a heavy vehicle was caused by the driver of a passenger vehicle. This demonstrates a need to educate the public how to drive defensively around heavy vehicles and also the need to teach them the severity of their actions. To be most effective, a combination of hard hitting, reality based educational media for the general public (i.e., TV commercials) and targeted education at high risk groups (elderly and young drivers) is needed.
Target(s) Of the passenger vehicles involved in a fatal crash with a heavy vehicle, their drivers were often considered to be young (less than 20, 14% of drivers) or older (greater than 64, 21% of drivers). However, drivers between the age of 20 and 64 also need to be educated on how to drive around heavy vehicles and the severity of the consequences when poor decision are made since they still represented 65% of the passenger vehicle drivers involved.
Goal Of the fatal heavy vehicle crashes, there are approximately 70 each year that involve multiple vehicles. Of these, it has been estimated that a driver of the passenger vehicle was a major contributor in 70% to 80% of these crashes (approximately 50 to 55 fatal crashes annually). To reach the annual goal of 60 fatal crash or fewer per year, than the number of crashes primarily caused by passenger vehicle actions need to be reduced to approximately 40 to 44 fatal crashes per year
Reactive and Proactive Plans
TV and radio campaigns targeted at passenger vehicle drivers during times where they could reach a wide demographic would be a proactive approach. Providing educational materials to select groups that are over represented (i.e., older drivers during 55 Alive classes, novice drivers during driver training) would be a reactive method of public education. Another approach that would be considered reactive is message prepared (i.e., commercials, news interviews) in response to high profile fatal crashes.
Expected Effectiveness
(Tried) Little information is available regarding the effectiveness of public education campaigns, especially on the issue of heavy vehicle safety. However, one can expect high quality, hard hitting marketing will reach more people and have a greater impact on individuals.
Keys to Success The programs need to be broad based in order to reach as many people as possible, especially those in high risk groups. Yet, they must also use hard hitting, reality based information that has the ability to grab the attention and affect people at the personal level.
Potential Difficulties/Risks
Obtaining quality, relevant data to convey to the general public in a manner that is convincing. Also, the information must be coordinated with other driver education campaigns. TV and radio advertising at times that will reach large and/or targeted markets can be expensive.
Appropriate Measures and Data
One measure would be to look for a decrease in the number of fatal crashes where the passenger vehicle driver was a primary contributor and part of a group targeted in the public education campaign. Additionally, polls and surveys could be conducted to measure the change in awareness and/or attitudes towards heavy vehicles and to the dangers and risks associated with making risky decisions in the vicinity of a heavy vehicle.
Related Performance Measures
Education #5 and #6
70 June 30, 2005
Minnesota Statewide Heavy Vehicle Safety Plan
Strategy 4. Passenger Vehicle Driver Education
Related Fatal Crash Data
Of the multiple vehicle fatal crashes, the action taken by the passenger vehicle driver is a primary contributor in 70% to 80% of the crashes.
Organizational and Institutional
Champion Department of Public Safety – Office of Communications
Organizational, Institutional, and Policy Issues
A point person should be identified to direct proactive and reactive media messaging. The programs and media should also be designed to work across agency boundaries.
Issues Affecting Implementation Time
Due to the cost of both creating media messages and purchasing advertising, budget issues could prevent the timing of the media outreach. When there are multiple agencies involved, at time agreement on the direction and/or execution of the message is important. In addition, time is needed to identify and decide on the authority given to the point person.
Costs Involved Cost will vary depending upon the type of outreach selected and the quality of any advertising, brochures, and press releases developed.
Training and Other Personnel Needs
It is anticipated no additional staff would be need since this could be accomplished through existing staff or outside assistance (i.e., volunteers, safety advocacy groups).
Legislative Needs If additional funding is requested, than action by the legislature would be needed.
Strategy 5. Four-Cable Median Barrier
Definition Install 4-cable median barriers to prevent head-on and sideswipe-opposing crashes on divided roadways.
Technical
Description To address across median crashes, one of the critical strategies in the Comprehensive Highway Safety Plan called for placing of median barriers in narrow medians. A current Mn/DOT practice has been to install 3-cable guardrail on divided roadways where there has been a history of across median crashes. The current 3-cable guardrail is not capable of redirecting large vehicles. However, some 4-cable guardrails systems have recently received certification for use of redirecting heavy vehicles.
Target(s) This strategy is directed towards head-on and sideswipe opposing crashes on divided roadways.
Goal From 2000 to 2003, there were 307 fatal heavy vehicle crashes, of which 95 were head-on and sideswipe opposing crashes. Of these crashes, 15 occurred on divided roadways (approximately 5% of all fatal heavy vehicle crashes or about four per year). If the annual number of heavy vehicle crashes was reduced to 60 or fewer, than the number of across median fatal crashes needs to be reduced to three per year.
Reactive and Proactive Plans
Four-cable median barriers can be reactively deployed along corridors where this is a high volume of heavy vehicles or a high frequency of heavy vehicle crashes. Deploying along these corridors first is also an important part of creating a prioritized plan for the strategy. Proactively, installation of the median barrier should be done on all highways were justified by volumes (passenger vehicle and heavy vehicle), even if there has not been a crash history problem.
Expected Effectiveness
(Proven/Tried) The effectiveness of a cable guardrail is highly dependent on how well it was designed and constructed to maximize its ability to stop heavy vehicles.
71 June 30, 2005
Minnesota Statewide Heavy Vehicle Safety Plan
Strategy 5. Four-Cable Median Barrier
Keys to Success Since the location of crashes can generally be described as random, it is necessary to have a widespread deployment of this strategy. However, beginning with corridors that have experienced a high frequency of crashes would be part of a prioritized plan. Also because of the random location of crashes, implementation at a specific location is response to a few number of crashes (especially high profile crashes) is not likely to be effective.
Potential Difficulties/Risks
A typical issue for many agencies is the associated maintenance with guardrail that has been hit and also that it can cause difficulties with snow removal. Because of the deflection allowed by cable guardrail, it is also important to ensure there is sufficient distance on both sides.
Appropriate Measures and Data
Effectiveness of the strategy can be determined by monitoring crash data for lane departure crashes. Also along corridors where truck inspection sites were constructed, the number of inspections performed and citations should also be tracked to make sure the inspections sites are being utilized.
Related Performance Measures
Engineering #1, #2, and #4
Related Fatal Crash Data
Between 2000 and 2003, there were 15 across median fatal crashes.
Organizational and Institutional
Champion Mn/DOT, county and city highway agencies
Organizational, Institutional, and Policy Issues
Installing cable median guardrail is relatively easy to implement and will typically not require coordination among multiple agencies, purchase of additional right-of-way, reconstruction, or extensive modification of the median. Maintenance departments may need education on the benefits of median guardrail is greater than the difficulties associated with maintenance.
Issues Affecting Implementation Time
Installing cable median guardrail can typically be implemented within a one or two year time frame.
Costs Involved The cost will vary depending upon the specific size of the project. Coordinating implementation of this strategy, especially when part of a proactive plan, with other construction activities may make implementation more cost effective and have less impact on traffic operations. In past experiences, Mn/DOT has been able to construct three-cable guardrail at a cost of $100,000 per mile.
Training and Other Personnel Needs
Training of engineers on proper design/placement and appropriate places to use cable median guardrail.
Legislative Needs None identified.
72 June 30, 2005
Minnesota Statewide Heavy Vehicle Safety Plan
Strategy 6. Automatic Notification of Driver Convictions
Definition Carriers should receive automatic notification of driving convictions for any driver that works for them.
Technical
Description Carriers are currently required to review the driving records for their drivers and drivers also have the responsibility to notify their employers of any traffic convictions. However, with today’s technology, it would be feasible to establish an email list-serve that will automatically notify carriers of any moving violation convictions that their drivers receive. This would ensure that carriers are receiving timely and accurate information regarding the driving records for their employees.
Another aspect regarding driving record is the need for the local Court system to enforce citations issued to drivers and to forward all convictions to DPS in a timely manner. Without cooperation of the all courts, the information reaching the employers still may not be useful if out of date.
Target(s) Notification of employers as to which of their drivers have received convictions, whether issued by local law enforcement or the State Patrol, is important in allowing the industry correct behavior before it becomes a problem. Automatic notification of these driving convictions would assist employers with timely identification of problem drivers.
Goal In approximately 20% to 25% of fatal heavy vehicle crashes involving two or more vehicles, a heavy vehicle driver was considered to be at-fault (this is approximately 15 to 20 fatal crashes per year). Plus, there are approximately five additional fatal crashes each year involving a single heavy vehicle. If the annual number of fatal crashes is reduced to sixty, than the related number of fatal crashes should be reduced to 16 to 20 per year.
Reactive and Proactive Plans
Not applicable.
Expected Effectiveness
(Tried) Giving employers timely notification if there drivers receive a driving conviction could result in companies giving additional training before a crash can occur. It was estimated that such a program could likely prevent one fatal crash in a five year period.
Keys to Success Proactive involvement by the employers, such as providing additional safety training if the driver receives a citation, is necessary to make this program successful. If the industry disregards the driver’s record and doesn’t emphasize the importance of safety, then it is unlikely to reduce the number of crashes.
Potential Difficulties/Risks
Privacy issues will need to be addressed to ensure that a driver’s convictions are not accidentally sent to a company the driver no longer works for or was never employed at. A strategy will also need to be devised to accommodate drivers that are “for hire” so that persons considering hiring them have the ability to learn about their driving record, including any safety (re)training they have taken in response to driving citations.
Appropriate Measures and Data
The number of times an employer automatically learns of a driving conviction. A survey could also be done to determine if the program has led to shorter notification times and how much the industry values the information.
Related Performance Measures
Administrative #2
Related Fatal Crash Data
It has been estimated that 15 to 20 fatal crashes each year are related to contributing factors of the heavy vehicle drivers and five fatal crashes each year involving only the heavy vehicle.
73 June 30, 2005
Minnesota Statewide Heavy Vehicle Safety Plan
Strategy 6. Automatic Notification of Driver Convictions
Organizational and Institutional
Champion Driver & Vehicles Services Division (DVS) of the Department of Public Safety.
Organizational, Institutional, and Policy Issues
How timely the notification to an employer actually occurs will be based on two major factors, which are (1) Courts quickly forwarding all convictions to the appropriate office and (2) fast processing of the convictions into the system.
Issues Affecting Implementation Time
Obtaining an email address for all drivers can not be accomplished immediately. Collecting working email addresses could be part of the license renewal process, which would take up to four years for all CDL holders in Minnesota to renew their license.
Costs Involved To upgrade the current system where timely and accurate notification is given to employers, an initial investment of $270,000 would be needed for hardware and time with an on-going cost of $130,000 annually. (Based on Critical Strategy #14 in the CHSP)
Training and Other Personnel Needs
Creating and maintaining the list-serve could possibly be accomplished with current IT staff within DPS.
Legislative Needs The Minnesota State Legislature may need to become involved in order to allow the DVS division provide automatic notification of driving convictions to a heavy vehicle driver’s employer.
Strategy 7. Demonstration Corridor
Definition Identify and implement a demonstration corridor(s) with a comprehensive set of safety strategies to address engineering, enforcement, education and emergency response issues.
Technical
Description So often, traffic safety strategies happen within a black box and are not coordinated across different agencies (i.e., engineering and enforcement). The thought is to identify a corridor or set of corridors with heavy vehicle safety deficiencies. In these areas, the implementation of safety strategies addressing the four safety Es would be coordinated in order to get the combined effect of a multi-disciplinary approach.
Target(s) A focus should be on a corridor(s) where there are a relatively high number of heavy vehicle crashes, especially fatal and life changing crashes, that are caused by a broad range of issues.
Goal The overall goal would be to help reduce the number of fatal crashes in order to meet the 2008 safety goal. The crash reduction goal for a demonstration corridor should be based on the specific conditions within the corridor.
Reactive and Proactive Plans
The selection of a demonstration corridor based on crash history is part of a reactive safety plan. However, using multiple strategies to address the entire corridor and the surrounding population would be a proactive approach within the targeted area.
Expected Effectiveness
Will depend upon the severity of the crash problem and strategies deployed in the corridor.
74 June 30, 2005
Minnesota Statewide Heavy Vehicle Safety Plan
Strategy 7. Demonstration Corridor
Keys to Success Participation from all types (i.e., enforcement, engineering, education, medial services) and levels (i.e., State or local) of agencies will be necessary in order be affective along a significant stretch of a roadway. Involvement and education of the local and commuting public on the existence of the program and why it is necessary will be important to getting drivers to adopt safer driving behaviors. Also, local businesses with heavy vehicle operations should be involved in the identification of safety issues and selection of strategies deployed along the corridor.
Potential Difficulties/Risks
The identification of the corridor(s) and development of the strategies must be done in a way so that it does not appear a specific group is being targeted, especially if enforcement levels are increased. Implementing multiple strategies at the same time will make it difficult (if not impossible) to measure the effectiveness of individual components.
Appropriate Measures and Data
For a demonstration corridor, the before and after conditions need to be measured and recorded. Example performance measures include vehicle speeds, number of inspections/citations, crash history, and changes in public awareness/attitudes toward traffic safety.
Related Performance Measures
Enforcement #1 - #5, Engineering #1 – #4, Education #5 - #6, and Emergency Medical/Health Services #1 - #2
Related Fatal Crash Data
Not applicable.
Organizational and Institutional
Champion Mn/DOT, State Patrol, and Office of Traffic Safety at the Department of Public Safety
Organizational, Institutional, and Policy Issues
A multi-disciplinary approach to traffic safety will require a high degree of coordination between different types of agencies (i.e., engineering, enforcement) and the different levels of government (State, county, city, and township). Issues that need to be addressed will include, but not be limited to, the selection of strategies deployed, timing, funding, and agency responsible for measuring the performance of the project.
Issues Affecting Implementation Time
The time to implement will have a large dependency on the extent of the strategies selected, the number of agencies involved, and the ability of each responsible agency to find project funding.
Costs Involved The cost associated with a demonstration corridor would be significantly influenced by the size of the corridor and the strategies employed to address the deficiencies. However, involvement of multiple agencies will help lower the cost for agencies.
Training and Other Personnel Needs
It is unlikely the additional staff would be needed to implement a demonstration corridor. Yet, the enforcement agencies are the most likely to have to use overtime in order to provided more patrols.
Legislative Needs None identified.
75 June 30, 2005
Minnesota Statewide Heavy Vehicle Safety Plan
Strategy 8. Work Zones
Definition Improve work zones to better accommodate needs of heavy vehicles.
Technical
Description To address work zone safety, management of traffic in work zones should be reviewed based on the special needs for heavy vehicles. This would entail ensuring lane width, horizontal clearances, superelevation (especially across lane transitions), and roadway curvature are designed to accommodate large truck and reduce the potential for roll-overs. If it is determined that the needs for a heavy vehicle cannot be accommodated, then consideration should be given to establishing a truck speed limit.
Another work zone issue is to provide heavy vehicles with sufficient advanced notice of the work zone, especially in rural areas. This allows the driver the option to avoid the work zone by selecting an alternate route.
Target(s) Designing work zones to safely accommodate heavy vehicles is important in all construction areas, but is even more important for construction sites where there is a relatively high number of heavy vehicles, high vehicle speeds, the construction will last an extended period of time, or any combination of these factors. The issue of crashes in work zones is not only important for the safety of vehicle occupants, but also because of the risks the construction workers face. A crash in a work zone can also have an unusually high impact on traffic operations, inducing long delays and backups. In some cases, advance warning of heavy vehicle drivers of the work zone and signing for alternative routes may be the preferred solution. This can reduce or possibly eliminate the number of heavy vehicles in the construction area and consequently the need to implement special designs intended to meet their needs.
Goal There has been an annual average of three fatal work zone crashes from 2000 through 2003. Consistent with the goal of reducing heavy vehicle crashes to 60 or fewer each year, fatal work zone crashes needs to be reduced to two fatal crashes each year.
Reactive and Proactive Plans
This strategy can be applied proactively by having traffic maintenance plans reviewed in advance to the start of construction. Also in corridors with high volumes of heavy vehicles, more effort should be taken to ensure the work zone is designed to accommodate a heavy vehicle. Reactive deployment of this strategy would be to review work zones if there has been a history of heavy vehicle crashes.
Expected Effectiveness
(Experimental) If 100 traffic maintenance plans were reviewed each year to ensure heavy vehicle needs are accommodated, it was estimated that one fatal crash could be prevented in a five year period.
Keys to Success The key to reducing the likelihood of reducing heavy vehicle crashes in work zones relies first on identifying work zones where problems may occur and then implementing special designs in response. Also, properly maintaining the work zone (i.e., signing, traffic control devices, marking) is needed if it will have a lasting affect.
Potential Difficulties/Risks
Constraints may make it difficult to accommodate heavy vehicles or expensive to do so. In this case, consideration should be given to implementing an alternative route for heavy vehicles or a truck speed limit. Coordination with law enforcement should be considered to ensure heavy vehicle drivers obey the restrictions.
Appropriate Measures and Data
The number of crashes that occurred in or near a work zone. Also, if a work zones was audited and had changes implemented because an unusual number of heavy vehicle crashes, the change in the crash history before and after implementation of the changes should be recorded.
76 June 30, 2005
Minnesota Statewide Heavy Vehicle Safety Plan
Strategy 8. Work Zones
Related Performance Measures
Engineering #5
Related Fatal Crash Data
Between 2000 and 2003, there were a total of 12 fatal crashes that were reported as having occurred in some form of a work zone.
Organizational and Institutional
Champion Mn/DOT and local highway agencies that perform construction.
Organizational, Institutional, and Policy Issues
Traffic work zones are often designed to simply meet the minimum requirements in the Minnesota MUTCD. Road designers need to consider if simply meeting the design guidelines can cause problems for heavy vehicles and what can be done to avoid these problems.
Issues Affecting Implementation Time
Implementation can begin almost immediately and can often be incorporated into the current project development process.
Costs Involved Cost may have a wide range depending on the specific issues in each work zone. The cost associated with a simple construction project that requires no special modification for heavy vehicles will be limited to a few hours of staff time needed to review traffic maintenance plans. At the other end of the scale, there may be a significant cost to implement special changes for heavy vehicles, if the project is in a location where there is limited space or construction will occur over an extended period. In this type of circumstance, the benefits and costs associated with special changes need to be considered.
Training and Other Personnel Needs
Staff that develop or review traffic maintenance plans will need education on the common work zone features that create difficulties for heavy vehicles and how these features can be avoided.
Legislative Needs None identified.
Strategy 9. Targeted Enforcement
Definition Address heavy vehicle crashes with targeted enforcement of heavy vehicles using State resources and partnerships with local agencies.
Technical
Description This strategy is intended to increase enforcement in areas where there is a history of heavy vehicle crashes or heavy vehicles that do not meet safety standards. The effective use of current resources may entail a law enforcement officer(s) that has the ability to stop a heavy vehicle who will then direct the driver to a location where a CVI is waiting to perform inspections. Such an operation does not have to use only State resources. If a city or county law enforcement agency is aware of a problem in their area, then their enforcement officers could partner with a State CVI. The level (level 1, 2 or 3) of additional inspections can vary by location/districts depending on the available resources (i.e., time and safe location) and the major problems within the area (i.e., fatigued driver versus poor equipment).
Minnesota State Patrol already uses similar programs to address traffic safety issues (i.e., NightCAP to target drinking and driving).
77 June 30, 2005
Minnesota Statewide Heavy Vehicle Safety Plan
Strategy 9. Targeted Enforcement
Target(s) The target group is the heavy vehicle drivers that are not operating their vehicles in a safe manner (i.e., driving behavior or lack of proper vehicle maintenance). Passenger vehicles that are also committing violations in the vicinity of a heavy vehicle would be targeted. A saturation patrol targeted at heavy vehicles could also result in citations for various traffic violations that were not part of the target group (i.e., unbelted vehicle occupants).
Goal Saturation patrols can target all types of heavy vehicle fatal crashes; therefore, the goal for this strategy is to reduce the number of fatal crashes to 60 or fewer by 2008. Based on site specific conditions, separate goals can be established for each targeted enforcement area.
Reactive and Proactive Plans
Selecting where to conduct a saturation patrol is primarily a reactive measure since they are located in areas with a crash problem. This type of program is also reactive since it identifies a driver as he/she is committing the offense, which did not stop the behavior but may have prevented a crash. Saturation patrols are also proactive when the results are highly publicized in the area it was conducted. If a driver knows there is a greater possibility they could be stopped, they are more likely to alter their behavior.
Expected Effectiveness
(Proven/Tried) It is known that the presence of law enforcement and the number of heavy vehicles inspected has a positive influence on driver behavior, but no information is available to quantify this into a crash reduction. For Minnesota’s CHSP, the State’s law enforcement experts estimated that one fatal crash could be prevented for each enforcement campaign (1 campaign = 50 saturation patrols).
Keys to Success In order to alter the behavior of heavy vehicle drivers (on road and vehicle maintenance) and also passenger vehicle drivers, it is important that the public is informed of the enforcement activity. Not only should the public be informed about the presence of the saturation patrol before it is conducted, the results of the patrol (i.e., citations, arrests, etc.) need to be released through the media so that drivers understand the benefits and impacts.
Potential Difficulties/Risks
Finding additional funding to conduct a saturation patrol and also coordinating all agencies that need to be involved.
Appropriate Measures and Data
Initially, the success of the program will be realized through an increase number of citations (passenger vehicle and heavy vehicle drivers), vehicle inspections conducted, and possibly arrests. The average vehicle speeds may also drop temporarily or while the targeted enforcement is being conducted. After numerous patrols, the number of crashes and fatalities is expected to decrease.
Related Performance Measures
Enforcement #1 - #5
Related Fatal Crash Data
Increased enforcement of heavy vehicles and surrounding passenger vehicles has the ability to address all crashes involving a heavy vehicle.
Organizational and Institutional
Champion Commercial Vehicle Enforcement section of the State Patrol as well as local law enforcement agencies coordinating with the State Patrol or working independently.
Organizational, Institutional, and Policy Issues
Targeted enforcement will be most effective when multiple law enforcement agencies work together to patrol as large of an area as possible. Mobilizations should be statewide covering large portions of Minnesota roadways and including a large percentage of law enforcement agencies.
78 June 30, 2005
Minnesota Statewide Heavy Vehicle Safety Plan
Strategy 9. Targeted Enforcement
Issues Affecting Implementation Time
Before targeted enforcement can be conducted, crash records need to be analyzed so that law enforcement agencies can effectively target the area with high incidents with heavy vehicles.
Costs Involved The primary cost associated with targeted enforcement is the time (and potential overtime) needed to staff the law enforcement patrols. Partnering the commercial vehicle enforcement with an existing saturation patrol that is operating in an area with high heavy vehicle volumes and at a time-of-day when heavy vehicles are on the roadway can help reduce the cost.
Training and Other Personnel Needs
Local agencies that participate in targeted enforcement of heavy vehicles may need education on identifying heavy vehicles that pose a potential risk and also which behaviors of the passenger vehicle driver can cause a crash with a heavy vehicle.
Legislative Needs None identified.
Strategy 10. Improve Data Systems
Definition Improve accuracy, availability, and completeness of heavy vehicle data to support heavy vehicle problem identification and program evaluation.
Technical
Description There are currently several databases that maintain information regarding heavy vehicles (i.e., crash history, inspection history, etc.) and in order to access this information, individual departments must be contacted. Also, certain information is not collected and entered into the State’s crash record database, including commodity type, years of driver experience, how long the driver had been on duty at the time of the crash, if the driver was exempted from any regulations because of commodity exemptions, if vehicle was overweight, and etc. Linking the crash database with other information and including some heavy vehicle specific information in the crash report, this data could then be used to evaluate existing programs and identify specific problems for heavy vehicles.
Target(s) By providing an integrated database that is easy for State and local staff to access can provide decision makers with the ability to identify and target problem locations, carriers, and drivers. This would also allow Minnesota to better evaluate the effectiveness of safety programs. With knowledge about each program’s effectiveness, that resources can be wisely invested into programs with proven track records.
Goal Increasing the accuracy, availability, and completeness of heavy vehicle data can apply to all fatal crashes; therefore, the goal for this strategy is to reduce the number of fatal crashes to 60 or fewer by 2008.
Reactive and Proactive Plans
Comprehensive information regarding heavy vehicles can be used reactively to focus on problems areas, carriers, and drivers or it can be use proactively to identify factors which may lead to an increase crash risk. With this knowledge, Minnesota can address potential safety deficiencies before a problem is manifested.
Expected Effectiveness
(Tried/Experimental) It has been estimated that improving and integrating Minnesota’s heavy database system to create a comprehensive source of information will allow decision makers select more effective programs; thereby, preventing one fatal crash in a five year period.
Keys to Success All information in the database needs to be current and also accurate and all responsible agencies need to cooperate. The agency responsible for maintaining and upgrading the final database will need to be provided with adequate resources.
79 June 30, 2005
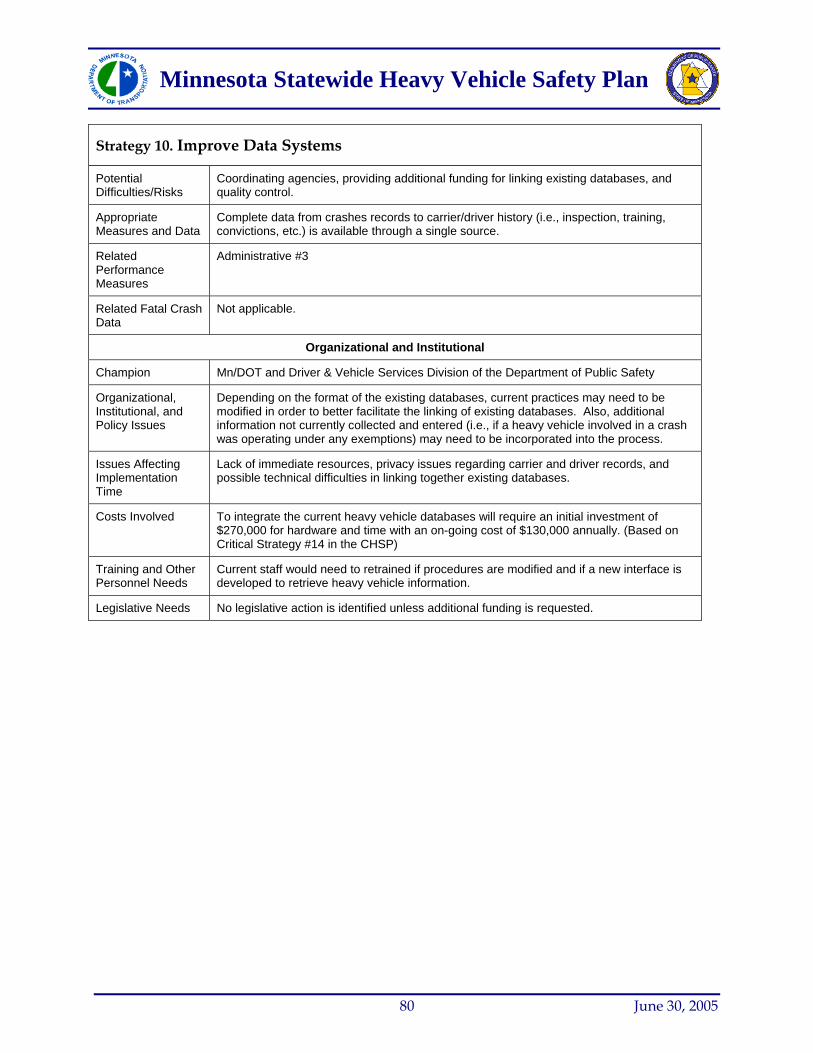
Minnesota Statewide Heavy Vehicle Safety Plan
Strategy 10. Improve Data Systems
Potential Difficulties/Risks
Coordinating agencies, providing additional funding for linking existing databases, and quality control.
Appropriate Measures and Data
Complete data from crashes records to carrier/driver history (i.e., inspection, training, convictions, etc.) is available through a single source.
Related Performance Measures
Administrative #3
Related Fatal Crash Data
Not applicable.
Organizational and Institutional
Champion Mn/DOT and Driver & Vehicle Services Division of the Department of Public Safety
Organizational, Institutional, and Policy Issues
Depending on the format of the existing databases, current practices may need to be modified in order to better facilitate the linking of existing databases. Also, additional information not currently collected and entered (i.e., if a heavy vehicle involved in a crash was operating under any exemptions) may need to be incorporated into the process.
Issues Affecting Implementation Time
Lack of immediate resources, privacy issues regarding carrier and driver records, and possible technical difficulties in linking together existing databases.
Costs Involved To integrate the current heavy vehicle databases will require an initial investment of $270,000 for hardware and time with an on-going cost of $130,000 annually. (Based on Critical Strategy #14 in the CHSP)
Training and Other Personnel Needs
Current staff would need to retrained if procedures are modified and if a new interface is developed to retrieve heavy vehicle information.
Legislative Needs No legislative action is identified unless additional funding is requested.
80 June 30, 2005
Minnesota Statewide Heavy Vehicle Safety Plan
81 June 30, 2005
7. Deployment Plan
The effectiveness values for fatal and serious injury crashes have also been color coded based on the level of confidence. Effectiveness values in green (“Proven”) are strategies that have been rigorously tested and the results are considered to be very reliable. Strategies with an effectiveness value in yellow (“Tried”) are often widely accepted, but quality experiments may have not been performed to document the safety benefit. The red effectiveness values (“Experimental”) may have little or no research available to document their effectiveness. Effectiveness values in red were set by Mn/DOT and DPS using local professional knowledge and expertise from past experiences. For some strategies, a range of effectiveness values may exist, but the best information available was used to determine a single effectiveness value. However, Mn/DOT and DPS realize that other agencies and organizations may be aware of or have more information that can improve the accuracy of the effectiveness values. If so, this information can be shared with Pierre Carpenter at Mn/DOT (651-406-4809, [email protected]).
The spreadsheet has been organized into three areas, given values, input values, and output values. Even though the user is expected to only need to alter the input values, several constants or given values may change for a local or regional level (i.e., county or city). Table 7-1 provides a detailed description of each field and values for one example strategy are also reviewed within Figure 7-1.
In addition to the action plans (see Chapter 6), an Effectiveness Spreadsheet was also created to show how the Critical Strategies are tied to the crash data and performance measures (see Figure 7-1). The spreadsheet also estimates the number and the value of fatal and serious injury heavy vehicle crashes prevented (i.e., benefit) based on the amount of deployment of each strategy. The spreadsheet also documents the estimated implementation costs and then computes a B/C ratio. It must be understood that the tool was created as a planning aid to provide a generic/statewide look at deployment of the Critical Strategies and is based on average crash densities spread over Minnesota’s state highway system. Results (i.e., safety benefit or implementation costs) for a specific project may vary greatly depending on actual crash characteristics and the local conditions. Finally, the benefit computed is only for the prevention of a crash involving at least one heavy vehicle. Some strategies will also be effective at preventing crashes that will not always include a heavy vehicle (i.e., four-cable median barrier preventing a passenger car from crossing the median and hitting another passenger car), but the benefit from preventing these crashes has not been captured. This choice has resulted in B/C ratios that are sometime below one. In these instances, if all crashes were considered, it is likely that the B/C ratio would be above one.
7.1 Effectiveness Spreadsheet
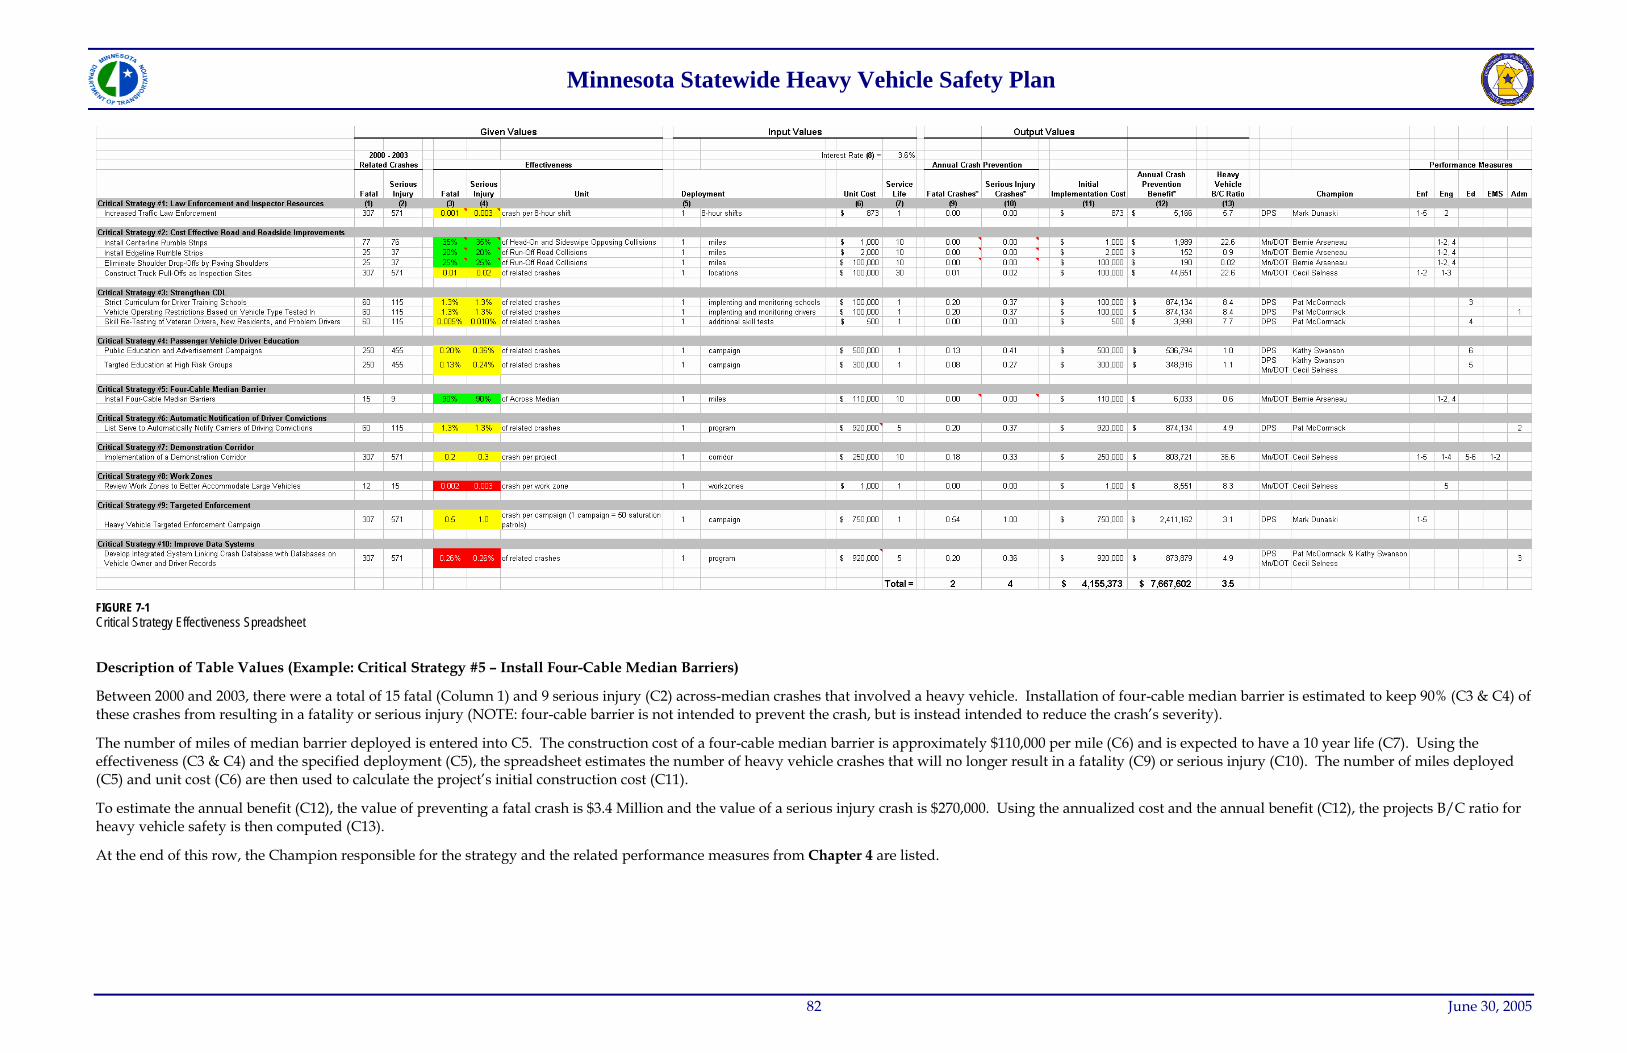
005
Minnesota Statewide Heavy Vehicle Safety Plan
Between 2000 and 2003, there were a total of 15 fatal (Column 1) and 9 serious injury (C2) across-median crashes that involved a heavy vehicle. Installation of four-cable median barrier is estimated to keep 90% (C3 & C4) of these crashes from resulting in a fatality or serious injury (NOTE: four-cable barrier is not intended to prevent the crash, but is instead intended to reduce the crash’s severity).
82 June 30, 2
To estimate the annual benefit (C12), the value of preventing a fatal crash is $3.4 Million and the value of a serious injury crash is $270,000. Using the annualized cost and the annual benefit (C12), the projects B/C ratio for heavy vehicle safety is then computed (C13).
The number of miles of median barrier deployed is entered into C5. The construction cost of a four-cable median barrier is approximately $110,000 per mile (C6) and is expected to have a 10 year life (C7). Using the effectiveness (C3 & C4) and the specified deployment (C5), the spreadsheet estimates the number of heavy vehicle crashes that will no longer result in a fatality (C9) or serious injury (C10). The number of miles deployed (C5) and unit cost (C6) are then used to calculate the project’s initial construction cost (C11).
At the end of this row, the Champion responsible for the strategy and the related performance measures from Chapter 4 are listed.
Description of Table Values (Example: Critical Strategy #5 – Install Four-Cable Median Barriers)
FIGURE 7-1 Critical Strategy Effectiveness Spreadsheet

Minnesota Statewide Heavy Vehicle Safety Plan
TABLE 7-1 Effectiveness Spreadsheet Field Descriptions
Field Field Description
1 Related Crashes: Fatal
The number of fatal heavy vehicle crashes (Minnesota, 2000-2003) that are potentially correctable by the action listed under the critical strategy.
2 Related Crashes: Serious Injury
The number of serious injury crashes (Minnesota, 2000-2003) that are potentially correctable by the action listed under the critical strategy.
3 Effectiveness: Fatal
Reports the effectiveness of the listed strategy at reducing the number of fatal crashes. The effectiveness may be listed as a percentage (i.e., prevent 50% of related crashes for every mile treated) or as an absolute number (i.e., prevent 1 crash for every program developed). The source for the effectiveness is presented in the cell’s comment.
Given Values
4 Effectiveness: Serious Injury
Reports the effectiveness of the listed strategy at reducing the number of serious injury crashes. The effectiveness may be listed as a percentage (i.e., prevent 50% of related crashes for every mile treated) or as an absolute number (i.e., prevent 1 crash for every program developed). The source for the effectiveness is presented in the cell’s comment.
5 Deployment The level of deployment for each strategy.
6 Unit Cost
Represents an estimate of the implementation cost (i.e., salary, construction cost, related maintenance, etc.) for the life of the project. The original values are general estimates that may be refined if more detailed information is available.
7 Service Life The estimated life of the project related to the unit cost.
Input Values
8 Interest Rate The interest rate use to amortize the implementation costs into an annual value over the life of the project. The default interest rate selected was the current interest rate used by Mn/DOT in benefit-cost analysis.
9 Annual Crash Prevention: Fatal Crashes
The estimated number of fatal heavy vehicle crashes prevented using the amount of deployment and the effectiveness for fatal crashes. Most values are computed using only the number of fatal crashes (1), effectiveness (3), and deployment (5). However, some strategies also include a constant value when calculating the crash prevention. This constant value represents a crash density (i.e., crash per mile) that was determined using the entire state trunk highway system. Even though this constant is based on the state highway system, it is a conservative value because crashes were averaged across the entire system. Therefore it is also likely relevant for use on local roadways.
10
Annual Crash Prevention: Serious Injury Crashes
The estimated number of serious injury heavy vehicle crashes prevented using the amount of deployment and the effectiveness for serious injury crashes. Most values are computed using only the number of serious injury crashes (1), effectiveness (3), and deployment (5). However, some strategies also include a constant value when calculating the crash prevention. This constant value represents a crash density (i.e., crash per mile) that was determined using the entire state trunk highway system. Even though this constant is based on the state highway system, it is a conservative value because crashes were averaged across the entire system. Therefore it is also likely relevant for use on local roadways.
Output Values
11 Initial Implementation Cost
The initial cost for implementation based upon the unit cost and the amount of deployment. The cost has not been converted into a yearly cost.
83 June 30, 2005
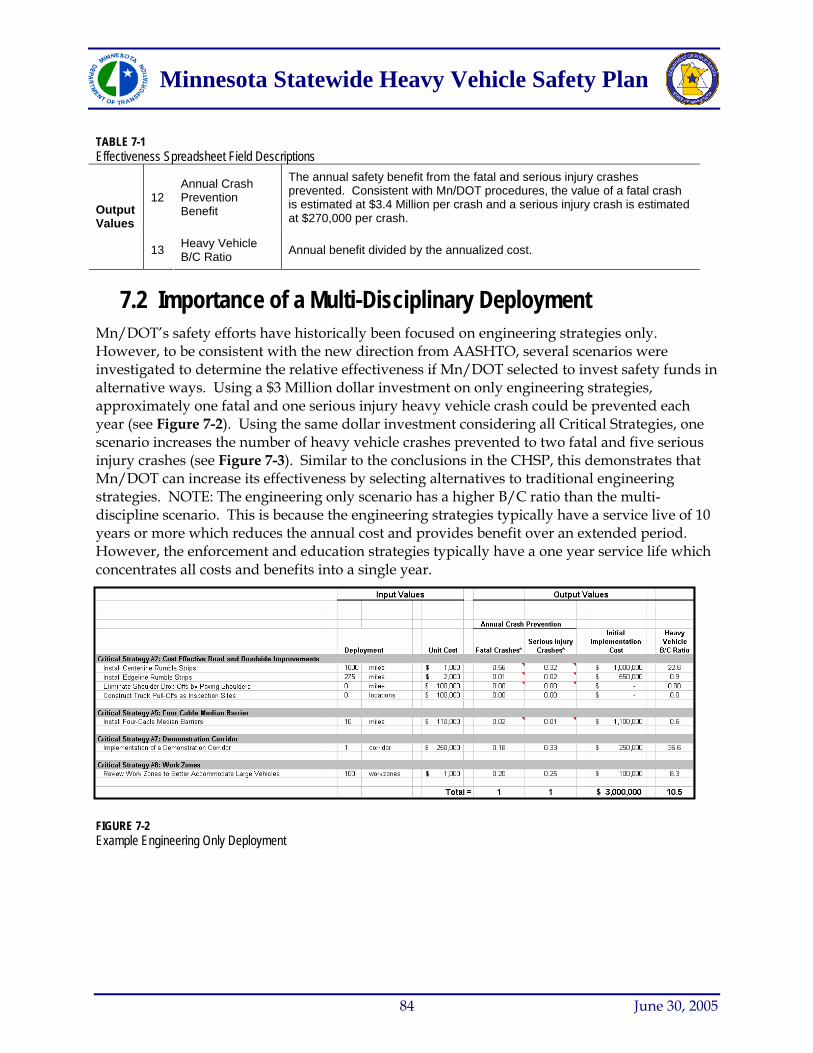
Minnesota Statewide Heavy Vehicle Safety Plan
TABLE 7-1 Effectiveness Spreadsheet Field Descriptions
12 Annual Crash Prevention Benefit
The annual safety benefit from the fatal and serious injury crashes prevented. Consistent with Mn/DOT procedures, the value of a fatal crash is estimated at $3.4 Million per crash and a serious injury crash is estimated at $270,000 per crash.
Output Values
13 Heavy Vehicle B/C Ratio Annual benefit divided by the annualized cost.
7.2 Importance of a Multi-Disciplinary Deployment Mn/DOT’s safety efforts have historically been focused on engineering strategies only. However, to be consistent with the new direction from AASHTO, several scenarios were investigated to determine the relative effectiveness if Mn/DOT selected to invest safety funds in alternative ways. Using a $3 Million dollar investment on only engineering strategies, approximately one fatal and one serious injury heavy vehicle crash could be prevented each year (see Figure 7-2). Using the same dollar investment considering all Critical Strategies, one scenario increases the number of heavy vehicle crashes prevented to two fatal and five serious injury crashes (see Figure 7-3). Similar to the conclusions in the CHSP, this demonstrates that Mn/DOT can increase its effectiveness by selecting alternatives to traditional engineering strategies. NOTE: The engineering only scenario has a higher B/C ratio than the multi-discipline scenario. This is because the engineering strategies typically have a service live of 10 years or more which reduces the annual cost and provides benefit over an extended period. However, the enforcement and education strategies typically have a one year service life which concentrates all costs and benefits into a single year.
FIGURE 7-2 Example Engineering Only Deployment
84 June 30, 2005
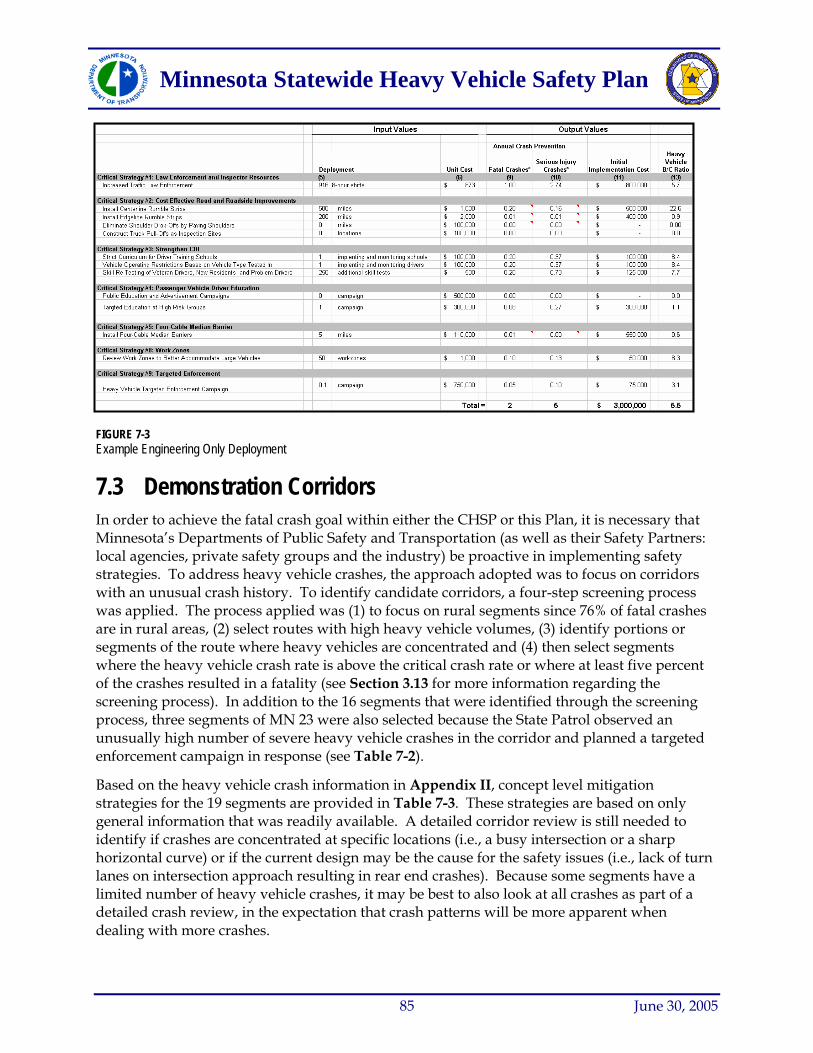
Minnesota Statewide Heavy Vehicle Safety Plan
FIGURE 7-3 Example Engineering Only Deployment
7.3 Demonstration Corridors In order to achieve the fatal crash goal within either the CHSP or this Plan, it is necessary that Minnesota’s Departments of Public Safety and Transportation (as well as their Safety Partners: local agencies, private safety groups and the industry) be proactive in implementing safety strategies. To address heavy vehicle crashes, the approach adopted was to focus on corridors with an unusual crash history. To identify candidate corridors, a four-step screening process was applied. The process applied was (1) to focus on rural segments since 76% of fatal crashes are in rural areas, (2) select routes with high heavy vehicle volumes, (3) identify portions or segments of the route where heavy vehicles are concentrated and (4) then select segments where the heavy vehicle crash rate is above the critical crash rate or where at least five percent of the crashes resulted in a fatality (see Section 3.13 for more information regarding the screening process). In addition to the 16 segments that were identified through the screening process, three segments of MN 23 were also selected because the State Patrol observed an unusually high number of severe heavy vehicle crashes in the corridor and planned a targeted enforcement campaign in response (see Table 7-2).
Based on the heavy vehicle crash information in Appendix II, concept level mitigation strategies for the 19 segments are provided in Table 7-3. These strategies are based on only general information that was readily available. A detailed corridor review is still needed to identify if crashes are concentrated at specific locations (i.e., a busy intersection or a sharp horizontal curve) or if the current design may be the cause for the safety issues (i.e., lack of turn lanes on intersection approach resulting in rear end crashes). Because some segments have a limited number of heavy vehicle crashes, it may be best to also look at all crashes as part of a detailed crash review, in the expectation that crash patterns will be more apparent when dealing with more crashes.
85 June 30, 2005
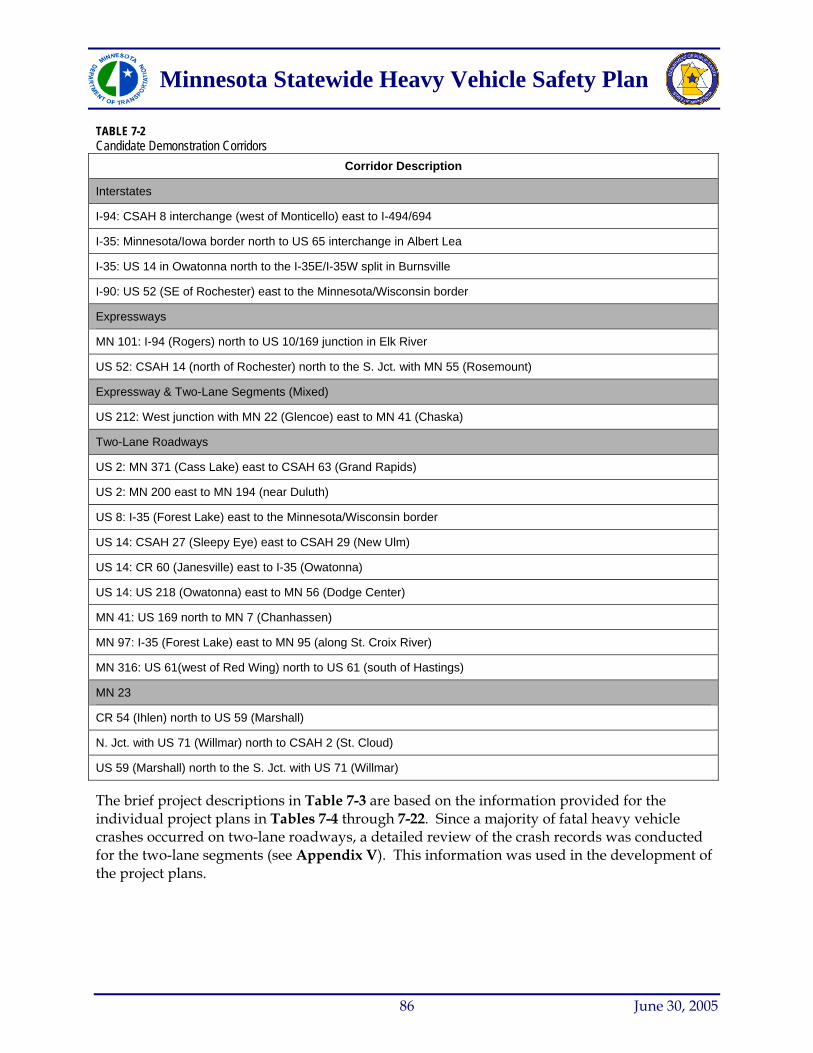
Minnesota Statewide Heavy Vehicle Safety Plan
TABLE 7-2 Candidate Demonstration Corridors
Corridor Description
Interstates
I-94: CSAH 8 interchange (west of Monticello) east to I-494/694
I-35: Minnesota/Iowa border north to US 65 interchange in Albert Lea
I-35: US 14 in Owatonna north to the I-35E/I-35W split in Burnsville
I-90: US 52 (SE of Rochester) east to the Minnesota/Wisconsin border
Expressways
MN 101: I-94 (Rogers) north to US 10/169 junction in Elk River
US 52: CSAH 14 (north of Rochester) north to the S. Jct. with MN 55 (Rosemount)
Expressway & Two-Lane Segments (Mixed)
US 212: West junction with MN 22 (Glencoe) east to MN 41 (Chaska)
Two-Lane Roadways
US 2: MN 371 (Cass Lake) east to CSAH 63 (Grand Rapids)
US 2: MN 200 east to MN 194 (near Duluth)
US 8: I-35 (Forest Lake) east to the Minnesota/Wisconsin border
US 14: CSAH 27 (Sleepy Eye) east to CSAH 29 (New Ulm)
US 14: CR 60 (Janesville) east to I-35 (Owatonna)
US 14: US 218 (Owatonna) east to MN 56 (Dodge Center)
MN 41: US 169 north to MN 7 (Chanhassen)
MN 97: I-35 (Forest Lake) east to MN 95 (along St. Croix River)
MN 316: US 61(west of Red Wing) north to US 61 (south of Hastings)
MN 23
CR 54 (Ihlen) north to US 59 (Marshall)
N. Jct. with US 71 (Willmar) north to CSAH 2 (St. Cloud)
US 59 (Marshall) north to the S. Jct. with US 71 (Willmar)
The brief project descriptions in Table 7-3 are based on the information provided for the individual project plans in Tables 7-4 through 7-22. Since a majority of fatal heavy vehicle crashes occurred on two-lane roadways, a detailed review of the crash records was conducted for the two-lane segments (see Appendix V). This information was used in the development of the project plans.
86 June 30, 2005
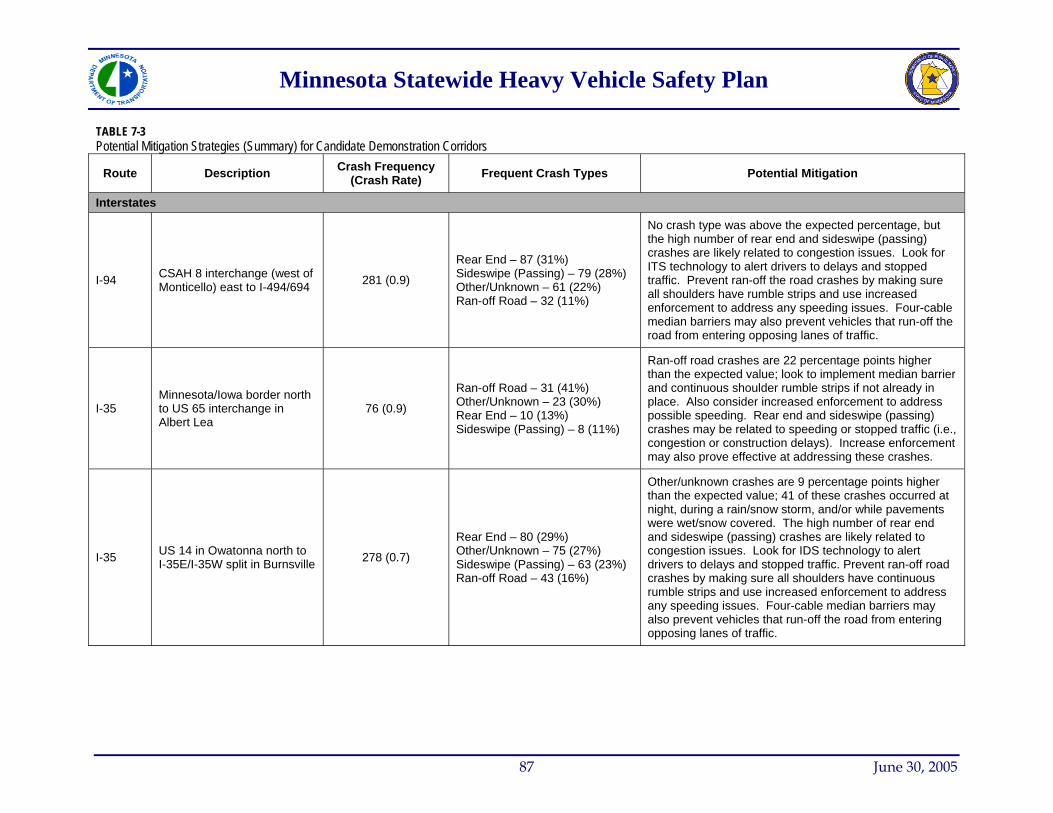
Minnesota Statewide Heavy Vehicle Safety Plan
TABLE 7-3 Potential Mitigation Strategies (Summary) for Candidate Demonstration Corridors
Route Description Crash Frequency (Crash Rate) Frequent Crash Types Potential Mitigation
Interstates
I-94 CSAH 8 interchange (west of Monticello) east to I-494/694 281 (0.9)
Rear End – 87 (31%) Sideswipe (Passing) – 79 (28%) Other/Unknown – 61 (22%) Ran-off Road – 32 (11%)
No crash type was above the expected percentage, but the high number of rear end and sideswipe (passing) crashes are likely related to congestion issues. Look for ITS technology to alert drivers to delays and stopped traffic. Prevent ran-off the road crashes by making sure all shoulders have rumble strips and use increased enforcement to address any speeding issues. Four-cable median barriers may also prevent vehicles that run-off the road from entering opposing lanes of traffic.
I-35 Minnesota/Iowa border north to US 65 interchange in Albert Lea
76 (0.9)
Ran-off Road – 31 (41%) Other/Unknown – 23 (30%) Rear End – 10 (13%) Sideswipe (Passing) – 8 (11%)
Ran-off road crashes are 22 percentage points higher than the expected value; look to implement median barrier and continuous shoulder rumble strips if not already in place. Also consider increased enforcement to address possible speeding. Rear end and sideswipe (passing) crashes may be related to speeding or stopped traffic (i.e., congestion or construction delays). Increase enforcement may also prove effective at addressing these crashes.
I-35 US 14 in Owatonna north to I-35E/I-35W split in Burnsville 278 (0.7)
Rear End – 80 (29%) Other/Unknown – 75 (27%) Sideswipe (Passing) – 63 (23%) Ran-off Road – 43 (16%)
Other/unknown crashes are 9 percentage points higher than the expected value; 41 of these crashes occurred at night, during a rain/snow storm, and/or while pavements were wet/snow covered. The high number of rear end and sideswipe (passing) crashes are likely related to congestion issues. Look for IDS technology to alert drivers to delays and stopped traffic. Prevent ran-off road crashes by making sure all shoulders have continuous rumble strips and use increased enforcement to address any speeding issues. Four-cable median barriers may also prevent vehicles that run-off the road from entering opposing lanes of traffic.
87 June 30, 2005
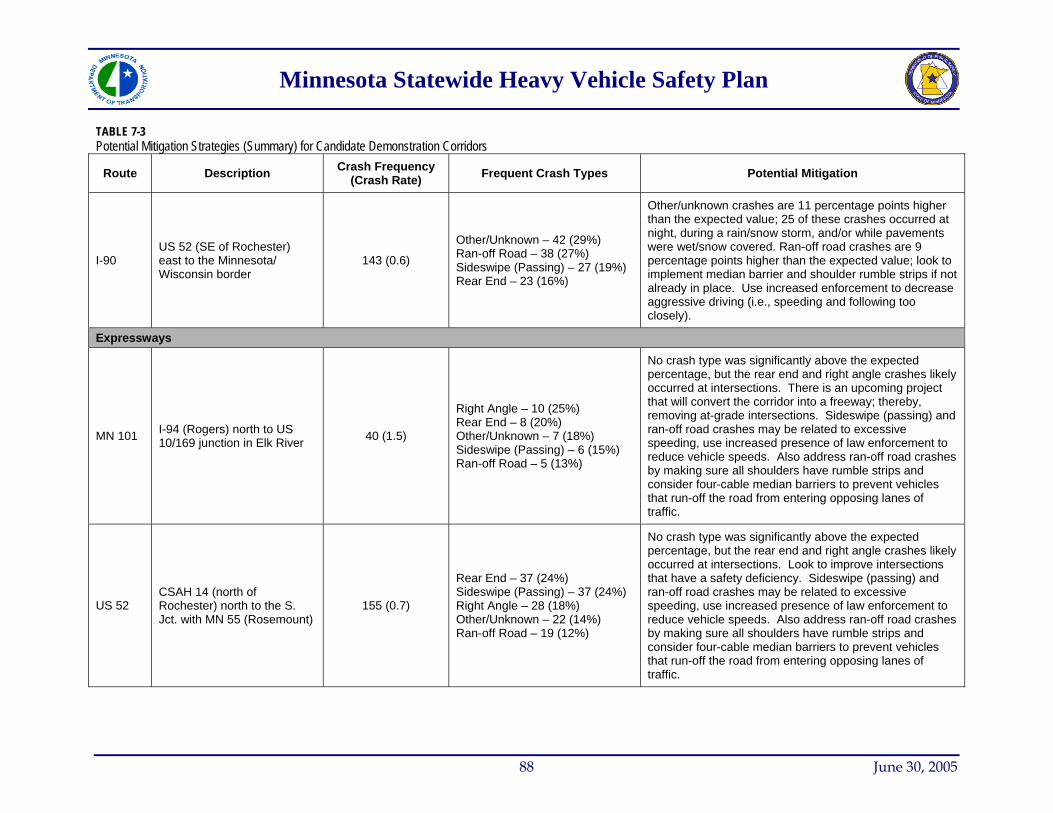
Minnesota Statewide Heavy Vehicle Safety Plan
TABLE 7-3 Potential Mitigation Strategies (Summary) for Candidate Demonstration Corridors
Route Description Crash Frequency (Crash Rate) Frequent Crash Types Potential Mitigation
I-90 US 52 (SE of Rochester) east to the Minnesota/ Wisconsin border
143 (0.6)
Other/Unknown – 42 (29%) Ran-off Road – 38 (27%) Sideswipe (Passing) – 27 (19%) Rear End – 23 (16%)
Other/unknown crashes are 11 percentage points higher than the expected value; 25 of these crashes occurred at night, during a rain/snow storm, and/or while pavements were wet/snow covered. Ran-off road crashes are 9 percentage points higher than the expected value; look to implement median barrier and shoulder rumble strips if not already in place. Use increased enforcement to decrease aggressive driving (i.e., speeding and following too closely).
Expressways
MN 101 I-94 (Rogers) north to US 10/169 junction in Elk River 40 (1.5)
Right Angle – 10 (25%) Rear End – 8 (20%) Other/Unknown – 7 (18%) Sideswipe (Passing) – 6 (15%) Ran-off Road – 5 (13%)
No crash type was significantly above the expected percentage, but the rear end and right angle crashes likely occurred at intersections. There is an upcoming project that will convert the corridor into a freeway; thereby, removing at-grade intersections. Sideswipe (passing) and ran-off road crashes may be related to excessive speeding, use increased presence of law enforcement to reduce vehicle speeds. Also address ran-off road crashes by making sure all shoulders have rumble strips and consider four-cable median barriers to prevent vehicles that run-off the road from entering opposing lanes of traffic.
US 52 CSAH 14 (north of Rochester) north to the S. Jct. with MN 55 (Rosemount)
155 (0.7)
Rear End – 37 (24%) Sideswipe (Passing) – 37 (24%) Right Angle – 28 (18%) Other/Unknown – 22 (14%) Ran-off Road – 19 (12%)
No crash type was significantly above the expected percentage, but the rear end and right angle crashes likely occurred at intersections. Look to improve intersections that have a safety deficiency. Sideswipe (passing) and ran-off road crashes may be related to excessive speeding, use increased presence of law enforcement to reduce vehicle speeds. Also address ran-off road crashes by making sure all shoulders have rumble strips and consider four-cable median barriers to prevent vehicles that run-off the road from entering opposing lanes of traffic.
88 June 30, 2005

Minnesota Statewide Heavy Vehicle Safety Plan
TABLE 7-3 Potential Mitigation Strategies (Summary) for Candidate Demonstration Corridors
Route Description Crash Frequency (Crash Rate) Frequent Crash Types Potential Mitigation
Expressway and Two-Lane Mix
US 212 W. Jct. with MN 22 (Glencoe) east to MN 41 (Chaska) 70 (0.8)
Sideswipe (Passing) – 18 (26%) Rear End – 16 (23%) Right Angle – 13 (19%) Ran-off Road – 9 (13%)
No crash type was significantly above the expected percentage. Since 43 of the crashes were at an intersection, look to improve individual intersections that may have a safety deficiency.
Two-Lane Roadways
US 2 MN 371 (Cass Lake) east to CSAH 63 (Grand Rapids) 31 (0.5)
Right Angle – 8 (26%) Rear End – 7 (23%) Sideswipe (Passing) – 6 (19%) Ran-off Road – 4 (13%) Other/Unknown – 3 (10%)
Right angle and rear end crashes (intersection crashes) are slightly above expected values. Look to improve intersections that have safety deficiencies. Sideswipe (passing) crashes are 9 percentage points above the expected, these along with ran-off road crashes could be linked to aggressive driving, use increased presence of law enforcement to reduce vehicle speeds. Also address ran-off road crashes by making sure all shoulders have rumble strips.
US 2 MN 200 east to MN 194 (near Duluth) 16 (0.5)
Other/Unknown – 4 (25%) Right Angle – 3 (19%) Left Turn – 3 (19%) Ran-off Road – 3 (19%)
Left turn crashes are 16 percentage points above the expected values. For left turn and right angle crashes, look to improve intersections with safety deficiencies. Consider edgeline rumble strips and increased enforcement to address ran-off road crashes.
US 8 I-35 (Forest Lake) east to the Minnesota/Wisconsin border 40 (1.3)
Rear End – 16 (40%) Right Angle – 8 (20%) Other/Unknown – 7 (18%) Sideswipe (Opposing) – 4 (10%)
Rear end crashes are 20 percentage points above the expected value (likely at signalized intersections). For the rear end and right angle crashes, look to improve intersections that have safety deficiencies. Sideswipe (opposing) crashes are possibly related to vehicles attempting to pass or simply crossing the centerline. Increase law enforcement to reduce vehicle speeds and make sure centerline rumble strips are placed in appropriate places.
89 June 30, 2005
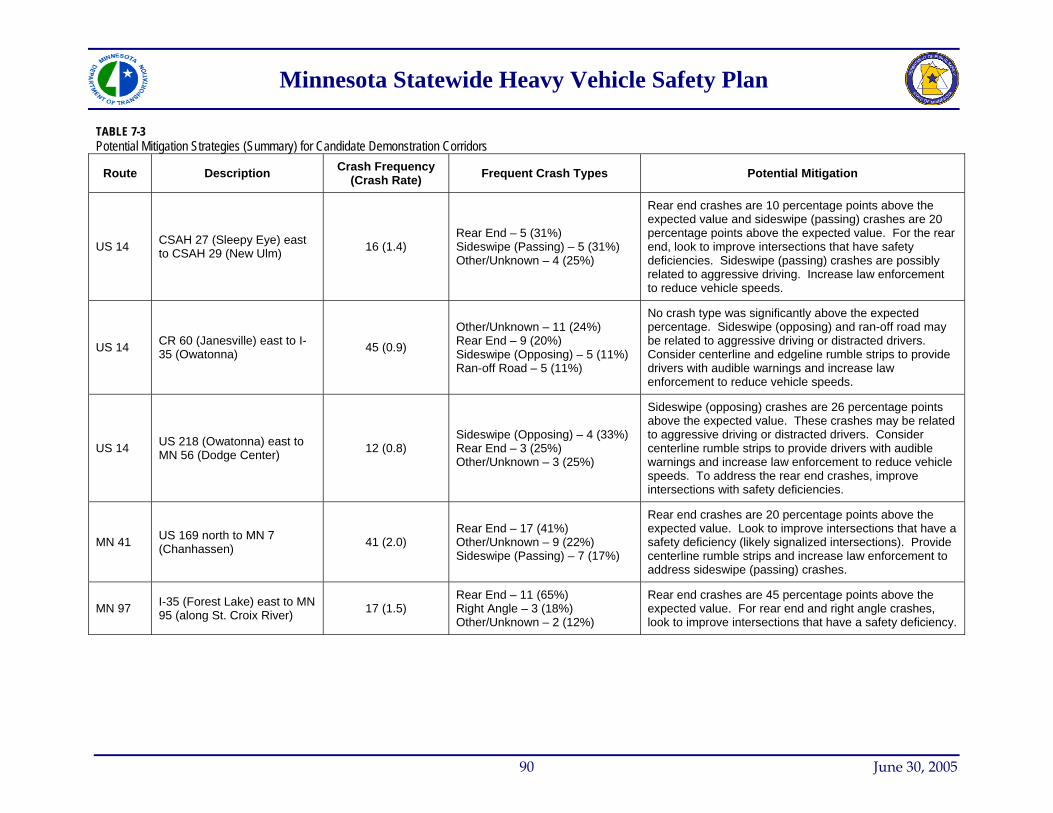
Minnesota Statewide Heavy Vehicle Safety Plan
TABLE 7-3 Potential Mitigation Strategies (Summary) for Candidate Demonstration Corridors
Route Description Crash Frequency (Crash Rate) Frequent Crash Types Potential Mitigation
US 14 CSAH 27 (Sleepy Eye) east to CSAH 29 (New Ulm) 16 (1.4)
Rear End – 5 (31%) Sideswipe (Passing) – 5 (31%) Other/Unknown – 4 (25%)
Rear end crashes are 10 percentage points above the expected value and sideswipe (passing) crashes are 20 percentage points above the expected value. For the rear end, look to improve intersections that have safety deficiencies. Sideswipe (passing) crashes are possibly related to aggressive driving. Increase law enforcement to reduce vehicle speeds.
US 14 CR 60 (Janesville) east to I-35 (Owatonna) 45 (0.9)
Other/Unknown – 11 (24%) Rear End – 9 (20%) Sideswipe (Opposing) – 5 (11%) Ran-off Road – 5 (11%)
No crash type was significantly above the expected percentage. Sideswipe (opposing) and ran-off road may be related to aggressive driving or distracted drivers. Consider centerline and edgeline rumble strips to provide drivers with audible warnings and increase law enforcement to reduce vehicle speeds.
US 14 US 218 (Owatonna) east to MN 56 (Dodge Center) 12 (0.8)
Sideswipe (Opposing) – 4 (33%) Rear End – 3 (25%) Other/Unknown – 3 (25%)
Sideswipe (opposing) crashes are 26 percentage points above the expected value. These crashes may be related to aggressive driving or distracted drivers. Consider centerline rumble strips to provide drivers with audible warnings and increase law enforcement to reduce vehicle speeds. To address the rear end crashes, improve intersections with safety deficiencies.
MN 41 US 169 north to MN 7 (Chanhassen) 41 (2.0)
Rear End – 17 (41%) Other/Unknown – 9 (22%) Sideswipe (Passing) – 7 (17%)
Rear end crashes are 20 percentage points above the expected value. Look to improve intersections that have a safety deficiency (likely signalized intersections). Provide centerline rumble strips and increase law enforcement to address sideswipe (passing) crashes.
MN 97 I-35 (Forest Lake) east to MN 95 (along St. Croix River) 17 (1.5)
Rear End – 11 (65%) Right Angle – 3 (18%) Other/Unknown – 2 (12%)
Rear end crashes are 45 percentage points above the expected value. For rear end and right angle crashes, look to improve intersections that have a safety deficiency.
90 June 30, 2005
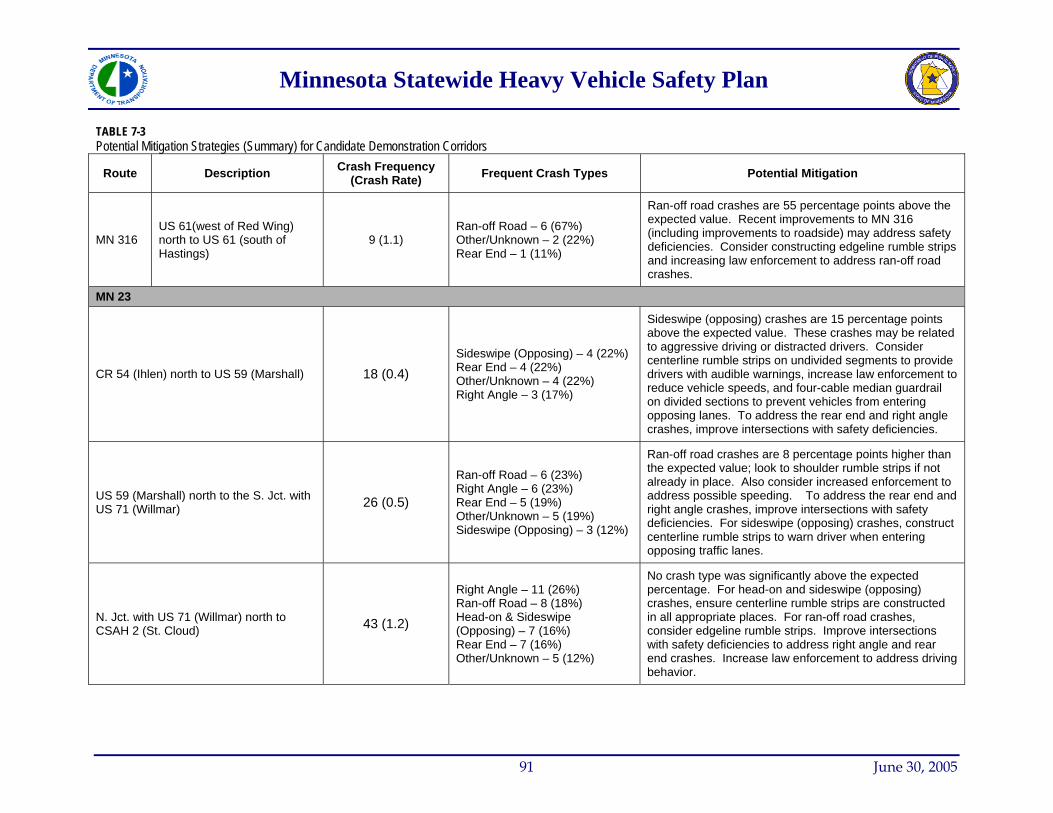
005
Minnesota Statewide Heavy Vehicle Safety Plan
91 June 30, 2
TABLE 7-3 Potential Mitigation Strategies (Summary) for Candidate Demonstration Corridors
Route Description Crash Frequency (Crash Rate) Frequent Crash Types Potential Mitigation
MN 316 US 61(west of Red Wing) north to US 61 (south of Hastings)
9 (1.1) Ran-off Road – 6 (67%) Other/Unknown – 2 (22%) Rear End – 1 (11%)
Ran-off road crashes are 55 percentage points above the expected value. Recent improvements to MN 316 (including improvements to roadside) may address safety deficiencies. Consider constructing edgeline rumble strips and increasing law enforcement to address ran-off road crashes.
MN 23
CR 54 (Ihlen) north to US 59 (Marshall) 18 (0.4) Sideswipe (Opposing) – 4 (22%) Rear End – 4 (22%) Other/Unknown – 4 (22%) Right Angle – 3 (17%)
Sideswipe (opposing) crashes are 15 percentage points above the expected value. These crashes may be related to aggressive driving or distracted drivers. Consider centerline rumble strips on undivided segments to provide drivers with audible warnings, increase law enforcement to reduce vehicle speeds, and four-cable median guardrail on divided sections to prevent vehicles from entering opposing lanes. To address the rear end and right angle crashes, improve intersections with safety deficiencies.
US 59 (Marshall) north to the S. Jct. with US 71 (Willmar) 26 (0.5)
Ran-off Road – 6 (23%) Right Angle – 6 (23%) Rear End – 5 (19%) Other/Unknown – 5 (19%) Sideswipe (Opposing) – 3 (12%)
Ran-off road crashes are 8 percentage points higher than the expected value; look to shoulder rumble strips if not already in place. Also consider increased enforcement to address possible speeding. To address the rear end and right angle crashes, improve intersections with safety deficiencies. For sideswipe (opposing) crashes, construct centerline rumble strips to warn driver when entering opposing traffic lanes.
N. Jct. with US 71 (Willmar) north to CSAH 2 (St. Cloud) 43 (1.2)
Right Angle – 11 (26%) Ran-off Road – 8 (18%) Head-on & Sideswipe (Opposing) – 7 (16%) Rear End – 7 (16%) Other/Unknown – 5 (12%)
No crash type was significantly above the expected percentage. For head-on and sideswipe (opposing) crashes, ensure centerline rumble strips are constructed in all appropriate places. For ran-off road crashes, consider edgeline rumble strips. Improve intersections with safety deficiencies to address right angle and rear end crashes. Increase law enforcement to address driving behavior.
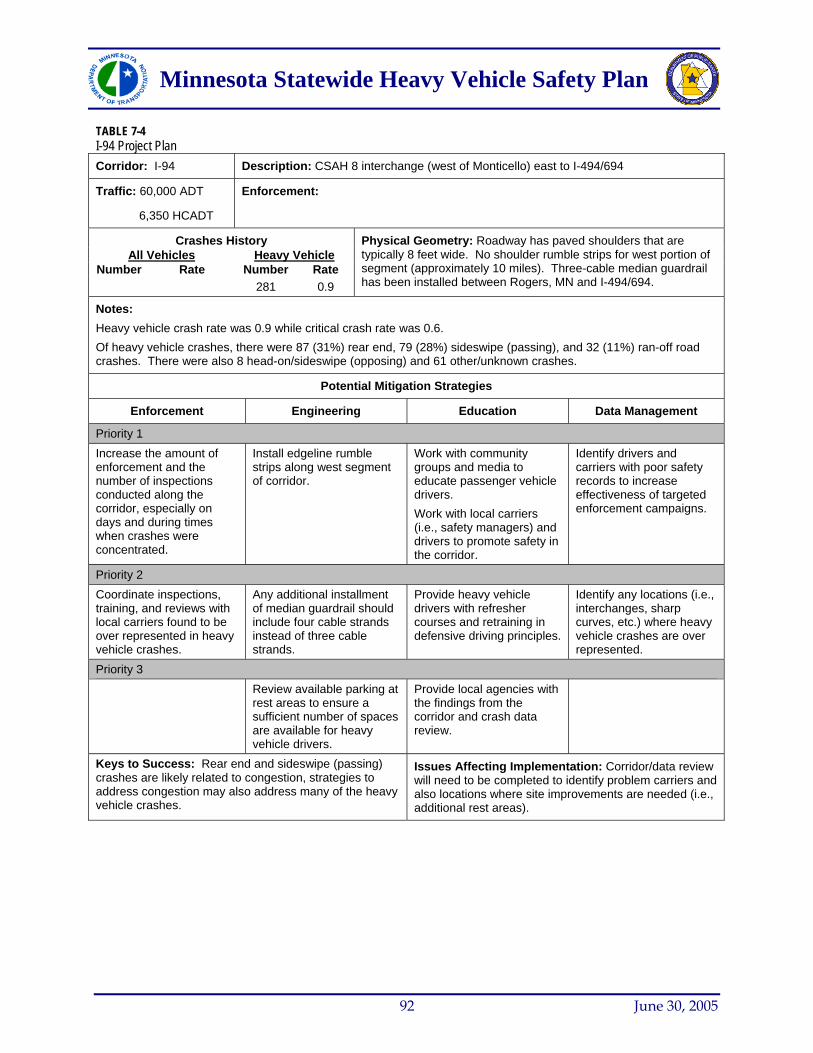
Minnesota Statewide Heavy Vehicle Safety Plan
TABLE 7-4 I-94 Project Plan
Corridor: I-94 Description: CSAH 8 interchange (west of Monticello) east to I-494/694
Traffic: 60,000 ADT
6,350 HCADT
Enforcement:
Crashes History All Vehicles Heavy Vehicle
Number Rate Number Rate 281 0.9
Physical Geometry: Roadway has paved shoulders that are typically 8 feet wide. No shoulder rumble strips for west portion of segment (approximately 10 miles). Three-cable median guardrail has been installed between Rogers, MN and I-494/694.
Notes: Heavy vehicle crash rate was 0.9 while critical crash rate was 0.6. Of heavy vehicle crashes, there were 87 (31%) rear end, 79 (28%) sideswipe (passing), and 32 (11%) ran-off road crashes. There were also 8 head-on/sideswipe (opposing) and 61 other/unknown crashes.
Potential Mitigation Strategies
Enforcement Engineering Education Data Management
Priority 1 Increase the amount of enforcement and the number of inspections conducted along the corridor, especially on days and during times when crashes were concentrated.
Install edgeline rumble strips along west segment of corridor.
Work with community groups and media to educate passenger vehicle drivers. Work with local carriers (i.e., safety managers) and drivers to promote safety in the corridor.
Identify drivers and carriers with poor safety records to increase effectiveness of targeted enforcement campaigns.
Priority 2 Coordinate inspections, training, and reviews with local carriers found to be over represented in heavy vehicle crashes.
Any additional installment of median guardrail should include four cable strands instead of three cable strands.
Provide heavy vehicle drivers with refresher courses and retraining in defensive driving principles.
Identify any locations (i.e., interchanges, sharp curves, etc.) where heavy vehicle crashes are over represented.
Priority 3 Review available parking at
rest areas to ensure a sufficient number of spaces are available for heavy vehicle drivers.
Provide local agencies with the findings from the corridor and crash data review.
Keys to Success: Rear end and sideswipe (passing) crashes are likely related to congestion, strategies to address congestion may also address many of the heavy vehicle crashes.
Issues Affecting Implementation: Corridor/data review will need to be completed to identify problem carriers and also locations where site improvements are needed (i.e., additional rest areas).
92 June 30, 2005
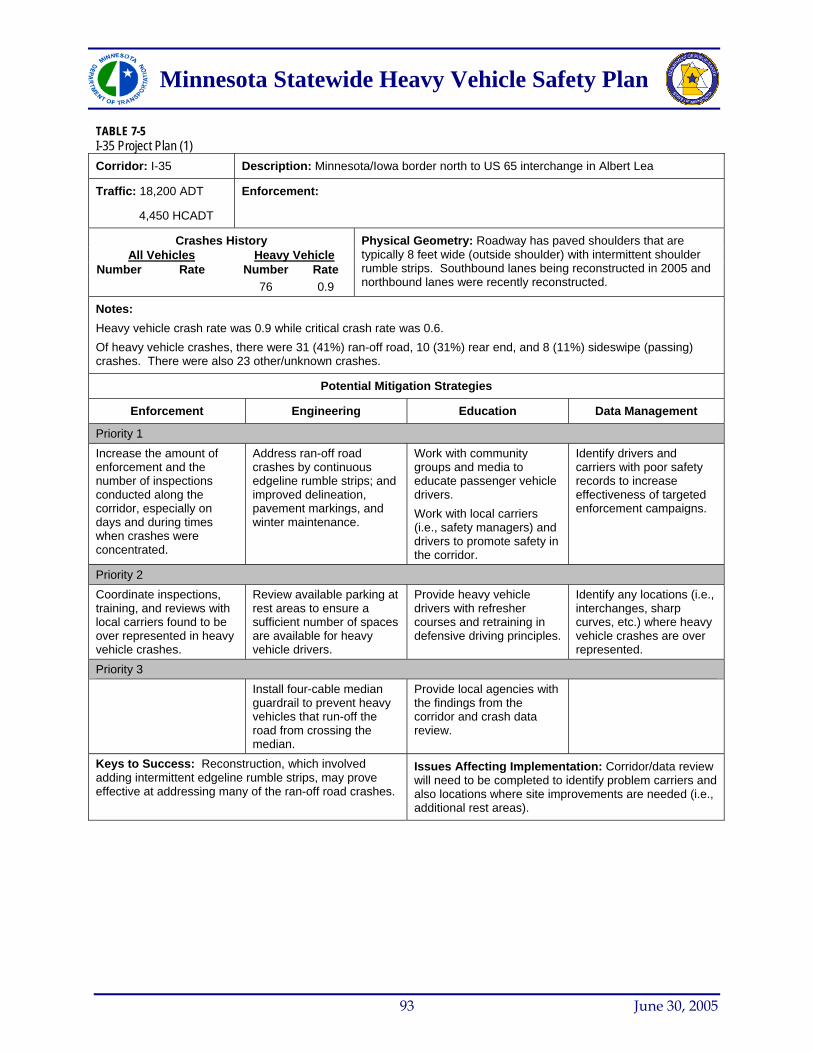
Minnesota Statewide Heavy Vehicle Safety Plan
TABLE 7-5 I-35 Project Plan (1)
Corridor: I-35 Description: Minnesota/Iowa border north to US 65 interchange in Albert Lea
Traffic: 18,200 ADT
4,450 HCADT
Enforcement:
Crashes History All Vehicles Heavy Vehicle
Number Rate Number Rate 76 0.9
Physical Geometry: Roadway has paved shoulders that are typically 8 feet wide (outside shoulder) with intermittent shoulder rumble strips. Southbound lanes being reconstructed in 2005 and northbound lanes were recently reconstructed.
Notes: Heavy vehicle crash rate was 0.9 while critical crash rate was 0.6. Of heavy vehicle crashes, there were 31 (41%) ran-off road, 10 (31%) rear end, and 8 (11%) sideswipe (passing) crashes. There were also 23 other/unknown crashes.
Potential Mitigation Strategies
Enforcement Engineering Education Data Management
Priority 1 Increase the amount of enforcement and the number of inspections conducted along the corridor, especially on days and during times when crashes were concentrated.
Address ran-off road crashes by continuous edgeline rumble strips; and improved delineation, pavement markings, and winter maintenance.
Work with community groups and media to educate passenger vehicle drivers. Work with local carriers (i.e., safety managers) and drivers to promote safety in the corridor.
Identify drivers and carriers with poor safety records to increase effectiveness of targeted enforcement campaigns.
Priority 2 Coordinate inspections, training, and reviews with local carriers found to be over represented in heavy vehicle crashes.
Review available parking at rest areas to ensure a sufficient number of spaces are available for heavy vehicle drivers.
Provide heavy vehicle drivers with refresher courses and retraining in defensive driving principles.
Identify any locations (i.e., interchanges, sharp curves, etc.) where heavy vehicle crashes are over represented.
Priority 3 Install four-cable median
guardrail to prevent heavy vehicles that run-off the road from crossing the median.
Provide local agencies with the findings from the corridor and crash data review.
Keys to Success: Reconstruction, which involved adding intermittent edgeline rumble strips, may prove effective at addressing many of the ran-off road crashes.
Issues Affecting Implementation: Corridor/data review will need to be completed to identify problem carriers and also locations where site improvements are needed (i.e., additional rest areas).
93 June 30, 2005

Minnesota Statewide Heavy Vehicle Safety Plan
TABLE 7-6 I-35 Project Plan (2)
Corridor: I-35 Description: US 14 in Owatonna north to the I-35E/I-35W split in Burnsville
Traffic: 44,000 ADT
5,430 HCADT
Enforcement:
Crashes History All Vehicles Heavy Vehicle
Number Rate Number Rate 278 0.7
Physical Geometry: Roadway has paved shoulders that are typically 8 feet wide. Shoulder rumble strips are in place for only the southern 10 miles of the segment.
Notes: Heavy vehicle crash rate was 0.7 while critical crash rate was 0.6. Of heavy vehicle crashes, there were 80 (29%) rear end, 63 (23%) sideswipe (passing), and 43 (16%) ran-off road crashes. There were also 7 head-on and 75 other/unknown crashes. Of the other/unknown crashes, 41 of these crashes occurred at night, during a rain/snow storm, and/or while pavements were wet/snow covered.
Potential Mitigation Strategies
Enforcement Engineering Education Data Management
Priority 1 Increase the amount of enforcement and the number of inspections conducted along the corridor, especially on days and during times when crashes were concentrated.
Address ran-off road crashes by continuous edgeline rumble strips. Address other/unknown crashes using improved delineation, pavement markings, and winter maintenance.
Work with community groups and media to educate passenger vehicle drivers. Work with local carriers (i.e., safety managers) and drivers to promote safety in the corridor.
Identify drivers and carriers with poor safety records to increase effectiveness of targeted enforcement campaigns.
Priority 2 Coordinate inspections, training, and reviews with local carriers found to be over represented in heavy vehicle crashes.
Install four-cable median guardrail to prevent heavy vehicles that run-off the road from crossing the median.
Provide heavy vehicle drivers with refresher courses and retraining in defensive driving principles.
Identify any locations (i.e., interchanges, sharp curves, etc.) where heavy vehicle crashes are over represented.
Priority 3 Review available parking at
rest areas to ensure a sufficient number of spaces are available for heavy vehicle drivers.
Provide local agencies with the findings from the corridor and crash data review.
Keys to Success: Rear end and sideswipe (passing) crashes are likely related to congestion, strategies to address congestion may also address many of the heavy vehicle crashes.
Issues Affecting Implementation: Corridor/data review will need to be completed to identify problem carriers and also locations where site improvements are needed (i.e., additional rest areas).
94 June 30, 2005
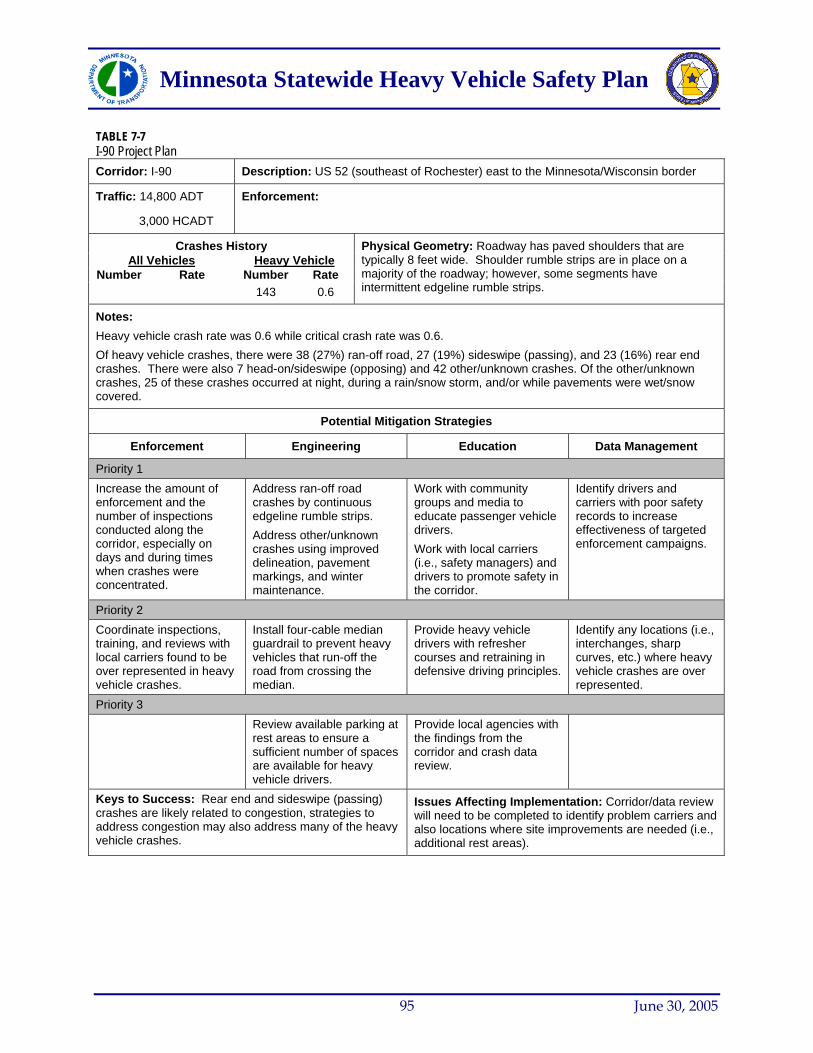
Minnesota Statewide Heavy Vehicle Safety Plan
TABLE 7-7 I-90 Project Plan
Corridor: I-90 Description: US 52 (southeast of Rochester) east to the Minnesota/Wisconsin border
Traffic: 14,800 ADT
3,000 HCADT
Enforcement:
Crashes History All Vehicles Heavy Vehicle
Number Rate Number Rate 143 0.6
Physical Geometry: Roadway has paved shoulders that are typically 8 feet wide. Shoulder rumble strips are in place on a majority of the roadway; however, some segments have intermittent edgeline rumble strips.
Notes: Heavy vehicle crash rate was 0.6 while critical crash rate was 0.6. Of heavy vehicle crashes, there were 38 (27%) ran-off road, 27 (19%) sideswipe (passing), and 23 (16%) rear end crashes. There were also 7 head-on/sideswipe (opposing) and 42 other/unknown crashes. Of the other/unknown crashes, 25 of these crashes occurred at night, during a rain/snow storm, and/or while pavements were wet/snow covered.
Potential Mitigation Strategies
Enforcement Engineering Education Data Management
Priority 1 Increase the amount of enforcement and the number of inspections conducted along the corridor, especially on days and during times when crashes were concentrated.
Address ran-off road crashes by continuous edgeline rumble strips. Address other/unknown crashes using improved delineation, pavement markings, and winter maintenance.
Work with community groups and media to educate passenger vehicle drivers. Work with local carriers (i.e., safety managers) and drivers to promote safety in the corridor.
Identify drivers and carriers with poor safety records to increase effectiveness of targeted enforcement campaigns.
Priority 2 Coordinate inspections, training, and reviews with local carriers found to be over represented in heavy vehicle crashes.
Install four-cable median guardrail to prevent heavy vehicles that run-off the road from crossing the median.
Provide heavy vehicle drivers with refresher courses and retraining in defensive driving principles.
Identify any locations (i.e., interchanges, sharp curves, etc.) where heavy vehicle crashes are over represented.
Priority 3 Review available parking at
rest areas to ensure a sufficient number of spaces are available for heavy vehicle drivers.
Provide local agencies with the findings from the corridor and crash data review.
Keys to Success: Rear end and sideswipe (passing) crashes are likely related to congestion, strategies to address congestion may also address many of the heavy vehicle crashes.
Issues Affecting Implementation: Corridor/data review will need to be completed to identify problem carriers and also locations where site improvements are needed (i.e., additional rest areas).
95 June 30, 2005
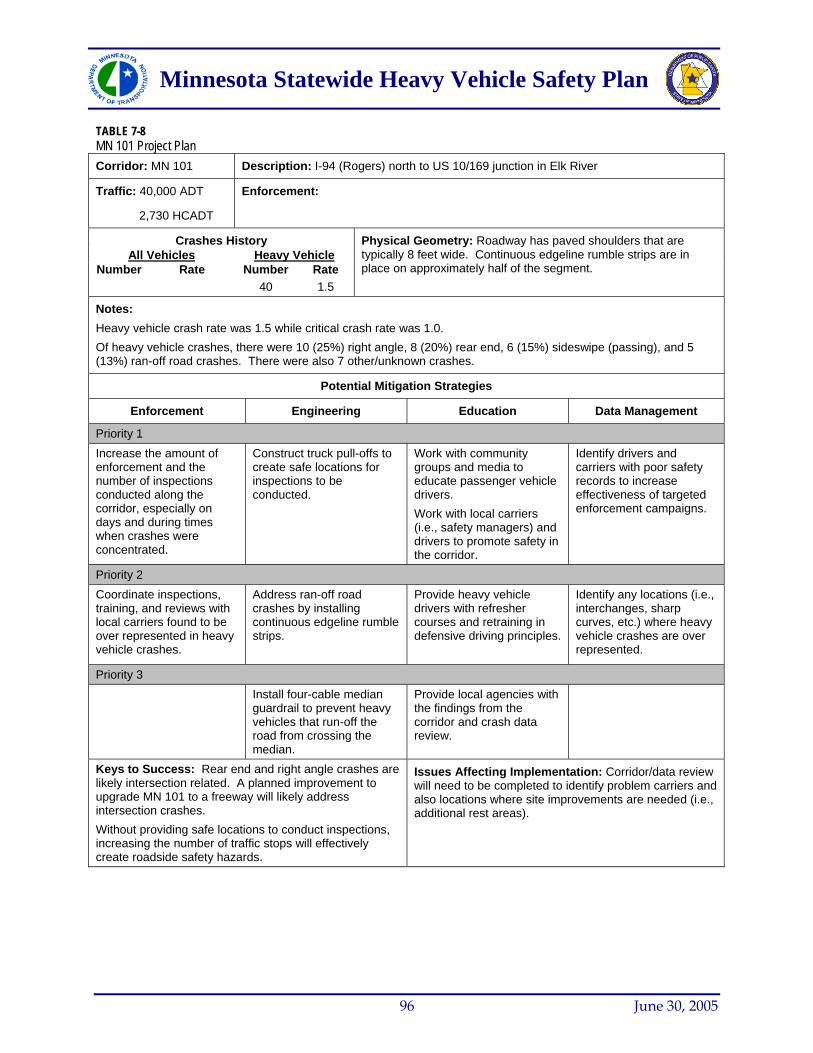
Minnesota Statewide Heavy Vehicle Safety Plan
TABLE 7-8 MN 101 Project Plan
Corridor: MN 101 Description: I-94 (Rogers) north to US 10/169 junction in Elk River
Traffic: 40,000 ADT
2,730 HCADT
Enforcement:
Crashes History All Vehicles Heavy Vehicle
Number Rate Number Rate 40 1.5
Physical Geometry: Roadway has paved shoulders that are typically 8 feet wide. Continuous edgeline rumble strips are in place on approximately half of the segment.
Notes: Heavy vehicle crash rate was 1.5 while critical crash rate was 1.0. Of heavy vehicle crashes, there were 10 (25%) right angle, 8 (20%) rear end, 6 (15%) sideswipe (passing), and 5 (13%) ran-off road crashes. There were also 7 other/unknown crashes.
Potential Mitigation Strategies
Enforcement Engineering Education Data Management
Priority 1 Increase the amount of enforcement and the number of inspections conducted along the corridor, especially on days and during times when crashes were concentrated.
Construct truck pull-offs to create safe locations for inspections to be conducted.
Work with community groups and media to educate passenger vehicle drivers. Work with local carriers (i.e., safety managers) and drivers to promote safety in the corridor.
Identify drivers and carriers with poor safety records to increase effectiveness of targeted enforcement campaigns.
Priority 2 Coordinate inspections, training, and reviews with local carriers found to be over represented in heavy vehicle crashes.
Address ran-off road crashes by installing continuous edgeline rumble strips.
Provide heavy vehicle drivers with refresher courses and retraining in defensive driving principles.
Identify any locations (i.e., interchanges, sharp curves, etc.) where heavy vehicle crashes are over represented.
Priority 3 Install four-cable median
guardrail to prevent heavy vehicles that run-off the road from crossing the median.
Provide local agencies with the findings from the corridor and crash data review.
Keys to Success: Rear end and right angle crashes are likely intersection related. A planned improvement to upgrade MN 101 to a freeway will likely address intersection crashes. Without providing safe locations to conduct inspections, increasing the number of traffic stops will effectively create roadside safety hazards.
Issues Affecting Implementation: Corridor/data review will need to be completed to identify problem carriers and also locations where site improvements are needed (i.e., additional rest areas).
96 June 30, 2005

Minnesota Statewide Heavy Vehicle Safety Plan
TABLE 7-9 US 52 Project Plan
Corridor: US 52 Description: CSAH 14 (north of Rochester) north to the S. Jct. with MN 55 (Rosemount)
Traffic: 22,900 ADT
2,620 HCADT
Enforcement:
Crashes History All Vehicles Heavy Vehicle
Number Rate Number Rate 155 0.7
Physical Geometry: Includes paved shoulders that are typically 8 feet wide. Edgeline rumble strips have been installed along a portion of the segment.
Notes: There were 10 fatal heavy vehicle crashes, which was 6% of all heavy vehicle crashes. Of heavy vehicle crashes, there were 37 (24%) rear end, 37 (24%) sideswipe (passing), 28 (18%) right angle, and 19 (12%) ran-off road crashes. There were also 22 other/unknown and 8 head-on/sideswipe (opposing) crashes.
Potential Mitigation Strategies
Enforcement Engineering Education Data Management
Priority 1 Increase the amount of enforcement and the number of inspections conducted along the corridor, especially on days and during times when crashes were concentrated.
Construct truck pull-offs to create safe locations for inspections to be conducted. Consider Michigan left-turn, or a device to assist with gap selection (i.e., dumb pole, IDS) to address right angle crashes.
Work with community groups and media to educate passenger vehicle drivers. Work with local carriers (i.e., safety managers) and drivers to promote safety in the corridor.
Identify drivers and carriers with poor safety records to increase effectiveness of targeted enforcement campaigns.
Priority 2 Coordinate inspections, training, and reviews with local carriers found to be over represented in heavy vehicle crashes.
Address ran-off road crashes by installing continuous edgeline rumble strips.
Provide heavy vehicle drivers with refresher courses and retraining in defensive driving principles.
Identify any locations (i.e., interchanges, sharp curves, etc.) where heavy vehicle crashes are over represented.
Priority 3 Install four-cable median
guardrail to prevent heavy vehicles that run-off the road from crossing the median.
Provide local agencies with the findings from the corridor and crash data review.
Keys to Success: Rear end and right angle crashes are likely intersection related. Some recent improvement (interchanges and overpasses) will likely address some of the intersection crashes. Without providing safe locations to conduct inspections, increasing the number of traffic stops will effectively create roadside safety hazards.
Issues Affecting Implementation: Corridor/data review will need to be completed to identify problem carriers and also locations where site improvements are needed (i.e., additional rest areas).
97 June 30, 2005
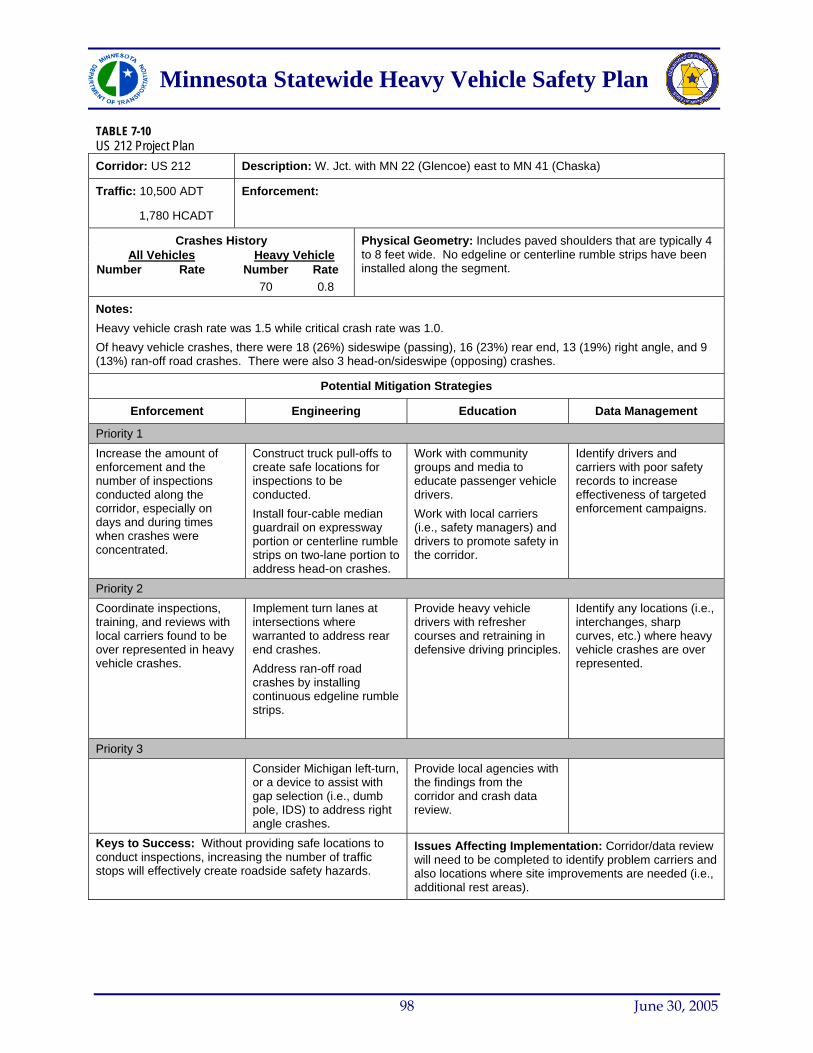
Minnesota Statewide Heavy Vehicle Safety Plan
TABLE 7-10 US 212 Project Plan
Corridor: US 212 Description: W. Jct. with MN 22 (Glencoe) east to MN 41 (Chaska)
Traffic: 10,500 ADT
1,780 HCADT
Enforcement:
Crashes History All Vehicles Heavy Vehicle
Number Rate Number Rate 70 0.8
Physical Geometry: Includes paved shoulders that are typically 4 to 8 feet wide. No edgeline or centerline rumble strips have been installed along the segment.
Notes: Heavy vehicle crash rate was 1.5 while critical crash rate was 1.0. Of heavy vehicle crashes, there were 18 (26%) sideswipe (passing), 16 (23%) rear end, 13 (19%) right angle, and 9 (13%) ran-off road crashes. There were also 3 head-on/sideswipe (opposing) crashes.
Potential Mitigation Strategies
Enforcement Engineering Education Data Management
Priority 1 Increase the amount of enforcement and the number of inspections conducted along the corridor, especially on days and during times when crashes were concentrated.
Construct truck pull-offs to create safe locations for inspections to be conducted. Install four-cable median guardrail on expressway portion or centerline rumble strips on two-lane portion to address head-on crashes.
Work with community groups and media to educate passenger vehicle drivers. Work with local carriers (i.e., safety managers) and drivers to promote safety in the corridor.
Identify drivers and carriers with poor safety records to increase effectiveness of targeted enforcement campaigns.
Priority 2 Coordinate inspections, training, and reviews with local carriers found to be over represented in heavy vehicle crashes.
Implement turn lanes at intersections where warranted to address rear end crashes. Address ran-off road crashes by installing continuous edgeline rumble strips.
Provide heavy vehicle drivers with refresher courses and retraining in defensive driving principles.
Identify any locations (i.e., interchanges, sharp curves, etc.) where heavy vehicle crashes are over represented.
Priority 3 Consider Michigan left-turn,
or a device to assist with gap selection (i.e., dumb pole, IDS) to address right angle crashes.
Provide local agencies with the findings from the corridor and crash data review.
Keys to Success: Without providing safe locations to conduct inspections, increasing the number of traffic stops will effectively create roadside safety hazards.
Issues Affecting Implementation: Corridor/data review will need to be completed to identify problem carriers and also locations where site improvements are needed (i.e., additional rest areas).
98 June 30, 2005
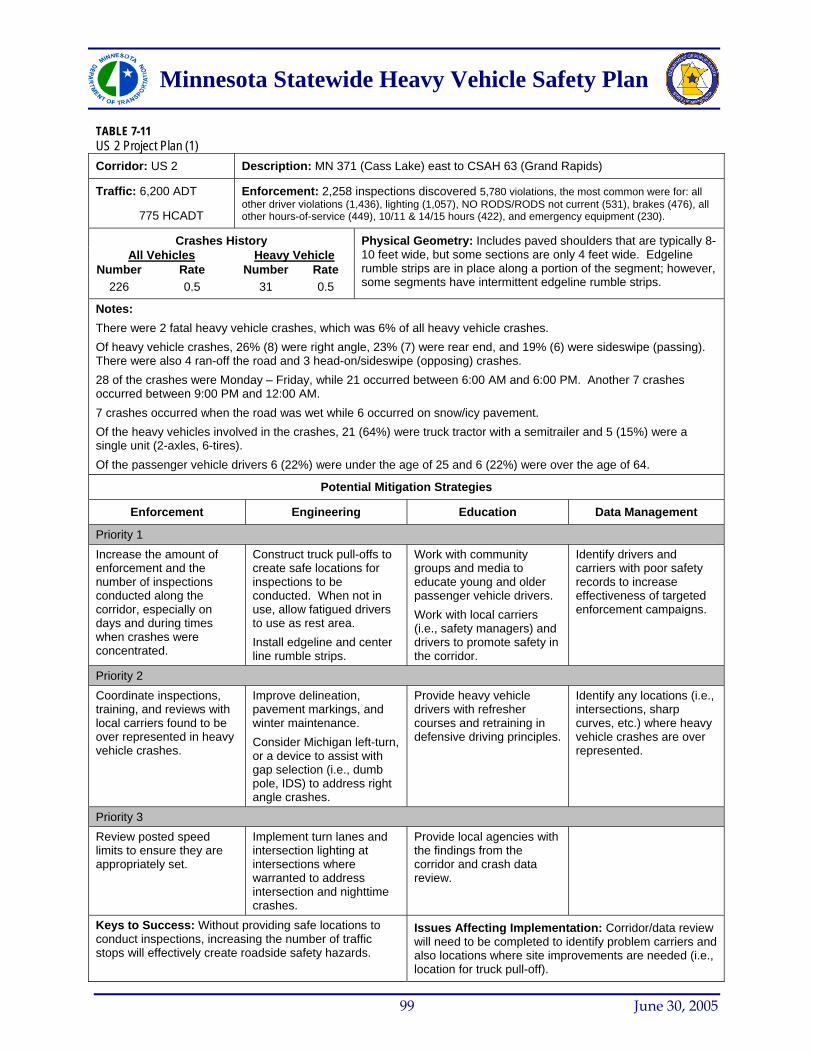
Minnesota Statewide Heavy Vehicle Safety Plan
TABLE 7-11 US 2 Project Plan (1)
Corridor: US 2 Description: MN 371 (Cass Lake) east to CSAH 63 (Grand Rapids)
Traffic: 6,200 ADT
775 HCADT
Enforcement: 2,258 inspections discovered 5,780 violations, the most common were for: all other driver violations (1,436), lighting (1,057), NO RODS/RODS not current (531), brakes (476), all other hours-of-service (449), 10/11 & 14/15 hours (422), and emergency equipment (230).
Crashes History All Vehicles Heavy Vehicle
Number Rate Number Rate 226 0.5 31 0.5
Physical Geometry: Includes paved shoulders that are typically 8-10 feet wide, but some sections are only 4 feet wide. Edgeline rumble strips are in place along a portion of the segment; however, some segments have intermittent edgeline rumble strips.
Notes: There were 2 fatal heavy vehicle crashes, which was 6% of all heavy vehicle crashes. Of heavy vehicle crashes, 26% (8) were right angle, 23% (7) were rear end, and 19% (6) were sideswipe (passing). There were also 4 ran-off the road and 3 head-on/sideswipe (opposing) crashes. 28 of the crashes were Monday – Friday, while 21 occurred between 6:00 AM and 6:00 PM. Another 7 crashes occurred between 9:00 PM and 12:00 AM. 7 crashes occurred when the road was wet while 6 occurred on snow/icy pavement. Of the heavy vehicles involved in the crashes, 21 (64%) were truck tractor with a semitrailer and 5 (15%) were a single unit (2-axles, 6-tires). Of the passenger vehicle drivers 6 (22%) were under the age of 25 and 6 (22%) were over the age of 64.
Potential Mitigation Strategies
Enforcement Engineering Education Data Management
Priority 1 Increase the amount of enforcement and the number of inspections conducted along the corridor, especially on days and during times when crashes were concentrated.
Construct truck pull-offs to create safe locations for inspections to be conducted. When not in use, allow fatigued drivers to use as rest area. Install edgeline and center line rumble strips.
Work with community groups and media to educate young and older passenger vehicle drivers. Work with local carriers (i.e., safety managers) and drivers to promote safety in the corridor.
Identify drivers and carriers with poor safety records to increase effectiveness of targeted enforcement campaigns.
Priority 2 Coordinate inspections, training, and reviews with local carriers found to be over represented in heavy vehicle crashes.
Improve delineation, pavement markings, and winter maintenance. Consider Michigan left-turn, or a device to assist with gap selection (i.e., dumb pole, IDS) to address right angle crashes.
Provide heavy vehicle drivers with refresher courses and retraining in defensive driving principles.
Identify any locations (i.e., intersections, sharp curves, etc.) where heavy vehicle crashes are over represented.
Priority 3 Review posted speed limits to ensure they are appropriately set.
Implement turn lanes and intersection lighting at intersections where warranted to address intersection and nighttime crashes.
Provide local agencies with the findings from the corridor and crash data review.
Keys to Success: Without providing safe locations to conduct inspections, increasing the number of traffic stops will effectively create roadside safety hazards.
Issues Affecting Implementation: Corridor/data review will need to be completed to identify problem carriers and also locations where site improvements are needed (i.e., location for truck pull-off).
99 June 30, 2005
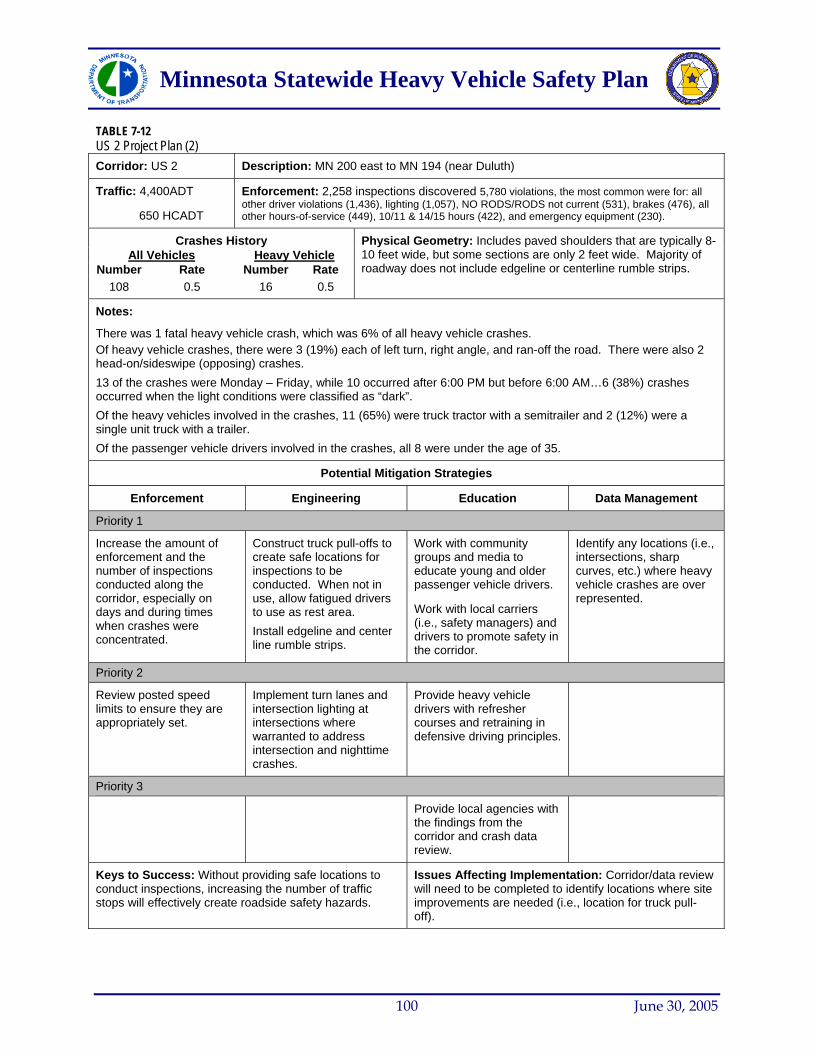
Minnesota Statewide Heavy Vehicle Safety Plan
TABLE 7-12 US 2 Project Plan (2)
Corridor: US 2 Description: MN 200 east to MN 194 (near Duluth)
Traffic: 4,400ADT
650 HCADT
Enforcement: 2,258 inspections discovered 5,780 violations, the most common were for: all other driver violations (1,436), lighting (1,057), NO RODS/RODS not current (531), brakes (476), all other hours-of-service (449), 10/11 & 14/15 hours (422), and emergency equipment (230).
Crashes History All Vehicles Heavy Vehicle
Number Rate Number Rate 108 0.5 16 0.5
Physical Geometry: Includes paved shoulders that are typically 8-10 feet wide, but some sections are only 2 feet wide. Majority of roadway does not include edgeline or centerline rumble strips.
Notes:
There was 1 fatal heavy vehicle crash, which was 6% of all heavy vehicle crashes. Of heavy vehicle crashes, there were 3 (19%) each of left turn, right angle, and ran-off the road. There were also 2 head-on/sideswipe (opposing) crashes. 13 of the crashes were Monday – Friday, while 10 occurred after 6:00 PM but before 6:00 AM…6 (38%) crashes occurred when the light conditions were classified as “dark”. Of the heavy vehicles involved in the crashes, 11 (65%) were truck tractor with a semitrailer and 2 (12%) were a single unit truck with a trailer. Of the passenger vehicle drivers involved in the crashes, all 8 were under the age of 35.
Potential Mitigation Strategies
Enforcement Engineering Education Data Management
Priority 1
Increase the amount of enforcement and the number of inspections conducted along the corridor, especially on days and during times when crashes were concentrated.
Construct truck pull-offs to create safe locations for inspections to be conducted. When not in use, allow fatigued drivers to use as rest area. Install edgeline and center line rumble strips.
Work with community groups and media to educate young and older passenger vehicle drivers.
Work with local carriers (i.e., safety managers) and drivers to promote safety in the corridor.
Identify any locations (i.e., intersections, sharp curves, etc.) where heavy vehicle crashes are over represented.
Priority 2
Review posted speed limits to ensure they are appropriately set.
Implement turn lanes and intersection lighting at intersections where warranted to address intersection and nighttime crashes.
Provide heavy vehicle drivers with refresher courses and retraining in defensive driving principles.
Priority 3
Provide local agencies with the findings from the corridor and crash data review.
Keys to Success: Without providing safe locations to conduct inspections, increasing the number of traffic stops will effectively create roadside safety hazards.
Issues Affecting Implementation: Corridor/data review will need to be completed to identify locations where site improvements are needed (i.e., location for truck pull-off).
100 June 30, 2005
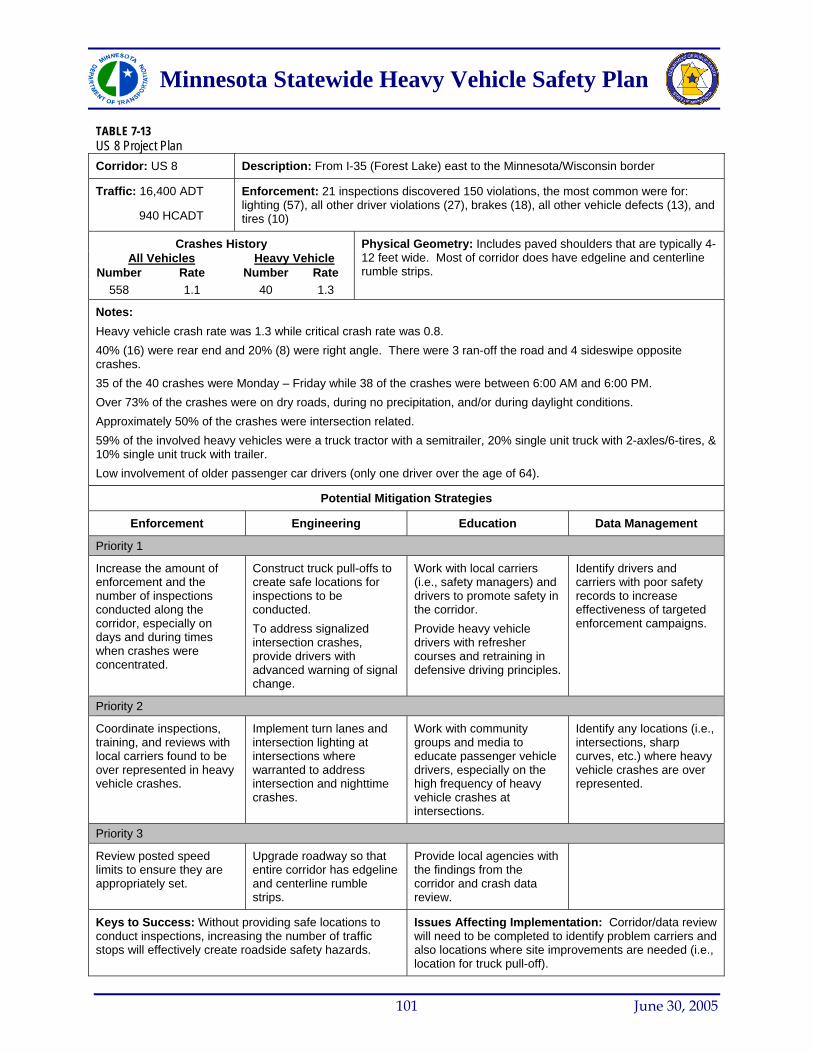
Minnesota Statewide Heavy Vehicle Safety Plan
TABLE 7-13 US 8 Project Plan
Corridor: US 8 Description: From I-35 (Forest Lake) east to the Minnesota/Wisconsin border
Traffic: 16,400 ADT
940 HCADT
Enforcement: 21 inspections discovered 150 violations, the most common were for: lighting (57), all other driver violations (27), brakes (18), all other vehicle defects (13), and tires (10)
Crashes History All Vehicles Heavy Vehicle
Number Rate Number Rate 558 1.1 40 1.3
Physical Geometry: Includes paved shoulders that are typically 4-12 feet wide. Most of corridor does have edgeline and centerline rumble strips.
Notes: Heavy vehicle crash rate was 1.3 while critical crash rate was 0.8. 40% (16) were rear end and 20% (8) were right angle. There were 3 ran-off the road and 4 sideswipe opposite crashes. 35 of the 40 crashes were Monday – Friday while 38 of the crashes were between 6:00 AM and 6:00 PM. Over 73% of the crashes were on dry roads, during no precipitation, and/or during daylight conditions. Approximately 50% of the crashes were intersection related. 59% of the involved heavy vehicles were a truck tractor with a semitrailer, 20% single unit truck with 2-axles/6-tires, & 10% single unit truck with trailer. Low involvement of older passenger car drivers (only one driver over the age of 64).
Potential Mitigation Strategies
Enforcement Engineering Education Data Management
Priority 1
Increase the amount of enforcement and the number of inspections conducted along the corridor, especially on days and during times when crashes were concentrated.
Construct truck pull-offs to create safe locations for inspections to be conducted. To address signalized intersection crashes, provide drivers with advanced warning of signal change.
Work with local carriers (i.e., safety managers) and drivers to promote safety in the corridor. Provide heavy vehicle drivers with refresher courses and retraining in defensive driving principles.
Identify drivers and carriers with poor safety records to increase effectiveness of targeted enforcement campaigns.
Priority 2
Coordinate inspections, training, and reviews with local carriers found to be over represented in heavy vehicle crashes.
Implement turn lanes and intersection lighting at intersections where warranted to address intersection and nighttime crashes.
Work with community groups and media to educate passenger vehicle drivers, especially on the high frequency of heavy vehicle crashes at intersections.
Identify any locations (i.e., intersections, sharp curves, etc.) where heavy vehicle crashes are over represented.
Priority 3
Review posted speed limits to ensure they are appropriately set.
Upgrade roadway so that entire corridor has edgeline and centerline rumble strips.
Provide local agencies with the findings from the corridor and crash data review.
Keys to Success: Without providing safe locations to conduct inspections, increasing the number of traffic stops will effectively create roadside safety hazards.
Issues Affecting Implementation: Corridor/data review will need to be completed to identify problem carriers and also locations where site improvements are needed (i.e., location for truck pull-off).
101 June 30, 2005
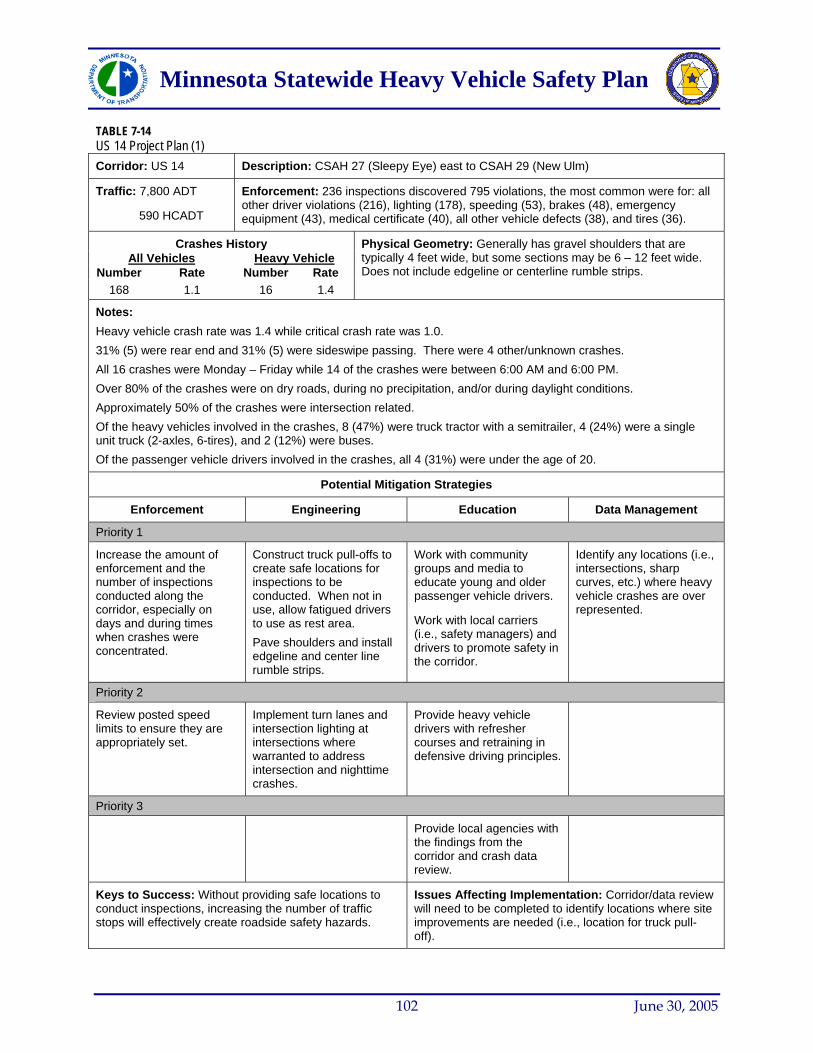
Minnesota Statewide Heavy Vehicle Safety Plan
TABLE 7-14 US 14 Project Plan (1)
Corridor: US 14 Description: CSAH 27 (Sleepy Eye) east to CSAH 29 (New Ulm)
Traffic: 7,800 ADT
590 HCADT
Enforcement: 236 inspections discovered 795 violations, the most common were for: all other driver violations (216), lighting (178), speeding (53), brakes (48), emergency equipment (43), medical certificate (40), all other vehicle defects (38), and tires (36).
Crashes History All Vehicles Heavy Vehicle
Number Rate Number Rate 168 1.1 16 1.4
Physical Geometry: Generally has gravel shoulders that are typically 4 feet wide, but some sections may be 6 – 12 feet wide. Does not include edgeline or centerline rumble strips.
Notes: Heavy vehicle crash rate was 1.4 while critical crash rate was 1.0. 31% (5) were rear end and 31% (5) were sideswipe passing. There were 4 other/unknown crashes. All 16 crashes were Monday – Friday while 14 of the crashes were between 6:00 AM and 6:00 PM. Over 80% of the crashes were on dry roads, during no precipitation, and/or during daylight conditions. Approximately 50% of the crashes were intersection related. Of the heavy vehicles involved in the crashes, 8 (47%) were truck tractor with a semitrailer, 4 (24%) were a single unit truck (2-axles, 6-tires), and 2 (12%) were buses. Of the passenger vehicle drivers involved in the crashes, all 4 (31%) were under the age of 20.
Potential Mitigation Strategies
Enforcement Engineering Education Data Management
Priority 1
Increase the amount of enforcement and the number of inspections conducted along the corridor, especially on days and during times when crashes were concentrated.
Construct truck pull-offs to create safe locations for inspections to be conducted. When not in use, allow fatigued drivers to use as rest area. Pave shoulders and install edgeline and center line rumble strips.
Work with community groups and media to educate young and older passenger vehicle drivers.
Work with local carriers (i.e., safety managers) and drivers to promote safety in the corridor.
Identify any locations (i.e., intersections, sharp curves, etc.) where heavy vehicle crashes are over represented.
Priority 2
Review posted speed limits to ensure they are appropriately set.
Implement turn lanes and intersection lighting at intersections where warranted to address intersection and nighttime crashes.
Provide heavy vehicle drivers with refresher courses and retraining in defensive driving principles.
Priority 3
Provide local agencies with the findings from the corridor and crash data review.
Keys to Success: Without providing safe locations to conduct inspections, increasing the number of traffic stops will effectively create roadside safety hazards.
Issues Affecting Implementation: Corridor/data review will need to be completed to identify locations where site improvements are needed (i.e., location for truck pull-off).
102 June 30, 2005
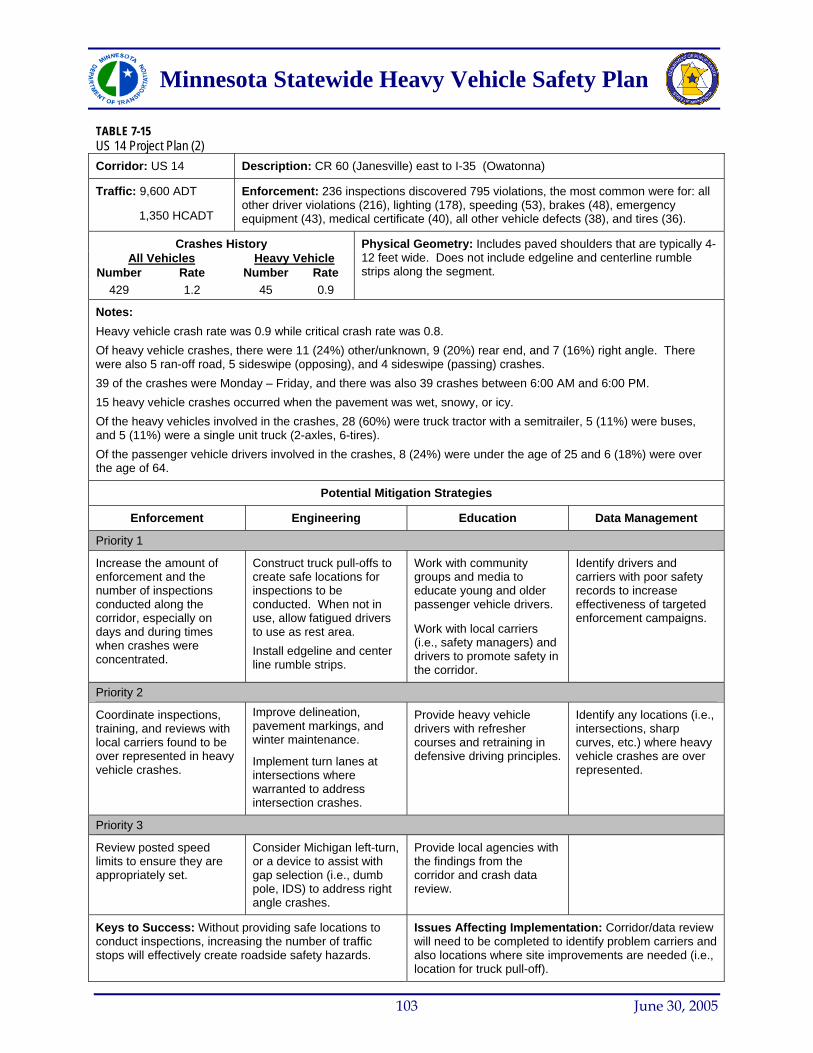
Minnesota Statewide Heavy Vehicle Safety Plan
TABLE 7-15 US 14 Project Plan (2)
Corridor: US 14 Description: CR 60 (Janesville) east to I-35 (Owatonna)
Traffic: 9,600 ADT
1,350 HCADT
Enforcement: 236 inspections discovered 795 violations, the most common were for: all other driver violations (216), lighting (178), speeding (53), brakes (48), emergency equipment (43), medical certificate (40), all other vehicle defects (38), and tires (36).
Crashes History All Vehicles Heavy Vehicle
Number Rate Number Rate 429 1.2 45 0.9
Physical Geometry: Includes paved shoulders that are typically 4-12 feet wide. Does not include edgeline and centerline rumble strips along the segment.
Notes: Heavy vehicle crash rate was 0.9 while critical crash rate was 0.8. Of heavy vehicle crashes, there were 11 (24%) other/unknown, 9 (20%) rear end, and 7 (16%) right angle. There were also 5 ran-off road, 5 sideswipe (opposing), and 4 sideswipe (passing) crashes. 39 of the crashes were Monday – Friday, and there was also 39 crashes between 6:00 AM and 6:00 PM. 15 heavy vehicle crashes occurred when the pavement was wet, snowy, or icy. Of the heavy vehicles involved in the crashes, 28 (60%) were truck tractor with a semitrailer, 5 (11%) were buses, and 5 (11%) were a single unit truck (2-axles, 6-tires). Of the passenger vehicle drivers involved in the crashes, 8 (24%) were under the age of 25 and 6 (18%) were over the age of 64.
Potential Mitigation Strategies
Enforcement Engineering Education Data Management
Priority 1
Increase the amount of enforcement and the number of inspections conducted along the corridor, especially on days and during times when crashes were concentrated.
Construct truck pull-offs to create safe locations for inspections to be conducted. When not in use, allow fatigued drivers to use as rest area. Install edgeline and center line rumble strips.
Work with community groups and media to educate young and older passenger vehicle drivers.
Work with local carriers (i.e., safety managers) and drivers to promote safety in the corridor.
Identify drivers and carriers with poor safety records to increase effectiveness of targeted enforcement campaigns.
Priority 2
Coordinate inspections, training, and reviews with local carriers found to be over represented in heavy vehicle crashes.
Improve delineation, pavement markings, and winter maintenance.
Implement turn lanes at intersections where warranted to address intersection crashes.
Provide heavy vehicle drivers with refresher courses and retraining in defensive driving principles.
Identify any locations (i.e., intersections, sharp curves, etc.) where heavy vehicle crashes are over represented.
Priority 3
Review posted speed limits to ensure they are appropriately set.
Consider Michigan left-turn, or a device to assist with gap selection (i.e., dumb pole, IDS) to address right angle crashes.
Provide local agencies with the findings from the corridor and crash data review.
Keys to Success: Without providing safe locations to conduct inspections, increasing the number of traffic stops will effectively create roadside safety hazards.
Issues Affecting Implementation: Corridor/data review will need to be completed to identify problem carriers and also locations where site improvements are needed (i.e., location for truck pull-off).
103 June 30, 2005
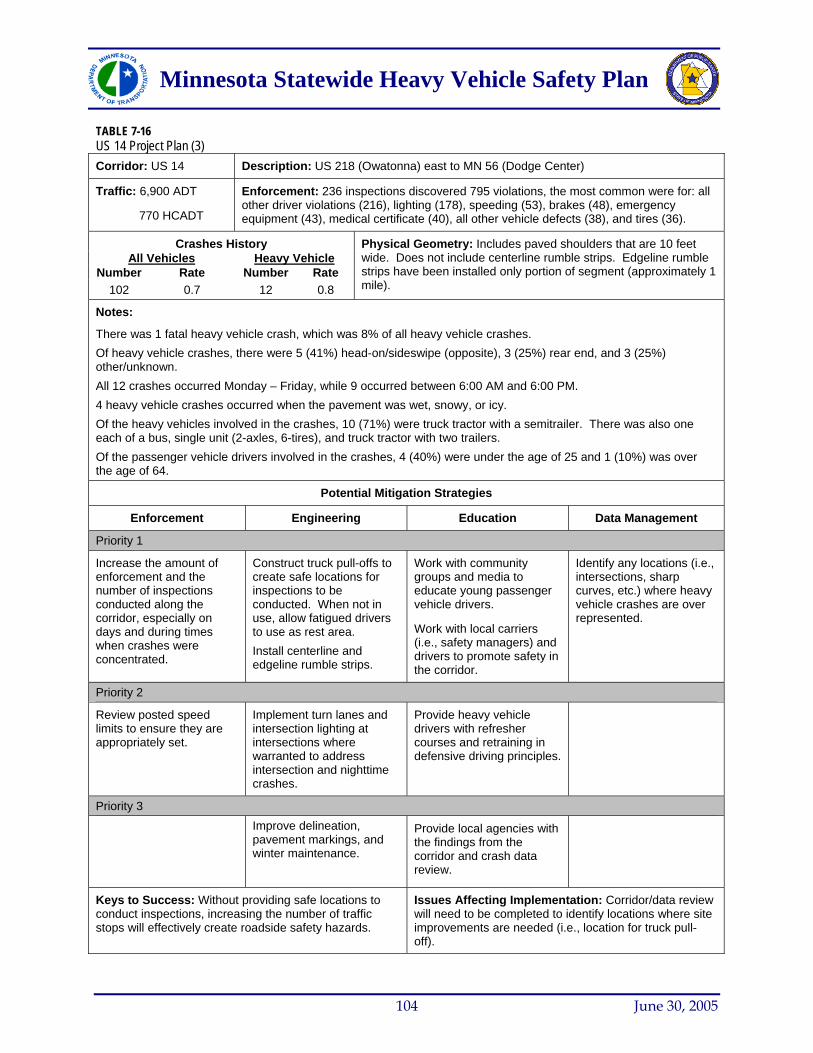
Minnesota Statewide Heavy Vehicle Safety Plan
TABLE 7-16 US 14 Project Plan (3)
Corridor: US 14 Description: US 218 (Owatonna) east to MN 56 (Dodge Center)
Traffic: 6,900 ADT
770 HCADT
Enforcement: 236 inspections discovered 795 violations, the most common were for: all other driver violations (216), lighting (178), speeding (53), brakes (48), emergency equipment (43), medical certificate (40), all other vehicle defects (38), and tires (36).
Crashes History All Vehicles Heavy Vehicle
Number Rate Number Rate 102 0.7 12 0.8
Physical Geometry: Includes paved shoulders that are 10 feet wide. Does not include centerline rumble strips. Edgeline rumble strips have been installed only portion of segment (approximately 1 mile).
Notes:
There was 1 fatal heavy vehicle crash, which was 8% of all heavy vehicle crashes. Of heavy vehicle crashes, there were 5 (41%) head-on/sideswipe (opposite), 3 (25%) rear end, and 3 (25%) other/unknown. All 12 crashes occurred Monday – Friday, while 9 occurred between 6:00 AM and 6:00 PM. 4 heavy vehicle crashes occurred when the pavement was wet, snowy, or icy. Of the heavy vehicles involved in the crashes, 10 (71%) were truck tractor with a semitrailer. There was also one each of a bus, single unit (2-axles, 6-tires), and truck tractor with two trailers. Of the passenger vehicle drivers involved in the crashes, 4 (40%) were under the age of 25 and 1 (10%) was over the age of 64.
Potential Mitigation Strategies
Enforcement Engineering Education Data Management
Priority 1
Increase the amount of enforcement and the number of inspections conducted along the corridor, especially on days and during times when crashes were concentrated.
Construct truck pull-offs to create safe locations for inspections to be conducted. When not in use, allow fatigued drivers to use as rest area. Install centerline and edgeline rumble strips.
Work with community groups and media to educate young passenger vehicle drivers.
Work with local carriers (i.e., safety managers) and drivers to promote safety in the corridor.
Identify any locations (i.e., intersections, sharp curves, etc.) where heavy vehicle crashes are over represented.
Priority 2
Review posted speed limits to ensure they are appropriately set.
Implement turn lanes and intersection lighting at intersections where warranted to address intersection and nighttime crashes.
Provide heavy vehicle drivers with refresher courses and retraining in defensive driving principles.
Priority 3
Improve delineation, pavement markings, and winter maintenance.
Provide local agencies with the findings from the corridor and crash data review.
Keys to Success: Without providing safe locations to conduct inspections, increasing the number of traffic stops will effectively create roadside safety hazards.
Issues Affecting Implementation: Corridor/data review will need to be completed to identify locations where site improvements are needed (i.e., location for truck pull-off).
104 June 30, 2005
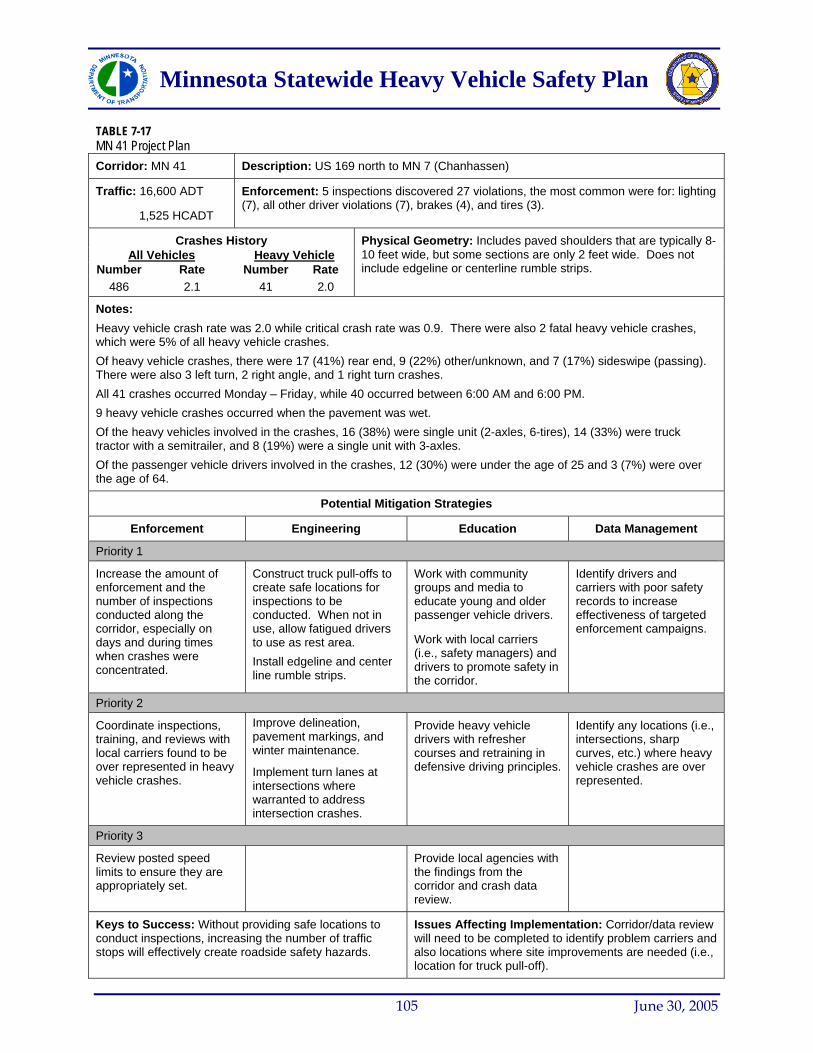
Minnesota Statewide Heavy Vehicle Safety Plan
TABLE 7-17 MN 41 Project Plan
Corridor: MN 41 Description: US 169 north to MN 7 (Chanhassen)
Traffic: 16,600 ADT Enforcement: 5 inspections discovered 27 violations, the most common were for: lighting (7), all other driver violations (7), brakes (4), and tires (3).
1,525 HCADT
Crashes History All Vehicles Heavy Vehicle
Number Rate Number Rate 486 2.1 41 2.0
Physical Geometry: Includes paved shoulders that are typically 8-10 feet wide, but some sections are only 2 feet wide. Does not include edgeline or centerline rumble strips.
Notes: Heavy vehicle crash rate was 2.0 while critical crash rate was 0.9. There were also 2 fatal heavy vehicle crashes, which were 5% of all heavy vehicle crashes. Of heavy vehicle crashes, there were 17 (41%) rear end, 9 (22%) other/unknown, and 7 (17%) sideswipe (passing). There were also 3 left turn, 2 right angle, and 1 right turn crashes. All 41 crashes occurred Monday – Friday, while 40 occurred between 6:00 AM and 6:00 PM. 9 heavy vehicle crashes occurred when the pavement was wet. Of the heavy vehicles involved in the crashes, 16 (38%) were single unit (2-axles, 6-tires), 14 (33%) were truck tractor with a semitrailer, and 8 (19%) were a single unit with 3-axles. Of the passenger vehicle drivers involved in the crashes, 12 (30%) were under the age of 25 and 3 (7%) were over the age of 64.
Potential Mitigation Strategies
Enforcement Engineering Education Data Management
Priority 1
Increase the amount of enforcement and the number of inspections conducted along the corridor, especially on days and during times when crashes were concentrated.
Construct truck pull-offs to create safe locations for inspections to be conducted. When not in use, allow fatigued drivers to use as rest area. Install edgeline and center line rumble strips.
Work with community groups and media to educate young and older passenger vehicle drivers.
Work with local carriers (i.e., safety managers) and drivers to promote safety in the corridor.
Identify drivers and carriers with poor safety records to increase effectiveness of targeted enforcement campaigns.
Priority 2
Coordinate inspections, training, and reviews with local carriers found to be over represented in heavy vehicle crashes.
Improve delineation, pavement markings, and winter maintenance.
Implement turn lanes at intersections where warranted to address intersection crashes.
Provide heavy vehicle drivers with refresher courses and retraining in defensive driving principles.
Identify any locations (i.e., intersections, sharp curves, etc.) where heavy vehicle crashes are over represented.
Priority 3
Review posted speed limits to ensure they are appropriately set.
Provide local agencies with the findings from the corridor and crash data review.
Keys to Success: Without providing safe locations to conduct inspections, increasing the number of traffic stops will effectively create roadside safety hazards.
Issues Affecting Implementation: Corridor/data review will need to be completed to identify problem carriers and also locations where site improvements are needed (i.e., location for truck pull-off).
105 June 30, 2005
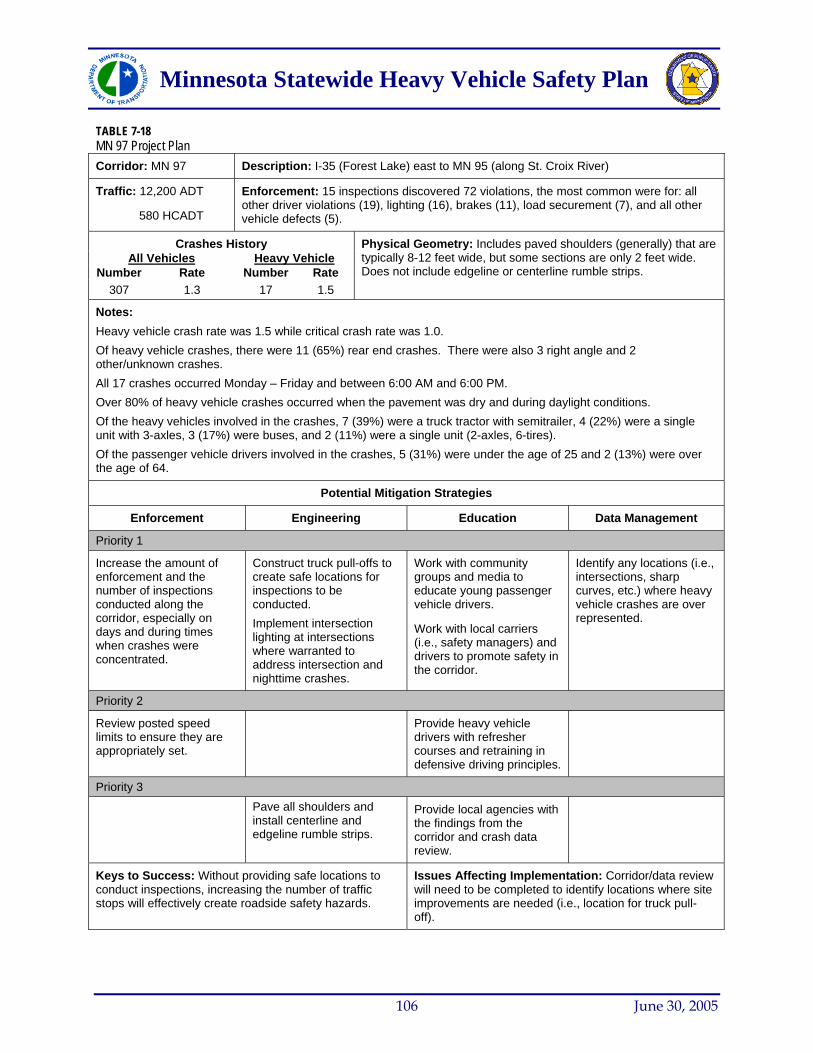
Minnesota Statewide Heavy Vehicle Safety Plan
TABLE 7-18 MN 97 Project Plan
Corridor: MN 97 Description: I-35 (Forest Lake) east to MN 95 (along St. Croix River)
Traffic: 12,200 ADT
580 HCADT
Enforcement: 15 inspections discovered 72 violations, the most common were for: all other driver violations (19), lighting (16), brakes (11), load securement (7), and all other vehicle defects (5).
Crashes History All Vehicles Heavy Vehicle
Number Rate Number Rate 307 1.3 17 1.5
Physical Geometry: Includes paved shoulders (generally) that are typically 8-12 feet wide, but some sections are only 2 feet wide. Does not include edgeline or centerline rumble strips.
Notes: Heavy vehicle crash rate was 1.5 while critical crash rate was 1.0. Of heavy vehicle crashes, there were 11 (65%) rear end crashes. There were also 3 right angle and 2 other/unknown crashes. All 17 crashes occurred Monday – Friday and between 6:00 AM and 6:00 PM. Over 80% of heavy vehicle crashes occurred when the pavement was dry and during daylight conditions. Of the heavy vehicles involved in the crashes, 7 (39%) were a truck tractor with semitrailer, 4 (22%) were a single unit with 3-axles, 3 (17%) were buses, and 2 (11%) were a single unit (2-axles, 6-tires). Of the passenger vehicle drivers involved in the crashes, 5 (31%) were under the age of 25 and 2 (13%) were over the age of 64.
Potential Mitigation Strategies
Enforcement Engineering Education Data Management
Priority 1
Increase the amount of enforcement and the number of inspections conducted along the corridor, especially on days and during times when crashes were concentrated.
Construct truck pull-offs to create safe locations for inspections to be conducted. Implement intersection lighting at intersections where warranted to address intersection and nighttime crashes.
Work with community groups and media to educate young passenger vehicle drivers.
Work with local carriers (i.e., safety managers) and drivers to promote safety in the corridor.
Identify any locations (i.e., intersections, sharp curves, etc.) where heavy vehicle crashes are over represented.
Priority 2
Review posted speed limits to ensure they are appropriately set.
Provide heavy vehicle drivers with refresher courses and retraining in defensive driving principles.
Priority 3
Pave all shoulders and install centerline and edgeline rumble strips.
Provide local agencies with the findings from the corridor and crash data review.
Keys to Success: Without providing safe locations to conduct inspections, increasing the number of traffic stops will effectively create roadside safety hazards.
Issues Affecting Implementation: Corridor/data review will need to be completed to identify locations where site improvements are needed (i.e., location for truck pull-off).
106 June 30, 2005
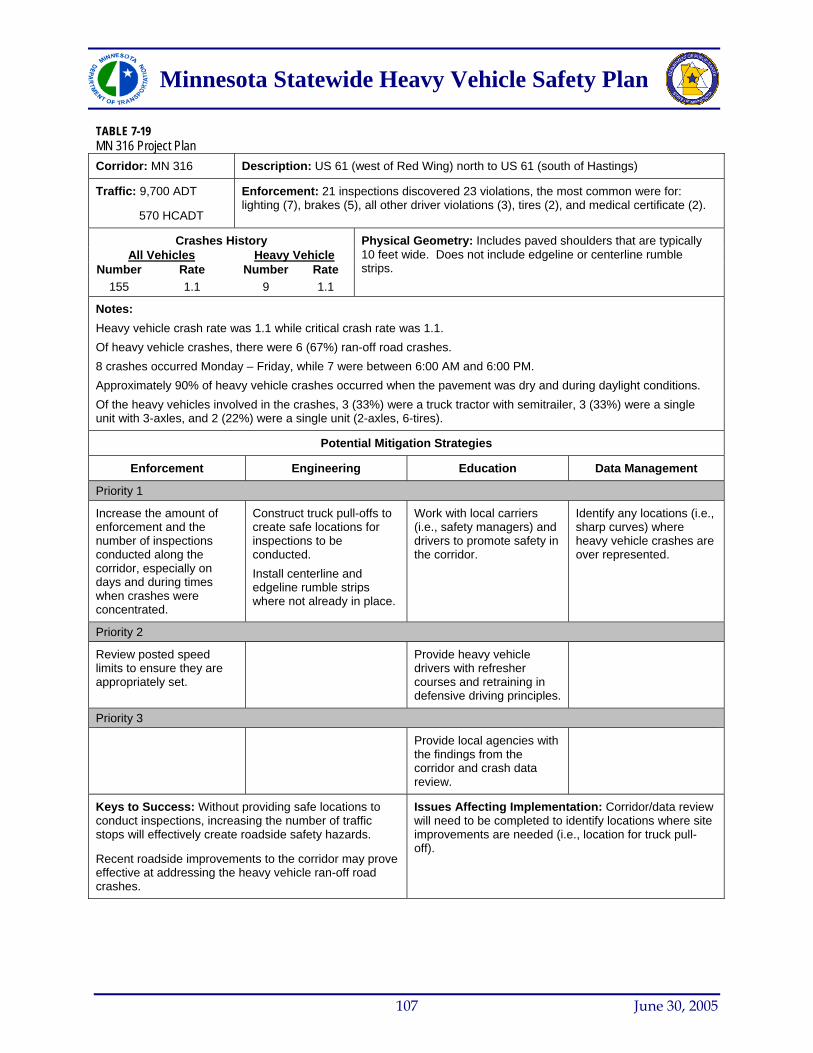
Minnesota Statewide Heavy Vehicle Safety Plan
TABLE 7-19 MN 316 Project Plan
Corridor: MN 316 Description: US 61 (west of Red Wing) north to US 61 (south of Hastings)
Traffic: 9,700 ADT
570 HCADT
Enforcement: 21 inspections discovered 23 violations, the most common were for: lighting (7), brakes (5), all other driver violations (3), tires (2), and medical certificate (2).
Crashes History All Vehicles Heavy Vehicle
Number Rate Number Rate 155 1.1 9 1.1
Physical Geometry: Includes paved shoulders that are typically 10 feet wide. Does not include edgeline or centerline rumble strips.
Notes: Heavy vehicle crash rate was 1.1 while critical crash rate was 1.1. Of heavy vehicle crashes, there were 6 (67%) ran-off road crashes. 8 crashes occurred Monday – Friday, while 7 were between 6:00 AM and 6:00 PM. Approximately 90% of heavy vehicle crashes occurred when the pavement was dry and during daylight conditions. Of the heavy vehicles involved in the crashes, 3 (33%) were a truck tractor with semitrailer, 3 (33%) were a single unit with 3-axles, and 2 (22%) were a single unit (2-axles, 6-tires).
Potential Mitigation Strategies
Enforcement Engineering Education Data Management
Priority 1
Increase the amount of enforcement and the number of inspections conducted along the corridor, especially on days and during times when crashes were concentrated.
Construct truck pull-offs to create safe locations for inspections to be conducted. Install centerline and edgeline rumble strips where not already in place.
Work with local carriers (i.e., safety managers) and drivers to promote safety in the corridor.
Identify any locations (i.e., sharp curves) where heavy vehicle crashes are over represented.
Priority 2
Review posted speed limits to ensure they are appropriately set.
Provide heavy vehicle drivers with refresher courses and retraining in defensive driving principles.
Priority 3
Provide local agencies with the findings from the corridor and crash data review.
Keys to Success: Without providing safe locations to conduct inspections, increasing the number of traffic stops will effectively create roadside safety hazards.
Recent roadside improvements to the corridor may prove effective at addressing the heavy vehicle ran-off road crashes.
Issues Affecting Implementation: Corridor/data review will need to be completed to identify locations where site improvements are needed (i.e., location for truck pull-off).
107 June 30, 2005
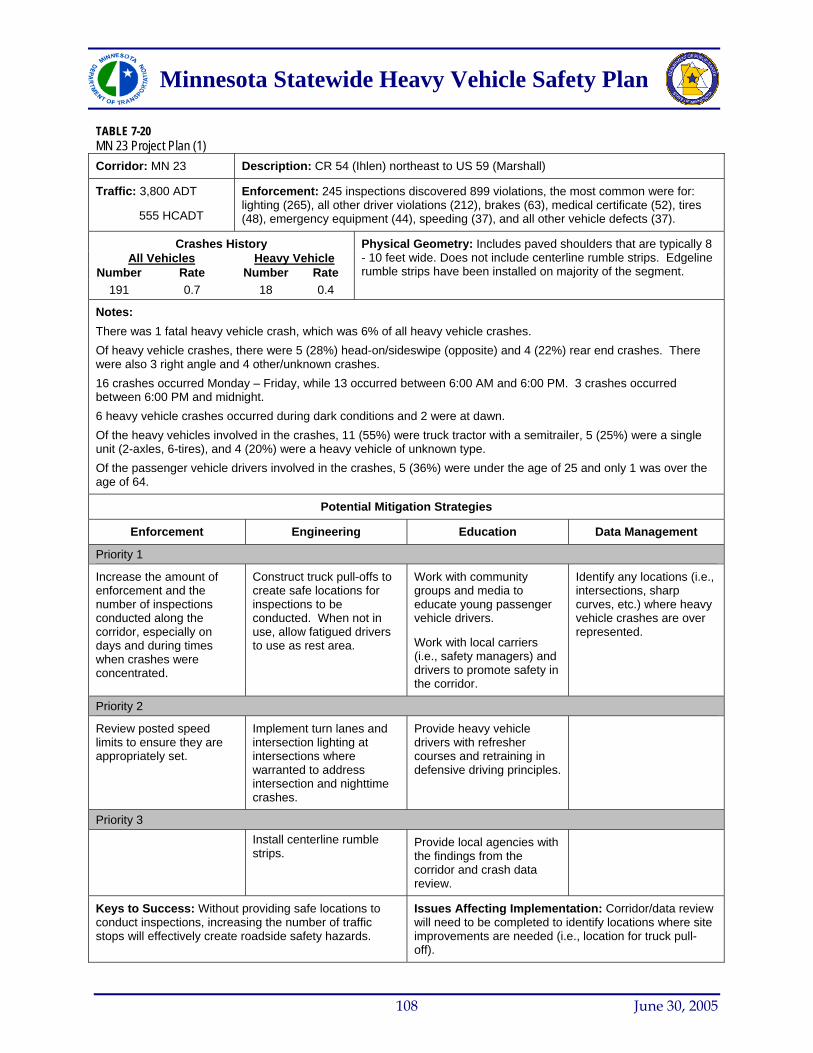
Minnesota Statewide Heavy Vehicle Safety Plan
TABLE 7-20 MN 23 Project Plan (1)
Corridor: MN 23 Description: CR 54 (Ihlen) northeast to US 59 (Marshall)
Traffic: 3,800 ADT
555 HCADT
Enforcement: 245 inspections discovered 899 violations, the most common were for: lighting (265), all other driver violations (212), brakes (63), medical certificate (52), tires (48), emergency equipment (44), speeding (37), and all other vehicle defects (37).
Crashes History All Vehicles Heavy Vehicle
Number Rate Number Rate 191 0.7 18 0.4
Physical Geometry: Includes paved shoulders that are typically 8 - 10 feet wide. Does not include centerline rumble strips. Edgeline rumble strips have been installed on majority of the segment.
Notes: There was 1 fatal heavy vehicle crash, which was 6% of all heavy vehicle crashes. Of heavy vehicle crashes, there were 5 (28%) head-on/sideswipe (opposite) and 4 (22%) rear end crashes. There were also 3 right angle and 4 other/unknown crashes. 16 crashes occurred Monday – Friday, while 13 occurred between 6:00 AM and 6:00 PM. 3 crashes occurred between 6:00 PM and midnight. 6 heavy vehicle crashes occurred during dark conditions and 2 were at dawn. Of the heavy vehicles involved in the crashes, 11 (55%) were truck tractor with a semitrailer, 5 (25%) were a single unit (2-axles, 6-tires), and 4 (20%) were a heavy vehicle of unknown type. Of the passenger vehicle drivers involved in the crashes, 5 (36%) were under the age of 25 and only 1 was over the age of 64.
Potential Mitigation Strategies
Enforcement Engineering Education Data Management
Priority 1
Increase the amount of enforcement and the number of inspections conducted along the corridor, especially on days and during times when crashes were concentrated.
Construct truck pull-offs to create safe locations for inspections to be conducted. When not in use, allow fatigued drivers to use as rest area.
Work with community groups and media to educate young passenger vehicle drivers.
Work with local carriers (i.e., safety managers) and drivers to promote safety in the corridor.
Identify any locations (i.e., intersections, sharp curves, etc.) where heavy vehicle crashes are over represented.
Priority 2
Review posted speed limits to ensure they are appropriately set.
Implement turn lanes and intersection lighting at intersections where warranted to address intersection and nighttime crashes.
Provide heavy vehicle drivers with refresher courses and retraining in defensive driving principles.
Priority 3
Install centerline rumble strips.
Provide local agencies with the findings from the corridor and crash data review.
Keys to Success: Without providing safe locations to conduct inspections, increasing the number of traffic stops will effectively create roadside safety hazards.
Issues Affecting Implementation: Corridor/data review will need to be completed to identify locations where site improvements are needed (i.e., location for truck pull-off).
108 June 30, 2005
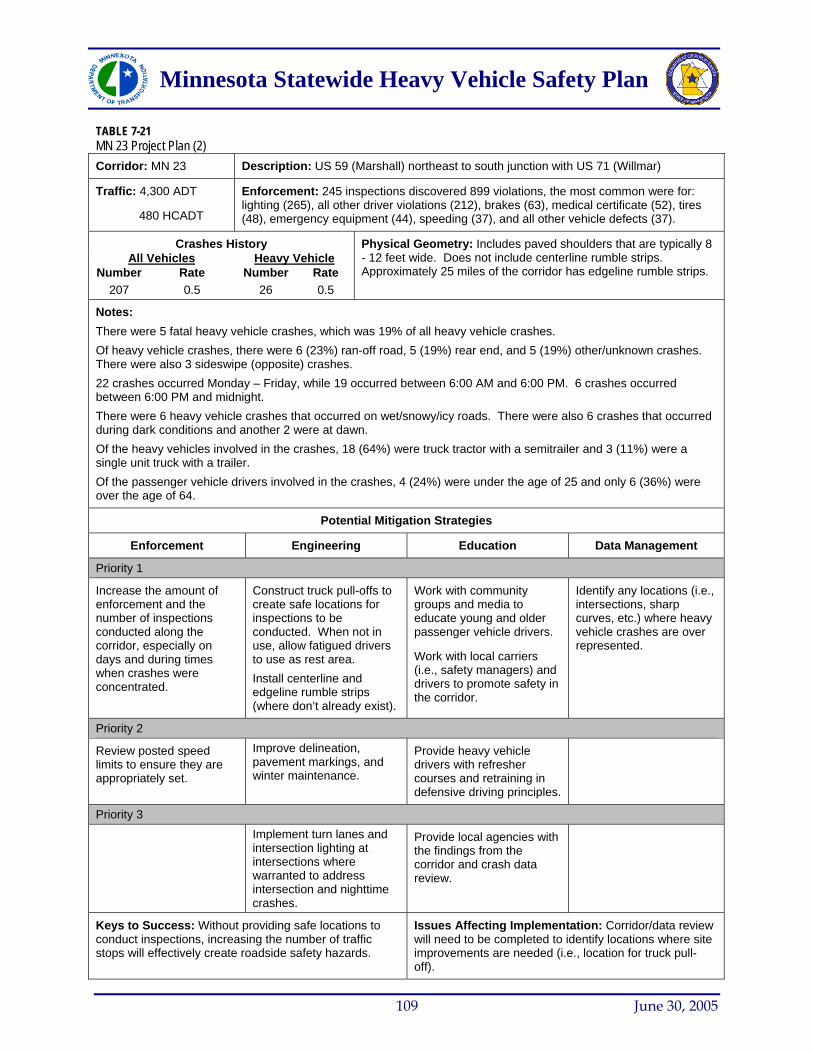
Minnesota Statewide Heavy Vehicle Safety Plan
TABLE 7-21 MN 23 Project Plan (2)
Corridor: MN 23 Description: US 59 (Marshall) northeast to south junction with US 71 (Willmar)
Traffic: 4,300 ADT
480 HCADT
Enforcement: 245 inspections discovered 899 violations, the most common were for: lighting (265), all other driver violations (212), brakes (63), medical certificate (52), tires (48), emergency equipment (44), speeding (37), and all other vehicle defects (37).
Crashes History All Vehicles Heavy Vehicle
Number Rate Number Rate 207 0.5 26 0.5
Physical Geometry: Includes paved shoulders that are typically 8 - 12 feet wide. Does not include centerline rumble strips. Approximately 25 miles of the corridor has edgeline rumble strips.
Notes: There were 5 fatal heavy vehicle crashes, which was 19% of all heavy vehicle crashes. Of heavy vehicle crashes, there were 6 (23%) ran-off road, 5 (19%) rear end, and 5 (19%) other/unknown crashes. There were also 3 sideswipe (opposite) crashes. 22 crashes occurred Monday – Friday, while 19 occurred between 6:00 AM and 6:00 PM. 6 crashes occurred between 6:00 PM and midnight. There were 6 heavy vehicle crashes that occurred on wet/snowy/icy roads. There were also 6 crashes that occurred during dark conditions and another 2 were at dawn. Of the heavy vehicles involved in the crashes, 18 (64%) were truck tractor with a semitrailer and 3 (11%) were a single unit truck with a trailer. Of the passenger vehicle drivers involved in the crashes, 4 (24%) were under the age of 25 and only 6 (36%) were over the age of 64.
Potential Mitigation Strategies
Enforcement Engineering Education Data Management
Priority 1
Increase the amount of enforcement and the number of inspections conducted along the corridor, especially on days and during times when crashes were concentrated.
Construct truck pull-offs to create safe locations for inspections to be conducted. When not in use, allow fatigued drivers to use as rest area. Install centerline and edgeline rumble strips (where don’t already exist).
Work with community groups and media to educate young and older passenger vehicle drivers.
Work with local carriers (i.e., safety managers) and drivers to promote safety in the corridor.
Identify any locations (i.e., intersections, sharp curves, etc.) where heavy vehicle crashes are over represented.
Priority 2
Review posted speed limits to ensure they are appropriately set.
Improve delineation, pavement markings, and winter maintenance.
Provide heavy vehicle drivers with refresher courses and retraining in defensive driving principles.
Priority 3 Implement turn lanes and
intersection lighting at intersections where warranted to address intersection and nighttime crashes.
Provide local agencies with the findings from the corridor and crash data review.
Keys to Success: Without providing safe locations to conduct inspections, increasing the number of traffic stops will effectively create roadside safety hazards.
Issues Affecting Implementation: Corridor/data review will need to be completed to identify locations where site improvements are needed (i.e., location for truck pull-off).
109 June 30, 2005
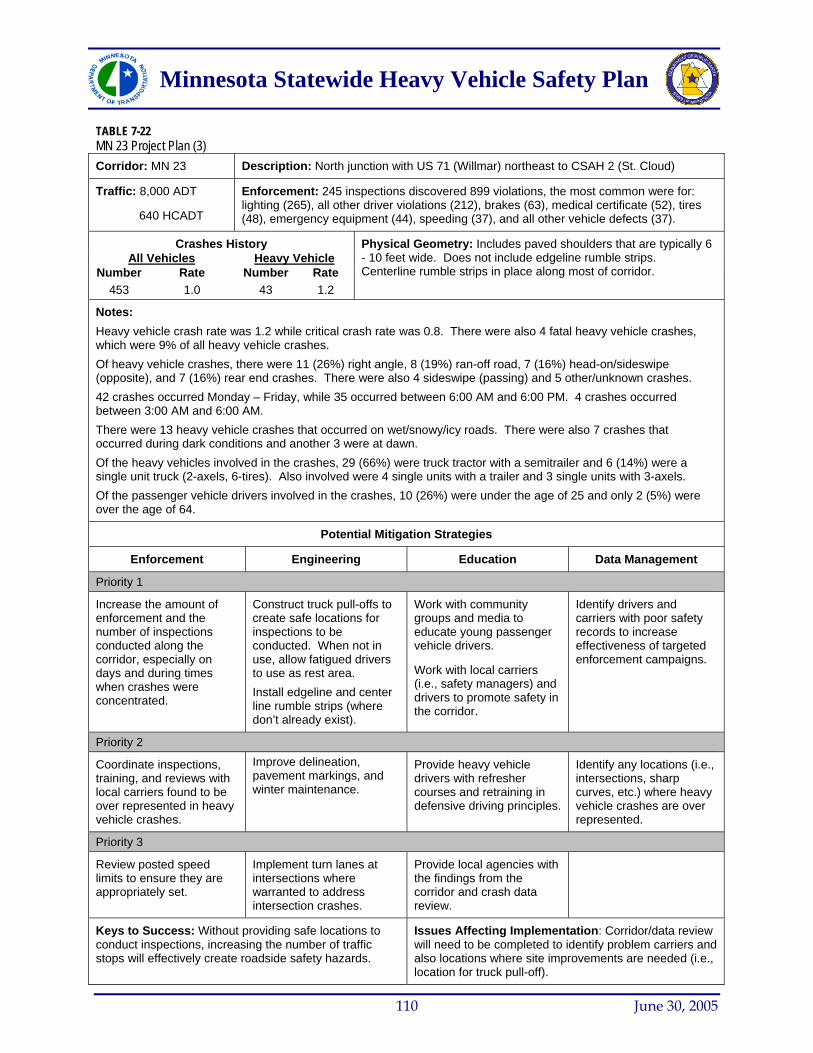
Minnesota Statewide Heavy Vehicle Safety Plan
TABLE 7-22 MN 23 Project Plan (3)
Corridor: MN 23 Description: North junction with US 71 (Willmar) northeast to CSAH 2 (St. Cloud)
Traffic: 8,000 ADT
640 HCADT
Enforcement: 245 inspections discovered 899 violations, the most common were for: lighting (265), all other driver violations (212), brakes (63), medical certificate (52), tires (48), emergency equipment (44), speeding (37), and all other vehicle defects (37).
Crashes History All Vehicles Heavy Vehicle
Number Rate Number Rate 453 1.0 43 1.2
Physical Geometry: Includes paved shoulders that are typically 6 - 10 feet wide. Does not include edgeline rumble strips. Centerline rumble strips in place along most of corridor.
Notes: Heavy vehicle crash rate was 1.2 while critical crash rate was 0.8. There were also 4 fatal heavy vehicle crashes, which were 9% of all heavy vehicle crashes. Of heavy vehicle crashes, there were 11 (26%) right angle, 8 (19%) ran-off road, 7 (16%) head-on/sideswipe (opposite), and 7 (16%) rear end crashes. There were also 4 sideswipe (passing) and 5 other/unknown crashes. 42 crashes occurred Monday – Friday, while 35 occurred between 6:00 AM and 6:00 PM. 4 crashes occurred between 3:00 AM and 6:00 AM. There were 13 heavy vehicle crashes that occurred on wet/snowy/icy roads. There were also 7 crashes that occurred during dark conditions and another 3 were at dawn. Of the heavy vehicles involved in the crashes, 29 (66%) were truck tractor with a semitrailer and 6 (14%) were a single unit truck (2-axels, 6-tires). Also involved were 4 single units with a trailer and 3 single units with 3-axels. Of the passenger vehicle drivers involved in the crashes, 10 (26%) were under the age of 25 and only 2 (5%) were over the age of 64.
Potential Mitigation Strategies
Enforcement Engineering Education Data Management
Priority 1
Increase the amount of enforcement and the number of inspections conducted along the corridor, especially on days and during times when crashes were concentrated.
Construct truck pull-offs to create safe locations for inspections to be conducted. When not in use, allow fatigued drivers to use as rest area. Install edgeline and center line rumble strips (where don’t already exist).
Work with community groups and media to educate young passenger vehicle drivers.
Work with local carriers (i.e., safety managers) and drivers to promote safety in the corridor.
Identify drivers and carriers with poor safety records to increase effectiveness of targeted enforcement campaigns.
Priority 2
Coordinate inspections, training, and reviews with local carriers found to be over represented in heavy vehicle crashes.
Improve delineation, pavement markings, and winter maintenance.
Provide heavy vehicle drivers with refresher courses and retraining in defensive driving principles.
Identify any locations (i.e., intersections, sharp curves, etc.) where heavy vehicle crashes are over represented.
Priority 3
Review posted speed limits to ensure they are appropriately set.
Implement turn lanes at intersections where warranted to address intersection crashes.
Provide local agencies with the findings from the corridor and crash data review.
Keys to Success: Without providing safe locations to conduct inspections, increasing the number of traffic stops will effectively create roadside safety hazards.
Issues Affecting Implementation: Corridor/data review will need to be completed to identify problem carriers and also locations where site improvements are needed (i.e., location for truck pull-off).
110 June 30, 2005
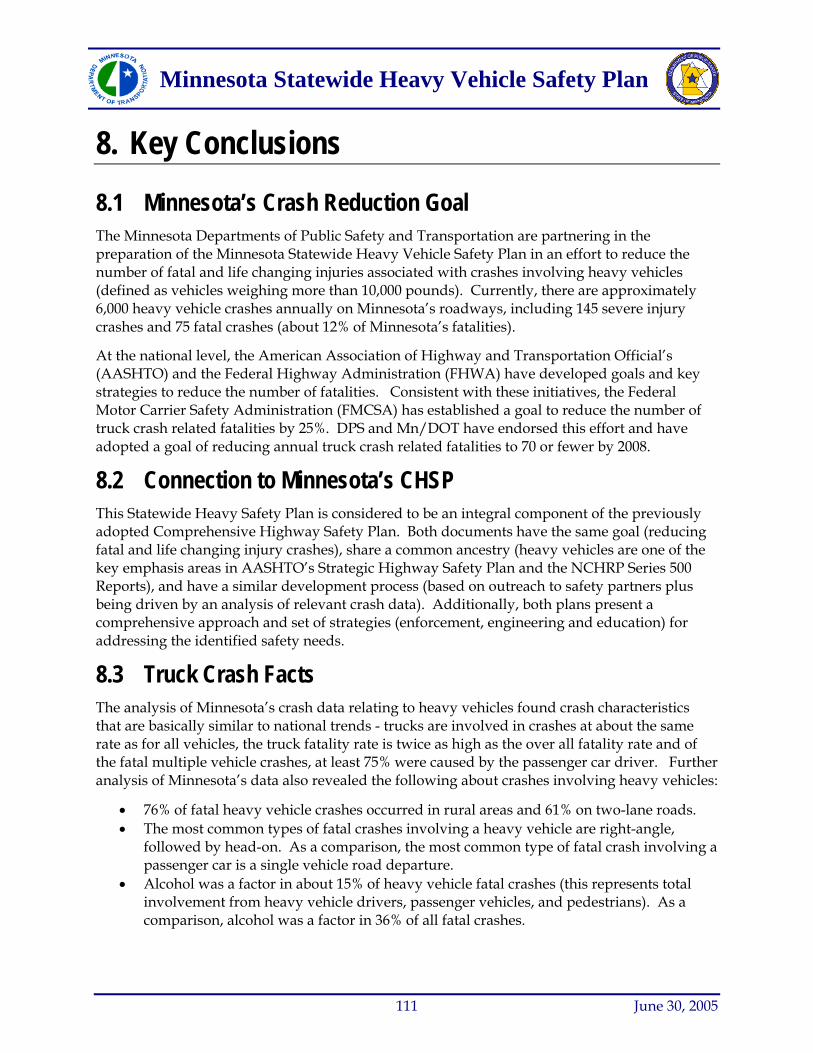
Minnesota Statewide Heavy Vehicle Safety Plan
8. Key Conclusions
8.1 Minnesota’s Crash Reduction Goal The Minnesota Departments of Public Safety and Transportation are partnering in the preparation of the Minnesota Statewide Heavy Vehicle Safety Plan in an effort to reduce the number of fatal and life changing injuries associated with crashes involving heavy vehicles (defined as vehicles weighing more than 10,000 pounds). Currently, there are approximately 6,000 heavy vehicle crashes annually on Minnesota’s roadways, including 145 severe injury crashes and 75 fatal crashes (about 12% of Minnesota’s fatalities).
At the national level, the American Association of Highway and Transportation Official’s (AASHTO) and the Federal Highway Administration (FHWA) have developed goals and key strategies to reduce the number of fatalities. Consistent with these initiatives, the Federal Motor Carrier Safety Administration (FMCSA) has established a goal to reduce the number of truck crash related fatalities by 25%. DPS and Mn/DOT have endorsed this effort and have adopted a goal of reducing annual truck crash related fatalities to 70 or fewer by 2008.
8.2 Connection to Minnesota’s CHSP This Statewide Heavy Safety Plan is considered to be an integral component of the previously adopted Comprehensive Highway Safety Plan. Both documents have the same goal (reducing fatal and life changing injury crashes), share a common ancestry (heavy vehicles are one of the key emphasis areas in AASHTO’s Strategic Highway Safety Plan and the NCHRP Series 500 Reports), and have a similar development process (based on outreach to safety partners plus being driven by an analysis of relevant crash data). Additionally, both plans present a comprehensive approach and set of strategies (enforcement, engineering and education) for addressing the identified safety needs.
8.3 Truck Crash Facts The analysis of Minnesota’s crash data relating to heavy vehicles found crash characteristics that are basically similar to national trends - trucks are involved in crashes at about the same rate as for all vehicles, the truck fatality rate is twice as high as the over all fatality rate and of the fatal multiple vehicle crashes, at least 75% were caused by the passenger car driver. Further analysis of Minnesota’s data also revealed the following about crashes involving heavy vehicles:
• 76% of fatal heavy vehicle crashes occurred in rural areas and 61% on two-lane roads. • The most common types of fatal crashes involving a heavy vehicle are right-angle,
followed by head-on. As a comparison, the most common type of fatal crash involving a passenger car is a single vehicle road departure.
• Alcohol was a factor in about 15% of heavy vehicle fatal crashes (this represents total involvement from heavy vehicle drivers, passenger vehicles, and pedestrians). As a comparison, alcohol was a factor in 36% of all fatal crashes.
111 June 30, 2005
Minnesota Statewide Heavy Vehicle Safety Plan
• Weather, road surface and light conditions were a factor in fewer than 35% of the fatal crashes.
• Truck drivers are using seat belts at about the same rate (self reported by drivers in a fatal or life changing crash) as all vehicle occupants in Minnesota (approximately 82%), however, this is almost twice the national average (observational study). In addition, a higher percentage of people wearing seat belts are killed in collisions with heavy vehicles than in collisions only involving passenger cars (59% vs. 47%).
8.4 Implementation The AASHTO and NCHRP documents encourage agencies to develop their own safety plans based on seven guiding principles
• Comprehensive • Systematic • Integrated • Stakeholder Involved
• Data Driven • Proactive • Substantive
The Minnesota Heavy Vehicle Safety Plan did in fact start with these guiding principles and then made adjustments based on the input from a variety of safety partners (approximately 50 individuals from law enforcement, insurance companies, courts, research universities, driver training schools, private industry, FMCSA and local, state and federal highway agencies attended the March 11, 2005 workshop that focused on strategic prioritization) and Minnesota’s crash records databases. The final result of this effort is a prioritized list of ten Critical Strategies that address enforcement, engineering and educational issues, including:
1. Law enforcement and inspector resources.
2. Cost effective road and roadside improvements.
3. Strengthen commercial drivers licensing.
4. Passenger vehicle driver education.
5. Median barriers on divided roadways.
6. Automatic notification of driver convictions.
7. Implementation of a comprehensive safety demonstration corridor.
8. Work zones. 9. Targeted enforcement. 10. Improve data systems.
The greatest challenge facing traffic safety professionals in Minnesota is the need to acknowledge that the effort to reduce fatal and life changing injuries associated with crashes involving heavy vehicles is tied to implementing the prioritized strategies. The guiding principles suggest that the most effective implementation likely involves doing things differently from what has been done in the past. This includes investing in more enforcement and having the enforcement focused in the corridors with the greatest needs based on truck volumes, speed profiles, number of citations issues and number of truck crashes. In addition, the highway related improvement strategies are intended to be implemented both as stand alone reactive safety projects and proactively as design features that are incorporated into larger projects that are part of programs for roadway preservation, reconstruction and expansion.
112 June 30, 2005
Minnesota Statewide Heavy Vehicle Safety Plan
8.5 Final Thoughts The process of developing this plan combined with comments provided by the safety partners identified a number of additional items that Mn/DOT and DPS should consider. These items are outside of the context of the ten Critical Strategies or were omitted from the list because they are either part of ongoing programs or they simply couldn’t be linked to numbers of fatal crashes. However, these items were found to be important enough to warrant follow up by the Departments.
• There has been little or no effort to document the effectiveness of current safety initiatives, as a result, little is known about their actual ability to address identified safety deficiencies. Conducting a thorough evaluation of these initiatives would provide insight about whether they should be continued, revised or terminated.
• Of the ten critical strategies, only two (both engineering related) are considered proven, the rest are considered either tried or experimental. In other words, the actual safety effectiveness of most of the strategies is not thoroughly documented at this time. In order to help generate the information necessary to document effectiveness, implementing agencies need to consider deployments of all safety strategies (particularly those related to enforcement, education and emergency response) as projects – by designating a project manager, establishing schedules, documenting “before” data, conducting an analysis of “after” conditions and finally identifying the effect of implementation.
• The level of detail provided in the current crash records database did not allow the analysis key heavy vehicle characteristics such as commodity, driver fatigue, hours of service, level of experience, and driver’s previous record (i.e., crash history or citations). This type of information is collected but is not included in the crash records database (which is the information generally available to highway traffic safety engineers), but is instead accessible by enforcement agencies. Integrating some or all of this information with Minnesota’s location based crash records system would allow analysts to do a more thorough job of documenting the factors contributing to crashes involving heavy vehicles.
• Given the limitations in the crash records system noted above, specific strategies relating to fatigue, driver training and roll over crashes did not make it through the data driven screening process. However, recent national research suggests that increasing the supply of public truck parking spaces, increasing the awareness of young passenger car drivers of the hazards of driving near heavy vehicles and supporting research investigating the application of technology to reduce roll over crashes should be considered.
• In order to help refine the strategies in this Plan and to generate support for implementation, the Departments are encouraged to reach out to industry, private carriers and the Minnesota Trucking Association.
The strategies and partnerships identified in this Statewide Heavy Vehicle Safety Plan present the Sate of Minnesota the greatest opportunity to achieve the aggressive safety goal of reducing heavy vehicle related fatalities to fewer than 70 by 2008, to support the CHSP goal of fewer than 500 fatalities statewide by 2008 and to take the initial steps in moving Towards Zero Deaths.
113 June 30, 2005
Minnesota Statewide Heavy Vehicle Safety Plan
References
1. Minnesota Comprehensive Highway Safety Plan. Minnesota Departments of Public Safety and Transportation. St. Paul, MN, December 2004.
2. AASHTO Strategic Highway Safety Plan: A Plan to Substantially Reduce Vehicle-Related Fatalities and Injuries on the Nation’s Highways. American Association of State Highway and Transportation Officials, Washington, D.C., 1998.
3. National Cooperative Highway Research Program Report 500 (series). TRB, National Research Council, Washington, D.C., various years
3A. Knipling, R.R., P. Waller, R. C. Peck, R. Pfefer, T. Neuman, K. Slack, K. Hardy. Guidance for Implementation of the AASHTO Strategic Highway Safety Plan, Volume13: A Guide for Reducing Collisions Involving Heavy Trucks. NCHRP Report 500, Transportation Research Board, Washington, D.C., 2004.
4. Minnesota Motor Vehicle Crash Facts. Minnesota Department of Public Safety, Office of Traffic Safety, St. Paul, MN, various years.
5. Harwood, D.W., I. Potts, D. Torbic, W. Glauz. Commercial Truck and Bus Safety Synthesis, Synthesis 3 - Highway/Heavy Vehicle Interaction. Transportation Research Board, Washington, D.C., 2003.
6. Staplin, L., K. Lococo, L. Decina, G. Bergoffen. Commercial Truck and Bus Safety Synthesis 5 - Training of Commercial Motor Vehicle Drivers. Transportation Research Board, Washington D.C., 2004.
7. Large Truck Crash Facts, 2002. Report FMCSA-RI-04-021. Federal Motor Carrier Safety Administration, Analysis Division, April 2004.
8. Knoblauch, R.L., R. Cotton, M. Nitzburg, R.F. Seifert, G. Shapiro, P. Broene. Safety Belt Usage by Commercial Motor Vehicle Drivers. Prepared for FMCSA, 2003. Accessed at http://www.fmcsa.dot.gov/safety-security/safety-initiatives/safety-belt/fmcsafinal-safetybeltstudy-nov2003.htm on April 29, 2005.
References R-1 June 30, 2005

Minnesota Statewide Heavy Vehicle Safety Plan
Education
Question 1 asked the respondents to describe how company/agency has worked to educate staff/carriers/drivers on driving habits that need to be modified or improved. How were these problems identified? Did the company/agency participate in any related Public Information & Education (PIE) campaigns or blue-ribbon panels?
The majority of the responses are participating in federal initiatives such as Share the Road, No Zone, and Operation Life Saver campaigns. Also, in Minnesota there is a state program entitled Toward Zero Fatalities that agencies and motor carriers are participating in. The respondents are also delivering safety presentations at tradeshows and annual meetings discussing truck safety. Many types of media are used to get the message out to people, including public service announcements, brochures, and electronic messages. However, there is concern that the messages being delivered are not reaching the general public.
Question 2 asked the respondents how the company/agency has worked to educate staff/carriers/drivers on the dangers of impaired or fatigued driving. What programs or countermeasures related to impaired or fatigued driving has the company/agency implemented or reviewed (i.e., rest areas, ITS technology, enforcement, driver and carrier sanctions, etc.)?
Many of the elements of the safety programs that were discussed included drivers’ hours of service and fatigue management. The driver fatigue problem has been an issue for several years, but now seems to have made it to the forefront. Numerous safety seminars and training sessions delivered by state agencies and safety departments addressed the issues of driver fatigue, alertness, and impairment.
Regarding the use of technology, the Minnesota State Patrol has experimented, with some success, with a retina scan device to detect fatigued operation of trucks. The device is not widely used at this time, but reports from the MSP state that the device shows promise.
Question 3 asked if the company/agency participates in multi-disciplinary teams to promote safety initiatives or identify safety problems. Has the company/agency been active in Safe Community based programs (or similar programs) to improve safety at the local level, especially in high crash areas or corridors?
The State of Minnesota is participating in the “Toward Zero Death” initiative, a consortium of safe community based programs to identify high accident corridors. (This is a state effort, not federal).
In the area of roadside enforcement, the State Patrol works with the local police departments on saturation inspections. The State Patrol will also work with Canadian authorities and insurance groups to promote truck safety.
The Minnesota Trucking Association also sponsors the Minnesota Road Team, made up of skilled drivers that go to local civic groups to discuss trucking issues, and promote safety.
Appendix I A.1-1 June 30, 2005
Minnesota Statewide Heavy Vehicle Safety Plan
Crash Prevention
Question 4 asked respondents what proactive or preemptive actions the company/agency taken to address driver error of the passenger vehicle or to increase passenger car awareness?
Most of the respondents answered that they were participating in public service campaigns such as the No Zone and Share the Road.
Minnesota has also developed a local initiative for the construction industry called the Construction Truck Operator Training program to inform construction truck operators of the particular regulations to which they are subject.
The private sector participants stated that they provide bonuses to drivers for top flight performance such as increased fuel mileage. The bonus programs have reduced costs of maintenance and repairs. The bonuses paid to drivers more than pay for the costs of maintenance. Preventative maintenance programs reduce costs to company by keeping the trucks on the road, out of the shop, and away from accidents.
Question 5 asked to explain any new safety technologies for heavy vehicles that the company/agency has adopted to prevent crashes (i.e., crash avoidance systems).
Our interviews did not reveal a widespread use of new technologies. The private sector has experimented with driver simulators in some driver training courses. They would like to see the use of these simulator expanded, if possible. The simulators seem to be a very valuable tool, in that drivers’ reactions to extreme situations can be tracked, recorded, and analyzed.
Both parties agreed that more training is needed in crash avoidance and defensive driving for commercial drivers. Better driver training for all drivers is needed as well.
Question 6 asked respondents to describe roadside designs intended to accommodate heavy trucks and to improve safety. They were asked to explain any special designs that they are aware of that were due to heavy vehicle safety issues.
The federal and state road agencies extensively review roadside designs for improvement. Many crashes occur on two lane roadways where improvements are needed. Several respondents commented that entrance and exit ramps need to be extended to allow for the slow acceleration of trucks to enter the freeway.
The enforcement agencies stated that they would like to conduct enforcement activities at sites other than at fixed scale facilities; however, there are few places that trucks can be pulled over safely, for an inspection. The enforcement agencies require wide shoulders or an area to pull over vehicles. There are also seasonal changes that affect enforcement, such as harvest time in the fall, construction activity in the summer, and winter conditions.
The private sector respondents stated that freight access to the downtown businesses is a problem. Many of the dock areas difficult to get to and that they have to stop traffic while they back into the dock to make the delivery.
Appendix I A.1-2 June 30, 2005
Minnesota Statewide Heavy Vehicle Safety Plan
Emergency Medical Services
The next category asked the respondents about any emergency medical services training received.
Question 7 asked them to describe if the agency/company had implemented a voluntary bystander care training program for drivers (consistent with a standard certification agency, such as American Red Cross), especially for those in rural areas.
This question revealed that there is little training provided in this area. Officers within the enforcement agencies receive first-responder training. However, other agencies or private sector did not provide emergency medical training as a common practice.
Data Management and Use
The third category of questions asked about how the agencies and companies gather, manage, and use data in their operations.
Question 8 asked how the company/agency uses safety data to support decision making. They were asked to describe any performance measures that have been established to evaluate cost effectiveness of safety investments.
The answers that were given show that data are used by both the private and public sectors for a variety of safety purposes. There are numerous databases available for both sectors, for example Crash Facts, SAFER, and SAFESTAT. While the public sector tends to use data for accident analysis and targeting enforcement activities, the private sector tends to use the available data for improving driver and equipment performance.
Both sectors are collecting data continuously in their efforts to reduce accidents and improve performance. However, there is a consensus among the respondents for development of a common source of data and the need to share the data that are collected. For example, if Mn/DOT discovers an area of roadway that is incurring a number of accidents, trucking would like to know that as well, in order to take pre-emptive action in that area.
Question 9 asked if the agency provided guidelines for crash investigation to improve consistency and quality of data collection. Has the agency conducted periodic reviews to ensure quality of safety data?
This question was asked of the public sector agencies to determine if there were quality checks of the data collection process. The answers provided here show room for improvement in this area. While the agencies follow the guidelines provided by the National Highway Traffic Safety Administration (NHTSA), there are no formal quality assurance checks on the data, once collected. However, Mn/DOT is developing a database for serious commercial vehicle accidents that is to be completed in 2005. Because most of the safety programs rely on these data, it is hoped that the development of this accident/inspection database, will spur data quality checks.
Appendix I A.1-3 June 30, 2005
Minnesota Statewide Heavy Vehicle Safety Plan
Question 10 asked if the company/agency reviews crash data to identify and target carriers/drivers with a disproportionate number of crashes. If so, how has this affected your operations or practices?
The agencies interviewed use all forms of crash data to target enforcement activities. For example, if the data show that a carrier, or group of carriers, are incurring a disproportionate number of accidents, they will be probably be investigated. Furthermore, data will be used to identify corridors in which crashes are occurring.
The motor carriers stated that they review all data with drivers, for example, accidents, traffic violations, miles per gallon, on time deliveries, etc. to determine performance and if retraining is needed.
Question 11 asked if the company/agency reviewed crash data to identify the most prevalent vehicle defects involved in truck crashes. If so, how has this changed vehicle inspection policies?
The respondents replied that driver error was most prevalent in crashes, for example, fatigue, using cell phones, driver inattention all contribute to crashes. Respondents stated that carriers need to better train their drivers. Many defects are found during roadside inspections that drivers should have discovered in their daily pre-trip inspections.
In Metro district, for example, round table discussions are held periodically to discuss what is found during the roadside inspection process. Inspectors are encouraged to take pictures of violations. The pictures are then shown to the group, then discussed and reviewed. It is the intent of these discussions to develop consistent interpretation of the regulations so that there is consistent enforcement of the regulations.
The private sector respondents stated that they review data all the time, to maintain delivery schedules, enhance driver performance, and promote safety.
Question 12 asked if the company/agency have any information regarding vehicle characteristics (i.e., vehicle configurations, vehicle manufacturers, equipment, etc.) that has an increased risk or likelihood of safety problems.
None of the respondents indicated specific problems with vehicle equipment, configurations, or manufacturers. One of the private sector representatives did state, however, that slow truck acceleration onto the freeways is a problem. The trucks take longer to get up to highway speed and merging into traffic at those slower speeds is difficult.
Question 13 asked respondents to explain your company/agency’s participation or awareness in a Safety Management System (SMS) for heavy vehicles (NOTE: A SMS would be a coordinated, organized program with a mission and vision to improve traffic safety).
There is some coordination among agencies, mostly enforcement oriented. There is not much coordination with other types of agencies. For example, the enforcement agencies participate in the “Safe & Sober” campaign, conducting probable cause stops. The commercial vehicle inspectors conduct vehicle inspections while the State Patrol troopers stop cars and trucks for other traffic violations.
Appendix I A.1-4 June 30, 2005
Minnesota Statewide Heavy Vehicle Safety Plan
Some motor carriers are participating in the Toward Zero Death campaign. These types of campaigns keep drivers in the loop. Having drivers involved these programs is a key to success. Drivers will talk to other drivers about things that they may not talk to management about.
Question 14 asked how does the company/agency maintain, know of, or use a clearinghouse that showcases new technology on safety data and its collection, storage, retrieval and analysis.
There are many sources of information that showcase safety technology that are available to both the public and private sectors. For example, the Federal Highway Administration (FHWA) has Turner-Fairbank Highway Research Center (TFHRC) that serves as the clearinghouse of data and research efforts. Federal and state enforcement officials can also access the Motor Carrier Management Information System (MCMIS), Safety and Fitness Electronic Records System (SAFER), and Inspection Selection System (ISS) federal databases that provide safety, inspection, and violation data.
Minnesota is also developing an accident data base that is available to the field. This database should provide more information for analysis and comparison to national data.
Closing Thoughts
Finally, the respondents were asked a series of questions that allowed them to provide their opinions, based on their expertise, of heavy vehicle safety issues.
Question 15 stated that since 2000, at least 73% of truck fatal crashes occurred in rural areas (i.e., population less than 5,000). They were asked to provide any insight as to why fatal crashes tend to occur in these areas.
Most of the respondents stated the possible reasons for increased accidents in these areas are less attentive drivers, less vehicle traffic, roadways that are less forgiving in the event of a crash, and longer response times for emergency services.
Other reasons given for the incidents of fatal crashes in these areas are less congestion in these areas, increased vehicle speeds, less enforcement presence, and the prevalence of two lane roads. Driver (car or truck) fatigue probably also plays a role, along with open spaces and narrow shoulders. The openness contributes to “chance taking” of drivers. Drivers then misjudge distances of on coming traffic. Drivers are not familiar with area contribute to them taking chances.
Question 16 asked that with the way the industry operates (NOT individual companies); explain any circumstances that can lead to safety issues because of problems with either the vehicle, equipment or the drivers (i.e., seasonal demands on drivers)?
The responses that we received included the idea that every load is a “hot” load, such that companies and individuals are pushing hard to meet demands of shippers and receivers. Furthermore, log books that keep track of drivers’ hours are not accurate, meaning that drivers are driving more hours than they are recording.
Appendix I A.1-5 June 30, 2005
Minnesota Statewide Heavy Vehicle Safety Plan
Representatives from both the public and private sectors stated that there is a lack of experienced, qualified drivers. This inexperience in driving contributes a lack of safety on the road.
Both public and private sector representatives also stated that commodity exemptions play a role in safety. Agricultural commodities are granted seasonal exemptions from safety regulations that allow drivers to drive beyond the 11-hour limit on commercial drivers. Several people commented that no one should be exempted from the safety regulations.
Question 17 asked at what point do economic strength and growth become a priority influencing exemptions from a safety based programs.
All of the respondents stated that safety is their number one priority and that safety would not be compromised. However, several people stated that rule makers must be cognizant of economic burden that may be placed on companies with any new requirements. For example, as freight volume keeps increasing and qualified drivers are in short supply, there is a need to increase the productivity of existing drivers. Perhaps rule makers should examine permitting the use of larger vehicles. Some companies already are operating larger, heavier vehicles (i.e., timber), so other companies can operate larger vehicles as well.
Several participants commented that any exemptions from safety regulations granted to the industry should be based on research and not the type of commodity transported. All trucks should be regulated the same, regardless of the commodity. There was a feeling among some of the respondents that the exempted carriers are operating with less safe equipment, and these exemptions need to be researched to determine if they are still relevant.
Question 18 asked what research/work/programs that have put in place we need to know about. What safety trends have you identified in the industry?
Several issues were brought forth with this question. One commenter stated that carrier management needs to play a more active role in training. It was felt that too many managers feel that once the training course is completed, the job is done. Training needs to be reinforced following the coursework.
The role of safety awards is underappreciated. The proper safety award can do a lot of good.
One commenter stated that the economic deregulation has hurt some in trucking industry. Transportation costs have gone up, but prices charged for shipping have not increased as much. Some haulers charge just enough to cover their costs. Carriers don’t belong to the NMFCA as much, so the rates charged are all over the map. Shippers are more demanding, so carriers cut costs to meet shipper demands. This cost cutting spiral could compromise safety.
Finally, several commented on the need for more research in fatigue, human factors, and younger drivers. None of the three areas are well understood by the industry and all contribute to accidents.
Appendix I A.1-6 June 30, 2005
Minnesota Statewide Heavy Vehicle Safety Plan
Question 19 asked to explain any safety initiatives likely to progress related to heavy vehicles? Are there any existing programs that can be improved upon?
One commenter reiterated the need to focus on increased productivity and to review the safety regulations to see if they can help carriers be more productive. The review of the regulations needs to be holistic in its approach, such that it doesn’t contradict existing regulations. There is an immediate need for more qualified drivers and larger trucks.
Along with the need for more truck drivers, one commenter stated the need for more enforcement staff. There are more trucks operating on the highways than ever before, but there are less staff operating the weigh stations.
Another commenter stated that as trucks and trucking are more regulated, and companies are safety conscious, that industry should help educate passenger car drivers on how to operate around trucks.
Several of those interviewed commented that there needs to be a concerted effort on fatigue monitoring. Driver fatigue is serious and we are just now realizing its effects. Some carriers are more proactive than others, but all carriers need to understand the effects of fatigue on the health and safety of their drivers. Some carriers will only adopt technologies if they are mandated to.
Along the theme of driver fatigue, several participants reiterated that the hours of service rules should apply to everyone. Furthermore, safety regulations should apply to all trucks; there should be no exemptions for commodity or size of fleet.
The final question, Question 20 asked if in the perfect world, what programs or initiatives need to developed and implemented by the State to address truck related safety issues.
Three of the respondents stated that the commercial vehicle inspectors (CVI) need the authority to stop vehicles on the roadside. Presently, CVI’s cannot pull trucks over on the roadside.
One person commented that in a perfect world there would be more truck awareness training at the time of an initial driver’s license application. The 3rd party testing in the commercial drivers’ license (CDL) program would also be eliminated in a perfect world. There is a need for standardized nationwide testing for CDLs.
The driver fatigue issue was raised by several participants, and the need for fatigue detection, for both commercial drivers and automobile drivers.
One person commented that in a perfect world there would be truck only lanes and off peak delivery times. There should be incentive programs to deliver goods at various times. And work zones would be designed for trucks to maneuver through.
Several new technologies would be deployed in a perfect world. Some devices that were suggested were:
• Deploy in-vehicle device to over ride radio (possibly CD player) to notify driver of an approaching train. Deploy device in school buses. Needs to be national program. Railroads won’t respond to state/local initiatives (interstate commerce clause).
Appendix I A.1-7 June 30, 2005
Minnesota Statewide Heavy Vehicle Safety Plan
A final suggestion to the enforcement community was to spend time on drivers and safety, not so much on proper completion of the paperwork. The safety fitness of the company should be tied to performance not paperwork.
Appendix I A.1-8 June 30, 2005
• Fatigue detectors in both cars and trucks. • Collision avoidance systems deployed on trucks. They need to be safe and affordable. • In vehicle navigation aids to assist the driver to locate shipper/receiver.
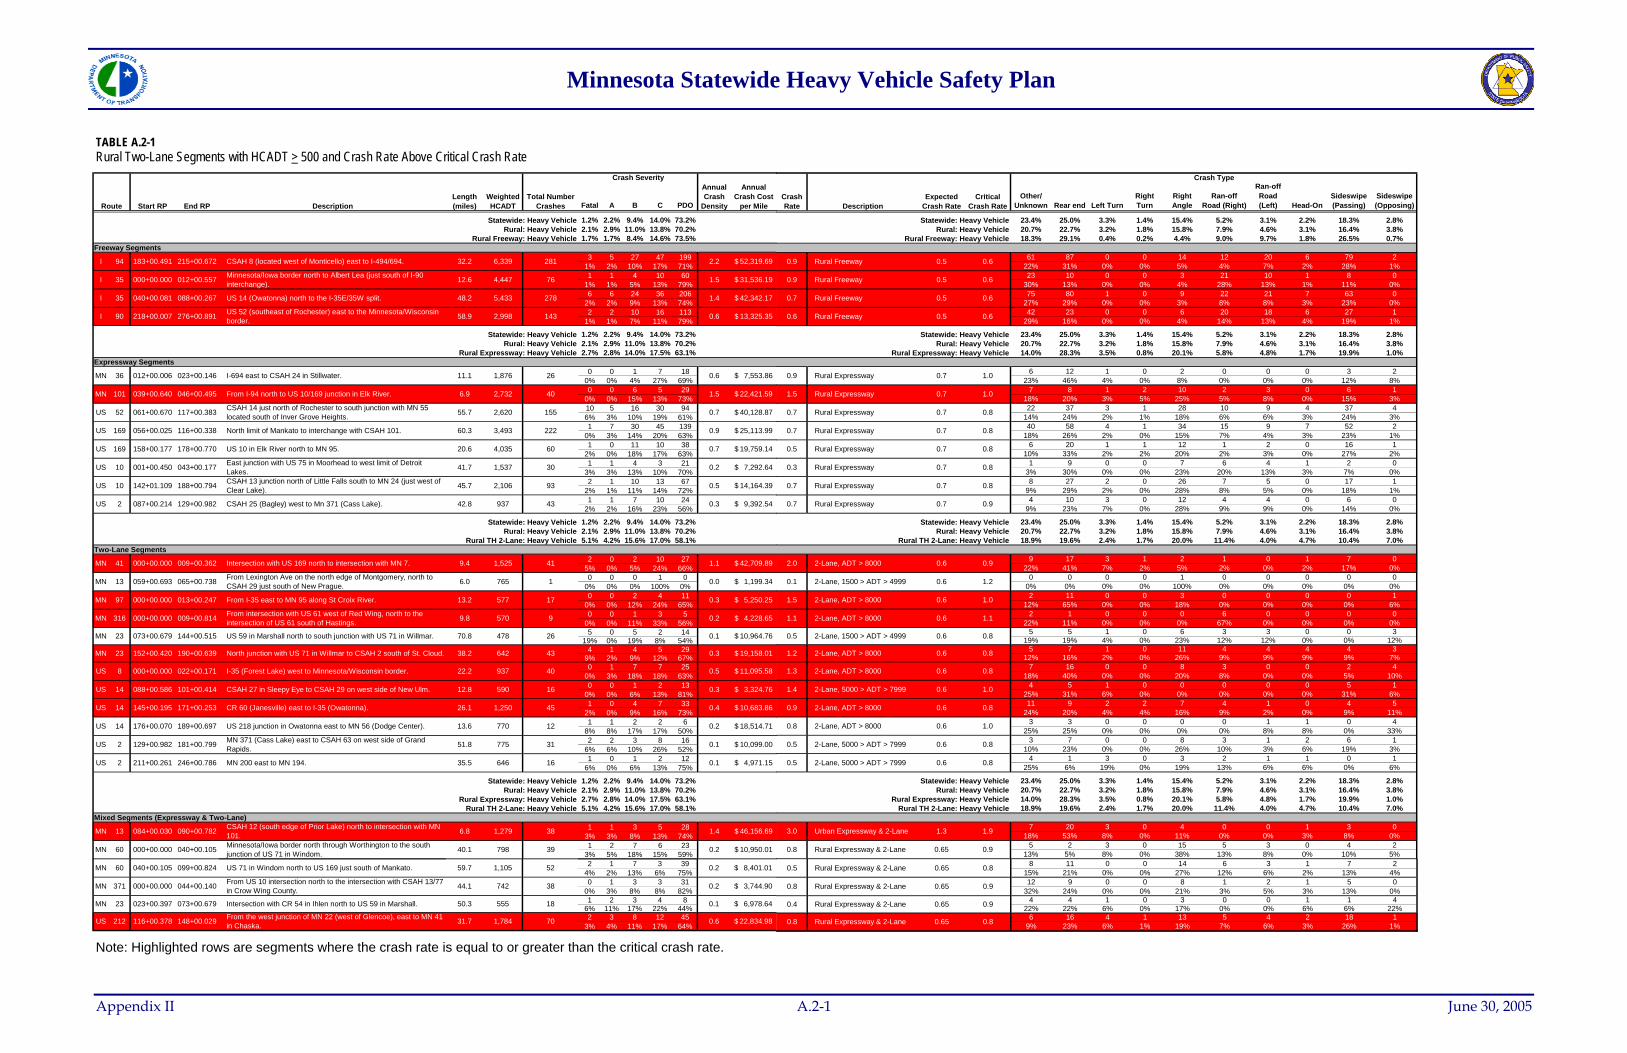
Minnesota Statewide Heavy Vehicle Safety Plan
TABLE A.2-1 Rural Two-Lane Segments with HCADT > 500 and Crash Rate Above Critical Crash Rate
Fatal A B C PDO
Statewide: Heavy Vehicle 1.2% 2.2% 9.4% 14.0% 73.2%Rural: Heavy Vehicle 2.1% 2.9% 11.0% 13.8% 70.2%
Rural Freeway: Heavy Vehicle 1.7% 1.7% 8.4% 14.6% 73.5%Freeway Segments
3 5 27 47 1991% 2% 10% 17% 71%1 1 4 10 60
1% 1% 5% 13% 79%6 6 24 36 206
2% 2% 9% 13% 74%2 2 10 16 113
1% 1% 7% 11% 79%
Statewide: Heavy Vehicle 1.2% 2.2% 9.4% 14.0% 73.2%Rural: Heavy Vehicle 2.1% 2.9% 11.0% 13.8% 70.2%
Rural Expressway: Heavy Vehicle 2.7% 2.8% 14.0% 17.5% 63.1%Ex
pressway Segments0 0 1 7 18
0% 0% 4% 27% 69%0 0 6 5 29
0% 0% 15% 13% 73%10 5 16 30 946% 3% 10% 19% 61%1 7 30 45 139
0% 3% 14% 20% 63%1 0 11 10 38
2% 0% 18% 17% 63%1 1 4 3 21
3% 3% 13% 10% 70%2 1 10 13 67
2% 1% 11% 14% 72%1 1 7 10 24
2% 2% 16% 23% 56%
Statewide: Heavy Vehicle 1.2% 2.2% 9.4% 14.0% 73.2%Rural: Heavy Vehicle 2.1% 2.9% 11.0% 13.8% 70.2%
Rural TH 2-Lane: Heavy Vehicle 5.1% 4.2% 15.6% 17.0% 58.1%wo-Lane Segments
2 0 2 10 275% 0% 5% 24% 66%0 0 0 1 0
0% 0% 0% 100% 0%0 0 2 4 11
0% 0% 12% 24% 65%0 0 1 3 5
0% 0% 11% 33% 56%5 0 5 2 14
19% 0% 19% 8% 54%4 1 4 5 29
9% 2% 9% 12% 67%0 1 7 7 25
0% 3% 18% 18% 63%0 0 1 2 13
0% 0% 6% 13% 81%1 0 4 7 33
2% 0% 9% 16% 73%1 1 2 2 6
8% 8% 17% 17% 50%2 2 3 8 16
6% 6% 10% 26% 52%1 0 1 2 12
6% 0% 6% 13% 75%
Statewide: Heavy Vehicle 1.2% 2.2% 9.4% 14.0% 73.2%Rural: Heavy Vehicle 2.1% 2.9% 11.0% 13.8% 70.2%
Rural Expressway: Heavy Vehicle 2.7% 2.8% 14.0% 17.5% 63.1%Rural TH 2-Lane: Heavy Vehicle 5.1% 4.2% 15.6% 17.0% 58.1%
ixed Segments (Expressway & Two-Lane)1 1 3 5 28
3% 3% 8% 13% 74%1 2 7 6 23
3% 5% 18% 15% 59%
Annual Crash
Density
Annual Crash Cost
per MileRoute Start RP End RP DescriptionLength (miles)
Weighted HCADT
Total Number Crashes
Crash Severity
770 12 0.2 18,514.71$ US 14 176+00.070 189+00.697 US 218 junction in Owatonna east to MN 56 (Dodge Center). 13.6
1,250 45 0.4 10,683.86$ 145+00.195 171+00.253 CR 60 (Janesville) east to I-35 (Owatonna). 26.1US 14
I 94 215+00.672 32.2 6,339 281
35I
I
I
183+00.491
040+00.08135
90
000+00.000 012+00.557 12.6 4,447
088+00.267 48.2 5,433
218+00.007 276+00.891 58.9 2,998
2.2 52,319.69$
31,536.19$
42,342.17$
MN 36 012+00.006 023+00.146 11.1 1,876I-694 east to CSAH 24 in Stillwater.
278 1.4
76 1.5
26
143 0.6 13,325.35$
0.6 7,553.86$
MN 13 059+00.693 065+00.738 6.0 765From Lexington Ave on the north edge of Montgomery, north to CSAH 29 just south of New Prague. 1 0.0 1,199.34$
MN 23 073+00.679 144+00.515 70.8 478US 59 in Marshall north to south junction with US 71 in Willmar. 26 0.1 10,964.76$
US 2 087+00.214 129+00.982 42.8 937CSAH 25 (Bagley) west to Mn 371 (Cass Lake). 43 0.3 9,392.54$
US 2 129+00.982 181+00.799 51.8 775MN 371 (Cass Lake) east to CSAH 63 on west side of Grand Rapids. 31 0.1 10,099.00$
US 2 211+00.261 246+00.786 35.5 646MN 200 east to MN 194. 16 0.1 4,971.15$
US 52 061+00.670 117+00.383 55.7 2,620CSAH 14 just north of Rochester to south junction with MN 55 located south of Inver Grove Heights. 155 0.7 40,128.87$
US 169 056+00.025 116+00.338 60.3 3,493North limit of Mankato to interchange with CSAH 101. 222 0.9 25,113.99$
US 169 158+00.177 178+00.770 20.6 4,035US 10 in Elk River north to MN 95. 60 0.7 19,759.14$
US 10 001+00.450 043+00.177 41.7 1,537East junction with US 75 in Moorhead to west limit of Detroit Lakes. 30 0.2 7,292.64$
US 10 142+01.109 188+00.794 45.7 2,106CSAH 13 junction north of Little Falls south to MN 24 (just west of Clear Lake). 93 0.5 14,164.39$
MN 41 000+00.000 009+00.362 9.4 1,525Intersection with US 169 north to intersection with MN 7. 41 1.1 42,709.89$
MN 23 152+00.420 190+00.639 38.2 642North junction with US 71 in Willmar to CSAH 2 south of St. Cloud. 43 0.3 19,158.01$
MN 13 084+00.030 090+00.782 6.8 1,279CSAH 12 (south edge of Prior Lake) north to intersection with MN 101. 38 1.4 46,156.69$
MN 60 000+00.000 040+00.105 40.1 798Minnesota/Iowa border north through Worthington to the south junction of US 71 in Windom. 39 0.2 10,950.01$
MN 97 000+00.000 013+00.247 13.2 577From I-35 east to MN 95 along St Croix River. 17 0.3 5,250.25$
MN 101 039+00.640 046+00.495 6.9 2,732From I-94 north to US 10/169 junction in Elk River. 40 1.5 22,421.59$
MN 316 000+00.000 009+00.814 9.8 570From intersection with US 61 west of Red Wing, north to the intersection of US 61 south of Hastings. 9 0.2 4,228.65$
US 8 000+00.000 022+00.171 22.2 937I-35 (Forest Lake) west to Minnesota/Wisconsin border. 40 0.5 11,095.58$
US 14 088+00.586 101+00.414 12.8 590CSAH 27 in Sleepy Eye to CSAH 29 on west side of New Ulm. 16 0.3 3,324.76$
CSAH 8 (located west of Monticello) east to I-494/694.
Minnesota/Iowa border north to Albert Lea (just south of I-90 interchange).
US 14 (Owatonna) north to the I-35E/35W split.
US 52 (southeast of Rochester) east to the Minnesota/Wisconsin border.
T
M
Other/ Unknown Rear end Left Turn
Right Turn
Right Angle
Ran-off Road (Right)
Ran-off Road (Left) Head-On
Sideswipe (Passing)
Sideswipe (Opposing)
Statewide: Heavy Vehicle 23.4% 25.0% 3.3% 1.4% 15.4% 5.2% 3.1% 2.2% 18.3% 2.8%Rural: Heavy Vehicle 20.7% 22.7% 3.2% 1.8% 15.8% 7.9% 4.6% 3.1% 16.4% 3.8%
Rural Freeway: Heavy Vehicle 18.3% 29.1% 0.4% 0.2% 4.4% 9.0% 9.7% 1.8% 26.5% 0.7%
61 87 0 0 14 12 20 6 79 222% 31% 0% 0% 5% 4% 7% 2% 28% 1%23 10 0 0 3 21 10 1 8 0
30% 13% 0% 0% 4% 28% 13% 1% 11% 0%75 80 1 0 9 22 21 7 63 0
27% 29% 0% 0% 3% 8% 8% 3% 23% 0%42 23 0 0 6 20 18 6 27 1
29% 16% 0% 0% 4% 14% 13% 4% 19% 1%
Statewide: Heavy Vehicle 23.4% 25.0% 3.3% 1.4% 15.4% 5.2% 3.1% 2.2% 18.3% 2.8%Rural: Heavy Vehicle 20.7% 22.7% 3.2% 1.8% 15.8% 7.9% 4.6% 3.1% 16.4% 3.8%
Rural Expressway: Heavy Vehicle 14.0% 28.3% 3.5% 0.8% 20.1% 5.8% 4.8% 1.7% 19.9% 1.0%
6 12 1 0 2 0 0 0 3 223% 46% 4% 0% 8% 0% 0% 0% 12% 8%
7 8 1 2 10 2 3 0 6 118% 20% 3% 5% 25% 5% 8% 0% 15% 3%22 37 3 1 28 10 9 4 37 4
14% 24% 2% 1% 18% 6% 6% 3% 24% 3%40 58 4 1 34 15 9 7 52 2
18% 26% 2% 0% 15% 7% 4% 3% 23% 1%6 20 1 1 12 1 2 0 16 1
10% 33% 2% 2% 20% 2% 3% 0% 27% 2%1 9 0 0 7 6 4 1 2 0
3% 30% 0% 0% 23% 20% 13% 3% 7% 0%8 27 2 0 26 7 5 0 17 1
9% 29% 2% 0% 28% 8% 5% 0% 18% 1%4 10 3 0 12 4 4 0 6 0
9% 23% 7% 0% 28% 9% 9% 0% 14% 0%
Statewide: Heavy Vehicle 23.4% 25.0% 3.3% 1.4% 15.4% 5.2% 3.1% 2.2% 18.3% 2.8%Rural: Heavy Vehicle 20.7% 22.7% 3.2% 1.8% 15.8% 7.9% 4.6% 3.1% 16.4% 3.8%
Rural TH 2-Lane: Heavy Vehicle 18.9% 19.6% 2.4% 1.7% 20.0% 11.4% 4.0% 4.7% 10.4% 7.0%
9 17 3 1 2 1 0 1 7 022% 41% 7% 2% 5% 2% 0% 2% 17% 0%
0 0 0 0 1 0 0 0 0 00% 0% 0% 0% 100% 0% 0% 0% 0% 0%2 11 0 0 3 0 0 0 0 1
12% 65% 0% 0% 18% 0% 0% 0% 0% 6%2 1 0 0 0 6 0 0 0 0
22% 11% 0% 0% 0% 67% 0% 0% 0% 0%5 5 1 0 6 3 3 0 0 3
19% 19% 4% 0% 23% 12% 12% 0% 0% 12%5 7 1 0 11 4 4 4 4 3
12% 16% 2% 0% 26% 9% 9% 9% 9% 7%7 16 0 0 8 3 0 0 2 4
18% 40% 0% 0% 20% 8% 0% 0% 5% 10%4 5 1 0 0 0 0 0 5 1
25% 31% 6% 0% 0% 0% 0% 0% 31% 6%11 9 2 2 7 4 1 0 4 5
24% 20% 4% 4% 16% 9% 2% 0% 9% 11%3 3 0 0 0 0 1 1 0 4
25% 25% 0% 0% 0% 0% 8% 8% 0% 33%3 7 0 0 8 3 1 2 6 1
10% 23% 0% 0% 26% 10% 3% 6% 19% 3%4 1 3 0 3 2 1 1 0 1
25% 6% 19% 0% 19% 13% 6% 6% 0% 6%
Statewide: Heavy Vehicle 23.4% 25.0% 3.3% 1.4% 15.4% 5.2% 3.1% 2.2% 18.3% 2.8%Rural: Heavy Vehicle 20.7% 22.7% 3.2% 1.8% 15.8% 7.9% 4.6% 3.1% 16.4% 3.8%
Rural Expressway: Heavy Vehicle 14.0% 28.3% 3.5% 0.8% 20.1% 5.8% 4.8% 1.7% 19.9% 1.0%Rural TH 2-Lane: Heavy Vehicle 18.9% 19.6% 2.4% 1.7% 20.0% 11.4% 4.0% 4.7% 10.4% 7.0%
7 20 3 0 4 0 0 1 3 018% 53% 8% 0% 11% 0% 0% 3% 8% 0%
5 2 3 0 15 5 3 0 4 213% 5% 8% 0% 38% 13% 8% 0% 10% 5%
Expected Crash Rate
Critical Crash Rate
Crash Rate Description
Crash Type
1.00.8 2-Lane, ADT > 8000 0.6
0.80.9 2-Lane, ADT > 8000 0.6
Rural Freeway 0.5
0.9
0.6
0.9
0.7
0.9
0.6
Rural Freeway 0.5 0.6
0.6
Rural Freeway 0.5 0.6
Rural Freeway 0.5
Rural Expressway 0.7 1.0
0.1 2-Lane, 1500 > ADT > 4999 0.6 1.2
0.5 2-Lane, 1500 > ADT > 4999 0.6 0.8
0.7 Rural Expressway 0.7 0.9
0.5 2-Lane, 5000 > ADT > 7999 0.6 0.8
0.5 2-Lane, 5000 > ADT > 7999 0.6 0.8
0.7 Rural Expressway 0.7 0.8
0.7 Rural Expressway 0.7 0.8
0.5 Rural Expressway 0.7 0.8
0.3 Rural Expressway 0.7 0.8
0.7 Rural Expressway 0.7 0.8
2.0 2-Lane, ADT > 8000 0.6 0.9
1.2 2-Lane, ADT > 8000 0.6 0.8
3.0 Urban Expressway & 2-Lane 1.3 1.9
0.8 Rural Expressway & 2-Lane 0.65 0.9
1.5 2-Lane, ADT > 8000 0.6 1.0
1.5 Rural Expressway 0.7 1.0
1.1 2-Lane, ADT > 8000 0.6 1.1
1.3 2-Lane, ADT > 8000 0.6 0.8
1.4 2-Lane, 5000 > ADT > 7999 0.6 1.0
2 1 7 3 394% 2% 13% 6% 75%0 1 3 3 31
0% 3% 8% 8% 82%1 2 3 4 8
6% 11% 17% 22% 44%2 3 8 12 45
3% 4% 11% 17% 64%
N 60 040+00.105 099+00.824 59.7 1,105US 71 in Windom north to US 169 just south of Mankato. 52 0.2 8,401.01$
MN 371 000+00.000 044+00.140 44.1 742From US 10 intersection north to the intersection with CSAH 13/77 in Crow Wing County. 38 0.2 3,744.90$
N 23 023+00.397 073+00.679 50.3 555Intersection with CR 54 in Ihlen north to US 59 in Marshall. 18 0.1 6,978.64$
US 212 116+00.378 148+00.029 31.7 1,784From the west junction of MN 22 (west of Glencoe), east to MN 41 in Chaska. 70 0.6 22,834.98$
M
M
8 11 0 0 14 6 3 1 7 215% 21% 0% 0% 27% 12% 6% 2% 13% 4%12 9 0 0 8 1 2 1 5 0
32% 24% 0% 0% 21% 3% 5% 3% 13% 0%4 4 1 0 3 0 0 1 1 4
22% 22% 6% 0% 17% 0% 0% 6% 6% 22%6 16 4 1 13 5 4 2 18 1
9% 23% 6% 1% 19% 7% 6% 3% 26% 1%
0.5 Rural Expressway & 2-Lane 0.65 0.8
0.8 Rural Expressway & 2-Lane 0.65 0.9
0.4 Rural Expressway & 2-Lane 0.65 0.9
0.8 Rural Expressway & 2-Lane 0.65 0.8
Note: Highlighted rows are segments where the crash rate is equal to or greater than the critical crash rate.
Appendix II A.2-1 June 30, 2005

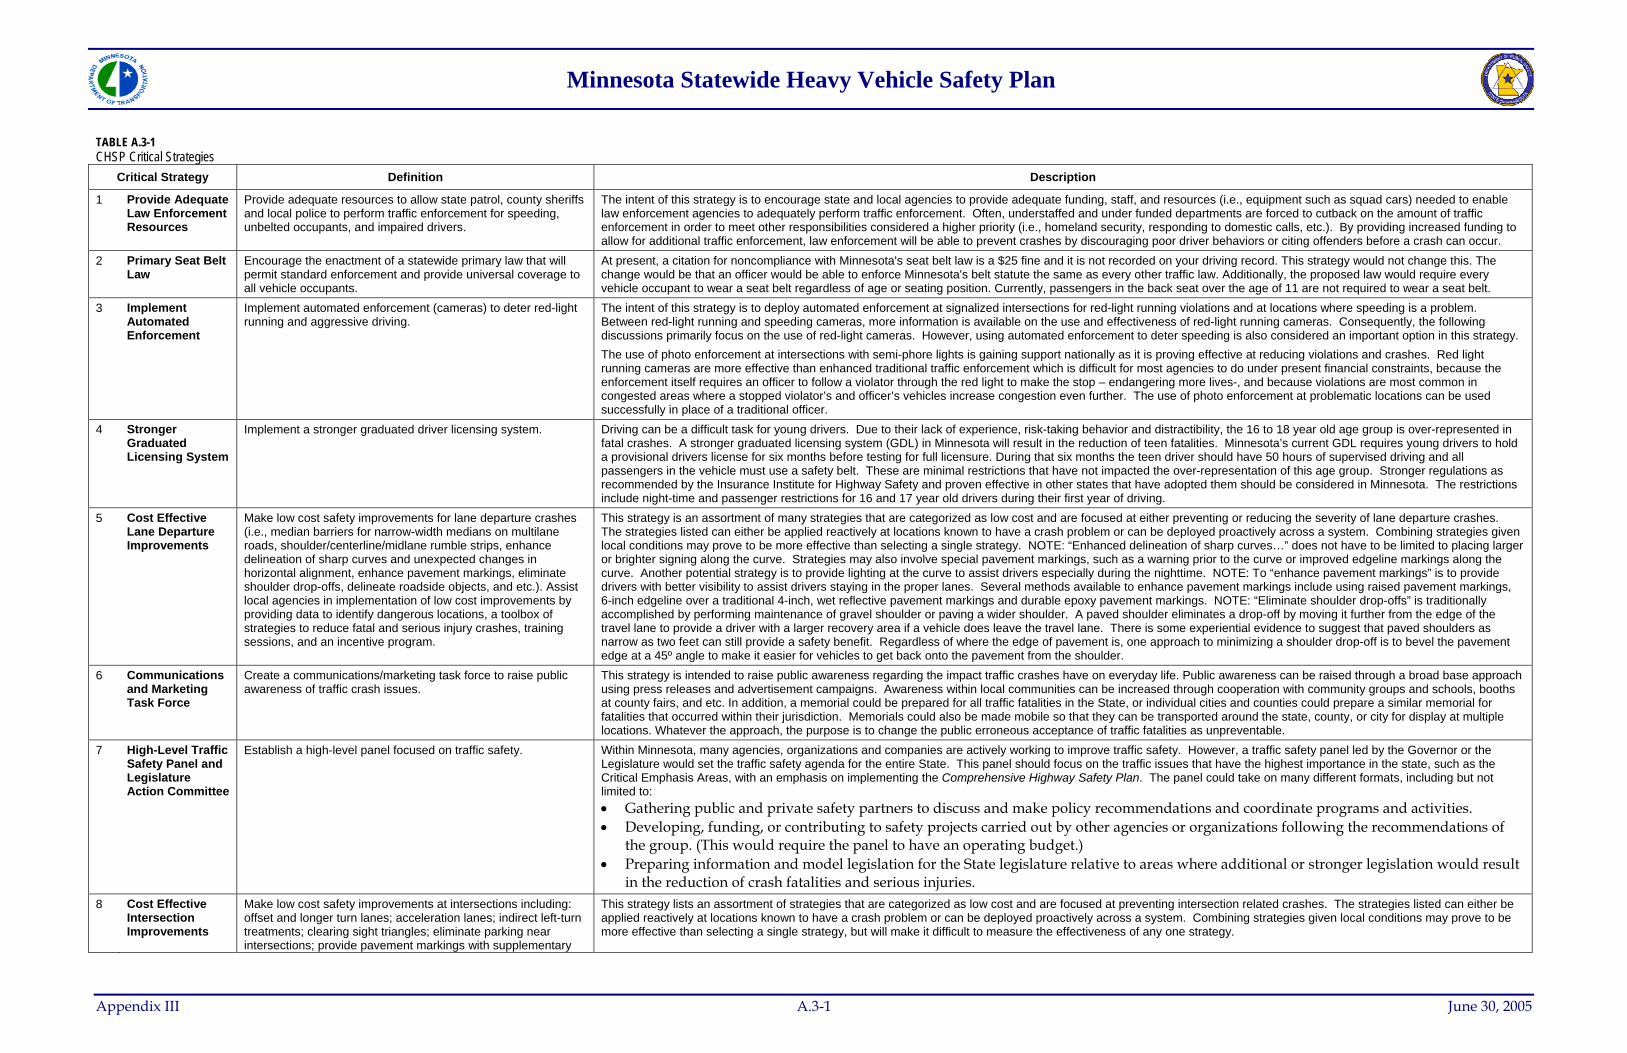
Minnesota Statewide Heavy Vehicle Safety Plan
TABLE A.3-1 CHSP Critical Strategies
Critical Strategy Definition Description
1 Provide Adequate Law Enforcement Resources
Provide adequate resources to allow state patrol, county sheriffs and local police to perform traffic enforcement for speeding, unbelted occupants, and impaired drivers.
The intent of this strategy is to encourage state and local agencies to provide adequate funding, staff, and resources (i.e., equipment such as squad cars) needed to enable law enforcement agencies to adequately perform traffic enforcement. Often, understaffed and under funded departments are forced to cutback on the amount of traffic enforcement in order to meet other responsibilities considered a higher priority (i.e., homeland security, responding to domestic calls, etc.). By providing increased funding to allow for additional traffic enforcement, law enforcement will be able to prevent crashes by discouraging poor driver behaviors or citing offenders before a crash can occur.
2 Primary Seat Belt Law
Encourage the enactment of a statewide primary law that will permit standard enforcement and provide universal coverage to all vehicle occupants.
At present, a citation for noncompliance with Minnesota's seat belt law is a $25 fine and it is not recorded on your driving record. This strategy would not change this. The change would be that an officer would be able to enforce Minnesota's belt statute the same as every other traffic law. Additionally, the proposed law would require every vehicle occupant to wear a seat belt regardless of age or seating position. Currently, passengers in the back seat over the age of 11 are not required to wear a seat belt.
3 Implement Automated Enforcement
Implement automated enforcement (cameras) to deter red-light running and aggressive driving.
The intent of this strategy is to deploy automated enforcement at signalized intersections for red-light running violations and at locations where speeding is a problem. Between red-light running and speeding cameras, more information is available on the use and effectiveness of red-light running cameras. Consequently, the following discussions primarily focus on the use of red-light cameras. However, using automated enforcement to deter speeding is also considered an important option in this strategy. The use of photo enforcement at intersections with semi-phore lights is gaining support nationally as it is proving effective at reducing violations and crashes. Red light running cameras are more effective than enhanced traditional traffic enforcement which is difficult for most agencies to do under present financial constraints, because the enforcement itself requires an officer to follow a violator through the red light to make the stop – endangering more lives-, and because violations are most common in congested areas where a stopped violator’s and officer’s vehicles increase congestion even further. The use of photo enforcement at problematic locations can be used successfully in place of a traditional officer.
4 Stronger Graduated Licensing System
Implement a stronger graduated driver licensing system. Driving can be a difficult task for young drivers. Due to their lack of experience, risk-taking behavior and distractibility, the 16 to 18 year old age group is over-represented in fatal crashes. A stronger graduated licensing system (GDL) in Minnesota will result in the reduction of teen fatalities. Minnesota’s current GDL requires young drivers to hold a provisional drivers license for six months before testing for full licensure. During that six months the teen driver should have 50 hours of supervised driving and all passengers in the vehicle must use a safety belt. These are minimal restrictions that have not impacted the over-representation of this age group. Stronger regulations as recommended by the Insurance Institute for Highway Safety and proven effective in other states that have adopted them should be considered in Minnesota. The restrictions include night-time and passenger restrictions for 16 and 17 year old drivers during their first year of driving.
5 Cost Effective Lane Departure Improvements
Make low cost safety improvements for lane departure crashes (i.e., median barriers for narrow-width medians on multilane roads, shoulder/centerline/midlane rumble strips, enhance delineation of sharp curves and unexpected changes in horizontal alignment, enhance pavement markings, eliminate shoulder drop-offs, delineate roadside objects, and etc.). Assist local agencies in implementation of low cost improvements by providing data to identify dangerous locations, a toolbox of strategies to reduce fatal and serious injury crashes, training sessions, and an incentive program.
This strategy is an assortment of many strategies that are categorized as low cost and are focused at either preventing or reducing the severity of lane departure crashes. The strategies listed can either be applied reactively at locations known to have a crash problem or can be deployed proactively across a system. Combining strategies given local conditions may prove to be more effective than selecting a single strategy. NOTE: “Enhanced delineation of sharp curves…” does not have to be limited to placing larger or brighter signing along the curve. Strategies may also involve special pavement markings, such as a warning prior to the curve or improved edgeline markings along the curve. Another potential strategy is to provide lighting at the curve to assist drivers especially during the nighttime. NOTE: To “enhance pavement markings” is to provide drivers with better visibility to assist drivers staying in the proper lanes. Several methods available to enhance pavement markings include using raised pavement markings, 6-inch edgeline over a traditional 4-inch, wet reflective pavement markings and durable epoxy pavement markings. NOTE: “Eliminate shoulder drop-offs” is traditionally accomplished by performing maintenance of gravel shoulder or paving a wider shoulder. A paved shoulder eliminates a drop-off by moving it further from the edge of the travel lane to provide a driver with a larger recovery area if a vehicle does leave the travel lane. There is some experiential evidence to suggest that paved shoulders as narrow as two feet can still provide a safety benefit. Regardless of where the edge of pavement is, one approach to minimizing a shoulder drop-off is to bevel the pavement edge at a 45º angle to make it easier for vehicles to get back onto the pavement from the shoulder.
6 Communications and Marketing Task Force
Create a communications/marketing task force to raise public awareness of traffic crash issues.
This strategy is intended to raise public awareness regarding the impact traffic crashes have on everyday life. Public awareness can be raised through a broad base approach using press releases and advertisement campaigns. Awareness within local communities can be increased through cooperation with community groups and schools, booths at county fairs, and etc. In addition, a memorial could be prepared for all traffic fatalities in the State, or individual cities and counties could prepare a similar memorial for fatalities that occurred within their jurisdiction. Memorials could also be made mobile so that they can be transported around the state, county, or city for display at multiple locations. Whatever the approach, the purpose is to change the public erroneous acceptance of traffic fatalities as unpreventable.
7 High-Level Traffic Safety Panel and Legislature Action Committee
Establish a high-level panel focused on traffic safety. Within Minnesota, many agencies, organizations and companies are actively working to improve traffic safety. However, a traffic safety panel led by the Governor or the Legislature would set the traffic safety agenda for the entire State. This panel should focus on the traffic issues that have the highest importance in the state, such as the Critical Emphasis Areas, with an emphasis on implementing the Comprehensive Highway Safety Plan. The panel could take on many different formats, including but not limited to: • Gathering public and private safety partners to discuss and make policy recommendations and coordinate programs and activities. • Developing, funding, or contributing to safety projects carried out by other agencies or organizations following the recommendations of
the group. (This would require the panel to have an operating budget.) • Preparing information and model legislation for the State legislature relative to areas where additional or stronger legislation would result
in the reduction of crash fatalities and serious injuries. 8 Cost Effective
Intersection Improvements
Make low cost safety improvements at intersections including: offset and longer turn lanes; acceleration lanes; indirect left-turn treatments; clearing sight triangles; eliminate parking near intersections; provide pavement markings with supplementary
This strategy lists an assortment of strategies that are categorized as low cost and are focused at preventing intersection related crashes. The strategies listed can either be applied reactively at locations known to have a crash problem or can be deployed proactively across a system. Combining strategies given local conditions may prove to be more effective than selecting a single strategy, but will make it difficult to measure the effectiveness of any one strategy.
Appendix III A.3-1 June 30, 2005
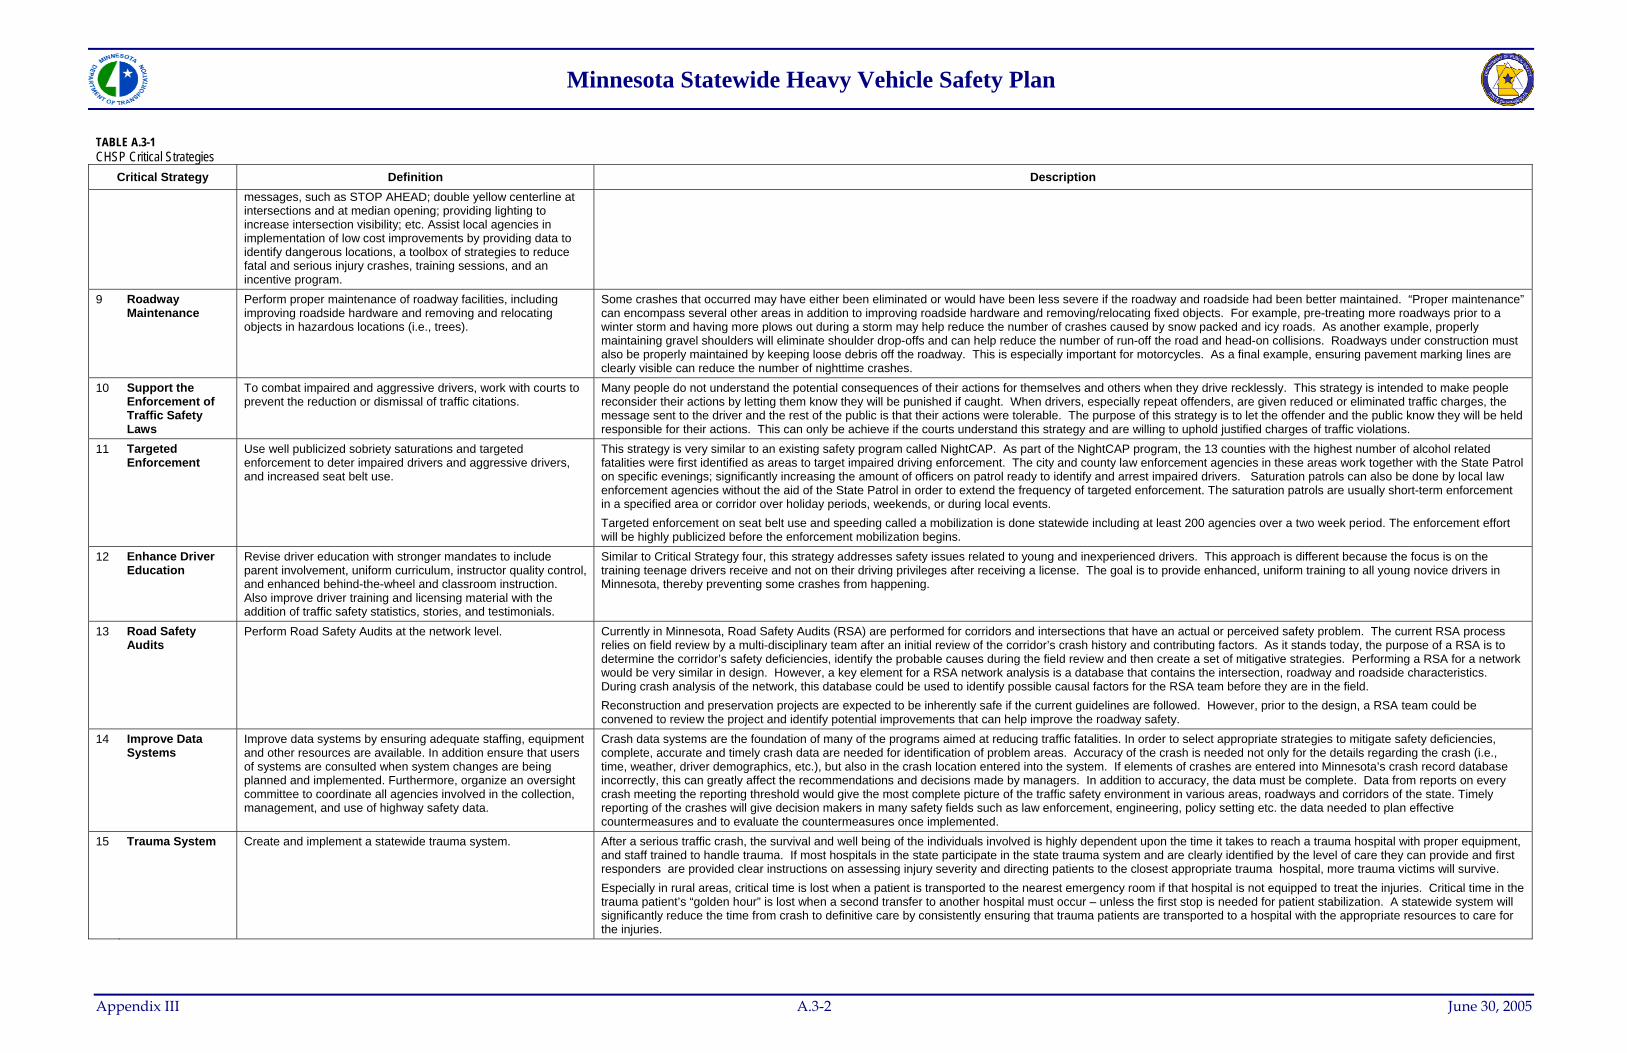
Minnesota Statewide Heavy Vehicle Safety Plan
TABLE A.3-1 CHSP Critical Strategies
Critical Strategy Definition Description messages, such as STOP AHEAD; double yellow centerline at intersections and at median opening; providing lighting to increase intersection visibility; etc. Assist local agencies in implementation of low cost improvements by providing data to identify dangerous locations, a toolbox of strategies to reduce fatal and serious injury crashes, training sessions, and an incentive program.
9 Roadway Maintenance
Perform proper maintenance of roadway facilities, including improving roadside hardware and removing and relocating objects in hazardous locations (i.e., trees).
Some crashes that occurred may have either been eliminated or would have been less severe if the roadway and roadside had been better maintained. “Proper maintenance” can encompass several other areas in addition to improving roadside hardware and removing/relocating fixed objects. For example, pre-treating more roadways prior to a winter storm and having more plows out during a storm may help reduce the number of crashes caused by snow packed and icy roads. As another example, properly maintaining gravel shoulders will eliminate shoulder drop-offs and can help reduce the number of run-off the road and head-on collisions. Roadways under construction must also be properly maintained by keeping loose debris off the roadway. This is especially important for motorcycles. As a final example, ensuring pavement marking lines are clearly visible can reduce the number of nighttime crashes.
10 Support the Enforcement of Traffic Safety Laws
To combat impaired and aggressive drivers, work with courts to prevent the reduction or dismissal of traffic citations.
Many people do not understand the potential consequences of their actions for themselves and others when they drive recklessly. This strategy is intended to make people reconsider their actions by letting them know they will be punished if caught. When drivers, especially repeat offenders, are given reduced or eliminated traffic charges, the message sent to the driver and the rest of the public is that their actions were tolerable. The purpose of this strategy is to let the offender and the public know they will be held responsible for their actions. This can only be achieve if the courts understand this strategy and are willing to uphold justified charges of traffic violations.
11 Targeted Enforcement
Use well publicized sobriety saturations and targeted enforcement to deter impaired drivers and aggressive drivers, and increased seat belt use.
This strategy is very similar to an existing safety program called NightCAP. As part of the NightCAP program, the 13 counties with the highest number of alcohol related fatalities were first identified as areas to target impaired driving enforcement. The city and county law enforcement agencies in these areas work together with the State Patrol on specific evenings; significantly increasing the amount of officers on patrol ready to identify and arrest impaired drivers. Saturation patrols can also be done by local law enforcement agencies without the aid of the State Patrol in order to extend the frequency of targeted enforcement. The saturation patrols are usually short-term enforcement in a specified area or corridor over holiday periods, weekends, or during local events. Targeted enforcement on seat belt use and speeding called a mobilization is done statewide including at least 200 agencies over a two week period. The enforcement effort will be highly publicized before the enforcement mobilization begins.
12 Enhance Driver Education
Revise driver education with stronger mandates to include parent involvement, uniform curriculum, instructor quality control, and enhanced behind-the-wheel and classroom instruction. Also improve driver training and licensing material with the addition of traffic safety statistics, stories, and testimonials.
Similar to Critical Strategy four, this strategy addresses safety issues related to young and inexperienced drivers. This approach is different because the focus is on the training teenage drivers receive and not on their driving privileges after receiving a license. The goal is to provide enhanced, uniform training to all young novice drivers in Minnesota, thereby preventing some crashes from happening.
13 Road Safety Audits
Perform Road Safety Audits at the network level. Currently in Minnesota, Road Safety Audits (RSA) are performed for corridors and intersections that have an actual or perceived safety problem. The current RSA process relies on field review by a multi-disciplinary team after an initial review of the corridor’s crash history and contributing factors. As it stands today, the purpose of a RSA is to determine the corridor’s safety deficiencies, identify the probable causes during the field review and then create a set of mitigative strategies. Performing a RSA for a network would be very similar in design. However, a key element for a RSA network analysis is a database that contains the intersection, roadway and roadside characteristics. During crash analysis of the network, this database could be used to identify possible causal factors for the RSA team before they are in the field. Reconstruction and preservation projects are expected to be inherently safe if the current guidelines are followed. However, prior to the design, a RSA team could be convened to review the project and identify potential improvements that can help improve the roadway safety.
14 Improve Data Systems
Improve data systems by ensuring adequate staffing, equipment and other resources are available. In addition ensure that users of systems are consulted when system changes are being planned and implemented. Furthermore, organize an oversight committee to coordinate all agencies involved in the collection, management, and use of highway safety data.
Crash data systems are the foundation of many of the programs aimed at reducing traffic fatalities. In order to select appropriate strategies to mitigate safety deficiencies, complete, accurate and timely crash data are needed for identification of problem areas. Accuracy of the crash is needed not only for the details regarding the crash (i.e., time, weather, driver demographics, etc.), but also in the crash location entered into the system. If elements of crashes are entered into Minnesota’s crash record database incorrectly, this can greatly affect the recommendations and decisions made by managers. In addition to accuracy, the data must be complete. Data from reports on every crash meeting the reporting threshold would give the most complete picture of the traffic safety environment in various areas, roadways and corridors of the state. Timely reporting of the crashes will give decision makers in many safety fields such as law enforcement, engineering, policy setting etc. the data needed to plan effective countermeasures and to evaluate the countermeasures once implemented.
15 Trauma System Create and implement a statewide trauma system. After a serious traffic crash, the survival and well being of the individuals involved is highly dependent upon the time it takes to reach a trauma hospital with proper equipment, and staff trained to handle trauma. If most hospitals in the state participate in the state trauma system and are clearly identified by the level of care they can provide and first responders are provided clear instructions on assessing injury severity and directing patients to the closest appropriate trauma hospital, more trauma victims will survive. Especially in rural areas, critical time is lost when a patient is transported to the nearest emergency room if that hospital is not equipped to treat the injuries. Critical time in the trauma patient’s “golden hour” is lost when a second transfer to another hospital must occur – unless the first stop is needed for patient stabilization. A statewide system will significantly reduce the time from crash to definitive care by consistently ensuring that trauma patients are transported to a hospital with the appropriate resources to care for the injuries.
Appendix III A.3-2 June 30, 2005
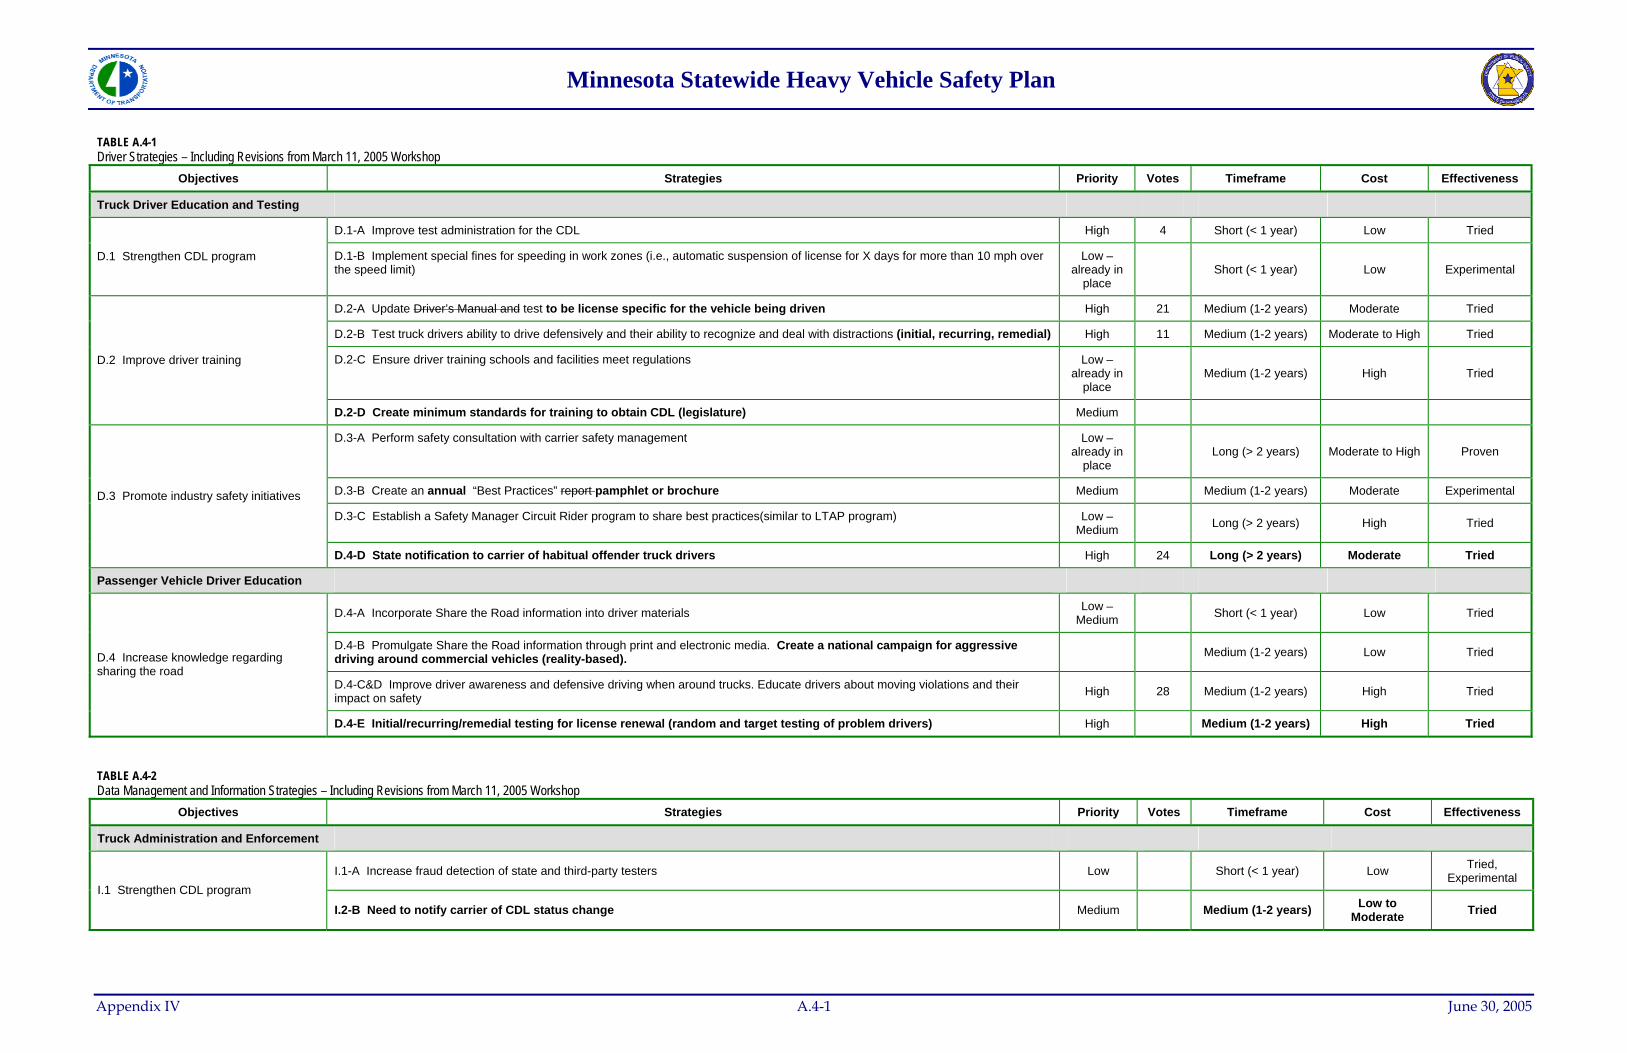
Minnesota Statewide Heavy Vehicle Safety Plan
TABLE A.4-1 Driver Strategies – Including Revisions from March 11, 2005 Workshop
Objectives Strategies Priority Votes Timeframe Cost Effectiveness
Truck Driver Education and Testing
D.1-A Improve test administration for the CDL High 4 Short (< 1 year) Low Tried
D.1 Strengthen CDL program D.1-B Implement special fines for speeding in work zones (i.e., automatic suspension of license for X days for more than 10 mph over the speed limit)
Low – already in
place Short (< 1 year) Low Experimental
D.2-A Update Driver’s Manual and test to be license specific for the vehicle being driven High 21 Medium (1-2 years) Moderate Tried
D.2-B Test truck drivers ability to drive defensively and their ability to recognize and deal with distractions (initial, recurring, remedial) High 11 Medium (1-2 years) Moderate to High Tried
D.2-C Ensure driver training schools and facilities meet regulations Low – already in
place Medium (1-2 years) High Tried
D.2 Improve driver training
D.2-D Create minimum standards for training to obtain CDL (legislature) Medium
D.3-A Perform safety consultation with carrier safety management Low – already in
place Long (> 2 years) Moderate to High Proven
D.3-B Create an annual “Best Practices” report pamphlet or brochure Medium Medium (1-2 years) Moderate Experimental
D.3-C Establish a Safety Manager Circuit Rider program to share best practices(similar to LTAP program) Low – Medium Long (> 2 years) High Tried
D.3 Promote industry safety initiatives
D.4-D State notification to carrier of habitual offender truck drivers High 24 Long (> 2 years) Moderate Tried
Passenger Vehicle Driver Education
D.4-A Incorporate Share the Road information into driver materials Low – Medium Short (< 1 year) Low Tried
D.4-B Promulgate Share the Road information through print and electronic media. Create a national campaign for aggressive driving around commercial vehicles (reality-based). Medium (1-2 years) Low Tried
D.4-C&D Improve driver awareness and defensive driving when around trucks. Educate drivers about moving violations and their impact on safety High 28 Medium (1-2 years) High Tried
D.4 Increase knowledge regarding sharing the road
D.4-E Initial/recurring/remedial testing for license renewal (random and target testing of problem drivers) High Medium (1-2 years) High Tried
TABLE A.4-2 Data Management and Information Strategies – Including Revisions from March 11, 2005 Workshop
Objectives Strategies Priority Votes Timeframe Cost Effectiveness
Truck Administration and Enforcement
I.1-A Increase fraud detection of state and third-party testers Low Short (< 1 year) Low Tried, Experimental
I.1 Strengthen CDL program
I.2-B Need to notify carrier of CDL status change Medium Medium (1-2 years) Low to Moderate Tried
Appendix IV A.4-1 June 30, 2005
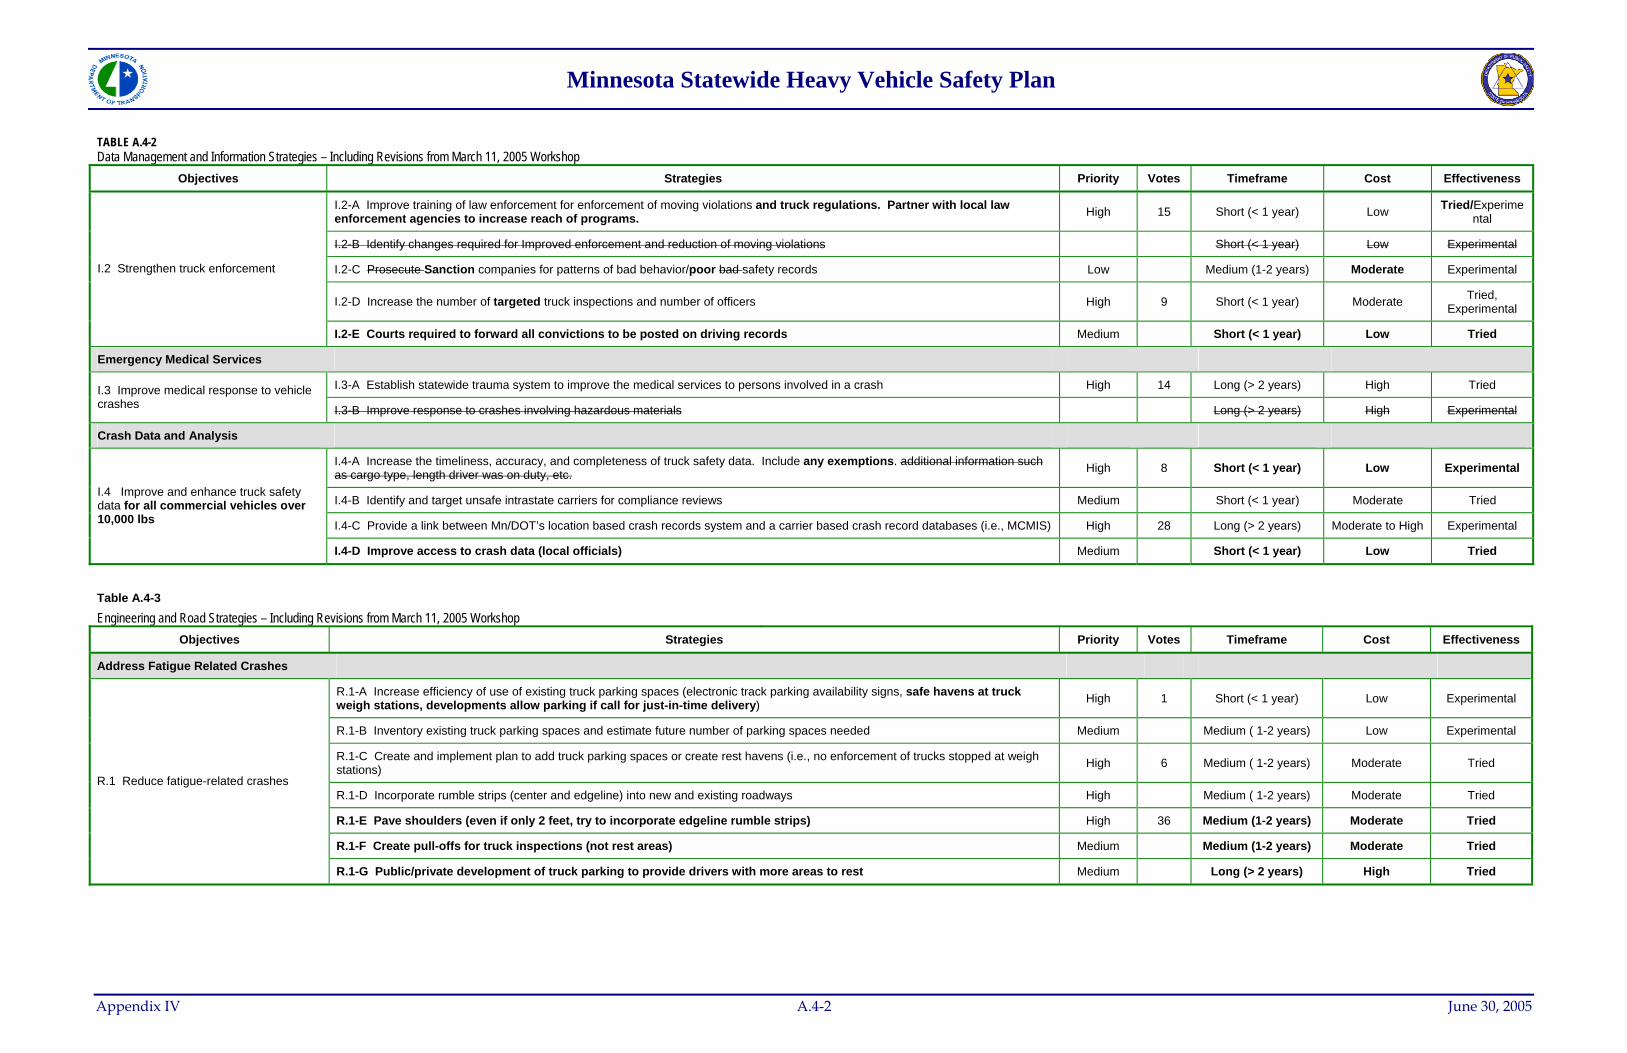
Minnesota Statewide Heavy Vehicle Safety Plan
TABLE A.4-2 Data Management and Information Strategies – Including Revisions from March 11, 2005 Workshop
Objectives Strategies Priority Votes Timeframe Cost Effectiveness
I.2-A Improve training of law enforcement for enforcement of moving violations and truck regulations. Partner with local law enforcement agencies to increase reach of programs. High 15 Short (< 1 year) Low Tried/Experime
ntal
I.2-B Identify changes required for Improved enforcement and reduction of moving violations Short (< 1 year) Low Experimental
I.2-C Prosecute Sanction companies for patterns of bad behavior/poor bad safety records Low Medium (1-2 years) Moderate Experimental
I.2-D Increase the number of targeted truck inspections and number of officers High 9 Short (< 1 year) Moderate Tried, Experimental
I.2 Strengthen truck enforcement
I.2-E Courts required to forward all convictions to be posted on driving records Medium Short (< 1 year) Low Tried
Emergency Medical Services
I.3-A Establish statewide trauma system to improve the medical services to persons involved in a crash High 14 Long (> 2 years) High Tried I.3 Improve medical response to vehicle crashes I.3-B Improve response to crashes involving hazardous materials Long (> 2 years) High Experimental
Crash Data and Analysis
I.4-A Increase the timeliness, accuracy, and completeness of truck safety data. Include any exemptions. additional information such as cargo type, length driver was on duty, etc. High 8 Short (< 1 year) Low Experimental
I.4-B Identify and target unsafe intrastate carriers for compliance reviews Medium Short (< 1 year) Moderate Tried
I.4-C Provide a link between Mn/DOT’s location based crash records system and a carrier based crash record databases (i.e., MCMIS) High 28 Long (> 2 years) Moderate to High Experimental
I.4 Improve and enhance truck safety data for all commercial vehicles over 10,000 lbs
I.4-D Improve access to crash data (local officials) Medium Short (< 1 year) Low Tried
Table A.4-3 Engineering and Road Strategies – Including Revisions from March 11, 2005 Workshop
Objectives Strategies Priority Votes Timeframe Cost Effectiveness
Address Fatigue Related Crashes
R.1-A Increase efficiency of use of existing truck parking spaces (electronic track parking availability signs, safe havens at truck weigh stations, developments allow parking if call for just-in-time delivery) High 1 Short (< 1 year) Low Experimental
R.1-B Inventory existing truck parking spaces and estimate future number of parking spaces needed Medium Medium ( 1-2 years) Low Experimental
R.1-C Create and implement plan to add truck parking spaces or create rest havens (i.e., no enforcement of trucks stopped at weigh stations) High 6 Medium ( 1-2 years) Moderate Tried
R.1-D Incorporate rumble strips (center and edgeline) into new and existing roadways High Medium ( 1-2 years) Moderate Tried
R.1-E Pave shoulders (even if only 2 feet, try to incorporate edgeline rumble strips) High 36 Medium (1-2 years) Moderate Tried
R.1-F Create pull-offs for truck inspections (not rest areas) Medium Medium (1-2 years) Moderate Tried
R.1 Reduce fatigue-related crashes
R.1-G Public/private development of truck parking to provide drivers with more areas to rest Medium Long (> 2 years) High Tried
Appendix IV A.4-2 June 30, 2005
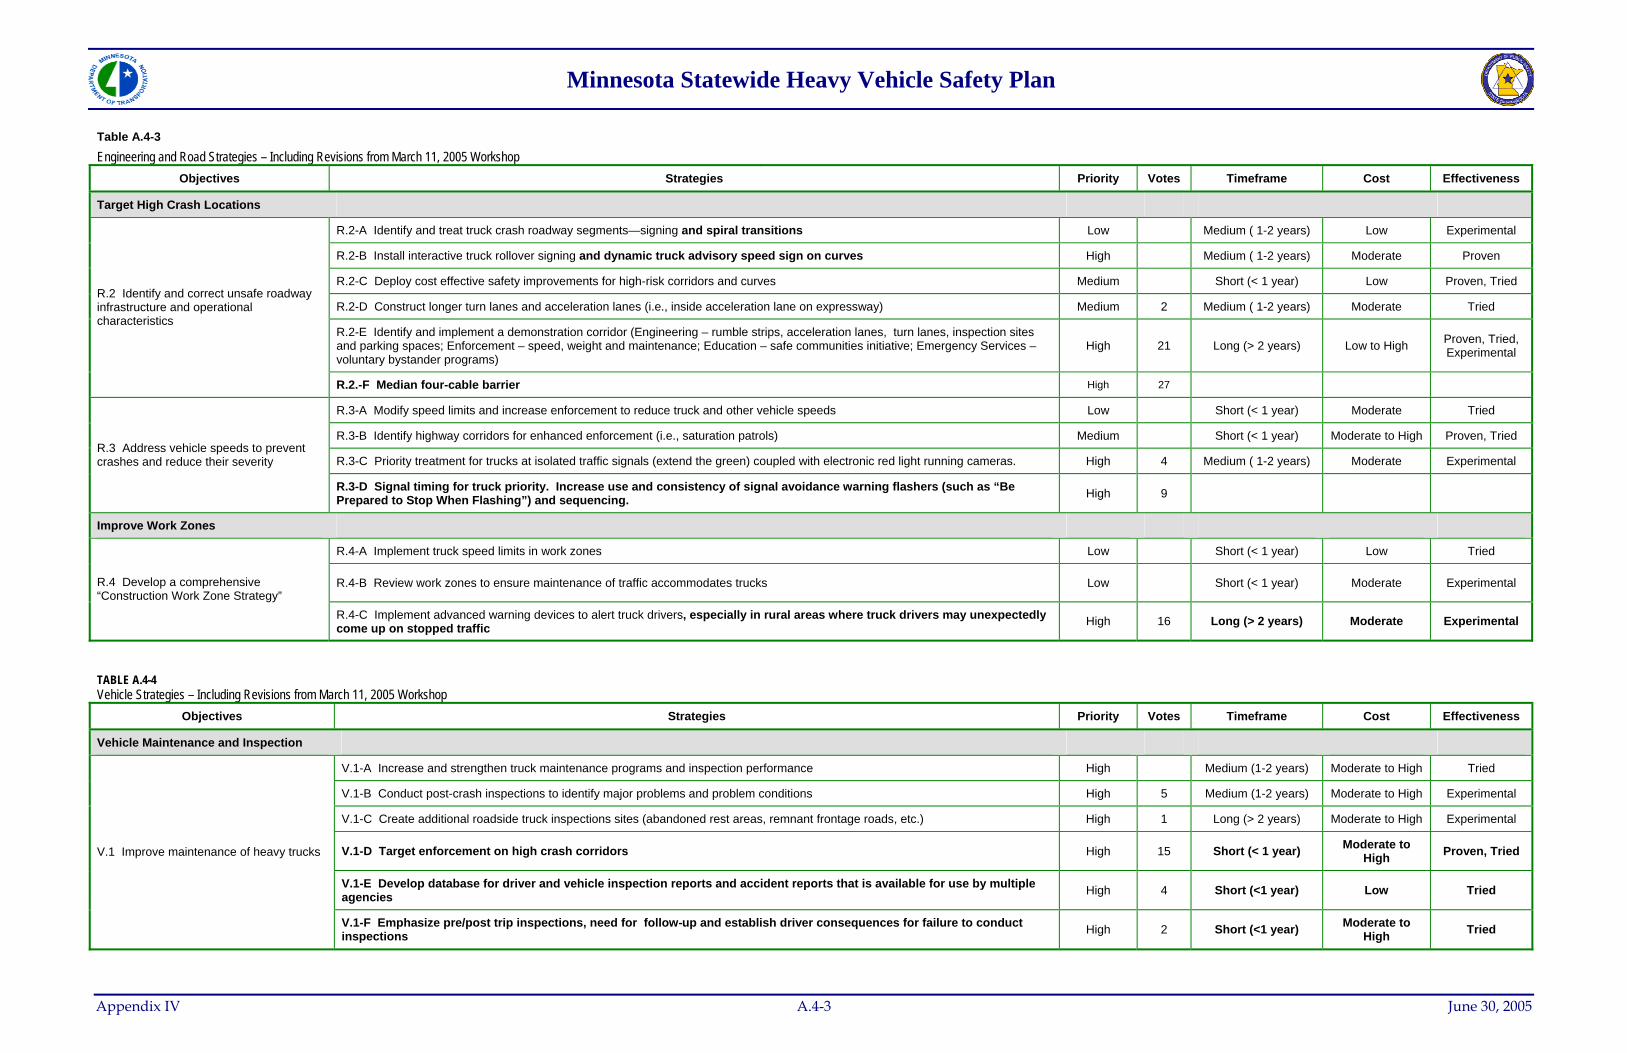
Minnesota Statewide Heavy Vehicle Safety Plan
Table A.4-3 Engineering and Road Strategies – Including Revisions from March 11, 2005 Workshop
Objectives Strategies Priority Votes Timeframe Cost Effectiveness
Target High Crash Locations
R.2-A Identify and treat truck crash roadway segments—signing and spiral transitions Low Medium ( 1-2 years) Low Experimental
R.2-B Install interactive truck rollover signing and dynamic truck advisory speed sign on curves High Medium ( 1-2 years) Moderate Proven
R.2-C Deploy cost effective safety improvements for high-risk corridors and curves Medium Short (< 1 year) Low Proven, Tried
R.2-D Construct longer turn lanes and acceleration lanes (i.e., inside acceleration lane on expressway) Medium 2 Medium ( 1-2 years) Moderate Tried
R.2-E Identify and implement a demonstration corridor (Engineering – rumble strips, acceleration lanes, turn lanes, inspection sites and parking spaces; Enforcement – speed, weight and maintenance; Education – safe communities initiative; Emergency Services – voluntary bystander programs)
High 21 Long (> 2 years) Low to High Proven, Tried, Experimental
R.2 Identify and correct unsafe roadway infrastructure and operational characteristics
R.2.-F Median four-cable barrier High 27
R.3-A Modify speed limits and increase enforcement to reduce truck and other vehicle speeds Low Short (< 1 year) Moderate Tried
R.3-B Identify highway corridors for enhanced enforcement (i.e., saturation patrols) Medium Short (< 1 year) Moderate to High Proven, Tried
R.3-C Priority treatment for trucks at isolated traffic signals (extend the green) coupled with electronic red light running cameras. High 4 Medium ( 1-2 years) Moderate Experimental R.3 Address vehicle speeds to prevent crashes and reduce their severity
R.3-D Signal timing for truck priority. Increase use and consistency of signal avoidance warning flashers (such as “Be Prepared to Stop When Flashing”) and sequencing. High 9
Improve Work Zones
R.4-A Implement truck speed limits in work zones Low Short (< 1 year) Low Tried
R.4-B Review work zones to ensure maintenance of traffic accommodates trucks Low Short (< 1 year) Moderate Experimental R.4 Develop a comprehensive “Construction Work Zone Strategy”
R.4-C Implement advanced warning devices to alert truck drivers, especially in rural areas where truck drivers may unexpectedly come up on stopped traffic High 16 Long (> 2 years) Moderate Experimental
TABLE A.4-4 Vehicle Strategies – Including Revisions from March 11, 2005 Workshop
Objectives Strategies Priority Votes Timeframe Cost Effectiveness
Vehicle Maintenance and Inspection
V.1-A Increase and strengthen truck maintenance programs and inspection performance High Medium (1-2 years) Moderate to High Tried
V.1-B Conduct post-crash inspections to identify major problems and problem conditions High 5 Medium (1-2 years) Moderate to High Experimental
V.1-C Create additional roadside truck inspections sites (abandoned rest areas, remnant frontage roads, etc.) High 1 Long (> 2 years) Moderate to High Experimental
V.1-D Target enforcement on high crash corridors High 15 Short (< 1 year) Moderate to High Proven, Tried
V.1-E Develop database for driver and vehicle inspection reports and accident reports that is available for use by multiple agencies High 4 Short (<1 year) Low Tried
V.1 Improve maintenance of heavy trucks
V.1-F Emphasize pre/post trip inspections, need for follow-up and establish driver consequences for failure to conduct inspections High 2 Short (<1 year) Moderate to
High Tried
Appendix IV A.4-3 June 30, 2005

Minnesota Statewide Heavy Vehicle Safety Plan
TABLE A.4-4 Vehicle Strategies – Including Revisions from March 11, 2005 Workshop
Objectives Strategies Priority Votes Timeframe Cost Effectiveness
Vehicle Technology
V.2-A Promote development and deployment of truck safety technologies, such as VORAD, driver alertness monitors, blind spot reduction, “smart car”, collision avoidance system, forward looking radar (reduce high frequency of rear end crashes), truck roll over warning system, etc.
Medium Long (> 2 years) Moderate to High Experimental
V.2-B Implement a new ongoing safety audit program of carriers Medium Long (> 2 years) Moderate to High Experimental
V.2-C Provided companies with incentive to install new technologies Medium Medium (1-2 years) High Experimental
V.2-D Implement seat belt interlocks Medium Long (> 2 years) High Experimental
V.2-E Include 10,000 – 26,000 lbs vehicles in commerce safety regulations High Medium (1-2 years) Moderate Tried
V.2-F Remove commodity exemptions from safety regulations, need to examine data of presently exempted vehicles High Long (> 2 years) High Experimental
V.2 Promote industry safety initiatives
V.2-G Include 10,000 – 26,000 lbs in MN vehicle inspection program High Medium (1-2 years) Moderate Experimental
V.3 Inspection and crash data V.3-A Improve data collection of post crash inspections High 2 Medium (1-2 years) Moderate Tried
V.4 Motor coaches V.4-A Address safety needs related to motor coaches Medium Medium (1-2 years) Moderate to High Experimental
V.5 Evaluation and follow-up V.5-A Conduct evaluation and follow-up to determine effectiveness of programs High 5 Long (> 2 years) Moderate Tried
V.6 Enforcement V.6-A Full staff, effective use of present staff by expanding CVI authority High 19 Short (<1 year) Moderate Tried, Experimental
Appendix IV A.4-4 June 30, 2005
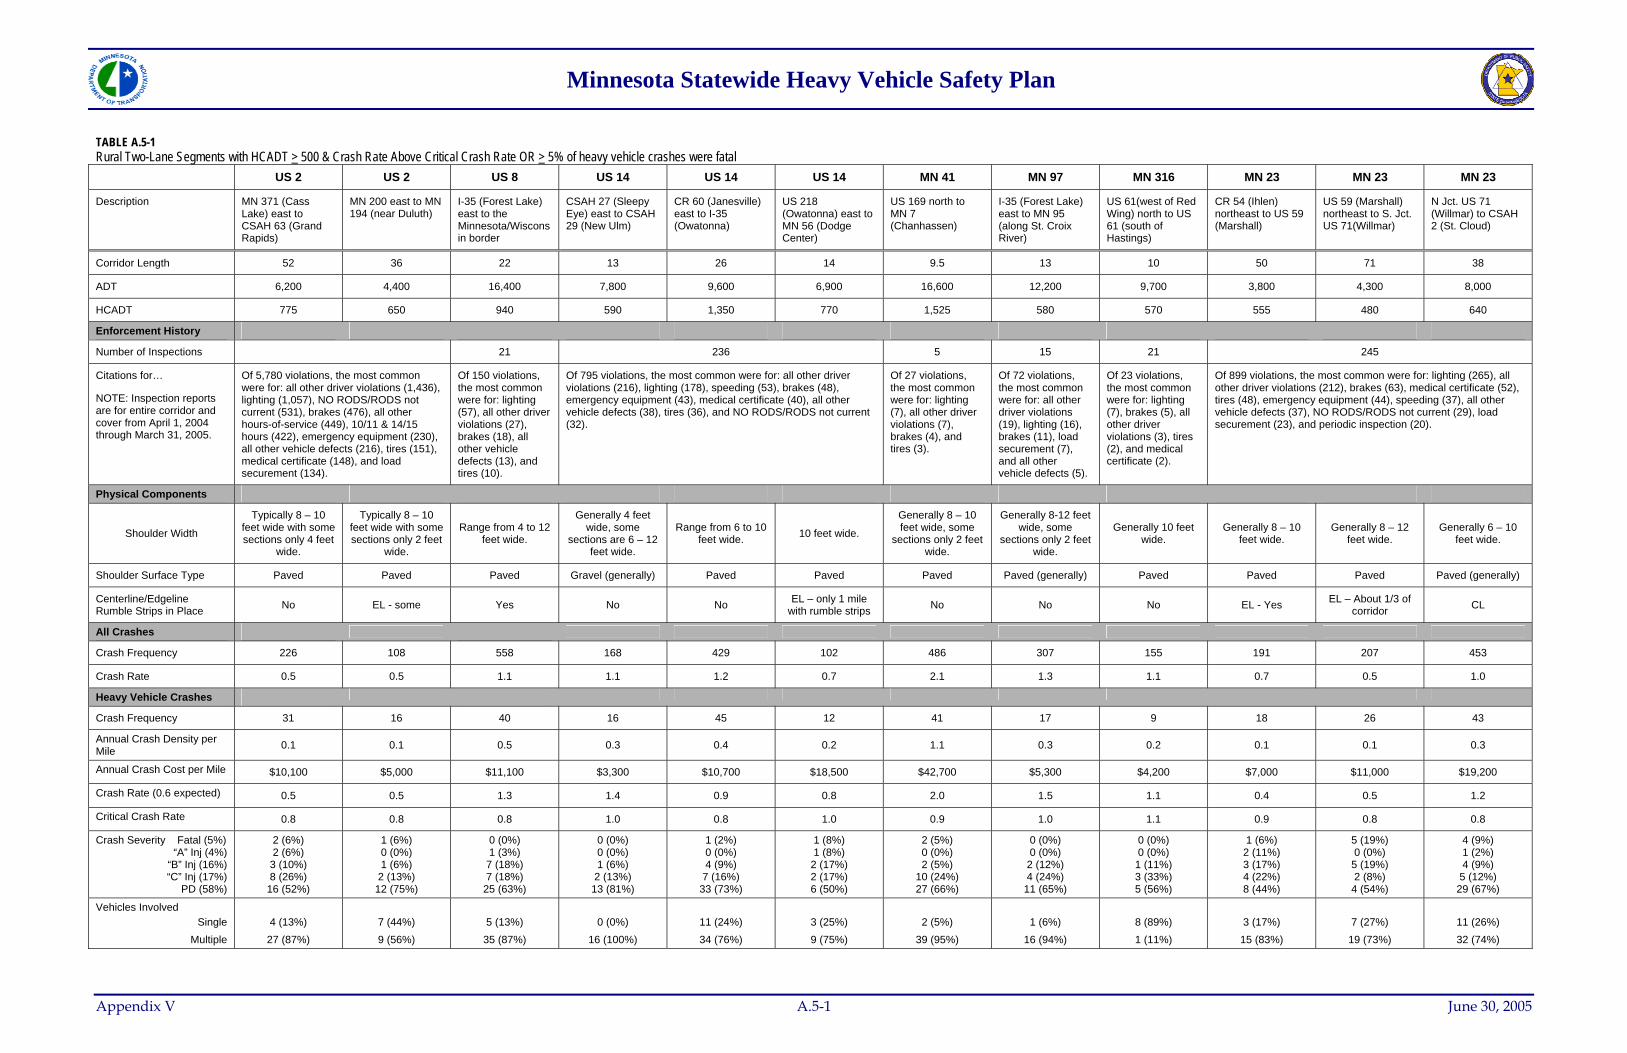
Minnesota Statewide Heavy Vehicle Safety Plan
TABLE A.5-1 Rural Two-Lane Segments with HCADT > 500 & Crash Rate Above Critical Crash Rate OR > 5% of heavy vehicle crashes were fatal
US 2 US 2 US 8 US 14 US 14 US 14 MN 41 MN 97 MN 316 MN 23 MN 23 MN 23
Description MN 371 (Cass Lake) east to CSAH 63 (Grand Rapids)
MN 200 east to MN 194 (near Duluth)
I-35 (Forest Lake) east to the Minnesota/Wisconsin border
CSAH 27 (Sleepy Eye) east to CSAH 29 (New Ulm)
CR 60 (Janesville) east to I-35 (Owatonna)
US 218 (Owatonna) east to MN 56 (Dodge Center)
US 169 north to MN 7 (Chanhassen)
I-35 (Forest Lake) east to MN 95 (along St. Croix River)
US 61(west of Red Wing) north to US 61 (south of Hastings)
CR 54 (Ihlen) northeast to US 59 (Marshall)
US 59 (Marshall) northeast to S. Jct. US 71(Willmar)
N Jct. US 71 (Willmar) to CSAH 2 (St. Cloud)
Corridor Length 52 36 22 13 26 14 9.5 13 10 50 71 38
ADT 6,200 4,400 16,400 7,800 9,600 6,900 16,600 12,200 9,700 3,800 4,300 8,000
HCADT 775 650 940 590 1,350 770 1,525 580 570 555 480 640
Enforcement History
Number of Inspections 21 236 5 15 21 245
Citations for…
NOTE: Inspection reports are for entire corridor and cover from April 1, 2004 through March 31, 2005.
Of 5,780 violations, the most common were for: all other driver violations (1,436), lighting (1,057), NO RODS/RODS not current (531), brakes (476), all other hours-of-service (449), 10/11 & 14/15 hours (422), emergency equipment (230), all other vehicle defects (216), tires (151), medical certificate (148), and load securement (134).
Of 150 violations, the most common were for: lighting (57), all other driver violations (27), brakes (18), all other vehicle defects (13), and tires (10).
Of 795 violations, the most common were for: all other driver violations (216), lighting (178), speeding (53), brakes (48), emergency equipment (43), medical certificate (40), all other vehicle defects (38), tires (36), and NO RODS/RODS not current (32).
Of 27 violations, the most common were for: lighting (7), all other driver violations (7), brakes (4), and tires (3).
Of 72 violations, the most common were for: all other driver violations (19), lighting (16), brakes (11), load securement (7), and all other vehicle defects (5).
Of 23 violations, the most common were for: lighting (7), brakes (5), all other driver violations (3), tires (2), and medical certificate (2).
Of 899 violations, the most common were for: lighting (265), all other driver violations (212), brakes (63), medical certificate (52), tires (48), emergency equipment (44), speeding (37), all other vehicle defects (37), NO RODS/RODS not current (29), load securement (23), and periodic inspection (20).
Physical Components
Shoulder Width
Typically 8 – 10 feet wide with some sections only 4 feet
wide.
Typically 8 – 10 feet wide with some sections only 2 feet
wide.
Range from 4 to 12 feet wide.
Generally 4 feet wide, some
sections are 6 – 12 feet wide.
Range from 6 to 10 feet wide. 10 feet wide.
Generally 8 – 10 feet wide, some
sections only 2 feet wide.
Generally 8-12 feet wide, some
sections only 2 feet wide.
Generally 10 feet wide.
Generally 8 – 10 feet wide.
Generally 8 – 12 feet wide.
Generally 6 – 10 feet wide.
Shoulder Surface Type Paved Paved Paved Gravel (generally) Paved Paved Paved Paved (generally) Paved Paved Paved Paved (generally)
Centerline/Edgeline Rumble Strips in Place No EL - some Yes No No EL – only 1 mile
with rumble strips No No No EL - Yes EL – About 1/3 of corridor CL
All Crashes
Crash Frequency 226 108 558 168 429 102 486 307 155 191 207 453
Crash Rate 0.5 0.5 1.1 1.1 1.2 0.7 2.1 1.3 1.1 0.7 0.5 1.0
Heavy Vehicle Crashes
Crash Frequency 31 16 40 16 45 12 41 17 9 18 26 43
Annual Crash Density per Mile 0.1 0.1 0.5 0.3 0.4 0.2 1.1 0.3 0.2 0.1 0.1 0.3
Annual Crash Cost per Mile $10,100 $5,000 $11,100 $3,300 $10,700 $18,500 $42,700 $5,300 $4,200 $7,000 $11,000 $19,200
Crash Rate (0.6 expected) 0.5 0.5 1.3 1.4 0.9 0.8 2.0 1.5 1.1 0.4 0.5 1.2
Critical Crash Rate 0.8 0.8 0.8 1.0 0.8 1.0 0.9 1.0 1.1 0.9 0.8 0.8
Crash Severity Fatal (5%) “A” Inj (4%)
“B” Inj (16%) “C” Inj (17%)
PD (58%)
2 (6%) 2 (6%)
3 (10%) 8 (26%)
16 (52%)
1 (6%) 0 (0%) 1 (6%)
2 (13%) 12 (75%)
0 (0%) 1 (3%)
7 (18%) 7 (18%)
25 (63%)
0 (0%) 0 (0%) 1 (6%)
2 (13%) 13 (81%)
1 (2%) 0 (0%) 4 (9%)
7 (16%) 33 (73%)
1 (8%) 1 (8%)
2 (17%) 2 (17%) 6 (50%)
2 (5%) 0 (0%) 2 (5%)
10 (24%) 27 (66%)
0 (0%) 0 (0%)
2 (12%) 4 (24%)
11 (65%)
0 (0%) 0 (0%)
1 (11%) 3 (33%) 5 (56%)
1 (6%) 2 (11%) 3 (17%) 4 (22%) 8 (44%)
5 (19%) 0 (0%)
5 (19%) 2 (8%)
4 (54%)
4 (9%) 1 (2%) 4 (9%)
5 (12%) 29 (67%)
Vehicles Involved Single
Multiple
4 (13%)
27 (87%)
7 (44%) 9 (56%)
5 (13%)
35 (87%)
0 (0%)
16 (100%)
11 (24%) 34 (76%)
3 (25%) 9 (75%)
2 (5%)
39 (95%)
1 (6%)
16 (94%)
8 (89%) 1 (11%)
3 (17%)
15 (83%)
7 (27%)
19 (73%)
11 (26%) 32 (74%)
Appendix V A.5-1 June 30, 2005

Minnesota Statewide Heavy Vehicle Safety Plan
TABLE A.5-1 Rural Two-Lane Segments with HCADT > 500 & Crash Rate Above Critical Crash Rate OR > 5% of heavy vehicle crashes were fatal
US 2 US 2 US 8 US 14 US 14 US 14 MN 41 MN 97 MN 316 MN 23 MN 23 MN 23
Description MN 371 (Cass Lake) east to CSAH 63 (Grand Rapids)
MN 200 east to MN 194 (near Duluth)
I-35 (Forest Lake) east to the Minnesota/Wisconsin border
CSAH 27 (Sleepy Eye) east to CSAH 29 (New Ulm)
CR 60 (Janesville) east to I-35 (Owatonna)
US 218 (Owatonna) east to MN 56 (Dodge Center)
US 169 north to MN 7 (Chanhassen)
I-35 (Forest Lake) east to MN 95 (along St. Croix River)
US 61(west of Red Wing) north to US 61 (south of Hastings)
CR 54 (Ihlen) northeast to US 59 (Marshall)
US 59 (Marshall) northeast to S. Jct. US 71(Willmar)
N Jct. US 71 (Willmar) to CSAH 2 (St. Cloud)
Crash Type Rear End (20%)
Left Turn (2%) Right Turn (2%)
Right Angle (20%) Ran-off Road (15%)
Head-On (5%) Sideswipe (Passing) (10%) Sideswipe (Opposite) (7%)
Other/Unknown (19%)
7 (23%) 0 (0%) 0 (0%)
8 (26%) 4 (13%) 2 (6%)
6 (19%) 1 (3%)
3 (10%)
1 (6%)
3 (19%) 0 (0%)
3 (19%) 3 (19%) 1 (6%) 0 (0%) 1 (6%)
4 (25%)
16 (40%)
0 (0%) 0 (0%)
8 (20%) 3 (8%) 0 (0%) 2 (5%)
4 (10%) 7 (18%)
5 (31%) 1 (6%) 0 (0%) 0 (0%) 0 (0%) 0 (0%)
5 (31%) 1 (6%)
4 (25%)
9 (20%) 2 (4%) 2 (4%)
7 (16%) 5 (11%) 0 (0%) 4 (9%)
5 (11%) 11 (24%)
3 (25%) 0 (0%) 0 (0%) 0 (0%) 1 (8%) 1 (8%) 0 (0%)
4 (33%) 3 (25%)
17 (41%)
3 (7%) 1 (2%) 2 (5%) 1 (2%) 1 (2%)
7 (17%) 0 (0%)
9 (22%)
11 (65%)
0 (0%) 0 (0%)
3 (18%) 0 (0%) 0 (0%) 0 (0%) 1 (6%)
2 (12%)
1 (11%) 0 (0%) 0 (0%) 0 (0%)
6 (67%) 0 (0%) 0 (0%) 0 (0%)
2 (22%)
4 (22%) 1 (6%) 0 (0%)
3 (17%) 0 (0%) 1 (6%) 1 (6%)
4 (22%) 4 (22%)
5 (19%) 1 (4%) 0 (0%)
6 (23%) 6 (23%) 0 (0%) 0 (0%)
3 (12%) 5 (19%)
7 (16%) 1 (2%) 0 (0%)
11 (26%) 8 (19%) 4 (9%) 4 (9%) 3 (7%)
5 (12%)
Day-of-Week Sunday Monday
Tuesday Wednesday
Thursday Friday
Saturday
1 (3%)
5 (16%) 6 (19%) 7 (23%) 5 (16%) 5 (16%) 2 (6%)
2 (13%) 2 (13%) 3 (19%) 1 (6%) 1 (6%)
6 (38%) 1 (6%)
2 (5%)
9 (23%) 9 (23%) 8 (20%) 3 (8%)
6 (15%) 3 (8%)
0 (0%)
2 (13%) 5 (31%) 3 (19%) 2 (13%) 4 (25%) 0 (0%)
1 (2%)
6 (13%) 7 (16%) 8 (18%)
12 (27%) 6 (13%) 5 (11%)
0 (0%)
2 (17%) 2 (17%) 2 (17%) 2 (17%) 4 (33%) 0 (0%)
0 (0%)
8 (20%) 7 (17%) 6 (15%) 9 (22%)
11 (27%) 0 (0%)
0 (0%)
4 (24%) 6 (35%) 3 (18%) 1 (6%)
3 (18%) 0 (0%)
1 (11%) 2 (22%) 2 (22%) 1 (11%) 1 (11%) 2 (22%) 0 (0%)
1 (6%)
5 (28%) 2 (11%) 4 (22%) 1 (6%)
4 (22%) 1 (6%)
3 (12%) 6 (23%) 6 (23%) 2 (8%)
6 (23%) 2 (8%) 1 (4%)
0 (0%) 4 (9%)
10 (23%) 9 (21%)
10 (23%) 9 (21%) 1 (2%)
Time-of-Day 12:00 AM – 3:00 AM
3:00 AM – 6:00 AM 6:00 AM – 9:00 AM
9:00 AM – 12:00 PM 12:00 PM – 3:00 PM
3:00 PM – 6:00 PM 6:00 PM – 9:00 PM
9:00 PM – 12:00 AM
0 (0%) 0 (0%)
3 (10%) 8 (26%) 5 (16%) 5 (16%) 3 (10%) 7 (23%)
2 (13%) 3 (19%) 0 (0%)
3 (19%) 1 (6%)
2 (13%) 4 (25%) 1 (6%)
0 (0%) 0 (0%)
7 (18%) 10 (25%) 8 (20%)
13 (33%) 2 (5%) 0 (0%)
0 (0%) 0 (0%) 1 (6%)
3 (19%) 5 (31%) 5 (31%) 2 (13%) 0 (0%)
1 (2%) 2 (4%)
10 (22%) 9 (20%)
12 (27%) 8 (18%) 1 (2%) 2 (4%)
0 (0%) 1 (8%)
2 (17%) 2 (17%) 2 (17%) 3 (25%) 0 (0%)
2 (17%)
1 (2%) 0 (0%)
7 (17%) 13 (32%) 8 (20%)
12 (29%) 0 (0%) 0 (0%)
0 (0%) 0 (0%)
6 (35%) 1 (6%)
3 (18%) 7 (41%) 0 (0%) 0 (0%)
1 (11%) 0 (0%) 0 (0%)
3 (33%) 0 (0%)
4 (44%) 1 (11%) 0 (0%)
0 (0%)
2 (11%) 4 (22%) 1 (6%)
5 (28%) 3 (17%) 1 (6%)
2 (11%)
0 (0%) 1 (4%)
3 (12%) 5 (19%) 4 (15%) 7 (27%) 4 (15%) 2 (8%)
1 (2%) 4 (9%)
8 (19%) 5 (12%)
13 (30%) 9 (21%) 1 (2%) 2 (5%)
Road Surface Conditions Dry Wet
Snow or Slush Ice or Packed Snow
Other or Unknown
17 (55%) 7 (23%) 2 (6%)
4 (13%) 1 (3%)
13 (81%) 2 (13%) 0 (0%) 1 (6%) 0 (0%)
29 (73%) 5 (13%) 4 (10%) 2 (5%) 0 (0%)
13 (81%)
0 (0%) 1 (6%)
2 (13%) 0 (0%)
30 (67%) 5(11%) 3 (7%)
7 (16%) 0 (0%)
7 (58%) 2 (17%) 1 (8%) 1 (8%) 1 (8%)
29 (71%) 9 (22%) 0 (0%) 3 (7%) 0 (0%)
14 (82%) 3 (18%) 0 (0%) 0 (0%) 0 (0%)
8 (89%) 1 (11%) 0 (0%) 0 (0%) 0 (0%)
16 (89%)
0 (0%) 0 (0%)
2 (11%) 0 (0%)
20 (77%)
1 (4%) 1 (4%)
4 (15%) 0 (0%)
29 (67%)
4 (9%) 2 (5%)
7 (16%) 1 (2%)
Weather Conditions Clear/Cloudy
Rain Snow
Sleet, Hail, etc. Fog, Smog, or Smoke
Other or Unknown
25 (80%) 3 (10%) 3 (10%) 0 (0%) 0 (0%) 0 (0%)
11 (69%)
1 (6%) 1 6(%) 0 (0%)
3 (19%) 0 (0%)
32 (80%)
2 (5%) 2 (5%) 2 (5%) 1 (3%) 1 (3%)
16 (100%)
0 (0%) 0 (0%) 0 (0%) 0 (0%) 0 (0%)
31 (69%)
1 (2%) 4 (9%) 1 (2%) 1 (2%)
7 (16%)
10 (83%)
0 (0%) 1 (8%) 0 (0%) 0 (0%) 1 (8%)
33 (80%) 7 (17%) 1 (2%) 0 (0%) 0 (0%) 0 (0%)
14 (82%) 2 (12%) 0 (0%) 0 (0%) 1 (6%) 0 (0%)
9 (100%)
0 (0%) 0 (0%) 0 (0%) 0 (0%) 0 (0%)
15 (83%)
0 (0%) 0 (0%) 1 (6%) 1 (6%) 1 (6%)
19 (73%)
2 (8%) 2 (8%) 0 (0%) 0 (0%)
3 (12%)
36 (84%)
3 (7%) 1 (2%) 0 (0%) 1 (2%) 2 (5%)
Appendix V A.5-2 June 30, 2005
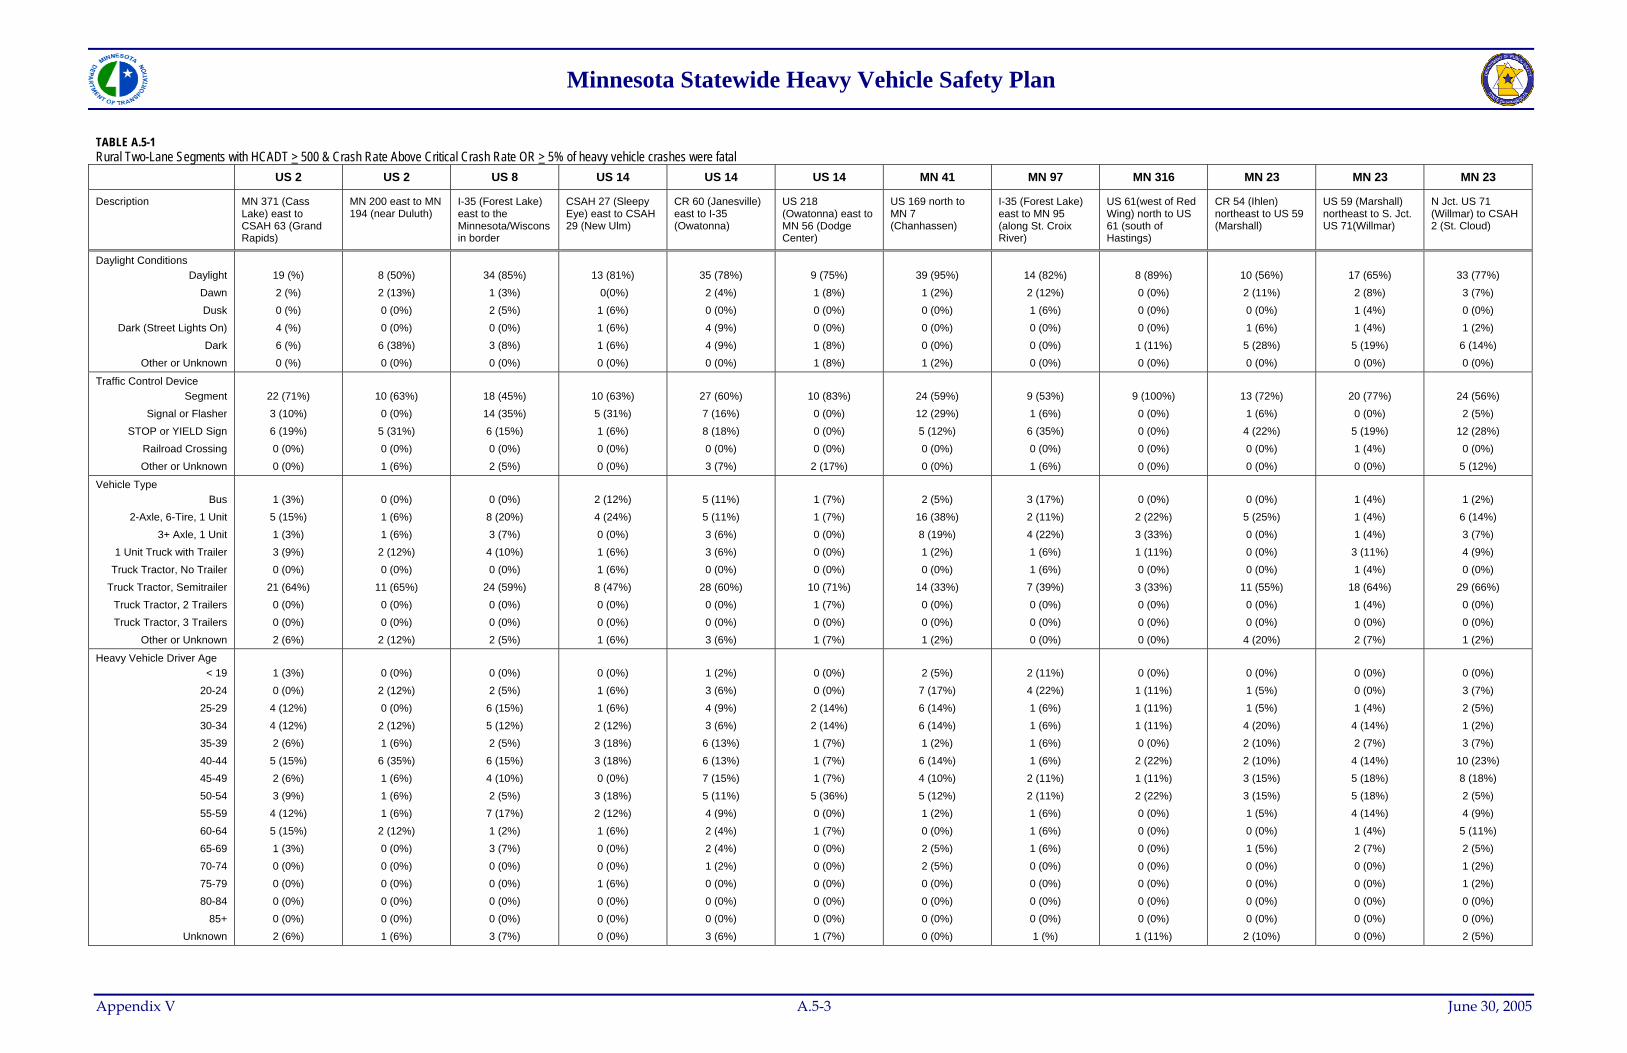
Minnesota Statewide Heavy Vehicle Safety Plan
TABLE A.5-1 Rural Two-Lane Segments with HCADT > 500 & Crash Rate Above Critical Crash Rate OR > 5% of heavy vehicle crashes were fatal
US 2 US 2 US 8 US 14 US 14 US 14 MN 41 MN 97 MN 316 MN 23 MN 23 MN 23
Description MN 371 (Cass Lake) east to CSAH 63 (Grand Rapids)
MN 200 east to MN 194 (near Duluth)
I-35 (Forest Lake) east to the Minnesota/Wisconsin border
CSAH 27 (Sleepy Eye) east to CSAH 29 (New Ulm)
CR 60 (Janesville) east to I-35 (Owatonna)
US 218 (Owatonna) east to MN 56 (Dodge Center)
US 169 north to MN 7 (Chanhassen)
I-35 (Forest Lake) east to MN 95 (along St. Croix River)
US 61(west of Red Wing) north to US 61 (south of Hastings)
CR 54 (Ihlen) northeast to US 59 (Marshall)
US 59 (Marshall) northeast to S. Jct. US 71(Willmar)
N Jct. US 71 (Willmar) to CSAH 2 (St. Cloud)
Daylight Conditions Daylight
Dawn Dusk
Dark (Street Lights On) Dark
Other or Unknown
19 (%) 2 (%) 0 (%) 4 (%) 6 (%) 0 (%)
8 (50%) 2 (13%) 0 (0%) 0 (0%)
6 (38%) 0 (0%)
34 (85%)
1 (3%) 2 (5%) 0 (0%) 3 (8%) 0 (0%)
13 (81%)
0(0%) 1 (6%) 1 (6%) 1 (6%) 0 (0%)
35 (78%)
2 (4%) 0 (0%) 4 (9%) 4 (9%) 0 (0%)
9 (75%) 1 (8%) 0 (0%) 0 (0%) 1 (8%) 1 (8%)
39 (95%)
1 (2%) 0 (0%) 0 (0%) 0 (0%) 1 (2%)
14 (82%) 2 (12%) 1 (6%) 0 (0%) 0 (0%) 0 (0%)
8 (89%) 0 (0%) 0 (0%) 0 (0%)
1 (11%) 0 (0%)
10 (56%) 2 (11%) 0 (0%) 1 (6%)
5 (28%) 0 (0%)
17 (65%)
2 (8%) 1 (4%) 1 (4%)
5 (19%) 0 (0%)
33 (77%)
3 (7%) 0 (0%) 1 (2%)
6 (14%) 0 (0%)
Traffic Control Device Segment
Signal or Flasher STOP or YIELD Sign
Railroad Crossing Other or Unknown
22 (71%) 3 (10%) 6 (19%) 0 (0%) 0 (0%)
10 (63%)
0 (0%) 5 (31%) 0 (0%) 1 (6%)
18 (45%) 14 (35%) 6 (15%) 0 (0%) 2 (5%)
10 (63%) 5 (31%) 1 (6%) 0 (0%) 0 (0%)
27 (60%) 7 (16%) 8 (18%) 0 (0%) 3 (7%)
10 (83%)
0 (0%) 0 (0%) 0 (0%)
2 (17%)
24 (59%) 12 (29%) 5 (12%) 0 (0%) 0 (0%)
9 (53%) 1 (6%)
6 (35%) 0 (0%) 1 (6%)
9 (100%)
0 (0%) 0 (0%) 0 (0%) 0 (0%)
13 (72%)
1 (6%) 4 (22%) 0 (0%) 0 (0%)
20 (77%)
0 (0%) 5 (19%) 1 (4%) 0 (0%)
24 (56%)
2 (5%) 12 (28%)
0 (0%) 5 (12%)
Vehicle Type Bus
2-Axle, 6-Tire, 1 Unit 3+ Axle, 1 Unit
1 Unit Truck with Trailer Truck Tractor, No Trailer
Truck Tractor, Semitrailer Truck Tractor, 2 Trailers Truck Tractor, 3 Trailers
Other or Unknown
1 (3%)
5 (15%) 1 (3%) 3 (9%) 0 (0%)
21 (64%) 0 (0%) 0 (0%) 2 (6%)
0 (0%) 1 (6%) 1 (6%)
2 (12%) 0 (0%)
11 (65%) 0 (0%) 0 (0%)
2 (12%)
0 (0%)
8 (20%) 3 (7%)
4 (10%) 0 (0%)
24 (59%) 0 (0%) 0 (0%) 2 (5%)
2 (12%) 4 (24%) 0 (0%) 1 (6%) 1 (6%)
8 (47%) 0 (0%) 0 (0%) 1 (6%)
5 (11%) 5 (11%) 3 (6%) 3 (6%) 0 (0%)
28 (60%) 0 (0%) 0 (0%) 3 (6%)
1 (7%) 1 (7%) 0 (0%) 0 (0%) 0 (0%)
10 (71%) 1 (7%) 0 (0%) 1 (7%)
2 (5%)
16 (38%) 8 (19%) 1 (2%) 0 (0%)
14 (33%) 0 (0%) 0 (0%) 1 (2%)
3 (17%) 2 (11%) 4 (22%) 1 (6%) 1 (6%)
7 (39%) 0 (0%) 0 (0%) 0 (0%)
0 (0%)
2 (22%) 3 (33%) 1 (11%) 0 (0%)
3 (33%) 0 (0%) 0 (0%) 0 (0%)
0 (0%)
5 (25%) 0 (0%) 0 (0%) 0 (0%)
11 (55%) 0 (0%) 0 (0%)
4 (20%)
1 (4%) 1 (4%) 1 (4%)
3 (11%) 1 (4%)
18 (64%) 1 (4%) 0 (0%) 2 (7%)
1 (2%)
6 (14%) 3 (7%) 4 (9%) 0 (0%)
29 (66%) 0 (0%) 0 (0%) 1 (2%)
Heavy Vehicle Driver Age < 19
20-24 25-29 30-34 35-39 40-44 45-49 50-54 55-59 60-64 65-69 70-74 75-79 80-84
85+ Unknown
1 (3%) 0 (0%)
4 (12%) 4 (12%) 2 (6%)
5 (15%) 2 (6%) 3 (9%)
4 (12%) 5 (15%) 1 (3%) 0 (0%) 0 (0%) 0 (0%) 0 (0%) 2 (6%)
0 (0%)
2 (12%) 0 (0%)
2 (12%) 1 (6%)
6 (35%) 1 (6%) 1 (6%) 1 (6%)
2 (12%) 0 (0%)
0 (0%) 0 (0%) 0 (0%) 1 (6%)
0 (0%) 2 (5%)
6 (15%) 5 (12%) 2 (5%)
6 (15%) 4 (10%) 2 (5%)
7 (17%) 1 (2%) 3 (7%) 0 (0%) 0 (0%) 0 (0%) 0 (0%) 3 (7%)
0 (0%) 1 (6%) 1 (6%)
2 (12%) 3 (18%) 3 (18%) 0 (0%)
3 (18%) 2 (12%) 1 (6%) 0 (0%) 0 (0%) 1 (6%) 0 (0%) 0 (0%) 0 (0%)
1 (2%) 3 (6%) 4 (9%) 3 (6%)
6 (13%) 6 (13%) 7 (15%) 5 (11%) 4 (9%) 2 (4%) 2 (4%) 1 (2%) 0 (0%) 0 (0%) 0 (0%) 3 (6%)
0 (0%) 0 (0%)
2 (14%) 2 (14%) 1 (7%) 1 (7%) 1 (7%)
5 (36%) 0 (0%) 1 (7%) 0 (0%) 0 (0%) 0 (0%) 0 (0%) 0 (0%) 1 (7%)
2 (5%)
7 (17%) 6 (14%) 6 (14%) 1 (2%)
6 (14%) 4 (10%) 5 (12%) 1 (2%) 0 (0%) 2 (5%) 2 (5%) 0 (0%) 0 (0%) 0 (0%) 0 (0%)
2 (11%) 4 (22%) 1 (6%) 1 (6%) 1 (6%) 1 (6%)
2 (11%) 2 (11%) 1 (6%) 1 (6%) 1 (6%) 0 (0%) 0 (0%) 0 (0%) 0 (0%) 1 (%)
0 (0%)
1 (11%) 1 (11%) 1 (11%) 0 (0%)
2 (22%) 1 (11%) 2 (22%) 0 (0%) 0 (0%) 0 (0%) 0 (0%) 0 (0%) 0 (0%) 0 (0%)
1 (11%)
0 (0%) 1 (5%) 1 (5%)
4 (20%) 2 (10%) 2 (10%) 3 (15%) 3 (15%) 1 (5%) 0 (0%) 1 (5%) 0 (0%) 0 (0%) 0 (0%) 0 (0%)
2 (10%)
0 (0%) 0 (0%) 1 (4%)
4 (14%) 2 (7%)
4 (14%) 5 (18%) 5 (18%) 4 (14%) 1 (4%) 2 (7%) 0 (0%) 0 (0%) 0 (0%) 0 (0%) 0 (0%)
0 (0%) 3 (7%) 2 (5%) 1 (2%) 3 (7%)
10 (23%) 8 (18%) 2 (5%) 4 (9%)
5 (11%) 2 (5%) 1 (2%) 1 (2%) 0 (0%) 0 (0%) 2 (5%)
0 (0%)
Appendix V A.5-3 June 30, 2005
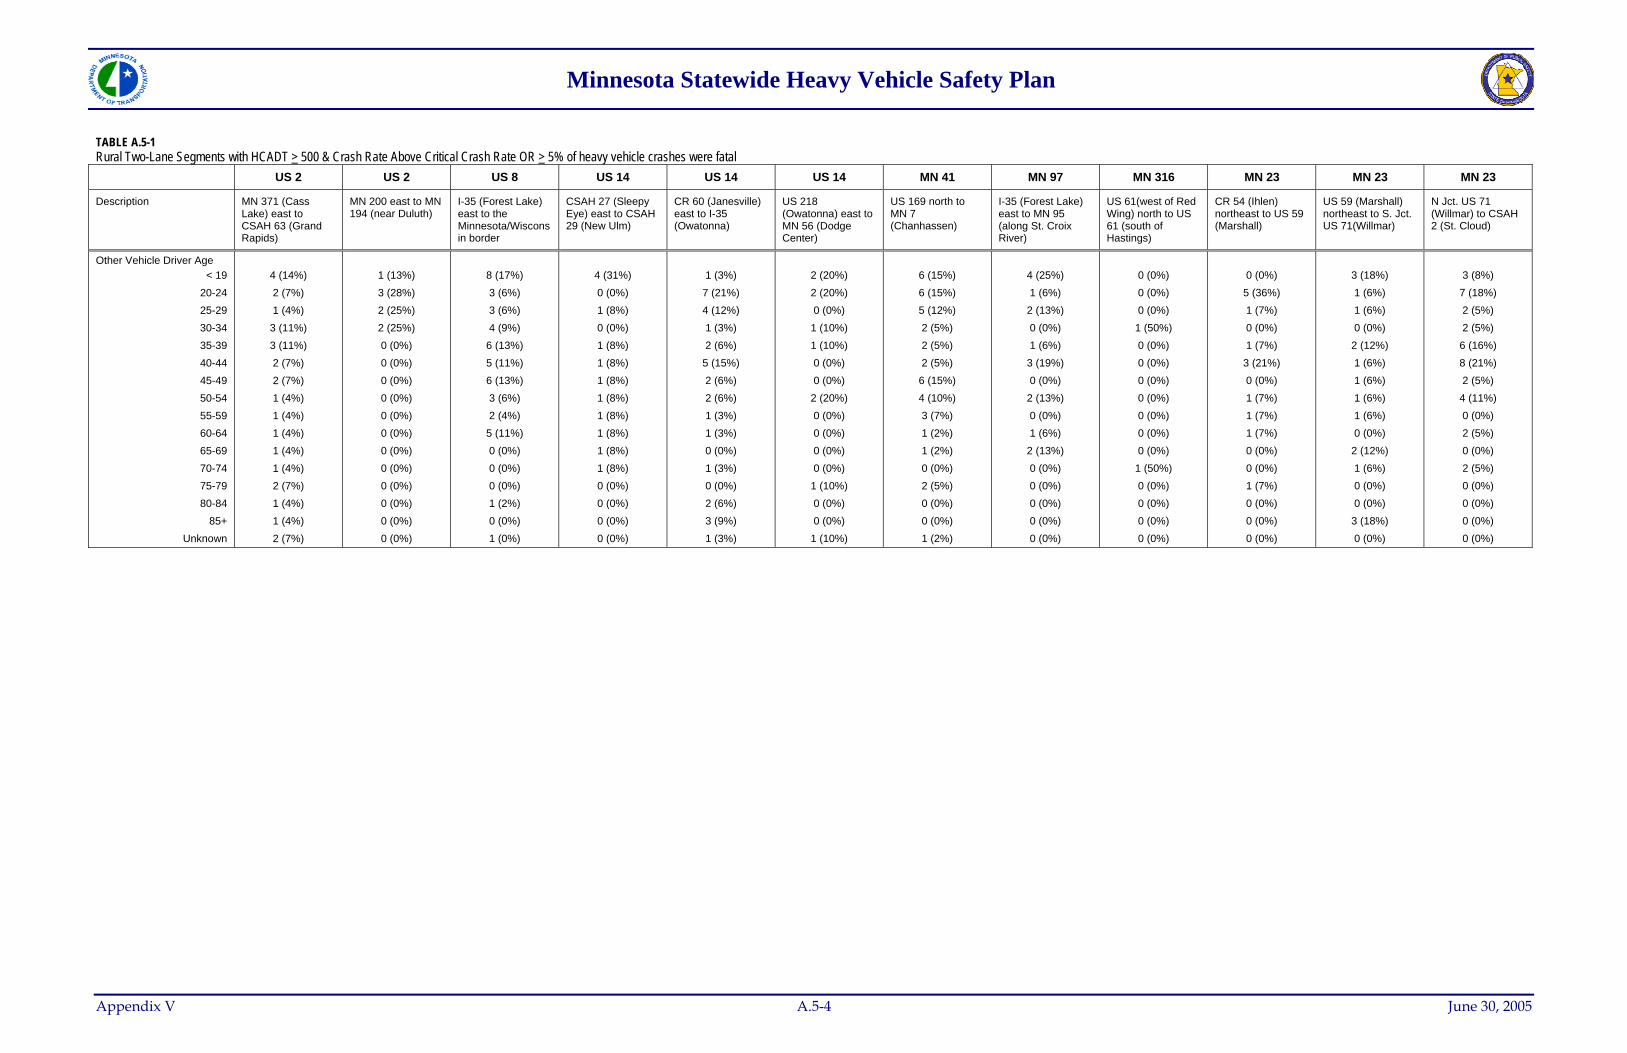
Minnesota Statewide Heavy Vehicle Safety Plan
TABLE A.5-1 Rural Two-Lane Segments with HCADT > 500 & Crash Rate Above Critical Crash Rate OR > 5% of heavy vehicle crashes were fatal
US 2 US 2 US 8 US 14 US 14 US 14 MN 41 MN 97 MN 316 MN 23 MN 23 MN 23
Description MN 371 (Cass Lake) east to CSAH 63 (Grand Rapids)
MN 200 east to MN 194 (near Duluth)
I-35 (Forest Lake) east to the Minnesota/Wisconsin border
CSAH 27 (Sleepy Eye) east to CSAH 29 (New Ulm)
CR 60 (Janesville) east to I-35 (Owatonna)
US 218 (Owatonna) east to MN 56 (Dodge Center)
US 169 north to MN 7 (Chanhassen)
I-35 (Forest Lake) east to MN 95 (along St. Croix River)
US 61(west of Red Wing) north to US 61 (south of Hastings)
CR 54 (Ihlen) northeast to US 59 (Marshall)
US 59 (Marshall) northeast to S. Jct. US 71(Willmar)
N Jct. US 71 (Willmar) to CSAH 2 (St. Cloud)
Other Vehicle Driver Age < 19
20-24 25-29 30-34 35-39 40-44 45-49 50-54 55-59 60-64 65-69 70-74 75-79 80-84
85+ Unknown
4 (14%) 2 (7%) 1 (4%)
3 (11%) 3 (11%) 2 (7%) 2 (7%) 1 (4%) 1 (4%) 1 (4%) 1 (4%) 1 (4%) 2 (7%) 1 (4%) 1 (4%) 2 (7%)
1 (13%) 3 (28%) 2 (25%) 2 (25%) 0 (0%) 0 (0%) 0 (0%) 0 (0%) 0 (0%) 0 (0%) 0 (0%) 0 (0%) 0 (0%) 0 (0%) 0 (0%) 0 (0%)
8 (17%) 3 (6%) 3 (6%) 4 (9%)
6 (13%) 5 (11%) 6 (13%) 3 (6%) 2 (4%)
5 (11%) 0 (0%) 0 (0%) 0 (0%) 1 (2%) 0 (0%) 1 (0%)
4 (31%) 0 (0%) 1 (8%) 0 (0%) 1 (8%) 1 (8%) 1 (8%) 1 (8%) 1 (8%) 1 (8%) 1 (8%) 1 (8%) 0 (0%) 0 (0%) 0 (0%) 0 (0%)
1 (3%)
7 (21%) 4 (12%) 1 (3%) 2 (6%)
5 (15%) 2 (6%) 2 (6%) 1 (3%) 1 (3%) 0 (0%) 1 (3%) 0 (0%) 2 (6%) 3 (9%) 1 (3%)
2 (20%) 2 (20%) 0 (0%)
1 (10%) 1 (10%) 0 (0%) 0 (0%)
2 (20%) 0 (0%) 0 (0%) 0 (0%) 0 (0%)
1 (10%) 0 (0%) 0 (0%)
1 (10%)
6 (15%) 6 (15%) 5 (12%) 2 (5%) 2 (5%) 2 (5%)
6 (15%) 4 (10%) 3 (7%) 1 (2%) 1 (2%) 0 (0%) 2 (5%) 0 (0%) 0 (0%) 1 (2%)
4 (25%) 1 (6%)
2 (13%) 0 (0%) 1 (6%)
3 (19%) 0 (0%)
2 (13%) 0 (0%) 1 (6%)
2 (13%) 0 (0%) 0 (0%) 0 (0%) 0 (0%) 0 (0%)
0 (0%) 0 (0%) 0 (0%)
1 (50%) 0 (0%) 0 (0%) 0 (0%) 0 (0%) 0 (0%) 0 (0%) 0 (0%)
1 (50%) 0 (0%) 0 (0%) 0 (0%) 0 (0%)
0 (0%)
5 (36%) 1 (7%) 0 (0%) 1 (7%)
3 (21%) 0 (0%) 1 (7%) 1 (7%) 1 (7%) 0 (0%) 0 (0%) 1 (7%) 0 (0%) 0 (0%) 0 (0%)
3 (18%) 1 (6%) 1 (6%) 0 (0%)
2 (12%) 1 (6%) 1 (6%) 1 (6%) 1 (6%) 0 (0%)
2 (12%) 1 (6%) 0 (0%) 0 (0%)
3 (18%) 0 (0%)
3 (8%)
7 (18%) 2 (5%) 2 (5%)
6 (16%) 8 (21%) 2 (5%)
4 (11%) 0 (0%) 2 (5%) 0 (0%) 2 (5%) 0 (0%) 0 (0%) 0 (0%) 0 (0%)
Appendix V A.5-4 June 30, 2005