misallocation and productivity in uruguay - economics and productivity in uruguay ... establishment...
TRANSCRIPT

Misallocation and Productivity in Uruguay
Diego RestucciaUniversity of Toronto
SEU-RIDGE-BID, Montevideo UY – December 2014
1/23

GDP per Capita in Uruguay
Relative GDP Annualizedper capita Growth
Country 1960 2009 (%)
Uruguay 0.45 0.31 1.37Latin America 0.30 0.23 1.53USA 1.00 1.00 2.10
Key questions:
I What factors (employment, capital, productivity,...) accountfor this poor economic performance?
I Why are these factors low?
2/23
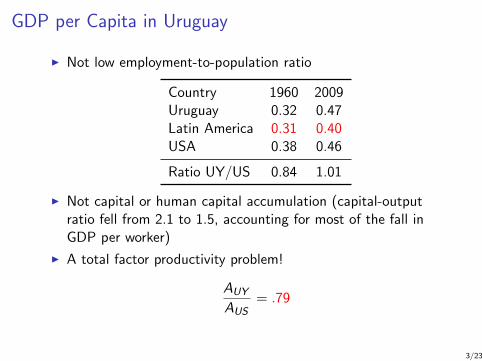
GDP per Capita in Uruguay
I Not low employment-to-population ratio
Country 1960 2009Uruguay 0.32 0.47Latin America 0.31 0.40USA 0.38 0.46
Ratio UY/US 0.84 1.01
I Not capital or human capital accumulation (capital-outputratio fell from 2.1 to 1.5, accounting for most of the fall inGDP per worker)
I A total factor productivity problem!
AUY
AUS= .79
3/23

A Model of TFP Differences
4/23

A Simple Illustrative Model
I Standard framework is the neoclassical growth modelaugmented to incorporate heterogeneous production units asin Hopenhayn (1992)
I One good is produced each period
I The production unit is an establishment
I An establishment is a decreasing returns to scale technology,for simplicity assume it requires only labor input:
y = s1−γ lγ ,
where s is the productivity of the establishment and l thelabor input
I Assume only two types of establishments sL and sH , and afixed number of establishments of each type, N = NL + NH
5/23

Efficient Allocation
I Planner allocates labor across establishments to maximizeoutput subject to total labor normalized to 1,
maxYe =∑i
s1−γi lγi Ni ,
subject to∑
i liNi = 1
I This problem implies labor allocation
li =si∑i siNi
I It implies that the marginal product of labor (and laborproductivity yi/li ) is equalized across establishment types
γs1−γi lγ−1i = γ
(∑i
siNi
)1−γ
6/23
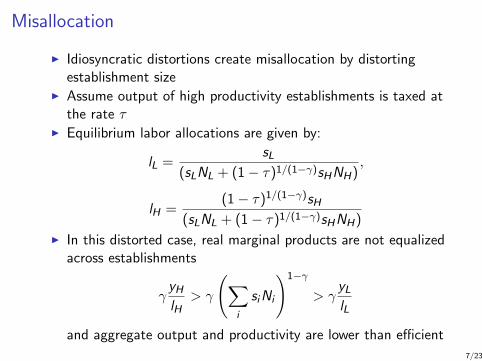
Misallocation
I Idiosyncratic distortions create misallocation by distortingestablishment size
I Assume output of high productivity establishments is taxed atthe rate τ
I Equilibrium labor allocations are given by:
lL =sL
(sLNL + (1 − τ)1/(1−γ)sHNH),
lH =(1 − τ)1/(1−γ)sH
(sLNL + (1 − τ)1/(1−γ)sHNH)
I In this distorted case, real marginal products are not equalizedacross establishments
γyHlH
> γ
(∑i
siNi
)1−γ
> γyLlL
and aggregate output and productivity are lower than efficient
7/23

Potential Sources of Misallocation
I Non-competitive banking systems
I Credit market imperfections
I Level of financial development
I Size restrictions
I Regulations and taxes
I Product and labor market regulations
I Industrial policies
I Public enterprises
I Imposition and enforcement of trade restrictions
I Corruption
8/23

Evidence of Misallocation
9/23

Hsieh and Klenow (2009)
I Micro data of manufacturing plants in China, India and theUnited States
I Calculate wedges of marginal products of capital and labor
I Evaluate the extent of misallocation by calculating output lossas the ratio of actual output relative to efficient output
10/23
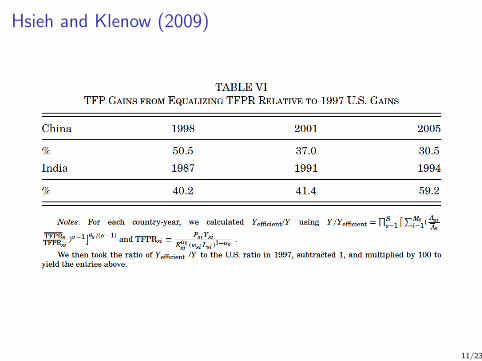
Hsieh and Klenow (2009)
11/23

Evidence from Uruguay
I Resource misallocation in Uruguay by Casacuberta andGandelman (2009) and in Latin America by Buso el al. (2014)and Pages (2010)
I Eliminating wedges in capital and labor in manufacturingplants in UY relative to wedges in the US implies an increasein TFP of 22%
12/23
Misallocation in Agriculture
I Based on Restuccia and Santaeulalia-Llopis (2014)
I Large representative household data from Malawi withexcruciating detail of agriculture outputs and inputs of farmers
I Malawi is a very poor country where most people work infarming
I Use micro data to measure household-farm productivitycontrolling for a wide array of factor inputs, land quality,output and other transitory shocks
13/23

Farm Productivity, Malawi ISA-2010/11
14/23

Land Size by Farm Productivity si
Notes: The correlations b/w land size and s(ζi , qi ) is .04, s(0, 0) is .01, s(ζi , 0) is .09, and s(0, qi ) is -.07.
15/23
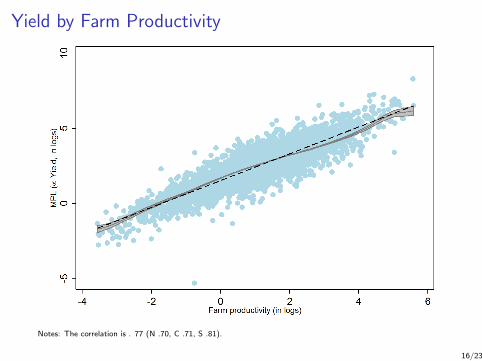
Yield by Farm Productivity
Notes: The correlation is . 77 (N .70, C .71, S .81).
16/23

Misallocation and Productivity
I Efficient allocation of capital and land across fixed set ofheterogeneous farmers in Malawi implies an increase in aggregateoutput (and total factor productivity) relative to actual of a factorof 3.6-fold
I Would unravel a major structural transformation of the economy,share of employment in agriculture would fall from 65% to 4% andagricultural productivity increase by 17-fold
17/23

Land Market Effects
Reallocation Results – Output Loss (Y a/Y e)
By Marketed Land Share By Marketed Land TypeNo Yes All Rented Purchased
(0%) (> 0%) (100%) Informal Formal Untit. Titled
Output (Productivity):Losses .2411 .5081 .6378 .5809 .5782 .1951 .7192Gains 4.146 1.968 1.567 1.721 1.729 5.125 1.390
Observations 5,962 1,189 746 215 682 126 97Sample (%) 83.4 16.6 10.4 3.0 9.5 1.8 1.3
18/23

Specific Policies and Institutions
19/23
Specific Policies and Institutions
I Firing costs
I Size dependent policies
I Trade and industrial policies
I Regulation, taxes and informality
I Financial frictions
20/23

Extension of Basic Framework
21/23
Broader Effects of Misallocation
I Enfasis has been on the factor allocation across existingproduction units
I But policies and institutions that create misallocation can alsocause negative selection effects by distorting agentsoccupational decisions and technology decisions
I and within-establishment dynamic effects via investments inestablishment-level productivity, innovation, etc.
22/23
Conclusions
I Development problem in Uruguay directly related to aproductivity gap
I The mis(allocation) of factors across heterogeneousproduction units may explain differences in TFP
I A key challenge is to identify, measure, and assess thequantitative impact of specific policies and institutionscreating misallocation and productivity losses
I These policies and institutions should be assessed in a broaderframework that includes selection and establishment-levelproductivity effects
23/23