misconceptions on force and gravity among high school students
TRANSCRIPT

Louisiana State UniversityLSU Digital Commons
LSU Master's Theses Graduate School
2010
Misconceptions on force and gravity among highschool studentsJane Ragasa PablicoLouisiana State University and Agricultural and Mechanical College, [email protected]
Follow this and additional works at: https://digitalcommons.lsu.edu/gradschool_theses
Part of the Physical Sciences and Mathematics Commons
This Thesis is brought to you for free and open access by the Graduate School at LSU Digital Commons. It has been accepted for inclusion in LSUMaster's Theses by an authorized graduate school editor of LSU Digital Commons. For more information, please contact [email protected].
Recommended CitationPablico, Jane Ragasa, "Misconceptions on force and gravity among high school students" (2010). LSU Master's Theses. 2462.https://digitalcommons.lsu.edu/gradschool_theses/2462

MISCONCEPTIONS ON FORCE AND GRAVITY
AMONG HIGH SCHOOL STUDENTS
A Thesis
Submitted to the Graduate Faculty of the
Louisiana State University and
Agricultural and Mechanical College
In partial fulfillment of the
requirements for the degree of
Master of Natural Sciences
In
The Interdepartmental Program in Natural Sciences
By
Jane R. Pablico
B.S., University of Northern Philippines, 1996
M.S.T., University of Northern Philippines, 2002
August 2010

ii
ACKNOWLEDGEMENTS
I would like to express my sincerest gratitude and appreciation to everyone who have, in
one way or another, contributed for the successful completion of this piece of work. Special
appreciation is accorded to:
Dr. Dana A. Browne, my thesis adviser and committee chair, for all his invaluable
assistance, motivation and brilliant suggestions;
My committee members, Dr. Steven F. Watkins and Dr. Michael L. Cherry, for their
comments and suggestions which contributed much to the improvement of this research;
Dr. James J. Madden, the coordinator of the MNS program for teachers, without whom
this program would not have been made possible;
Dr. Jing Wang and Dr. James P. Geaghan, for sharing their expertise in statistics;
Dr. Richard Gunstone, for allowing me to use the survey instrument;
My school administrators, for allowing me to conduct my research; my colleagues, for
their assistance in administering the survey; and students, for their participation;
The MNS- Physical Science 2010 cohorts: Ingrid, Beth, Cindy, Micah, Daniel, Danny,
Jason, Jonah and John, for their comments and suggestions, especially to Jason, who also
patiently edited my manuscript;
Friends, who provided encouragement and joyful company; and
Most of all, my family – Sam, for the love, and assistance in putting together my data; my
kids Schuyler James and Shirlene Joyce, for the inspiration which kept me going during those
tough times; and, my parents and sisters, for the words of encouragement amidst the distance that
separate us.

iii
TABLE OF CONTENTS
Acknowledgements …………………………………………………………………. ii
List of Tables ………………………………………………………………………… iv
List of Figures ……………………………………………………………………….. vi
Abstract ……………………………………………………………………………… viii
Introduction …………………………………………………………………………. 1
Materials and Methods ……………………………………………………………… 10
Results and Discussion ……………………………………………………………… 15
Summary and Conclusions …………………………………………………………. 54
References …………………………………………………………………………… 58
Appendix A: Letter of Request to Use Survey Instrument …………………………. 61
Appendix B: Letter of Permission to Use Survey Instrument ……………………… 62
Appendix C: Application for Exemption from Institutional Oversight ……………. 63
Appendix D: Approval from School District to Conduct Research ……….............. 64
Appendix E: The Survey Cover Letter and Questionnaire ………………………… 65
Appendix F: Contingency Tables for Fisher’s Exact Test ………………………… 72
Appendix G: Calculation of Kendall’s Coefficient of Concordance ……………… 73

iv
LIST OF TABLES
1. Frequency and Percentage Distribution of the Respondents in Terms of
School Physics Background and Gender ………………………………………...…12
2. Students’ Answers to Question 1 – If a ball is thrown straight up into the air,
then the total force on the ball on its way up is a)down, b) up or c) zero? ……. 16
3. Students’ Answers to Question 2 – If a ball is thrown straight up into the air,
then the total force on the ball just at the top of its flight is a) down , b) up
or c)zero? …………………………………………………………………………. 18
4. Students’ Answers to Question 3 – If a ball is thrown straight up into the air,
then the total force on the ball on its way down is a) down , b) up or c) zero?.….21
5. Students’ Answers to Question 4 – If a ball is thrown obliquely to travel along
a parabolic path, what forces act on the ball at its highest point? ………………... 23
6. Students’ Answers to Question 5 – If a ball is thrown obliquely to travel
along a parabolic path, what forces act on the ball when it is coming down?……. 25
7. Students' Responses to Second Part of Questions 4 and 5 - If a ball is thrown
obliquely to travel along a parabolic path, are there other forces acting on the
ball aside from those given in the options? ………………………………………. 26
8. Students’ Answers and Reasons to Question 6 – Is there a force on the bicycle
if the person riding it is not using the brakes or pedals but the bicycle
is slowing down? …………………………………………………………………. 27
9. Students’ Answers and Reasons to Question 7 – Is there gravity when
you are standing on the earth? ………………………………………………….. 29
10. Students’ Answers and Reasons to Question 8 – If someone falls from an
airplane, is there any gravity? ………………………………………………….. 31
11. Students’ Answers and Reasons to Question 9 – If someone is standing
on the moon, is there any gravity? ……………………………………………... 34
12. Students’ Answers and Reasons to Question 10 – Is there any gravity up
where the spaceman is if he is near a satellite going around the earth? ……….. 36
13. Students’ Answers and Reasons to Question 11 – Is there any gravity
when a person is swimming underwater? ……………………………………... 38

v
14. Students’ Answers and Reasons to Question 12 – Two equal blocks are
linked by a piece of string. The string is placed over a pulley, so the blocks are
at rest in the position that the left hand block is lower than the right hand block.
What will be the position of the blocks one minute later? ………………………. 40
15. Result of Fisher’s Exact Test of Association Between the Number of
Misconceptions Held and Gender………………………………………………. 47
16. Result of Fisher’s Exact Test of Difference in the Proportion of Male and
Female Students with Misconceptions…………………………………………… 48
17. Test of Agreement In the Ranking of the Number of Misconceptions
According to School Physics Background ……………………………………… 51
18. Test of Agreement In the Ranking of the Proportion of Students Having
Misconceptions According to School Physics Background ……………………. 53

vi
LIST OF FIGURES
1. Alternative Ideas of Students on the Total Force on a Ball
Thrown Vertically While Rising………………………………………………. 17
2. Alternative Ideas of Students on the Total Force on a Ball Thrown
Vertically at the Top of its Flight……………………………………………… 19
3. Alternative Ideas of Students on the Force on a Ball Falling Vertically ……… 22
4. Alternative Ideas of Students on the Force on a Ball at the Top of its
Parabolic Path…………………………………………………………………. 24
5. Alternative Ideas of Students on the force on a Ball in a Parabolic
Path While Descending……………………………………………………….. 25
6. Alternative Ideas of Students on the Forces on a Bicycle That is
Slowing Down ……………………………………………………………….. 28
7. Alternative Ideas of Students on Gravity When Standing on Earth …………. 30
8. Alternative Ideas of Students on Gravity in a Free Fall ……………………… 32
9. Alternative Ideas of Students on Gravity on Moon ………………………….. 35
10. Alternative Ideas of Students When in Orbit Around the Earth …………….. 37
11. Alternative Ideas of Students on Gravity When Swimming Underwater …… 39
12. Alternative Ideas of Students on Blocks on a Pulley..……………………….. 41
13 Prevalent Misconceptions on the Force on a Ball Thrown Vertically
Upward ……………………………………………………………………… 42
14. Prevalent Misconceptions on a Ball Thrown Obliquely to Travel Along a
Parabolic Path………………………………………………………………... 42
15. Prevalent Misconceptions on a Bicycle that is Slowing Down ……………… 43
vii
16. Prevalent Misconceptions on Gravity………………………………………... 44
17. Prevalent Misconception on Blocks on a Pulley…………………………….. 45
18. Comparison of the Number of Misconceptions Held
According to Gender ……………………………………………………….. 46
19. Comparison of the Proportion of Male and Female Students Having
Misconceptions……………………………………………………………….. 48
20. Comparison of the Number of Misconceptions Held by Students
According to School Physics Background…………………………………… 50
21. Comparison of the Proportion of Students with Misconceptions
According to School Physics Background…………………………………… 52
viii
ABSTRACT
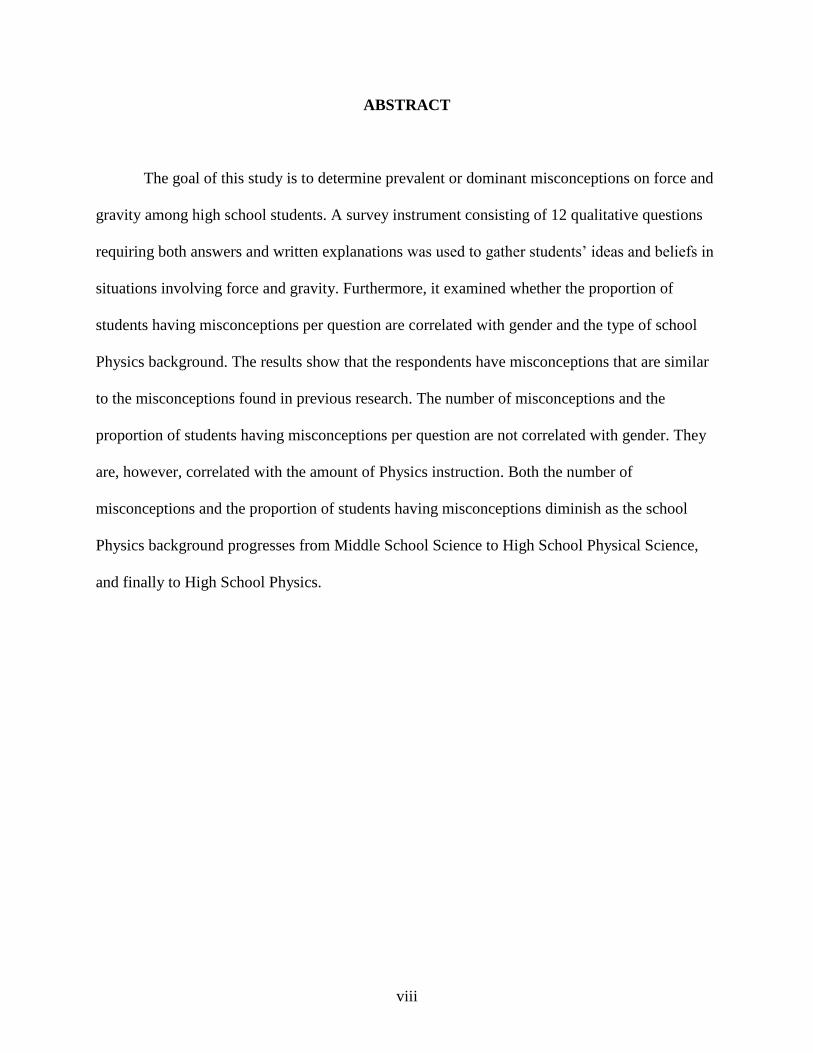
The goal of this study is to determine prevalent or dominant misconceptions on force and
gravity among high school students. A survey instrument consisting of 12 qualitative questions
requiring both answers and written explanations was used to gather students’ ideas and beliefs in
situations involving force and gravity. Furthermore, it examined whether the proportion of
students having misconceptions per question are correlated with gender and the type of school
Physics background. The results show that the respondents have misconceptions that are similar
to the misconceptions found in previous research. The number of misconceptions and the
proportion of students having misconceptions per question are not correlated with gender. They
are, however, correlated with the amount of Physics instruction. Both the number of
misconceptions and the proportion of students having misconceptions diminish as the school
Physics background progresses from Middle School Science to High School Physical Science,
and finally to High School Physics.
1
INTRODUCTION
Background of the Study. Students come to school bringing with them some
preconceptions that are incompatible with established scientific theories. Such preconceptions
are also called misconceptions, naïve conceptions, alternative conceptions, or conceptual
misunderstandings.
Lee, et. al (1992) pointed out at least three ways in which alternative conceptions among
children differ from generally-accepted concepts. First, children have difficulty with the kind of
abstract reasoning used by scientists. Second, children are interested in unique explanations for
specific events; unlike scientists, they are not concerned with the need for coherent and non-
contradictory explanations for a wide variety of phenomena. Third, the everyday language of our
society often leads children to have views that are different from those of scientists, and common
speech is often at odds with the precise language used by scientists.
Students usually explain physical phenomena using their knowledge from previous
experience or using “common sense” knowledge. But even common sense knowledge often does
not agree with scientific fact. According to Halloun and Hestenes (1985), Physics and General
Science can be regarded as extensions and modifications of common sense. This gives the
science teacher the challenging role of facilitating the modification of common sense.
Some of the students’ misconceptions in Physics may be traced back from pre-Newtonian
Physics such as the Aristotelian view and the 14th
century Impetus Theory by Jean Buridan
(Halloun & Hestenes, 1985). For example, Aristotle’s views include the ideas that “rest is the
natural state” of all objects, that “every motion has a cause”, that the “speed of a falling body is
proportional to its weight”, and that ”a constant force imparts to an object a constant speed”, to

2
name a few. On the other hand, Jean Buridan proposed that motion was maintained by some
property of the body, called “impetus”. Impetus is conceived to be an inanimate “motive power”
or “intrinsic force” that keeps things moving (Hestenes, et.al., 1992). Buridan further held that
the impetus of a body increased with the speed with which it was set in motion, and with its
quantity of matter (New World Encyclopedia). Clearly, Buridan anticipated Isaac Newton when
he wrote:
...”after leaving the arm of the thrower, the projectile would be moved by an impetus
given to it by the thrower and would continue to be moved as long as the impetus remained
stronger than the resistance, and would be of infinite duration were it not diminished and
corrupted by a contrary force resisting it or by something inclining it to a contrary motion”.
Tenacity is another characteristic of misconceptions. Children do not just drop their ideas
and beliefs just because someone says so, or because an event disproves what they have come to
believe (Worth, 2000). In a research conducted by Gunstone and White (1981), the students
exhibited a strong tendency to observe their prediction regardless of what actually happened in
the lecture demonstrations. Even adults have trouble changing theories that are well-grounded in
experience (Worth, 2000).
Misconceptions can have serious impact on student learning. The prevalence of those
misconceptions hinder students from learning more advanced concepts, and as they continue to
build up knowledge, it becomes more difficult to rectify the misconceptions. If their initial
understanding is not engaged, they may fail to grasp new concepts and information presented in
the classroom, or they may learn them for purposes of a test but revert to their preconceptions
outside the classroom (Donovan, et. al., 1999). It is then important that the science teacher

3
should find ways to identify and carefully address those misconceptions that students bring to
class.
The primary aim of this study is to determine the prevalent or dominant misconceptions
on force and gravity that need to be addressed in the science classroom. Furthermore, it also
examined if the number of misconceptions and proportion of students having misconceptions are
correlated with gender and the type of school Physics background.
The results of this study will provide data to teachers and curriculum developers on the
prevalent misconceptions of the students on force and gravity. Moreover, the findings will serve
as a guide for teachers in planning classroom activities that could address misconceptions, and
thus, improve their students’ conceptual understanding and facilitate the acquisition of advanced
knowledge.
Scope and Delimitation. This study is limited to the misconceptions associated with the
situations on force and gravity covered in the instrument used. The 12-item survey instrument
was adapted from the Asia-Pacific Physics Teachers and Educators Association (APPTEA)
research report (Gunstone, et.al., 1989) which was published in 1989. The misconceptions
gathered were also limited to the students’ written responses to the questions, and no further
interviews were conducted. The high school students in the study were 9th
to 12th
graders from a
public high school in East Baton Rouge Parish, Baton Rouge, Louisiana.
Related Studies. The following paragraphs report past studies designed to improve
science instruction by identifying students’ misconceptions.
Halloun and Hestenes ( 1985) surveyed and analyzed “common sense” beliefs of college
students. The researchers used multiple-choice diagnostic pretests and posttests, and

4
conducted interviews. Examples of misconceptions are: that under no net force, an object slows
down; that under a constant force, an object moves at constant speed; and, that an impetus is
required to maintain the motion of an object. From the result of the survey, a taxonomy of
“common sense” concepts which conflict with Newtonian Theory was developed as a guide to
instruction. This is part of a sequence that led to the development of the Force Concept Inventory
(FCI).
The Force Concept Inventory (Hestenes, et.al., 1992) is a probe of belief systems
originally consisting of 29 questions which were developed from the taxonomy of commonsense
misconceptions. The inventory has been used in different research studies for purposes of lesson
planning and monitoring student learning from different teaching approaches. In a research study
conducted by Savinainen and Scott (2002), the FCI was used to evaluate student learning after
Interactive Conceptual Instruction was used in teaching Mechanics in a Finnish upper secondary
school. The most common specific conceptions found after instruction were the ideas that the
last force to act determines motion, velocity is proportional to applied force, and greater mass
implies greater force. On another occasion, Viiri (1996, as cited by Savinainen and Scott),
compared the FCI scores of Finnish and American Students and concluded that the results are
very similar.
Another research-based assessment instrument that probes conceptual understanding of
Newtonian Mechanics is the Force and Motion Conceptual Evaluation, or FMCE (Thornton and
Sokoloff, 1998). It was developed as an assessment tool of students’ understanding of Newton’s
Laws of Motion, and was used to assess students’ conceptual learning after the implementation
of microcomputer-based laboratory (MBL) curricula. Thornton and Sokoloff found out that, after

5
students’ exposure to active learning strategies supported by the MBL curricula, students’
conceptual learning had improved, based on the test.
Trowbidge and McDermott investigated student understanding of the concept of velocity
(1980) and acceleration (1981) in one dimension. Individual demonstration interviews,
conducted with 200 university students, indicated that even after instruction, many students
confused position with velocity and velocity with acceleration. A long-term study was also
conducted to identify student difficulties in relating kinematical concepts, their graphical
representations, and the motions of real objects (McDermott, et.al., 1987). The result of this
study was used as a guide in developing a conceptual approach to teaching kinematics
(McDermott & Rosenquist, 1987). Other studies were conducted by McDermott, et.al such as the
investigation of student understanding of the work-energy and impulse-momentum theorems
(1987), of the Atwood’s machine (1994), of light (1987), and of DC circuits (1992), which led to
the development of the “Physics by Inquiry” modules (1996) and “Tutorials in Introductory
Physics” (1996). These modules and tutorials have emphasis on the development and application
of concepts and scientific reasoning skills.
Gunstone (1987) conducted a survey of student understanding in mechanics in Australia.
On a multiple-choice test given to 5500 high school students, a majority predicted that two equal
masses on an Atwood’s machine would “seek” the same level.
Lee, et.al. (1992) surveyed some of the common misconceptions of force, gravity, heat
and electricity among Malaysian pupils. The survey revealed that more than half of the pupils
had the misconceptions that if a body is moving, then a force is acting in the direction of the
motion, and if a body is stationary then there’s no force acting on it. They also associated gravity
with the earth’s atmosphere, deducing that an object would be weightless on the moon because
6
there is no atmosphere. About one-third of the pupils perceived heat as some form of a substance
that can move. They also believed that some electric current is used up after it has flowed
through a bulb in a circuit. This study showed that pupils still held certain misconceptions even
after receiving classroom instruction.
Prior to instruction, more than 100 students in an introductory university mechanics
course were given a short-answer test on concepts of force and motion (Champagne et al., 1980
as cited by McDermott, 1998). The test used a technique abbreviated as D.O.E. (demonstration,
observation, explanation). The results revealed that the students, who had previously studied
physics, had many incorrect ideas: a force will produce motion; a constant force produces
constant velocity; the magnitude of the velocity is proportional to the magnitude of the force;
acceleration is due to an increasing force; and in the absence of forces, objects are either at rest
or slowing down. In another study that involved written tests and interviews about a pendulum
and a coin tossed in the air, the results indicated that both before and after an introductory course
in mechanics, many students seemed to believe that motion implies a force (Clement, 1982 as
cited by McDermott, 1998).
In a study entitled “Gender Difference, Misconceptions and Instruction in Science”
(Khang, 1995), the relationship between gender and students’ misconceptions in science was
analyzed. The study was conducted on two groups of secondary three students (third year high
school) from Singapore, both of which consisted of males and females. The two groups were
subjected to different teaching strategies for six weeks, namely, teaching strategy 1, which is
basically didactic in nature, and teaching strategy 11, which incorporates students'
misconceptions and applies the Generative Learning Model. A constructed and validated
diagnostic instrument was used as a means to measure the effectiveness of these two teaching

7
strategies. The findings showed that gender differences did not relate well to students'
misconceptions in science.
Another study investigated relationships between gender, interest and experience in
electricity, and conceptual change text manipulations on learning fundamental direct current
concepts (Chambers, 1997). Conceptual change text has been shown to lead to better conceptual
understanding of electrical concepts than traditional didactic text. When interest level,
experience, and prior knowledge were not included in the analysis, both gender and text type
produced significant main effects. When interest level, experience, and prior knowledge were
included in the analysis, conceptual change text led to better understanding of electricity
concepts than did the traditional text, and the effect of gender was eliminated. This finding
supports the hypothesis that prior interest level, experience, and knowledge mediate apparent
gender differences in learning about electricity. It suggests that conceptual change text
manipulations are likely to be effective for both men and women.
A research study was also conducted to find what kind of changes in student
understanding of motion can occur and at what age (Dykstra & Sweet, 2009). The subjects of
this study were 4th
, 6th
and 8th
grade students. Prior to and after instruction, the students were
asked to carefully describe several demonstrated accelerated motions. The 4th
and 6th
grade
students gave similar pre-instructional descriptions of the motion, but the 4th
grade students did
not exhibit the same degree of change in descriptions after instruction. The findings of the study
suggests that students as early as 6th
grade can develop changes in ideas about motion needed to
construct Newtonian-like ideas about force. Furthermore, this study suggests that students’
conceptions about motion change little under traditional physics instruction from these grade
levels through college level.

8
The Asia-Pacific Physics Teachers and Educators Association (APPTEA) also conducted
a survey of students’ conceptions in mechanics in seven Asia-Pacific countries (Gunstone, et.al.,
1989). The survey covered 12 qualitative questions on force and gravity. It was found out that
students in the countries involved (India, Korea, Malaysia, Philippines, Thailand, Australia and
Singapore) use ideas other than those taught in Physics to interpret situations. These ideas
appeared to have been derived from students’ interpretation of the world around them and from
students’ attempts to construct meaning from their everyday experiences. The idea that force is
needed for motion was widely held. What was found to differ across some countries was the
nature of some commonly misapplied physics principles. These include association of spinning
with gravity (Australia), the invoking of an inertial force (Thailand), and the assertion that
gravity exists only on earth (Malaysia). The findings may reflect something specific about
physics education in the country – curriculum, textbook, or teacher knowledge - which can be
determined only by further investigations.
The following were the common misconceptions on force and gravity found in the
APPTEA research report: On the situation involving a ball thrown into the air, the students
believed that the direction of motion is the direction of the force; that the force of throw still acts
on the ball thrown; and the use of “push of gravity”. On the situation where the bicycle is
slowing down, the students believed that the force used to speed up is still there, and that there is
force because there is motion, but there were also some who said that there is no force because it
is slowing down. On gravity, the following were the misconceptions found: gravity decreases
with height; floating equals weightlessness; the higher you are, the harder you hit the ground, so
gravity is greater; no gravity when object is falling freely; no gravity on moon; moon has no
atmosphere, so it has no gravity; less gravity on moon because it is far from earth; no gravity in

9
space; floating means no gravity; and, gravity underwater makes you drown if you were not
swimming. On the Atwood’s machine, students believed that the blocks will move to the same
level because they have equal mass.
To sum up, various researches have already been conducted to investigate students’
misconceptions in science and to test the effectiveness of different teaching strategies in altering
those misconceptions. In this study, the researcher wishes to investigate misconceptions on force
and gravity among high school students in a public high school in East Baton Rouge Parish,
Baton Rouge, Louisiana, and compare these with the findings of previous research studies,
particularly with the result of APPTEA research, where the survey instrument has been adapted.

10
MATERIALS AND METHODS
This study made use of a descriptive research method. A survey instrument adapted from
Asia-Pacific Physics Teachers and Educators Association (APPTEA) research published in 1989
was used in gathering the profile of the respondents and in soliciting their ideas in response to
questions on some situations involving force and gravity. The survey was administered in
December 2009 to science classes with the help of their respective teachers.
Population and Sample. The respondents in this study consisted of students at a public
high school in East Baton Rouge Parish. Samples were taken from different science classes in
order to obtain information and ideas that are representative of different school Physics
backgrounds.
At the time of the survey, the school had a population of 1,140 students, 337 (30%) of
which were freshmen, 320 (28%) were sophomores, 272 (24%) were juniors and 211(18%) were
seniors. The freshmen were taking the Physical Science class which consisted of Chemistry in
the Fall semester and Physics in the Spring semester. Since the survey was administered in
December, Physics had not yet been discussed in class, so the freshmen were considered to have
“Middle School Science” as their school Physics background.
There were 135 (12%) students who were taking Physics at the time of the survey. Since
they had already learned about force and gravity in this class, they had “High School Physics” as
their source of school Physics background.
The rest of the respondents (58%) were taken from Biology and Environmental Science
classes which mostly consisted of sophomores and juniors. Since they had taken Physical
Science in their freshmen year, “High School Physical Science” was considered as their source
of school Physics background.
11
Z2 * ( p ) * ( 1 – p )
c2
ss
ss - 1
1 +
pop
With the school population of 1,140 students, and at a confidence level of 95% with a 5%
margin of error, this study needed a sample size of at least 288. Interactive online sample size
calculators were used (www.surveysystem.com and www.raosoft.com) and found to obtain the
same sample size as the formula below.
ss =
Where :
ss = sample size
Z = Z value ( e.g., 1.96 for 95 % confidence interval)
p = percentage picking a choice, expressed as decimal (0.5 used for sample size
needed)
c = confidence interval, expressed as decimal (e.g., 0.05 = ± 5 )
For a finite population, a correction is made by the following formula.
New sample size =
Where: pop = population
Stratified random sampling was employed to obtain samples from the different groups
based on “school Physics background”. Proportionate stratification was used to determine the
number of samples for each group.
Table 1 shows the distribution of the sampled respondents in terms of school Physics
background and gender. Among the 288 samples in the study, 86 of them belonged to the
Middle School Science group, 167 to the High School Physical Science group, and 35 to the
High School Physics group. These numbers are proportional to the total number of students who

12
belonged to each group. The random sampling also resulted in the sample being 51% male and
49% female subjects.
Table 1. Frequency and Percentage Distribution of the Respondents in Terms of School
Physics Background and Gender.
School Physics
Background
Male Female Total
f % F % f %
Middle School Science 43 15 43 15 86 30
HS Physical Science 87 30 80 28 167 58
HS Physics 18 6 17 6 35 12
Total 148 51 140 49 288 100.00
Data Gathering Instrument. The instrument was a 12-item qualitative test that
requested student answers and the reasoning used to arrive at those answers. It aimed to find out
students’ ideas and beliefs relevant to aspects of force and gravity. This instrument was
formulated in Australia in 1987 for the Asia-Pacific Physics Teachers and Educators Association
(APPTEA) project. It was the result of the collective efforts of the representatives of the
countries who attended the inaugural meeting of the APPTEA in a workshop sponsored by
UNESCO in 1986 in Manila. The pilot testing of this instrument was done in seven countries
namely India, Korea, Malaysia, Philippines, Singapore, Thailand and Australia.
Questions 1, 2 and 3 asked about the total (net) force (whether up, down or no force) on
a ball thrown straight up into the air at three positions: on the way up (after leaving the hand of
the thrower) ; at the top of its flight ; and on the way down. After each question, a space was
given for students to write their reasons in choosing their answer.
Questions 4 and 5 focused on a ball thrown up in a parabolic path. The students were

13
asked to consider “all the forces on the ball” at two positions - the ball at its highest point and
the ball on its way down. In order to avoid student confusion on pull of gravity and push of
gravity, the original six alternative responses were reduced to four, eliminating the choices that
involve “push of gravity”. The alternative responses involved one or two of: “pull of gravity” ;
“force of throw” ; “no force” . Students’ reasoning was also asked. The third part of questions 4
and 5 asked if there were other forces not shown in the choices.
Question 6 showed a bicycle being ridden with no brakes and no pedaling, but slowing
down. Students were asked if there was a force on the bicycle, and to explain their answer.
Questions 7, 8, 9, 10 and 11 asked about the presence or absence of gravity in five
situations : standing on the earth ; falling from an airplane ; standing on the moon; spaceman
near a satellite ; and swimming underwater. In some of these cases, the perceived magnitude of
any gravity was also probed.
Question 12 showed two equal blocks at rest on a pulley (Atwood’s machine) with the
left hand block lower than the right hand block. Students were asked whether, one minute later,
the blocks would be in the same position, or at the same height with each other, or if the right
hand block would be lower. Their reasoning for their answer was also asked.
In all questions, line drawings were used to illustrate the situations. The final version of
the instrument is shown in Appendix E.
A correct conception corresponds to a correct answer with correct reason. Students with
misconceptions did not include those who did not express ideas, those who gave the correct
answers but with no reasons, and those who gave the correct answers but restated their answers
instead of giving their reasons.

14
Statistical Treatment. Frequency counts and percentages were used to present students’
ideas and misconceptions in the situations involving force and gravity.
In determining the association between gender and the number of misconceptions found
per situation, Fisher’s Exact Test was utilized. The null hypothesis was tested at 0.05 level of
significance. The same statistical test was used to determine whether there was a significant
difference in the proportion of male and female students having misconceptions. To further
validate the result of Fisher’s Exact Test, a t-test was also used to determine significant
differences between the number of misconceptions of male and female students, and between the
proportion of male and female students having misconceptions.
Kendall’s Coefficient of Concordance was calculated to determine agreement in the
ranking of the number of misconceptions held according to school Physics background. The
same statistical tool was also used to determine agreement in the ranking of the proportion of
students having misconceptions according to school Physics background. The values of
Kendall’s coefficient of concordance range from 0 to 1 and is treated same way as coefficient of
correlation. Higher values denote a stronger correlation. The chi-square statistic was used to test
the significance of the Kendall’s coefficient at the 0.05 level of significance.

15
RESULTS AND DISCUSSION
Data on students’ ideas and beliefs about force and gravity were gathered with the use of
the survey instrument consisting of 12 qualitative questions. The ideas and beliefs gathered were
limited to the situations included in the survey and to the students’ written responses. After a
thorough collection, tabulation, and analysis of students’ responses, the following results were
obtained.
Students’ Responses and Misconceptions. Questions 1, 2 and 3 in the survey asked
about the total or net force on a ball thrown straight up into the air at three positions, namely: on
the way up ; at the top of its flight ; and, on the way down. Tables 2, 3 and 4 summarize the
students’ responses to each of the three positions, and figures 1, 2 and 3 present a bar graph of
these misconceptions. The data were derived from the students’ responses but only the
alternative ideas and beliefs were used. Correct responses, answers with no reasons, and
inconsistent answers that did not provide a logical clue to students’ thinking, were not presented
in these graphs.
On question 1 (the ball is on its way up), only 20 or 7% of the total number of students
got the correct answer and correct reasons (see Table 2). Five students believed that the force is
downward because “gravity pushes it down”. Although the vocabulary used is not appropriate,
this response was not considered to be a misconception in this study. The students who wrote
this answer may only have a wrong choice of word for “push” when they actually meant “pull”
of gravity. The respondents in the APPTEA research also presented an idea about “push of
gravity”.
A majority of the students (69%) thought that the total force is directed upward. This
result is consistent with the findings of the APPTEA research in 1989 where a majority of the

16
Male Female Male Female Male Female Male Female Total
A) Down 7 7 25 15 10 7 42 29 71
Reasons:
*gravity pulls it down 5 3 0 0 7 4 12 7 19
*ball is decelerating 0 0 0 0 1 0 1 0 1
gravity pushes it down 0 2 0 0 2 1 2 3 5
ball is leaving the hand 2 1 0 0 0 0 2 1 3
ball will eventually fall 0 1 0 0 0 0 0 1 1
force is directed down 0 0 15 8 0 0 15 8 23
what goes up must come down 0 0 2 1 0 0 2 1 3
force is directed up(inconsistent) 0 0 3 5 0 0 3 5 8
don't know 0 0 0 0 0 1 0 1 1
no reason given 0 0 5 1 0 1 5 2 7
B) Up 35 33 57 57 8 9 100 99 199
Reasons:
force from throw 15 10 0 0 3 4 18 14 32
force from throw is greater than gravity 0 0 0 0 2 0 2 0 2
ball is going up 18 20 0 2 2 5 20 27 47
gravity makes the ball go up 1 0 0 0 0 0 1 0 1
force is directed up 0 0 52 47 0 0 52 47 99
gravity makes the ball come down(inconsistent) 0 1 1 0 0 0 1 1 2
common sense 0 1 0 0 0 0 0 1 1
right answer 0 0 0 3 0 0 0 3 3
no reason given 1 1 4 5 1 0 6 6 12
c) Zero 1 3 4 6 0 1 5 10 15
Reasons:
no force when the ball goes into the air 0 2 0 3 0 0 0 5 5
force of throw and gravity cancel 0 0 0 0 0 1 0 1 1
ball will stop at its peak 1 0 2 2 0 0 3 2 5
don't know 0 1 0 0 0 0 0 1 1
no reason given 0 0 2 1 0 0 2 1 3
No Answer Given 0 0 1 2 0 0 1 2 3
Total 43 43 87 80 18 17 148 140 288
Middle School (n=86) Physics (n=35) Overall (n=288)Answers and Reasons
Physical Sci. (n=167)
students also answered the same thing. Ninety-nine students (or 59%) from the Physical Science
group responded that the force is directed upward when the ball is on its way up, but were not
able to reason out their conceptual belief. Some students based their response on the idea that
the direction of motion is also the direction of the force. Others believed that the force from
throw still existed when the ball was rising in the air.
Table 2. Students’ Answers to Question 1 – If a ball is thrown straight up into the air,
then the total force on the ball on its way up is a) down, b) up or c) zero?
* Correct answers

17
3
1
0
29
0
44
1
0
2
0
1
0
0
2
0
0
1
0
59
2
0
2
0
0
0
20
6
20
0
0
0
3
0
0 10 20 30 40 50 60 70
Force is down because ball is leaving the
hand
Force is down because the ball will
eventually fall
What goes up must come down
Force is upward due to the force from throw
Force from throw is greater than gravity
Force is upward because ball is going up
Gravity makes the ball go up
Force is directed up
There is no force when the ball goes into the
air
There is no net force because force of throw
and gravity cancel
There is no force , that is why the ball will
stop at its peak
Percent of Students
Stu
den
ts' A
lter
nati
ve
Idea
s an
d B
elie
fs
Physics
Physical Science
Middle School Science
Figure 1. Alternative Ideas of Students on the Total Force on a Ball Thrown Vertically
While Rising.
Figure 1 shows the misconceptions held by the students. The idea that the direction of
motion is also the direction of force, and the idea that the force of throw is still in the ball on its
way up, are dominant misconceptions among students with Middle School Science background
and students with Physics background.
Students who answered that there is no force when the ball is going up, believed that
there is no force when the ball is in the air. Some believed that gravity and force of throw cancel,

18
Male Female Male Female Male Female Male Female Total
A) Down 9 11 16 26 7 7 32 44 76
Reasons:
*gravity pulls it down 2 2 0 0 6 4 8 6 14
*the ball is accelerating down 0 0 0 0 1 3 1 3 4
gravity pushes it down 3 0 0 0 0 0 3 0 3
mass of the ball makes it go down 1 0 0 0 0 0 1 0 1
force is directed down 0 0 13 18 0 0 13 18 31
what goes up must come down 0 0 0 3 0 0 0 3 3
ball starts to come down 3 8 0 0 0 0 3 8 11
it's the right answer 0 0 0 2 0 0 0 2 2
no reason given 0 1 3 3 0 0 3 4 7
B) Up 3 6 14 13 0 0 17 19 36
Reasons:
ball is up in the air 3 3 1 0 0 0 4 3 7
force is directed up 0 0 7 8 0 0 7 8 15
ball will come down(inconsistent) 0 2 0 0 0 0 0 2 2
no reason given 0 1 6 5 0 0 6 6 12
c) Zero 31 25 55 38 11 10 97 73 170
Reasons:
ball stops on top of its flight 12 12 35 8 8 5 55 25 80
gravity didn't force it down yet 1 0 1 1 0 0 2 1 3
force of throw has run out 3 1 0 0 0 0 3 1 4
getting ready to go down 1 0 0 1 0 0 1 1 2
no force on top of flight 14 9 10 22 0 0 24 31 55
has potential energy on top 0 1 0 0 0 0 0 1 1
ball is weightless at the top 0 0 1 0 0 0 1 0 1
ball loses momentum at the top 0 0 1 0 0 0 1 0 1
force of throw and gravity balance 0 1 0 0 3 4 3 5 8
the right answer 0 0 0 1 0 0 0 1 1
don't know 0 0 0 0 0 1 0 1 1
no reason given 0 1 7 5 0 0 7 6 13
No Answer Given 0 1 2 3 0 0 2 4 6
Total 43 43 87 80 18 17 148 140 288
Middle School (n=86) HS Physical Sci. (n=167) HS Physics (n=35) Overall (n=288)Answers and Reasons
and a few reasoned out that the ball will eventually stop on top because there are no forces acting
on it.
Table 3. Students’ Answers to Question 2 – If a ball is thrown straight up into the air,
then the total force on the ball just at the top of its flight is a) down , b) up or
c)zero?
* Correct answers

19
1
0
13
7
0
28
1
5
1
27
1
0
0
1
0
2
0
1
9
26
1
0
1
19
0
1
1
0
0
0
0
0
0
37
0
0
0
0
0
0
0
20
0 10 20 30 40 50
Force is downward because the mass of
the ball makes it go down
What goes up must come down
Force is downward because at the top of
flight, ball starts to come down
Force is upward when the ball is up in the
air
Force is directed up when the ball is at the
top of flight
Force is zero because the ball stops on top
of its flight
Force is zero at the top because gravity
didn't force it down yet
Force of throw runs out on top of flight
Force is zero because the ball is still
getting ready to go down
There's no force on top of flight
Force is zero because the ball has potential
energy on top
Force is zero because the ball is weightless
at the top
Force is zero because ball loses
momentum at the top
Force of throw and gravity balance at the
top of its flight
Percent of Students
Stu
den
ts' A
lter
nati
ve
Idea
s an
d B
elie
fs
Physics
Physical Science
Middle School Science
Table 3 reveals the students responses on question 2, which asks about the total force on
the ball when it is just at the top of its flight. Seventy-six or 26% of the students answered that
the force was downward, but only 18 or 6% supported their answers with correct reasons.
Figure 2. Alternative Ideas of Students on the Total Force on a Ball Thrown Vertically
at the Top of its Flight.

20
Figure 2 shows a comparison of the misconceptions held by each group of students. The
most common misconception for all the three groups (28% of Middle School Group, 26% of
Physical Science Group, and 37 % of the Physics group) is that “the force is zero because the
ball stops on top of its flight”. The students thus believed that there is no force when there is no
motion. This very persistent misconception exists in higher percentage of students who had
received advanced Physics instruction in the Physics group. Twenty-seven percent of the Middle
School group and 19% of the Physical Science group believed that there is no force on top of
flight, but they did not provide an explanation for their belief. Among the Physics group, 20%
believed that there is no force at the top of the ball’s flight because the force of throw and gravity
balance at that point. This probably comes from the idea that when the ball is momentarily at rest
at the top of its flight, it is in instantaneous positional equilibrium, and there must therefore be a
balance of forces.
On question 3, which asks for the total force on the ball on its way down, 233 or 81%
answered that the total force is downward, but only 54 or 19% answered with correct reasons
(see table 4). The majority (53%) of the Middle school students answered that the “force is
downward because the motion is downward”. Five percent from the Physical Science group and
17% from the Physics group also answered the same. This is another persistent and common
misconception (Driver, 1994). Nine percent of the Physics group believed that the force is
upward because of air resistance. Other misconceptions include “no force when the ball is in the
air by itself”, “no force when falling”, “force is up when ball is coming down”, “force on the
ball is pressured down”, and “there’s a force above the ball that pushes it down”. The responses
“the force of the ball is pulling it down” and “force is downward because gravity is greater than
the force of the ball” is indicative of students’ belief that the ball has a motive force. Table 4
21
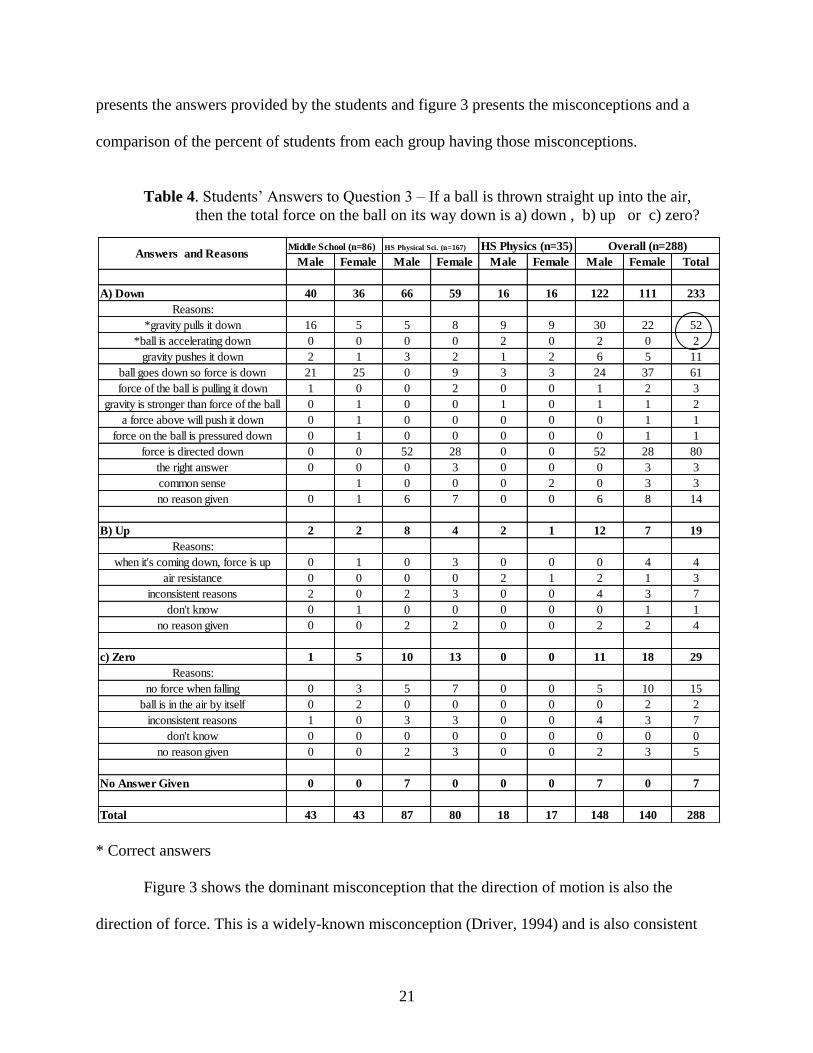
presents the answers provided by the students and figure 3 presents the misconceptions and a
comparison of the percent of students from each group having those misconceptions.
Table 4. Students’ Answers to Question 3 – If a ball is thrown straight up into the air,
then the total force on the ball on its way down is a) down , b) up or c) zero?
* Correct answers
Figure 3 shows the dominant misconception that the direction of motion is also the
direction of force. This is a widely-known misconception (Driver, 1994) and is also consistent
Male Female Male Female Male Female Male Female Total
A) Down 40 36 66 59 16 16 122 111 233
Reasons:
*gravity pulls it down 16 5 5 8 9 9 30 22 52
*ball is accelerating down 0 0 0 0 2 0 2 0 2
gravity pushes it down 2 1 3 2 1 2 6 5 11
ball goes down so force is down 21 25 0 9 3 3 24 37 61
force of the ball is pulling it down 1 0 0 2 0 0 1 2 3
gravity is stronger than force of the ball 0 1 0 0 1 0 1 1 2
a force above will push it down 0 1 0 0 0 0 0 1 1
force on the ball is pressured down 0 1 0 0 0 0 0 1 1
force is directed down 0 0 52 28 0 0 52 28 80
the right answer 0 0 0 3 0 0 0 3 3
common sense 1 0 0 0 2 0 3 3
no reason given 0 1 6 7 0 0 6 8 14
B) Up 2 2 8 4 2 1 12 7 19
Reasons:
when it's coming down, force is up 0 1 0 3 0 0 0 4 4
air resistance 0 0 0 0 2 1 2 1 3
inconsistent reasons 2 0 2 3 0 0 4 3 7
don't know 0 1 0 0 0 0 0 1 1
no reason given 0 0 2 2 0 0 2 2 4
c) Zero 1 5 10 13 0 0 11 18 29
Reasons:
no force when falling 0 3 5 7 0 0 5 10 15
ball is in the air by itself 0 2 0 0 0 0 0 2 2
inconsistent reasons 1 0 3 3 0 0 4 3 7
don't know 0 0 0 0 0 0 0 0 0
no reason given 0 0 2 3 0 0 2 3 5
No Answer Given 0 0 7 0 0 0 7 0 7
Total 43 43 87 80 18 17 148 140 288
Middle School (n=86) HS Physical Sci. (n=167) HS Physics (n=35) Overall (n=288)Answers and Reasons

22
1
53
1
1
1
1
0
3
2
0
5
1
0
0
2
0
7
0
3
17
0
0
0
0
9
0
0
0 10 20 30 40 50 60 70
Force is downward because gravity is
stronger than the force of the ball
Force is downward because the ball is
going downward
Force of the ball is pulling it down
A force above the ball pushes it down
Force on the ball is pressured down
When the ball is coming down, force is
up
The force is upward because of air
resistance
There's no force on the ball when
falling
There's no force when ball is in the air
by itself
Percent of Students
Stu
den
ts' A
lter
nati
ve
Idea
s an
d B
elie
fs
Physics
Physical Science
Middle School Science
with the findings in the APPTEA research (1989). The APPTEA research found that 86% of the
Asia-Pacific students jointly believed in the presence of the force of throw and that the direction
of motion is also the direction of the force.
Figure 3. Alternative Ideas of Students on the Force on a Ball Falling Vertically

23
Male Female Male Female Male Female Male Female Total
A) Pull of Gravity 1 4 12 7 4 1 17 12 29
Reasons:
*only gravity acts on the ball 1 2 7 5 2 1 10 8 18
* ball has already left the hand 0 0 0 0 1 0 1 0 1
*throw is no longer a force after leaving the hand 0 0 0 0 1 0 1 0 1
inconsistent/no reason given 0 2 5 2 0 0 5 4 9
B) Force of Throw 6 12 8 18 2 1 16 31 47
Reasons:
no gravity at the highest point 0 1 0 0 0 0 0 1 1
only force of throw exists at the highest point 5 11 4 10 2 1 11 22 33
inconsistent/no reason given 1 0 4 8 0 0 5 8 13
c) Pull of Gravity + Force of Throw 27 23 57 35 11 12 95 70 165
Reasons:
force of throw combines with gravity 25 21 16 10 0 0 41 31 72
the force has horizontal and vertical components 0 0 17 7 5 10 22 17 39
inconsistent/no reason given 2 2 24 18 6 2 32 22 54
D) No Force 9 4 7 14 1 3 17 21 38
No Answer Given 0 0 3 6 0 0 3 6 9
Total 43 43 87 80 18 17 148 140 288
Middle School (n=86) HS Physical Sci. (n=167) HS Physics (n=35) Overall (n=288)Answers and Reasons
Table 5 presents the students’ responses to question 4, which asks about the total force on
a ball thrown obliquely at the top of its parabolic path. It can be seen from the table that only 20
students or 7% answered and reasoned correctly.
Table 5. Students’ Answers to Question 4 – If a ball is thrown obliquely to travel along
a parabolic path, what forces act on the ball at its highest point?
* correct answers
It can be seen from the table above that 165 or 58% of the students believed that the force
of gravity and the force of the throw both act on the ball when it is at the top of its flight. When
the number of students answering b (force of throw) and c (gravity +force of throw) are
combined together, this sums up to 212 or 74 % of students who believed that the force of the
throw is still present on the ball. In the APPTEA research, 78% of the younger students (15-16
y/o) and 71% of the older students (17-18 y/o), or 75% of all the students also believed in the

24
1
19
53
0
15
0
8
16
14
13
0
9
0
43
11
0 10 20 30 40 50 60 70
There is no gravity at the highest point
Only force of throw exists at the highest
point
At the highest point, force of throw
combines with gravity
The force at the highest point has horizontal
and vertical components
There is no force at the highest point
Percent of Students
Stu
den
ts' A
lter
nati
ve
Idea
s an
d B
elie
fs
Physics
Physical Science
Middle School Science
presence of the “force of throw”. This conceptual belief coincides with the Impetus Theory (as
cited by Halloun and Hestenes, 1985) which was formulated in the 14th
century.
A detailed comparison of students’ misconceptions and percent of students per group
having the misconceptions is presented in figure 4.
Figure 4. Alternative Ideas of Students on the Force on a Ball at the Top of its Parabolic
Path.
Figure 4 shows that the misconception on the presence of the “force of throw” is more
common among the Middle School group (total of 72%) and decreases to 24% among the
Physical Science group, and to 9% among the Physics group. It noted however, that 43% of the
Physics group believed that the force at the highest point has horizontal and vertical components.
Since they had received more advanced Physics instruction, their knowledge of vectors and the
horizontal and vertical components of velocity in projectile motion has probably caused

25
Male Female Male Female Male Female Male Female Total
A) Pull of Gravity 10 6 17 24 7 2 34 32 66
Reasons:
*only gravity acts on the ball on its way down 7 4 10 15 7 2 24 21 45
*force of throw is over after leaving the hand 2 1 0 0 0 0 2 1 3
inconsistent/no reason given 1 1 7 9 0 0 8 10 18
B) Force of Throw 9 14 21 17 0 0 30 31 61
c) Pull of Gravity + Force of Throw 23 19 40 23 11 15 74 57 131
D) No Force 0 4 5 7 0 0 5 11 16
No Answer Given 1 0 4 9 0 0 5 9 14
Total 43 43 87 80 18 17 148 140 288
Middle School (n=86)Answers and Reasons
HS Physics (n=35) Overall (n=288)HS Physical Sci. (n=167)
27
49
5
23
38
7
0
74
0
0 10 20 30 40 50 60 70 80 90
The force of throw makes the ball descend in
a parabolic path
Pull of gravity combines with force of throw
There is no force when the ball is descending
in a parabolic path
Percent of Students
Stu
den
ts' A
lter
nati
ve
Idea
s an
d
Bel
iefs
Physics
Physical Science
Middle School Science
confusion with the concept of force. Some students also believed that “there is no force at the
highest point” of a parabolic path.
Table 6. Students’ Answers to Question 5 – If a ball is thrown obliquely to travel along a
parabolic path, what forces act on the ball when it is coming down?
* Correct answers
Figure 5. Alternative Ideas of Students on the force on a Ball in a Parabolic Path While
Descending.
26
Male Female Male Female Male Female Male Female Total
Question 4
*Yes, air resistance 2 0 0 0 4 4 6 4 10
Yes, upward force 3 4 1 0 1 0 5 4 9
Yes, diagonal force 1 1 0 0 0 0 1 1 2
Yes, weight of the ball 0 1 0 0 0 0 0 1 1
Yes, (no reason given) 0 0 17 9 0 0 17 9 26
No 37 35 60 52 0 13 97 100 197
No answer given 0 2 9 19 0 0 9 21 30
Question 5
*Yes, air resistance 0 0 0 0 6 2 6 2 8
Yes, upward force 0 2 0 1 0 0 0 3 3
Yes, (no reason given) 0 0 9 5 0 0 9 5 14
No 38 38 62 54 12 15 112 107 219
No answer given 5 3 16 20 0 0 21 23 44
Middle School (n=86)Answers
HS Physical Sci. (n=167) HS Physics (n=35) Overall (n=288)
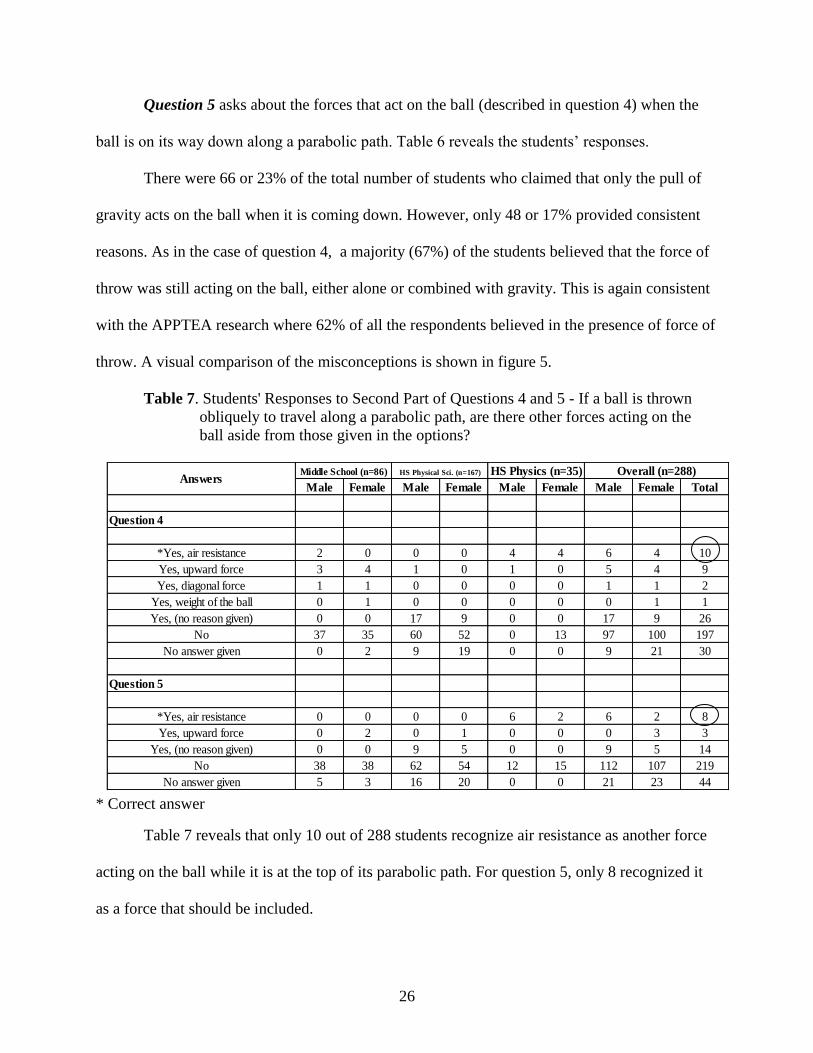
Question 5 asks about the forces that act on the ball (described in question 4) when the
ball is on its way down along a parabolic path. Table 6 reveals the students’ responses.
There were 66 or 23% of the total number of students who claimed that only the pull of
gravity acts on the ball when it is coming down. However, only 48 or 17% provided consistent
reasons. As in the case of question 4, a majority (67%) of the students believed that the force of
throw was still acting on the ball, either alone or combined with gravity. This is again consistent
with the APPTEA research where 62% of all the respondents believed in the presence of force of
throw. A visual comparison of the misconceptions is shown in figure 5.
Table 7. Students' Responses to Second Part of Questions 4 and 5 - If a ball is thrown
obliquely to travel along a parabolic path, are there other forces acting on the
ball aside from those given in the options?
* Correct answer
Table 7 reveals that only 10 out of 288 students recognize air resistance as another force
acting on the ball while it is at the top of its parabolic path. For question 5, only 8 recognized it
as a force that should be included.

27
Male Female Male Female Male Female Male Female Total
YES with correct reason 6 3 12 5 12 8 30 16 46
Reasons:
*friction 5 1 7 5 10 6 22 12 34
*air resistance 1 2 5 0 2 2 8 4 12
YES with incorrect reason 22 19 21 22 6 7 49 48 97
Reasons:
force used to speed up is still there 9 8 0 0 0 0 9 8 17
still moving so there's force 4 4 8 12 3 0 15 16 31
inertia 0 2 0 1 0 0 0 3 3
gravity 7 5 13 9 2 5 22 19 41
normal reaction 2 0 0 0 0 0 2 0 2
inconsistent reason 0 0 0 0 1 2 1 2 3
YES, no explanation given 3 0 15 8 0 0 18 8 26
NO 8 20 35 36 0 2 43 58 101
Reasons:
no pedalling and/or no brakes 1 12 0 0 0 0 1 12 13
slowing down 4 5 7 3 0 2 11 10 21
tires are just rolling 1 0 0 0 0 0 1 0 1
no pressure applied on the bike 0 1 0 0 0 0 0 1 1
inertia caused the motion 0 1 0 0 0 0 0 1 1
inconsistent reasons 2 1 11 17 0 0 13 18 31
no force (restatement) 0 0 9 11 0 0 9 11 20
no reason given 0 0 8 5 0 0 8 5 13
0 0 0
No answer given 4 1 4 9 0 0 8 10 18
Total 43 43 87 80 18 17 148 140 288
Answers and ReasonsMiddle School (n=86) HS Physical Sci. (n=167) HS Physics (n=35) Overall (n=288)
Question 6 asks about the force on a bicycle when brakes and pedals are not used and
the bicycle is slowing down. Out of the 288 students, only 46 or 16% answered correctly and
with correct reasons. One hundred twenty-three of the students also agreed that there is a force
on the bicycle but they provided no or wrong explanation.
Table 8 provides the detailed data on students’ responses to question 6. The
misconceptions involving this situation are also summarized and compared per group in a bar
graph (figure 6).
Table 8. Students’ Answers and Reasons to Question 6 – Is there a force on the bicycle
if the person riding it is not using the brakes or pedals but the bicycle is slowing down?
* Correct answers

28
20
9
2
14
2
15
10
1
1
1
0
12
1
13
0
0
6
0
0
0
0
9
0
20
0
0
6
0
0
0
0 10 20 30
The force used to speed up is still there
There is force because it is still moving
Inertia slows it down
Gravity slows down the bicycle
Normal reaction slows down the bicycle
There's no force when no pedalling and/or no
brakes
No force because it is slowing down
No force because the tires are just rolling
There's no force because no pressure is applied
on the bike
There's no force, it is inertia that caused the
motion
Percent of Students
Stu
den
ts'
Alt
ern
ati
ve
Idea
s a
nd
Bel
iefs
Physics
Physical Science
Middle School Science
It is observed from figure 6 that 26% of the Physics group believed that gravity slows
down the bicycle, together with 13% and 14% of the Middle School and Physical Science groups
respectively. Twenty percent of the Middle School group also believed that the force used to
speed up is still present. Students also reasoned out that there is force on the bicycle since it is
still moving. Students argued that there’s no force because there’s no pedaling and no brakes
applied, because it is slowing down, because tires are just rolling, and because inertia just caused
the motion. Others also believed that inertia and normal force slowed it down. Three of these
were found similar to the misconceptions found in the APPTEA research, namely: force used to
speed up is still there; there’s a force because it is still moving; and, there’s no force because it is
slowing down.
Figure 6. Alternative Ideas of Students on the Forces on a Bicycle That is Slowing Down

29
Male Female Male Female Male Female Male Female Total
YES with consistent reason 35 31 57 55 15 15 107 101 208
Reasons:
*gravity keeps us standing on earth 26 24 38 35 9 9 73 68 141
*gravity keeps us from floating 7 6 19 20 6 6 32 32 64
*mass of earth causes gravity 2 0 0 0 0 0 2 0 2
*you have weight 0 1 0 0 0 0 0 1 1
YES with incorrect/inconsistent reason 0 2 1 0 3 0 4 2 6
Reasons:
there's gravity because of the air 0 2 1 0 0 0 1 2 3
gravity pushes you down 0 0 0 0 3 0 3 0 3
YES with no reason given 6 1 14 6 0 2 20 9 29
NO 2 9 8 12 0 0 10 21 31
Reasons:
no gravity when you're not moving 0 2 0 0 0 0 0 2 2
no gravity when you're just standing 1 5 2 3 0 0 3 8 11
earth's atmosphere 0 0 0 2 0 0 0 2 2
inconsistent reasons 1 0 0 1 0 0 1 1 2
no reason given 0 2 6 6 0 0 6 8 14
0 0 0
No answer given 0 0 7 7 0 0 7 7 14
Total 43 43 87 80 18 17 148 140 288
Answers and ReasonsMiddle School (n=86) HS Physical Sci. (n=167) HS Physics (n=35) Overall (n=288)
Table 9. Students’ Answers and Reasons to Question 7 – Is there gravity when you are
standing on the earth?
* Correct answers
Questions 7 to 11 were aimed to determine students’ ideas about gravity at various
locations. Question 7, which asks about gravity when someone is standing on earth, had the
greatest percentage of students getting the correct answer. A total of 208 students or 72%
answered correctly with consistent reasons. The consistent idea about the gravity of the earth that
“pushes” you down persists for three or 9% of the Physics group. There are also noted
misconceptions about gravity when standing on earth. Figure 7 provides a summary of those
misconceptions as well as a comparison of the percentage of students from each group who had
each of those misconceptions.
30
2
2
7
0
1
0
3
1
0
0
0
0
0 10 20
There is gravity because of the air
There is no gravity when you're not moving
There is no gravity when you're just standing
There is no gravity because of the earth's
atmosphere
Percent of Students
Stu
den
ts' A
lter
na
tiv
e Id
eas
an
d
Bel
iefs
Physics
Physical Science
Middle School Science
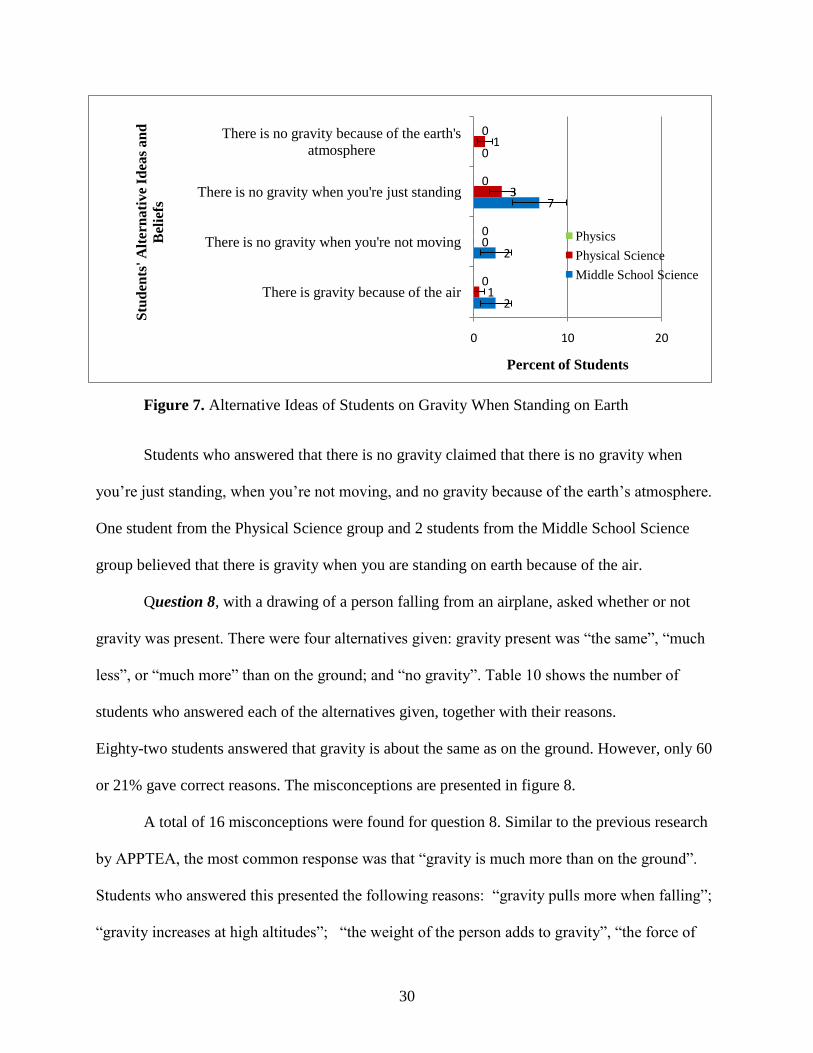
Figure 7. Alternative Ideas of Students on Gravity When Standing on Earth
Students who answered that there is no gravity claimed that there is no gravity when
you’re just standing, when you’re not moving, and no gravity because of the earth’s atmosphere.
One student from the Physical Science group and 2 students from the Middle School Science
group believed that there is gravity when you are standing on earth because of the air.
Question 8, with a drawing of a person falling from an airplane, asked whether or not
gravity was present. There were four alternatives given: gravity present was “the same”, “much
less”, or “much more” than on the ground; and “no gravity”. Table 10 shows the number of
students who answered each of the alternatives given, together with their reasons.
Eighty-two students answered that gravity is about the same as on the ground. However, only 60
or 21% gave correct reasons. The misconceptions are presented in figure 8.
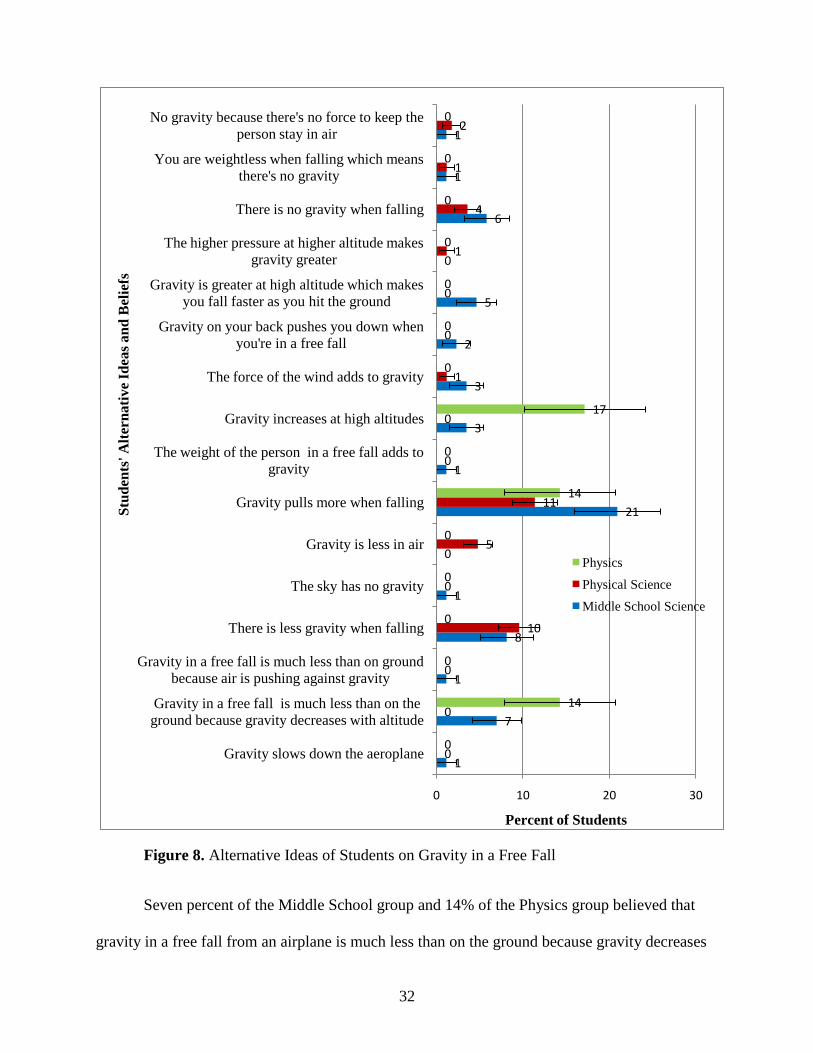
A total of 16 misconceptions were found for question 8. Similar to the previous research
by APPTEA, the most common response was that “gravity is much more than on the ground”.
Students who answered this presented the following reasons: “gravity pulls more when falling”;
“gravity increases at high altitudes”; “the weight of the person adds to gravity”, “the force of
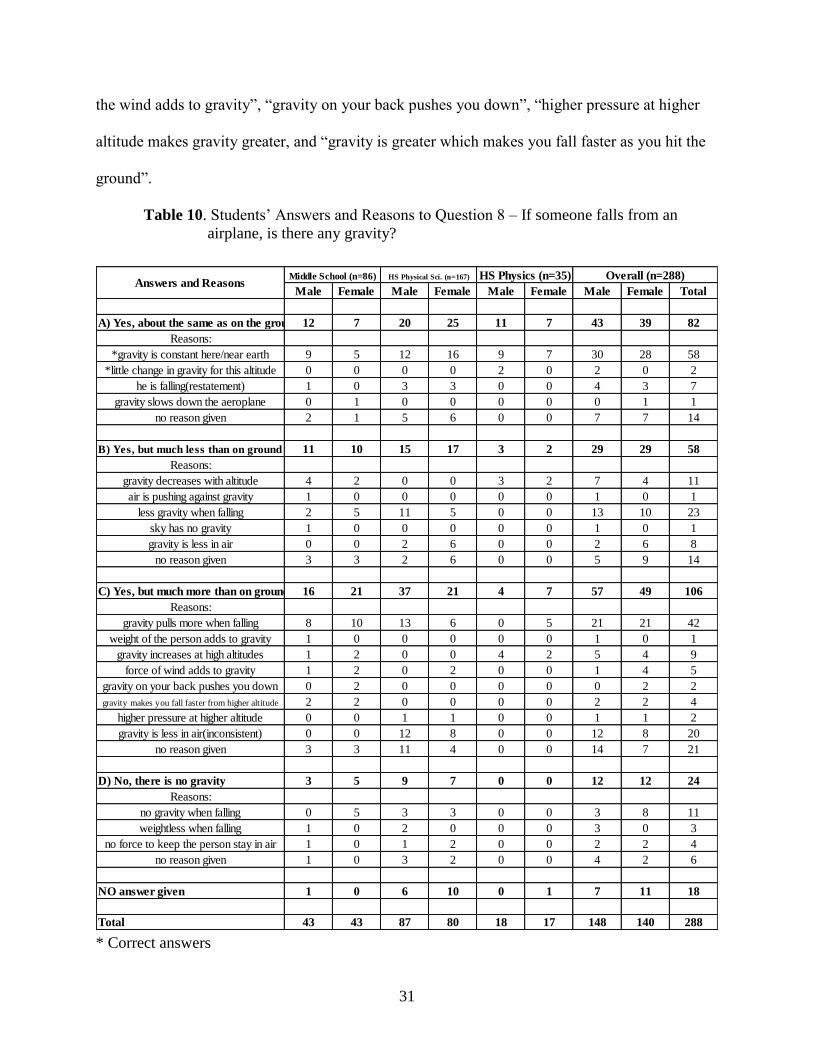
31
Male Female Male Female Male Female Male Female Total
A) Yes, about the same as on the ground 12 7 20 25 11 7 43 39 82
Reasons:
*gravity is constant here/near earth 9 5 12 16 9 7 30 28 58
*little change in gravity for this altitude 0 0 0 0 2 0 2 0 2
he is falling(restatement) 1 0 3 3 0 0 4 3 7
gravity slows down the aeroplane 0 1 0 0 0 0 0 1 1
no reason given 2 1 5 6 0 0 7 7 14
B) Yes, but much less than on ground 11 10 15 17 3 2 29 29 58
Reasons:
gravity decreases with altitude 4 2 0 0 3 2 7 4 11
air is pushing against gravity 1 0 0 0 0 0 1 0 1
less gravity when falling 2 5 11 5 0 0 13 10 23
sky has no gravity 1 0 0 0 0 0 1 0 1
gravity is less in air 0 0 2 6 0 0 2 6 8
no reason given 3 3 2 6 0 0 5 9 14
C) Yes, but much more than on ground 16 21 37 21 4 7 57 49 106
Reasons:
gravity pulls more when falling 8 10 13 6 0 5 21 21 42
weight of the person adds to gravity 1 0 0 0 0 0 1 0 1
gravity increases at high altitudes 1 2 0 0 4 2 5 4 9
force of wind adds to gravity 1 2 0 2 0 0 1 4 5
gravity on your back pushes you down 0 2 0 0 0 0 0 2 2
gravity makes you fall faster from higher altitude 2 2 0 0 0 0 2 2 4
higher pressure at higher altitude 0 0 1 1 0 0 1 1 2
gravity is less in air(inconsistent) 0 0 12 8 0 0 12 8 20
no reason given 3 3 11 4 0 0 14 7 21
D) No, there is no gravity 3 5 9 7 0 0 12 12 24
Reasons:
no gravity when falling 0 5 3 3 0 0 3 8 11
weightless when falling 1 0 2 0 0 0 3 0 3
no force to keep the person stay in air 1 0 1 2 0 0 2 2 4
no reason given 1 0 3 2 0 0 4 2 6
NO answer given 1 0 6 10 0 1 7 11 18
Total 43 43 87 80 18 17 148 140 288
Answers and ReasonsMiddle School (n=86) HS Physical Sci. (n=167) HS Physics (n=35) Overall (n=288)
the wind adds to gravity”, “gravity on your back pushes you down”, “higher pressure at higher
altitude makes gravity greater, and “gravity is greater which makes you fall faster as you hit the
ground”.
Table 10. Students’ Answers and Reasons to Question 8 – If someone falls from an
airplane, is there any gravity?
* Correct answers
32
1
7
1
8
1
0
21
1
3
3
2
5
0
6
1
1
0
0
0
10
0
5
11
0
0
1
0
0
1
4
1
2
0
14
0
0
0
0
14
0
17
0
0
0
0
0
0
0
0 10 20 30
Gravity slows down the aeroplane
Gravity in a free fall is much less than on the
ground because gravity decreases with altitude
Gravity in a free fall is much less than on ground
because air is pushing against gravity
There is less gravity when falling
The sky has no gravity
Gravity is less in air
Gravity pulls more when falling
The weight of the person in a free fall adds to
gravity
Gravity increases at high altitudes
The force of the wind adds to gravity
Gravity on your back pushes you down when
you're in a free fall
Gravity is greater at high altitude which makes
you fall faster as you hit the ground
The higher pressure at higher altitude makes
gravity greater
There is no gravity when falling
You are weightless when falling which means
there's no gravity
No gravity because there's no force to keep the
person stay in air
Percent of Students
Stu
den
ts' A
lter
nati
ve
Idea
s a
nd
Bel
iefs
Physics
Physical Science
Middle School Science
Figure 8. Alternative Ideas of Students on Gravity in a Free Fall
Seven percent of the Middle School group and 14% of the Physics group believed that
gravity in a free fall from an airplane is much less than on the ground because gravity decreases

33
with altitude. Just like the respondents in the APPTEA research, this is an indication of a blind
application of a learned fact. The students didn’t realize that it takes extraordinary altitude (about
32,000 m) to have a 1% decrease in gravitational force (Gunstone, et.al., 1989). This is supported
by a research by Ruggiero, et.al. (as cited by Driver,1994) who found that students who hold the
view that gravity decreases with height tend to expect a far bigger decrease in the force of
gravity with increases in height than is actually the case.
A small portion of the students believed that “there is no gravity when falling”, that
“you’re weightless when falling, so there’s no gravity”, and that “there’s no gravity because
there is nothing to keep the person stay in air”.
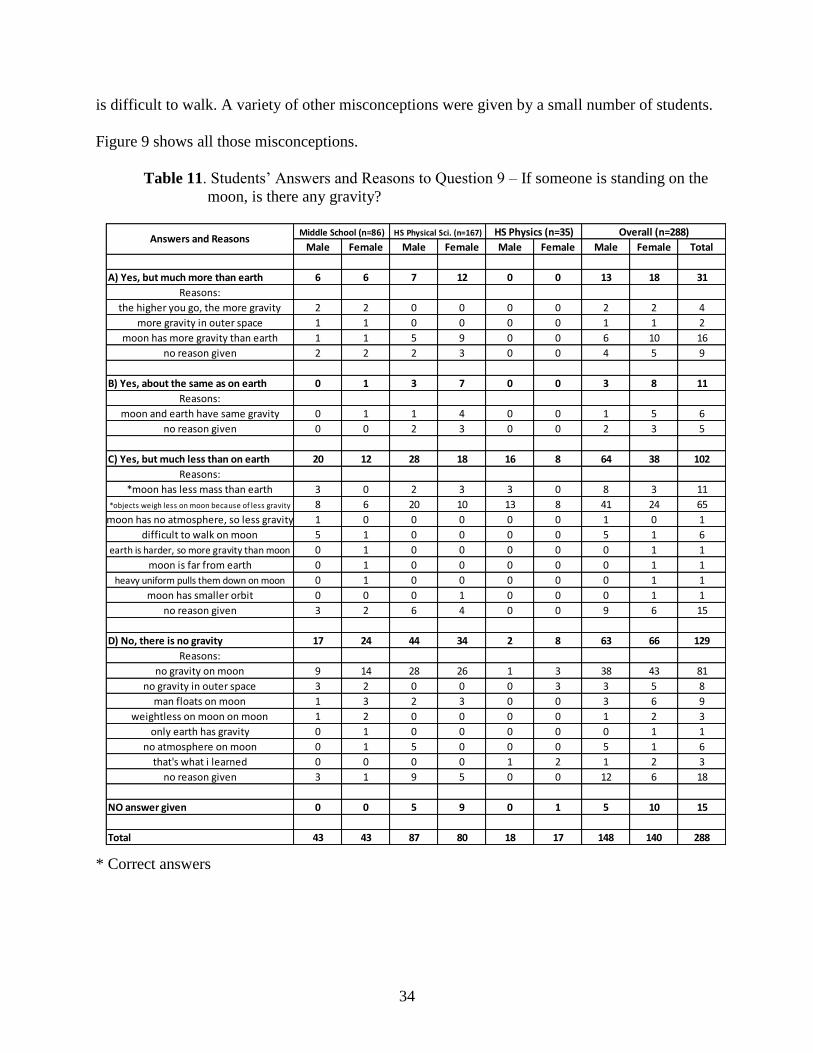
On question 9, students were asked if there is gravity on the moon and how, if any,
would the moon’s gravity compare with earth’s gravity. Seventy-six or 26% of the students
answered correctly with
consistent reasons. In the previous research, 44 % of the respondents got the correct answer and
reasoning. One hundred twenty-nine or 45% of the students believed that there is no gravity on
the moon. This number consists of 44% of the Middle School Science group, 47% of the
Physical Science group and 11% of the Physics group. A detailed distribution of students’
responses is presented in table 11, and a comparison of the misconceptions is found in figure 9.
A dominant misconception is the notion that there is no gravity on moon. A total of 129
or 45% of the students were found to have this misconception. Students who answered that there
is no gravity on moon based their answer on ideas such as “man floats on moon”, “no gravity in
outer space”, “no atmosphere on moon” , “weightless on moon”, and “only earth has gravity”.
Seven percent of the Middle School group suggested that there is less gravity on moon because it
34
Male Female Male Female Male Female Male Female Total
A) Yes, but much more than earth 6 6 7 12 0 0 13 18 31
Reasons:
the higher you go, the more gravity 2 2 0 0 0 0 2 2 4
more gravity in outer space 1 1 0 0 0 0 1 1 2
moon has more gravity than earth 1 1 5 9 0 0 6 10 16
no reason given 2 2 2 3 0 0 4 5 9
B) Yes, about the same as on earth 0 1 3 7 0 0 3 8 11
Reasons:
moon and earth have same gravity 0 1 1 4 0 0 1 5 6
no reason given 0 0 2 3 0 0 2 3 5
C) Yes, but much less than on earth 20 12 28 18 16 8 64 38 102
Reasons:
*moon has less mass than earth 3 0 2 3 3 0 8 3 11
*objects weigh less on moon because of less gravity 8 6 20 10 13 8 41 24 65
moon has no atmosphere, so less gravity 1 0 0 0 0 0 1 0 1
difficult to walk on moon 5 1 0 0 0 0 5 1 6
earth is harder, so more gravity than moon 0 1 0 0 0 0 0 1 1
moon is far from earth 0 1 0 0 0 0 0 1 1
heavy uniform pulls them down on moon 0 1 0 0 0 0 0 1 1
moon has smaller orbit 0 0 0 1 0 0 0 1 1
no reason given 3 2 6 4 0 0 9 6 15
D) No, there is no gravity 17 24 44 34 2 8 63 66 129
Reasons:
no gravity on moon 9 14 28 26 1 3 38 43 81
no gravity in outer space 3 2 0 0 0 3 3 5 8
man floats on moon 1 3 2 3 0 0 3 6 9
weightless on moon on moon 1 2 0 0 0 0 1 2 3
only earth has gravity 0 1 0 0 0 0 0 1 1
no atmosphere on moon 0 1 5 0 0 0 5 1 6
that's what i learned 0 0 0 0 1 2 1 2 3
no reason given 3 1 9 5 0 0 12 6 18
NO answer given 0 0 5 9 0 1 5 10 15
Total 43 43 87 80 18 17 148 140 288
Answers and ReasonsMiddle School (n=86) HS Physical Sci. (n=167) HS Physics (n=35) Overall (n=288)
is difficult to walk. A variety of other misconceptions were given by a small number of students.
Figure 9 shows all those misconceptions.
Table 11. Students’ Answers and Reasons to Question 9 – If someone is standing on the
moon, is there any gravity?
* Correct answers

35
5
2
2
1
1
7
1
1
1
0
27
6
5
3
1
1
0
0
8
3
0
0
0
0
0
1
32
0
3
0
0
3
0
0
0
0
0
0
0
0
0
0
11
9
0
0
0
0
0 10 20 30 40 50 60 70 80 90
There is greater gravity on moon because the
higher you go, the more gravity
There is more gravity in outer space
Moon has more gravity than earth
Moon and earth have same gravity
Moon has no atmosphere, so less gravity
There is less gravity on moon because it is
difficult to walk
Earth is harder, so more gravity than moon
Moon has less gravity because it is far from earth
Heavy uniform pulls them down on moon
Moon has less gravity because it has smaller
orbit
There is no gravity on moon
There is no gravity in outer space
No gravity because man floats on moon
No gravity because man is weightless on moon
Only earth has gravity
No gravity on moon because it has no
atmosphere
Percent of Students
Stu
den
ts' A
lter
nati
ve
Idea
s an
d B
elie
fs
Physics
Physical Science
Middle School Science
Among the 12 questions in the survey, question 9 has the longest list of misconceptions.
Similar misconceptions in small percentages were also found in the APPTEA research. Also in
relation to the result of this study, Stead and Osborne (as cited by Driver, 1994) found that 44%
of the 258 13-year old kids believed that there is no gravity on the moon.
Figure 9. Alternative Ideas of Students on Gravity on Moon

36
Male Female Male Female Male Female Male Female Total
YES, with correct reasoning 8 9 7 11 9 4 24 24 48
Reasons:
*gravity keeps it in orbit 6 4 2 3 0 0 8 7 15
*gravity is everywhere in the universe 2 5 5 8 9 4 16 17 33
YES, with incorrect reasoning 0 1 3 2 0 0 3 3 6
Reasons:
astronaut is just floating 0 1 3 2 0 0 3 3 6
YES, with no reason given 3 3 7 3 2 0 12 6 18
NO, there's no gravity 32 29 60 54 7 11 99 94 193
Reasons:
no gravity in space 24 14 38 29 7 11 69 54 123
astronaut is just floating 3 9 10 12 0 0 13 21 34
no air in space 0 1 2 2 0 0 2 3 5
no reason given 5 5 10 11 0 0 15 16 31
NO answer given 0 1 10 10 0 2 10 13 23
Total 43 43 87 80 18 17 148 140 288
Middle School (n=86) HS Physical Sci. (n=167) HS Physics (n=35) Overall (n=288)Answers and Reasons
Question 10 was intended to collect students’ ideas about gravity when in orbit around
the earth. Only forty-eight students or 17% agreed that there is gravity and supported it with
consistent reasons. In the previous research, 21% of the students gave correct responses with
consistent reasons. A dominant misconception that “there is no gravity” in orbit around the earth
is evident on the data. Table 12 presents the students’ answers and reason to question 10.
Table 12. Students’ Answers and Reasons to Question 10 – Is there any gravity up
where the spaceman is if he is near a satellite going around the earth?
* Correct answers
A summary and comparison of misconceptions among groups is also revealed in figure
10. It is seen that the misconception that “there is no gravity in space” is very persistent since it
is even seen in 51% of the Physics group. Students could have based this idea on science fiction
which often depicts zero gravity in space. Students also view “floating” as an indication of no
gravity. A small number of the respondents also believed that “there is no gravity because there
is no air in space”. Similar to this, the APPTEA research also reported that 15% of the Thai

37
44
14
1
40
13
2
51
0
0
0 10 20 30 40 50 60 70 80 90
There is no gravity in space
No gravity in orbit because astronaut is just
floating
No gravity because there is no air in space
Percent of Students
Stu
den
ts' A
lter
na
tiv
e Id
eas
an
d
Bel
iefs
Physics
Physical Science
Middle School Science
students also had the misconception of associating the absence of atmosphere to the absence of
gravity. This idea also came out in a study conducted by Stead and Osborne (as cited by Driver,
1984) in New Zealand among students aged 11 to 17. The students claimed that “there must be
air for gravity to act”.
Figure 10. Alternative Ideas of Students When in Orbit Around the Earth
As shown in table 13, although 114 or 40% agreed that there is gravity when swimming
underwater, only 57 or 20% have the correct conception. In the previous research, 21% of the
students gave correct responses. The table above shows a summary of the students’ responses,
and figure 11 shows a visual display of students’ misconceptions.
A dominant misconception among the Middle School Science group is the idea that
“there is more gravity when swimming down”. Eighteen percent of the Physical Science group
and 3 percent of the Physics group believed that “there is no gravity underwater”. This
misconception also came out in the study conducted by Stead and Osborne (as cited by Driver,
1984). Students also associated floatation with the absence of gravity. Students from the Middle
School Science group and Physics group supported their idea of the presence of gravity by the

38
experience that “a man would drown if he doesn’t swim”. This reasoning also came out in the
APPTEA research. It is also interesting to note that there were students from the Physics and
Physical Science group who claimed that “there’s more gravity when you swim deeper because
you’re closer to the center of the earth”. This could be a result of Physics instruction and a
learned fact about the Law of Universal Gravitation. Other misconceptions were reported from
small number of students. The misconceptions are presented in figure 11.
Table 13. Students’ Answers and Reasons to Question 11 – Is there any gravity when a
person is swimming underwater?
*Correct answers
Male Female Male Female Male Female Male Female Total
A) YES 21 13 23 27 16 14 60 54 114
Reasons:
*gravity is constant anywhere on earth 7 1 10 11 11 10 28 22 50
*gravity is the same, but buoyant force pushes you up 4 0 0 1 2 0 6 1 7
man will drown if he doesn't swim 3 8 0 0 2 1 5 9 14
gravity underwater is less than in air 2 0 0 1 1 0 3 1 4
viscosity lessens gravity 0 1 0 1 0 0 0 2 2
pressure of the water 0 0 2 2 0 0 2 2 4
no gravity underwater(inconsistent) 0 0 1 1 0 0 1 1 2
no reason 5 3 10 10 0 3 15 16 31
B) NO 5 7 33 17 1 1 39 25 64
Reasons:
no gravity underwater 0 0 20 9 0 1 20 10 30
you float in water 3 5 5 2 0 0 8 7 15
man is weightless in water 0 0 0 0 1 0 1 0 1
water takes up your share of gravity 1 0 0 0 0 0 1 0 1
no reason given 1 2 8 6 0 0 9 8 17
C) Depends whether up/down 15 20 21 28 1 1 37 49 86
Reasons:
more gravity when swimming down 9 13 4 3 0 0 13 16 29
more pressure when swimming up 1 0 0 0 0 0 1 0 1
buoyant force makes you float 1 1 0 0 0 0 1 1 2
depends on person's weight 0 0 2 3 0 0 2 3 5
water has less gravity 0 0 5 5 0 0 5 5 10
more gravity when you swim deeper 0 0 0 4 1 1 1 5 6
no reason given 4 6 10 13 0 0 14 19 33
NO answer given 2 3 10 8 0 1 12 12 24
Total 43 43 87 80 18 17 148 140 288
Answers and ReasonsMiddle School (n=86) HS Physical Sci. (n=167) HS Physics (n=35) Overall (n=288)

39
13
2
1
0
0
9
0
1
26
1
2
0
0
0
0
1
1
2
18
4
0
0
4
0
0
3
6
2
9
3
0
0
3
0
3
0
0
0
0
0
0
6
0 10 20 30 40 50 60 70 80 90
There is gravity because man will drown if he
doesn't swim
Gravity underwater is less than in air
Viscosity lessens gravity
Gravity results to pressure of the water
There is no gravity underwater
There is no gravity because you float in water
There is no gravity because man is weightless in
water
Water takes up your share of gravity when you're
underwater
There is more gravity when swimming down
There is more pressure when swimming up
Gravity depends whether buoyant force makes
you float
Gravity underwater depends on person's weight
Water has less gravity
There's more gravity when you swim deeper
because you're closer to the center of the earth
Percent of Students
Stu
den
ts' A
lter
nati
ve
Idea
s a
nd
Bel
iefs
Physics
Physical Science
Middle School Science
Figure 11. Alternative Ideas of Students on Gravity When Swimming Underwater.
On question 12, two blocks described as “equal” were shown connected by a string and
suspended “at rest” from a pulley. Students were asked what to predict the position of the blocks
one minute later. Table 14 shows the students responses.

40
Male Female Male Female Male Female Male Female Total
A) Blocks remain unchanged 8 10 18 16 10 5 36 31 67
Reasons:
*blocks are at rest, so no change in position 3 2 3 1 0 3 6 6 12
*blocks have equal weight, so no net force to move them 1 2 2 4 6 2 9 8 17
*equal tension on both sides, so no net force to move them 0 0 0 0 1 0 1 0 1
more gravity on the left since lower 1 2 4 5 0 0 5 7 12
blocks will stay the same 2 4 4 2 3 0 9 6 15
no reason given 1 0 5 4 0 0 6 4 10
B) Blocks move so both at the same level 31 26 54 44 8 9 93 79 172
Reasons:
blocks are equal 23 15 37 32 8 9 68 56 124
gravity pulls the blocks with same force 1 2 5 2 0 0 6 4 10
when one block falls, the other rises 0 3 0 0 0 0 0 3 3
no reason given 7 6 12 10 0 0 19 16 35
C) Blocks move so right hand block is lower 2 7 8 8 0 2 10 17 27
Reasons:
blocks will switch around 1 7 4 2 0 2 5 11 16
equal weight 0 0 0 3 0 0 0 3 3
no reason given 1 0 4 3 0 0 5 3 8
NO answer given 2 0 7 12 0 1 9 13 22
Total 43 43 87 80 18 17 148 140 288
Answers and ReasonsMiddle School (n=86) HS Physical Sci. (n=167) HS Physics (n=35) Overall (n=288)
Table 14. Students’ Answers and Reasons to Question 12 – Two equal blocks are
linked by a piece of string. The string is placed over a pulley, so the blocks are
at rest in the position that the left hand block is lower than the right hand block.
What will be the position of the blocks one minute later?
* Correct answers
Table 14 reveals that only 30 students or 10% of the students answered and reasoned
correctly. Most of the students believed that the blocks would move to the same level after one
minute. Forty-four percent of the Middle School Science group, 41% of the Physical Science
group, and 49% of the Physics group claimed that the “blocks will move to the same level
because they are equal”. This belief is consistent with the findings of the APPTEA research
(44% of students) , and with the findings of Gunstone and White (as cited in the APPTEA
research). This could be due to students’ unfamiliarity with the situation presented. Figure 12
presents a visual display of the misconceptions.

41
3
7
44
3
3
9
5
4
41
4
0
4
0
9
49
0
0
6
0 10 20 30 40 50 60 70 80 90
There is more gravity on the lower block
blocks will stay the same
Blocks will move to the same level because they
are equal
Blocks will move to the same level because
gravity pulls them with same force
When one block falls, the other rises
Blocks will switch around so right hand block
will be lower
Percent of Students
Stu
den
ts' A
lter
na
tiv
e Id
eas
an
d B
elie
fs
Physics
Physical Science
Middle School Science
Figure 12. Alternative Ideas of Students on Blocks on a Pulley.
Summary of Prevalent Misconceptions. In this study, the misconceptions held by at
least 10% of the students in any group of school Physics background are referred to as “prevalent
misconceptions”.
Prevalent misconceptions on question 1, 2 and 3 were grouped together because they all
involved the force on a ball that is thrown vertically upward. A summary is provided in figure
13.
Misconceptions 1, 6 and 7 in the figure reflect the idea that “the direction of motion is
also the direction of the force”. Misconceptions 2 and 3 suggest the presence of a “force of
throw”, the “impetus” view of motion. Misconceptions 4 and 5 present the persistent idea that
“there is no force when there is no motion”. All these are known common misconceptions.

42
27
49
19
53
0
15
23
38
8
16
14
13
0
74
9
0
43
11
0 10 20 30 40 50 60 70 80 90
6. The force of throw makes the ball descend
in a parabolic path
5. Pull of gravity combines with force of
throw when ball is descending
4. Only force of throw exists at the highest
point
3. At the highest point, force of throw
combines with gravity
2. Force at the highest point has horizontal
and vertical components
1. There is no force at the highest point
Percent of Students
Pre
vale
nt
Mis
con
cep
tion
s
Physics
Physical Science
Middle School Science
53
13
28
27
1
29
44
5
0
26
19
0
0
1
17
0
37
0
20
20
20
0 10 20 30 40 50 60 70 80 90
7. Force is downward when ball is going
down
6. Force is downward on top because ball
starts to come down
5. Force is zero when ball stops on top
4. There's no force on top of flight
3. Force of throw and gravity balance at the
top of its flight
2. Force is upward due to the force from
throw
1. Force is upward because ball is going up
Percent of Students
Pre
vale
nt
Mis
con
cep
tion
s
Physics
Physical Science
Middle School
Figure 13. Prevalent Misconceptions on the Force on a Ball Thrown Vertically Upward
Figure 14. Prevalent Misconceptions on a Ball Thrown Obliquely to Travel Along a
Parabolic Path.

43
20
9
14
15
10
0
12
13
0
6
0
9
20
0
6
0 10 20 30 40 50 60 70 80 90
5. The force used to speed up is still there
4. There is force because it is still moving
3. Gravity slows down the bicycle
2. No force when no pedalling and/or no
brakes
1. No force when motion is slowing down
Percent of Students
Pre
vale
nt
Mis
con
cep
tion
s
Physics
Physical Science
Middle School Science
Figure 14 presents a strong persistent view of the presence of “force of throw” on a ball
travelling along a parabolic path. This idea is evident on misconceptions 3, 4, 5 and 6.
Misconception 1 also agrees with misconceptions 4 and 5 from figure 13. The Physics group
and Physical Science group also revealed an idea that the force at the highest point has horizontal
and vertical components, which made them chose the answer with gravity + force of throw.
The prevalent misconceptions about a bicycle that is slowing down are shown in figure
15. The impetus view of motion is the most common misconception among the Middle School
Science group. The idea that gravity slows down the motion is also the most common
misconception among the Physics group, but is also consistent with the Middle School Science
and Physical Science groups. Misconceptions 1 and 2 on figure 15 reflect the idea that force is
needed in order to maintain motion.
Figure 15. Prevalent Misconceptions on a Bicycle that is Slowing Down

44
13
0
26
14
44
27
7
21
8
3
0
18
4
13
40
32
0
11
10
0
9
3
0
0
51
11
14
14
0
17
0 10 20 30 40 50 60 70 80 90
10. There is gravity because man will drown
if he doesn't swim
9. There is no gravity underwater
8. There is more gravity when swimming
down
7. No gravity in orbit because astronaut is
just floating
6. There is no gravity in space
5. There is no gravity on moon
4. Gravity in a free fall is much less because
gravity decreases with altitude
3. Gravity pulls more when falling
2. There is less gravity when falling
1. Gravity increases at high altitudes
Percent of Students
Pre
vale
nt
Mis
con
cep
tion
s
Physics
Physical Science
Middle School Science
Figure 16 presents a summary of students’ prevalent misconceptions about gravity at
various locations, and in some case, its relative magnitude. The most persistent misconception is
the notion that “there is no gravity in space”. This misconception, together with misconceptions
5 and 7, could be due to the influence of science fiction movies. Misconception 1 implies an
incorrect association of gravity with altitude among Middle School Science and Physics group.
Misconceptions 2 , 3 and 9 are reflections of students’ beliefs. Misconception 4 appears to be a
blind application of a learned concept in science, and misconceptions 8 and 10 are
misconceptions developed by students from experience. These misconceptions are displayed in
visual form on figure 16.
Figure 16. Prevalent Misconceptions on Gravity.

45
4441
49
0 10 20 30 40 50 60 70 80 90
Blocks will move to the same level because
they are equal
Percent of Students
Pre
vale
nt
Mis
con
cep
tion
Physics
Physical Science
Middle School Science
Gravity is a very familiar word to everyone , but in this study, it appears that this is the
science concept with which students have the greatest number of misconceptions. Another
prevalent misconception is the belief that equal blocks will move to the same level on a pulley.
Figure 17. Prevalent Misconception on Blocks on a Pulley.
Comparison of Misconceptions Held by the Students According to Gender. Figure
18 presents a comparison of the number of misconceptions held by gender. There is no
significant association between the number of misconceptions and gender.
According to figure 18, the greatest number of misconceptions was seen among female
students in the situation involving gravity on the moon where 15 misconceptions were noted.
The male students showed the greatest number of misconceptions (14) in the situation involving
gravity and free fall. Both male and female students showed 3 misconceptions in the situations
involving the force on a ball falling along a parabolic path, and on gravity in orbit around the
earth. These items have the smallest number of misconceptions among the female students. For
the male students, the situation involving gravity when standing on earth has the lowest number
of misconceptions.
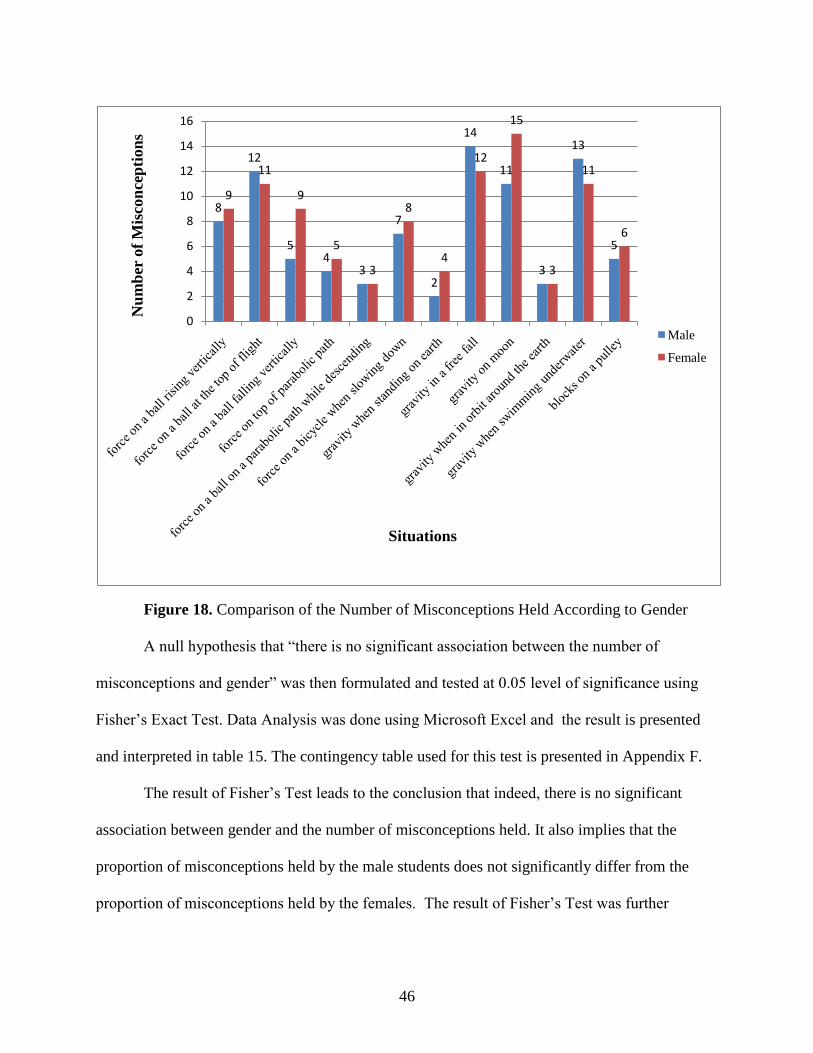
46
8
12
54
3
7
2
14
11
3
13
5
9
11
9
5
3
8
4
12
15
3
11
6
0
2
4
6
8
10
12
14
16
Nu
mb
er o
f M
isco
nce
pti
on
s
Situations
Male
Female
Figure 18. Comparison of the Number of Misconceptions Held According to Gender
A null hypothesis that “there is no significant association between the number of
misconceptions and gender” was then formulated and tested at 0.05 level of significance using
Fisher’s Exact Test. Data Analysis was done using Microsoft Excel and the result is presented
and interpreted in table 15. The contingency table used for this test is presented in Appendix F.
The result of Fisher’s Test leads to the conclusion that indeed, there is no significant
association between gender and the number of misconceptions held. It also implies that the
proportion of misconceptions held by the male students does not significantly differ from the
proportion of misconceptions held by the females. The result of Fisher’s Test was further
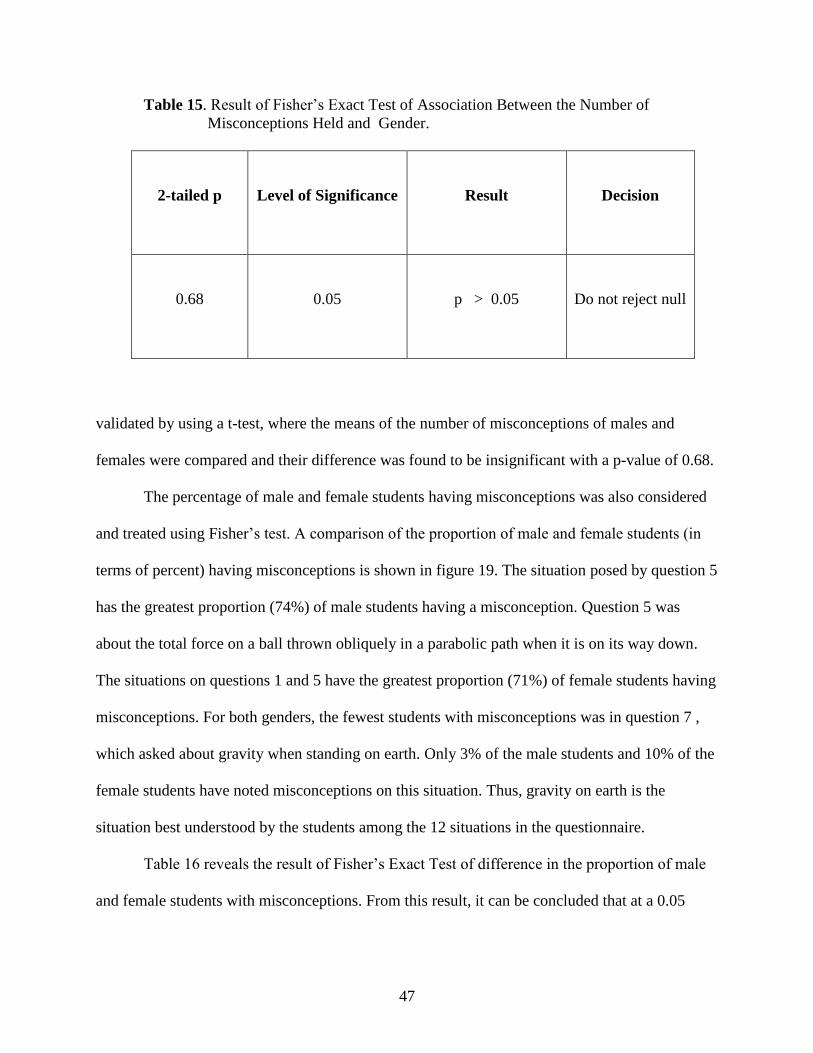
47
Table 15. Result of Fisher’s Exact Test of Association Between the Number of
Misconceptions Held and Gender.
2-tailed p
Level of Significance
Result
Decision
0.68
0.05
p > 0.05
Do not reject null
validated by using a t-test, where the means of the number of misconceptions of males and
females were compared and their difference was found to be insignificant with a p-value of 0.68.
The percentage of male and female students having misconceptions was also considered
and treated using Fisher’s test. A comparison of the proportion of male and female students (in
terms of percent) having misconceptions is shown in figure 19. The situation posed by question 5
has the greatest proportion (74%) of male students having a misconception. Question 5 was
about the total force on a ball thrown obliquely in a parabolic path when it is on its way down.
The situations on questions 1 and 5 have the greatest proportion (71%) of female students having
misconceptions. For both genders, the fewest students with misconceptions was in question 7 ,
which asked about gravity when standing on earth. Only 3% of the male students and 10% of the
female students have noted misconceptions on this situation. Thus, gravity on earth is the
situation best understood by the students among the 12 situations in the questionnaire.
Table 16 reveals the result of Fisher’s Exact Test of difference in the proportion of male
and female students with misconceptions. From this result, it can be concluded that at a 0.05
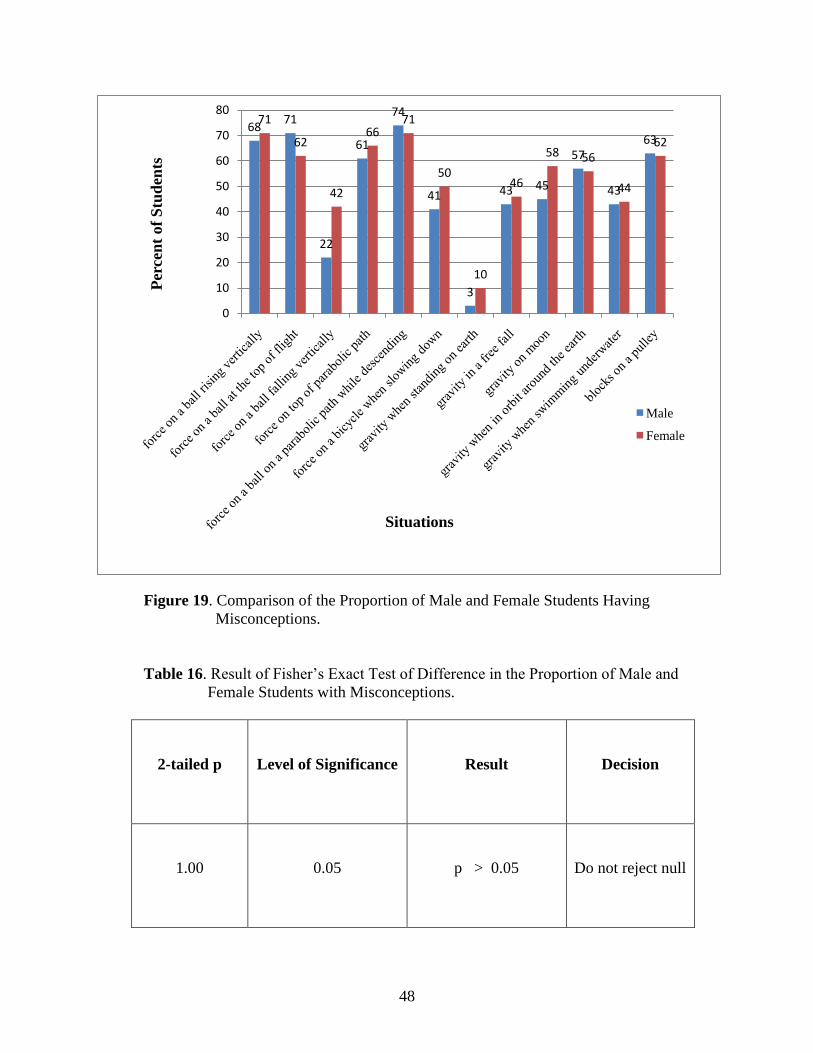
48
6871
22
61
74
41
3
43 45
57
43
63
71
62
42
6671
50
10
46
58 56
44
62
0
10
20
30
40
50
60
70
80
Per
cen
t of
Stu
den
ts
Situations
Male
Female
Figure 19. Comparison of the Proportion of Male and Female Students Having
Misconceptions.
Table 16. Result of Fisher’s Exact Test of Difference in the Proportion of Male and
Female Students with Misconceptions.
2-tailed p
Level of Significance
Result
Decision
1.00
0.05
p > 0.05
Do not reject null

49
level of significance, the proportion of male students with misconceptions does not significantly
differ from the proportion of female students with misconception. This means that students’
misconceptions are not correlated to gender. T-test was also used to test the difference between
the means of the proportion of male and female students having misconceptions. The test
resulted in a p-value of 1.00, which is greater than 0.05, from which it can be inferred that the
there is no significant difference between the two means.
Comparison of Misconceptions Held by Students According to School Physics
Background. The number of misconceptions was also compared to school Physics background
(see figure 20). As seen in the figure, the Middle School Science group has the highest number
of misconceptions in most situations, while the Physics group has mostly the least. The greatest
number of misconceptions (15) for the Middle School Science group is on the question about
gravity on the moon. For the Physical Science group, the greatest number of misconceptions ( 9)
is a tie between questions 2 and 11, which are about the total force at the maximum height of a
ball thrown vertically upward, and about gravity underwater respectively. The Physics group has
also the greatest number of misconceptions (5) on question 11, which is about gravity
underwater.
Kendall’s coefficient of concordance (W ) was used to see if there is a significant
agreement in the ranking of the number of misconceptions among the three groups of school
Physics background. The numbers of misconceptions were converted into ranks among the three
groups for each of the 12 situations, and the coefficient of concordance W was calculated. Table
17 summarizes the results of the statistical test. The calculation of the W is shown in Appendix
G.

50
7
10
8
43
10
3
1415
3
8
65
9
4 43
43
8
6
3
9
54
23 3
1
3
0
32
1
5
3
0
2
4
6
8
10
12
14
16
Nu
mb
er o
f M
isco
nce
pti
on
s
Situations
Middle School Science
Physical Science
Physics
Figure 20. Comparison of the Number of Misconceptions Held by Students According to
School Physics Background.
From the coefficient of concordance, a chi-square statistic was calculated , and the p-
value was determined to be less than 0.001 which means that the result is highly significant. The
null hypothesis is therefore rejected, and the statistical test leads to the conclusion that “there is a
significant agreement in the ranking of the number of misconceptions according to school
Physics background”. This implies a strong correlation between the number of misconceptions
and the school Physics background. It is evident from the data that the number of misconceptions
is greatest for the Middle School Science group and lowest for the Physics group. This result also

51
Table 17. Test of Agreement In the Ranking of the Number of Misconceptions
According to School Physics Background
W
Chi-Square
Df
p-value
Decision
0.886
21.3
2
p < 0.001
Reject Null
implies that students from middle school bring a wide variety of alternative ideas and beliefs as
they go to high school, but those misconceptions are diminished as the students receive more
Physics instruction in Physical Science and Physics classes.
Figure 21 also shows a comparison of the proportion of students having misconceptions
according to school Physics background. It is evident from the figure that the Middle School
Science group has the greatest proportion of students having misconceptions in all the 12
situations presented in the questions. There were situations where the proportion of Physical
Science group having misconceptions was higher than the proportion of students from the
Physics group. There were, however, situations where the Physics group had a larger proportion
of students who have misconceptions than the Physical Science group.
The Kendall’s coefficient of concordance and chi-square statistic were again used to
determine any significant agreement in the ranking of the proportion of students having
misconceptions according to school Physics background.
Table 18 supports the decision to reject the null hypothesis. Thus, there is a significant
agreement in the ranking of the proportion of students having misconceptions according to
school Physics background. It also implies a strong correlation between school Physics
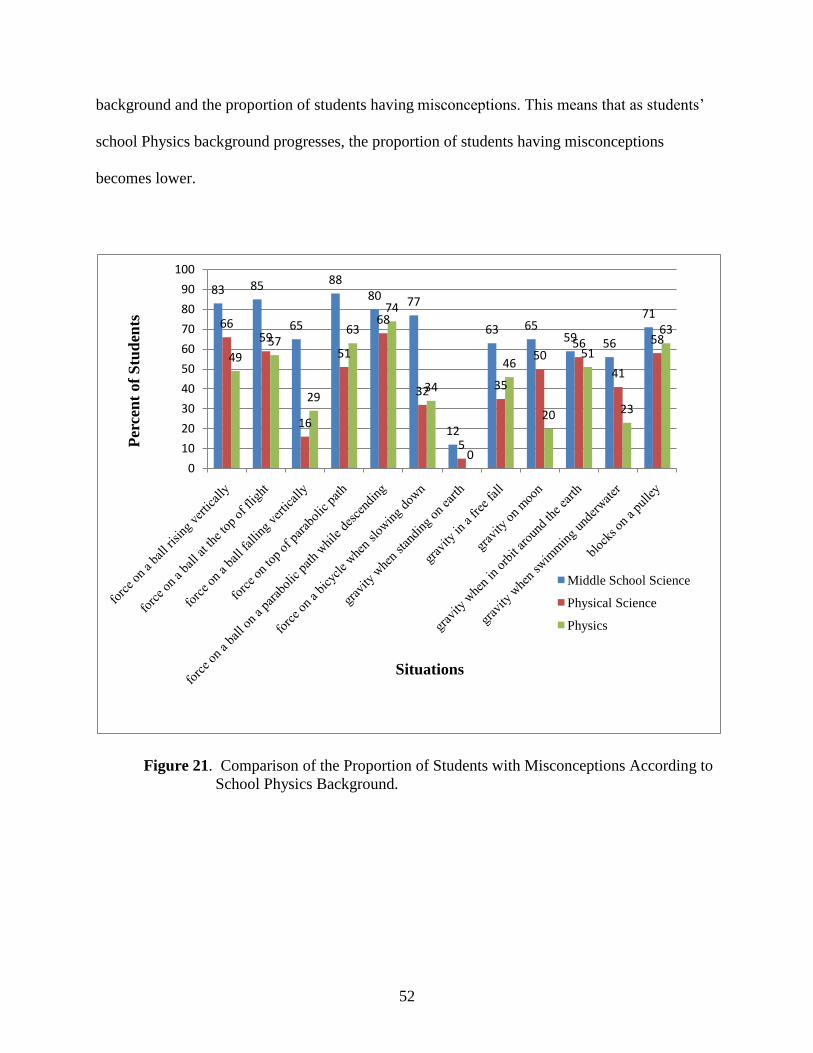
52
83 85
65
8880 77
12
63 6559 56
7166
59
16
51
68
32
5
35
5056
41
58
4957
29
63
74
34
0
46
20
51
23
63
0
10
20
30
40
50
60
70
80
90
100
Per
cen
t of
Stu
den
ts
Situations
Middle School Science
Physical Science
Physics
background and the proportion of students having misconceptions. This means that as students’
school Physics background progresses, the proportion of students having misconceptions
becomes lower.
Figure 21. Comparison of the Proportion of Students with Misconceptions According to
School Physics Background.
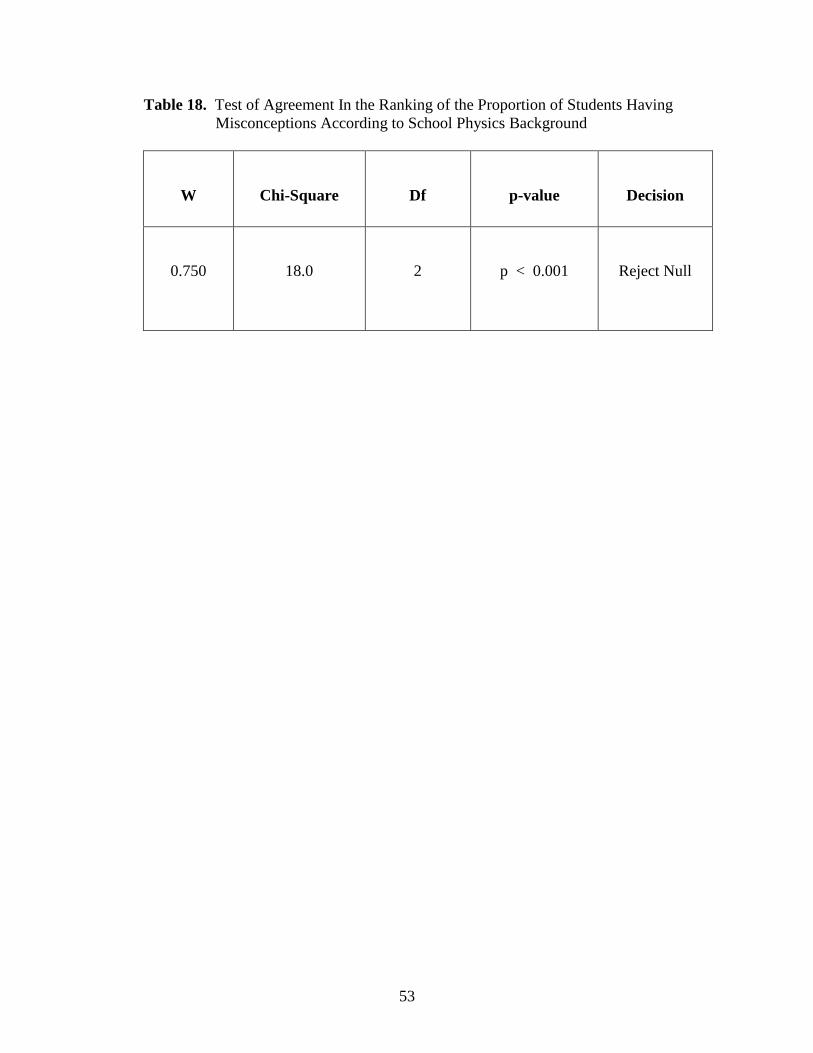
53
Table 18. Test of Agreement In the Ranking of the Proportion of Students Having
Misconceptions According to School Physics Background
W
Chi-Square
Df
p-value
Decision
0.750
18.0
2
p < 0.001
Reject Null
54
SUMMARY AND CONCLUSIONS
Summary. This study determined the misconceptions of high school students aged 14 to
18 on force and gravity and compared the misconceptions according to gender and according to
school Physics background. The results suggest that the subjects of this research study hold
misconceptions that have been reported by other similar research studies.
Three prevalent misconceptions were found on questions 1, 2 and 3, concerning the force
on a ball thrown vertically upward. One of these is the idea that the direction of motion is also
the direction of the force. Another prevalent misconception is the belief that the force of throw is
still present in the ball even after leaving the hand. The third prevalent misconception is the idea
that there is no force when there is no motion. These misconceptions were found to be persistent
because they were present in students of the three types of school Physics background, which
means that they exist in the minds of students even after Physics instruction.
In the situation where the ball was thrown in a parabolic path (questions 4 and 5), a
dominant misconception seen was the belief in the presence of the force of throw. The Physics
group showed a strong belief in the combination of force of throw and gravity in the motion of
the ball in a parabolic path, which they associated with the horizontal and vertical components of
the force. Another prevalent misconception seen was the belief that there is no force when the
ball is at the top of its parabolic path.
Question 6 asked about the force on a bicycle that is slowing down. The most common
misconception among the Physics and Physical Science group is the idea that gravity slows down
the motion. Among the Middle School Science group, the most common misconception was that
the force used to speed up is still there. Other prevalent misconceptions include the following

55
ideas: there is force when there is motion; there is no force when motion is slowing down; and
there is no force when no pedaling and no brakes are applied.
The concept of gravity, which is covered on questions 7-11, has the most prevalent
misconceptions found in this study. The most common misconception was the belief that there is
no gravity in space. Students from the Physics group were found to be the largest proportion
having this misconception. Other misconceptions reported are the following: gravity increases at
high altitudes; gravity is less in air; gravity is less when falling; gravity in a free-fall from an
airplane is much less because gravity decreases with altitude; there is no gravity on the moon;
there is no gravity in orbit because objects just float; there’s more gravity underwater when
swimming downward; there’s no gravity underwater; and gravity makes the man drown if he
doesn’t swim. Some lines of reasoning were found to be similar between the students of the
Middle School Science and Physics groups.
A prevalent misconception found by question 12 is the belief that the blocks will move to
the same level because they are equal. Question 12 involved a situation in which two equal mass
blocks were tied to ends of a string that was passed over a pulley.
The misconceptions found in this study are very similar to the misconceptions found
among Asia-Pacific students in the APPTEA research. This is an indication that misconceptions
are universal, and although it is often believed and quoted in the popular press that Asian
students are “better” than American students, the findings of this study show that they have
similar conceptual difficulties on force and gravity. This is also consistent with my own
experience as a teacher for 12 years in the Philippines and as a teacher here in East Baton Rouge
Parish for two years.

56
Aside from gathering students’ misconceptions, this study also included a comparison of
the number of misconceptions held according to gender and according to school Physics
background. There is no significant association between gender and the number of
misconceptions; the proportion of misconceptions held by the males does not significantly differ
from the proportion of misconceptions held by the female students. The Kendall’s coefficient of
concordance (W) between school Physics background and the number of misconceptions held
suggests a strong agreement in the ranking of the number of misconceptions held by students
according to school Physics background.
The proportion of students having misconceptions is also compared to gender and to
school Physics background. The difference in the proportion of male and female students having
misconceptions is not significant at the 0.05 level of significance. Thus, the proportion of
students with misconceptions is not associated with gender. The coefficient of concordance
(W=0.750) suggests a strong correlation between school Physics background and the proportion
of students having misconceptions. This is also found to be significant with a p-value < 0.001.
Conclusions . Based on the findings of this study, the following conclusions are drawn:
1. Students in this study have misconceptions similar to the misconceptions found in previous
research. American students have similar conceptual difficulties on force and gravity as the Asia-
Pacific students.
2. There is no significant association between the number of misconceptions and gender
(p=0.68).
3. There is no significant difference in the proportion of male and female students having
misconceptions (p=1.00).

57
4. There is a strong correlation between the number of misconceptions held and the type of
school Physics background (W=0.886 and p<0.001). That is, the number of misconceptions held
diminishes as school Physics instruction progresses.
5. There is a strong correlation between the proportion of students having misconceptions and
the type of school Physics background (W=0.750 and p<0.001). The proportion of students with
misconceptions decreases as school Physics instruction progresses.
Recommendations. The researcher recommends that:
1. The findings of this study be used by teachers and curriculum developers in designing
classroom activities and teaching strategies that could address the students’ misconceptions
found;
2. Teachers find ways of identifying students’ misconceptions, such as the use of probes or
formative assessment, to motivate students and to guide in the teaching process; and
3. Similar researches be conducted, with emphasis on testing teaching strategies that could
effectively alter students’ misconceptions.

58
REFERENCES
Beyer, B. & Panna, A. (1971). “Some Implications of Concept Thinking”. National Council for
the Social Studies Bulletin . No. 45.
Brown, D. (1982). “Using Examples and Analogies to Remediate Misconceptions in Physics:
Factors Influencing Conceptual Change”. Journal of Research in Science Teaching , 21
(1), 17-34.
Chambers, S. & Andre, T. (1997). “Gender, prior knowledge, interest, and experience in
electricity and conceptual change text manipulations in learning about direct current”.
Journal of Research in Science Teaching. Vol. 34, No. 2. Pages 107-123.
Cibik, A., et.al. (2008) “The Effect of Group Works and Demonstrative Experiments Based on
Conceptual Change Approach: Photosynthesis and Respiration”. Asia-Pacific Forum on
Science Learning and Teaching, Volume 9, Issue 2, Article 2 .
Donovan, M., et.al. (1999). “How People Learn: Bridging Research and Practice”. National
Academic Press.
Driver, R., et.al (1994). “Making Sense of Secondary Science”. Routledge Falmer. London and
New York.
Dow, P. (2000). “Why Inquiry? A Historical and Philosophical Commentary”. Foundations ,
Vol.2, Chap. 2.
Khang, G.N., et.al. (1995). “Gender Difference, Misconceptions and Instruction in Science”.
Asia-Pacific Journal of Education. Volume 15, Issue 2 1995 , pages 33 – 41.
Gunstone, R. & White, R. (1981). “Understanding of Gravity”. Science Education. Vol. 65,
Pages 291-299.
Gunstone, R. (1987). “Student Understanding in Mechanics: A Large Population Survey”.
American Journal of Physics. Vol. 55, Pages 691-696.
Gunstone, R. et.al. (1989). “Conceptions in Mechanics: A Survey of Students’ Beliefs in Seven
Asian Countries” . Asia-Pacific Physics Teachers And Educators Association Research
Report . No. 1.
Halloun, I.A. & Hestenes, D. (1985). “Common Sense Concepts About Motion”. American
Journal of Physics , 53 (11), 1056-1065.
Haury, D. (1993). “Teaching Science Through Inquiry” . ERIC Clearinghouse for Science,
Mathematics and Environmental Education . ED359048.

59
Hestenes, D., Wells, M. and Swackhamer, G. (1992). “Force Concept Inventory”. The Physics
Teacher. Vol. 30. March 1992.
Lawson, R. and McDermott, L. (1987). “Student Understanding of the Work-Energy and
Impulse-Momentum Theorems”. Vol. 55, No. 9.
Lee, M. et.al. (1992). “Misconceptions on Selected Topics in Physics Among Malayan Pupils” .
Journal of Science and Mathematics Education in Southeast Asia , 15 (1) , 55-62.
Lijnse, P. (1990). “Energy Between the Life-World of Pupils and the World of Physics” .
Science Education , 74 (5), 571-583.
McDermott, L. (1998). “Students’ Conceptions and Problem Solving in Mechanics”. Connecting
Research in Physics Education with Teacher Education . International Commission on
Physics Education. Page 42.
McDermott, L. & Redish, E. (1999). “RL-PER1:Resource Letter on Physics Education
Research”. American Association of Physics Teachers.
McDermott, L., et.al. (1987). “Student Difficulties in Connecting Graphs and Physics: Examples
from Kinematics”. American Journal of Physics. Vol. 53, Pages 503-513.
McDermott, L., et.al. (1994). “Research as a Guide for Teaching Introductory Mechanics: An
Illustration in the Context of the Atwood’s Machine”. American Journal of Physics. Vol.
62. Pages 46-55.
Rankin, L (2000). “Lessons Learned: Addressing Common Misconceptions About Inquiry”.
Foundations, Vol. 2, Chap. 5.
Rosenquist, M. & McDermott, L. (1987). “A Conceptual Approach to Teaching Kinematics”.
American Journal of Physics. Vol. 55, No. 5.
Savinainen, A & Scott, P. (2002). “Using the Force Concept Inventory to Monitor Student
Learning and to Plan Teaching”. Physics Education. Vol. 37. Retrieved September 6,
2009, from iopscience.
Scott, P. et.al. (1998). “Teaching for Conceptual Change: A Review of Strategies”. Connecting
Research in Physics Education with Teacher Education . International Commission on
Physics Education. Page 71.
Taborda, U. (1998). “Misconceptions on Force and Gravity Among the Science High School
Students of Mariano Marcos State University”. Unpublished Master’s Thesis. University
of Northern Philippines.

60
Thornton, R. & Sokoloff, D. (1998). “Assessing Student Learning of Newton’s Laws: The Force
and Motion Conceptual Evaluation and the Evaluation of Active Learning Laboratory
and Lecture Curricula”. American Journal of Physics. Vol. 66, No. 4.
Trowbridge, D & McDermott, L. (1981). “Investigation of Student Understanding of the Concept
of Acceleration in One Dimension”. American Journal of Physics. Vol. 49. No.3.
Trowbridge, D & McDermott, L. (1980). “Investigation of Student Understanding of the Concept
of Velocity in One Dimension”. American Journal of Physics. Vol. 48. No.12.
Worth,K. (2000). “The Power of Children’s Thinking”. Foundations, Vol.2, Chap. 4.
Electronic References:
http://ejournals.ebsco.com/Journal2.asp?JournalID=103332
http://www.langsrud.com/fisher.htm
http://www.newworldencyclopedia.org/entry/Jean_Buridan
http://www.raosoft.com/samplesize.html
http://www.surveysystem.com/sscalc.htm

61
APPENDIX A
LETTER OF REQUEST TO USE SURVEY INSTRUMENT
August 1, 2009
Richard Gunstone, Ph.D.
Emeritus Professor of Science and Technology Education
Faculty of Education
Monash University
Vic 3800, Australia
Dear Prof. Gunstone,
I am a graduate student at Louisiana State University, Baton Rouge, Louisiana, USA and I am
doing a research on Students' Misconceptions on Force and Gravity for my Master's thesis. I
have seen the APPTEA Research Report entitled "Conceptions in Mechanics: A Survey of
Students' Beliefs in Seven Asian Countries" which was published in 1989 and I found your
findings interesting. The survey instrument you developed would be a perfect instrument I could
use for my research.
I would like to request your permission to allow me to use the said survey instrument. I have a
hard copy of the research report. However, I would so much appreciate it if you could send me
an electronic copy or a revised version (if available) of the instrument.
Thank you sir. Your assistance will surely be a great help in the pursuit of my study.
Respectfully yours,
Jane R. Pablico (sgd)
MNS Student
Louisiana State University
Baton Rouge, LA

62
APPENDIX B
LETTER OF PERMISSION TO USE SURVEY INSTRUMENT
August 5, 2009
Dear Jane,
Nice to know that the APPTEA report still exists somewhere besides my office!!
Of course I am very happy for you to make use of that instrument. It was developed with specific
concern for being able to be used by others with whom I would only have postal (snail mail)
contact - this was all before the existence of email (yes, there was such a time).
Unfortunately I do not have an electronic version of the instrument - I put this together so long
ago that I did not use a pc; indeed we had only 2 word processors in the whole faculty (not pcs,
but desktop machines that ONLY were word processors) and they operated only with a typing
program ('wordperfect') that had no diagram capabilities. That's a roundabout way of explaining
why I don't have a handy file to email you I am afraid.
While I have used various forms of some of the question structures in other contexts on many
other / later occasions, the instrument as a whole was not ever refined / developed beyond the
form you have in the APPTEA report.
Good luck with your research, sorry I can't help in the way that would be most valuable to you.
Dick Gunstone (sgd)
________________________________________
Richard Gunstone
Emeritus Professor of Science and Technology Education
Faculty of Education
Building 6
Monash University
Vic 3800, Australia
Phone & Voicemail: +(int)(61)(3)99052857
Fax: +(int)(61)(3)99059197
http://www.education.monash.edu.au/profiles/dgunston

63
APPENDIX C
APPLICATION FOR EXEMPTION FROM INSTITUTIONAL OVERSIGHT

64
APPENDIX D
APPROVAL FROM SCHOOL DISTRICT TO CONDUCT RESEARCH

65
APPENDIX E
THE SURVEY COVER LETTER AND QUESTIONNAIRE

66

67

68
A. B.
C. D.
A. B.
C. D.
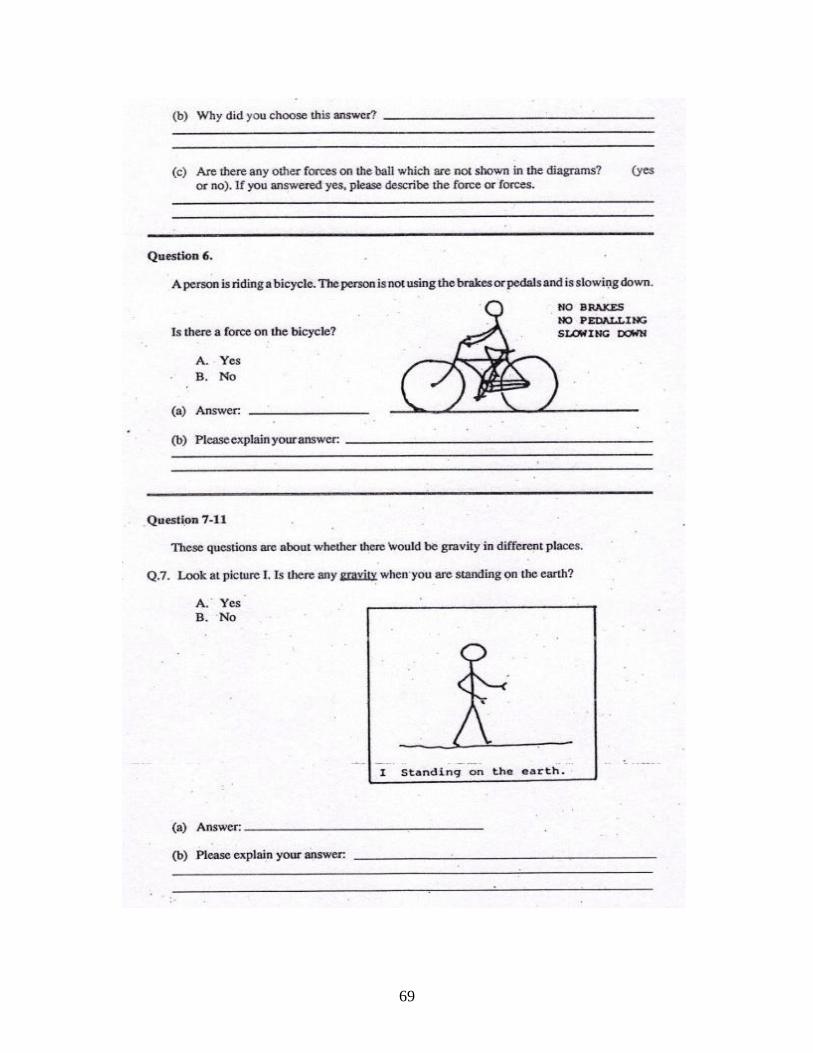
69

70

71

72
APPENDIX F
CONTINGENCY TABLES FOR FISHER’S EXACT TEST
A) Ho: There is no significant association between the number of misconceptions and gender in
the 12 situations.
# of Misconceptions Gender Total
Male Female
0-7 7 5 12
8-15 5 7 12
Total 12 12 24
Result: 2-tailed p = 0.6843
2-tailed p > 0.05
Decision : Do not reject Ho
B) Ho : There is no significant difference in the proportion of male and female students having
misconceptions.
Percent of Students Gender Total
Male Female
3 – 39 2 1 3
40 - 74 10 11 21
Total 12 12 24
Result : 2-tailed p = 1.00
2-tailed p > 0.05
Decision : Do not reject Ho

73
APPENDIX G
CALCULATION OF KENDALL’S COEFFICIENT OF CONCORDANCE (W)
A) Ho: There is no significant agreement in the ranking of the number of misconceptions
according to the type of school Physics background.
Background
(n)
Questions (p)/Ranking of the Number of Misconceptions
1 2 3 4 5 6 7 8 9 10 11 12 Total D S
Middle Sch 1 1 1 1.5 1.5 1 1.5 1 1 1.5 2 1 15 9 81
Physical Sc 2 2 2 1.5 1.5 2 1.5 2 2 1.5 1 2 21 3 9
Physics 3 3 3 3 3 3 3 3 3 3 3 3 36 12 144
Mean = 24 ∑S =234
W = 12 S
p2 (n
3 - n) - pT T = correction for ties
= (23-2) + (2
3 – 2) + (2
3-2) + (2
3-2)
= 12 (234) = 24
122(3
3 – 3) - 12 (24)
W = 0.886
Where: W = Kendall’s coefficient of concordance
D = deviation from mean
S = square of the deviation from mean
p = number of questions (judges)
n = number of items to be ranked
T = correction for ties
χ2 = p (n-1) W χ
2 tabular = 5.99
= 12 (3-1) (0.886)
= 21.3
Results : χ2 > tabular
p-value = 0.000024
Decision : Reject Ho

74
B) Ho : There is no significant agreement in the ranking of the proportion of students having
misconceptions according to the type of school Physics background.
Background
(n)
Questions (p)/ Ranking of Proportion of Students Having Misconceptions
1 2 3 4 5 6 7 8 9 10 11 12 Total D S
Middle Sch 1 1 1 1 1 1 1 1 1 1 1 1 12 12 144
Physical Sc 2 2 3 3 3 3 3 2 2 2 2 3 30 6 36
Physics 3 3 2 2 2 2 2 3 3 3 3 2 30 6 36
Mean = 24 ∑S = 216
W = 12 S
p2 (n
3 - n) - pT
= 12 (216)
122 (3
3 – 3) - 12(0)
= 0.750
χ2 = p (n-1) W χ
2 tabular = 5.99
= 12 (3-1) (0.75)
= 18.0
Results: χ2 > tabular
p – value = 0.000123
Decision : Reject Ho
75
VITA
Jane Ragasa-Pablico was born in 1976 in the Philippines. She earned her Bachelor of
Science in physics and Master of Science in teaching in the years 1996 and 2002, respectively,
from the University of Northern Philippines. She started teaching science and math in the
Philippines in the school year following her graduation in 1996. In February 2008, she moved to
Baton Rouge, Louisiana, to continue a more challenging teaching career. She started pursuing
her master’s degree at Louisiana State University in summer 2008. She is employed by the East
Baton Rouge Parish School System and is currently assigned as a science teacher at McKinley
High School.