misperceptions about the magnitude and timing of changes ... · growth in median census real income...
TRANSCRIPT

NBER WORKING PAPER SERIES
MISPERCEPTIONS ABOUT THE MAGNITUDE AND TIMING OF CHANGESIN AMERICAN INCOME INEQUALITY
Robert J. Gordon
Working Paper 15351http://www.nber.org/papers/w15351
NATIONAL BUREAU OF ECONOMIC RESEARCH1050 Massachusetts Avenue
Cambridge, MA 02138September 2009
¸˛I am grateful to David Autor, Rebecca Blank, Richard Burkhauser, Ian Dew-Becker, Lawrence Katz,Lawrence Mishel, and participants in the San Francisco EPS session for helpful comments. CarmenDeNavas and Ed Kirby of the Census Bureau were helpful in explaining CPS measurement conceptsfor median income per household and per person. The views expressed herein are those of the author(s)and do not necessarily reflect the views of the National Bureau of Economic Research.
NBER working papers are circulated for discussion and comment purposes. They have not been peer-reviewed or been subject to the review by the NBER Board of Directors that accompanies officialNBER publications.
© 2009 by Robert J. Gordon. All rights reserved. Short sections of text, not to exceed two paragraphs,may be quoted without explicit permission provided that full credit, including © notice, is given tothe source.

Misperceptions About the Magnitude and Timing of Changes in American Income InequalityRobert J. GordonNBER Working Paper No. 15351September 2009JEL No. D12,D3,D31,D63,I3,J24,J31,J62,R10
ABSTRACT
The rise in American inequality has been exaggerated both in magnitude and timing. Commentatorslament the large gap between the growth rates of real median household income and of private sectorproductivity. This paper shows that a conceptually consistent measure of this growth gap over 1979to 2007 is only one-tenth of the conventional measure. Further, the timing of the rise of inequalityis often misunderstood. By some measures inequality stopped growing after 2000 and by others inequalityhas not grown since 1993. This cessation of inequality’s secular rise in 2000 is evident from the growthof Census mean vs. median income, and in the income share of the top one percent of the income distribution.The income share of the 91st to 95th percentile has not increased since 1983, and the income ratio ofthe 90th to 10th percentile has barely increased since 1986. Further, despite a transient decline inlabor’s income share in 2000-06, by mid-2009 labor’s share had returned virtually to the same value asin 1983, 1991, and 2001.
Recent contributions in the inequality literature have raised questions about previous research on skill-biasedtechnical change and the managerial power of CEOs. Directly supporting our theme of prior exaggerationof the rise of inequality is new research showing that price indexes for the poor rise more slowly thanfor the rich, causing most empirical measures of inequality to overstate the growth of real income ofthe rich vs. the poor. Further, as much as two-thirds of the post-1980 increase in the college wagepremium disappears when allowance is made for the faster rise in the cost of living in cities wherethe college educated congregate and for the lower quality of housing in those cities. A continuingtendency for life expectancy to increase faster among the rich than among the poor reflects the jointimpact of education on both economic and health outcomes, some of which are driven by the behavioralchoices of the less educated.
Robert J. GordonDepartment of EconomicsNorthwestern UniversityEvanston, IL 60208-2600and [email protected]

Inequality Increase Exaggerated? Page 1
1. Introduction The evidence is incontrovertible that American income inequality has increased
in the United States since the 1970s.1 This paper shows that the rise in American
inequality has been exaggerated in at least three senses. First, the conventional measure
showing a large gap between growth of median real household income and of
productivity greatly overstates the increase compared to a conceptually consistent
alternative gap concept, which increases at only one‐tenth the rate of the conventional
gap between 1979 and 2007.
Second, the increase of inequality is not a steady ongoing process; after widening
most rapidly between 1981 and 1993, the growth of inequality reversed itself and
became negative during 2000‐2007. For instance, a new study that integrates CPS and
IRS data and corrects for top‐coding using internal Census data, shows that there was no
increase of inequality after 1993 in the bottom 99 percent of the population, and the
remaining increase of inequality can be entirely explained by the behavior of incomes in
the top 1 percent. This paper shows that by several measures, the increase of inequality
had already ceased by the early 1990s and by others around 2000, even before the
current major recession that has cut incomes at the top more than at the bottom
(Leonhardt and Fabrikant, 2009). Because of the very different behavior of the top 1
percent and the bottom 99 percent, this paper treats as two separate topics the causes of
1. Indeed Ian Dew‐Becker and I developed the striking result that over the period 1966‐2001 only the top 10 percent of the income distribution had a gain in real income equal to growth in labor productivity (Dew‐Becker and Gordon, 2005).
Inequality Increase Exaggerated? Page 2
changes of inequality at the very top and among the remaining 99 percent of the
population.2
Third, an emerging literature documents an exaggeration of the rise of inequality
due to the use of common price indexes across income groups. Several important recent
articles document that prices paid by the rich have been increasing more rapidly than
prices paid by the poor. The implication is that almost all studies that use a single
common price index across all income groups overstate growth in real income at the top
and understate real income growth at the bottom.
This paper begins in Part 2 by introducing an alternative concept of the gap
between median income and productivity; it shows that over the three decades 1979‐
2007 the alternative gap measure grew at an annual rate barely one‐tenth as fast as the
conventional gap measure. The comparison between the conventional and alternative
gap measures is also carried out for sub‐periods of the past three decades with special
attention to the sharp contrast in outcomes between the 1995‐2000 and 2000‐07 sub‐
periods. We show that the failure of median household income to grow in 2000‐07 has
little to do with inequality and a lot to do with measurement puzzles involving the slow
realized growth of Census real income relative to real GDP.
The paper then turns in Part 3 to issues raised by other quantitative measures of
inequality. The decline in labor’s income share so evident in national accounts data for
2001‐07 has now been almost fully reversed in quarterly data through 2009:Q2. Longer‐ 2. Indeed until the two papers by Dew‐Becker and Gordon (1995, 1997/98), most of the literature on inequality treated topics related to the bottom 90 percent (unions, minimum wage, immigration, technical change) or related to the top 1 percent (CEO pay), but not both in the same paper.

Inequality Increase Exaggerated? Page 3
term moving averages show no decline in labor’s income share over the last four
decades following a marked increase in the previous three decades going back to 1938.
We also focus on measures of top pay, including the income share of the top 1 and 0.1
percentiles and the pay premia of top CEOs, and these show no further increase of
income shares between 2000 and 2006/07, prior to the 2007‐08 stock market collapse that
caused sharp declines in the top income shares.
Our examination of the data on income and productivity in Parts 2 and 3 is
supplemented in Part 4 by a focused review of selected articles in the literature on
inequality that have appeared since the previous surveys by Gordon and Dew‐Becker
(2007, 2008).3 Are recent findings consistent with previous hypotheses? Which
substantive findings in recent research support our theme that the rise of inequality has
been exaggerated? The topics span new interpretations of skill‐biased technical change,
of executive compensation, of differences among the rich and poor in changes of life
expectancy, and particularly of different growth rates of prices paid by the rich and the
poor. The paper concludes by speculating on the implications of the current deep
recession for the future evolution of income inequality.
2. Measuring the Gap between Income and Productivity Growth Previous commentators have noted the sharply slower growth of median real
household incomes than in productivity. A typical comparison would lament that
3. See Gordon and Dew‐Becker (2007, 2008). The 2007 paper is a version, drastically shortened for publication, of the comprehensive longer 2008 paper. In addition to providing a more complete treatment of each topic in the shorter paper, the longer paper also covers several topics that are absent from the short version, including consumption and geographical inequality.
Inequality Increase Exaggerated? Page 4
median real household income as reported by the Census Bureau grew between 1979
and 2007 at a mere 0.49 percent per year, while productivity in the nonfarm private
business (NFPB) sector grew four times faster at 1.95 percent per year.4 The implication
is that the entire gap between the 0.49 and 1.95 percent growth rates can be explained by
increased skewness in the income distribution.
Alternative Concepts of Median Income and Productivity
However, this “conventional gap” compares apples with oranges, and then
oranges with bananas. There are five key conceptual differences between median real
household income and private sector productivity that are ignored in the typical
comparison: (1) changes in the number of people per household, (2) top coding that
causes Census total income to increase more slowly than the equivalent national
accounts measure, (3) differences among price deflators, (4) changes in the number of
hours worked per person, and (5) slower growth of productivity in the total economy
than in the NFPB sector. In contrast to the total difference of 1.46 percentage points
over 1979‐2007 between the growth rates of NFPB productivity and median real
household income implied by the typical apples‐oranges‐bananas comparison, there is a
negligible 0.16 point gap in an apples‐to‐apples comparison of total economy
productivity with median real income per capita deflated by the GDP deflator. The
alternative gap is only 11 percent of the conventional gap.
4. An example of this type of misleading comparison appears in Mishel et al. (2009, Figure 1G, p. 58). All data in this section of the text come from Table 1 and are identified below by column and line number; data sources for Table 1 and Figures 1‐2 are current through August, 2009. Data sources for the table and figures are listed in the Data Appendix.

Inequality Increase Exaggerated? Page 5
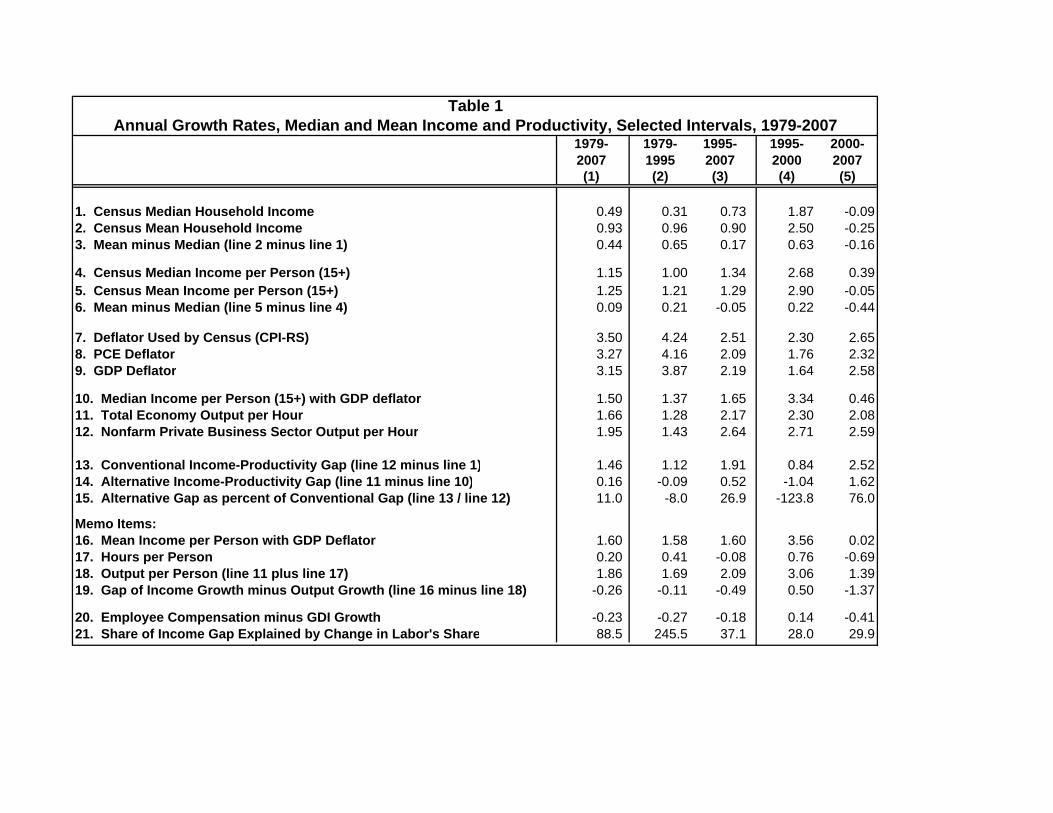
Table 1 provides detail on the growth rates of alternative concepts of income and
of productivity over the three decades between 1979 and 2007, as shown in column (1),
and also over selected subintervals. Columns (2) and (3) split up the full period into two
subperiods divided at 1995, while columns (4) and (5) further split the 1995‐2007
subperiod at the year 2000. This last distinction is designed to highlight important
aspects of the slightly negative growth in median Census real income that has occurred
since 2000.
Over the full period in column (1) Census median real household income grew at
0.49 percent per year versus 0.93 percent for mean real household income, implying a
contribution of distributional skewness of 0.44 points (rows 1 through 3).5 But this 0.49
median growth rate understates growth in the real income concept that is comparable to
productivity growth. We must first switch from median income per household to
median income per person, which is accomplished in rows 4 thought 6.
Fortunately the Census publishes median and mean income on a per person
basis, not just on a per‐household basis, where only persons of working age (15+) are
included on the assumptions that the income of people aged 0‐14 is negligible. The
growth of median income per person shown on line 4 was more than twice as fast as
median income per household (1.15 percent per year), and mean income per person
grew only slightly faster at 1.25 percent per year, for a contribution of distributional
skewness of 0.09 percent per year.
5. The Census concept of income includes all cash income before taxes but excludes in‐kind income. Thus employee‐financed health and pension benefits are included, while employer‐financed benefits are excluded. See DeNavas‐Walt (2008), p. 29.

Inequality Increase Exaggerated? Page 6
Median and mean income per household and per person are deflated by the
Census using the CPI‐RS price index, where the “RS” stands for research series and
corrects many of the sources of upward bias present in the standard CPI‐U price index.
The CPI‐RS increases over 1979‐2007 (line 7) at an annual rate of 3.50 percent, 0.25 points
slower than the conventional CPI‐U. Even slower growth of 3.27 and 3.15 percent is
exhibited by the deflator for Personal Consumption Expenditures (PCE, line 8), and the
GDP deflator (line 9). An investigator who took the Census nominal median income per
person series and deflated it by the CPI‐U would emerge with an annual growth rate
over this period of 0.90 percent, whereas deflation by the GDP deflator deflator yields a
growth rate of 1.50 percent, two‐thirds higher (line 10). To make median real income
comparable to productivity growth, we must use the same GDP deflator that is used to
create the economywide productivity series shown in line 11. Differences in the growth
rates of the various deflators belong in papers on price index bias and differential price
growth by spending sector, not in papers about inequality.
The key income concept on line 10, median income per person deflated by the
GDP deflator, can now be compared with growth in productivity. Most commentators
then point to the rapid growth of productivity in the nonfarm private business sector
(NFPB, line 12), which is the standard version of productivity, published every quarter
by the Bureau of Labor Statistics. However for comparisons with median income across
the entire economy, the correct productivity concept should refer not to a part of the
economy but rather to the total economy. Productivity in the total economy (line 11),
which is unfortunately not published, consistently grows more slowly than productivity
Inequality Increase Exaggerated? Page 7
in the NFPB sector, because the narrower concept excludes the government, households,
and institutions where productivity growth is negligible.6 When the preferred income
concept on line 10 of Table 1 is compared with the appropriate productivity concept on
line 11, the conceptually consistent gap between income and productivity growth is only
0.16 percent per year (line 14), barely one‐tenth of the conventional gap of 1.46 percent
(line 13).
One reason that the corrected gap is so small is that mean real income per capita
grew at 1.60 percent (line 15), almost as fast as total‐economy productivity. This 1.60
annual growth rate of Census mean income lagged behind the 1.86 growth rate of
National Income and Product Accounts (hereafter NIPA) real GDP per person, a gap of
0.26 percentage points. While one might surmise that this reflects top coding that
excludes the highest incomes, it can be almost completely explained by a reduction in
the share of employee compensation in Gross Domestic Income (lines 19 through 21).
The big surprises in the first column of Table 1 for the 1979‐2007 period are not only that
the alternative income‐productivity gap of 0.16 points is so small compared to the
conventional gap of 1.46 points, but also that the contribution of skewness to the
difference between mean and median income growth in lines 4 though 6 is so small.
Income and Productivity Growth across Sub‐periods
The same conclusion that the conventional gap measure greatly exaggerates the
alternative gap concept holds also for the 1979‐95 and 1995‐2007 subperiods in columns
6. Output in the nonfarm private business sector in 2007 was 75.8 percent of GDP (NIPA Table 1.3.5).

Inequality Increase Exaggerated? Page 8
(2) and (3) of Table 1. In fact the alternative gap measure is negative, i.e., median income
per person grew faster than total economy productivity, in the initial 1979‐1995 interval.
Note that the contribution of distributional skewness as measured by the mean‐to‐
median growth gap for income per person was 0.21 points during 1979‐95, much less
than is generally assumed. As shown below in Figure 3, inequality grew fastest during
1981 and 1986, with continued inequality growth through the mid‐1990s.
The 1995‐2007 subinterval is notable (column 3, line 6) in that mean income per
person actually grew more slowly than median income per person. The alternative
incomeo‐productivity growth gap was 27 percent, somewhat higher than the 11 percent
of the full period 1979‐2007 and the negative ‐8 percent of 1979‐95. Another difference
is that the growth rate shortfall of Census mean income per person compared to real
GDP per person is only partly explained by changes in the income share of employee
compensation during 1995‐2007 (column 3, lines 16‐21), whereas it is overexplained
during the first subinterval 1979‐1995.
The most startling aspect of the 1995‐2007 subinterval is the sharp difference
between the first and second periods, 1995‐2000 compared with 2000‐2007, as shown in
columns (4) and (5) of Table 1. The break at the year 2000 shows how little the income‐
productivity gap has to do with inequality. Median income performed exceptionally
well during 1995‐2000, with a large negative alternative gap between income and
productivity growth, despite an increase of inequality (line 3) roughly similar as as
during 1981‐95. Then after 2000 median income performed abysmally with an
alternative gap of 1.62 percent, despite the fact that inequality actually decreased, with a

Inequality Increase Exaggerated? Page 9
small decline in mean income per person relative to modest growth in median income
per person (columns 4 and 5, lines 4 though 6).
The exceptionally large conventional and alternative gaps, together with the
decline of inequality, raises puzzling questions about the 2000‐07 period in column (5).
The problem is that a lot of income seems to be missing. Census mean income per
person with the GDP deflator did not grow at all during 2000‐07 (line 16), whereas real
GDP per person grew at 1.39 percent per year. Only 30 percent per year of this income
growth shortfall can be explained by slower growth in employee compensation than in
Gross Domestic Income. But this leaves a growth rate of ‐0.96 percent per year as an
unexplained shortfall of income, or 7 percent when cumulated over the seven‐year
period 2000‐07. Further research is needed into the sources of this missing income. We
return to this puzzle below in the section on caveats and qualifications in relation to the
top‐coding problem in Census mean income growth rate measures.
Overall this exploration reinforces our initial theme, how little the gap between
median real household income and business‐sector productivity has to do with growth
of inequality. Between 1979 and 1995 inequality as measured by the gap between mean
and median income growth per household grew at 0.65 percent per year, even though the
alternative income‐productivity growth gap was slightly negative. Between 1995 and
2000 inequality grew rapidly but the alternative growth gap was strongly negative. Then
the period of the largest alternative growth gap in 2000‐07 witnessed a decline of
inequality. How could the growth gap be near zero when inequality was rising before
2000? This occurred because by coincidence hours per person grew, allowing income

Inequality Increase Exaggerated? Page 10
per person to grow faster than productivity, and this benefit of rising hours per person
was offset by an increase of inequality that was in part related. To the extent that higher
hours per person reflected higher labor force participation of women and teenagers
prior to 1995, the labor‐force entry of these inexperienced workers helped to hold down
growth in median relative to mean income.
Caveats and Qualifications
At least one issue has been suggested as a possible qualification to the
interpretation provided above as based on Table 1.7 Top coding in the Current
Population Survey (CPS) data used by the Census Bureau to calculate median and mean
incomes may understate the growth in mean incomes. Top coding means, for example,
that all incomes above the 90th percentile are lumped together into one category such as
“above $100,000”, and growth in incomes in the 99th percentile as compared to the 90th
percentile is ignored. An extensive set of studies has been produced by Burkhauser and
co‐authors (2008, 2009a, 2009b) who were given access to the internal Census data and
thus could compute distributions based on the full range of incomes, including those
above the top income limit (e.g., $100,000 in the above example).
They show (2009a, Table 2 and Figure 6) that top‐coding makes little difference
in conclusions based on either 90‐10 income ratios or on calculations of the Gini
coefficient. They regard the Gini coefficient which is based on the complete distribution
as superior to the 90‐10 ratio which is based on two points in the distribution, and they
add to the evidence reviewed in this paper showing that most of the increase of
7. I am grateful to Rebecca Blank for raising the issue of top‐coding.

Inequality Increase Exaggerated? Page 11
inequality had occurred by 1993, with little further increase after that year. Their Gini
coefficients (with a base of 1975 = 1.0) based both on public‐use and internal CPS data
show that the Gini coefficient rose from 1.0 in 1975 to 1.16 in 1993, and then little further
to 1.19 in 2004. Burkhauser et al. (2008) conclude that, “at least for the poorest 99 percent
of the income distribution,” the increase in inequality since 1993 has been significantly
slower in the U. S. than in the previous two decades.
Burkhauser et al. (2009b) makes this finding more precise, finding that all of the
increase of inequality after 1993 occurred in the top 1 percent group, and there was no
increase of inequality in the bottom 99 percent of the population. Their new results are
notable because they are able to reconcile findings from the CPS and IRS data by using
internal Census data that is not top‐coded to disguise differences of income among the
top groups of earners.
Table 1 presents some indirect evidence on the role of top coding in the official
published CPS data. The shortfall of growth in Census mean income per person as
compared to real GDP per person for 1979‐2007 (column 1, line 19) suggests a role for
top coding, but virtually the entire shortfall can be explained by a slippage in labor’s
income share from its high levels reached in the 1970s (see Figures 1 and 2 as discussed
below). The conclusion of Burkhauser and co‐authors that inequality has not increased
further after 1993 is supported by line 6 of Table 1, which shows that there was no net
increase in the growth rate of mean vs. median real income per person from 1995 to 2007
(the increase in 1995‐2000 was more than offset by a decrease during 2000‐07).

Inequality Increase Exaggerated? Page 12
3. The Recent Behavior of Income Shares: Labor, Bottom, and Top The Decline and Rebound of Labor’s Income Share The rise of American inequality is not about the income shares of labor versus
capital, but recent commentary has pointed to the decline in labor’s share since the year
2000 as one more symptom, along with stagnant median household income, of rising
inequality. Is this an accurate implication? Figure 1 plots labor’s share from the NIPA.8
Labor’s share has been remarkably stable over the past 50 years, in that the share of 73.7
percent in 2009 was almost identical to that in 1959 of 73.3 percent. Even if labor’s share
were observed to increase, this would not indicate that inequality has declined, because
such an increase could reflect simultaneously a sharp increase of the labor income of the
highest‐paid workers together with a decline in the real income of the median worker.
The dynamics of labor’s share reflect the cyclical timing of productivity growth
rather than any fundamental tug‐of‐war between labor and capital; labor’s share
declines and the profit share increases during the early part of the recovery when
productivity growth, which spills into profits, is most rapid (see Gordon, 2003). Thus
the decline in labor’s share in 2001‐06 in large part reflects the rapid productivity growth
of that interval, and the labor’s share turnaround after mid‐2006 is a normal response to
the slowdown in productivity growth that occurred roughly at the same time.
8. The numerator of labor’s share is nominal employee compensastion plus 40 percent of proprietor’s income. The denominator is domestic net factor income (i.e., gross domestic income minus business taxes and depreciation). Data for both numerator and denominator are taken from NIPA Table 1.10, current through 2009:Q2 as of August 27, 2009. The data plotted for 2009 is the average of the first two quarters.

Inequality Increase Exaggerated? Page 13
As a crude method to eliminate the cyclical fluctuations of labor’s share, Figure 2
displays 10‐year moving averages of the two series from Figure 1. Thus the first
observation plotted in Figure 2 is the average for 1929‐38, and the final observation is the
average for 2000‐09. This provides a more interesting history. Labor’s share started
relatively low in the 1950s and early 1960s and then increased sharply between 1965 and
1975. The increase during the late 1960s can be plausibly explained by some
combination of tight labor markets and union power. The continued high level of
labor’s share in the 1970s and the subsequent decline after 1985 can be explained by the
systematic inverse correlation of labor’s share with an acceleration or deceleration of
trend productivity growth (see Dew‐Becker and Gordon, 2005, p. 96). Slowing trend
productivity growth between 1965 and 1980 boosted labor’s share and rising trend
productivity growth after 1985 reduced labor’s share. In Figure 2 the average share
over the final ten years 2000‐2009 (74.0 percent) is higher than 50 years earlier (1950‐59 at
73.0) and indeed higher than any ten‐year period ending prior to 1971.
Inequality in the Bottom 90 Percent: Previous Explanations and Recent Data Previous research has tended to focus either on the bottom 90 percent or the top
10 percent but not both together, due to data limitations. The Current Population
Survey (CPS) data, typically used to examine the evolution of incomes in the bottom 90
percent, is top‐coded and provides little information on what is happening within the
top 10 percent. Similarly most studies of top incomes are based on tax data that provide
little insight on incomes below the median where many households do not file tax
returns at all. Our 2005 paper was one of the first to use tax data uniformly across the

Inequality Increase Exaggerated? Page 14
income distribution and showed a monotonic increase in the 1966‐2001 growth rate of
real income across the percentiles, from 0.48 percent per year at the 20th percentile to 5.63
percent per year at the 99.99th percentile.
Because of its greater coverage of the bottom half of the income distribution, CPS
data are suitable for evaluating hypotheses regarding the evolution of the income
distribution in the bottom 90 percent. While the 90‐50 ratio for both men and women
increased slowly and steadily from 1979 to 2005, the 50‐10 ratio showed a sharp jump in
1979‐86 that was twice as large for women as for men. To save space in this paper these
ratios are displayed in Figure 3 only for both sexes combined.
The steady rise of the 90‐50 log percent ratio (expressed as an index with 1979 =
0), from zero in 1979 to 14.6 percent in 2007, seems consistent with the hypothesis of
skill‐biased technical change (SBTC). However, the SBTC hypothesis has been criticized
by Mishel et al. (2008), based on data from Goldin and Katz (2008), because the growth in
the demand for college graduates was relatively steady in 1950‐90 and declined in 1990‐
2005. Indeed, the increase in the 90‐50 log percent ratio was not continuous but mainly
concentrated in the period prior to 1995. The log percent ratio increased from 0 in 1979
to 12.2 in 1995, and then little further to 14.6 percent in 2007, supporting the Mishel et al.
qualification.
Returning to the 90‐10 ratio for both sexes plotted in Figure 3, the sharp rise
between 1981 and 1987 was followed by a stable plateau, with the 2003 90‐10 log percent
ratio of 23.2 percent roughly equal to the 22.8 percent of 1987. However, the middle
years of the current decade have witnessed a further increase in the 90‐10 log percent

Inequality Increase Exaggerated? Page 15
ratio to new high values of 27.7 percent in 2006 and 27.1 percent in 2007. This appears
mainly to be related to a reversal in the 50‐10 ratio, with a decline during 1987‐2002
decline followed by a substantial increase from 7.2 to 12.5 percent between 2002 and
2007.
David Autor and co‐authors (2006, 2008) have at least in part rescued the SBTC
hypothesis from timing inconsistencies. Their key distinction is between interactive
work at the top, whether lawyers in courtrooms or investment bankers making deals in
person, and interactive work at the bottom, whether nursing home attendants, waiters,
or bartenders. These jobs at the top and bottom cannot be outsourced. But jobs can be
outsourced in the broad middle where people do routine, easily duplicated jobs such as
airline reservations agents or, at a higher education level, radiologists reading electronic
test results. This is consistent with the interpretation that Figure 3 shows mainly
weekness in the middle relative to the top and bottom, in the sense that the 90‐50 ratio
rises throughout while the 50‐10 ratio declines by half between 1987 and 2002 before
partly recovering through 2007.
While the 1987‐2002 decline in the relative income at the 50th percentile seems
roughly consistent with the Autor et al. 2008) hypothesis of outsourcing in the middle
tier of occupations, the post‐2002 turnaround so far has not been explained. Indeed it is
too soon for such an interpretation which may depend on how the 50‐10 ratio emerges
from the current severe 2007‐09 recession.

Inequality Increase Exaggerated? Page 16
Inequality Above the 90th Percentile: Previous Explanations and Recent Data
SBTC is a major explanation of increased skewness of labor incomes at the top,
where we distinguish three different types of top incomes. The first two groups include
entertainment/sports superstars and top professionals (investment bankers, lawyers,
management consultants, surgeons, textbook authors); in both groups incomes are
driven by the market. The most contentious questions about top‐bracket pay regards
the third category, that is, the sources of the enormous increases in the ratio of top
executive compensation to that of average workers, both over time and between the
United States and other developed nations. While superstars and top professionals have
their incomes chosen by the market, CEO compensation is chosen by their peers, a
system that gives CEOs and their hand‐picked boards of directors, rather than the
market, control over top incomes.
This idea that the principal‐agent control of stockholders has been reversed
through managerial power helps to explain some of the outsized gains in CEO pay.
However, the close correlation between stock market outcomes and CEO pay suggests
that stock options created an automatic spillover from the stock market gains of the
1990s and mid‐2000’s into executive pay.
Our presentation of the data begins with updated graphs from Piketty‐Saez
(2003) on the evolution of top incomes over most of the twentieth century. Their work
exploits the oversampling of high incomes in the IRS micro data files and tells a
fascinating story of the U‐shaped evolution of top incomes. Figure 4 plots the latest
Piketty‐Saez shares of wage income (including bonusses and stock option income but
Inequality Increase Exaggerated? Page 17
excluding capital gains) extending from 1927 to 2006. The time series for the top 1
percent has become familiar, with its U‐shaped trajectory that declines during World
War II, maintains a plateau until the late 1970s, and then rises in 1980‐2000 to over 12
percent, well above the 1927‐40 average of 8.5 percent.
Less familiar in Figure 4 are the shares for the other percentiles that make up the
top tenth of the income distribution, that is, percentiles 91‐95 and 96‐99. Perhaps the
most surprising aspect of Figure 4 is that the share of the 91‐95 group did not increase at
all between 1983 and 2006, with an identical share of 10.6 percent in both years. In
contrast the 96‐99 group enjoyed a steady increase from 10.5 percent in 1967 to 13.1
percent in 2006. The time path for the 96‐99 group appears to be roughly a weighted
average of the 91‐95 and 99+ groups. This result that income shares increased
monotonically from the lowest to highest groups echoes the findings for 1966‐2001 of
Dew‐Becker and Gordon (2005, Table 8).
An important development in the first half of this decade is the U‐shaped pattern
of the top‐1 percent share, indicating a response to the decline in stock prices of 2000‐02
and the post‐2002 recovery. This continues the influence of soaring stock market prices
between 1982 and 2000, when the annual average of the S&P 500 index rose from 120 to
1420. The 2000‐02 decline in the top‐1 percent share is only faintly echoed in the 96‐99
share and is not visible at all in the 91‐95 share. Not only do stock options provide a
channel by which the stock market influences top incomes, but also stock options
became much more important as a source of executive compensation in the 1990s

Inequality Increase Exaggerated? Page 18
(increasing from roughly 40 to 70 percent of executive compensation between 1990 and
2000).
Figure 4 includes labor income only, including bonuses and stock option income
but excludes income from business proprietorships, capital income, and capital gains.
The impact of excluding the non‐labor sources of income is shown in Figure 5 for the top
0.1 percent, in contrast to the top 1 percent share plotted in Figure 4. Whereas the top 1
percent wage income share more than doubled from 5.3 percent in 1966 to 12.3 percent
in 2000, the top 0.1 percent wage income share rose by a factor of more than six from 0.6
percent in 1966 to 4.1 percent in 2000. This implies that the top tenth of one percent
earned only 11 percent of the income of the top one percent in 1966 (this seems
implausibly low) but fully one‐third in 2000.
Piketty‐Saez (2003) use their version of Figure 5 to emphasize how the source of
income in the top 0.1 percent shifted from capital income in the 1920s to labor income
after 1990. Indeed, we have already seen in Figure 1 that labor’s income share for the
total population was substantially lower in 1929 than in any postwar year and fully
eight points below that in 2009.
In the final year of 2005 in Figure 5 the total share of 8.8 percent was divided up
into 1.8 percent for capital gains, 1.4 percent for capital income, 2.6 for business income,
and 3.0 percent for labor income. The U‐shaped pattern during 2000‐05 is exhibited not
just by labor income (due to stock options) but also by capital gains. Business proprietor
income increased steadily during this interval without exhibiting a single year of a
declining share. An apparent puzzle is that capital gains income was positive during

Inequality Increase Exaggerated? Page 19
2001 and 2002 when stock prices were declining; this must reflect the gains on shares
sold during these years but bought before 1998 when stock prices were much lower.
In Figure 6 we turn from top‐share pay to the pay of CEOs, who make up a
sizeable proportion of top incomes.9 The solid black line plots the ratio of average pay
of the top 100 CEOs to average worker pay, and this exhibits an even more pronounced
U‐shape response to the stock market than do the top wage income shares of Figures 4
and 5; this top‐100 ratio increased by a factor of five between 1990 and 2000 and th
dropped by more than half between 2000 and 2002‐03. The lower grey line displays the
same ratio for the CEO whose income is ranked 100. This ratio is substantially lower,
increased by 3.4 times from 1990 to 2000, and fell by somewhat less than half between
2000 and 2002‐03. The relations between the lines plotted in Figures 4, 5, and 6 suggests
that corporate CEOs, with their incomes dependent on stock options that fluctuate with
the stock market, may make up as much as half of top incomes (including top officers of
both “Main Street” and “Wall Street” firms in the language of Kaplan‐Rauh, 2007).
en
The clear correlation of top income shares and the stock market, with a V‐shaped
pattern between 2000 and 2006, suggests that in 2007‐09 the top income shares may have
decline at least as much as in 2000‐02. The peak value of the S&P 500 stock market index
was 1525 in 2000, fell to a low of XXX in October, 2002, returned to a slightly higher
index value than in the year 2000 to its all‐time high of 1568 in October, 2007, and fell to
a local minimum of 670 in March, 2009. Given that the decline from 2007 to 2009 was
9. Kaplan‐Rauh (2007) and Gordon and Dew‐Becker (2008) debate the relative importance of CEO pay in the pay of all top income earners including superstars and high‐paid lawyers and investment bankers.

Inequality Increase Exaggerated? Page 20
even steeper than in 2000‐02, it is a reasonable assumption that top income shares may
have fallen by as much or more as in 2000‐02/03.
International Differences
Some of the most interesting remaining issues in the area of increased inequality
involve cross‐country differences. The post‐1970 upsurge in American inequality,
particularly in top incomes, is much greater than in continental Europe or Japan, with
the U. K. and Canada somewhere in between. Figure 7 provides the latest available
figures for the income share of the top 0.1 percent in the U. S., U. K., and France. The
data are similar to those displayed above in Figure 5 and include all sources of income
except for capital gains. Compared to the sharp 1980‐2006 ratio for the U. S., the stability
of the French ratio all the way back to 1945 is quite remarkable. The U. K. share was
roughly equal to the U. S. and France shares between 1953 and 1970, then fell below
France until a recovery began around 1980 that boosted the share through 2000 by about
half the increase observed in the U. S.
We have proposed a mix of institutional and market‐driven explanations to
explain the divergence in Figure 7. An important institutional difference is the earlier
and more pervasive introduction of stock options in the U. S. and prohibitions on the
use of stock options until relatively recently in some countries, e.g., Japan. In Germany
and Scandinavia a tradition of corporatism and cooperative bargaining constrains
management compensation excess. Other institutional factors include the larger role of
unions and a higher real minimum wage in some European countries. But the market
matters also; gains in profits and price‐earnings ratios in the U. S. stock market in the

Inequality Increase Exaggerated? Page 21
1990s and again in 2003‐07 spilled over to executive compensation, interacting with the
large increase in the share of executive compensation taking the form of stock options.
4. New Research Insights Related to the Inequality Debates We now turn to a brief review of some of the recent research literature that is
related to the explanation of rising American inequality. To what extent do recent
contributions reinforce the theme of this paper that the growth of inequality has been
exaggerated and has largely ceased? This section is divided into research that is relevant
to the bottom 90 percent, relevant to top incomes, and relevant to other topics including
health and geographical inequality.
The Bottom 90 Percent
An interesting feature of the data discussed above is that the 90‐10 ratio from the
CPS data displayed in Figure 3 exhibits almost all of its increase between 1980 and 1993,
whereas the Piketty‐Saez data on the top income classes displayed in Figures 4 and 5
continues to increase from 1993 to 2000 and then exhibits a U‐shaped pattern after 2000
that is not evident at all in the CPS data. In Figure 4 above based on Piketty‐Saez data,
we noticed that there is no increase at all in the 91‐95 percentile share after 1987, and the
96‐99 share exhibits most of its increase between 1970 and 1989. Overall, the time path
of the top one percent is unique and justifies the methodology in this and our past
papers of treating the sources of rising inequality in the bottom 90 percent (or perhaps
better stated as the bottom 99 percent) and the top one percent as separate topics with
separate explanations.

Inequality Increase Exaggerated? Page 22
Autor and Dorn (2008) have produced new research that supports the earlier
polarization hypothesis of Autor, Katz, and Kearney (2006, 2008). As we have seen, the
polarization hypothesis creates at least three segments in the labor force, with skilled
interaction in the top group, unskilled interaction in the bottom group, and a middle
group doing routine repetitive work that can be replaced by computers and/or
outsourced. In their new paper, Autor‐Dorn focus on the apparent paradox that in a
world of widening earnings inequality between high and low‐skilled workers, both
employment and relative wages have grown in manual service jobs. In their view the
computerization of routine white‐collar jobs has pushed relatively unskilled workers
into routine but interactive manual jobs, and this occurs to a greater extent in
geographical areas which initially had a larger share of employment in routine repetitive
occupations.
The Top One Percent
We have seen that the timing and interpretation of increases in top incomes at
the top 1.0 and 0.1 percent levels is very different than that in the bottom 99 percent.
Much of the within‐group increase in inequality in the bottom 99 percent occurred
before 1993, whereas between 1993 and 2000 there continued to be an increase in the
income share of the top one percent, and a continuing shift toward the top 0.1 and 0.01
percent groups within the top one percent segment. We have previously suggested that
the timing of the increased shares in the top groups appears consistent with an
important role for stock options as a major source of CEO pay and the gyrations of its
share in response to stock market price fluctuations. Between 1989 and 2007, the share

Inequality Increase Exaggerated? Page 23
of total CEO compensation taking the form of stock option gains and other
compensation beyond salary and bonus pay has jumped from 34 to 74 percent (Jarque,
Figure 1, p. 269).
In turn the increased role of stock options in executive compensation has been
traced by Jarque (2009) to changes in tax regulations that took place in 1993, an ironic
finding given the current demands in the popular press for government regulation of
CEO pay. The 1993 regulation was a limitation on the tax deductability for any
compensation above $1 million taking the form of standard salary and bonus pay but
not for equity‐based compensation. Empirical studies cited by Jarque have found that
this regulatory change was a direct cause of a shift of CEO compensation away from
salary and toward stocks and options. Tax advantages for pay in the form of stock
options antedates the 1993 regulations and goes back to the tax reform legislation of
1986. Hall and Liebman (2000) show that the tax advantage of options reached a
maximum of 7 percentage points in 1988‐90. Not only are capital gains tax rates lower
than top‐bracket personal income tax rates, but also there are no capital gains tax
charges on the increase in value of a stock from the grant date to the exercise date. If the
executive holds the stock after the date of exercise and there are capital gains, tax is
charged only on gains from the exercise date to the date of sale, not from the original
grant date.
Recently Frydman and Saks (2008) have extended their previous research on
executive compensation that extends back to the 1930s. They call attention to the sharp
change in behavior before and after the mid‐1970s. In the three previous decades the

Inequality Increase Exaggerated? Page 24
median real value of compensation was surprisingly flat and seemed unresponsive both
to macroeconomic fluctuations and growth of individual firms. Then in the three
subsequent decades median real compensation has increased sharply as is evident in
Figures 4, 5, and 6 above. Among the results based on their micro evidence is, while the
cross‐sectional relationship between executive pay and firm size has remained stable
over the last 70 years, there has been a sharp increase in the correlation between the level
of pay and the average market value of firms in the past 30 years to roughly 1.0 (the
Gabaix‐Landier 2008 result) from a previous 0.1 to 0.3 before 1980. This increased
elasticity can be traced directly to the 1986 and 1993 changes in tax law and tax
regulation that created a sharp increase in the share of CEO compensation taking the
form of stock options, creating a more direct link than previously between CEO pay and
market capitalization.
Frydman‐Saks apply their results to several theories of executive pay. The small
response of executive pay to the economy and to firm size before the 1970s is
inconsistent with “theories of managerial rent‐seeking, a competitive labor market for
executives, and increases in managerial incentives.” Their explanation for the post‐1970s
shift include changes in social norms, which we have previously invoked to explain part
of the differing evolution of inequality at the top in the U. S. as compared with some
foreign countries. For instance, the presence of strong unions in Germany and other
corporatist nations appears to have limited CEO pay through a form of moral suasion,
and the same may have been true in the U. S. before the 1970s when unions were strong.

Inequality Increase Exaggerated? Page 25
The closer alignment of CEO pay to stock market performance reviewed here is
placed in a broader context of performance pay by Lemieux et al. (2009). These authors
document using micro data that performance‐based pay (bonus p[ay, commissions, and
piece‐rate contracts) are more closely aligned with observed and unobserved
productivity characteristics of individual workers than non‐performance types of pay.
They argue that SBTC creates an incentive of performance‐based pay which then
becomes a conduit in the chain of causation between SBTC and inequality. They
conclude that this is an important source of rising inequality above the 80th percentile
level of income over the past three decades. Their findings put the CEO pay controversy
into context as part of the movement toward performance‐based pay, of which CEO
stock options are one particular form that stands out sharply in the data on top‐bracket
incomes as in Figures 4 and 5 above.
Philippon and Reshef provide an even longer historical perspective than
Frydman and Saks, studying the period 1909‐2006 not for CEO pay but rather for the
separately interesting issue of pay in the financial services industry. Their unique new
data set documents a U‐shaped pattern of skill intensity and job complexity in the
financial sector relative to the nonfarm private sector, which has almost the same timing
pattern as the U‐shaped Piketty‐Saez (2003) pattern of top‐bracket pay reviewed above
in Figures 4 and 7. They attribute the rise in skills in the financial sector since the late
1970s to the financial deregulation that occurred at that time and introduced more
complex financial products such as initial public offerings and a more sophisticated set
of tools for evaluation of credit risk. However, controlling for skills, education, the risk

Inequality Increase Exaggerated? Page 26
of job loss, and numerous other variables, the authors find a substantial earnings
premium in the finance industry. “We find that rents account for 30 percent to 50
percent of the wage differentials observed since the late 1990s. In that sense, financiers
are overpaid.” However, these authors do not explore the stock option or market
capitalization channel that could explain some of these apparent rents as they also
explain a large part of CEO pay. They need to assess their conclusions in the context of
the Kaplan‐Rauh argument that top‐bracket pay on “Wall Street vs. Main Street” is part
of the same phenomenon.
Price Indexes and Geographic Inequality
An important part of the case that the rise of inequality has been exaggerated
rests on recent research regarding price indexes, both comparisons of inflation for the
rich vs. poor and also aspects of differential price index movements across geographical
regions. Broda and Romalis document both the inflation differential in favor of the poor
and secondarily attempt to calculate the role of Chinese exports in contributing to the
differential. Here we are not concerned with China but rather with their basic finding
about the inflation differential, which results from three factors, (a) a higher
consumption share of non‐durables consumed by the poor than the rich in conjunction
with slower overall inflation rates of non‐durables than of non‐housing services, and (b)
based on bar‐code scanner data for individual items, the prices of the particular set of
non‐durables consumed by the poor has increased slower than the set consumed by the
rich. Their headline result is that over the period 1994‐2005 the inflation rate for non‐
durables consumed by the poor increased at an annual rate of 1.9 percent as compared

Inequality Increase Exaggerated? Page 27
to 2.6 percent for the rich. By their measure this inflation differential completely offsets
their measure of the increase in rich‐poor inequality over the same period.
Unfortunately their data and results do not extend before 1994 into the period of
the 1980s when so much of the increase in the 90‐10 ratio occurred, but it is plausible
that the differential they find extends well before 1994. However, their finding that
there was no further increase of inequality in the inflation‐adjusted 90‐10 ratio after 1994
provides strong support for the basic argument of this paper is that inequality stopped
increasing 15 or more years ago except in the very top income brackets. Further, the
Broda‐Romalis methods do not take explicit account of the stunning Hausman‐Leibtag
(2005) result showing that the arrival of a new Wal‐Mart store reduces food prices by 25
percent. While there is no firm evidence on the income distribution of Wal‐Mart
shoppers, it is reasonable to assume that poor households take more advantage of low
Wal‐Mart prices than rich households, except perhaps in inner‐city areas in some places
like Chicago and New York that Wal‐Mart has not yet been allowed to enter due to
political opposition of local labor unions.
A stunning new data set undermines our previous conclusion (2008) that real
income per capita has increased significantly in superstar bi‐coastal metropolitan areas.
Very recently the Bureau of Economic Analysis has released data on price level
differences across states, and this is the first time that a systematic sete of level
differences has been published (as contrasted to long‐available measures of differences
in CPI growth rates across cities). Without adjustment for price level differences, per‐
capita incomes in Massachusetts and New York are respectively 26.1 percent and 20.0

Inequality Increase Exaggerated? Page 28
percent above the national average. With correction for regional price disparities, these
percentages drop to 10.7 and ‐0.2 percent respectively.
In an important and related piece of research, Moretti (2008) notes that college
graduates disproportionately cluster in metropolitan areas that have a high cost of
housing. He finds that fully two‐thirds of the previously documented increase in the
return to college between 1980 and 2000 vanishes when he corrects for differences in the
cost of living across metropolitan areas. His cross‐area price measures are
comprehensive and ingenious and take account of differences in housing costs, housing
quality (i.e., smaller apartment sizes in New York than St. Louis), and price differences
of non‐housing goods and services (pizza and haircuts are more expensive in New
York).10
Moretti then asks why college graduates sort into expensive cities. He carries out
an empirical analysis that distinguishes between supply and demand factors and
concludes that college graduates move to expensive cities because jobs for college
graduates are increasingly located in those cities, not because they particularly like
living in those cities. His results are tempered by the likelihood that the agglomeration
of college graduates, even though initially driven by demand rather than a shift of
supply, carries with it a set of externalities such as the opening of new restaurants and
shops that cater to people with college‐educated tastes. Further, the amenities of cities
with high shares of college graduates are not just created by the newly arriving 10. The rental cost of an apartment with a given number of bedrooms and bathrooms is obtained from survey evidence, as are the quality attributes of these apartments. Non‐housing costs are estimated from a regression of non‐housing costs on housing costs for a small number of metro areas that have CPI indexes on the level of the cost of lilving.

Inequality Increase Exaggerated? Page 29
graduates, but were already present throughout history as a lure to highly educated
people. Cities like Chicago, New York, and San Francisco have had top‐ranked
symphony orchestras, opera companies, and jazz clubs going back decades, even a
century.
A methodological critique is that Moretti’s methodology falls prey to Laspeyres
index number bias by neglecting substitution between goods. College graduates earn
higher salaries and react to high apartment prices by substituting away from square feet
of living space toward culture, good restaurants, and organized activities with their
peers. As a result, the Moretti analysis inevitably overstates the extent to which the
increase in the college wage premium is offset by cost of living differences among cities.
His estimate is a two‐thirds offset, but substitution could easily reduce this to one‐third.
However, strengthening his basic result is the fact that the Federal tax system is
based on nominal income and thus penalizes those who move to high‐priced locations.
Further several of the popular bicoastal states (New York, Massachusetts, and
California) have relatively high progressive state income tax rates. Another factor
strengthening Moretti’s result is that when college‐educated couples marry and have
children, they tend to move to the suburbs and face long commutes to their highly‐paid
jobs. This disamenity tends to cancel out many of the urban amenities they enjoy when
younger and childless. Qualifications to these arguments include the tax deductability
of mortgage interest, which benefits high income families, and the top‐bracket tax cuts
achieved by Presidents Reagan and Bush II.

Inequality Increase Exaggerated? Page 30
Health Outcomes and Inequality
One of the most surprising discoveries of our previous search through the
inequality literature was the quantitative importance of differences in health outcomes
by education and income group. An important research result of Singh and Siahpush
(2006) revealed that life expectancy in the “least deprived” top‐decile group increased
between 1980 and 2000 by 3.4 years, fully double the 1.7 year increase in life expectancy
of the “most deprived” bottom‐decile group.
Meara, Richards, and Cutler (2008) go further and show that over the same 1980‐
2000 period life expectancy at age 25 grew by 1.6 years for high‐education people and
0.5 years, less than one‐third as much, for low‐education people. They attribute a
substantial part of their findings to differential trends in smoking use among high‐ and
low‐educated groups, with much greater declines in tobacco use among the highly
educated. A second factor that differentiates the high and low education groups is a
growing tendency toward obesity among the low‐education groups.
A more comprehensive study that pulls together much of the previous evidence
has been released recently by Cutler et al. (2008). There is no implication in this research
that increased income inequality causes the disparity of health outcomes, but rather that
differences in educational attainment have separate impacts on relative incomes and
relative life expectancy that go in the same direction. The major influence of
socioeconomic (SES) status on health occurs in childhood, and “once childhood health is
set, the effect of economic resources on health diminishes” (p. 35).

Inequality Increase Exaggerated? Page 31
As in the two studies summarized above, education is a powerful determinant of
health but mainly because of its effect on behaviors like smoking and obesity rather than
its association with access to medical care. An important direction of causation works in
the opposite direction from health to socioeconomic status. “Unhealthy adults earn less,
spend less time in the labor force, and retire earlier” (p. 36). Overall, to the extent that
income inequality rises relative to educational attainment, there is no implication for
health outcomes. Reversing the rise of inequality and reducing the incomes of the rich
would not cause the less educated groups to smoke less and weigh less.
5.. Conclusions Quantitative Evidence The rise of American inequality has been exaggerated in magnitude, and its
impact is now largely in the past. Standard commentary laments the slow growth of
median real household income and concludes that over the past three decades (1979‐
2007) the gap between growth of income and productivity has been 1.46 percent per
year. But this “conventional” gap measure is riddled with measurement and conceptual
inconsistencies. Our “alternative” gap measure grows at only 0.16 percent over the
same period, only one‐tenth as rapidly as the conventional gap, and it does not grow at
all during the 1979‐1995 period when inequality was growing fastest. In fact, we show
that income‐productivity gaps have virtually nothing to do with inequality. The
alternative growth gap is zero when inequality grew fastest before 1995, became

Inequality Increase Exaggerated? Page 32
negative when inequality grew further during 1995‐2000, and was strongly positive in
2000‐07 when inequality decreased.
Previous writers have lamented the absence of any growth in median household
income after 2000. Indeed our preferred measure of median income per person deflated
with the GDP deflator rises at only 0.46 percent per year after 2000 and lags far behind
the robust growth of productivity during this period. But this is not a byproduct of
rising inequality, because mean income actually grew slower than median income after
2000. What happened is that Census measures of real income grew much more slowly
than real GDP after 2000, even though they track real GDP quite closely before 2000.
Why this happened is a measurement puzzle that needs to be investigated further. If the
measurement shortfall of Census income relative to GDP was due to top coding in the
Census data, then the shortfall should have occurred equally before and after the year
2000.
Not only has the increase of inequality been exaggerated, but it has ceased. The
excess growth of mean relative to median income reversed itself after 2000. The income
shares of the top one percent and of CEOs, which had exploded before 2000, went down
and back up with stock market gyrations between 2000 and 2006 but did not rise on
balance. The decline in the U. S. stock market since mid‐2007 is now more severe than in
2000‐02 and has doubtless already reduced the income share of the top one percent and
of CEOs by more than occurred then. To the extent that shifting social norms fostered
the rise in top incomes in the past three decades, as argued by Frydman and Saks (2008),
the attack on executive bonuses and perks by the Obama Administration may lead to a

Inequality Increase Exaggerated? Page 33
decline in top income shares even more than would be expected in light of the stock
market decline.
Other measures suggest that the rise of inequality ceased well before the year
2000. Our examination of labor’s income share shows virtually no change over the past
two decades once an allowance is made for the business cycle. Labor’s share in the first
half of 2009 was virtually the same as in 1983, 1991, and 2001. The 50‐10 ratio in CPS
data is lower now than in 1986, while the 90‐50 ratio has barely budged from a plateau
reached in 1993. The income share of the 90‐95 percentile group has been stable since
1988.
Recent Research Results
The paper provides a mini‐survey of very recent papers that have emerged since
our major survey (Gordon and Dew‐Becker, 2008); these either question long‐standing
hypotheses in the inequality literature, support our theme that the rise of inequality had
been exaggerated, or both. The hypothesis of skill‐biased technical change (SBTC) as an
explanation of rising inequality has a hard time coping with the data when expressed in
terms of two dimensions of skill. Autor and co‐authors (2006, 2008) have provided a
convincing three‐way polarization hypothesis that explains a hollowing‐out of wages
and employment opportunities in a middle occupational group where skills can be
outsourced to machines and to foreign workers. This seems consistent with the erosion
of incomes in the middle relative to the top and bottom; the 90‐50 ratio has increased
steadily while the 50‐10 ratio has declined since the late 1980s.

Inequality Increase Exaggerated? Page 34
To explain the rise in the income share of the top one percent, two hypotheses
seem essential, even though at first glance they appear to be in conflict. CEO pay is
determined by peers, not by the market, giving support to the managerial power
hypothesis. But the clear correlation of CEO pay premia with the stock market, together
with separate evidence on the higher share of stock options in CEO pay, support a
market‐driven view that CEO pay responds to market capitalization. However the
work of Frydman and Saks (2008) cautions that this connection only exists in the period
since the mid‐1970s and was mysteriously absent between 1936 and 1976. They argue
that this profound change in behavior reflects a shift in social norms. This emphasis on
social norms seems consistent with the differences in CEO pay multiples between the
U. S. and Europe. It also heralds a possible future decline in CEO pay multiples not only
as a result of the 2007‐09 stock market collapse but also due to newly intense scrutiny of
executive compensation practices emerging from Washington.
The theme of previous exaggeration of the rise of inequality is supported by the
recent research of Moretti (2008), who shows that the increase in the wage premium of
college over high school has been overstated by half to two‐thirds due to higher housing
price inflation in metropolitan areas where college graduates congregate, although his
work needs to be qualified to take account of the ability of college graduates living in
high‐price cities to substitute away from square feet of living space to urban amenities
like free concerts and opportunities to socialize with like‐minded highly educated
people. Moretti’s work is further supported by the fact that progressive taxes,
particularly in bicoastal states, hit the high nominal incomes of college graduates over

Inequality Increase Exaggerated? Page 35
and above the bite they pay in a higher cost of living. Newly released cross‐state cost of
living data yield the complementary conclusion that the excess of per‐capita income in
New York state over the national average vanishes when translated from nominal to real
terms and that in Massachusetts falls by half.
The most significant ongoing increase of American inequality takes the form of
faster growth in life expectancy for the top 20 percent of the income distribution than for
the bottom 20 percent. Yet even here the interpretation of Cutler et al. shifts the
emphasis from unfair gains by the rich at the expense of the poor, to the role of low
educational attainment in causing both poor economic outcomes and poor health
outcomes at the bottom of the distribution. The toll taken by smoking and obesity
among the low‐income quantiles reflects behavioral choices tied to low education and is
in a different category than most other causes of rising inequality, just as behavior drives
divorce as a factor that reduces income per household relative to income per person.
Inequality Increase Exaggerated? Page 36
REFERENCES
Autor, David, Katz, Lawrence F., and Kearney, Melissa S. (2006). “The Polarization of the U. S. Labor Market,” American Economic Review 96:2 (May), 189‐94.
Autor, David, Katz, Lawrence F., and Kearney, Melissa S. (2008). “Trends in U.S. Wage
Inequality: Revising the Revisionists,” Review of Economics and Statistics 90:2 (May), 300‐23.
Autor, David, and Dorn, David (2008). “Inequality and Specialization: The Growth of
Low‐Skill Service Jobs in the4 United States,” draft paper, July. Broda, Christian, and Romalis, John (2008). “Inequality and Prices: Does China Benefit
the Poor in America?” Working Paper, University of Chicago. Burkhauser, Richard V., Feng, Shuaizhang, Jenkins, Stephen P., and Larrimore, Jeff
(2008). “Estimating Trends in US Income Inequality Using the Current Population Survey: The Importance of Controlling for Censoring,” NBER Working Paper 14247, August.
Burkhauser, Richard V., Feng, Shuaizhang, and Jenkins, Stephen P. (2009a). “Using the
P90/P10 Index to Measure U. S. Inequality Trends with Current Population Survey Data: A View from inside the Census Bureau Vaults,” Review of Income and Wealth 50:1 (March), 166‐85.
Burkhauser, Richard V., Feng, Shuaizhang, Jenkins, Stephen P., and Larrimore, Jeff
(2009b). “Recent Trends in Top Income Shares in the USA: Reconciling Estimates from March CPS and IRS Tax Return Data,” NBER Working Paper, forthcoming.
Cutler, David M., and Katz, Lawrence F. (1992). “Macroeconomic Performance and the
Disadvantaged,” Brookings Papers on Economic Activity no. 1, 1‐61. Cutler, David M., Lleras‐Muney, Adriana, and Vogl, Tom (2008). “Socioeconomic Status
and Health: Dimensions and Mechanisms,” NBER Working Paper 14333, September.
DeNavas‐Walt, Carmen, Proctor, Bernadette D., and Smith, Jessica C. (2008). Income,
Poverty, and Health Insurance Coverage in the United States: 2007. Washington: U. S. Census Bureau, August. This can be accessed at: www.census.gov/prod/2008pubs/p60‐235.pdf.

Inequality Increase Exaggerated? Page 37
Dew‐Becker, Ian, and Gordon, Robert J. (2005). “Where Did the Productivity Growth Go? Inflation Dynamics and the Distribution of Income,” Brookings Papers on Economic Activity 36:2, 67‐127.
Frydman, Carola and Saks, Raven E. (2008). “Executive Compensation: A New View
from a Long‐term Perspective, 1936‐2005,” NBER Working Paper 14145, June. Gabaix, Xavier and Lanider, Augustin (2008). “Why Has CEO Pay Increased So Much?”
Quarterly Journal of Economics 123:1, 49‐100. Goldin, Claudia, and Katz, Lawrence F. (2008). The Race Between Education and
Technology. Cambridge: Harvard University Press. Gordon, Robert J. (2003). “Exploding Productivity Growth: Context, Causes, and
Implications,” Brookings Papers on Economic Activity 34:2, 207‐79. Gordon, Robert J. and Dew‐Becker, Ian (2007). “Selected Issues in the Rise of Income
Inequality,” Brookings Papers on Economic Activity 38:2, 169‐92. Gordon, Robert J. and Dew‐Becker, Ian (2008). “Controversies About the Rise of
American Inequality: A Survey,” NBER Working Paper 13982, April. Hall, Brian, and Liebman, Jeffrey (2000). “The Taxation of Executive Compensation,”
NBER Working Paper 7596, March. Jarque, Arantxa (2009). “CEO Compensation Trends, Market Changes, and Regulation,”
Federal Reserve Bank of Richmond Economic Quarterly 94(3), Summer, 265‐300. Kaplan, Steven N. and Joshua D. Rauh (2007). “Wall Street and Main Street: What
Contributes to the Rise in the Highest Incomes?” Center for Research in Security Prices (CRSP), University of Chicago, Working Paper 615, July.
Krämer, Hagen (2008). “Developments and Determinants of the Labor Share of Income
in Selected Advanced Economies,” Karlsruhe University of Applied Sciences, October. See http://www.boeckler.de/pdf/v_2008_10_31_kraemer.pdf.
Lemieux, Thomas, MacLeod, W. Bentley, and Parent, Daniel (2009). “Performance Pay
and Wage Inequality,” Quarterly Journal of Economics 124 (1), 1‐49. Leonhardt, David, and Geraldine Fabrikant (2009). “After 30‐Year Run, Rise of the
Super‐Rich Hits a Sobering Wall,” New York Times, August 21, p. A1, A16.

Inequality Increase Exaggerated? Page 38
Meara, Ellen R., Richards, Seth, and Cutler, David M. (2008). “The Gap Gets Bigger: Changes in Mortality and Life Expectancy, by Education, 1981‐2000,” Social Determinants 27:2, 350‐60.
Mishel, Lawrence, Bernstein, Jared, and Allegretto, Sylvia (2005). The State of Working
America 2004/2005. Cornell University Press. Mishel, Lawrence, Bernstein, Jared, and Shierholz, Heidi (2009). The State of Working
America 2008/2009. ILR Press, an imprint of Cornell University Press. Moretti, Enrico (2008). “Real Wage Inequality,” NBER Working Paper 14370,
September. Philippon, Thomas, and Reshef, Ariell (2009). “Wages and Human Capital in the U. S.
Financial Industry,” NBER Working Paper 14644, January. Piketty, Thomas and Saez, Emmanuel (2003). “Income Inequality in the United States,
1913‐1998,” Quarterly Journal of Economics 118, 1‐39. Singh, Gopal K., and Siahpush, Mohammed (2006). “Widening Socioeconomic
Inequalities in U. S. Life Expectancy, 1980‐2000,” International Journal of Epidemiology, advance access published May 9.

Inequality Increase Exaggerated? Page 39
Data Appendix: Source Notes for Tables and Figures
Table 1, by row number 1, 2 Denavas‐Walt et al. (2008), Table A‐1, p. 31. 4, 5 U. S. Census Bureau, Income / Historical Income Tables – People, Table P‐4, found at http://www.census.gov/hhes/www/income/histinc/incpertoc.html 7 Denavas‐Walt et al. (2008), unnumbered table on p. 30. 8. 9 www.bea.gov, NIPA table 1.1.9, lines 1 and 2. 11 Real GDP divided by total‐economy hours of work, an unpublished series
obtained from the BLS. 12 www.bls.gov. 17 Total Economy Hours: Same source as line 10. Population: Population.
Statistical Abstract of the U. S. 2009, Table 2, p. 7 20 www.bea.gov, NIPA table 1.10.
Figures, by Figure number 1. NIPA Table 1.10, where the denominator is net domestic factor income, which is equal to employee compensation plus operating surplus. The labor share of proprietor’s income is the average value of the share shown in Mishel, Bernstein, and Allegretto (2005, table 1.24, p. 95). The raw values of the line plotted in Figure 1 exhibit a one‐quarter spike in 2005:Q3 due to the depressing effect of the Katrina disaster on the denominator; this spike is eliminated by substituting for the actual value of 2005:Q3 an interpolation between the values of 2005:Q2 and 2005:Q4. 2. A ten‐year trailing moving average of the two series plotted in Figure 1. 3. Author’s calculations from data provided by Economic Policy Institute, updated for 2006‐07 from charts 3K, 3L, and 3M in Mishel et al. (2009). 4. Piketty‐Saez (2003), data updated to 2006, downloaded from http://elsa.berkeley.edu/~saez/. This is a replotted and relabelled version of Figure 9 from the Saez web site. Wage income includes bonuses as well as profits from exercised stock options.

Inequality Increase Exaggerated? Page 40
5. Same source as Figure 4, this is “Figure 4 – new” from the Saez web site. 6. Same source as Figure 4, new calculations of CEO ratios from the sheet “data‐Fig11” that gives the raw income numbers rather than the ratios. 7. Same source as Figure 4, this is “Figure 12” from the Saez web site. Sources of data for France and the U. K. are given in the notes to that figure. In all three countries, income is defined as before individual taxes and excludes capital gains.
1979- 1979- 1995- 1995- 2000-2007 1995 2007 2000 2007(1) (2) (3) (4) (5)
1. Census Median Household Income 0.49 0.31 0.73 1.87 -0.092. Census Mean Household Income 0.93 0.96 0.90 2.50 -0.253. Mean minus Median (line 2 minus line 1) 0.44 0.65 0.17 0.63 -0.16
4. Census Median Income per Person (15+) 1.15 1.00 1.34 2.68 0.395. Census Mean Income per Person (15+) 1.25 1.21 1.29 2.90 -0.056. Mean minus Median (line 5 minus line 4) 0.09 0.21 -0.05 0.22 -0.44
7. Deflator Used by Census (CPI-RS) 3.50 4.24 2.51 2.30 2.658. PCE Deflator 3.27 4.16 2.09 1.76 2.329. GDP Deflator 3.15 3.87 2.19 1.64 2.58
10. Median Income per Person (15+) with GDP deflator 1.50 1.37 1.65 3.34 0.4611. Total Economy Output per Hour 1.66 1.28 2.17 2.30 2.0812. Nonfarm Private Business Sector Output per Hour 1.95 1.43 2.64 2.71 2.59
13. Conventional Income-Productivity Gap (line 12 minus line 1) 1.46 1.12 1.91 0.84 2.5214. Alternative Income-Productivity Gap (line 11 minus line 10) 0.16 -0.09 0.52 -1.04 1.6215. Alternative Gap as percent of Conventional Gap (line 13 / line 12) 11.0 -8.0 26.9 -123.8 76.0
Memo Items:16. Mean Income per Person with GDP Deflator 1.60 1.58 1.60 3.56 0.0217. Hours per Person 0.20 0.41 -0.08 0.76 -0.6918. Output per Person (line 11 plus line 17) 1.86 1.69 2.09 3.06 1.3919. Gap of Income Growth minus Output Growth (line 16 minus line 18) -0.26 -0.11 -0.49 0.50 -1.37 20. Employee Compensation minus GDI Growth -0.23 -0.27 -0.18 0.14 -0.4121. Share of Income Gap Explained by Change in Labor's Share 88.5 245.5 37.1 28.0 29.9
Table 1Annual Growth Rates, Median and Mean Income and Productivity, Selected Intervals, 1979-2007

Figure 1. Income Share of Employee Compensation and 40 Percent of Proprietor's Income in Net Domestic Factor Income,
1929-2009
65
70
75
80
1929 1939 1949 1959 1969 1979 1989 1999 2009
Perc
ent

Figure 2. Ten-Year Moving Average of Income Share of Employee Compensation and 40 Percent of Proprietor's Income
in Net Domestic Factor Income, 1938-2009
65
70
75
80
1938 1948 1958 1968 1978 1988 1998 2008
Perc
ent

Figure 3. CPS Percentile Income Ratios for Both Men and Women,Log Percent Ratio, 1979 = 0, 1973-2007
-10
-5
0
5
10
15
20
25
30
1973 1978 1983 1988 1993 1998 2003
Perc
ent
90-10
50-10
90-50

Figure 4. Wage Income Shares of Top 1 Percent, Percentiles 96-99, and Percentiles 91-95, 1927-2006
0
2
4
6
8
10
12
14
1927 1932 1937 1942 1947 1952 1957 1962 1967 1972 1977 1982 1987 1992 1997 2002
Perc
ent
Top 1 Percent
Percentiles 96-99
Percentiles 91-95

Figure 5. The Top 0.1 Percent Income Share and its Composition, 1916-2005
0%
1%
2%
3%
4%
5%
6%
7%
8%
9%
10%19
16
1921
1926
1931
1936
1941
1946
1951
1956
1961
1966
1971
1976
1981
1986
1991
1996
2001
Salaries Business Income
Capital Income Capital Gains
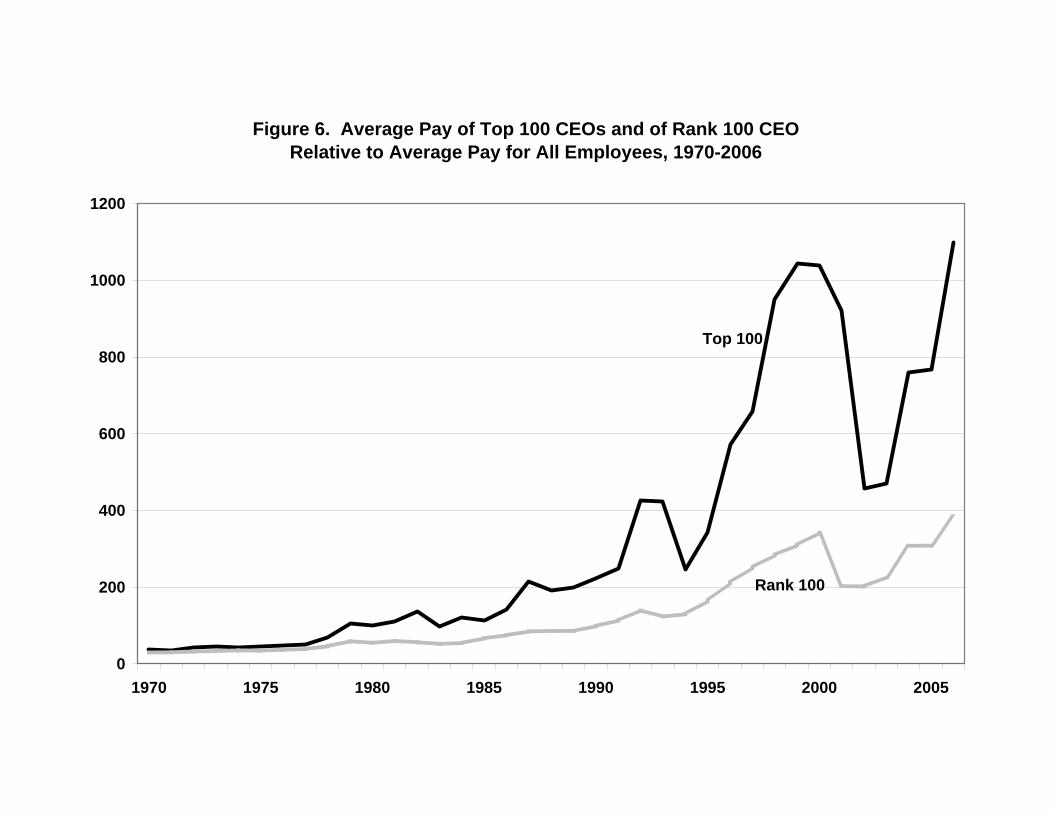
Figure 6. Average Pay of Top 100 CEOs and of Rank 100 CEORelative to Average Pay for All Employees, 1970-2006
0
200
400
600
800
1000
1200
1970 1975 1980 1985 1990 1995 2000 2005
Top 100
Rank 100

Figure 7. Top 0.1% Income Shares in the U.S., France, and the U.K.,1913-2006
0%
1%
2%
3%
4%
5%
6%
7%
8%
9%
10%
11%
12%
1915
1920
1925
1930
1935
1940
1945
1950
1955
1960
1965
1970
1975
1980
1985
1990
1995
2000
2005
shar
e (in
%)
France
U.K.
U. S.