mission-critical networking and situation-awarenesscnl.gmu.edu/gmu_mcn_talk_moayeri.pdf · audio...
TRANSCRIPT
Mission-Critical Networking and Situation-Awareness
Nader Moayeri
Presented at George Mason University September 26, 2008

ContributorsJ. BragaA. El-KikC. GentileJ. GeissbuehlerD. KasparL. KleinBerndtL. MillerJ. PerezM. RefaeiK. SayrafianM. SouryalA. WapfH. You

Introduction / TerminologyMission-Critical Operations–
Military
–
Emergency Response–
Search and Rescue
•
Urban•
Mine Incidents
Situation-Awareness–
Wireless Sensor Networks
•
Sensing the Environment•
Physiological Monitoring of Workers
–
Indoor Localization and Tracking

Presentation OutlineReal-Time Deployment of Multihop Relays (“Breadcrumbs”) for Communication Range ExtensionAn Overview of Indoor Localization Research at NIST

Real-Time Deployment of Multihop Relays (“Breadcrumbs”)
for Communication Range Extension
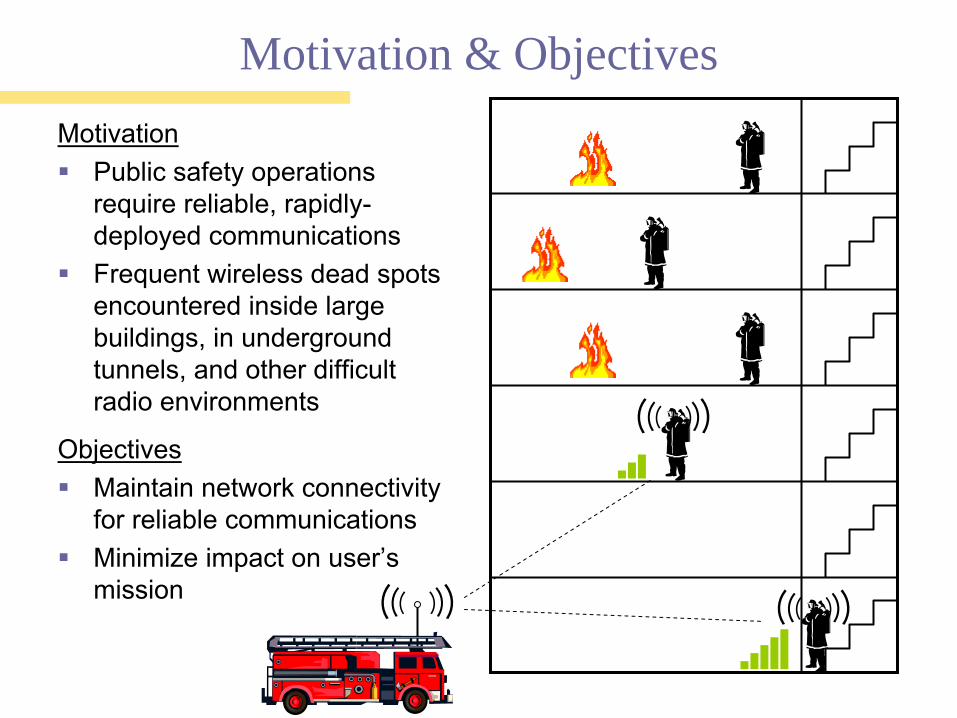
Motivation & ObjectivesMotivation
Public safety operations require reliable, rapidly-deployed communicationsFrequent wireless dead spots encountered inside large buildings, in underground tunnels, and other difficult radio environments
ObjectivesMaintain network connectivity for reliable communicationsMinimize impact on user’s mission
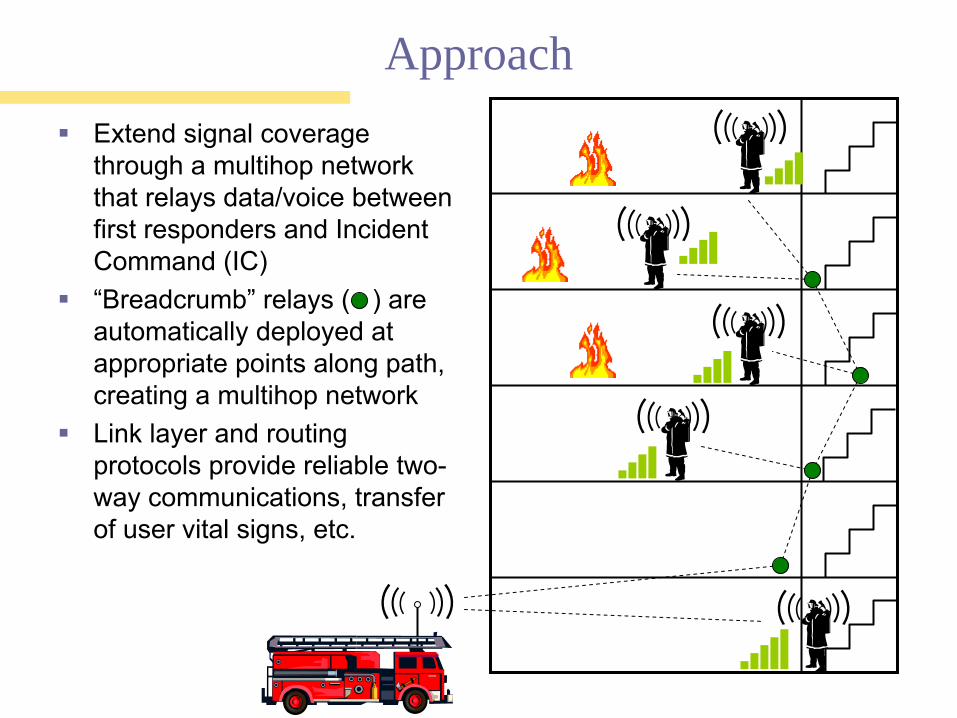
ApproachExtend signal coverage through a multihop network that relays data/voice between first responders and Incident Command (IC)“Breadcrumb” relays ( ) are automatically deployed at appropriate points along path, creating a multihop networkLink layer and routing protocols provide reliable two-way communications, transfer of user vital signs, etc.

Technical ChallengesAutomating the deployment process…When/where to deploy relays?
Reliable end-to-end transmission»
Link-quality-sensitive route metric»
Link and network layer retransmission
Adapting to changes in link quality and topology»
Timely route updates»
Power control
Incident Command Link
Measurement

Questions & OverviewQuestions to Address
How to measure the quality of a wireless link reliably and efficiently? (in order to determine when to deploy a new relay)What criteria should be used to trigger deployment?Is real-time on-the-fly deployment feasible? (Will it result in well-connected networks capable of reliable communications?)
What FollowsApproach to real-time deploymentOverview of 900 MHz and 2.4 GHz prototypesTest results of 2.4 GHz prototypeNext steps
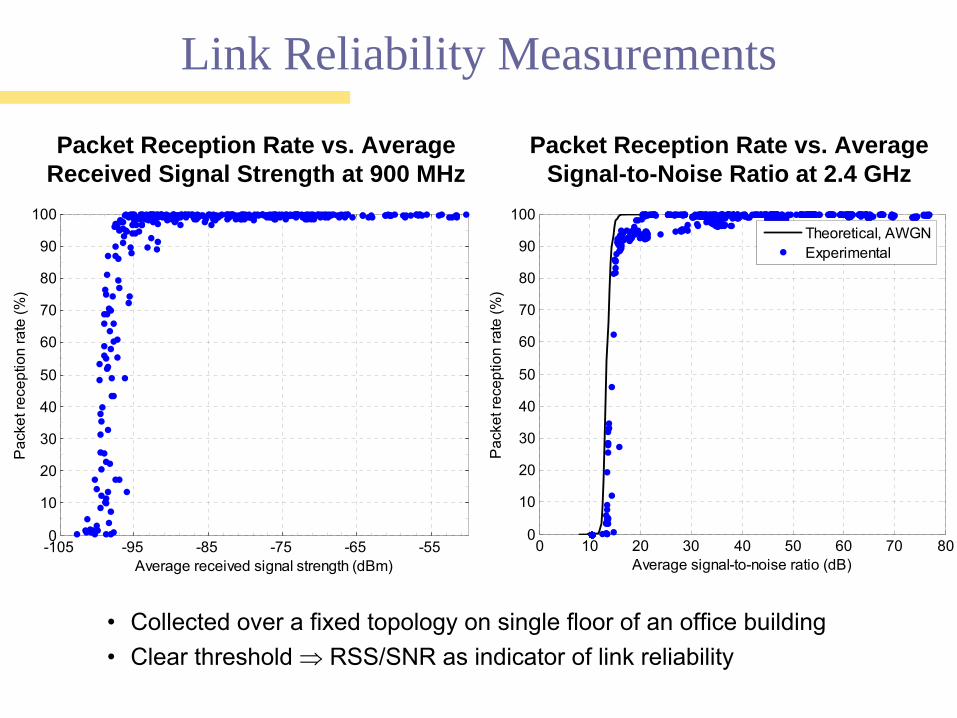
Link Reliability Measurements
-105 -95 -85 -75 -65 -550
10
20
30
40
50
60
70
80
90
100
Average received signal strength (dBm)
Pac
ket r
ecep
tion
rate
(%)
0 10 20 30 40 50 60 70 800
10
20
30
40
50
60
70
80
90
100
Pac
ket r
ecep
tion
rate
(%)
Average signal-to-noise ratio (dB)
Theoretical, AWGNExperimental
•
Collected over a fixed topology on single floor of an office building•
Clear threshold ⇒ RSS/SNR as indicator of link reliability
Packet Reception Rate vs. Average Received Signal Strength at 900 MHz
Packet Reception Rate vs. Average Signal-to-Noise Ratio at 2.4 GHz
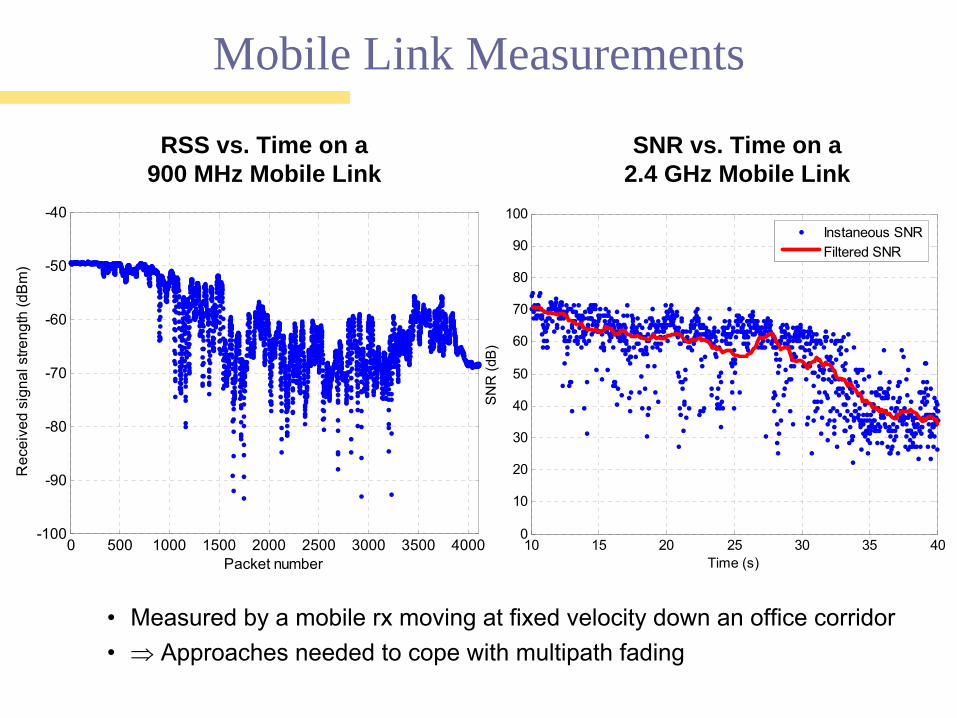
Mobile Link Measurements
•
Measured by a mobile rx
moving at fixed velocity down an office corridor•
⇒ Approaches needed to cope with multipath fading
SNR vs. Time on a 2.4 GHz Mobile Link
0 500 1000 1500 2000 2500 3000 3500 4000-100
-90
-80
-70
-60
-50
-40
Packet number
Rec
eive
d si
gnal
stre
ngth
(dB
m)
RSS vs. Time on a 900 MHz Mobile Link
10 15 20 25 30 35 400
10
20
30
40
50
60
70
80
90
100
Time (s)
SN
R (d
B)
Instaneous SNRFiltered SNR
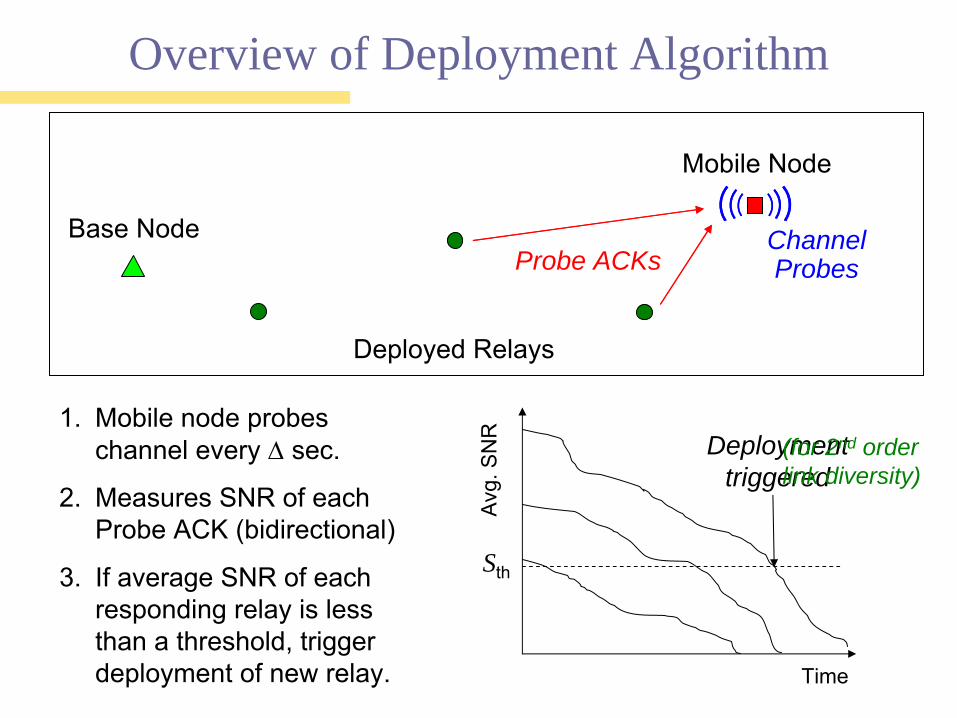
Overview of Deployment Algorithm
Probe ACKs
Deployed Relays
Base Node
Mobile Node
Channel Probes
1.
Mobile node probes channel every Δ
sec.
2.
Measures SNR of each Probe ACK (bidirectional)
3.
If average SNR of each responding relay is less than a threshold, trigger deployment of new relay.
Deployment triggered
Avg.
SN
R
Time
Sth
(for 2nd order link diversity)

900 MHz Experimental PlatformCrossbow MICA2 Mote (MPR400CB)–
ChipCon CC1000 transceiver at 916 MHz–
8-bit ATMega128L 7.37 MHz processor–
128 kB program memory, 4 kB SRAM–
Powered by 2 AA batteries–
5 dBm max. RF power
Multi-Sensor Module (MTS310)–
Light, Temperature –
Acoustic, Sounder –
2-Axis Accelerometer –
2-Axis Magnetometer

900 MHz Prototype SystemApplications
Continuous monitoring of Mobile Node’s sensorsTwo-way text messaging between Base and MobileDisplay approximate location of Mobile Node–
using RFID location tags
Technical FeaturesRapid link measurement w/ adaptive probingReal-time deployment w/ local placement assistanceModified DSDV routing with link quality metricPower control
Base Node Mobile Node
Relays

2.4 GHz Prototype Breadcrumb
Gumstix
motherboard400 MHz Linux computer16 MB Flash64 MB SDRAM8 cm × 2 cm
Lithium polymer battery & charger
Wifistix
expansion boardIEEE 802.11b/gOpen source driver8 cm × 2 cm

Deployment MonitorNext breadcrumb to be deployed continuously probes and measures link quality to its neighbors.
Deployment monitor on mobile display:
When that breadcrumb is deployed, next breadcrumb is set to probe.

2.4 GHz Prototype System FeaturesApplications
Two-way voice between Base and Mobile NodeContinuous monitoring of Mobile Node’s sensorsDisplay approximate location of Mobile Node–
using RFID location tags
Video
Technical FeaturesRapid link measurementReal-time deployment w/ local placement assistanceIEEE 802.11 PHY/MACOLSR routing w/ ETX metricIP support

Test in NIST AMLMarch 24 & 26, 2008Buildings 217, 218, and 219

Deployment Example8 breadcrumbs deployed
IEEE 802.11 2-Mbps data rate
OLSR–
HELLO period 0.5 s
During deployment:–
28 kbps full-duplex VoIP call between IC and FR
–
Ping every second
After deployment:–
10 MB file transfer–
Audio recording
12
11 10
9
8
G
B
SB
5
6
7
Bldg 219-SB
Bldg 218-SB
Bldg 217 Stairwell 3
FR
IC
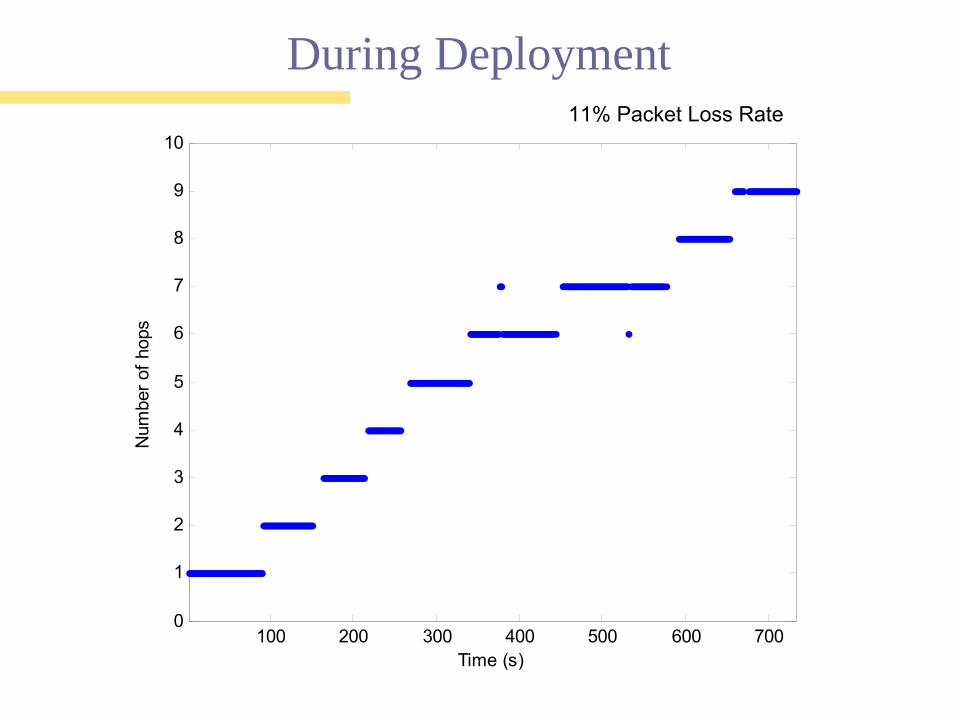
During Deployment
100 200 300 400 500 600 7000
1
2
3
4
5
6
7
8
9
10
Time (s)
Num
ber o
f hop
s11% Packet Loss Rate

During Deployment: Packet Losses
100 200 300 400 500 600 7000
1
2
3
4
5
6
7
8
9
10
Time (s)
Num
ber o
f hop
s11% Packet Loss Rate

During Deployment: Round-Trip Time
0 1 2 3 4 5 6 7 8 9 10-20
0
20
40
60
80
100
Number of hops
Ave
rage
/med
ian
roun
d-tri
p tim
e (m
s)
AverageMedian

File Transfer9-hop route
10 MB file
Transmission time: 8 min 3 sAverage throughput: 166 kbps
–
Peak throughput: 232 kbps
Simultaneous ping:–
Average RTT: 173 ms–
Packet loss rate: 36%
12
11 10
9
8
G
B
SB
5
6
7
Bldg 219-SB
Bldg 218-SB
Bldg 217 Stairwell 3
FR
IC

12
11 10
9
8
G
B
SB
5
6
7
AudioReading of Gettysburg AddressLinphone VoIP connection with 16 kHz Speex codec at 28 kbps
Bldg 219-SB
Bldg 218-SB
Bldg 217 Stairwell 3
180 200 220 240 260 280 300
6
7
8
9
Time (s)
Num
ber o
f hop
s
29/41/55
35/54/100
40/58/94
Min/Avg/Max RTTs
(ms)
Simultaneous Ping Results
orig recv
IC

Ongoing and Future WorkSystematic study of link quality measurement techniques
Routing protocol improvements–
Smoother route transitions
–
Incorporate new link quality metrics
Feasibility of image/video over deployed multihop network
Integration of Inertial Navigation Unit–
To provide estimate of user’s location between RFID tags
Network simulation of cognitive radio breadcrumbs

Publications"Interference avoidance in rapidly deployed wireless ad hoc incident area networks," M. T. Refaei, M. R. Souryal, and N. Moayeri, in Proc. 2nd IEEE Workshop on Mission Critical Networking (MCN), April 2008.
"Real-time deployment of multihop relays for range extension," M. R. Souryal, J. Geissbuehler, L. E. Miller, and N. Moayeri, in Proc. ACM MobiSys, June 2007.
"Link assessment in an indoor 802.11 network," M. R. Souryal, L.Klein-Berndt, L. E. Miller, and N. Moayeri, in Proc. IEEE WCNC, April 2006.
"Measuring indoor mobile wireless link quality," A. Wapf and M. R. Souryal, submitted to IEEE Globecom 2008.
An Overview of Indoor Localization Research at NIST

Program Scope
Performance evaluation of various ranging, direction estimation, and localization techniques through simulations and prototypingEvaluation of COTS localization productsParticipation in IEEE & NFPA standardization activitiesBasic research and development of new localization techniques

NIST Location System
Developed in 2003.Works based on Received Signal Strength (RSS) measurements and IEEE 802.11b technology.Locates mobile nodes within 2 meters in 80% of queries.Software available for download at: www.antd.nist.gov/wctg/NISTlocation/locationdemo.htm
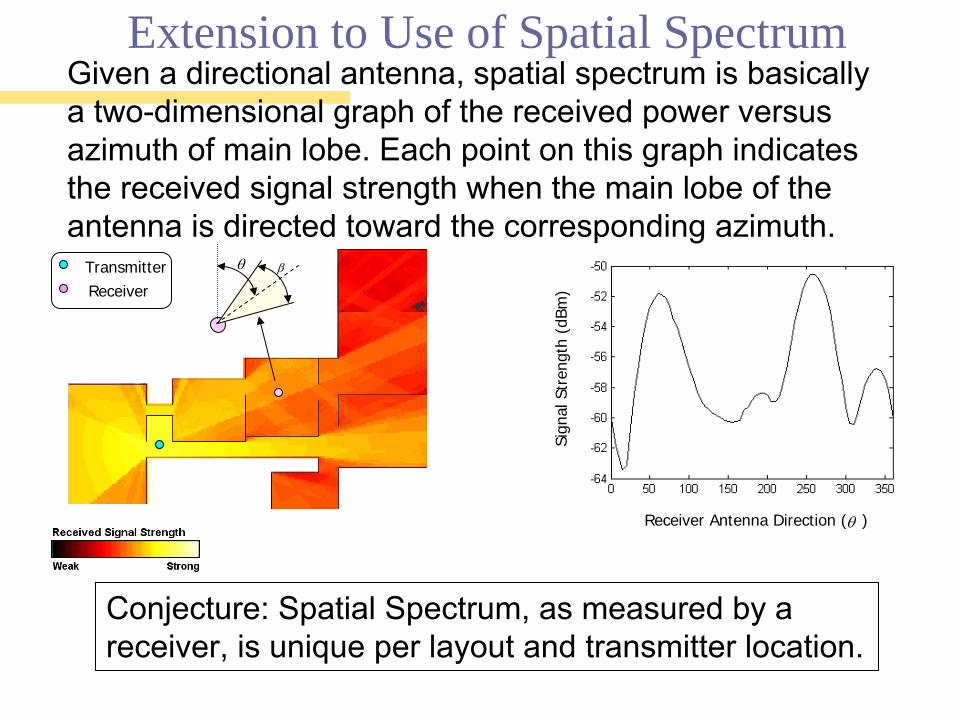
Extension to Use of Spatial Spectrum
Conjecture: Spatial Spectrum, as measured by a receiver, is unique per layout and transmitter location.
Given a directional antenna, spatial spectrum is basically a two-dimensional graph of the received power versus azimuth of main lobe. Each point on this graph indicates the received signal strength when the main lobe of the antenna is directed toward the corresponding azimuth.
Produced By:Kamran Sayrafian-Pour
Sign
al S
tren
gth
(dBm
)
Receiver Antenna Direction ( )θ
Produced By:Kamran Sayrafian-Pour
TransmitterReceiver
θ β
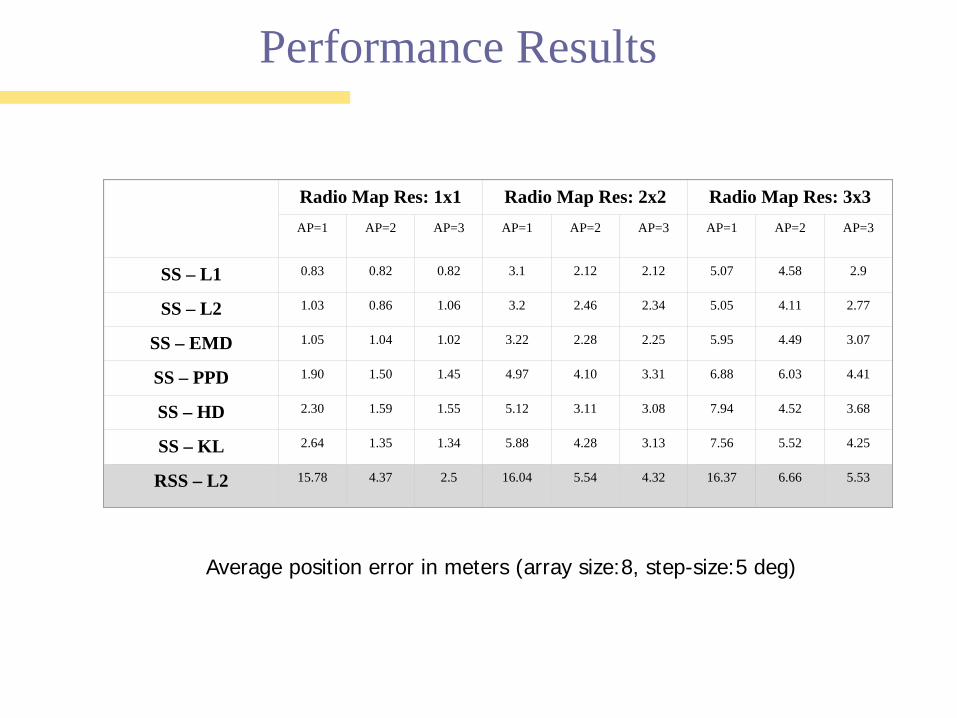
Performance Results
Radio Map Res: 1x1 Radio Map Res: 2x2 Radio Map Res: 3x3AP=1 AP=2 AP=3 AP=1 AP=2 AP=3 AP=1 AP=2 AP=3
SS – L1 0.83 0.82 0.82 3.1 2.12 2.12 5.07 4.58 2.9
SS – L2 1.03 0.86 1.06 3.2 2.46 2.34 5.05 4.11 2.77
SS – EMD 1.05 1.04 1.02 3.22 2.28 2.25 5.95 4.49 3.07
SS – PPD 1.90 1.50 1.45 4.97 4.10 3.31 6.88 6.03 4.41
SS – HD 2.30 1.59 1.55 5.12 3.11 3.08 7.94 4.52 3.68
SS – KL 2.64 1.35 1.34 5.88 4.28 3.13 7.56 5.52 4.25
RSS – L2 15.78 4.37 2.5 16.04 5.54 4.32 16.37 6.66 5.53
Average position error in meters (array size:8, step-size:5 deg)

Localization Using Relative Signal StrengthRelative ordering of the received signal strengths from several sensors located inside a building can be used to identify the location of a mobile. This approach potentially provides better performance with imperfect layout information or noisy signal strength measurements.
Number of Reference Nodes
4 6 8 10 12 14
0.5
1.0
1.5
2.0
2.5
16Abso
lute
Err
or in
the
Est
imat
ed P
ositi
on

Carrier Frequency andAntenna Characteristics
Ray TracingTool
Floor LayoutDielectric Properties
Transmitter & ReceiverLocations
Multipath Profile ofthe Received Signal Parameter
Estimation(e.g., TOA, AOA)
Estimated Range / AOA
PerformanceEvaluation
Ranging / AOAPerformance
Noise / Interference
Simulation Testbed
of an RF-Based IndoorLocalization Systems Using a Ray-Tracing Tool
Given a specific building layout and a transmitter location, a ray-tracing tool predicts the multipath profile of the channel at any given point. A simulation testbed
as shown below is
used to evaluate the performance of different ranging/AOA algorithms that are used in a localization process.

Test Scenarios
TX
RX
TX
RX
TX
RX
TX
RX
TX
RX
In-RoomIn-Corridor
Corridor-to-CorridorRoom-to-Room Corridor-to-Room
Multiple Test scenarios have been chosen to represent various canonical propagation conditions that normally occur in indoor environments.
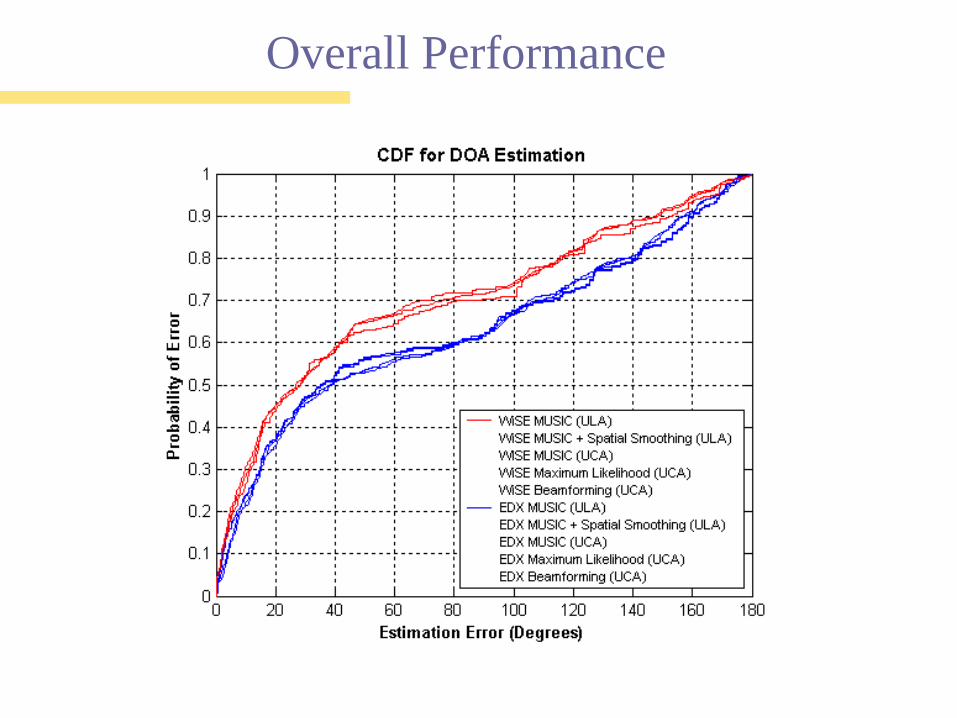
Overall Performance

Error w.r.t. the Strongest Ray

Range Error (m)
Scenario 1Scenario 2
Scenario 6
Scenario 4Scenario 5
Scenario 3Bandwidth (MHz) Center frequency (GHz)
NoiseAntenna height (m)
Nominal Parameters:BW = {0.05, 0.1, 0.2, 0.5, 1} GHz
Fc= {0.6, 2.4, 5} GHzNoise = {No, Moderate, High}Antenna height = {0.2, 1.8} m

Can TOA-Based Localization Meet First Responders’ Expectations?
TX-RX Distance (m)
Range Error (m)
Test Parameters:BW = {0.05, 0.1, 0.2, 0.5, 1} GHz
Fc= {0.6, 2.4, 5} GHzNoise = {No, Moderate, High}Antenna height = {0.2, 1.8} m

Evaluation of COTS Products
•
Evaluated three UWB ranging/localization systems:–
Multispectral Solutions, Inc. (MSSI) Pal650 System–
MSSI ranger designed and developed for CERDEC–
Time Domain, Inc. PulseON
P210 Radio System•
Evaluations were done in four NIST buildings using many deployment scenarios.

Overview of UWB Ranging•
UWB cited as most promising technology for precision location systems (cms
error)•
A standardization effort is completed through the IEEE 802.15.4a
Task Group incorporating ranging into their UWB radio•
Several companies (MSSI, Time Domain, Aether
Wire & Location) have delivered products with precision location and ranging capabilities for indoors
•
The scope of our work is to push UWB ranging to the limit and conduct an extensive measurement campaign to characterize its performance
–
1 W power emission–
6 GHz bandwidth–
150 dB dynamic range•
Open questions: How does UWB ranging perform . . .. . . as a function of wall material?. . . at long ranges up to 45 meters?. . . as a function of bandwidth?. . . as a function of center frequency?

UWB Ranging Measurement System•
Time-domain measurements:•
Tx
emits a UWB pulse•
Rx measures received pulses which together form the channel impulse response
•
Thresholding
determines first arrival of the direct path
•
Frequency-domain measurements:•
Tx
emits a series of synchronized tones
•
Rx measures the amplitude and phase shift of each which together form the channel frequency response
impulse response recovered through the IDFT
Gives flexibility to vary bandwidth and center frequency of UWB pulse

Measurement Campaign
Building layout of NIST North Building:–
Solid points indicate the varying positions of the TX
–
Hollow points indicate the varying positions of the RX
–
In the test with the longest range, the signal must traverse 12 walls in the direct path
Testing in four buildings with uniform interior walls allows gauging performance according to construction material.50 experiments conducted in each building on our NIST campus.

Results: Line-of-SightNIST North, fc
= 5 GHz
•
There is no apparent correlation between range error and ground-truth range•
The average range error decreases with increasing bandwidth•
The average range error decreases at a diminishing rate•
The average range error at B = 6 GHz is 6 cm throughout all four
buildings
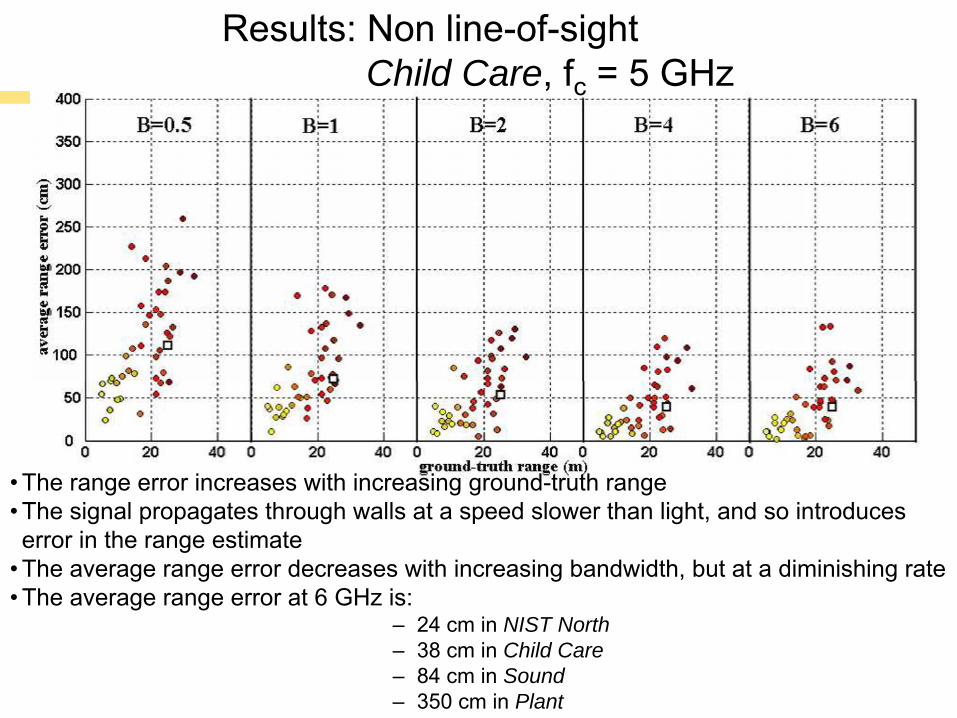
Results: Non line-of-sightChild Care, fc
= 5 GHz
•
The range error increases with increasing ground-truth range•
The signal propagates through walls at a speed slower than light, and so introduces error in the range estimate
•
The average range error decreases with increasing bandwidth, but
at a diminishing rate•
The average range error at 6 GHz is:–
24 cm in NIST North–
38 cm in Child Care–
84 cm in Sound–
350 cm in Plant

Results: Non line-of sightSound, B = 1 GHz
•
The effects of center frequency are more pronounced in cinder block than other materials tested
•
The average range error increases 30 cm from fc
=3 GHz to fc
=7GHz (25%)•
Similar increase in average range error at B = 2 GHz and B = 4 GHz in cinderblock•
Increases of about 5 cm in sheet rock and 10 cm in plaster

Conclusions
•
In LOS conditions, the UWB ranging system has 6 cm average error
in all four buildings•
In NLOS conditions, the UWB ranging system has:–
1% average error in sheet rock–
2% average error in plaster–
4% average error in cinder block–
10% average error in metal up to 15 m•
The range error is significantly reduced in translating to position error through triangulation
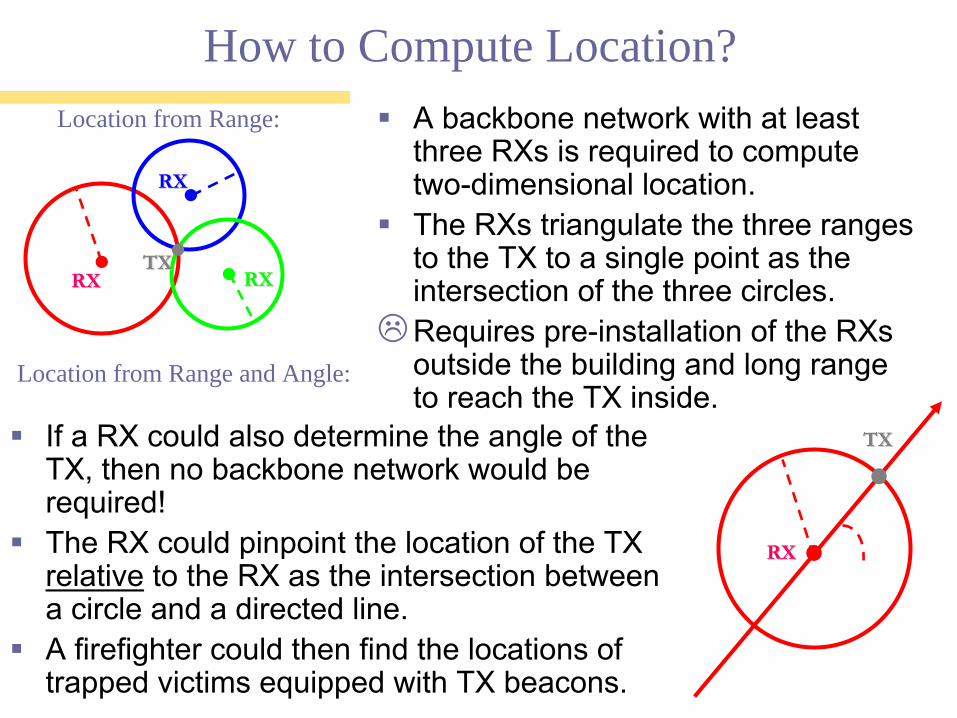
How to Compute Location?A backbone network with at least three RXs is required to compute two-dimensional location.The RXs triangulate the three ranges to the TX to a single point as the intersection of the three circles.Requires pre-installation of the RXsoutside the building and long range to reach the TX inside.
RXRXRXRXTXTX
RXRX
If a RX could also determine the angle of the TX, then no backbone network would be required!The RX could pinpoint the location of the TX relative to the RX as the intersection between a circle and a directed line.A firefighter could then find the locations of trapped victims equipped with TX beacons.
TXTX
RXRX
Location from Range:
Location from Range and Angle:

Spatial-Temporal Channel Sounder
Extended temporal channel sounder to a spatial-temporal channel sounder by mounting the receiver antenna on a two-dimensional positioning table.The circular array pattern was realized virtually by tracing the element positions sequentially.

Spatial-Temporal Channel Impulse Response
h(t,h(t,θθ))
The frequency sweeps taken at each element of the virtual array can be processed together to generate the spatial-temporal channel impulse response h(t,θ).Now the first arrival indexed in time and angle can be extracted from the response, giving both the range and direction of the TX with respect to the RX.

Results: LOS, NIST North, B = 6 GHz, fc = 5 GHz
No apparent correlation between errors and ground-truth rangeErrors decrease with increasing bandwidth, but at diminishing rateThroughout all four buildings, average angle error of 1.1o
range error of 20 cmlocation error of 31 cm

Results: NLOS, NIST North, B = 6 GHz, fc = 5 GHz
Errors increase with increasing ground-truth rangeMore and more walls between the TX and RX with increasing ground-truth range:
–
Range error: the signal propagates through walls at a speed slower than light, so the estimated range is always greater than the actual range
–
Angle error: the walls deflect the signal off its original angle
from the transmitterAverage location error in NIST North is 150 cm, Child Care is 159 cm
Sound is 656 cm, Plant is 995 cm

Results: NLOS, Sound, Results: NLOS, Sound, B = 2 GHzB = 2 GHz
The signal penetrates the walls better at lower frequencies, so the average range error is smaller.The angular resolution is higher at larger frequencies, so the average angle error is smaller.The two phenomena compensate for each other, so the average location error is the same at lower and higher frequencies.
ffcc
= 3 GHz= 3 GHz ffcc
= 7 GHz= 7 GHz
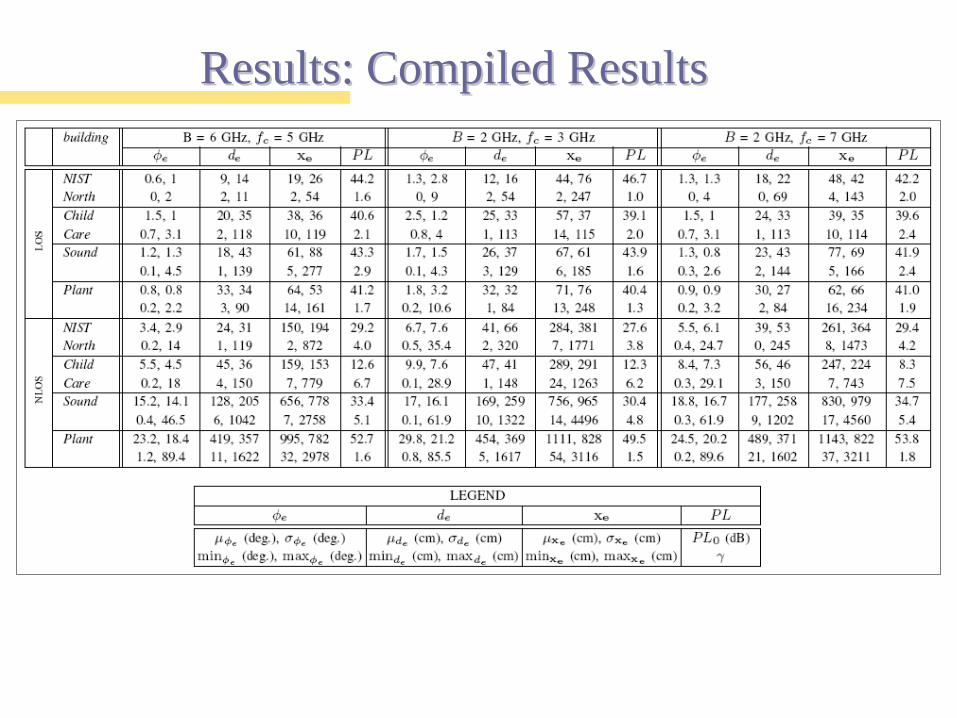
Results: Compiled Results Results: Compiled Results

Indoor first responder localization using inertial and magnetic sensors, RFID
START
Trajectory 2: Sequence ofcrossover path (red) and outerpath (blue)
Red: start of trajectory, involving two crossovers.
Blue: continuation of trajectory with long loop.
Localization Using Inertial Navigation Systems & RFID

Indoor first responder localization using inertial and magnetic sensors, RFID
Simple correction, fixed 750 mm stride
Blue: unassisted DRM with magnetic heading sensor and step counting.
Red: DRM track with simple position correction at RFID “waypoints.”
Cont’d

Extra Slides
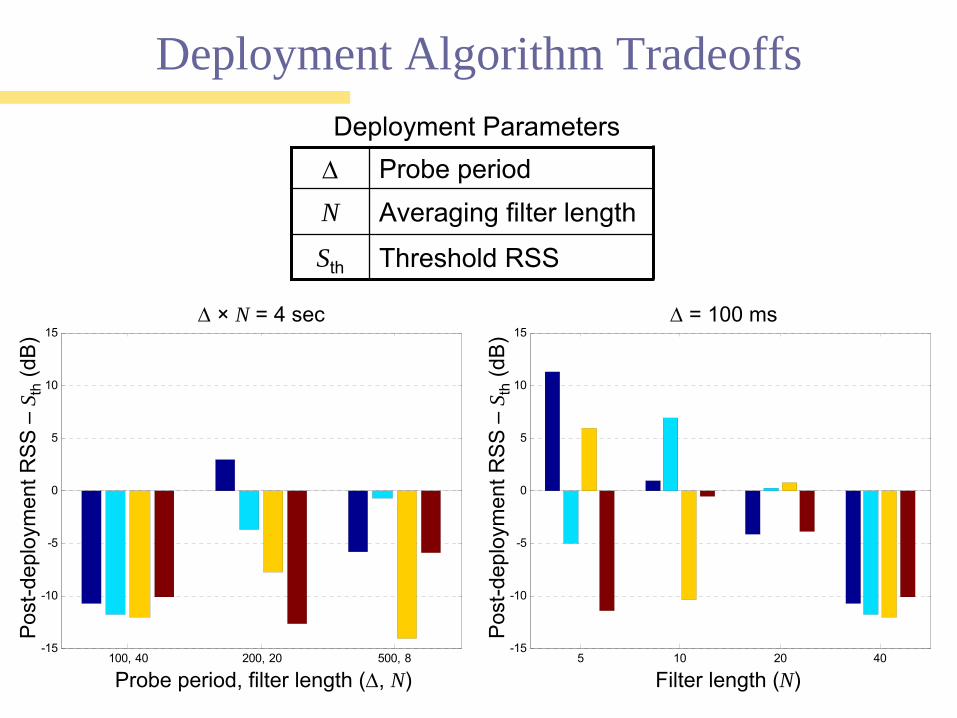
Deployment Algorithm Tradeoffs
100, 40 200, 20 500, 8-15
-10
-5
0
5
10
15
Δ Probe period 100 msN Averaging filter length 20
Sth Threshold RSS -80 dBm
Deployment Parameters
Probe period, filter length (Δ, N)
Δ
×
N = 4 sec
Pos
t-dep
loym
ent R
SS –
S th
(dB
)
5 10 20 40-15
-10
-5
0
5
10
15
( )Filter length (N)
Pos
t-dep
loym
ent R
SS –
S th
(dB
)
Δ
= 100 ms

0 20 40 60 80 100 120 140 160 18010
20
30
40
50
60
70
80
Time (s)
Filte
red
SN
R (d
B)
Link A->BLink B->A
•
Fixed STA “A”, mobile STA “B”•
“B”
carried down 110 m corridor and back at ~ 1.2 m/s
•
Sampling period: 100 ms•
Filter:
Uniform moving average of last 20 samples (2 s filter)
•
Data rate: 2 Mbps
2.4 GHz Symmetric Link MeasurementsBi-directional Filtered SNR Measurements of a Symmetric Mobile Link

2.4 GHz Asymmetric Link Measurements
0 20 40 60 80 100 120 140 160 18010
20
30
40
50
60
70
80
Time (s)
Filte
red
SN
R (d
B)
Link A->BLink B->A
•
Fixed STA “A”, mobile STA “B”•
“B”
carried down 110 m corridor and back at ~ 1.2 m/s
•
Sampling period: 100 ms•
Filter:
Uniform moving average of last 20 samples (2 s filter)
•
Data rate: 2 Mbps
Bi-directional Filtered SNR Measurements of an Asymmetric Mobile Link

Similarities with LANdroids
LANdroid Capability NIST Breadcrumb
Self-Configuration ○Self-Optimization ○Self-Healing ○Tethering ○Intelligent Power Management
Placement-by-Indicator ●Geolocation ○
○●
Partial supportFull support