missions and means framework (mmf) demonstration: the storyboard … · 9 november 2005 09:30 slide...
TRANSCRIPT
9 November 2005 Slide 109:30
Presented by Richard [email protected]
Richard S. SandmeyerU.S. Army Research Laboratory
International Test and Evaluation AssociationModeling and Simulation Conference
December 12-15, 2005
Missions and Means Framework Missions and Means Framework (MMF) Demonstration: (MMF) Demonstration: The Storyboard Model The Storyboard Model
Approved for Public Release; Unlimited Distribution
Report Documentation Page Form ApprovedOMB No. 0704-0188
Public reporting burden for the collection of information is estimated to average 1 hour per response, including the time for reviewing instructions, searching existing data sources, gathering andmaintaining the data needed, and completing and reviewing the collection of information. Send comments regarding this burden estimate or any other aspect of this collection of information,including suggestions for reducing this burden, to Washington Headquarters Services, Directorate for Information Operations and Reports, 1215 Jefferson Davis Highway, Suite 1204, ArlingtonVA 22202-4302. Respondents should be aware that notwithstanding any other provision of law, no person shall be subject to a penalty for failing to comply with a collection of information if itdoes not display a currently valid OMB control number.
1. REPORT DATE DEC 2005 2. REPORT TYPE
3. DATES COVERED 00-00-2005 to 00-00-2005
4. TITLE AND SUBTITLE Missions and Means Framework (MMF) Demonstration: The Storyboard Model
5a. CONTRACT NUMBER
5b. GRANT NUMBER
5c. PROGRAM ELEMENT NUMBER
6. AUTHOR(S) 5d. PROJECT NUMBER
5e. TASK NUMBER
5f. WORK UNIT NUMBER
7. PERFORMING ORGANIZATION NAME(S) AND ADDRESS(ES) U.S. Army Research Laboratory,Computational and InformationSciences Directorate,White Sands Missile Range,NM,88002
8. PERFORMING ORGANIZATIONREPORT NUMBER
9. SPONSORING/MONITORING AGENCY NAME(S) AND ADDRESS(ES) 10. SPONSOR/MONITOR’S ACRONYM(S)
11. SPONSOR/MONITOR’S REPORT NUMBER(S)
12. DISTRIBUTION/AVAILABILITY STATEMENT Approved for public release; distribution unlimited
13. SUPPLEMENTARY NOTES Modeling and Simulation Conference, 2005 Dec 12-15, Las Cruces, NM
14. ABSTRACT
15. SUBJECT TERMS
16. SECURITY CLASSIFICATION OF: 17. LIMITATION OF ABSTRACT Same as
Report (SAR)
18. NUMBEROF PAGES
26
19a. NAME OFRESPONSIBLE PERSON
a. REPORT unclassified
b. ABSTRACT unclassified
c. THIS PAGE unclassified
Standard Form 298 (Rev. 8-98) Prescribed by ANSI Std Z39-18
9 November 2005 Slide 209:30
Objective
To present an overview of
the Missions and Means Framework
and of
its first demonstration,
which may impact future application of
Modeling and Simulation to
Test and Evaluation.
9 November 2005 Slide 309:30
Outline
oo MMF Background
o What is it?
o What is different from previous approach?
o Relevance to SoS analysis
o MMF Demonstration 2004-2005
o Mission-to-Task Decomposition
o Degraded Capability States
o Task Requirements versus Unit Capabilities
o Storyboard Model
o Outputs
o Conclusions and Path Forward
9 November 2005 Slide 409:30
personnel
leadership
organization
T1T1T1T1T1Tm
component
subsystem
operational
tactical
strategic theater
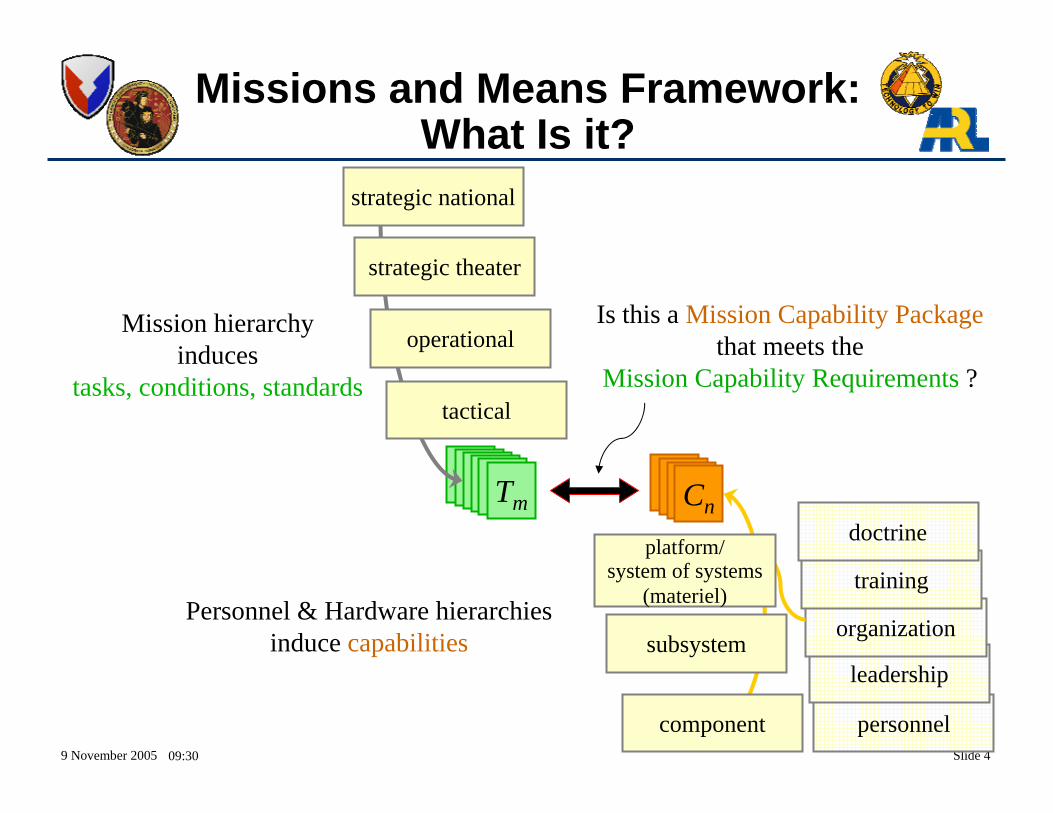
Missions and Means Framework: What Is it?
platform/system of systems
(materiel)
strategic national
CnCnCnCn
training
doctrine
Is this a Mission Capability Packagethat meets the
Mission Capability Requirements ?
Mission hierarchyinduces
tasks, conditions, standards
Personnel & Hardware hierarchiesinduce capabilities
9 November 2005 Slide 509:30
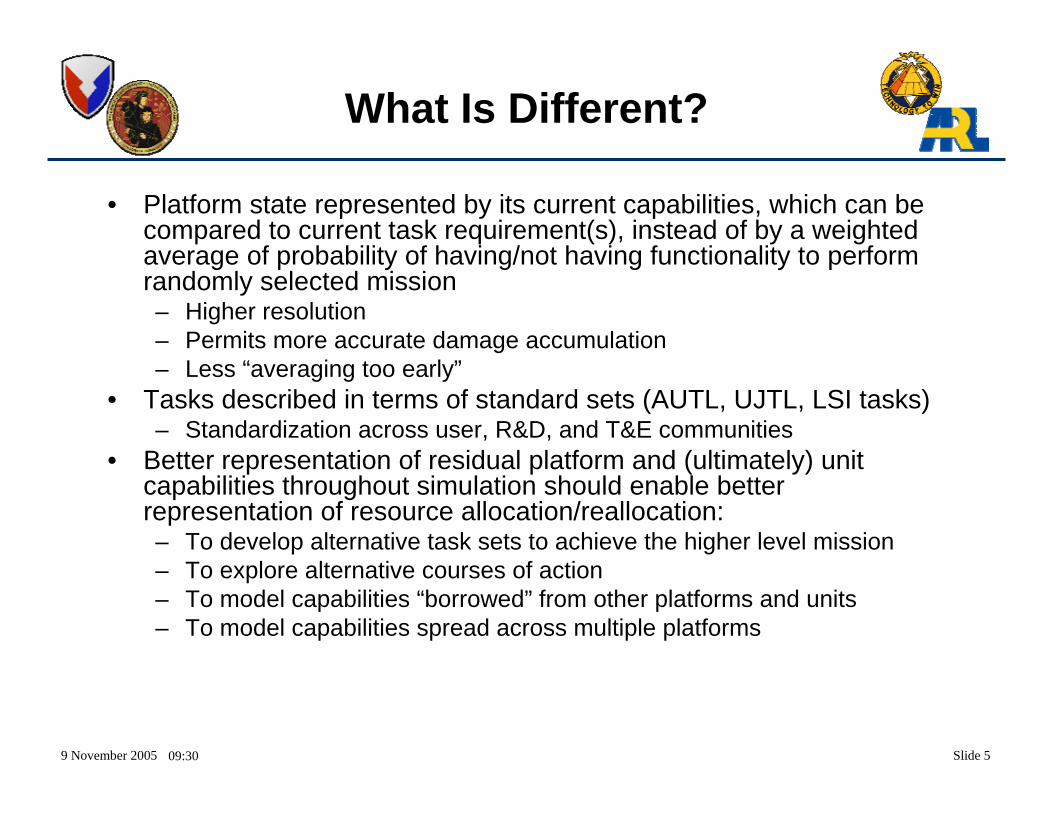
What Is Different?
• Platform state represented by its current capabilities, which can be compared to current task requirement(s), instead of by a weighted average of probability of having/not having functionality to perform randomly selected mission– Higher resolution– Permits more accurate damage accumulation– Less “averaging too early”
• Tasks described in terms of standard sets (AUTL, UJTL, LSI tasks)– Standardization across user, R&D, and T&E communities
• Better representation of residual platform and (ultimately) unitcapabilities throughout simulation should enable better representation of resource allocation/reallocation:– To develop alternative task sets to achieve the higher level mission– To explore alternative courses of action– To model capabilities “borrowed” from other platforms and units– To model capabilities spread across multiple platforms
9 November 2005 Slide 609:30
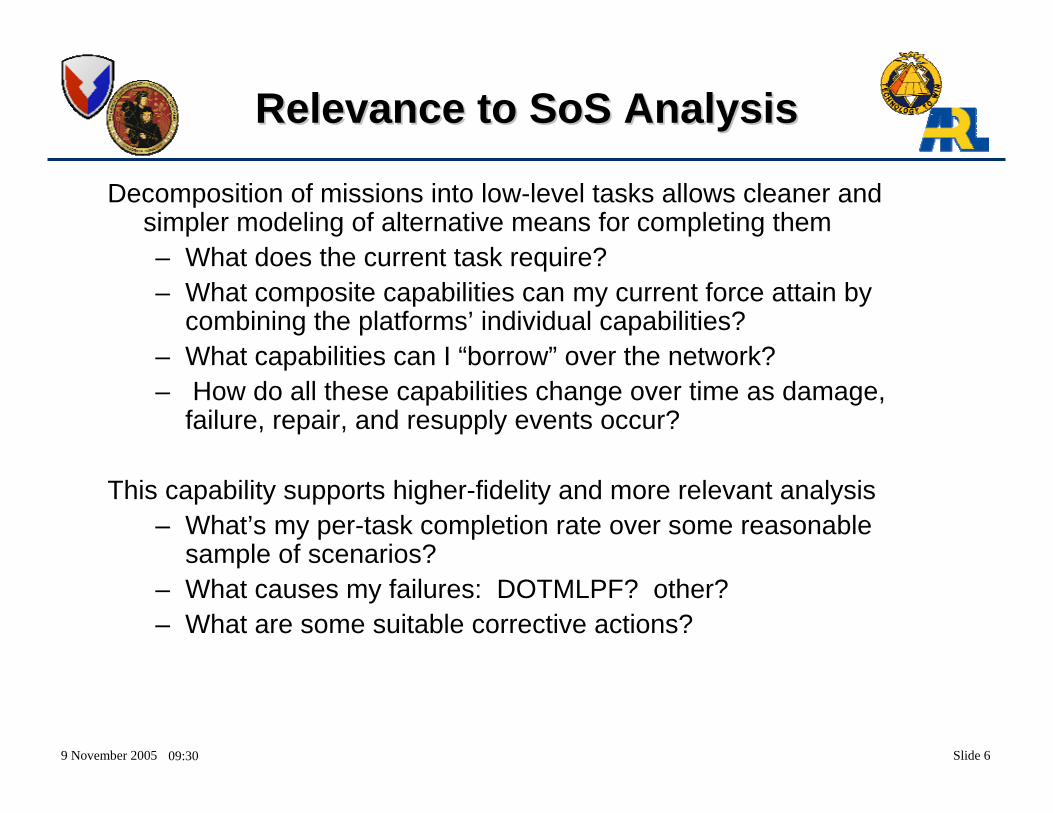
Relevance to SoS AnalysisRelevance to SoS Analysis
Decomposition of missions into low-level tasks allows cleaner and simpler modeling of alternative means for completing them– What does the current task require?– What composite capabilities can my current force attain by
combining the platforms’ individual capabilities?– What capabilities can I “borrow” over the network?– How do all these capabilities change over time as damage,
failure, repair, and resupply events occur?
This capability supports higher-fidelity and more relevant analysis– What’s my per-task completion rate over some reasonable
sample of scenarios?– What causes my failures: DOTMLPF? other?– What are some suitable corrective actions?
9 November 2005 Slide 709:30
Overlaywhat we have withwhat we need to do
•COCOM IPLs•GAP Analysis
•Risk AssessmentJCIDS Analysis(FAA, FNA, FSA)
JCIDSRecommendation
Capability NeedsDOTMLPF Changes
AssessmentandAnalysis
NSSStrategy &
OverarchingConcepts
Joint OperationsConcepts
OPLANsand
CONPLANs
JointOperatingConcepts
DefensePlanningScenarios
Science &Technology
Planning,Programming, andBudgeting System
Acquisition Experimentation
Guidance
IntegratedArchitecture
JointFunctionalConcepts
ReconciliationandRecommendation
DecisionandAction
component
subsystem
platform/system of systems
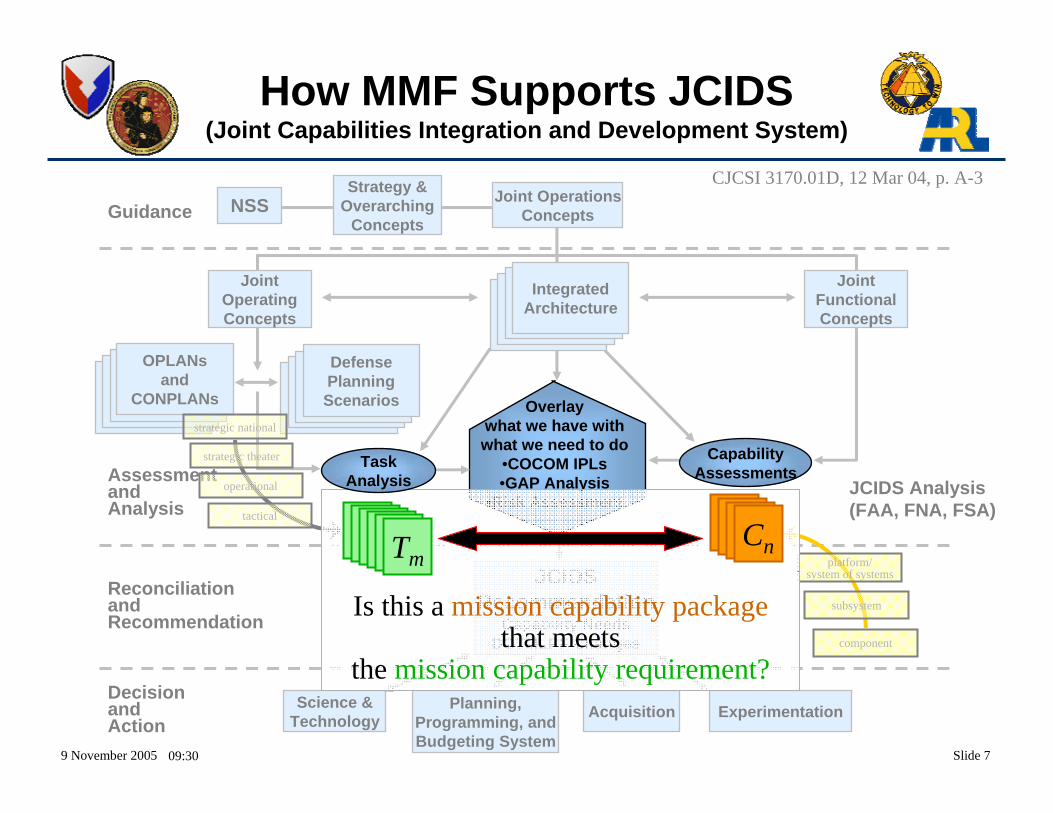
How MMF Supports JCIDS(Joint Capabilities Integration and Development System)
CJCSI 3170.01D, 12 Mar 04, p. A-3
operational
tactical
strategic theater
strategic national
Is this a mission capability packagethat meets
the mission capability requirement?
TaskAnalysis
CapabilityAssessments
CnCnCnCnT1T1T1T1T1Tm
9 November 2005 Slide 809:30
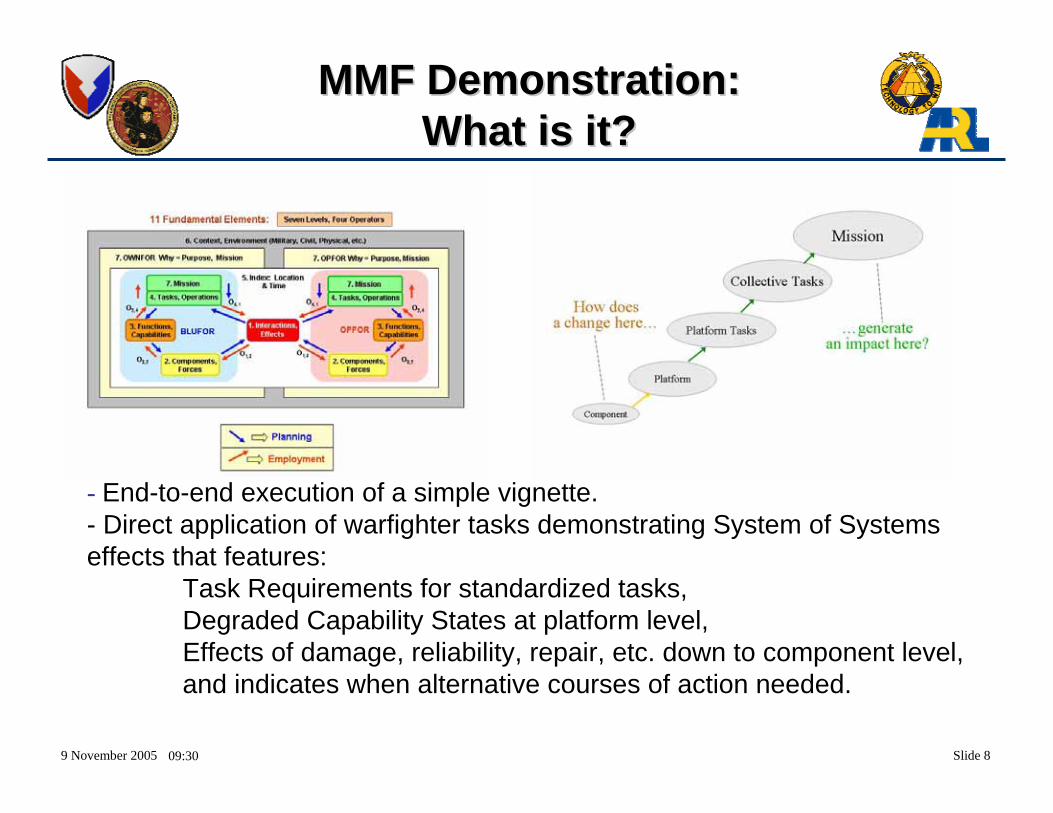
MMF Demonstration: MMF Demonstration: What is it?What is it?
- End-to-end execution of a simple vignette.- Direct application of warfighter tasks demonstrating System of Systems effects that features:
Task Requirements for standardized tasks,Degraded Capability States at platform level,Effects of damage, reliability, repair, etc. down to component level,and indicates when alternative courses of action needed.
9 November 2005 Slide 909:30
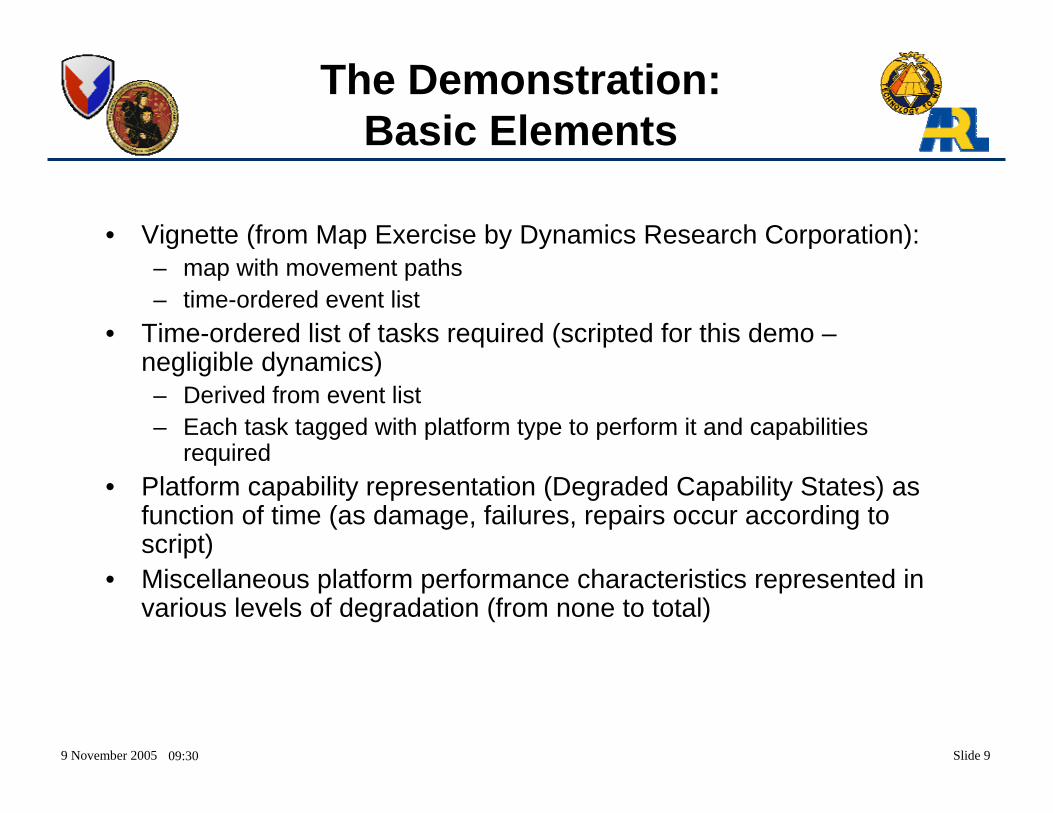
The Demonstration: Basic Elements
• Vignette (from Map Exercise by Dynamics Research Corporation): – map with movement paths– time-ordered event list
• Time-ordered list of tasks required (scripted for this demo –negligible dynamics)– Derived from event list– Each task tagged with platform type to perform it and capabilities
required• Platform capability representation (Degraded Capability States) as
function of time (as damage, failures, repairs occur according to script)
• Miscellaneous platform performance characteristics represented in various levels of degradation (from none to total)
9 November 2005 Slide 1009:30
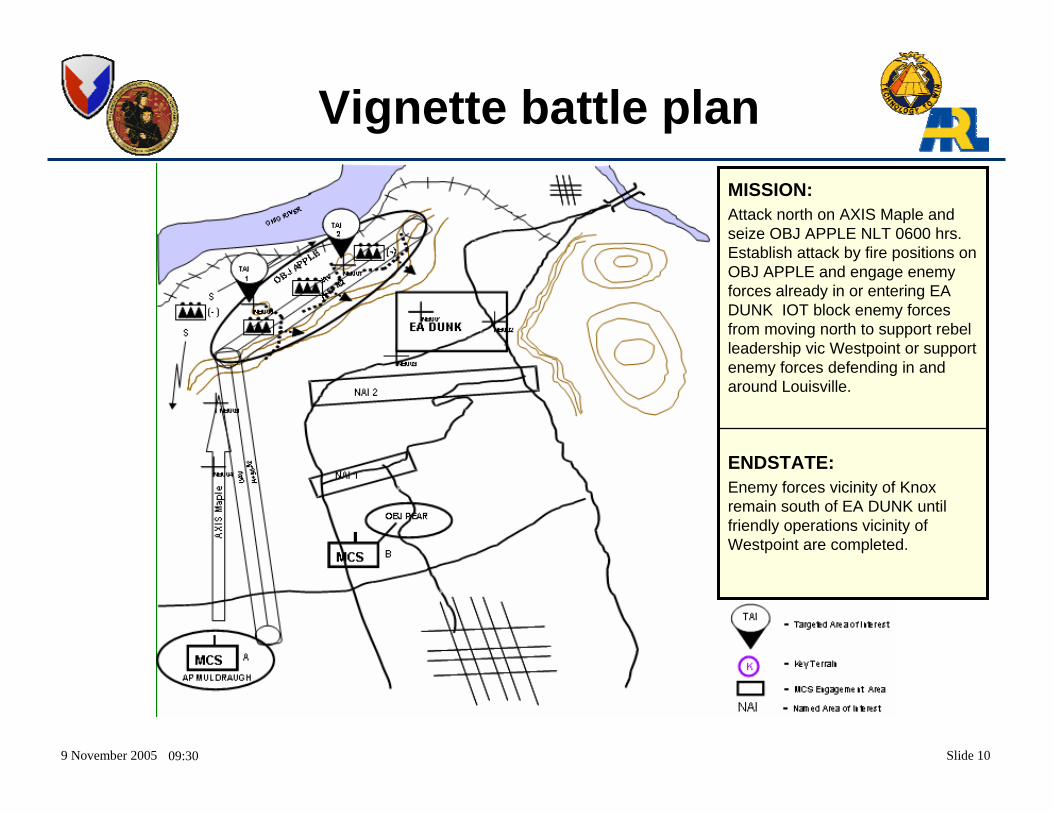
Vignette battle plan
ENDSTATE:Enemy forces vicinity of Knox remain south of EA DUNK until friendly operations vicinity of Westpoint are completed.
MISSION:Attack north on AXIS Maple and seize OBJ APPLE NLT 0600 hrs. Establish attack by fire positions on OBJ APPLE and engage enemy forces already in or entering EA DUNK IOT block enemy forces from moving north to support rebel leadership vic Westpoint or support enemy forces defending in and around Louisville.
9 November 2005 Slide 1109:30
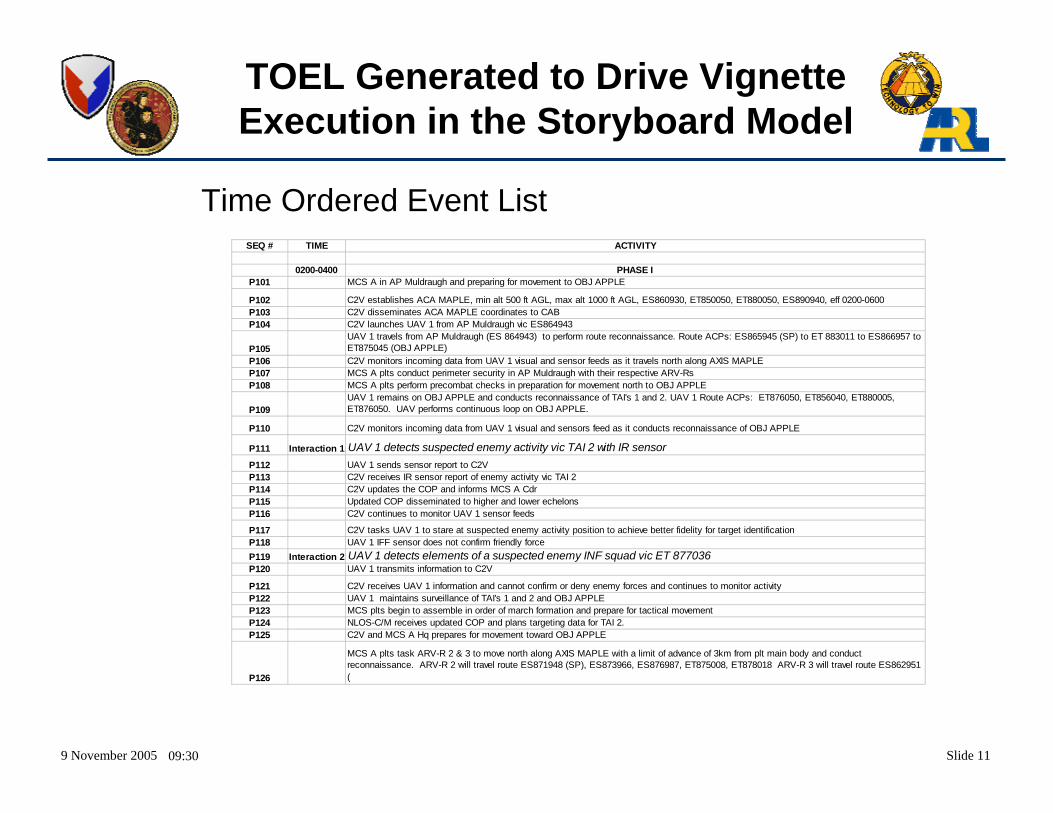
TOEL Generated to Drive Vignette Execution in the Storyboard Model
SEQ # TIME ACTIVITY
0200-0400 PHASE IP101 MCS A in AP Muldraugh and preparing for movement to OBJ APPLE
P102 C2V establishes ACA MAPLE, min alt 500 ft AGL, max alt 1000 ft AGL, ES860930, ET850050, ET880050, ES890940, eff 0200-0600P103 C2V disseminates ACA MAPLE coordinates to CABP104 C2V launches UAV 1 from AP Muldraugh vic ES864943
P105UAV 1 travels from AP Muldraugh (ES 864943) to perform route reconnaissance. Route ACPs: ES865945 (SP) to ET 883011 to ES866957 to ET875045 (OBJ APPLE)
P106 C2V monitors incoming data from UAV 1 visual and sensor feeds as it travels north along AXIS MAPLEP107 MCS A plts conduct perimeter security in AP Muldraugh with their respective ARV-RsP108 MCS A plts perform precombat checks in preparation for movement north to OBJ APPLE
P109UAV 1 remains on OBJ APPLE and conducts reconnaissance of TAI's 1 and 2. UAV 1 Route ACPs: ET876050, ET856040, ET880005, ET876050. UAV performs continuous loop on OBJ APPLE.
P110 C2V monitors incoming data from UAV 1 visual and sensors feed as it conducts reconnaissance of OBJ APPLE
P111 Interaction 1 UAV 1 detects suspected enemy activity vic TAI 2 with IR sensorP112 UAV 1 sends sensor report to C2VP113 C2V receives IR sensor report of enemy activity vic TAI 2P114 C2V updates the COP and informs MCS A CdrP115 Updated COP disseminated to higher and lower echelonsP116 C2V continues to monitor UAV 1 sensor feeds
P117 C2V tasks UAV 1 to stare at suspected enemy activity position to achieve better fidelity for target identification P118 UAV 1 IFF sensor does not confirm friendly forceP119 Interaction 2 UAV 1 detects elements of a suspected enemy INF squad vic ET 877036P120 UAV 1 transmits information to C2V
P121 C2V receives UAV 1 information and cannot confirm or deny enemy forces and continues to monitor activityP122 UAV 1 maintains surveillance of TAI's 1 and 2 and OBJ APPLEP123 MCS plts begin to assemble in order of march formation and prepare for tactical movementP124 NLOS-C/M receives updated COP and plans targeting data for TAI 2. P125 C2V and MCS A Hq prepares for movement toward OBJ APPLE
P126
MCS A plts task ARV-R 2 & 3 to move north along AXIS MAPLE with a limit of advance of 3km from plt main body and conduct reconnaissance. ARV-R 2 will travel route ES871948 (SP), ES873966, ES876987, ET875008, ET878018 ARV-R 3 will travel route ES862951 (
Time Ordered Event List
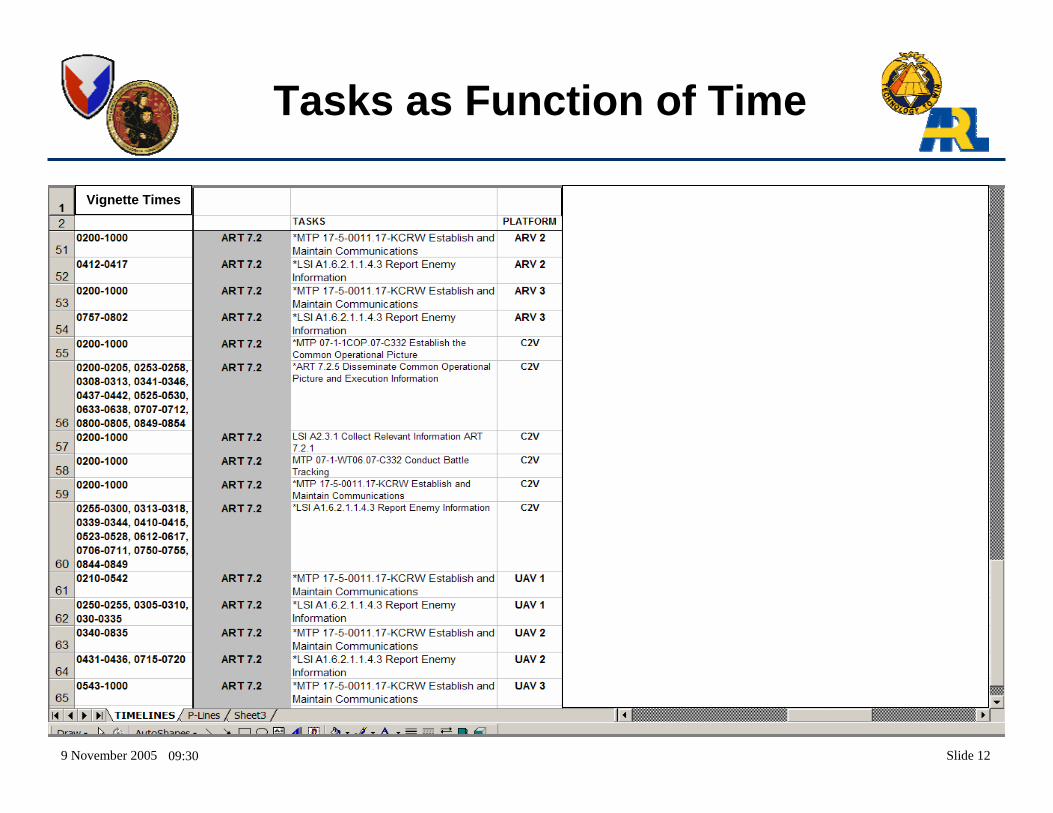
9 November 2005 Slide 1209:30
Tasks as Function of Time
Vignette Times
9 November 2005 Slide 1309:30
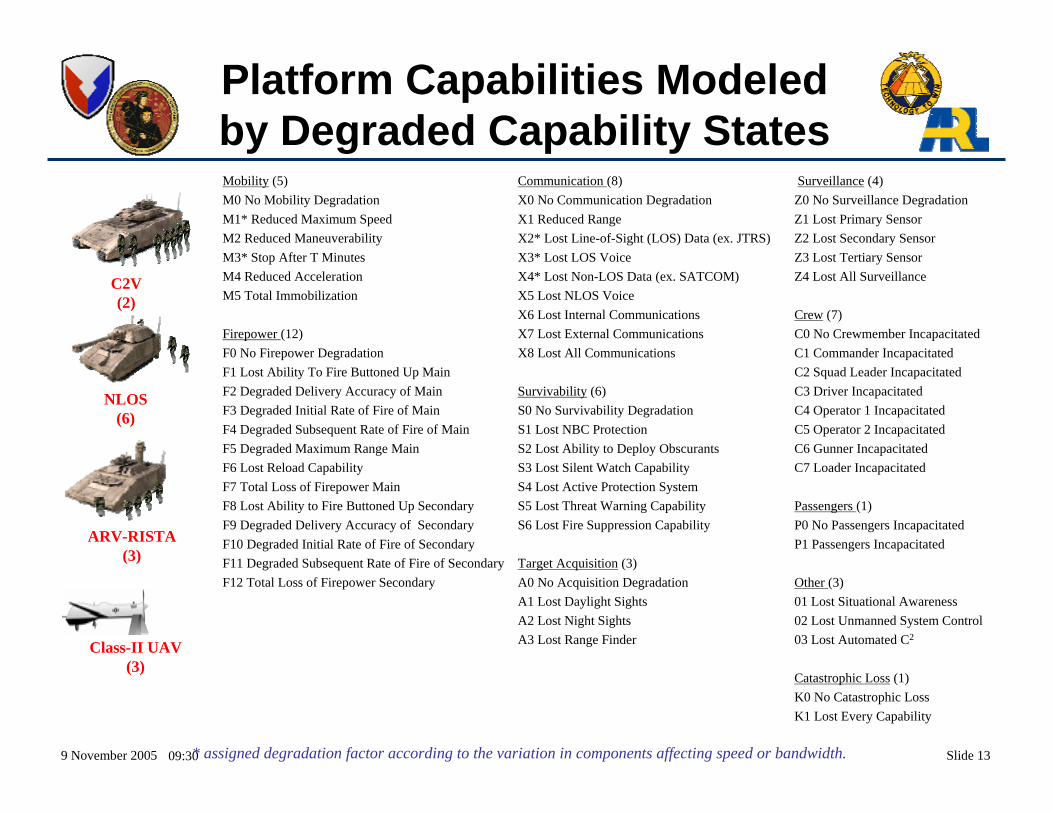
Mobility (5)M0 No Mobility Degradation M1* Reduced Maximum Speed M2 Reduced Maneuverability M3* Stop After T Minutes M4 Reduced AccelerationM5 Total Immobilization
Firepower (12)F0 No Firepower DegradationF1 Lost Ability To Fire Buttoned Up MainF2 Degraded Delivery Accuracy of MainF3 Degraded Initial Rate of Fire of MainF4 Degraded Subsequent Rate of Fire of MainF5 Degraded Maximum Range MainF6 Lost Reload CapabilityF7 Total Loss of Firepower Main F8 Lost Ability to Fire Buttoned Up SecondaryF9 Degraded Delivery Accuracy of SecondaryF10 Degraded Initial Rate of Fire of SecondaryF11 Degraded Subsequent Rate of Fire of SecondaryF12 Total Loss of Firepower Secondary
Communication (8)X0 No Communication DegradationX1 Reduced RangeX2* Lost Line-of-Sight (LOS) Data (ex. JTRS)X3* Lost LOS VoiceX4* Lost Non-LOS Data (ex. SATCOM)X5 Lost NLOS VoiceX6 Lost Internal CommunicationsX7 Lost External CommunicationsX8 Lost All Communications
Survivability (6)S0 No Survivability DegradationS1 Lost NBC ProtectionS2 Lost Ability to Deploy ObscurantsS3 Lost Silent Watch CapabilityS4 Lost Active Protection SystemS5 Lost Threat Warning CapabilityS6 Lost Fire Suppression Capability
Target Acquisition (3) A0 No Acquisition Degradation A1 Lost Daylight SightsA2 Lost Night Sights A3 Lost Range Finder
Surveillance (4)Z0 No Surveillance Degradation Z1 Lost Primary Sensor Z2 Lost Secondary SensorZ3 Lost Tertiary SensorZ4 Lost All Surveillance
Crew (7)C0 No Crewmember IncapacitatedC1 Commander IncapacitatedC2 Squad Leader IncapacitatedC3 Driver Incapacitated C4 Operator 1 IncapacitatedC5 Operator 2 IncapacitatedC6 Gunner IncapacitatedC7 Loader Incapacitated
Passengers (1)P0 No Passengers IncapacitatedP1 Passengers Incapacitated
Other (3)01 Lost Situational Awareness02 Lost Unmanned System Control03 Lost Automated C2
Catastrophic Loss (1)K0 No Catastrophic LossK1 Lost Every Capability
Platform Capabilities Modeled by Degraded Capability States
* assigned degradation factor according to the variation in components affecting speed or bandwidth.
C2V(2)
NLOS(6)
ARV-RISTA(3)
Class-II UAV(3)
9 November 2005 Slide 1409:30
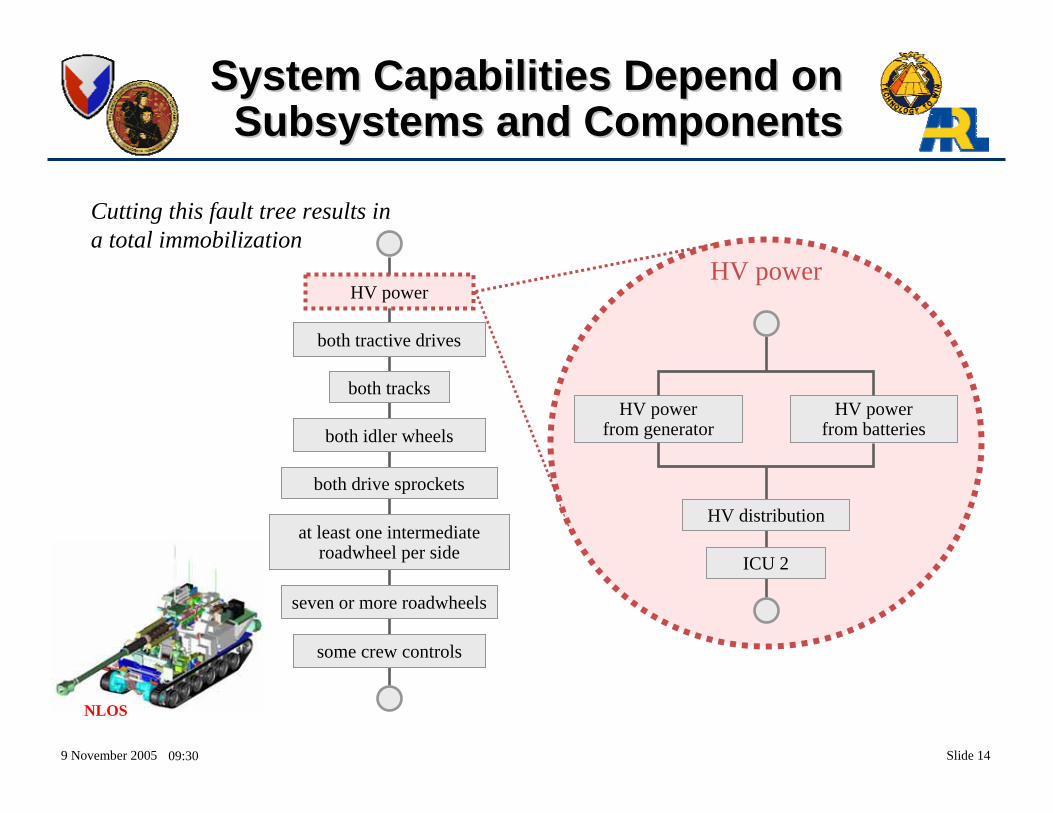
System Capabilities Depend onSystem Capabilities Depend onSubsystems and ComponentsSubsystems and Components
HV power
both tractive drives
both tracks
both idler wheels
both drive sprockets
at least one intermediateroadwheel per side
some crew controls
seven or more roadwheels
Cutting this fault tree results ina total immobilization
HV distribution
ICU 2
HV powerfrom generator
HV powerfrom batteries
HV power
NLOS
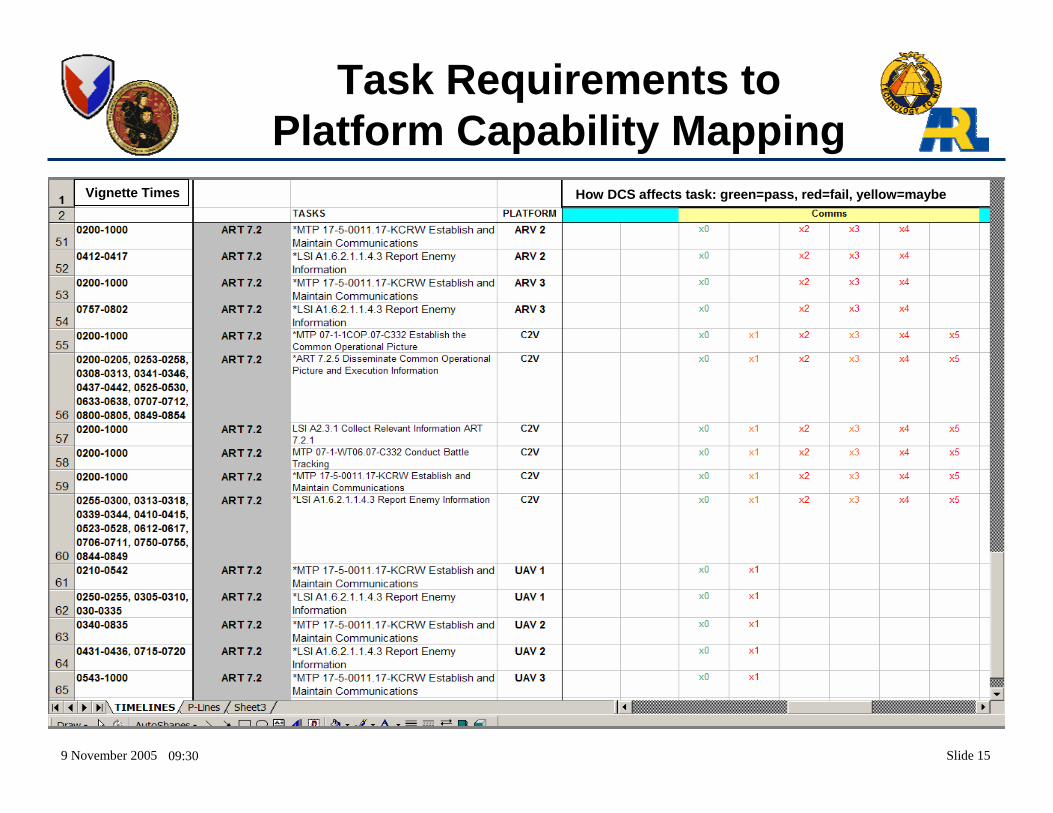
9 November 2005 Slide 1509:30
Task Requirements to Platform Capability Mapping
Vignette Times How DCS affects task: green=pass, red=fail, yellow=maybe
9 November 2005 Slide 1609:30
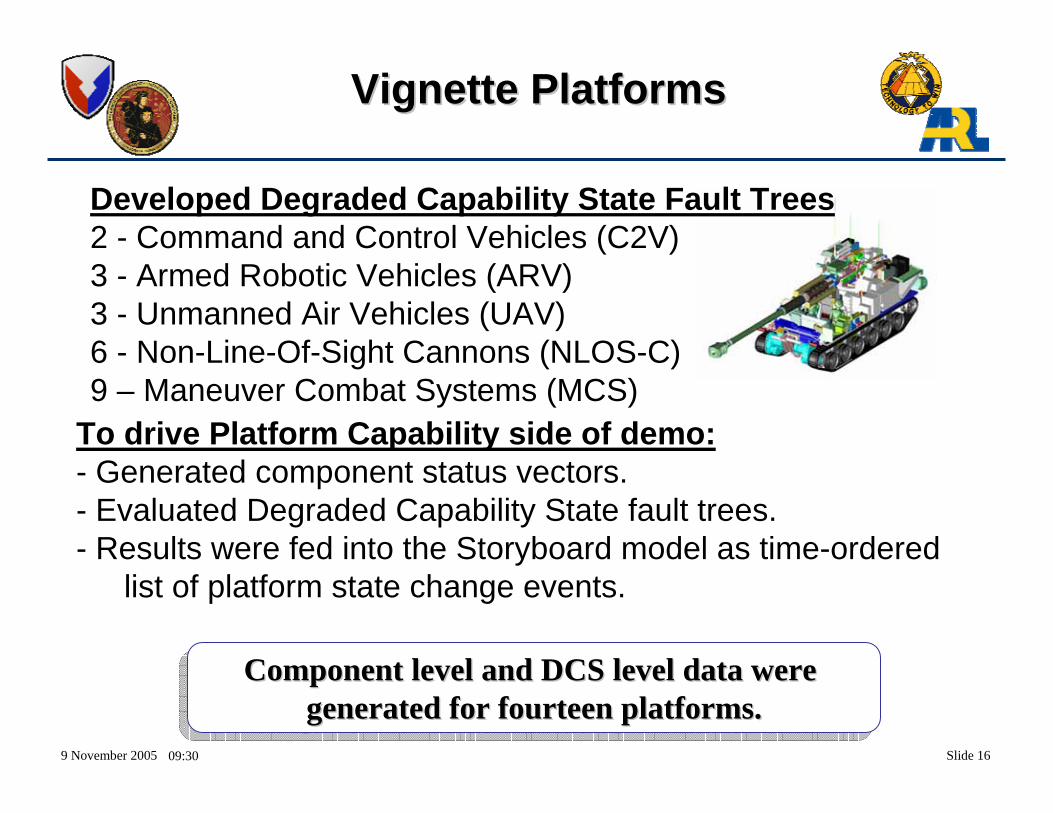
Vignette PlatformsVignette Platforms
Developed Degraded Capability State Fault Trees2 - Command and Control Vehicles (C2V)3 - Armed Robotic Vehicles (ARV) 3 - Unmanned Air Vehicles (UAV) 6 - Non-Line-Of-Sight Cannons (NLOS-C)9 – Maneuver Combat Systems (MCS)
Component level and DCS level data were generated for fourteen platforms.
Component level and DCS level data were Component level and DCS level data were generated for fourteen platforms.generated for fourteen platforms.
To drive Platform Capability side of demo:- Generated component status vectors.- Evaluated Degraded Capability State fault trees.- Results were fed into the Storyboard model as time-ordered
list of platform state change events.
9 November 2005 Slide 1709:30
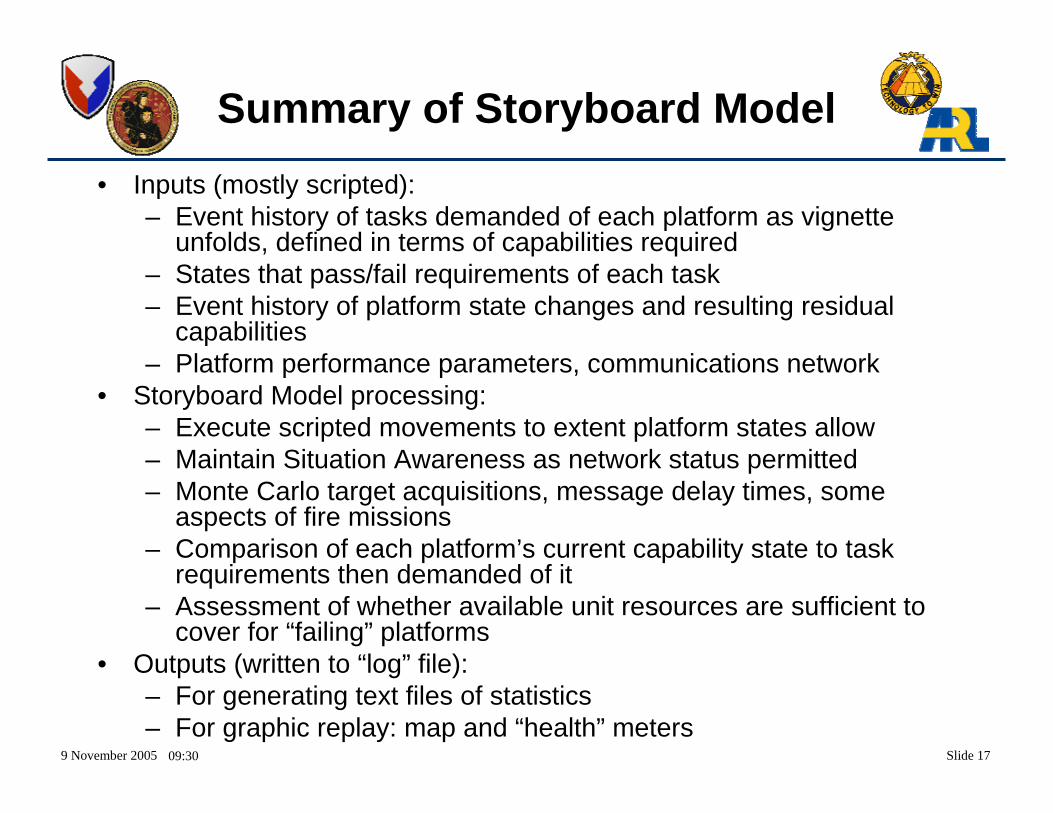
Summary of Storyboard Model• Inputs (mostly scripted):
– Event history of tasks demanded of each platform as vignette unfolds, defined in terms of capabilities required
– States that pass/fail requirements of each task– Event history of platform state changes and resulting residual
capabilities– Platform performance parameters, communications network
• Storyboard Model processing:– Execute scripted movements to extent platform states allow– Maintain Situation Awareness as network status permitted– Monte Carlo target acquisitions, message delay times, some
aspects of fire missions– Comparison of each platform’s current capability state to task
requirements then demanded of it– Assessment of whether available unit resources are sufficient to
cover for “failing” platforms• Outputs (written to “log” file):
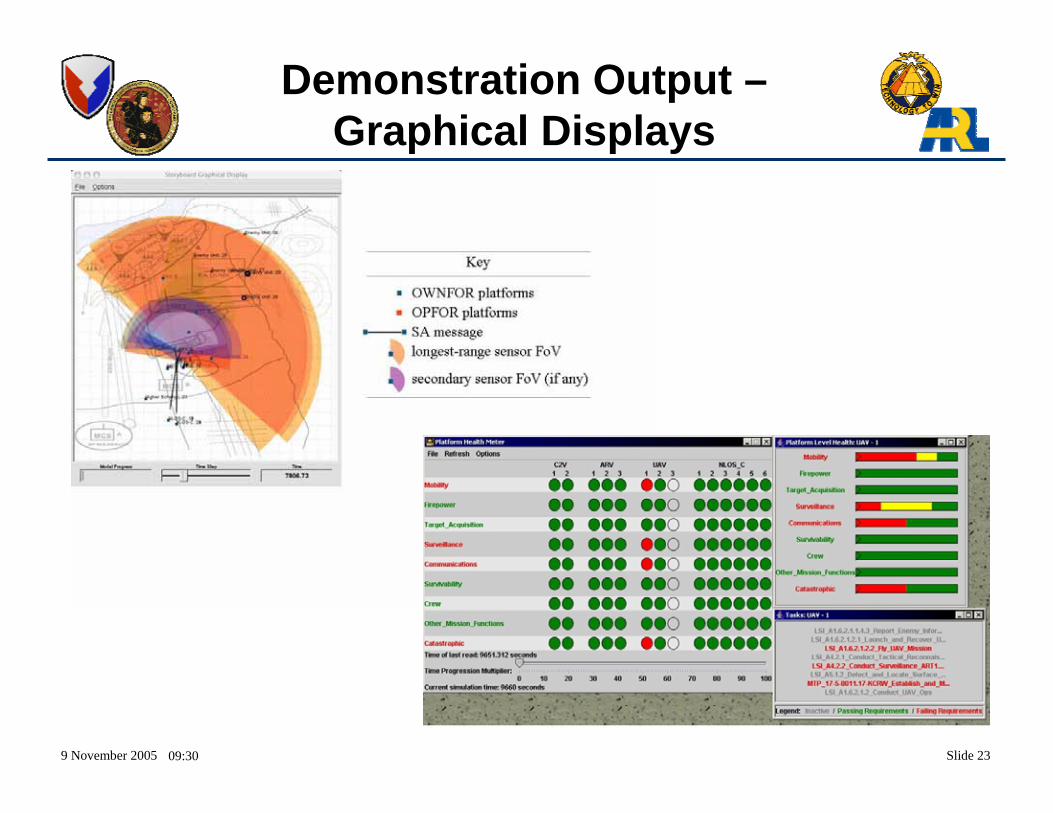
– For generating text files of statistics– For graphic replay: map and “health” meters
9 November 2005 Slide 1809:30
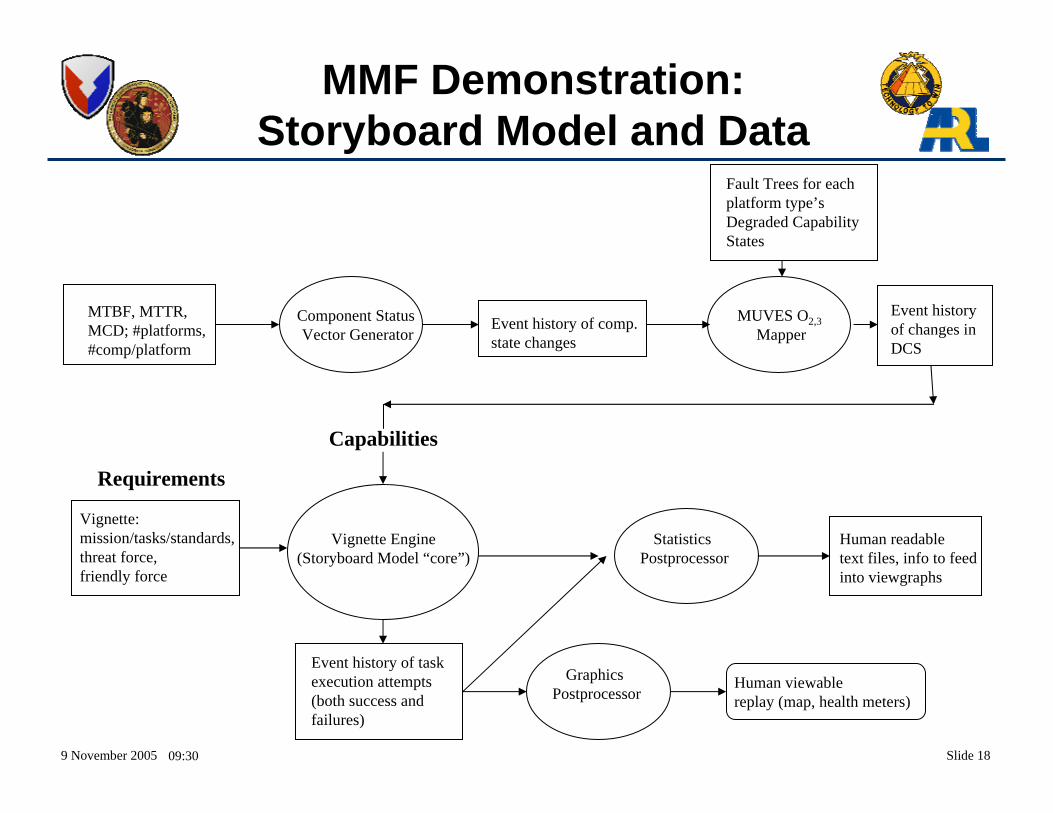
MMF Demonstration:Storyboard Model and Data
MTBF, MTTR,MCD; #platforms,#comp/platform
Component Status Vector Generator
Event history of comp.state changes
MUVES O2,3Mapper
Fault Trees for each platform type’s Degraded CapabilityStates
Event history of changes in DCS
Vignette: mission/tasks/standards,threat force,friendly force
Capabilities
Requirements
Vignette Engine(Storyboard Model “core”)
Event history of taskexecution attempts(both success and failures)
Graphics Postprocessor
Human viewablereplay (map, health meters)
Statistics Postprocessor
Human readabletext files, info to feedinto viewgraphs
9 November 2005 Slide 1909:30
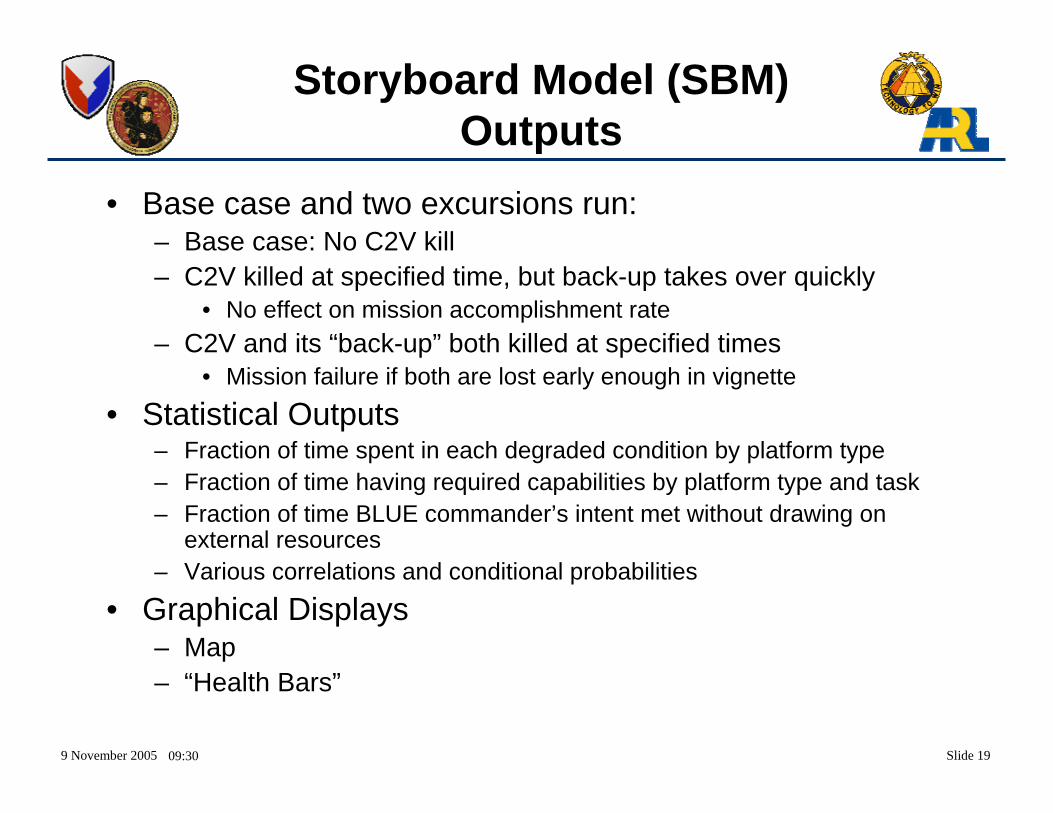
Storyboard Model (SBM) Outputs
• Base case and two excursions run:– Base case: No C2V kill– C2V killed at specified time, but back-up takes over quickly
• No effect on mission accomplishment rate– C2V and its “back-up” both killed at specified times
• Mission failure if both are lost early enough in vignette
• Statistical Outputs– Fraction of time spent in each degraded condition by platform type– Fraction of time having required capabilities by platform type and task– Fraction of time BLUE commander’s intent met without drawing on
external resources– Various correlations and conditional probabilities
• Graphical Displays– Map– “Health Bars”
9 November 2005 Slide 2009:30
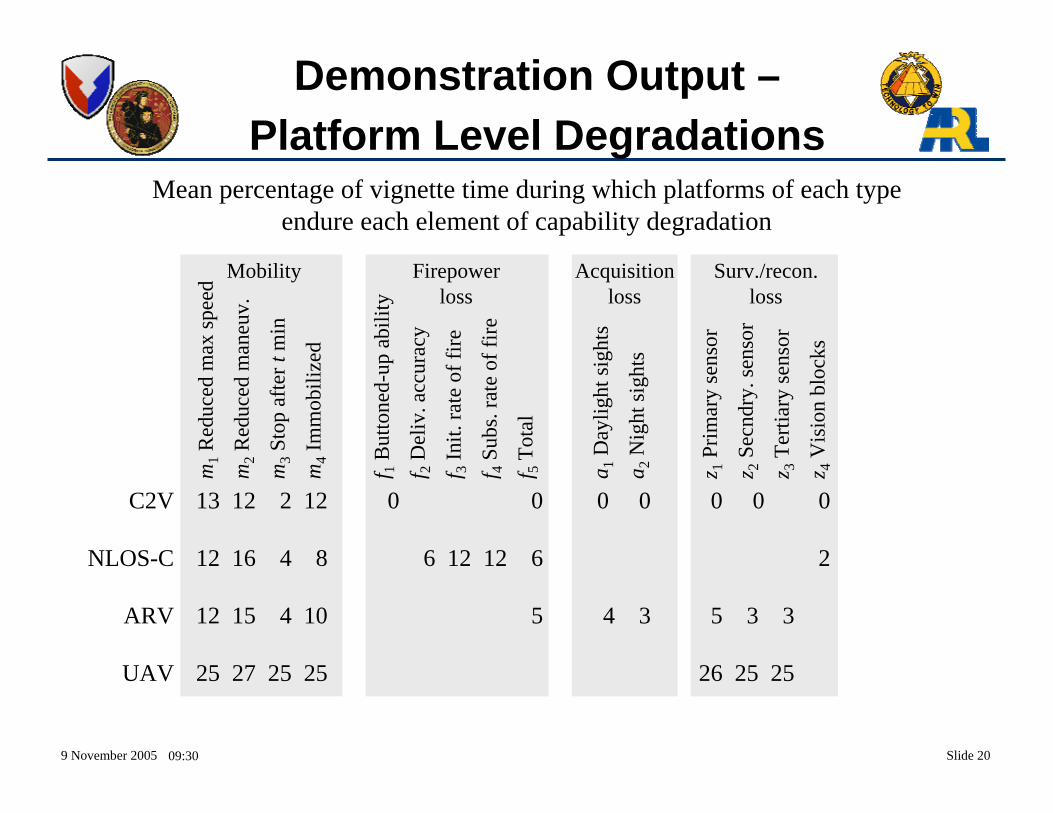
Demonstration Output –Platform Level Degradations
Mean percentage of vignette time during which platforms of each typeendure each element of capability degradation
13 12 2 12 0 0 0 0 0 0 0
12 16 4 8 6 12 12 6 2
12 15 4 10 5 4 3 5 3 3
25 27 25 25 26 25 25
m1
Red
uced
max
spee
d
m2
Red
uced
man
euv.
m3
Stop
afte
r tm
in
m4
Imm
obili
zed
Mobility
f 1B
utto
ned-
up a
bilit
y
f 2D
eliv
. acc
urac
y
f 3In
it. ra
te o
f fire
f 4Su
bs. r
ate
of fi
re
f 5To
tal
Firepowerloss
a 1D
aylig
ht si
ghts
a 2N
ight
sigh
ts
Acquisitionloss
Surv./recon.loss
z 1Pr
imar
y se
nsor
z 2Se
cndr
y. se
nsor
z 3Te
rtiar
y se
nsor
z 4V
isio
n bl
ocks
C2V
NLOS-C
ARV
UAV
9 November 2005 Slide 2109:30
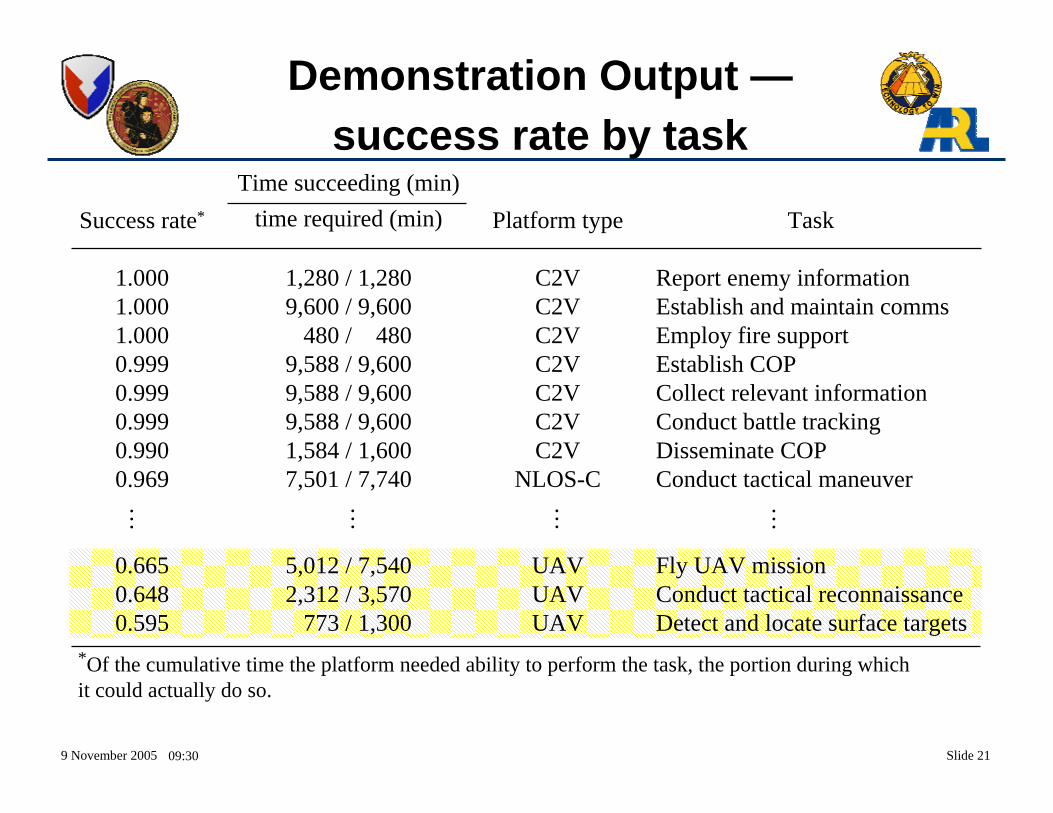
Demonstration Output —success rate by task
Success rate*
1.0001.0001.0000.9990.9990.9990.9900.969
0.6650.6480.595
Time succeeding (min)time required (min)
1,280 / 1,2809,600 / 9,600
480 / 4809,588 / 9,6009,588 / 9,6009,588 / 9,6001,584 / 1,6007,501 / 7,740
5,012 / 7,5402,312 / 3,570
773 / 1,300
Platform type
C2VC2VC2VC2VC2VC2VC2V
NLOS-C
UAVUAVUAV
Task
Report enemy informationEstablish and maintain commsEmploy fire supportEstablish COPCollect relevant informationConduct battle trackingDisseminate COPConduct tactical maneuver
Fly UAV missionConduct tactical reconnaissanceDetect and locate surface targets
… … … …
*Of the cumulative time the platform needed ability to perform the task, the portion during whichit could actually do so.
9 November 2005 Slide 2209:30
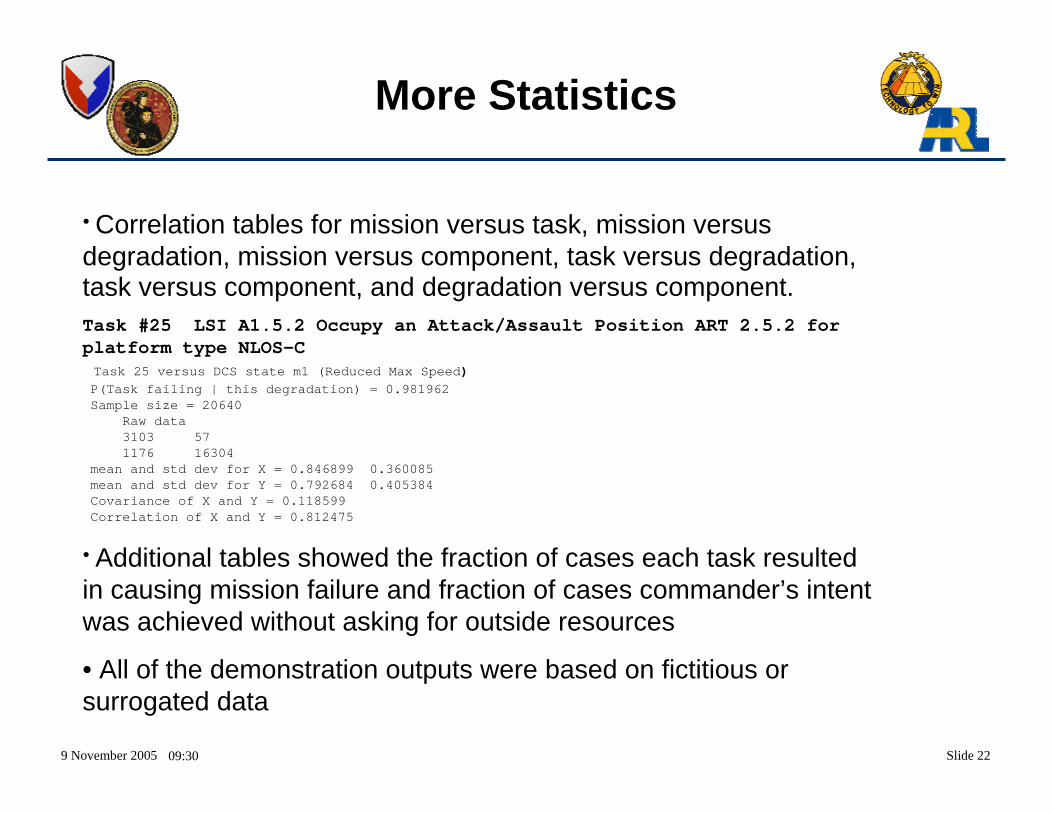
More Statistics
• Correlation tables for mission versus task, mission versus degradation, mission versus component, task versus degradation, task versus component, and degradation versus component. Task #25 LSI A1.5.2 Occupy an Attack/Assault Position ART 2.5.2 for platform type NLOS-CTask 25 versus DCS state m1 (Reduced Max Speed) P(Task failing | this degradation) = 0.981962Sample size = 20640
Raw data 3103 571176 16304
mean and std dev for X = 0.846899 0.360085mean and std dev for Y = 0.792684 0.405384Covariance of X and Y = 0.118599Correlation of X and Y = 0.812475
• Additional tables showed the fraction of cases each task resulted in causing mission failure and fraction of cases commander’s intent was achieved without asking for outside resources
• All of the demonstration outputs were based on fictitious or surrogated data
9 November 2005 Slide 2309:30
Demonstration Output –Graphical Displays
9 November 2005 Slide 2409:30
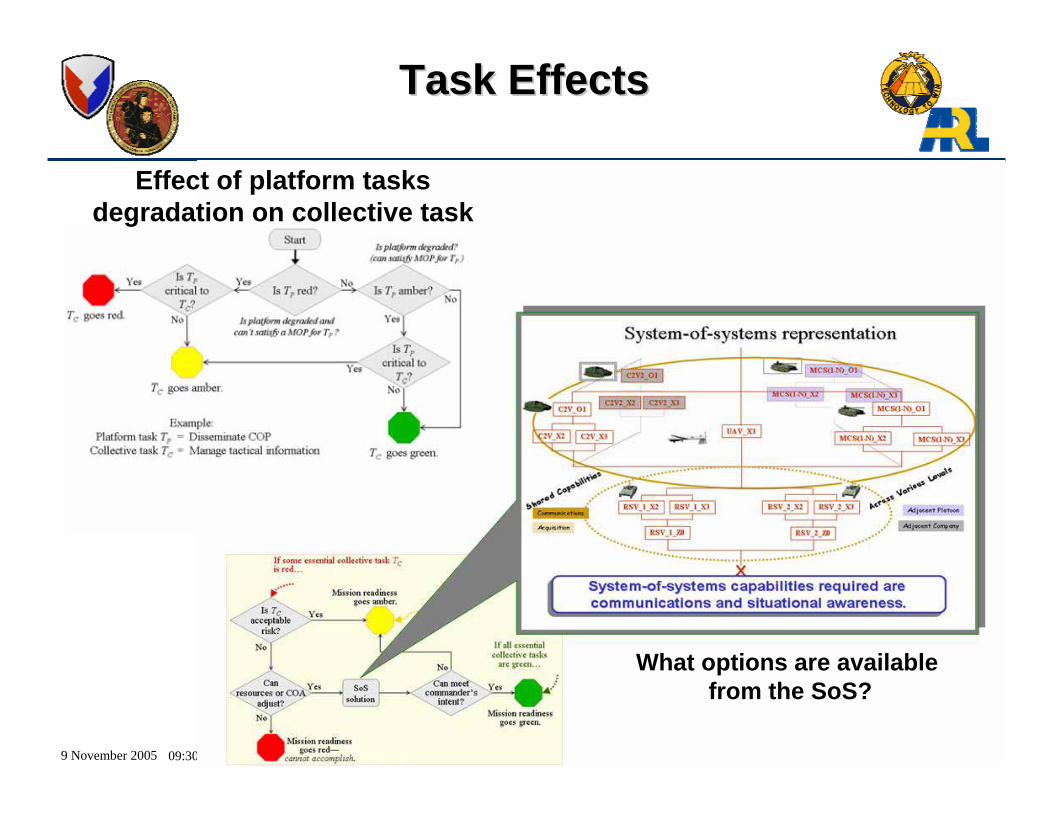
Task EffectsTask Effects
Effect of platform tasksdegradation on collective task
What options are available from the SoS?
9 November 2005 Slide 2509:30
ImplicationsImplications
• There was wide-spread acceptance of and agreement with demonstration results by key Army leadership• DCS data has multiple applications; force level modeling, training, simulation, and System-of-System evaluation• MMF data development for production studies will require close collaboration within the modeling and analysis communities in TRADOC, RDECOM, and ATEC•• Demo is first step toward a methodology for assessing the Demo is first step toward a methodology for assessing the effectiveness and feasibility of proposed courses of actioneffectiveness and feasibility of proposed courses of action
MMF demonstrated the linkage from low-level state changes to task/mission success
MMF demonstrated the linkage from lowMMF demonstrated the linkage from low--level level state changes to task/mission success state changes to task/mission success
9 November 2005 Slide 2609:30
Conclusions and Path Forward
• Demo showed that mission/task pass/fail could be tied to low-level state changes as claimed prior to demo
• To fully exploit MMF in future analyses and evaluations:– Improve dynamics (i.e., reduce scripting)– Enlarge vignette– Improve process for generating input data
• DUSA-OR has directed that MMF next be applied to a live exercise