mississippi economic review and outlook · mississippi economic review and outlook ... gross...
TRANSCRIPT
1
Mississippi Economic Review and Outlook
Note to Readers
Hang on tight! There’s a rocky road ahead. The downturn in the housing market is not over and, before it’s through, Global Insight predicts losses in the range of $60 to $120 billion by the financial system and a drop in housing prices of 11%, the largest such drop since the 1930s. Despite the grim news, the financial system can weather the hit and no recession is expected. See the article on the national outlook. Mississippi’s economy will slow in 2008, along with the national economy. The article on the state economic outlook provides details, with a focus on the coast. Besides the articles on the national and state economies, there is also a research brief examining the economic status of African Americans in Mississippi in this issue of the Review. Comments and feedback are welcomed, and may be published. To subscribe to this Review, see the form on the next page. National projections are based on the forecast of Global Insight, Inc. As always, the views expressed in the Review are those of the authors and do not necessarily represent the official position of the Center for Policy Research and Planning or the Mississippi Institutions of Higher Learning. Marianne T. Hill, Ph.D. [email protected] Editor and Senior Economist
Now available on-line at www.mississippi.edu/URC.html
go to “Publications”.
December 2007
In This Issue
1 Note to Readers 2 Subscribe Now 3 National Economic Outlook
10 Mississippi Economic Outlook 27 News and Notes 28 Economic Status of African
Americans in Mississippi 39 State Economic Forecast Tables 49 Tables with State Historical Data
Vol. 21, No. 2 ISSN 1530-5546
Published by the
Mississippi Institutions of Higher Learning
Thomas C. Meredith, Ed.D., Commissioner Philip W. Pepper, Ph.D., State Economist
----------
Debra E. Anderson, Econ. Dev. Planner Deborah D. Bridges, Admin. Assistant Marianne T. Hill, Ph.D., Sr. Economist Barbara J. Logue, Ph.D., Sr. Demographer Robert H. Neal, Ph.D., Sr. Economist Christian D. Pruett, Economist Peter J. Walley, Dir. Economic Development
Darrin M. Webb, Ph.D., Sr. Economist

2
Please fill in the form below and mail it with a check or money order payable to Mississippi Institutions of Higher Learning at the following address:
Mississippi Institutions of Higher Learning Center for Policy Research and Planning 3825 Ridgewood Road - 8th Floor Tower Attention: Deborah Bridges Jackson, MS 39211 Telephone (601) 432-6742
Name ________________________________________________________________________ Institution/Firm ________________________________________________________________ Street____________________Address/P.O.Box ______________________________________ City/State/Zip Code_____________________________________________________________ (Area Code) Telephone Number ___________________________________________________ Individual _____ Institution _____ One Year _____ Two Years _____ Back Issues (specify date) _____
SUBSCRIBE NOW
SUBSCRIPTION RATES FOR MISSISSIPPI ECONOMIC REVIEW AND OUTLOOK
One Year Two Years Individual $10 $15 Institution $20 $30
Back issues are available for $4 each.
NOTE: Persons working in the legislative or executive branch of state government, as well as county libraries and persons in state or local agencies or universities, are eligible for a waiver of the subscription fee. Please call to make necessary arrangements.
3
NATIONAL ECONOMIC OUTLOOK: LIGHT AT END OF TUNNEL RECEDES
Although the economy in the third quarter (Q3) proved stronger than anticipated, with a 3.9% growth rate of gross domestic product (GDP), the national economic outlook has been revised downward since June. The slowest growth rate since the 2001 recession is now predicted for 2008. The downturn in the housing market has reduced total investment spending, and has now translated into a broader squeeze on credit, hitting commercial real estate and consumer purchases as well as housing. Housing starts continue to drop, and will be below 1 million per year heading into 2008, down 54% from Q1 of 2006. Delinquency rates among homeowners continue to rise. On top of the growing credit crunch, oil prices were approaching $100 per barrel in mid-November and remain elevated, cutting into the purchasing power of consumers and businesses. Spending by households has been sustained by a solid, if moderate, growth of employment. Wages in 2007 won the battle with inflation as well, giving consumers a long-awaited boost in real purchasing power and offsetting some of the negative effects of falling home values. The outlook for 2008, however, is for slower growth of employment and of consumer spending. Exports have been a bright spot among national economic indicators. Sales to other countries have surged at double-digit rates as the value of the dollar has plummeted. Moderate growth in the world economy will sustain strong export growth, on the order of 10%, in 2008. The core rate of inflation, as measured by the consumer price index (CPI) excluding food and energy, has dropped to about 2.3% this year. With inflation under control, the Federal Reserve Board opted to cut the federal funds rate in October in an attempt to stimulate the slowing economy. It is likely to drop that rate further, to 4.25%, in January. The major downside risks to the Global Insight projections presented here come from the possibilities that oil prices will remain in the $90-$100 range over the next six months and/or that the credit crunch will become more severe than assumed in the baseline forecast. The probability of a brief recession in 2008 is now estimated at 35%.
hock waves from the subprime mortgage market meltdown are hitting financial markets hard, and losses
continue. The light at the end of the tunnel through the housing debacle is farther away than appeared to be the case at the time of our June forecast. While the economy’s solid performance in the third quarter was welcome news, there is clear evidence that growth rates will drop sharply in 2008, due to the effects of
the housing market downturn and the uptick in oil prices. Falling home equity values, higher mortgage payments for subprime borrowers, and high energy prices are pinch-ing consumers, and the drop in residential investment has now become an overall drop in investment spending. Global Insight predicts a growth rate of GDP of only 1.9% in 2008, with a 35% probability of a brief recession if oil prices
S

4
Table 1. TRENDS IN SELECTED NATIONAL EXPENDITURES(Billions of constant dollars and average annual percentage change unless otherwise indicated)
2007 2007 2007 2007 2008 2008Q1 Q2 Q3P Q4P Q1P Q2P
1. Gross Domestic Product (2000$) $11,413 $11,520 $11,631 $11,669 $11,690 $11,736 (% change) 0.6 3.8 3.9 1.3 0.7 1.62. Consumer Expenditures (2000$) $8,216 $8,244 $8,305 $8,345 $8,369 $8,412 (% change) 3.7 1.4 3.0 1.9 1.1 2.13. On Durable Goods (2000$) $1,223 $1,228 $1,242 $1,256 $1,242 $1,238 (% change) 8.5 1.7 4.4 4.5 -4.4 -1.34. On Nondurable Goods (2000$) $2,387 $2,384 $2,400 $2,406 $2,415 $2,433 (% change) 3.0 -0.5 2.7 1.0 1.5 2.95. On Services (2000$) $4,631 $4,657 $4,690 $4,712 $4,735 $4,761 (% change) 3.1 2.2 2.8 1.9 1.9 2.2
6. Gross Private Domestic Investment (2000$) $1,817 $1,837 $1,836 $1,798 $1,783 $1,740 (% change) -8.5 4.5 0.8 -9.4 -6.7 -6.47. In Equipment and Software (2000$) $1,045 $1,057 $1,073 $1,088 $1,094 $1,098 (% change) 0.3 4.6 5.8 5.6 2.2 1.88. In Nonresidential Structures (2000$) $283 $300 $308 $314 $309 $303 (% change) 10.4 22.7 12.0 8.5 -5.8 -6.89. In Residential Structures (2000$) $497 $482 $455 $416 $380 $358 (% change) -17.7 -12.5 -22.2 -33.8 -35.3 -22.5
10. Government Purchases (2000$) $1,995 $2,015 $2,033 $2,047 $2,057 $2,036 (% change) -0.5 4.0 3.7 2.7 1.9 1.111. Net Exports of Goods & Services (2000$) -$612 -$574 -$546 -$520 -$503 -$478 (% change) -9.9 25.0 19.3 19.1 13.1 20.012. Exports (2000$) $1,355 $1,380 $1,432 $1,459 $1,497 $1,529 (% change) 1.1 7.3 15.3 7.6 10.4 8.513. Imports (2000$) $1,967 $1,953 $1,978 $1,979 $2,000 $2,007 (% change) 3.8 -2.7 5.1 0.2 4.2 1.4
P = Preliminary or projected.Note: Percentage change refers to average annual rate, based on quarter-to-quarter growth rates multiplied by four.
SOURCE: Global Insight, Inc., November 2007.
remain in the $90-$100/barrel range for the next two quarters and other key variables weaken. Indicators Point to Slow Growth in 2008 Trends in aggregate expenditures are summarized in Table 1. The weak growth of output (line 1) in the first quarter (Q1) of this year, as investment, government purchases, and net exports all dropped, did not persist into Q2. Strong growth of nonresidential construction (line 8) and a 25% lift in exports (line 12) enabled a 3.8% growth of output in Q2. Similar factors at work in Q3 kept the growth rate of GDP at approximately the same level. Exports (line 12) will continue to be a strongly positive influence in the first quarter of 2008 and over the forecast period. Levels of spending on gross domestic investment
(line 6), however, will continue to sink as nonresidential construction (line 8) joins residential construction (line 9) in a downturn. Neither the government sector (line 10) or consumers (line 2) will be in a position to manage more than modest increases in spending.1
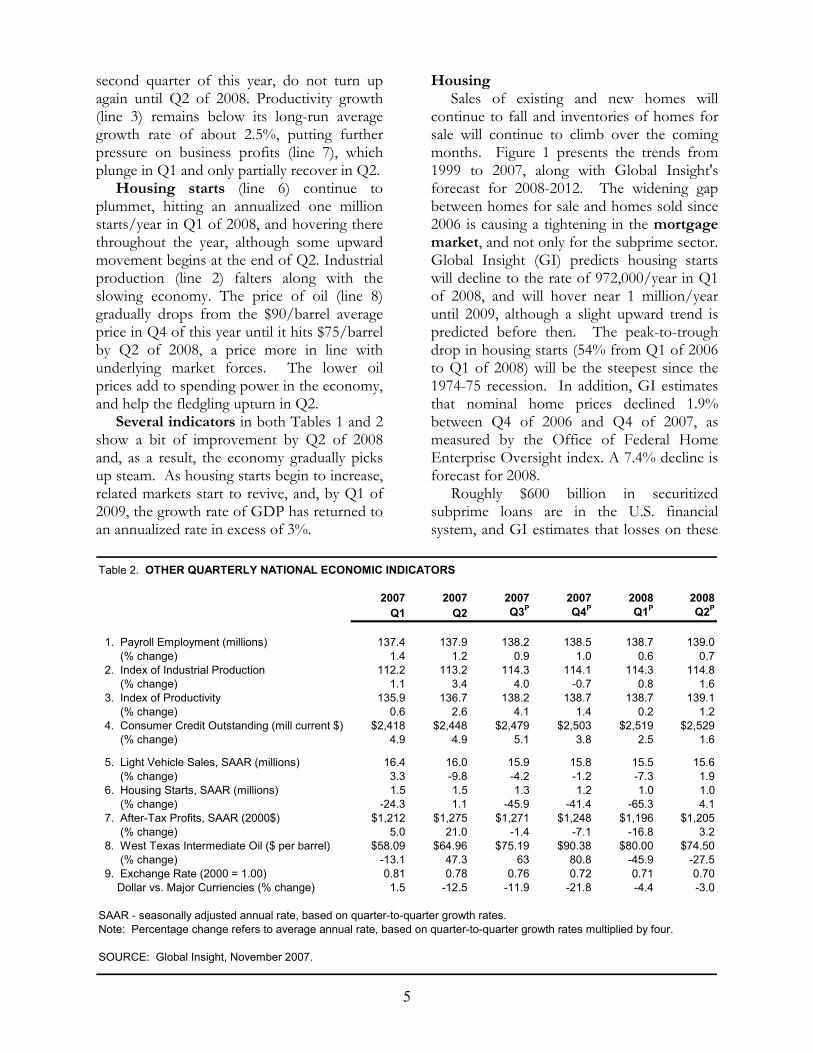
By the start of 2008, businesses are expected to slow their hiring in response to the slow growth of aggregate demand detailed in Table 1. Table 2 provides the related numbers. Payroll employment growth (line 1) slows to an average annual rate of 0.6% in Q1 of 2008 and achieves only a moderate 0.8% growth rate for the year (see also Table 3, which presents the forecast for the coming three years). Consumers are less willing to take on additional debt (line 4) as the labor and housing markets weaken. Light vehicle sales (line 5), which have been falling since the
5
second quarter of this year, do not turn up again until Q2 of 2008. Productivity growth (line 3) remains below its long-run average growth rate of about 2.5%, putting further pressure on business profits (line 7), which plunge in Q1 and only partially recover in Q2. Housing starts (line 6) continue to plummet, hitting an annualized one million starts/year in Q1 of 2008, and hovering there throughout the year, although some upward movement begins at the end of Q2. Industrial production (line 2) falters along with the slowing economy. The price of oil (line 8) gradually drops from the $90/barrel average price in Q4 of this year until it hits $75/barrel by Q2 of 2008, a price more in line with underlying market forces. The lower oil prices add to spending power in the economy, and help the fledgling upturn in Q2. Several indicators in both Tables 1 and 2 show a bit of improvement by Q2 of 2008 and, as a result, the economy gradually picks up steam. As housing starts begin to increase, related markets start to revive, and, by Q1 of 2009, the growth rate of GDP has returned to an annualized rate in excess of 3%.
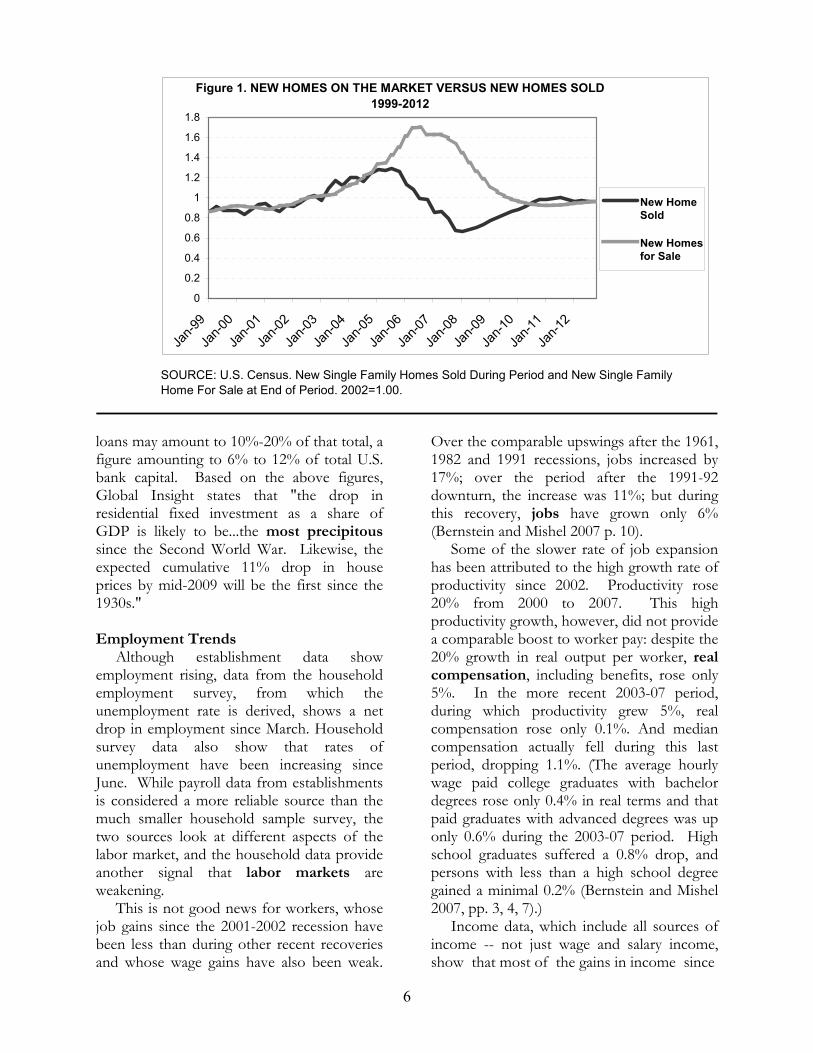
Housing Sales of existing and new homes will continue to fall and inventories of homes for sale will continue to climb over the coming months. Figure 1 presents the trends from 1999 to 2007, along with Global Insight's forecast for 2008-2012. The widening gap between homes for sale and homes sold since 2006 is causing a tightening in the mortgage market, and not only for the subprime sector. Global Insight (GI) predicts housing starts will decline to the rate of 972,000/year in Q1 of 2008, and will hover near 1 million/year until 2009, although a slight upward trend is predicted before then. The peak-to-trough drop in housing starts (54% from Q1 of 2006 to Q1 of 2008) will be the steepest since the 1974-75 recession. In addition, GI estimates that nominal home prices declined 1.9% between Q4 of 2006 and Q4 of 2007, as measured by the Office of Federal Home Enterprise Oversight index. A 7.4% decline is forecast for 2008. Roughly $600 billion in securitized subprime loans are in the U.S. financial system, and GI estimates that losses on these
Table 2. OTHER QUARTERLY NATIONAL ECONOMIC INDICATORS
2007 2007 2007 2007 2008 2008Q1 Q2 Q3P Q4P Q1P Q2P
1. Payroll Employment (millions) 137.4 137.9 138.2 138.5 138.7 139.0 (% change) 1.4 1.2 0.9 1.0 0.6 0.7 2. Index of Industrial Production 112.2 113.2 114.3 114.1 114.3 114.8 (% change) 1.1 3.4 4.0 -0.7 0.8 1.6 3. Index of Productivity 135.9 136.7 138.2 138.7 138.7 139.1 (% change) 0.6 2.6 4.1 1.4 0.2 1.2 4. Consumer Credit Outstanding (mill current $) $2,418 $2,448 $2,479 $2,503 $2,519 $2,529 (% change) 4.9 4.9 5.1 3.8 2.5 1.6
5. Light Vehicle Sales, SAAR (millions) 16.4 16.0 15.9 15.8 15.5 15.6 (% change) 3.3 -9.8 -4.2 -1.2 -7.3 1.9 6. Housing Starts, SAAR (millions) 1.5 1.5 1.3 1.2 1.0 1.0 (% change) -24.3 1.1 -45.9 -41.4 -65.3 4.1 7. After-Tax Profits, SAAR (2000$) $1,212 $1,275 $1,271 $1,248 $1,196 $1,205 (% change) 5.0 21.0 -1.4 -7.1 -16.8 3.2 8. West Texas Intermediate Oil ($ per barrel) $58.09 $64.96 $75.19 $90.38 $80.00 $74.50 (% change) -13.1 47.3 63 80.8 -45.9 -27.5 9. Exchange Rate (2000 = 1.00) 0.81 0.78 0.76 0.72 0.71 0.70 Dollar vs. Major Curriencies (% change) 1.5 -12.5 -11.9 -21.8 -4.4 -3.0
SAAR - seasonally adjusted annual rate, based on quarter-to-quarter growth rates.Note: Percentage change refers to average annual rate, based on quarter-to-quarter growth rates multiplied by four.
SOURCE: Global Insight, November 2007.
6
SOURCE: U.S. Census. New Single Family Homes Sold During Period and New Single Family Home For Sale at End of Period. 2002=1.00.
Figure 1. NEW HOMES ON THE MARKET VERSUS NEW HOMES SOLD 1999-2012
0
0.2
0.4
0.6
0.8
1
1.2
1.4
1.6
1.8
Jan-9
9
Jan-0
0
Jan-0
1
Jan-0
2
Jan-0
3
Jan-0
4
Jan-0
5
Jan-0
6
Jan-0
7
Jan-0
8
Jan-0
9
Jan-1
0
Jan-1
1
Jan-1
2
New HomeSold
New Homesfor Sale
loans may amount to 10%-20% of that total, a figure amounting to 6% to 12% of total U.S. bank capital. Based on the above figures, Global Insight states that "the drop in residential fixed investment as a share of GDP is likely to be...the most precipitous since the Second World War. Likewise, the expected cumulative 11% drop in house prices by mid-2009 will be the first since the 1930s." Employment Trends Although establishment data show employment rising, data from the household employment survey, from which the unemployment rate is derived, shows a net drop in employment since March. Household survey data also show that rates of unemployment have been increasing since June. While payroll data from establishments is considered a more reliable source than the much smaller household sample survey, the two sources look at different aspects of the labor market, and the household data provide another signal that labor markets are weakening. This is not good news for workers, whose job gains since the 2001-2002 recession have been less than during other recent recoveries and whose wage gains have also been weak.
Over the comparable upswings after the 1961, 1982 and 1991 recessions, jobs increased by 17%; over the period after the 1991-92 downturn, the increase was 11%; but during this recovery, jobs have grown only 6% (Bernstein and Mishel 2007 p. 10). Some of the slower rate of job expansion has been attributed to the high growth rate of productivity since 2002. Productivity rose 20% from 2000 to 2007. This high productivity growth, however, did not provide a comparable boost to worker pay: despite the 20% growth in real output per worker, real compensation, including benefits, rose only 5%. In the more recent 2003-07 period, during which productivity grew 5%, real compensation rose only 0.1%. And median compensation actually fell during this last period, dropping 1.1%. (The average hourly wage paid college graduates with bachelor degrees rose only 0.4% in real terms and that paid graduates with advanced degrees was up only 0.6% during the 2003-07 period. High school graduates suffered a 0.8% drop, and persons with less than a high school degree gained a minimal 0.2% (Bernstein and Mishel 2007, pp. 3, 4, 7).) Income data, which include all sources of income -- not just wage and salary income, show that most of the gains in income since
7
2000 have gone to families in the top 10% of the income distribution. In 2005, the most recent year for which such data is available, the income of the top decile rose, while all other families lost income (a 1% fall). And those at the very top gained the most: the top half of the top 1% gained 16% on their average annual income of $1.8 million, while those in the 90-95 percentile range gained only 2.2% (Bernstein and Mishel, 3/28/07). The trend toward widening inequality in the country, then, is continuing. It will be a factor entering into Congressional discussions about the alternative minimum tax, which will soon be hitting upper middle class families hard, if no action is taken. 2008-2010 Forecast The U.S. economy will narrowly skirt a recession during the next six months as the housing market continues to plummet and the financial sector tightens its lending practices. Table 3 presents Global Insight's forecast for 2008 to 2010. According to the GI forecast, the growth rate of real GDP drops to 1.9% in 2008 as real investment falls for the second straight year. Establishment employment expands, but at the reduced rate of 0.8%. Contract construction employment, which fell 0.7% in 2007, drops more sharply in 2008 (-3.2%). Despite expanding exports, manufac-turing employment continues to fall. The unemployment rate rises to 5.0%, and the slow growth of employment and earnings results in a more moderate growth rate of personal income (4.9%). Inflation remains under control as oil prices gradually return to the $75/barrel range. The Federal Reserve (the Fed) drops the federal funds rate to 4.25% by early 2008, and interest rates fall, with the prime
rate going from its average of 8.1% in 2007 to 7.3% in 2008. This in turn stimulates spending. The economy begins to regain its strength as housing starts inch upward in the spring of 2008. By the end of the year, spending on residential investment finally registers positive growth. The national economy is on an upswing by 2009, with the growth rate of GDP close to 3.0%. Payroll employment grows 1.2% in 2009 and 1.3% in 2010. As the slack in the labor market is taken up, personal incomes pick up and the unemployment rate falls back to 4.8% by 2010. A fuller version of the national economic forecast is provided at the end of this Review, in Appendix I, Tables 8 and 9. Alternative Forecast Scenarios As of November, Global Insight estimates the probability of a recession in 2008 at 35%. In addition, the baseline forecast has been revised downward from that published in the June Review: the GDP growth rate in 2008 is now forecast to be 1.9%, down from 2.8%, and in 2009, 2.9%, down from 3.3%. The probability of a more optimistic outcome than that predicted under the baseline scenario has been reduced from 20% to 10%. Under the pessimistic scenario (probability 35%), several variables do not perform as well as assumed in the baseline forecast. Most importantly, the housing market decline is even steeper than predicted, with housing starts, housing sales, and home prices all lower than in baseline assumptions. The negative effects on consumers, business, and financial markets are, then, even greater. The poorer economic outlook causes further retrenchment of investment spending.
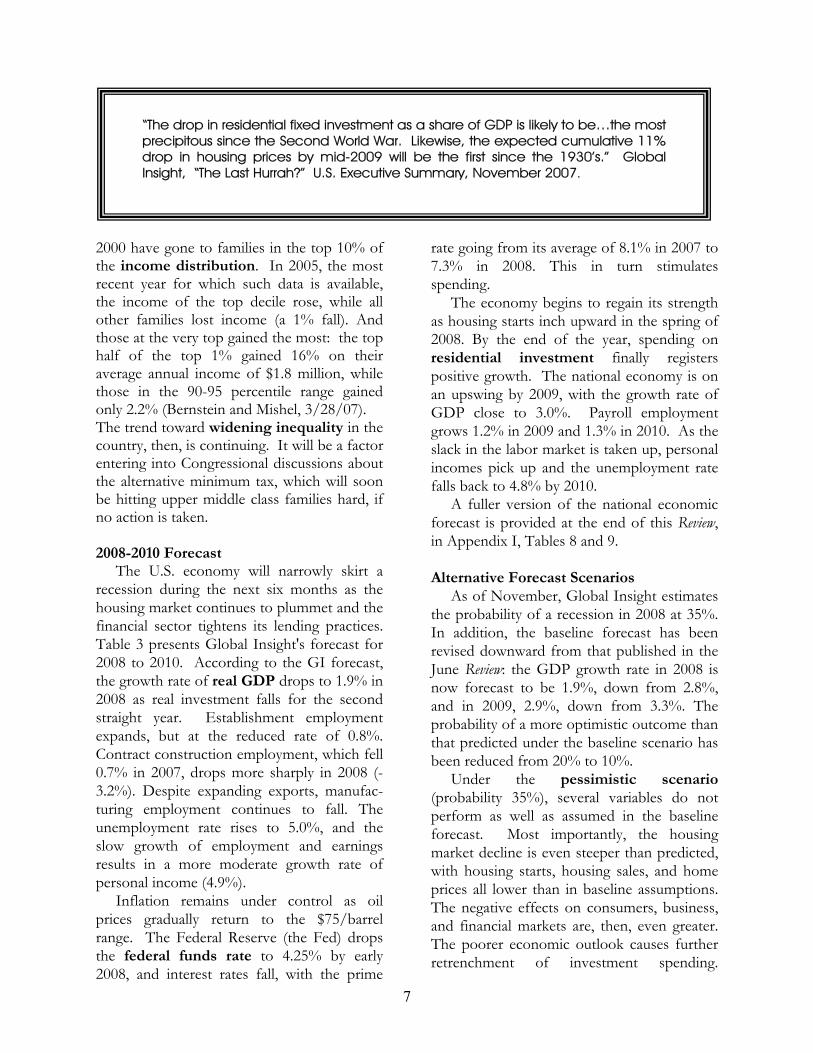
“The drop in residential fixed investment as a share of GDP is likely to be…the most precipitous since the Second World War. Likewise, the expected cumulative 11% drop in housing prices by mid-2009 will be the first since the 1930’s.” Global Insight, “The Last Hurrah?” U.S. Executive Summary, November 2007.

8
Table 3. U.S. ECONOMIC FORECAST 2007-2010(Percent change)
2007 2008 2009 2010
U. S. Gross Domestic Product (GDP) 4.7 3.6 4.6 4.9Real GDP 2.1 1.9 2.9 2.9GDP Price Index 2.6 1.6 1.7 2.0Real Gross Domestic Investment -5.0 -3.9 4.5 6.1
Establishment Employment 1.3 0.8 1.2 1.3
Manufacturing -1.2 -1.7 -1.4 0.4 Contract Construction -0.7 -3.2 -0.6 1.7 Transportation, Utilities 0.9 0.6 1.5 0.9 Wholesale, Retail Trade 0.8 0.5 1.3 0.5
Finance, Insurance, Real Estate 1.0 0.0 2.0 2.0 Health & Social Services 3.0 2.9 2.4 1.4 Business & Professional Services 2.1 2.2 4.2 3.8 Leisure & Hospitality 3.2 2.1 1.4 0.9 Government 1.2 1.0 0.5 0.8
Unemployment Rate1 4.6 5.0 5.0 4.8Personal Income 6.5 4.9 5.0 5.3Consumer Price Level 2.9 2.0 1.6 1.9Prime Rate1 8.1 7.3 7.6 7.71Not percentage change.
SOURCE: Global Insight, November 2007.
Under this scenario, which pushes negative assumptions to a reasonable extreme, the price of oil shoots above $100 in Q1 of 2008 and productivity growth drops, averaging to 0.7% for the year and only 1.6% over the forecast period, compared to the baseline 2%. In this situation, Global Insight predicts that the growth rate of GDP will be -0.4% in Q4, -1.6% in Q1 of 2008 and -0.2% in Q2. Payroll employment, although it remains steady in Q4 of 2007, falls slightly in both Q1 and Q2 of 2008. Industrial production, already predicted to drop in Q4 in the baseline forecast, continues to fall over the first three quarters of 2008. A misstep by the Fed, which ignores rising inflation for slightly too long, is also part of this scenario. Rising motor vehicles sales and increased spending on equipment and software in Q2 of 2008 are
among the first harbingers of recovery. The growth rate of GDP rises from 0.4% in 2008, to 1.8% in 2009 and 2.6% in 2010. The optimistic scenario (probability 10%), on the other hand, is based on the fortuitous confluence of several positive developments. One key assumption is that of a high growth rate of productivity, averaging in excess of 2% annually, compared to the 2% baseline rate. An increase in output per worker hour enabled by new technologies and improved efficiency has positive effects on profits and business expectations under this scenario, and investment and employment perk up. The higher productivity growth enables business to pay higher wages, while keeping prices low, and strengthens the competitive position of the U.S. inter-nationally.

9
The housing downturn is assumed to be somewhat less steep than in the baseline, averaging about 200,000 more housing starts in 2008. The price of oil at the same time is a bit lower, falling slightly below $70 in Q1 and averaging $65/barrel over the course of the year. The world economy is stronger, boosting exports. Under the optimistic scenario, then, the growth rate of GDP picks up steadily from a low of 1.7% in Q4 of this year until it hits 2.9% in Q2 of 2008. The growth rate of GDP in 2008, then, comes in
at 2.8% and in 2009, at 3.7%. The growth of payroll employment follows a similar trend, accelerating from an annual rate of 1.1% in Q4 to 1.4% in Q1 and reaching a 2.0% rate by Q3, at which point nonresidential investment spending also picks up, growing at a rate in excess of 6%. The upswing peaks in 2009, and the growth rate of GDP averages about 3.0% for the next two years. Written by Marianne Hill, with input from members of the Center for Policy Research and Planning.
Table 4. ALTERNATIVE SCENARIOS AND PROBABILITIES FOR NATIONAL ECONOMIC FORECAST2007 2008 2009 Probability
Baseline 2.1 1.9 2.9 55%
Optimistic 2.1 2.8 3.7 10%
Pessimistic 2.0 0.4 1.8 35%
SOURCE: Global Insight, November 2007.
Note
1. An emerging issue in the area of government expenditures is that of contracting out to the private sector services typically performed by the government. This trend can be seen at both the national and state & local levels. Data on federal spending from the Consolidated Federal Funds Report of the U.S. Census shows that from 1995 to 2005 federal procurement expenditures increased from a value equal to 120% of total wages & salaries paid by the federal government to 165% (in FY2005 this was $381 billion compared to $231.5 billion for wages and salaries).The Federal procurement office provides similar data, which show that the "value of actions" has increased from $235 billion in 2001 to $415 billion in 2006, which represents an average annual rate of increase of 15%. The federal services contracted out to private hands include protective services abroad and disaster management at home. Data on trends at the state and local level are harder to come by. Several examples can be given of functions formerly performed by municipal governments that are now being handled by the private sector. Private prisons are an example at the state level of a new area open to private contractors. Systems for oversight and accountability may be playing catch-up, according to some critics. See, for example, “Disaster Capitalism” by Naomi Klein in the October 2007 issue of Harper’s Magazine. New York.
Sources Bernstein, J. and L. Mishel. 9/3/2007. “Economy’s Gains Fail to Reach Most Workers’ Paychecks”, EPI Briefing Paper #195. Economic Policy Institute. At www.epinet.org Economy.com at www.Economy.com.
Economic Policy Institute, “The ARMs Alarm”, AGDP Picture@, “Income Picture”, AJobs Picture@, “Wide Impact of the Housing Slump on the Economy” and “Trade Picture” at www.epinet.org. Energy Information Agency, U.S. Department of Energy. www.eia.doe.gov. Federal Reserve Board, Beige Book, available at www.federalreserve.gov . Global Insight, Inc. Forecasts and Reports. See www.globalinsight.com. Kiplinger Letters. Available at www.kiplingerforecasts.com. Mishel, L. and J. Bernstein. 3/28/07. “Recent Income Gains Went to Those with Highest Income”, Economic Snapshot, Economic Policy Institute. www.epinet.org. National Foreign Trade Council, at www.nftc.com. Organization for Economic Cooperation and Development, AOECD Economic Outlook ", at www.oecd.org/eco. Realty Times, at http://realtytimes.com U.S. Census Bureau. U.S. Bureau of Labor Statistics, “Employment, Hours, and Earnings”, Current Employment Statistics, B Tables. www.bls.gov/ces/cesbtabs.htm U.S. Department of Commerce and U.S. Department of Labor reports.
10
MISSISSIPPI ECONOMIC OUTLOOK: CAN THE STATE BUCK NATIONAL TRENDS?
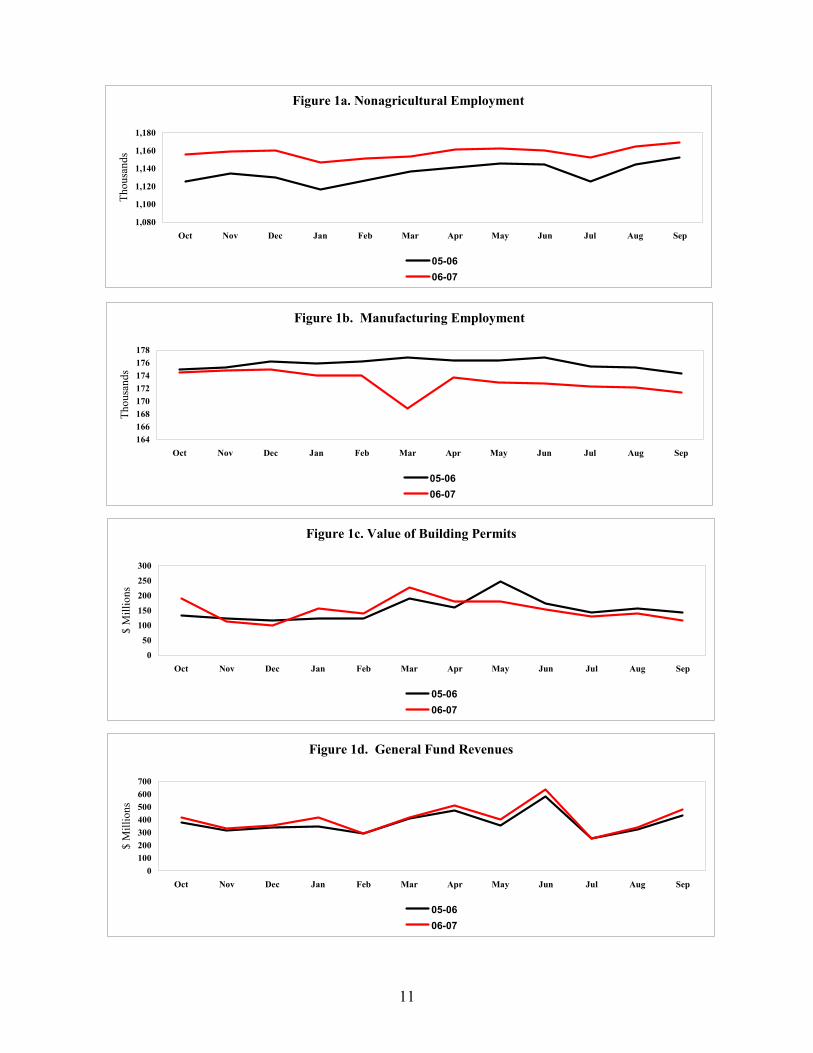
Employment in Mississippi was 1.8% higher during the first nine months of 2007 than during the same period in 2006, and has followed a generally steady upward trend since January. The state’s strong employment growth this year will outpace the national rate of increase of about 1.3%. However, the growth rates of employment, retail sales and other economic indicators for the state have been slowing, foreshadowing a slower pace of economic growth in 2008. The high level of economic activity in the state in 2007 has been fueled in part by post-Katrina reconstruction and by several major investment projects. Construction employment has been growing at an annual rate of 5.2%, and employment in amusements/gambling at 16% as casinos on the coast rebuild. Construction employment in the five coastal counties is up 6.7% in comparison to 2006, while the rest of the state has experienced a 4.9% growth in construction jobs, year-to-date. State Tax Commission transfers so far this fiscal year (July through October) were just 3.1% above collections for the same months in 2006. This is substantially below the rate of increase in the past two fiscal years. In FY2006, state revenue collections rose 12.9%, and in FY2007 10.5%, as spending surged in the wake of Katrina. Progress in recovery on the coast continues to be uneven. The hard-hit leisure & hospitality sector in Gulfport-Biloxi has achieved a remarkable comeback and gaming is approaching pre-Katrina levels of employment. The recovery in manufacturing is even further along. However, housing remains a severe problem. Consumers are displaying a more cautious approach to the economy. Consumer confidence dropped slightly during the summer, although the latest business confidence survey shows business expectations largely unchanged from the start of the year.
eading into 2008, growth rates at both the national and state levels are slowing. However, economic mo-mentum in Mississippi is stronger than
for the U.S. as a whole, as the billions of dollars for post-Katrina recovery continue to work their way through the economy. In addition, several major projects across the state are providing a lift to construction and related activity. Employment grew a strong 1.8% year-to-date through September, and is expected to post an overall growth rate of 1.5% for the year as a whole. By contrast, the national growth rate of employment will, at most, reach 1.3% this year. Among the new private investment projects driving economic activity in Mississippi are a $1.3 billion auto plant
(Toyota), a $400 million diesel engine plant (PACCAR), and the $700 million Margaritaville Casino and Resort. SeverCorr’s $880 million steel mill also just began operations. In addition, Mississippi has been chosen as one of the sites for expansion of the Strategic Oil Reserve (estimated cost here: $1 billion). Trends in Key Indicators Major trends in the state's economy are summarized in Figures 1a to 1h. The number of persons employed in the state has been rising steadily over the course of the year, interrupted only by the usual seasonal drop in the summer months. See Figure 1a. Payroll employment during the past twelve months has averaged more than 20,000 jobs above
H
11
Figure 1d. General Fund Revenues
0100200300400500600700
Oct Nov Dec Jan Feb Mar Apr May Jun Jul Aug Sep
$ M
illio
ns
05-0606-07
Figure 1c. Value of Building Permits
0
50
100150
200
250
300
Oct Nov Dec Jan Feb Mar Apr May Jun Jul Aug Sep
$ M
illio
ns
05-0606-07
Figure 1a. Nonagricultural Employment
1,080
1,100
1,120
1,140
1,160
1,180
Oct Nov Dec Jan Feb Mar Apr May Jun Jul Aug Sep
Thou
sand
s
05-0606-07
Figure 1b. Manufacturing Employment
164166168170172174176178
Oct Nov Dec Jan Feb Mar Apr May Jun Jul Aug Sep
Thou
sand
s
05-0606-07

12
Figure 1e. Personal Income Tax Revenues
0
50
100
150
200
250
Oct Nov Dec Jan Feb Mar Apr May Jun Jul Aug Sep
$ M
illio
ns
05-0606-07
Figure 1f. Retail Sales
0
1,000
2,000
3,000
4,000
5,000
Oct Nov Dec Jan Feb Mar Apr May Jun Jul Aug Sep
$ M
illio
ns
05-0606-07
Figure 1g. Gaming Revenue -- Coast
020406080
100120140
Oct Nov Dec Jan Feb Mar Apr May Jun Jul Aug Sep
$ M
illio
ns
05-0606-07
Figure 1h. Gaming Revenue -- River
0
50
100
150
200
Oct Nov Dec Jan Feb Mar Apr May Jun Jul Aug Sep
$ M
illio
ns
05-0606-07

13
year-ago levels. This strong increase in employment has been achieved despite a drop in manufacturing employment, which is down 2% year-to-date through September (Figure 1b). The dip seen in March was due to a strike in shipbuilding. There has been a steady upward trend in construction employment since the start of the year, with construction activity strong both on the coast and in the rest of the state. The value of building permits issued for new housing has been below year-ago levels since May (Figure 1c), although levels of current activity in both residential and nonresidential construction remain high in much of the state. Foreclosure rates in the state have shot up in recent months, and are likely to increase, particularly on the coast where the moratorium on housing foreclosures after the hurricane has recently ended. National trends in the housing market are adverse, as the article on the national outlook explains, and the growth rate of housing construction here is expected to slow further during the coming year. The situation on the coast is discussed in greater detail below. General fund revenues so far this fiscal year, July through October 2007, were just 3.1% above revenues for the same months in 2006. This is substantially below the rate of increase in the past two fiscal years. In FY2006, state revenue collections rose 12.9% and in FY2007 10.5%, as spending surged in the wake of Katrina. See Figure 1d. Personal income tax revenues were up 5.0% (Figure 1e), but the sales tax flat-lined as retail sales slowed (Figure 1f). This slowing growth of revenues will complicate the upcoming legislative session.1 Gaming on the coast has not only recovered but has surpassed its pre-storm levels of gross revenues (Figure 1g). Year-to-date through August, gross revenues totaled $900 million, or 1.0% above pre-Katrina levels for the same period in 2005. River gaming revenues have been slightly below year-ago levels for most of the past twelve months (Figure 1h). Competition from the
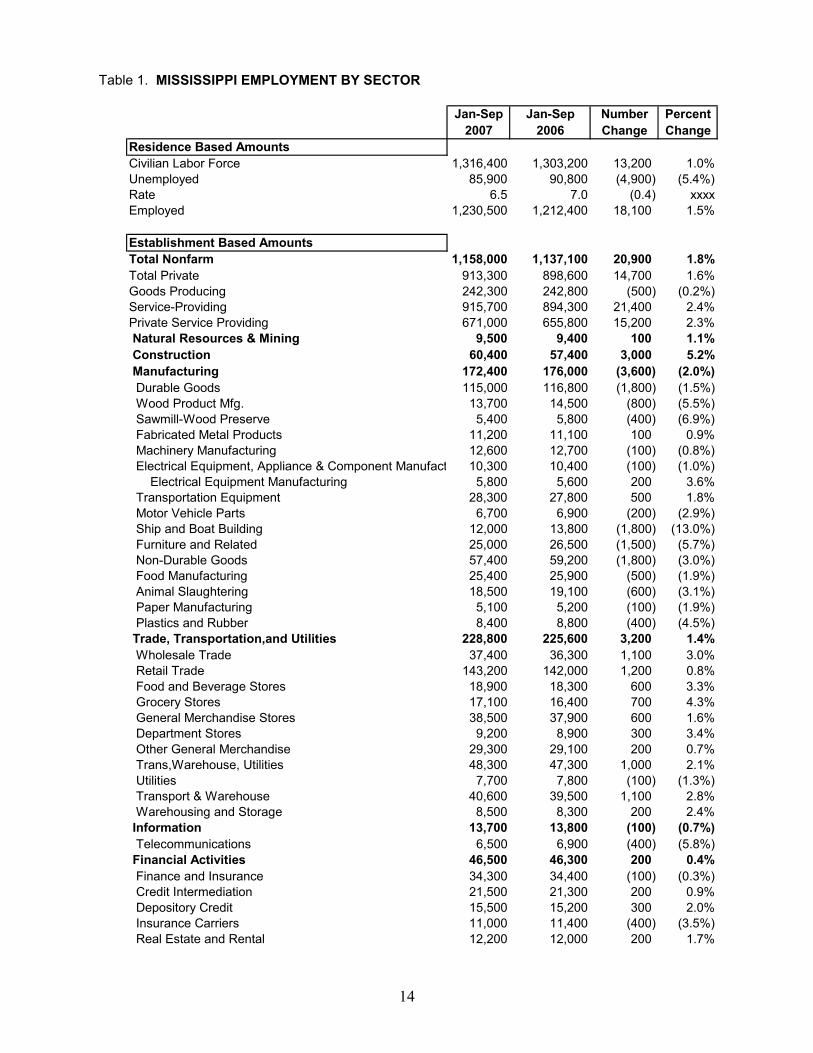
new and rebuilt casinos opening on the coast is certainly a factor. However, the high cost of gasoline and the uncertainty afflicting the national economy may mean a slowing rate of revenue growth for both markets over the coming months. The latest index of consumer confidence calculated by the Mississippi Center for Policy Research and Planning shows that consumers are displaying a more cautious approach to the economy, with the index dropping slightly. On the other hand, the latest business confidence survey shows business expectations largely unchanged from the start of the year. A Closer Look at Employment Employment has increased steadily throughout 2007. Table 1 shows the figures year-to-date for 2007. Total payroll employment through September 2007 was up 1.8% compared to the same period in 2006, although the number of persons employed in coastal counties remained 4% below 2005 levels. The state unemployment rate, which hit 9.5% in September 2005 in the aftermath of the storm, was down to 6.1% this September. About 20,900 more persons were employed in the first nine months of 2007 than during the same period in 2006. The number of persons employed in the goods-producing sectors dropped slightly in the first three quarters of 2007 compared to the same period in 2006, while service-providing industries created an impressive 21,400 net new jobs. Employment gains in the services-producing sectors were broadly based. Three industries added over 3,000 jobs each: health care & social assistance, accommodation, and local government education. Amusement/ gambling and accommodation experi-enced double-digit growth rates, as the coast approached pre-Katrina levels of em-ployment. Transportation/utilities, whole-sale trade, professional & business activities, and government each had growth rates of over 2%. The rapid growth of professional,
14
Table 1. MISSISSIPPI EMPLOYMENT BY SECTOR
Jan-Sep Jan-Sep Number Percent2007 2006 Change Change
Residence Based AmountsCivilian Labor Force 1,316,400 1,303,200 13,200 1.0%Unemployed 85,900 90,800 (4,900) (5.4%)Rate 6.5 7.0 (0.4) xxxxEmployed 1,230,500 1,212,400 18,100 1.5%
Establishment Based AmountsTotal Nonfarm 1,158,000 1,137,100 20,900 1.8%Total Private 913,300 898,600 14,700 1.6%Goods Producing 242,300 242,800 (500) (0.2%)Service-Providing 915,700 894,300 21,400 2.4%Private Service Providing 671,000 655,800 15,200 2.3% Natural Resources & Mining 9,500 9,400 100 1.1% Construction 60,400 57,400 3,000 5.2% Manufacturing 172,400 176,000 (3,600) (2.0%) Durable Goods 115,000 116,800 (1,800) (1.5%) Wood Product Mfg. 13,700 14,500 (800) (5.5%) Sawmill-Wood Preserve 5,400 5,800 (400) (6.9%) Fabricated Metal Products 11,200 11,100 100 0.9% Machinery Manufacturing 12,600 12,700 (100) (0.8%) Electrical Equipment, Appliance & Component Manufact 10,300 10,400 (100) (1.0%) Electrical Equipment Manufacturing 5,800 5,600 200 3.6% Transportation Equipment 28,300 27,800 500 1.8% Motor Vehicle Parts 6,700 6,900 (200) (2.9%) Ship and Boat Building 12,000 13,800 (1,800) (13.0%) Furniture and Related 25,000 26,500 (1,500) (5.7%) Non-Durable Goods 57,400 59,200 (1,800) (3.0%) Food Manufacturing 25,400 25,900 (500) (1.9%) Animal Slaughtering 18,500 19,100 (600) (3.1%) Paper Manufacturing 5,100 5,200 (100) (1.9%) Plastics and Rubber 8,400 8,800 (400) (4.5%) Trade, Transportation,and Utilities 228,800 225,600 3,200 1.4% Wholesale Trade 37,400 36,300 1,100 3.0% Retail Trade 143,200 142,000 1,200 0.8% Food and Beverage Stores 18,900 18,300 600 3.3% Grocery Stores 17,100 16,400 700 4.3% General Merchandise Stores 38,500 37,900 600 1.6% Department Stores 9,200 8,900 300 3.4% Other General Merchandise 29,300 29,100 200 0.7% Trans,Warehouse, Utilities 48,300 47,300 1,000 2.1% Utilities 7,700 7,800 (100) (1.3%) Transport & Warehouse 40,600 39,500 1,100 2.8% Warehousing and Storage 8,500 8,300 200 2.4% Information 13,700 13,800 (100) (0.7%) Telecommunications 6,500 6,900 (400) (5.8%) Financial Activities 46,500 46,300 200 0.4% Finance and Insurance 34,300 34,400 (100) (0.3%) Credit Intermediation 21,500 21,300 200 0.9% Depository Credit 15,500 15,200 300 2.0% Insurance Carriers 11,000 11,400 (400) (3.5%) Real Estate and Rental 12,200 12,000 200 1.7%

15
Table 1. MISSISSIPPI EMPLOYMENT BY SECTOR (continued)Jan-Sep Jan-Sep Number Percent
2007 2006 Change ChangeProfessional and Business Activities 95,900 93,700 2,200 2.30% Professional, Scientific and Technical Services 35,800 34,000 1,800 5.3% Management of Companies 9,400 9,500 (100) (1.1%) Administrative and Support 50,800 50,200 600 1.2% Educational and Health Services 125,400 121,700 3,700 3.0% Educational Services 16,000 15,700 300 1.9% Health Care and Social Assistance 109,300 106,000 3,300 3.1% Hospitals 30,600 29,400 1,200 4.1% Nursing and Residential Care 22,800 21,900 900 4.1% Leisure and Hospitality 123,600 117,700 5,900 5.0% Arts, Entertainment, and Recreation 12,500 10,900 1,600 14.7% Amusement, Gambling 11,600 10,000 1,600 16.0% Accommodation and Food services 111,000 106,800 4,200 3.9% Accommodation 32,000 28,800 3,200 11.1% Food Services and Drive Ins 79,100 78,100 1,000 1.3% Other Services 37,200 37,100 100 0.3% Repair and Maintenance 9,100 9,800 (700) (7.1%)Government 244,700 238,400 6,300 2.6% Federal Government 26,100 26,200 (100) (0.4%) State Government 59,600 57,800 1,800 3.1% State Govt. Education 21,200 20,200 1,000 5.0% Local Government 159,000 154,400 4,600 3.0% Local Govt Education 85,800 82,400 3,400 4.1%
SOURCE: Mississippi Employment Security Commission, September, 2007. Preliminary figures.
Residence employment estimates are based on household surveys, whereas establishment data arebased on jobs reported at places of work. A person with two jobs will generally be counted twice by establishment data, but not by the household data. A person residing in Mississippi but employed outside of the state will be included in residence-based data, but not in establishment data. The self-employed are also better captured by residence-based data.
scientific and technical services (5.3%) suggests that the state is beginning to move towards closing its technological gap with the rest of the nation. Insurance carriers, utilities, and telecommunications, on the other hand, reduced their workforces. Among goods-producing industries, the most rapid growth of employment has been in construction. The overall growth rate for the state was 5.2%. Figure 2 shows the trends on the coast, compared to the trends in the rest of the state. The number of construction jobs in the five coastal counties making up the Gulfport-Biloxi and Pascagoula Metropolitan Statistical Areas (MSAs) was up 6.7% for the year-to-date as of September, but the rest of the state also showed strong growth, with a growth rate of 4.9%. Despite the strong increase in construction employment and a 1.1% increase in mining employment, there was a drop of 0.2% in the
goods producing sectors, due to the loss of 3,600 manufacturing jobs. This loss was equally divided between nondurable and durable goods industries. Among nondur-ables, plastics & rubber, food and paper all lost workers. Among durable industries, losses were concentrated in shipbuilding, furniture, and wood products, although machinery and appliances also reduced their workforces. Electrical equipment and fabric-cated metals saw modest gains, and, if shipbuilding is excluded, employment in the transportation equipment industry rose by 2,300 persons – a 16% increase. Shipbuilding, however, lost 1,800 jobs. The trend in total manufacturing employment since April has been downward. Coastal Recovery Employment in the five coastal counties, which account for about 15% of

16
the state’s total employment, is now only 3% below pre-Katrina levels. As Figure 3 shows, employment in all major sectors except for manufacturing, leisure & hospitality and retail trade are at or above levels prevailing in August of 2005. The gains in construction employment have been by far the greatest. The number of workers in construction & mining (12,500) is over 50% above pre-storm levels. Leisure & hospitality employment in Gulfport-Biloxi is at 80% of pre-storm levels, but has been increasing rapidly. This figure includes accommodation & food services as well as entertainment & recreation (with gambling as a subcategory). Many of those employed have been hired since 2005, and many of these new employees are recent arrivals to the area. School enrollment figures reflect the turmoil in population. As of October of this year, the number of students enrolled in the Biloxi School District was 20% below pre-Katrina levels; the possibility of closing some schools in the district has been discussed. (Enrollment figures for all school districts for 2006-07 are not yet available.)2
Housing and Other Issues Housing remains the critical issue on the coast for residents and employers. The rate of rebuilding has been slow. This year, year-to-date through August, 4,527 housing permits for new home construction were issued in the five coastal counties. The total number of permits for new housing units issued for both 2006 and 2007 will come in at about 12,300. In comparison, about 14,449 units on the coast were more than 50% destroyed and another 45,000 suffered major damage.3 Even before the hurricane, though, there would have been about 6,400 permits issued over the same period, so the increase in permits has only been about 6,000 (see footnote for methodology and data sources). An estimated 15,000 FEMA trailers were still in use this December, down from 40,000 in March of 2006 (see June 2007 Review, p. 16). A recent RAND study looks at housing on the coast and estimates that permits have been issued for about 60% of storm-damaged units (McCarthy and Hanson, 2007). This includes repairs as well as reconstruction. The same
SOURCE: Mississippi Department of Employment Security, November 2007.
Figure 2. CONSTRUCTION EMPLOYMENT IN STATE AND COASTAL MSA'S
August 2005 = 100
80
100
120
140
160
Aug Nov Feb May Aug Nov Feb May Aug
TotalCoastRest of State

17
Figure 3. GULF COAST EMPLOYMENT AS PERCENT OF PRE-KATRINA LEVELS, AUGUST 2007
SOURCE: Mississippi Center for Policy Research and Planning, September 2007. Leisure and hospitality figures are for Gulfport-Biloxi only.
97%156%
89%80%
104%98%
101%106%105%
100%106%
60% 80% 100% 120% 140% 160% 180%
TOTAL EMPLOYMENTConstruction
ManufacturingLeisure,Hosplty G-B Transport & Utilities
Retail TradeGovernmentFederal Govt
State GovtLocal Govt
Local Education
Percent of Pre-Katrina Levels
study points out that rebuilding of single homes has outpaced the reconstruction of rental housing. Rental housing, in fact, suffered a disproportionately hard hit in terms of the severity of storm damage. (See December 2006 Review p. 20.) More generally, the researchers find that recovery is slower in the affordable-housing market than it is in the upper end of the market. “Access to financing appears to be the single most important obstacle to recovery,” says the RAND summary fact sheet. Homeowners and realtors on the coast, however, typically cite the cost of insurance as the key factor reducing the affordability of housing. One realtor stated that his cost for $250,000 worth of coverage on some rental property had increased from $4,400 per year to $14,000. For homeowners, coverage for a
$135,000 residence near the coast has increased from about $1,500 to just under $4,000. The doubling and tripling of insurance rates has impacted condominium develop-ments planned for the Gulf, as has the national downturn in the housing market. The selling prices of condominiums along the coast from Mississippi to Florida have suffered a significant drop, and vacancy rates are often high, according to local realtors, who also note that some projects planned for the Mississippi coast have been cancelled or modified (for example, units are being made more affordable by reducing the size of the typical unit being constructed). There are programs that provide incentives for those building housing that is affordable to the local workforce, but so far no end to

18
the current shortage is within sight. The cost of housing has increased the cost of living in the area.4 Most recently, legislation is being proposed that would enable a voluntary federal buy-out program for residents who wish to move farther inland from the coast. The slow pace of the housing recovery is taking its toll on residents. The percentage of the population showing signs of mental illness, such as post-traumatic stress syndrome (PTSD), increased from 27% shortly after the storm to 32% this year, according to a study done by Harvard Medical School’s Katrina Community Advisory Group (SunHerald, 11/4/07). A disaster is typically a short-term phenomenon, followed by a spike in mental health problems which then abate as the recovery proceeds. This disaster has been different. The continuing crisis on the coast, the study points out, has resulted in unmet mental health needs, a problem that will come up in the 2008 state legislative session. Several new projects are planned for the coast. A $60 million oil and gas drilling platform, announced in June by Gulf Ship, is among them. A Strategic Oil Reserve facility at Richton will be built to hold 160 million
barrels of crude oil, with pipelines running from Pascagoula to Richton. These projects are not without controversy. In some cases, projects compete with the existing fishing and tourism industries, which could be adversely impacted. Wetlands protection is also an issue of increasing concern after the Corps of Engineers relaxed its wetlands regulations to accommodate some post-Katrina projects.5 References to some news reports related to the coast are provided at the end of this article.6
Short-Term Outlook The post-Katrina recovery will continue to bolster economic growth in the state over the next few years, and will, to some extent, offset negative national trends. The state forecast is summarized in Table 2. Gross state product is forecast to grow 3.0% in real terms in 2007, dipping to 2.3% in 2008 due to the slowdown in the national economy, but rising again to 2.6% in 2009. Employment, which grew 1.1% in 2006, will post at least a 1.5% gain in 2007, and the growth of employment will be close to 1.0% for the following two years. The accom-
Table 2. ECONOMIC FORECAST FOR 2007-2010
2007 2008 2009 2010Mississippi Gross State Product (Percent Change) 5.7 4.2 4.6 4.7 Real Gross State Product (Percent Change) 3.0 2.3 2.6 2.7 Price Level (Percent Change) 2.6 1.9 1.9 2.0 Establishment Employment (Percent Change) 1.5 0.9 0.8 1.1 Unemployment Rate 6.5 6.4 6.3 6.0 Personal Income (Percent Change) 5.6 5.0 4.6 5.0 Consumer Price Level-South (Percent Change) 2.3 2.1 2.0 1.9
United States Gross Domestic Product (Percent Change) 4.7 3.6 4.6 4.9 Real Gross Domestic Product (Percent Change) 2.1 1.9 2.9 2.9 Price Level (Percent Change) 2.6 1.6 1.7 2.0 Establishment Employment (Percent Change) 1.3 0.8 1.2 1.3 Unemployment Rate 4.6 5.0 5.0 4.8 Personal Income (Percent Change) 6.5 4.9 5.0 5.3 Consumer Price Level (Percent Change) 2.9 2.0 1.6 1.9
SOURCE: Center for Policy Research and Planning, Mississippi Institutions of Higher Learning.November, 2007. Global Insight, November, 2007.

19
panying increase in wages, salaries and labor income will boost personal incomes. Inflation remains low. Overall, a growth rate of 5.6% in personal income is predicted for 2007, gradually slowing to 5.0% in 2008 and 4.6% in 2009. The slowdown in the state’s economy in 2008 will be considerably greater, should the nation go into recession, which is a situation that has a 35% probability of occurring, according to Global Insight. As the pace of rebuilding slows and the national economy recovers, there will be a return to the state’s long-run growth path. Over the 2007-2012 period, the gross state product is forecast to average an annual growth rate of 2.6%, which is just below the predicted national average of 2.8%. Tax reform may be on the agenda during the coming legislative session. The adverse impact on families of the 7% sales tax on groceries was a hot issue during the fall election season, and both the Governor and several legislators have stated their interest in reviewing the current tax system. The National Association of State Budget Officers (NASBO) has also been warning legislature for years that the shift towards services in the economy has been eroding the states’ sales tax base. NASBO also notes that taxing more services is not an easy quick-fix, because many of those growing services are health-and education-related. The dependence of the state on federal dollars also indicates a need for the state to re-examine its long-run revenue sources, as the flow of funds to the state for governmental operations cannot be guaranteed to continue at the same levels in the future. A recently released report on federal expenditures by state showed that Mississippi was 10th in the nation in per capita federal expenditures in FY2005. Total federal expenditures here were $26.2 billion. (The federal fiscal year ended 9/30/05 and so does not include the bulk of Katrina-related spending.) Some data and studies relevant to the discussion of tax reform in Mississippi are provided in the appendix following this article. The full state forecast is presented in tables at the end of this Review.
Figure 4. ACTUAL AND PROJECTED CHANGES IN REAL GSP AND REAL GDP
1.9%
2.6%
2.9% 2.8%
0.0%
0.5%
1.0%
1.5%
2.0%
2.5%
3.0%
3.5%
2001-2006 2007-2012
MS US
SOURCE: Center for Policy Research and Planning, November 2007.
Figure 5. ACTUAL AND PROJECTED ANNUAL CHANGES IN EMPLOYMENT
0.2%
1.0%
0.7%
1.1%
0.0%
0.2%
0.4%
0.6%
0.8%
1.0%
1.2%
1.4%
2001-2006 2007-2012
MS US
SOURCE: Same as above.

20
Figure 6. MISSISSIPPI EMPLOYMENT PROJECTIONSAVERAGE ANNUAL GROWTH RATES 2007-2012
SOURCE: Center for Policy Research and Planning, November 2007.
0.7
1.3
0.6
0.7
-0.1
-1.7
1.6
1.4
1.6
1.5
0.9
-2.5 -1.5 -0.5 0.5 1.5 2.5
AgricultureConstruction
FinanceGovernment
ManufacturingMining
Health & SocialLeisure & Hospitality
Other ServicesTransport & Utilities
Trade
Percentage Change
Forecast for 2007-2012 Figures 4 and 5 compare the coming five-year period to the preceding five years. Growth rates of both output and employment will be higher over the 2007-2012 period than during the previous five years. In addition, Mississippi’s growth rates will be considerably closer to the national average rates. Over the 2001-2006 period, during which Hurricane Katrina rocked the state’s economy, output grew at an average annual rate of 1.9% and employment at an average annual rate of 0.2%. Over the coming five years, the state’s growth rate of GSP will average 2.6%, and the rate of employment growth will be 1%, compared to 1.1% for the U.S. as a whole. Despite improvements in the growth rates of output and employment, the gap in per capita incomes between Mississippi and the U.S. is expected to remain the same, with the state’s per capita income staying at 74% of the U.S. average. However, trends in per capita income vary considerably by county. Figure 7
shows per capita income in each county in 2005 as a percent of the per capita figure for the U.S. ($34,644), along with the change in that percentage from 2000 to 2005. Madison was the only county with a per capita income greater than the U.S. average in 2005, at $38,211, and from 2000 to 2005, its per capita income as a percent of the U.S. figure increased from 106% to 111%. DeSoto, Hinds, Rankin and Warren Counties each had per capita incomes that were at 86% of the U.S. average, but progress in DeSoto stalled over the period considered, and Rankin County's gap with the nation increased. Regionally, the rate of change in per capita income in relation to the U.S. varied considerably across the state. The three counties on the coast all lost ground after Hurricane Katrina. Most northeastern counties made some gains over the period, with the exceptions of Tishomingo, Lee and Webster Counties. The Delta, as well, generally showed some progress, although three of the poorest Delta counties --

21
SOURCE: U.S. Bureau of Economic Analysis, November 2007.
Figure 7. PER CAPITA INCOME BY COUNTY AS PERCENTAGE OF U.S. PER CAPITA INCOME 2005 (WITH INCREASE 2000-2005 ALSO SHOWN)

22
Humphreys, Sunflower and Tunica -- did not. The largest gains were in the rural counties of Issaquena, Lafayette and Simpson, where agricultural incomes are a major factor, and the greatest drop was in Harrison County on the coast. Written by Marianne Hill, with input from members of the Center for Policy Research and Planning. Special thanks to Jason Knight of MARIS for Figure 7.
Notes 1. Medicaid is one of the largest programs in the state, and though there is three to one matching federal funding, there are concerns that the numbers of children and low-income adults covered may remain below 2005 levels, despite no improvement in poverty rates. Numbers on Medicaid eligibility from an October 2007 report of the Mississippi Human Services Coalition show sizeable drops from January 2005 levels to September 2007. The numbers, followed by summary comments, are as follows:
Jan 05 Dec 06 June 07 Sept 07 Difference
Total 622,193 565,184 552,424 558,940* -63,253
Children 336,767 286,609 278,486 282,840 -53,927
SCHIP 68,728 61,190 60,122 61,192 -7,536
*Family Planning Only = 41, 141 Eligibility numbers since June have come up in all groups except the 65+. However these numbers mask the fact that 41,141 women receive only Family Planning Services. Overall, Medicaid eligibility is still down from January 2005 by 63,253 and children’s eligibility in Medicaid and SCHIP is still down by 53,927. 2. http://www.biloxischools.net/comparison _of_enrollment_figures.htm shows that as of October 9, 2007, enrollment in Biloxi School District was 20% below pre-Katrina levels. Biloxi High School enrollment was down 11%.
3. This year through August 53% of permits were for single unit, as opposed to multiple unit, homes. Permits for about 12, 317 new housing units (including multi-unit buildings) will have been issued in 2006 and 2007, which is approaching the 14,449 units that were destroyed. (about 8,500 of the 12,317 plus are single units). Even before the Hurricane, though, there would have been about 6,400 permits issued over the same period , leaving an increase of 12,317 – 6,400 = 5,917 or 41% of the 14,449 units destroyed. That is, the increase above pre-Katrina levels in the number of housing permits for new housing since Katrina (5,917) would allow for rebuilding about 41% of the 14,449 housing units destroyed. The RAND study uses other data to reach its conclusions. Permit data can be found at the following sites: http://www.census.gov/const/C40/Table3/tb3u2006.txt http://www.census.gov/const/C40/Table3/t3yu200708.txt http://www.census.gov/const/www/C40/table3.html#monthly shows for Gulfport-Biloxi: 819 permits in March, 190 in July and 357 in August, 2007. The above links provides data from the U.S. Census on number of building permits issued for new housing units for 2006 and through August 2007. They include all data from the 6 permit offices in the Gulfport-Biloxi MSA (Hancock, Harrison and Stone counties.) and the 5 permit-issuing offices in Pascagoula MSA (George and Jackson counties). These represent only new housing units (completely rebuilt housing units are counted as new). The data are provided by a form that the permit office mails in – 5 of the 6 in Gulfport-Biloxi mail in their forms every month (the other, D’Iberville, does so annually) and 4 of the 5 in Pascagoula do so monthly (the other, Moss Point, does so annually). These Census numbers, then, provide the most accurate count of total new housing units being built in the five coastal counties. The number of permits issued so far in 2007 show the number of permits issued for single

23
homes dropping in comparison to 2006 and the number of multi-unit permits rising. Detailed data on housing damage can be found at: www.huduser.org/publications/pdf/GulfCoa
st_HsngDmgEst.pdf A March 2006 assessment of the housing situation on the Mississippi coast: http://www.huduser.org/publications/pdf/cmar_gulfportms.pdf The figure of 14,449 units in the two coastal MSAs (Hancock, Harrison, Jackson, George and Stone Counties) that were more than 50% destroyed was based on FEMA data that was cross-checked by the Department of Housing and Urban Development (HUD) to eliminate double-counting. Site visits as well as aerial surveys and applications for assistance were all utilized and analyzed for the Housing Damage Estimates. 4. Summary data from ACCRA for the cost of living in Gulfport-Biloxi compare the 1st quarter of 2005 to 1st quarter of 2007. In 2005, the Gulfport-Biloxi cost of living was 92.5% of the national average but was up to 97.3% of the national in Q1 of 2007. Almost all of the increase relative to the national cost of living was due to the increased cost of housing, which was 73.9% of the national cost in Q1 of 2005 but 95.6% of the national average in Q1 of 2007. Overall, grocery items were 102.8% of the national average (compared to 101.4% in 2005), utilities were 93.3% of the national average, transportation 97.9% of the national, health care 101.6% of national, and misc. good and services 97.2% of the national average cost. 5. The Lawyers Committee for Civil Rights under the Law is involved with various civil rights issues on the coast. For information on housing-related issues see the following site: http://www.lawyerscommittee.org/2005website/projects/housing/recent_dev.html. It is also representing two Mississippi organi-zations that are contesting the Corps of Engineers’ decision to permit the destruction of more coastal wetlands found here:
http://www.lawyerscommittee.org/2005website/publications/press/press082407.html 6. Recent news items on developments on the coast: MSNBC, “More than two years after Hurricanes Katrina and Rita battered the Mis- sissippi Gulf Coast, private tests of FEMA travel trailers and mobile homes provided to storm victims indicate that high levels of formaldehyde gas in the units is much more widespread than the government has acknowledged.” http://www.msnbc.msn.com/id/21725858/ National Public Broadcasting. 11/16/07. Bill Moyers Journal feature story on the Steps Coalition. See also www.stepscoalition.org. Native Times. 11/09/07. “New Test Results on FEMA Mobile Homes and Trailers Confirms High Formaldehyde Levels in Both Types of Units” by Shelley Bluejay Pierce. SunHerald, 11/05/07. “Cleanup of rivers may have been too much, Anglers fear removal of trees may cause loss of fish habitat” by Karen Nelson. [email protected] New York Times, 11/16/07. “Poor Are Lagging in Hurricane Aid From Mississippi” by Leslie Eaton http://www.nytimes.com/2007/11/16/us/16mississippi.html?hp SunHerald, 11/04/07. “Feds plan oil reservoir near Hattiesburg: Salt dome to be created using Pascagoula River water, salted and piped to Sound”, by Ben Raines. Newhouse News Service
References and Sources Agricultural Economic and Policy Per-
spectives, Mississippi State University, Department of Agricultural Economics. at http://msucares.com/newsletters
Federal Emergency Management Agency,
www.fema.gov. Hurricane Katrina Recovery Update: (news release). Flood insurance program statistics, found at the following website:

24
http://www.fema.gov/business/nfip/statistics/fy2005st.shtm and at
http://www.dhs.gov/dhspublic/display?content=4917
Federal Reserve Board of Atlanta, State of the
States, EconSouth, Second Quarter 2007. Food Research and Action Center. State by
state participation rates in the Federal Food Stamp Program is at http://www.frac.org/html/news/fsp/2006.12_1Yr.html
Global Insight, Inc. National and regional
forecasts and reports. 2007. ISO Property Claims Services press releases,
www.iso.com. Krueckeberg, Donald A. 2007. “The Burden
of Tax-Exempt Property”, New Jersey Policy Perspective Report, August 22, 2007.
McCarthy, K. and M. Hanson. 2007. “Post-
Katrina Recovery of the Housing Market Along the Mississippi Gulf Coast”. RAND Technical Report TR-511-OA/MAR/NAR. At www.rand.org/rgspi.
Mississippi Business, published by the
Mississippi Institutions of Higher Learning, available at the following site: www.mississippi.edu/urc.html– go to Economics Department.
Mississippi Legislature, www.ls.state.ms.us,
has the text of all bills. Mississippi Municipal League. “Legislative
Update 2007”. At this web address: www.mmlonline.com/legupdate.asp
Mississippi State Tax Commission. Data at
http://www.mstc.state.ms.us/info/stats/divers.htm
National Association of State Budget Officers. www.nasbo.org
Office of the Governor, State of Mississippi.
News releases. Also see the following addresses: http://www.governorbarbour.com/Recovery/ see Recovery Fact Sheet under News and Updates and also here: www.mississippi.org for added information and data relating to the recovery. Information on the Homeowner Grant Programs can be found at: http://www.mshomehelp.gov/
Sun Herald, 11/04/07. “Study Finds Coast
Worse than N.O.” by Joshua Norman. At http://www.sunherald.com/212/story/179840.html
U.S. Small Business Administration. Firm termination rates. At http://www.sba.gov/advo/stats/sbei_tab03_v971.xls
U.S. Department of Housing and Urban
Development, Office of Policy Development and Research. http://www.hud.gov/news/katrina05response.cfm and more information is at the following: www.hud.gov/local.
Detailed data on housing damage can be found at the following internet site: www.huduser.org/publications/pdf/GulfCoast_HsngDmgEst.pdf A March 2006 assessment of the housing situation on the Mississippi coast is at: http://www.huduser.org/publications/pdf/cmar_gulfportms.pdf
U.S. Department of Health and Human
Services. www.hhs.gov gives information U.S. Environmental Protection Agency.
http://www.epa.gov/Region4/topics/indexalpha.html

25
SPECIAL APPENDIX ON TAXES IN MISSISSIPPI Section 1. How much do different income groups pay? Table A. STATE AND LOCAL TAXES AS PERCENT OF FAMILY INCOME IN 2002 (Nonelderly Taxpayers)
TOTAL1
IndividualSales and State and Local
Family Excise Taxes Property Taxes Income Taxes Taxes/IncomeIncome Group MS US MS US MS US MS US
Lowest 20% 8.1% 7.8% 1.7% 3.1% 0.2% 0.6% 10.0% 11.4% MS Average $7,000 US Average $9,300
Second 20% 8.0 6.4 2.9 2.3 0.6 1.6 11.5 10.3 MS Average $15,100 US Average $19,700
Middle 20% 6.9 5.1 1.6 2.5 1.2 2.3 9.7 9.6 MS Average $24,100 US Average $31,900
Fourth 20% 5.4 4.1 1.4 2.6 2.0 2.7 8.6 8.8 MS Average $40,400 US Average $52,500
Top 20%2
Next 15% 4.3 3.1 1.8 2.6 2.4 3.2 8.0 7.7 Next 4% 2.7 2.0 1.8 2.3 3.1 3.8 6.6 6.5 Top 1% 1.3 1.1 1.5 1.4 4.0 4.8 5.3 5.2
1These totals include tax offsets due to federal deductions, which reduce the overall tax burden.
2Average income for top 20% was not provided. For bottom 15% of top 20%, the average income in Mississippiwas $69,000, for the next 4% $131,000, and for the top 1%, $509,000. For the U.S., the corresponding numbers are $95,300, $202,300 and $1,080,900.
This difference in average incomes affects how this table should be interpreted. Note that the average income level in the bottom quintile in Mississippi is $7,000, compared to $9,300 for the U.S. A Mississippi family with a $9,300 income could well be paying 11.4% of that income in state and local taxes--the same rate as for the U.S.
SOURCE: Institute on Taxation and Economic Policy Report, Who Pays State and Local Taxes , 2002,at www.itepnet.org.
Using the above table, the percentage of total taxes paid by each income group and noting that families with an average income of $7,000 paid average taxes of $700 and so on, we have an estimate of the percent of total taxes paid by each quintile:

26
Bottom 20% 4.5% (average taxes $700)Next 20% 11.2% (average taxes $1,737)Next 20% 15.1% (average taxes $2,338)Next 20% 22.5% (average taxes $3,474)
Last 20%Lowest 15% 26.8% (average taxes $5,520)Next 4% 11.2% (average taxes $8,646)Top 1% 8.7% (average taxes $26,977) Section 2. What would be the revenue loss from eliminating or reducing the sales tax on food? There is an annual consumer expenditure survey done by the Bureau of Labor Statistics that is used by tax commissions when estimating the impact of changes in the sales tax. This survey provides information on consumer expenditure by region, income level and race on budget items, including food. The latest survey, done in 2005, shows that the average annual expenditure on food and nonalcoholic beverages at home was no more than $1152.90 per person in Mississippi. This translates into total expenditures on food at home of $3,435 million in 2006 (allowing for inflation). Of this, approximately $450 million was financed by food stamps (the FY2005 figure, but perhaps more in 2006, given the effects of Katrina), in any case leaving slightly less than $3 billion in food sales subject to the sales tax. As a cross-check to this estimate, the State Tax Commission lists $3,616 million as Gross Taxable Sales by grocery stores and other food stores in FY2006 (see Annual Report, Sales by Industry Group). This $3,616 million does not include food sales financed by food stamps, but will include sales of non-food items sold by these stores.
These numbers make it possible to say that in FY2006 the state would have lost at most $210 million (.07 x $3 billion) if food in grocery stores were not subject to the sales tax. Or, if the tax on food were cut in half, the decrease in revenue would have been no more than $105 million.
Recent Studies of Mississippi’s Tax Structure: Hill, M. 2003. “Easing the State Budget Squeeze”, Mississippi Economic Review and Outlook, June 2003. Under “Publications” at www.mississippi.edu/URC.html Institute on Taxation and Economic Policy. 1/7/03. “Mississippi Taxes Hit Poor and Middle Class Far Harder Than the Wealthy.” Miller, S. et al. 2007. “Putting the Pieces Together: A Taxpayer’s Guide to the Mississippi Budget”, Mississippi Economic Policy Center. http://www.mepconline.com/images/admin/spotedit/attach/0/MS_Budget_and_Tax_Guide.pdf

27
NEWS AND NOTES ON MISSISSIPPI
See www.mississippi.org and www.visitmississippi.org for more news on economic developments in the state. Investment in New and Expanded Facilities Jumps in 2007 New projects valued at $5.3 billion were announced during the January-September period, an increase of over 200% compared to the same period last year. Investment in non-manufacturing facilities rose 12%, while investment in manufacturing was 12 times as great as in 2006. Overall, about 9,424 new jobs will be added to the state as a result of these investments. Sixteen manufacturing firms were among the top 25 job creators. Eight investment projects of over $100 million were announced during the first nine months of 2007, led by the $1.3 billion Toyota
plant (near Tupelo), which is expected to begin production in
2010. The Galleria multiplex in Madison, to include office buildings, a shopping center and single-family houses, was the second-largest project, at $900 million, and the Margaritaville Casino and Resort Complex ($700 million), to be located on the coast, was the third-largest. Other major projects included a Rolls
Royce Outdoor Engine Testing facility ($133 million) destined for the Stennis Space Center and the Bacaran Bay Casino ($600
million) to be built in Biloxi. PACCAR, Inc. will build a $348 million diesel engine plant near Columbus. PACCAR is the parent company of Peterbilt and Kenworth trucks. (PACCAR expects to complete the 400,000-square-foot plant by 2009).
Manufacturing investments included a $300 million plant for the production of titanium and other metal products. RTI International Metals will employ about 200 workers in Monroe County at this new facility. Auto Parts Manufacturing Mississippi also announced that it will build a $180 million facility for automotive stamping and vehicle parts in Itawamba County. It expects to employ about 260 persons. Other large job expansions will come from the projects of: Howard Computers (Jones County), which is adding 1,000 workers; Comcast Advanced Solution Center telephone
answering services (Madison Coun-ty), which will employ 600; and Griffin, Inc. – West Point Armor
Division (Clay County), which will employ 375 persons. Energy-related projects will also be contributing hundreds of new jobs to the state
in coming years. A drilling platform for oil and gas is planned by Gulf Ship, LLC, at a cost of $60 million. About 250
jobs will be created. PSL-North America plans to construct a $61 million plant for the manufacture of cast iron gas pipes in Hancock County; about 275 new jobs will result. Also among the projected top job creators, adding 300 jobs, was the privately operated Adams County Correctional Center (invest-ment cost: $105 million).

28
THE ECONOMIC STATUS OF AFRICAN-AMERICANS IN MISSISSIPPI
Marianne Hill, Ph.D.
frican-Americans make up 37% of Mississippi’s population, the highest percentage of any state, and account for a third of the working age population 25 to 64 years old. While the status of
Mississippi’s black population has improved greatly over the past twenty-five years, and milestone accomplishments in the economic, political and social arenas have been achieved, much remains to be done. This article provides a snapshot of the economic status of African Americans in Mississippi today, noting remaining challenges and promising trends. Policy implications are considered. Wage Gaps The median wage in Mississippi, at $31,107 for year-round, fulltime workers in 2006, was 81% of the national median. However, this gap was considerably greater for African-Americans. As Table 1 shows, among the state’s major demographic groups, black women receive the lowest wages (American Community Survey 2006). They earned only 69% of what African-American women earned nationally, and only 52% of what white men in the state earned. White males in Mississippi, on the other hand, received 88% of the figure for their national counterparts, and their median earnings were actually higher than the overall national median of $38,463. Black
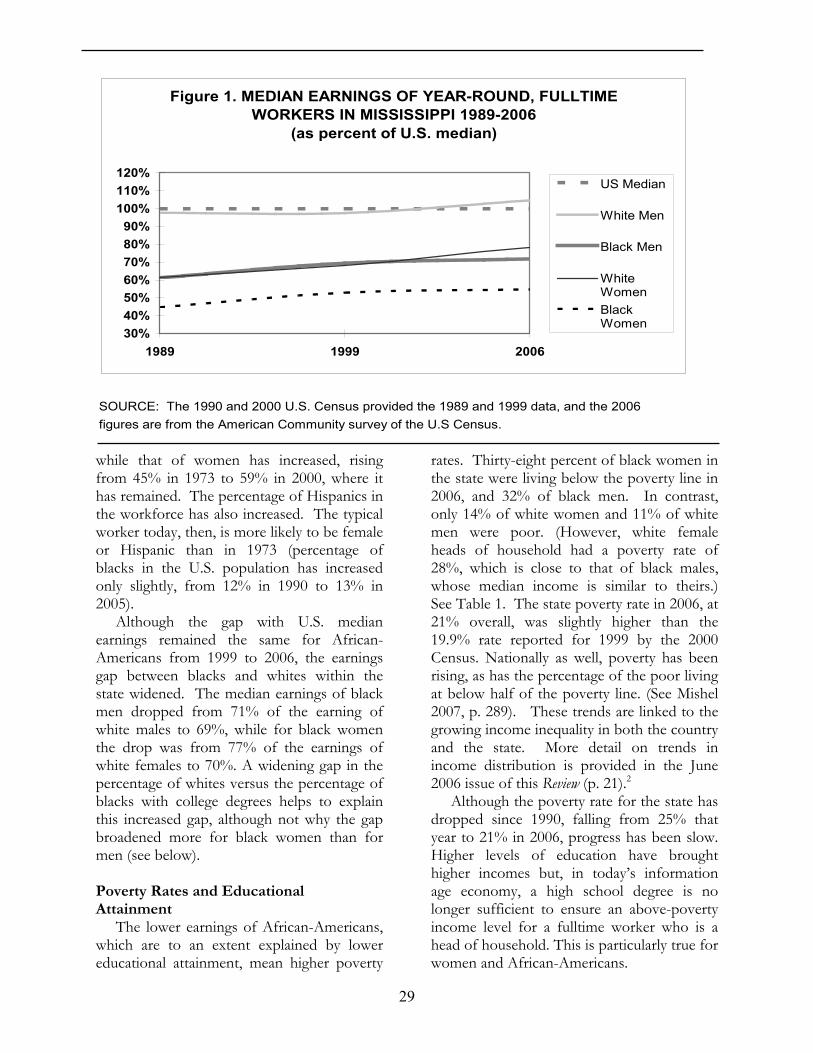
men and white women each earned approximately 80% as much as their national counterparts, and just under the national median for black women of $30,398. Figure 1 illustrates trends over time in median wages by race and gender, relative to the national median wage. From 1989 to 1999, the gap between median earnings of each of the state’s major demographic groups and the U.S. median narrowed, but the progress of blacks stalled from 1999 to 2006.1 The changing composition of the U.S. workforce has affected the size of the wage gap for the different demographic groups: the labor force participation rate of men has gradually dropped from 79% in 1973 to 73% in 2005,
Table 1. BRIEF ECONOMIC PROFILE OF MISSISSIPPI BY RACE AND SEX, 2006
STATE Black White Black WhiteTOTAL Women Women Men Men
Percent of Population 25 and over 100%1 18% 34% 15% 31%
Median Earnings Year-Round, Fulltime $31,107 $21,049 $30,117 $27,625 $40,260
Percent High School Graduates 78% 72% 84% 68% 81%
Percent Bachelors Degree or Higher 19% 14% 22% 9% 23%Poverty Rates 21% 38% 14% 32% 11%1Hispanics make up about 1.3% of the population over 25 years of age, according to the American Community Survey. Their poverty rate is20%, 58% have a high school degree or above and 15% have a bachelor's degree or above. Their median household income was $35,378in 2006. American Indians account for 0.4% of the state's total population and Asians 0.8%.
SOURCE: 2006 American Community Survey, U.S. Census.
A
29
SOURCE: The 1990 and 2000 U.S. Census provided the 1989 and 1999 data, and the 2006figures are from the American Community survey of the U.S Census.
Figure 1. MEDIAN EARNINGS OF YEAR-ROUND, FULLTIME WORKERS IN MISSISSIPPI 1989-2006
(as percent of U.S. median)
30%40%50%60%70%80%90%
100%110%120%
1989 1999 2006
US Median
White Men
Black Men
WhiteWomenBlackWomen
while that of women has increased, rising from 45% in 1973 to 59% in 2000, where it has remained. The percentage of Hispanics in the workforce has also increased. The typical worker today, then, is more likely to be female or Hispanic than in 1973 (percentage of blacks in the U.S. population has increased only slightly, from 12% in 1990 to 13% in 2005). Although the gap with U.S. median earnings remained the same for African-Americans from 1999 to 2006, the earnings gap between blacks and whites within the state widened. The median earnings of black men dropped from 71% of the earning of white males to 69%, while for black women the drop was from 77% of the earnings of white females to 70%. A widening gap in the percentage of whites versus the percentage of blacks with college degrees helps to explain this increased gap, although not why the gap broadened more for black women than for men (see below).
Poverty Rates and Educational Attainment The lower earnings of African-Americans, which are to an extent explained by lower educational attainment, mean higher poverty
rates. Thirty-eight percent of black women in the state were living below the poverty line in 2006, and 32% of black men. In contrast, only 14% of white women and 11% of white men were poor. (However, white female heads of household had a poverty rate of 28%, which is close to that of black males, whose median income is similar to theirs.) See Table 1. The state poverty rate in 2006, at 21% overall, was slightly higher than the 19.9% rate reported for 1999 by the 2000 Census. Nationally as well, poverty has been rising, as has the percentage of the poor living at below half of the poverty line. (See Mishel 2007, p. 289). These trends are linked to the growing income inequality in both the country and the state. More detail on trends in income distribution is provided in the June 2006 issue of this Review (p. 21).2 Although the poverty rate for the state has dropped since 1990, falling from 25% that year to 21% in 2006, progress has been slow. Higher levels of education have brought higher incomes but, in today’s information age economy, a high school degree is no longer sufficient to ensure an above-poverty income level for a fulltime worker who is a head of household. This is particularly true for women and African-Americans.

30
Table 1 shows educational attainment by race and gender. Overall, 21% of persons over 25 years old had a bachelor’s degree or above in 2006 (12% of blacks), and only 22% lacked a high school diploma (30% of blacks). This represents considerable progress: in 1990, only 15% of this age group had bachelor degrees (8.8% of blacks) and 36% had not completed high school (53% of blacks). These numbers show that while blacks made greater progress than whites in reducing the percentage of persons without a high school diploma, whites made greater progress in increasing the percentage with college degrees. Currently, about 22% of whites have a college degree, compared to about 12% of blacks. And, in recent years, the return to a college degree has increased much more rapidly than the return to a high school education (see Mishel et al. 2005). Growing levels of educational attainment and the changing economy have meant an increase in the percentage of persons holding managerial and professional positions in each demographic group. Currently 39% of white women and 29% of white men in Mississippi hold these positions, while the percentages are considerably lower for African-Americans. Twenty-three percent of black women hold managerial and professional jobs, but only 11% of black men. These percentages can be expected to increase. Figure 2 shows the growth rates of degrees awarded by the eight four-year public institutions of higher learning in the state from 2002 to 2006. The 10.8% growth rate of awards to African-Americans greatly out-stripped the overall growth rate of 2.4%, indicating that the educational gap between African-Africans and other Mississippians at the college level is closing, which will in turn impact the occupational mix. However, the growth rate for African-American men was only 2.9% versus a 14.2% rate for African-American women, with more than twice as many women as men receiving degrees. This signals an issue requiring further con- sideration. The drop in the number of degrees awarded to whites over this period is also a troubling trend.
SOURCE: Mississippi Institutions of Higher Learning, October 2007.
-0.8%
2.4%
10.8%
-4.0%
-2.0%
0.0%
2.0%
4.0%
6.0%
8.0%
10.0%
12.0%
14.0%
Africa
n-Ameri
cans
White
s
Total N
umber of A
wards
Figure 2. DEGREES AWARDED BY IHL INSTITUTIONS MISSISSIPPI, 2002-2006
(Growth Rates)
Income Distribution and Home Ownership The accumulation of savings and wealth enables families to enjoy greater financial and economic security. The single most important asset owned by a family is typically the home, if we exclude pension funds and retirement benefits paid by employers and the government. Home ownership in Mississippi is high, with 71% of all households owning their home, including 58% of African-American and 43% of Hispanic households. Figure 3 illustrates the percentage of blacks and whites that own homes of different values. About 50% of black-owned homes were valued at less than $50,000 in 1999, with 26% at over $70,000. About 60% of white-owned homes were valued at over $70,000. The value of homes owned by African Americans mirrors the income distribution within that group. While the income gap between whites and blacks within the state is substantial, the wealth gap is even greater. Nationally, the net worth of the median black household was only about $10,700 or 10% of the median for whites. Figure 4 provides Census 2000 data on household income by race. Note that while the percentage of white and black households with incomes from $25,000 to $50,000 is

31
similar (at about 25%), the percentage of black households with incomes lower than this is almost double that of whites (57% versus 32%) and vice-versa for households with incomes over $50,000 (14% versus 35%). Since 2000, household incomes have increased, but the increase has been significantly greater for white households. Black median household income rose from $20,572 in 1999 to $21,969 in 2006, but this latter figure represented only 51% of the white median in the state, a somewhat lower percentage than in 1999. Over the same period, white median income rose from $37,420 to $43,139, or from 81% to 84% of the 2006 white U.S. median. Firm Ownership and the African American Market Besides education, firm ownership offers another avenue to higher incomes. Figure 5 shows the ownership of firms in Mississippi by race and gender in 2002, based on Census data for 187,602 firms.3 Just over 25,000 of these firms, or somewhat more than 13% of firms, are owned by African-Americans, with more firms owned by black men than by black women. (The category ‘other’ includes firms that are owned equally by male and female African Americans, a category accounting for only 2% of all firms.)
The number of African-American firms in the state grew 42% from 1997 to 2002, a rate far in excess of the overall average growth rate of 12% as shown in Figure 6. This indicates the growing importance of black businesses in the state’s economy. African-American firms are most num-erous in the service sector. Of the 25,002 firms owned by blacks in 2002], the break-down among industries is as follows:
Health care and social assistance, 15%; Construction, 12%; Administrative support and waste
management, 11%; Retail trade, 10%; Transportation & warehousing, 10%;
Professional, scientific & technical, 6%;
Other services, 20%; Remaining industries, 16%.
The number of black-owned manufactur-ing firms (largely in lumber and wood products) dropped 78% from 1997 to 2002, and the number of black-owned firms in retail trade fell 20%. At the same time, the number in construction rose 25% and in trans-portation & warehousing, 51% (Economic Census 1997 and 2002, American FactFinder). These latter two industries were very domi-
Figure 3. VALUE OF HOMES OWNED BY AFRICAN-AMERICANS AND WHITES IN MISSISSIPPI IN 2000
20%
30%
24%
17%
7%
2%0.3%
6%
15%
19%
26%24%
10%
0.6%0.0%
5.0%
10.0%
15.0%
20.0%
25.0%
30.0%
35.0%
0-$30,000 $30,000-50,000
$50,000-70,000
$70,000-100,000
$100,000-175,000
$175,000-500,000
$500,000 on
African-AmericanWhites
SOURCE: Custom Table from Summary File 3 of 2000 U.S. Census.

32
Figure 4. INCOME DISTRIBUTION, AFRICAN-AMERICAN AND WHITE HOUSEHOLDS IN MISSISSIPPI, 2000 CENSUS
0.0%
5.0%
10.0%
15.0%
20.0%
25.0%
30.0%
0 - $1
0,000
$10 -
$15,0
00
$15 -
$20,0
00
$20 -
$25,0
00
$25 -
$30,0
00
$30 -
$35,0
00
$35 -
$40,0
00
$40 -
$45,0
00
$45 -
$50,0
00
$50 -
$60,0
00
$60 -
$75,0
00
$75 -
$100
,000
$100
- $12
5,000
$125
- $15
0,000
$150
- $20
0,000
$200
,000 -
Black MS
White MS
U.S.
SOURCE: Custom Table from Summary File 3 of 2000 U.S. Census.
nantly male-owned businesses (over 80%). Health care and retail trade, by contrast, were dominantly female-owned (over 73%).4 Firm ownership grew more rapidly among black women than among black men over the period. The number of firms owned by black women in Mississippi rose 70% over that period, versus a 16% growth rate for firms owned by black males. Although firms owned by blacks serve all Mississippians, it is worth noting that there is a large African American market in the state. The number of African Americans in Mississippi is greater than the total population of Alaska, Wyoming, Montana, North Dakota, South Dakota, or Delaware, and matches that of Rhode Island. Similar comparisons can be made for total aggregate income and net asset ownership of this demographic group. There is a substantial middle class and a growing number of wealthy African Americans. According to the latest decennial Census, over 2,000 black households (or 0.64% of the total) had annual incomes above $200,000. (The comparable percentage for white households was 1.47%.) Policy Implications There are many policy steps that can be taken to increase the educational attainment, earnings, net wealth and firm ownership of blacks in the state and so reduce the gaps
within the state between whites and blacks, as well as the economic gaps between Mississippi and the rest of the U.S. The data indicate that some of these gaps are beginning to close. Nonetheless, as recent increases in poverty rates both in Mississippi and nationally make clear, positive economic trends cannot be taken for granted. The state has programs in place to improve the skills of the workforce, to increase the job opportunities available, and to foster entrepreneurial abilities and strengthen locally-owned businesses. But could modifications to existing programs improve their outcomes for minority men and women? What areas of concern require particular focus? This article is only a brief overview of the economic status of African Americans in the state today. It has not addressed the causes of the lower status of African Americans, nor will it be possible here to analyze in depth policies for alleviating poverty and increasing income levels of African Americans here. Before discussing a few points related to policy implications, two observations are in order. First, the question of how to improve the economic status of African-Americans in the state is inextricably tied to broader questions related to human and economic development in the state. Human development requires ensuring that indi-

33
viduals and families have access to a means of meeting their basic needs for health care, physical security, employment and education. The particular obstacles that low-income individuals face must be considered. A child who is healthy, whose basic needs are met, and who is being raised in a secure, stable, nurturing environment is off to a good start in life. Such children are more likely to become teenagers who make sound life choices. Studies of current social programs have identified some effective interventions in the cycles that feed poverty, but they also identify areas where closer monitoring of the outcomes of these programs and other changes could improve results. Second, black men and women in Mississippi are concentrated in certain occupational categories, and changing social expectations of both blacks and whites about what jobs and social roles are appropriate for African Americans is basic to the social changes that will close the income gap. Young people who expect that they will become the doctors, business owners, and screenwriters of tomor-
row are more likely to value their education. And employers with similarly higher ex-pectations will support investment in the highly capable young people who are the workforce of the future. With rising expectations, more will be demanded of schools, and of the state. That is, changing attitudes about what the state’s population can and should be expected to accomplish is a part of social change. That said, we turn now to a few policy issues. 1. Improving Educational Opportunities The lower levels of educational attainment by African Americans affect skill levels and occupations. Several steps can be taken to improve levels of educational attainment and training. Employers can encourage and reward employees who pursue further training. Families and communities can become more involved in local schools and in policy debates related to education. The state has many options available. Organizations such as the National Conference of State Legislators and the National Center on
SOURCE: 2002 U.S. Economic Census.
White Men52%
Other 18%
Af-Am Men6%
Af-Am Women5%
White Women19%
Figure 5. FIRM OWNERSHIP, MISSISSIPPI 2002
34
Education and the Economy compile and analyze recommendations that have been made and acted upon by states across the country to improve the access to and affordability of higher education, early childhood education, and workforce skills certifications. There are also alternative tools and programs available that are effective in reducing high school drop-out rates, aiding the transition from school to work, increasing enrollment in the sciences, educating inmates in prison, and in addressing other educational issues. 2. Improving Access to Nontraditional Jobs One problem of particular importance is that of the concentration of blacks in certain job categories. Part of wage gaps by race and gender can be explained by differences in occupations. Jobs that are traditionally held by women often pay less than male-dominated occupations with similar ed-ucational requirements. African American males with similar educational backgrounds to their white colleagues may be less likely to be hired for entry-level positions that have traditionally been held by a white male. A 1996 study by Hill in this Review showed that occupational differences by race and sex were greater in Mississippi than in the South, and greater in the South than in the U.S. as a whole. Occupational differences by sex are especially great, and here opening nontraditional jobs to women can be particularly beneficial. One relevant measure of this occupational difference was Hill’s calculation that, in order for the occupational distribution of jobs for black men and black women to be identical, 59% of either black men or black women would have had to change jobs, compared to 57% in the U.S. For the jobs of black men and white men to be identical, 38% of either black men or white men would have had to change jobs (compared to 32% in the U.S.). While much of the difference in job categories among black and white males may be explained by differences in skill levels, the creation of
opportunities for the required education, training and work experience is an issue that needs to be considered.
Wage gaps by race and sex can be reduced through a lessening of the social pressures which steer women and minorities into certain occupations (see Jones 2007). Several policy steps have been suggested. Employers, for example, could encourage the entry of minority men and women into nontraditional occupations by providing training opportunities to current employees, instituting broader searches for new employees, and ensuring career advancement paths for all employees. Educational institutions could do more to encourage students to consider nontraditional options. Pay equity across job categories would also tend to reduce gender wage gaps through ensuring that the training and skills requirements of different jobs are systematically compared when setting pay rates.
3. Related Policy Proposals by Nonprofit Organizations The National Urban League is among the organizations supporting increasing oppor-tunities for workplace success for African-American men and women through programs beginning in elementary school that include mentoring, after-school activities, and summer jobs programs, as well as strengthening the links between schools, colleges and employers. The Joint Center for Political and Economic Studies has made several workforce-related suggestions, examining reasons behind the mixed record of the Workforce Investment Act, which it argues does not recognize the specific obstacles facing many blacks. Many African-American men, for example, may have served time in prison, and job opportunities are especially needed for these workers. 4. A Focus on African American Women The overall wage gap between women and men in Mississippi ranks the state in the bottom half of the nation, and the gap is especially great for African American women

35
42%
23%
8%12%
45%
20%
6%10%
0.0%
5.0%
10.0%
15.0%
20.0%
25.0%
30.0%
35.0%
40.0%
45.0%
50.0%
African-American
Woman-Owned
Other TotalNumber of
Firms
MS US
Figure 6. GROWTH RATES OF FIRMS BY OWNERSHIP AND TOTAL, MISSISSIPPI AND U.S.
1997-2002
SOURCE: 2002 Survey of Business Owners, U.S. Economic Census.
(Institute for Women’s Policy Research 2006). The Institute estimates that closing the wage gap between men and women in Mississippi would cut the poverty rate in half for women and their families, in both single-parent and two-parent homes. Child care is critical to women with children who work or who wish to pursue their high school equivalency and college degrees, and much remains to be done in this area. Besides improving family income, higher educational attainment of mothers has been shown to have a positive impact on the educational attainment of their children.5 The health care accessible to African American women and men requires improvement. One telling example: the maternal mortality rate in Mississippi for nonwhite women in 2006, at 50.3 per 100,000, was higher than that of any of the 46 developed countries listed in the 2000 U.N. report on human development, except for the island state of Antigua/Barbuda. (The five-year average for Mississippi nonwhite maternal mortality of 39.2 per 100,000 would move the state’s ranking up above Bahrain and Estonia as well.)6
What About the EEOC? Discrimination in the workplace remains a problem both nationally and locally (see Jackson Free Press, 10/24/07). The Equal Opportunity Employment Commission (EEOC) and the Office of Federal Contract Compliance Policy (OFCCP), along with the courts, define what constitutes discrimination under the law and attempt to counter it. In FY2003, the EEOC received 81,293 complaints but brought only 393 lawsuits.7 The OFCCP annually reviews about 4,000 of the 150,000 workplaces of federal contractors (who employ 28 million persons). A firm can be barred from receiving federal contracts by the OFCCP, but between 1972 and 1995, only 41 firms were debarred from the approved list of federal contractors. In the assessment of Barbara Bergmann, Professor Emeritus of American University, “Currently antidiscrimination remedies are difficult to administer, expensive, work very slowly, and not infrequently produce inadequate results” (Bergmann 2005). In part, she argues, this is due to the weakness of a complaint-oriented strategy, as opposed to an investigative strategy, such as that followed by

36
the IRS which maintains routine surveillance of taxpayers. Among the shortcomings of relying on complaints is the fact that workers may believe that “a complaint of dis- crimination will end any chance of further advancement, and indeed may result in termination”. In addition, in many instances, individuals are not in a position to judge why their applications for a position or a promotion are rejected, whereas an investigative agency would have access to the needed data. One proposed solution has been to require firms to keep track of wages paid by occupation, race and sex. This information would then, at the least, be available to support or refute claims of discrimination. At an aggregate level, routine examination of data, comparing similar firms, could provide the scrutiny and publicity that could result in change. In some cases, data on individual firms has been made public. General Motors, for example, had almost three times as many women managers as Ford, according to1992 data. The availability of this data showed the possibility of considerable improvement by Ford even in the short-run. Concluding Remarks There are many studies, projects and examples that offer potential paths to improving the living standard of Mississippi’s residents, whether of African American or other ethnic origin. Inclusiveness may be the key. Co-operation and cross-sector collabora-tion, accountability, and vision have been documented as factors that lead to successful development planning (Stoker and Rich 2006). Mississippi has the highest percentage of blacks in the state legislature of any state, which bodes well for the success of policy initiatives aimed at putting in place means of tracking and evaluating the success of Mississippi’s programs in advancing its citizenry, not only on average, but also within each demographic group.
Notes
1. In 2006, the ratio of the median earnings of African-Americans to that of whites was 82% in the U.S. among the full-time year-round employed, while in Mississippi the ratio was 69%. The wage gap by sex was also higher here. Women working full-time in Mississippi earned 72% of the median earnings for
men, compared to a 77% ratio nationally (American Community Survey, U.S. Census, 2006). The wage gaps between women and men, and between blacks and whites, however, were less in 2005 than they were in 1989, both in Mississippi and nationally. Some of the decrease in the gender wage gap, however, was due to stagnation in the real earnings of male high school graduates, a trend that did not hold for female graduates (Mishel 2007). 2. The percentage of poor Mississippians living below one-half of the poverty line increased from 39% in 2003 to 42% in 2006. Nationally, African American households had net assets of $10,700 at the median in 2001, compared to $106,400 for white households (see State of Working America 2004/2005 p. 285). 3. These firms include all firms that filed a IRS 1040 C return, forms 1065, 1120 or 941. Includes five legal forms of organization: C corporations (except S), S corporations, individual proprietorships, partnerships and others (including cooperatives, receiverships and others). 4. Administrative support and waste management firms were 64% male-owned, manufacturing 65% male-owned, and professional, scientific & technical busi-nesses 50% male-owned. The remaining firms in each industry were either female-owned or equally male/female owned. 5. See, for example, Carneiro, P., C. Meghir and M. Parey. 2006. “Increasing Mothers’ Education Benefits Their Children’s School Performance”, Institute for Fiscal Studies, www.ifs.org.uk. 6. State data from p. 168, Mississippi Vital Statistics 2006. Mississippi’s maternal mortality rate (deaths related to pregnancy and childbirth) for nonwhites was 50.3 per 100,000 live births (versus 12.4 for white women) in 2006. The rate for the U.S. was 8 per 100,000 over the 1990-98 period, and of the 46 developed countries listed in the U.N. D.P. Human Development Report 2000 only Antigua and Barbuda had a higher rate. The rate has been increasing: over the five-year period 2002-6 the average rate for nonwhite women in MS was 39.2 and from 1997-2001 was 27.2. The last time before 2005 in which this rate was above 50 was in 1972. And, for a while, from 1980 to 1985, the rate reported was below 10.
Nationally, “In 2000, the maternal mortality rate for non-Hispanic Black women (22.3 per 100,000 live births) was greater than three times the rate for non-Hispanic White women (6.8 per 100,000 live births) and more than twice the rate for Hispanic women (9.9 per 100,000 live births),” according to the Federal Maternal and Child Health Bureau, 2003 Report. Found (11/9/07) at: the following address: http://mchb.hrsa.gov/data/women.htm. Later reports on maternal health did not include this statistic.

37
7. The Equal Opportunity Employment Commission (EEOC) and the Office of Federal Contract Compliance Policy (OFCCP), along with the courts, define what constitutes discrimination under the law and attempt to counter it. Courts have ruled that people have the right to be considered on their individual merits, and not disadvantaged by their membership in a group that may have lower average test scores than another or lower average physical strength. Bergmann notes the high cost and slow change produced by individual lawsuits, including those brought by the EEOC against employers, but notes that the deterrence effects of class-action lawsuits are often significant, although in recent years the EEOC has avoided such suits. Even when a lawsuit is unsuccessful, it typically provides documentation of discriminatory behavior at the workplace. For example, EEO News reported that seventeen black postal workers who worked in a metal enclosure while workers threw bananas and made racist comments could not prevail because they did not show that management knew and failed to corrective action (Allen v. Potter, 5th Circuit). The OFCCP, on the other hand, requires each federal contractor with more than 15 employees to formulate an “affirmative action” plan which typically involves setting a goal for each race-sex group (e.g. black females) for each type of job. This goal depends upon the pool of qualified persons available. Where reasonable, this may involve setting up training programs for new recruits.
References
Bergmann, Barbara. 2005. The Economic Emergence of Women, Second Edition. Palgrave MacMillan, New York. Pp. 103-118. Carneiro, P., C. Meghir and M. Parey. 2006. “Increasing Mothers’ Education Benefits Their Children’s School Performance”, Institute for Fiscal Studies, found here: www.ifs.org.uk. Equal Employment Opportunity News, EEO News at www.eeonews.com. Equal Rights Advocates, www.equalrights.org. On legal cases involving discrimination against women. Hill, Marianne. “Mississippi Wage Gap Persists”, Mississippi Economic Review and Outlook, December 2006. www.mississippi.edu/URC.html and “Trends in Occupations and Earnings in Mississippi”, Mississippi Economic Review and Outlook, February 1996. Institute for Women’s Policy Research. The Status of Women in the States, 2006 and other years. www.iwpr.org.
Jackson Free Press, October 24, 2007. “Talk of Jackson” covers a case of racial harassment filed by Robert Shoulders. www.jacksonfreepress.com. Joint Center for Political and Economic Studies. Data on race and public office can be located here: http://www.jointcenter.org/DB/table/graphs/beo_99.pdf Jones, S. ed., State of Black America 2007, “Executive Summary”, National Urban League. www.nul.org. Lawyers Committee for Civil Rights Under the Law is involved with various civil rights issues on the coast. For information on housing-related issues see: http://www.lawyerscommittee.org/2005website/proje-cts/housing/recent_dev.html. It is also representing two Mississippi organizations that are contesting the Corps of Engineers’ decision to permit the destruction of more coastal wetlands located at this address: http://www.lawyerscommittee.org/2005website/publi-cations/press/press082407.html Lynch, Adam. “Jackson Resident Claims Racism”, Jackson Free Press, p. 8. 10/25-31. Mishel, L., J. Bernstein and S. Allegretto, The State of Working America 2006/2007 and 2004/2005. Economic Policy Institute. See p. 289 on the poverty gap. www.epinet.org. Mishel, L., J. Bernstein and S. Allegretto, The State of Working America 2004/2005, Economic Policy Institute. www.epinet.org. Mississippi Legislative Black Caucus, found here: http://www.mslbc.org/ Mississippi Department of Health, Mississippi Vital Statistics 2006, http://www.msdh.state.ms.us/ Mississippi Municipal League, located at this location: http://www.mmlonline.com/ National Association for the Advancement of Colored People (NAACP), Legal cases, found at this site: http://www.naacp.org/legal/cases/docket/index.htm Stoker, Robert and Michael Rich, “Lessons and Limits: Tax Incentives and Rebuilding the Gulf Coast after Katrina”. Brookings Institution, August 2006. www.Brookings.org United Nations Development Programme. 2000. Human Development Report 2000, New York. U.S. Bureau of Economic Analysis (www.bea.gov) and U.S. Bureau of the Census (www.census.gov). U.S. Equal Employment Opportunity Commission, www.eeoc.gov Wage Project has extensive files on sex discrimination cases, and can be found by following this link: http://www.wageproject.org/content/discrimination/