missoula, montana
TRANSCRIPT
1
CHP Feasibility Assessment
The University of Montana Missoula, Montana
Recuperated Gas Turbine with Heat Recovery Steam
Generator
August 1
Northwest CHP TAP
, 2016

2
Acknowledgments
This material is based upon work supported by the Department of Energy under Award Number
DE-EE0006283. Thanks are due for gathering and analyzing utility billing and steam production data to
Brian Spangler, Manager, Energy Planning and Renewable Energy Program, with the Department of
Environmental Quality’s Energy Bureau; David LeMiux, Engineer with the Department of Environmental
Quality; and Chris Batson, Mechanical Engineer with the State of Montana Energy Program. Additional
thanks are extended to Brian Kerns, Engineer with Facilities Services, University of Montana, for
providing information on central heating and power plant operations and equipment.
Disclaimer
This report was prepared as an account of work sponsored by an agency of the United States
Government. Neither the United States Government nor any agency thereof, nor any of their
employees, makes any warranty, express or implied, or assumes any legal liability or responsibility for
the accuracy, completeness, or usefulness of any information, apparatus, product, or process disclosed,
or represents that its use would not infringe privately owned rights. Reference herein to any specific
commercial product, process, or service by trade name, trademark, manufacturer, or otherwise does
not necessarily constitute or imply its endorsement, recommendation, or favoring by the United States
Government or any agency thereof. The views and opinions of authors expressed herein do not
necessarily state or reflect those of the United States Government or any agency thereof.

3
Site Information
Name Brian Kerns, Engineer
Location
Facilities Services, Engineering and Utilities Physical Plant Building 32 University of Montana Missoula, MT 59812
Contact Person Phone (406) 243-2788 Contact Person E-Mail [email protected]
Utility Provider
Electrical: Northwestern Energy Natural Gas: Northwestern Energy Other:
Department of Environmental Quality Contact
Contact Name Brian Spangler Contact Position/Company Manager, Energy Planning and Renewables Program
Department of Environmental Quality Energy Bureau, P.O. Box 200901 Helena, MT 59620-0901
Contact Person Phone (406) 444-6459 Contact Person E-Mail [email protected]
U.S. DOE CHP TAP Contacts
CHP TAP Name and Region Northwest CHP TAP Website http://www.northwestchptap.org/
Assessment Contact Gilbert A. McCoy, PE Carolyn Roos, PhD Assessment Contact Phone 360-956-2086 (360) 956-2156 Assessment Contact Email [email protected]
CHP TAP Director Name David Sjoding CHP TAP Director Phone 360-956-2004 CHP TAP Director Email [email protected]
4
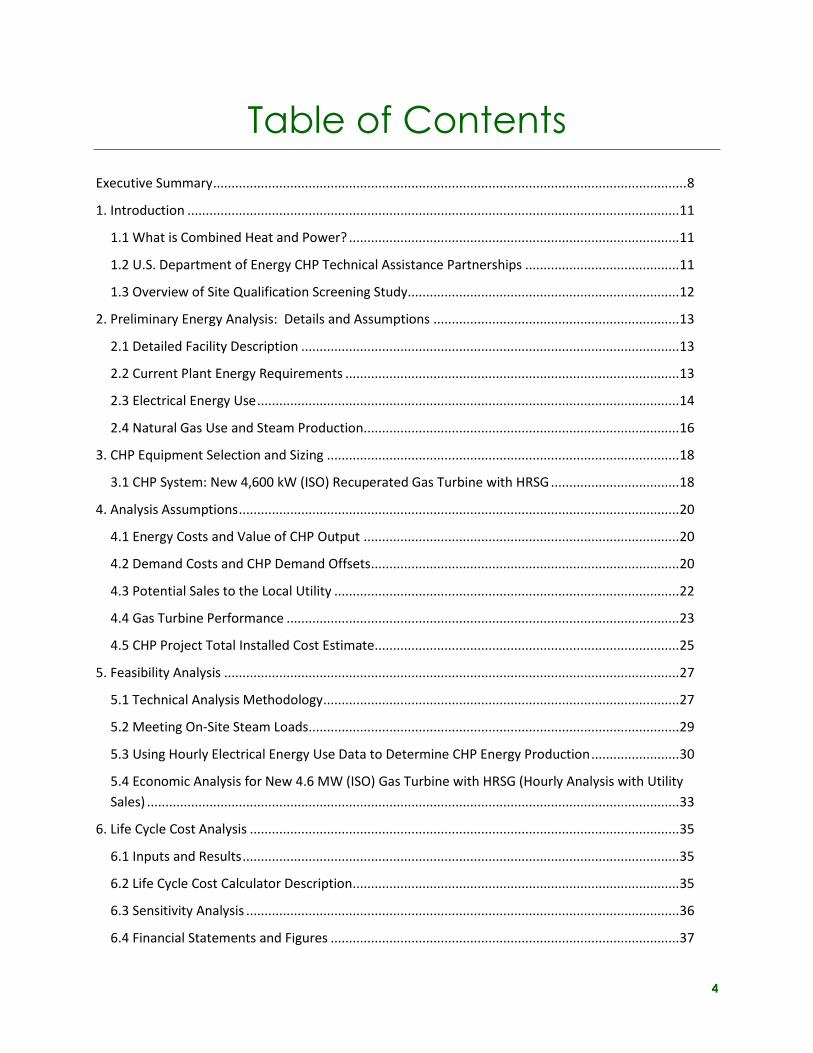
Table of Contents
Executive Summary ................................................................................................................................. 8
1. Introduction ...................................................................................................................................... 11
1.1 What is Combined Heat and Power? .......................................................................................... 11
1.2 U.S. Department of Energy CHP Technical Assistance Partnerships .......................................... 11
1.3 Overview of Site Qualification Screening Study.......................................................................... 12
2. Preliminary Energy Analysis: Details and Assumptions ................................................................... 13
2.1 Detailed Facility Description ....................................................................................................... 13
2.2 Current Plant Energy Requirements ........................................................................................... 13
2.3 Electrical Energy Use ................................................................................................................... 14
2.4 Natural Gas Use and Steam Production ...................................................................................... 16
3. CHP Equipment Selection and Sizing ................................................................................................ 18
3.1 CHP System: New 4,600 kW (ISO) Recuperated Gas Turbine with HRSG ................................... 18
4. Analysis Assumptions ........................................................................................................................ 20
4.1 Energy Costs and Value of CHP Output ...................................................................................... 20
4.2 Demand Costs and CHP Demand Offsets .................................................................................... 20
4.3 Potential Sales to the Local Utility .............................................................................................. 22
4.4 Gas Turbine Performance ........................................................................................................... 23
4.5 CHP Project Total Installed Cost Estimate................................................................................... 25
5. Feasibility Analysis ............................................................................................................................ 27
5.1 Technical Analysis Methodology ................................................................................................. 27
5.2 Meeting On-Site Steam Loads ..................................................................................................... 29
5.3 Using Hourly Electrical Energy Use Data to Determine CHP Energy Production ........................ 30
5.4 Economic Analysis for New 4.6 MW (ISO) Gas Turbine with HRSG (Hourly Analysis with Utility
Sales) ................................................................................................................................................. 33
6. Life Cycle Cost Analysis ..................................................................................................................... 35
6.1 Inputs and Results ....................................................................................................................... 35
6.2 Life Cycle Cost Calculator Description ......................................................................................... 35
6.3 Sensitivity Analysis ...................................................................................................................... 36
6.4 Financial Statements and Figures ............................................................................................... 37

5
7. Emissions Analysis ............................................................................................................................. 39
7.1 Air Emissions Analysis ................................................................................................................. 39
7.2 Greenhouse Gas Emissions ......................................................................................................... 39
7.3 Criteria Pollutants ....................................................................................................................... 39
8. Summary and Conclusions ................................................................................................................ 43
6
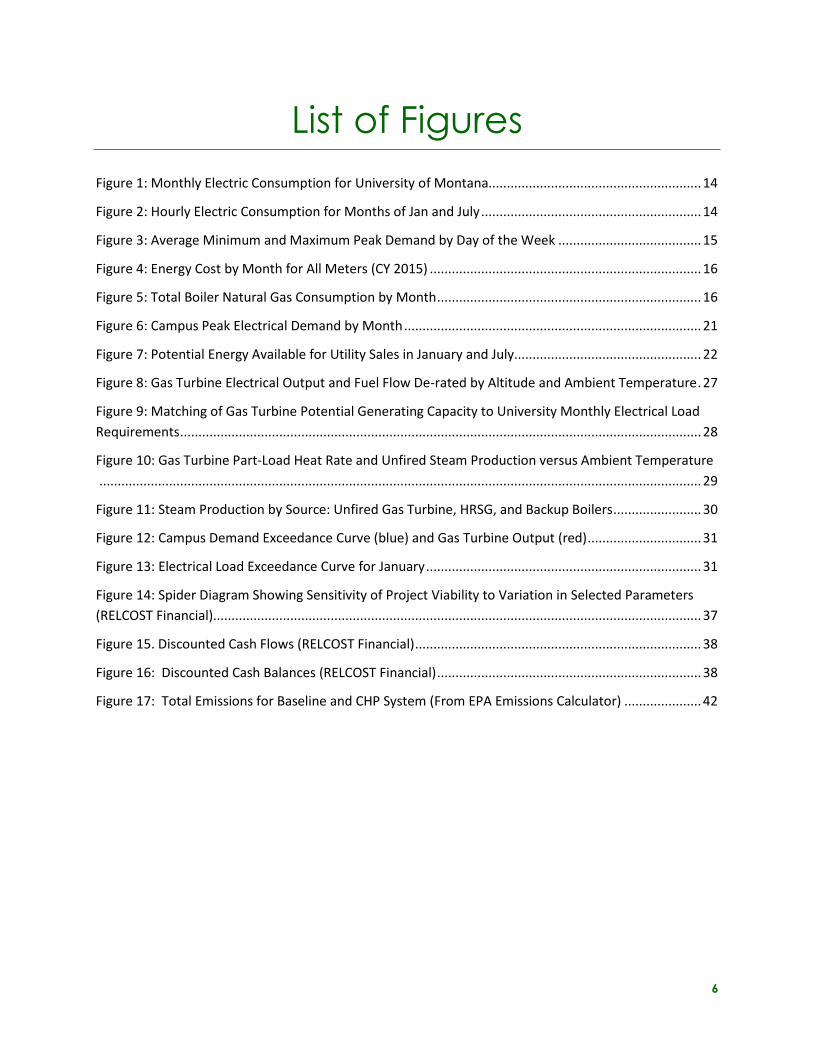
List of Figures
Figure 1: Monthly Electric Consumption for University of Montana.......................................................... 14
Figure 2: Hourly Electric Consumption for Months of Jan and July ............................................................ 14
Figure 3: Average Minimum and Maximum Peak Demand by Day of the Week ....................................... 15
Figure 4: Energy Cost by Month for All Meters (CY 2015) .......................................................................... 16
Figure 5: Total Boiler Natural Gas Consumption by Month ........................................................................ 16
Figure 6: Campus Peak Electrical Demand by Month ................................................................................. 21
Figure 7: Potential Energy Available for Utility Sales in January and July................................................... 22
Figure 8: Gas Turbine Electrical Output and Fuel Flow De-rated by Altitude and Ambient Temperature . 27
Figure 9: Matching of Gas Turbine Potential Generating Capacity to University Monthly Electrical Load
Requirements .............................................................................................................................................. 28
Figure 10: Gas Turbine Part-Load Heat Rate and Unfired Steam Production versus Ambient Temperature
.................................................................................................................................................................... 29
Figure 11: Steam Production by Source: Unfired Gas Turbine, HRSG, and Backup Boilers ........................ 30
Figure 12: Campus Demand Exceedance Curve (blue) and Gas Turbine Output (red) ............................... 31
Figure 13: Electrical Load Exceedance Curve for January ........................................................................... 31
Figure 14: Spider Diagram Showing Sensitivity of Project Viability to Variation in Selected Parameters
(RELCOST Financial)..................................................................................................................................... 37
Figure 15. Discounted Cash Flows (RELCOST Financial) .............................................................................. 38
Figure 16: Discounted Cash Balances (RELCOST Financial) ........................................................................ 38
Figure 17: Total Emissions for Baseline and CHP System (From EPA Emissions Calculator) ..................... 42
7
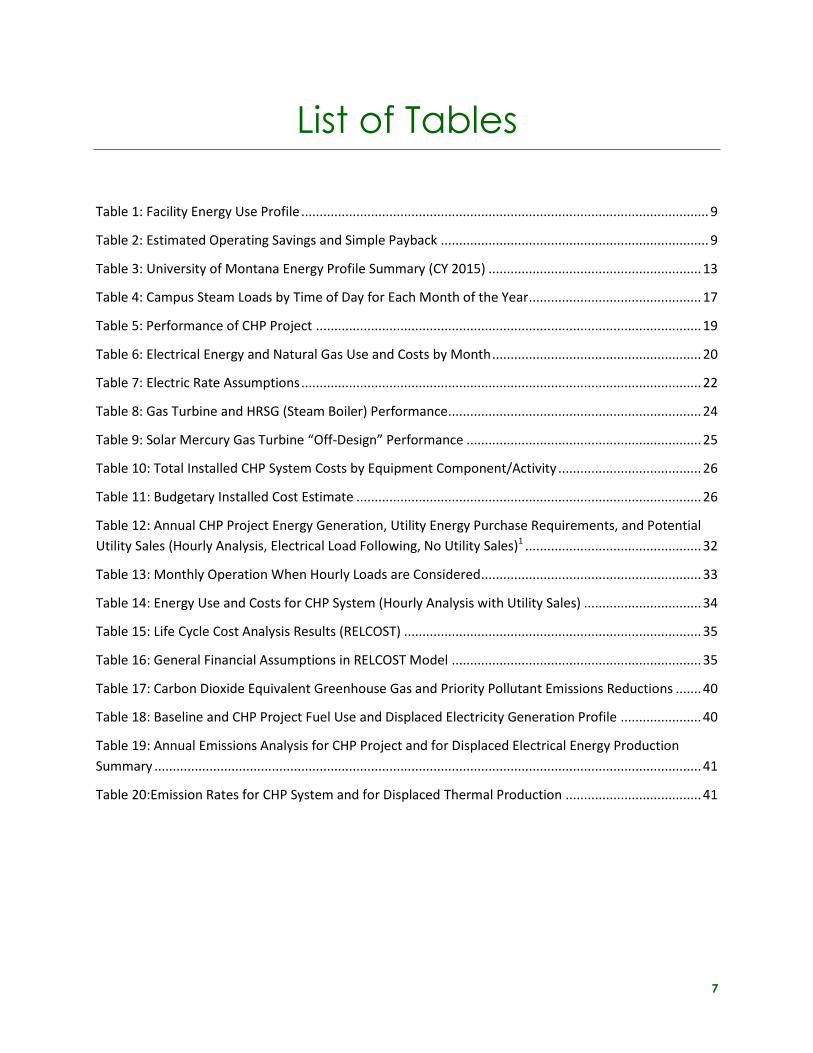
List of Tables
Table 1: Facility Energy Use Profile ............................................................................................................... 9
Table 2: Estimated Operating Savings and Simple Payback ......................................................................... 9
Table 3: University of Montana Energy Profile Summary (CY 2015) .......................................................... 13
Table 4: Campus Steam Loads by Time of Day for Each Month of the Year ............................................... 17
Table 5: Performance of CHP Project ......................................................................................................... 19
Table 6: Electrical Energy and Natural Gas Use and Costs by Month ......................................................... 20
Table 7: Electric Rate Assumptions ............................................................................................................. 22
Table 8: Gas Turbine and HRSG (Steam Boiler) Performance ..................................................................... 24
Table 9: Solar Mercury Gas Turbine “Off-Design” Performance ................................................................ 25
Table 10: Total Installed CHP System Costs by Equipment Component/Activity ....................................... 26
Table 11: Budgetary Installed Cost Estimate .............................................................................................. 26
Table 12: Annual CHP Project Energy Generation, Utility Energy Purchase Requirements, and Potential
Utility Sales (Hourly Analysis, Electrical Load Following, No Utility Sales)1 ................................................ 32
Table 13: Monthly Operation When Hourly Loads are Considered ............................................................ 33
Table 14: Energy Use and Costs for CHP System (Hourly Analysis with Utility Sales) ................................ 34
Table 15: Life Cycle Cost Analysis Results (RELCOST) ................................................................................. 35
Table 16: General Financial Assumptions in RELCOST Model .................................................................... 35
Table 17: Carbon Dioxide Equivalent Greenhouse Gas and Priority Pollutant Emissions Reductions ....... 40
Table 18: Baseline and CHP Project Fuel Use and Displaced Electricity Generation Profile ...................... 40
Table 19: Annual Emissions Analysis for CHP Project and for Displaced Electrical Energy Production
Summary ..................................................................................................................................................... 41
Table 20:Emission Rates for CHP System and for Displaced Thermal Production ..................................... 41
8
Executive Summary
The University of Montana is interested in CHP for its potential to provide operating cost reductions at
the central heating plant. This feasibility assessment was undertaken by the NW CHP TAP (with its
partner the Montana Energy Bureau) at the request of University of Montana facility managers, based
on a recent CHP Qualification Screening. The screening study conducted identifies the University of
Montana as a strong candidate for CHP and suggests that a more detailed analysis be completed. The
purpose of this feasibility assessment is to refine and provide more certainty regarding CHP project
sizing, estimate total CHP project installed costs, illustrate the economic and operational benefits of CHP
to the university and to identify next steps.
The assessment evaluated the installation of a 4,600 kW gas turbine that would produce about 31.74 million kWh of electrical energy annually (or 91.7% of the University’s current use). Annual operating savings of $1.311 million provide a simple payback of 9.8 years when existing financial incentives are included. Internal rate-of-return on investment (ROI) for the proposed $14.19 million dollar CHP project is 9.4%. The CHP project would also reduce greenhouse gas emissions from utility purchases and direct on-site combustion by 43%.
The University of Montana is a public research university that occupies 220 acres in Missoula, Montana.
Established in 1893, the university provides instruction for over 12,900 students. Steam is provided
from a central heating and power plant to a campus wide district heating system to serve 62 campus
buildings plus athletic facilities. The heating plant contains three boilers: two rated at 70,000 pounds
per hour and one at 30,000 pounds per hour. Current practice is to produce steam at 180-psig .
The University purchases about 34.5 million kWh of electrical energy annually at a melded (energy plus
demand) cost of $0.09457/kWh. The heating plant consumes about 239,000 MMBtu of natural gas. The
average total cost for natural gas during the 2015 calendar year was $7.44/MMBtu. Total annual energy
costs were about $5.04 million. The University has been greatly reducing gas costs through reducing the
percentage of transport gas purchased under firm contracts, thus a future natural gas delivered cost of
$4.75/MMBtu is assumed for this feasibility analysis.
This feasibility analysis determines the costs and benefits of installing a 4,600 kW (ISO rating) gas turbine
equipped with heat recovery steam generator (HRSG) at the central heating plant. This turbine is well
matched to both University electrical and steam loads when operating in an electrical load-following
mode up to its full rated output. The turbine would continuously operate at full output with utility sales
of excess generation during months with peak or “Heavy Load Hours”. The gas turbine selected for this
analysis produces an unfired HRSG steam flow of about 10,100 lbs/hour of 175-psig steam. Steam
produced enters the steam header system and passes through the existing backpressure steam turbine
to supply 30-psig steam for distribution as is current practice. A recuperated gas turbine can minimize
bypass of hot exhaust gases around the HRSG as the campus steam requirements between July and
September are approximately 10,000 pounds per hour. Specification of a duct burner allows the HRSG
to efficiently meet fall and winter campus steam loads up to 42,250 pounds per hour.

9
A spreadsheet-based software tool was used in this feasibility study to determine CHP annual electrical
generation, utility energy sales, CHP system fuel use, and HRSG steam production by month. This
monthly analysis tool includes re-rating gas turbine generating capacity, heat rate, and unfired steam
production based upon both altitude and varying ambient air temperature. The tool automatically
calculates monthly capacity factors, or the analyst can input monthly capacity factors determined from
an hourly electrical load analysis.
The gas turbine would produce about 31.74 million kWh of electrical energy annually. An annual
operating savings of $1.311 million provides a simple payback of 9.8 years. The facility’s energy use
profile for both baseline and CHP operating scenarios is summarized in Table 1 while estimated energy
and cost savings are provided in Table 2.
Table 1: Facility Energy Use Profile
Base Case CHP Alternative
Annual Average Net Generator Output, kW (Includes elevation derate, ambient temperatures, and auxiliary loads) 4,067
Purchased Energy, kWh/year 34,593,944 4,143,952
Average Steam Production, lbs/hour 23,752 23,752
Generated Energy for On-Site Use 30,449,992
Generated Energy for Utility Sales, kWh 1,294,867
Boiler Fuel Use, MMBtu/year 239,043 9,688
Gas Turbine Fuel Use, MMBtu/year 330,872
HRSG Fuel Use, MMBtu/year 135,218
Total Natural Gas Use, MMBtu/year 239,043 475,778
Table 2: Estimated Operating Savings and Simple Payback
Base Case CHP Alternative
Boiler and CHP Natural Gas Price, $/MMbtu $4.7500 $4.7500
Base Electric Rate, $/kWh $0.095 (melded)
Supplemental and Backup Electric, $/kWh $0.072 (energy rate only)
Demand Charges, $/year $640,802 $328,628
Natural Gas Costs, $/year $1,135,454 $2,259,944
Total Electricity Energy Costs, $/year $2,630,662 $299,063
CHP O&M Costs, $/year $317,449
Total Operating Costs, $/year $4,406,918 $3,109,393
Operating Savings, $/year $1,311,704
Capital Costs, $ $14,195,664
CHP Incentives or Grants, $ $1,277,610
Before-Tax Simple Payback (years) 10.8
Simple Payback w/CHP Incentive (years) 9.8

10
As a next step, it is recommended that the site contract with an engineering firm to move the project
forward. Negotiations with the local electric utility and pre-design studies should be pursued to verify
the technical and economic viability of CHP at the University and ensure that no “project-stoppers”
exist. Further investigation of CHP viability could include conducting an investment grade feasibility
study, which would further explore the University’s energy usage and needs, including planned
expansions and overall University planning and goals.
Special consideration may also be given to power reliability concerns, fine-tuning of generating
equipment and HRSG selection and estimated total installed costs, and consideration of additional
equipment redundancy factors that may impact CHP system equipment selection or sizing.
11
1. Introduction
1.1 What is Combined Heat and Power?
Combined heat and power (CHP) is an efficient approach for generating power and useful thermal
energy (heating or cooling) from a single fuel source at the point of use. Instead of purchasing electricity
from the local utility and using fuel in an onsite boiler or furnace to produce needed thermal energy, an
industrial or commercial facility can use CHP to provide both services onsite in one energy-efficient step.
By recovering the heat normally wasted in power generation and avoiding transmission and distribution
losses in delivering electricity from the power plant to the user, CHP reduces overall energy use, lowers
emissions, and, depending on local conditions, provides operating savings and increased reliability to the
end user.
CHP can be configured either as a topping or bottoming cycle. In a topping cycle, fuel is combusted in a
prime mover such as a gas turbine or reciprocating engine, generating electricity or mechanical power.
Energy normally lost in the prime mover’s hot exhaust and/or cooling systems is recovered to provide
process heat, hot water, or space heating/cooling for the site. In a bottoming cycle, also referred to as
waste heat to power, heat energy is recovered from the hot exhaust of a furnace or kiln to generate
mechanical power or electricity for the site. Common thermal loads for CHP applications can be process
steam or process heat for industrial facilities; cooling, heating, and humidity control systems for
buildings; or domestic hot water wherever the need exists.
The strength of CHP technology lies in its flexibility. Although natural gas is the most prevalent fuel
source, CHP can also utilize opportunity fuels such as landfill gas (LFG), biomass, and digester gas. CHP is
particularly effective when byproducts from industrial processes can be used as fuel.
1.2 U.S. Department of Energy CHP Technical Assistance Partnerships
U.S. DOE's CHP Technical Assistance Partnerships (CHP TAPs) promote and assist in transforming the
market for CHP technologies and concepts throughout the United States.
Key services of the CHP TAPs include:
o Market Assessments – Supporting analyses of CHP market potential in diverse sectors, such as
health care, industrial sites, hotels, and new commercial and institutional buildings.
o Education and Outreach – Providing information on the benefits and applications of CHP to
state and local policy makers, regulators, energy end-users, trade associations, and others.
o Technical Assistance – Providing technical information to energy end-users and others to help
them consider if CHP makes sense for them. This includes performing site assessments, producing
project feasibility studies, and providing technical and financial analyses.

12
1.3 Overview of Site Qualification Screening Study
Our CHP Qualification Screening (QS) letter indicated that “based on our review of the technical and
economic data provided, we believe the University of Montana qualifies as a strong candidate for CHP”.
Responses from facilities management staff indicate the following factors that favor the installation and
operation of a CHP system:
o Fuel and electricity rates combined with electric and thermal loads appear to support economic CHP operation;
o Concerns about future electrical energy cost increases; o Concurrent electric and thermal loads (8,760 annual hours of operation including thermal loads
due to a commercial kitchen, pool and athletic center, labs, greenhouses, and a laundry); o Existing central heating system with large thermal demands; o Advanced age of the existing boilers (46 and 55 years old); o Space adjacent to the boiler house to accommodate a gas turbine power plant; o Preliminary screening results showing the potential for operating savings at the university; o The University’s commitment to reducing its carbon footprint through funding efficiency
measures and adopting a climate action plan; and o Expectation of facility expansion or new construction projects within the next 5 years.
We reviewed gas turbines that are a good “fit” for meeting the electrical and thermal loads at the University. Our preliminary analysis focused on a recuperated turbine rated at about 3,941 kW at the
site elevation that is capable of meeting about 86% of campus electrical energy requirements and 83%
of thermal needs. Our screening study estimated an annual operating cost savings of $1.226 million at
current utility rates; a total installed cost of $7.125 million; with a simple payback of 5.8 years without
incentives.
The QS screening indicates the university is a strong candidate for a CHP project and suggests a more
detailed analysis be conducted with considerations given to seasonal use of thermal energy and
seasonal temperature variations of gas turbine performance factored in. Facility hourly electrical energy
and steam usage data could be used to identify spikes in use that could not be met by either the gas
turbine or HRSG. The QS screening also had valued electrical generation at the full melded cost of
electrical energy with the gas turbine offsetting both energy and all, or a portion of, demand or capacity
charges. A more detailed study would examine demand benefits taking into consideration gas turbine
mean time between failures; the need for scheduled outages; and the frequency and duration of forced
outages.
This feasibility analysis is being conducted, at the request of facility managers, to refine and provide
more certainty regarding the estimated total installed costs, and economic and operational benefits of
CHP to the university. The feasibility analysis will clarify gas compression operating costs, and
determine the additional costs associated with adding reliability components to the CHP project such as
the ability of the gas turbine to use No. 2 (diesel) oil when natural gas supplies are interrupted, and the
costs associated with providing outside air firing capability to the HRSG. The goal is to provide the
information necessary for the university to make a decision on taking the next steps(s) in the CHP
development process.
13
2. Preliminary Energy Analysis:
Details and Assumptions
2.1 Detailed Facility Description
The University of Montana is a public research university that occupies 220 acres in Missoula, Montana.
Established in 1893, the university employs 831 full and part-time staff to provide instruction for 12,922
students (Spring, 2015). Steam is provided from a central heating and power plant to a campus wide
district heating system to serve 62 campus buildings plus athletic facilities. The heating plant contains
three boilers: two rated at 70,000 pounds per hour and one at 30,000 pounds per hour. The large
boilers can produce steam at up to 200-psig while the smaller boiler can operate at 275-psig. Current
practice is to produce steam at pressures up to 180-psig and then to reduce the steam to a distribution
pressure of 30-psig through passing it through pressure reduction valves or a 440 kW backpressure
steam turbine. The steam turbine, rated for a flow of 24,978 pounds per hour, supplies about 5% of the
current campus annual energy consumption.
2.2 Current Plant Energy Requirements
In addition to the steam turbine output, the University purchases about 34.5 million kWh of electrical
energy annually from NorthWestern Energy at a melded (energy plus demand) cost of $0.09457/kWh.
Total annual costs for the purchase of electrical energy is $3,261,008. The heating plant annually
consumes about 239,000 MMBtu of pipeline transport natural gas. Total natural gas cost for the 2015
calendar year was $1,779,899. The average cost for natural gas commodity prices plus transportation
and storage during the 2015 calendar year was $4.75/MMBtu. Total utility bills for the campus in CY
2015 amounted to $5,040,907. Natural gas prices have since declined.
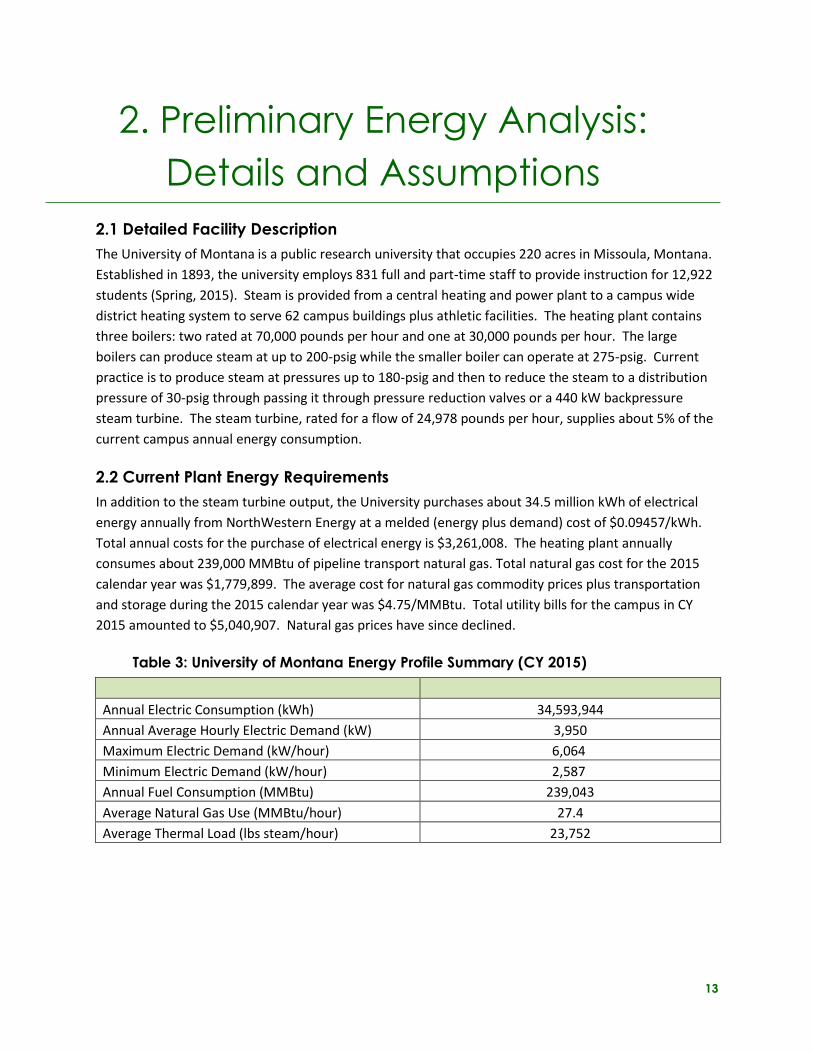
Table 3: University of Montana Energy Profile Summary (CY 2015)
Annual Electric Consumption (kWh) 34,593,944
Annual Average Hourly Electric Demand (kW) 3,950
Maximum Electric Demand (kW/hour) 6,064
Minimum Electric Demand (kW/hour) 2,587
Annual Fuel Consumption (MMBtu) 239,043
Average Natural Gas Use (MMBtu/hour) 27.4
Average Thermal Load (lbs steam/hour) 23,752
14
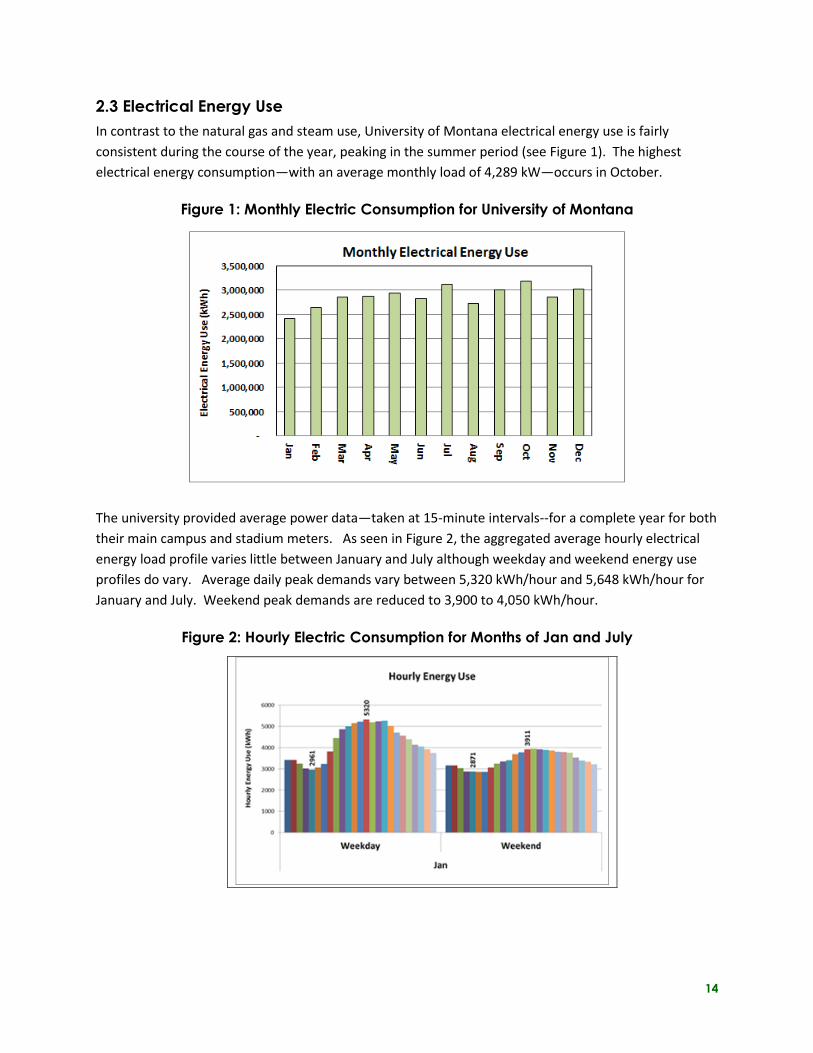
2.3 Electrical Energy Use
In contrast to the natural gas and steam use, University of Montana electrical energy use is fairly
consistent during the course of the year, peaking in the summer period (see Figure 1). The highest
electrical energy consumption—with an average monthly load of 4,289 kW—occurs in October.
Figure 1: Monthly Electric Consumption for University of Montana
The university provided average power data—taken at 15-minute intervals--for a complete year for both
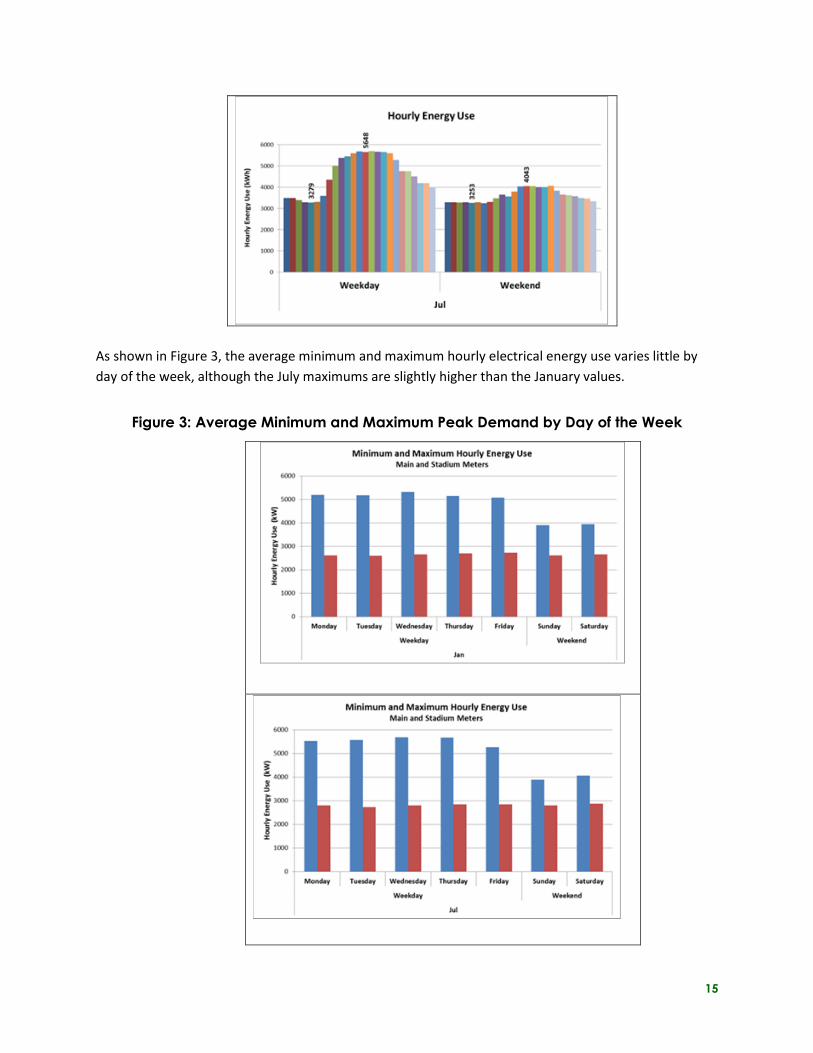
their main campus and stadium meters. As seen in Figure 2, the aggregated average hourly electrical
energy load profile varies little between January and July although weekday and weekend energy use
profiles do vary. Average daily peak demands vary between 5,320 kWh/hour and 5,648 kWh/hour for
January and July. Weekend peak demands are reduced to 3,900 to 4,050 kWh/hour.
Figure 2: Hourly Electric Consumption for Months of Jan and July
15
As shown in Figure 3, the average minimum and maximum hourly electrical energy use varies little by
day of the week, although the July maximums are slightly higher than the January values.
Figure 3: Average Minimum and Maximum Peak Demand by Day of the Week
16
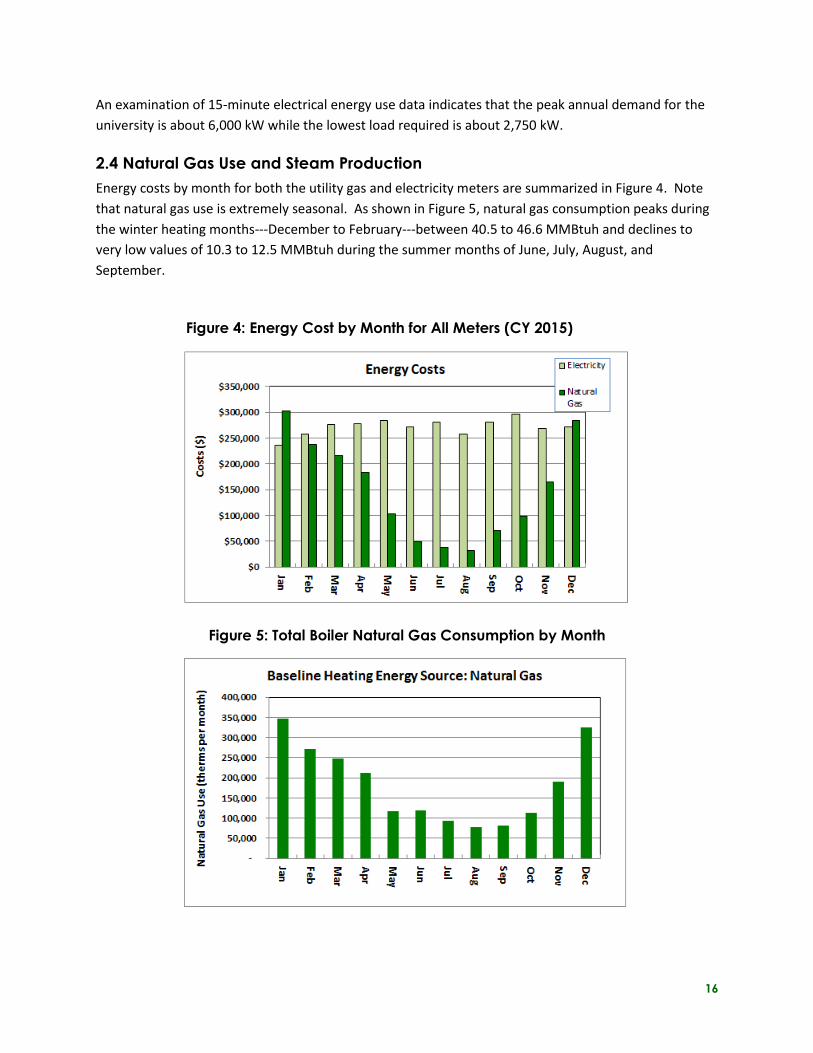
An examination of 15-minute electrical energy use data indicates that the peak annual demand for the
university is about 6,000 kW while the lowest load required is about 2,750 kW.
2.4 Natural Gas Use and Steam Production
Energy costs by month for both the utility gas and electricity meters are summarized in Figure 4. Note
that natural gas use is extremely seasonal. As shown in Figure 5, natural gas consumption peaks during
the winter heating months---December to February---between 40.5 to 46.6 MMBtuh and declines to
very low values of 10.3 to 12.5 MMBtuh during the summer months of June, July, August, and
September.
Figure 4: Energy Cost by Month for All Meters (CY 2015)
Figure 5: Total Boiler Natural Gas Consumption by Month

17
The university facilities staff provided steam production extracted from plant logs for all boilers by three
hour intervals. The data shown in Table 4 shows average steam production is relatively constant over
the course of both weekdays and weekends. While gas consumption and steam generation varies
widely by month, the average steam production by 3-hour time block or by time-of-day for each month
is extremely consistent. It is postulated that, due to Montana’s harsh winter weather and building
thermal mass, the buildings are not allowed to cool down at night, followed by a morning warmup cycle.
This constant daily natural gas and steam use profile is ideal for a CHP project as backup boilers are not
required to be maintained in a hot standby condition and brought on-line to meet early morning peak
loads.
Table 4: Campus Steam Loads by Time of Day for Each Month of the Year
Row Labels
Average of
Midnight
Average of
3:00 AM
Average of
6:00 AM
Average of
9:00 AM
Average of
Noon
Average of
3:00 PM
Average of
6:00 PM
Average of
9:00 PM
Jan
Weekday 27,330 27,858 29,129 29,437 27,992 26,362 27,535 27,463
Weekend 26,746 26,916 28,129 28,150 26,680 24,772 25,424 26,089
Feb 23,427 23,655 26,228 28,323 24,878 22,069 23,282 24,356
Mar 19,382 19,974 23,092 26,377 21,173 17,408 17,433 18,680
Apr 16,222 17,171 19,501 22,588 17,646 14,860 14,649 15,285
May 10,873 11,645 14,141 15,543 12,141 10,756 10,309 10,724
Jun 7,231 7,629 8,635 8,799 8,195 7,580 7,248 6,908
Jul 6,719 6,868 7,741 8,247 7,543 7,111 7,019 6,645
Aug 6,827 6,886 7,830 8,376 7,914 7,202 6,920 6,694
Sep 9,346 8,846 10,567 14,085 10,788 9,552 9,304 9,739
Oct 12,948 12,579 14,983 19,141 15,199 12,324 12,070 13,164
Nov 21,903 21,429 23,668 26,743 24,003 21,855 23,347 22,862
Dec 26,309 26,327 27,684 28,760 28,527 27,328 27,680 27,382
Overall Average 15,761 15,936 17,776 19,708 17,204 15,383 15,588 15,871

18
3. CHP Equipment Selection and
Sizing
3.1 CHP System: New 4,600 kW (ISO) Recuperated Gas Turbine with HRSG
This feasibility analysis determines the costs and benefits of installing a 4,600 kW (ISO rating)
recuperated gas turbine equipped with heat recovery steam generator (HRSG) at the central heating
plant. The gas turbine is de-rated to 3,941 kW (at 59⁰F)given the 3,209 elevation of the university and
would be operated in an electrical load-following mode up to its full output. Due to the temperature
profile at the site, the net annual electrical output (when auxiliary service loads are included) is 4,067
kW. Electrical energy must be purchased from the local electrical utility when campus electrical energy
requirements exceed the generating capacity of the gas turbine. Steam is produced by routing the gas
turbine exhaust through a HRSG. A duct burner is provided so the CHP project is capable of
simultaneously operating in both an electrical and a steam load following mode. CHP project
performance is summarized in Table 5.
The recuperated turbine was selected for analysis as its exhaust temperature of 650⁰F to 700⁰F
produces an unfired steam flow of about 10,100 lbs/hour of 175-psig steam. Steam production would
enter the existing header system and pass through the existing backpressure steam turbine as is current
practice. The recuperated turbine would minimize bypass of hot exhaust around the HRSG when the
campus steam requirements fall below 10,000 pounds per hour between July and September. Use of a
duct burner would allow the HRSG to efficiently meet fall and winter campus steam loads up to 42,250
pounds per hour.
A non-recuperated 4,600 kW (ISO) gas turbine would provide exhaust gas at a temperature of about
950⁰F. Without use of a bypass or dump stack, the unfired steam generation from the non-recuperated
gas turbine would be approximately 21,100 pounds per hour---which greatly exceeds the campus steam
requirements for the six month period between May through October. About 20% of the potentially
useable thermal energy for this equipment selection alternative would have to be bypassed to a dump
stack and vented to atmosphere. Although a non-recuperated turbine has a lower initial cost, gas
turbine fuel consumption would increase (by over 31%) when providing the same electrical output as
the turbine nominal generating efficiency (at 59⁰F and site altitude) decreases from 33.8% for a
recuperated turbine to only 25.7% (HHV basis) for the non-recuperated turbine. As the unfired steam
flow is greater, however, less fuel would be required by the duct burner for steam production.
Assuming a 94.7% availability factor, the recuperated gas turbine would produce about 31.7 million kWh
of electrical energy annually. About 1.29 million kWh of surplus electrical energy would be sold to the
utility during on-peak or Heavy Load Hour months. Natural gas use at the central heating plant would
increase from about 239,300 MMBtu/year to 475,778 MMBtu annually.
19
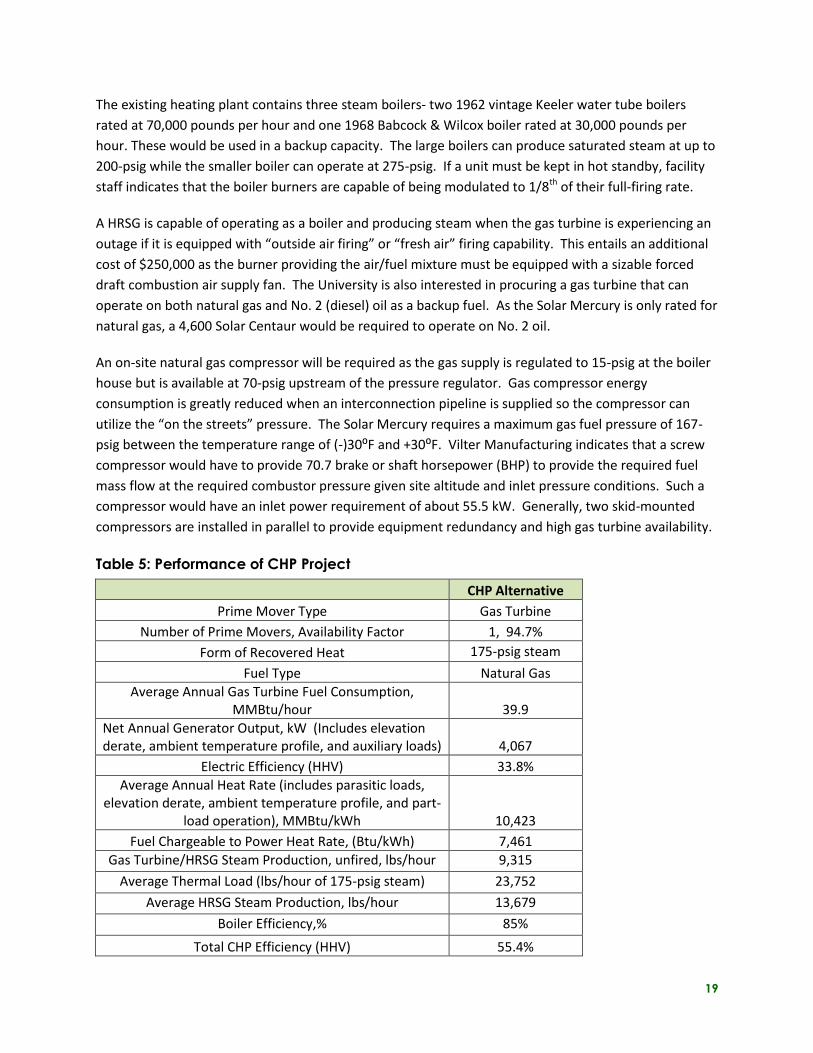
The existing heating plant contains three steam boilers- two 1962 vintage Keeler water tube boilers
rated at 70,000 pounds per hour and one 1968 Babcock & Wilcox boiler rated at 30,000 pounds per
hour. These would be used in a backup capacity. The large boilers can produce saturated steam at up to
200-psig while the smaller boiler can operate at 275-psig. If a unit must be kept in hot standby, facility
staff indicates that the boiler burners are capable of being modulated to 1/8th of their full-firing rate.
A HRSG is capable of operating as a boiler and producing steam when the gas turbine is experiencing an
outage if it is equipped with “outside air firing” or “fresh air” firing capability. This entails an additional
cost of $250,000 as the burner providing the air/fuel mixture must be equipped with a sizable forced
draft combustion air supply fan. The University is also interested in procuring a gas turbine that can
operate on both natural gas and No. 2 (diesel) oil as a backup fuel. As the Solar Mercury is only rated for
natural gas, a 4,600 Solar Centaur would be required to operate on No. 2 oil.
An on-site natural gas compressor will be required as the gas supply is regulated to 15-psig at the boiler
house but is available at 70-psig upstream of the pressure regulator. Gas compressor energy
consumption is greatly reduced when an interconnection pipeline is supplied so the compressor can
utilize the “on the streets” pressure. The Solar Mercury requires a maximum gas fuel pressure of 167-
psig between the temperature range of (-)30⁰F and +30⁰F. Vilter Manufacturing indicates that a screw
compressor would have to provide 70.7 brake or shaft horsepower (BHP) to provide the required fuel
mass flow at the required combustor pressure given site altitude and inlet pressure conditions. Such a
compressor would have an inlet power requirement of about 55.5 kW. Generally, two skid-mounted
compressors are installed in parallel to provide equipment redundancy and high gas turbine availability.
Table 5: Performance of CHP Project
CHP Alternative
Prime Mover Type Gas Turbine
Number of Prime Movers, Availability Factor 1, 94.7%
Form of Recovered Heat 175-psig steam
Fuel Type Natural Gas
Average Annual Gas Turbine Fuel Consumption, MMBtu/hour 39.9
Net Annual Generator Output, kW (Includes elevation derate, ambient temperature profile, and auxiliary loads) 4,067
Electric Efficiency (HHV) 33.8%
Average Annual Heat Rate (includes parasitic loads, elevation derate, ambient temperature profile, and part-
load operation), MMBtu/kWh 10,423
Fuel Chargeable to Power Heat Rate, (Btu/kWh) 7,461
Gas Turbine/HRSG Steam Production, unfired, lbs/hour 9,315
Average Thermal Load (lbs/hour of 175-psig steam) 23,752
Average HRSG Steam Production, lbs/hour 13,679
Boiler Efficiency,% 85%
Total CHP Efficiency (HHV) 55.4%

20
4. Analysis Assumptions
4.1 Energy Costs and Value of CHP Output
Monthly consumption for electrical energy and natural gas at the University of Montana are given in
Table 6. Annual electrical energy consumption for the main and stadium electrical meters combined
total 34.48 million kWh with a cost of $3.26 million for both energy and demand. The melded electrical
energy cost amounts to $0.095/kWh. Natural gas use amounts to 239,043 MMBtu with a total cost of
$1.135 million. The average cost for natural gas is $4.752/MMBtu.
Table 6: Electrical Energy and Natural Gas Use and Costs by Month
The University purchases electrical energy from Northwestern Energy under their General Service -1-
Demand rate schedule. For CY 2015, the average energy cost was $0.06665/kWh while the average
demand charge was $7.822/kW-mo. For the December 2015—January 2016 period, the demand charge
increased to $7.90/kW-mo. When taxes and surcharges are included, the energy and demand charge
offset values increase to $0.0726/kWh and $8.92/kW-mo, respectively. The CHP electrical energy
production of 29.8 million kWh/year that is used on-site to displace utility purchases yields a total
annual energy purchase displacement benefit of $2,167,300 when valued at $0.0726/kWh.
4.2 Demand Costs and CHP Demand Offsets
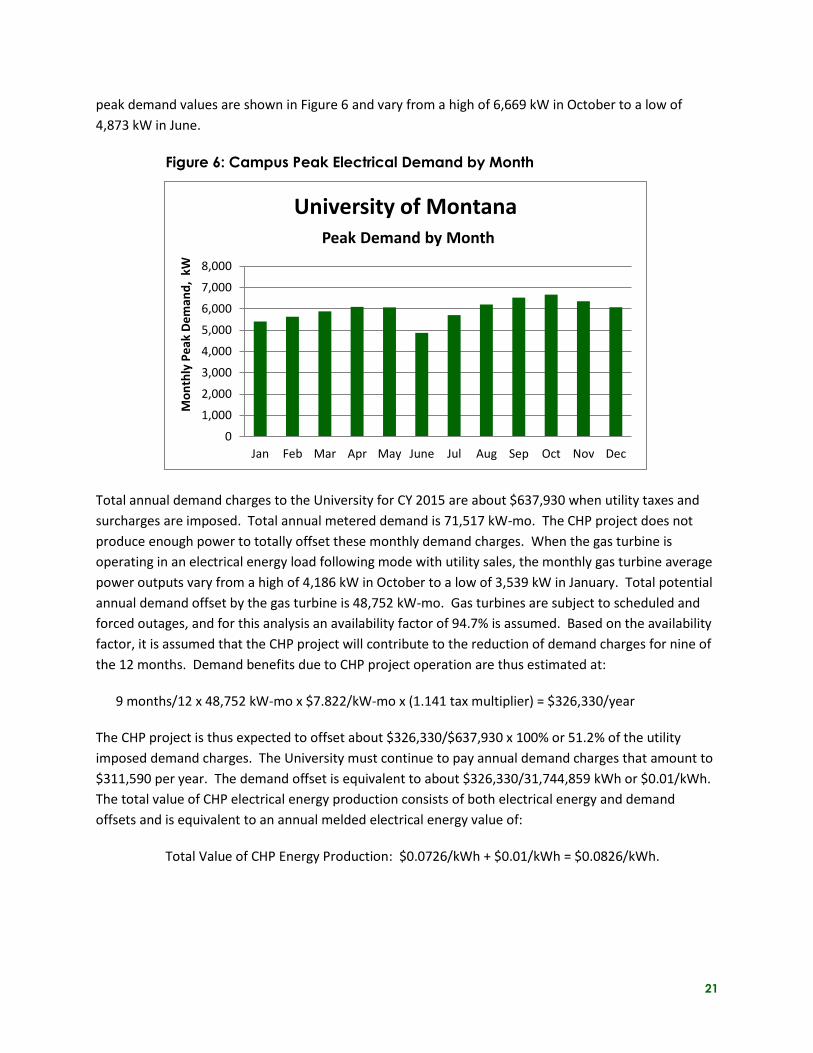
The average monthly peak demand for the University of Montana was 5,960 kW during the CY2015
billing period. Demand is summed for both the main and stadium meters. Utility-metered monthly
21
peak demand values are shown in Figure 6 and vary from a high of 6,669 kW in October to a low of
4,873 kW in June.
Figure 6: Campus Peak Electrical Demand by Month
Total annual demand charges to the University for CY 2015 are about $637,930 when utility taxes and
surcharges are imposed. Total annual metered demand is 71,517 kW-mo. The CHP project does not
produce enough power to totally offset these monthly demand charges. When the gas turbine is
operating in an electrical energy load following mode with utility sales, the monthly gas turbine average
power outputs vary from a high of 4,186 kW in October to a low of 3,539 kW in January. Total potential
annual demand offset by the gas turbine is 48,752 kW-mo. Gas turbines are subject to scheduled and
forced outages, and for this analysis an availability factor of 94.7% is assumed. Based on the availability
factor, it is assumed that the CHP project will contribute to the reduction of demand charges for nine of
the 12 months. Demand benefits due to CHP project operation are thus estimated at:
9 months/12 x 48,752 kW-mo x $7.822/kW-mo x (1.141 tax multiplier) = $326,330/year
The CHP project is thus expected to offset about $326,330/$637,930 x 100% or 51.2% of the utility
imposed demand charges. The University must continue to pay annual demand charges that amount to
$311,590 per year. The demand offset is equivalent to about $326,330/31,744,859 kWh or $0.01/kWh.
The total value of CHP electrical energy production consists of both electrical energy and demand
offsets and is equivalent to an annual melded electrical energy value of:
Total Value of CHP Energy Production: $0.0726/kWh + $0.01/kWh = $0.0826/kWh.
0
1,000
2,000
3,000
4,000
5,000
6,000
7,000
8,000
Jan Feb Mar Apr May June Jul Aug Sep Oct Nov Dec
Mo
nth
ly P
eak
De
man
d,
kW
University of Montana Peak Demand by Month
22
Table 7: Electric Rate Assumptions
Energy and Demand Charges Used in Analysis
Generation (Offset On-Site Energy Charges) $0.0726/kWh
Utility Sales (During Heavy-Load Hour Months) $0.0739/kWh
Demand Offset Benefits (Assuming 75% Offset) $6.69/kW-mo
The total value due to offset of electrical energy used on-site and offset demand charges is:
CHP Annual Electrical Energy Benefits = $2,167,300/year + $326,330/year = $2,493,960
Benefits due to energy sales to the utility during heavy load hour months are discussed in the following
section.
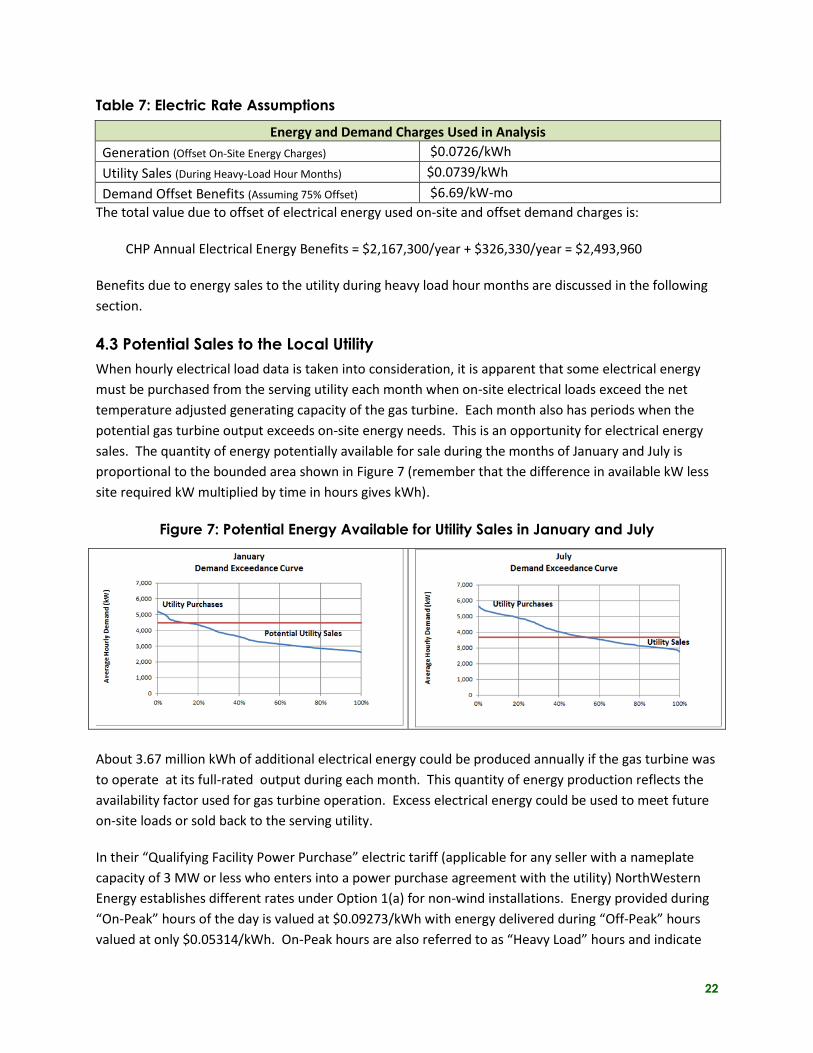
4.3 Potential Sales to the Local Utility
When hourly electrical load data is taken into consideration, it is apparent that some electrical energy
must be purchased from the serving utility each month when on-site electrical loads exceed the net
temperature adjusted generating capacity of the gas turbine. Each month also has periods when the
potential gas turbine output exceeds on-site energy needs. This is an opportunity for electrical energy
sales. The quantity of energy potentially available for sale during the months of January and July is
proportional to the bounded area shown in Figure 7 (remember that the difference in available kW less
site required kW multiplied by time in hours gives kWh).
Figure 7: Potential Energy Available for Utility Sales in January and July
About 3.67 million kWh of additional electrical energy could be produced annually if the gas turbine was
to operate at its full-rated output during each month. This quantity of energy production reflects the
availability factor used for gas turbine operation. Excess electrical energy could be used to meet future
on-site loads or sold back to the serving utility.
In their “Qualifying Facility Power Purchase” electric tariff (applicable for any seller with a nameplate
capacity of 3 MW or less who enters into a power purchase agreement with the utility) NorthWestern
Energy establishes different rates under Option 1(a) for non-wind installations. Energy provided during
“On-Peak” hours of the day is valued at $0.09273/kWh with energy delivered during “Off-Peak” hours
valued at only $0.05314/kWh. On-Peak hours are also referred to as “Heavy Load” hours and indicate
23
the weekday and Saturday hours between 7 a.m. through 10 p.m. except for holidays during the months
of January, February, July, August, and December. Off-peak hours are all hours that are not considered
to be on-peak.
It would not be cost-effective to operate the gas turbine during “off-peak” months with no Heavy Load
hours. Rather than operate the gas turbine at full-firing rate only during the on-peak hours during the
Heavy Load hour months, we assume that the gas turbine will operate at full output for each of these
five critical months. Taking Sundays and holidays into consideration, a reasonable estimate for a
weighted average utility purchase price is $0.0739/kWh. With a total expected utility sales of 1,294,867
kWh/year during Heavy Load hour months only, the benefit from utility purchases amounts to about
$95,690 annually (See Section 5 for additional details).
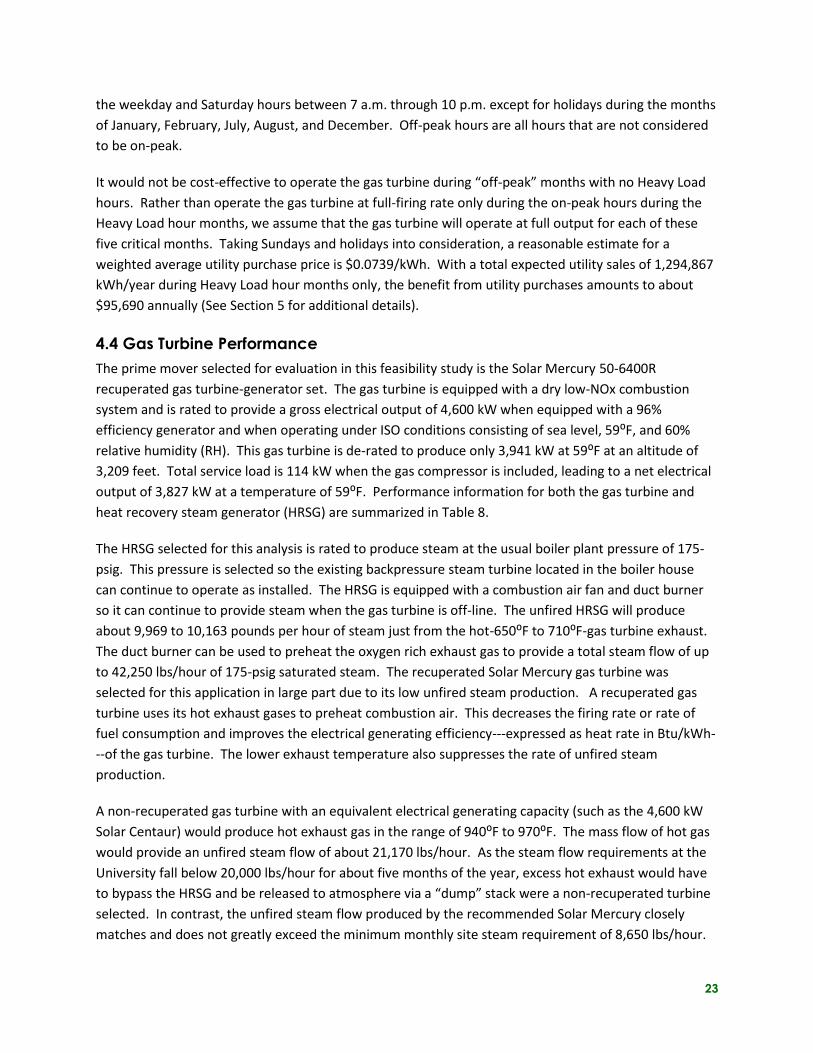
4.4 Gas Turbine Performance
The prime mover selected for evaluation in this feasibility study is the Solar Mercury 50-6400R
recuperated gas turbine-generator set. The gas turbine is equipped with a dry low-NOx combustion
system and is rated to provide a gross electrical output of 4,600 kW when equipped with a 96%
efficiency generator and when operating under ISO conditions consisting of sea level, 59⁰F, and 60%
relative humidity (RH). This gas turbine is de-rated to produce only 3,941 kW at 59⁰F at an altitude of
3,209 feet. Total service load is 114 kW when the gas compressor is included, leading to a net electrical
output of 3,827 kW at a temperature of 59⁰F. Performance information for both the gas turbine and
heat recovery steam generator (HRSG) are summarized in Table 8.
The HRSG selected for this analysis is rated to produce steam at the usual boiler plant pressure of 175-
psig. This pressure is selected so the existing backpressure steam turbine located in the boiler house
can continue to operate as installed. The HRSG is equipped with a combustion air fan and duct burner
so it can continue to provide steam when the gas turbine is off-line. The unfired HRSG will produce
about 9,969 to 10,163 pounds per hour of steam just from the hot-650⁰F to 710⁰F-gas turbine exhaust.
The duct burner can be used to preheat the oxygen rich exhaust gas to provide a total steam flow of up
to 42,250 lbs/hour of 175-psig saturated steam. The recuperated Solar Mercury gas turbine was
selected for this application in large part due to its low unfired steam production. A recuperated gas
turbine uses its hot exhaust gases to preheat combustion air. This decreases the firing rate or rate of
fuel consumption and improves the electrical generating efficiency---expressed as heat rate in Btu/kWh-
--of the gas turbine. The lower exhaust temperature also suppresses the rate of unfired steam
production.
A non-recuperated gas turbine with an equivalent electrical generating capacity (such as the 4,600 kW
Solar Centaur) would produce hot exhaust gas in the range of 940⁰F to 970⁰F. The mass flow of hot gas
would provide an unfired steam flow of about 21,170 lbs/hour. As the steam flow requirements at the
University fall below 20,000 lbs/hour for about five months of the year, excess hot exhaust would have
to bypass the HRSG and be released to atmosphere via a “dump” stack were a non-recuperated turbine
selected. In contrast, the unfired steam flow produced by the recommended Solar Mercury closely
matches and does not greatly exceed the minimum monthly site steam requirement of 8,650 lbs/hour.
24
High temperature pollution control equipment (selective catalytic reduction or SCR) is available that is
capable of operating at temperatures of up to 1,100⁰F. A high temperature SCR installation allows the
catalyst to be placed directly downstream of the turbine exhaust flange.
Table 8: Gas Turbine and HRSG (Steam Boiler) Performance
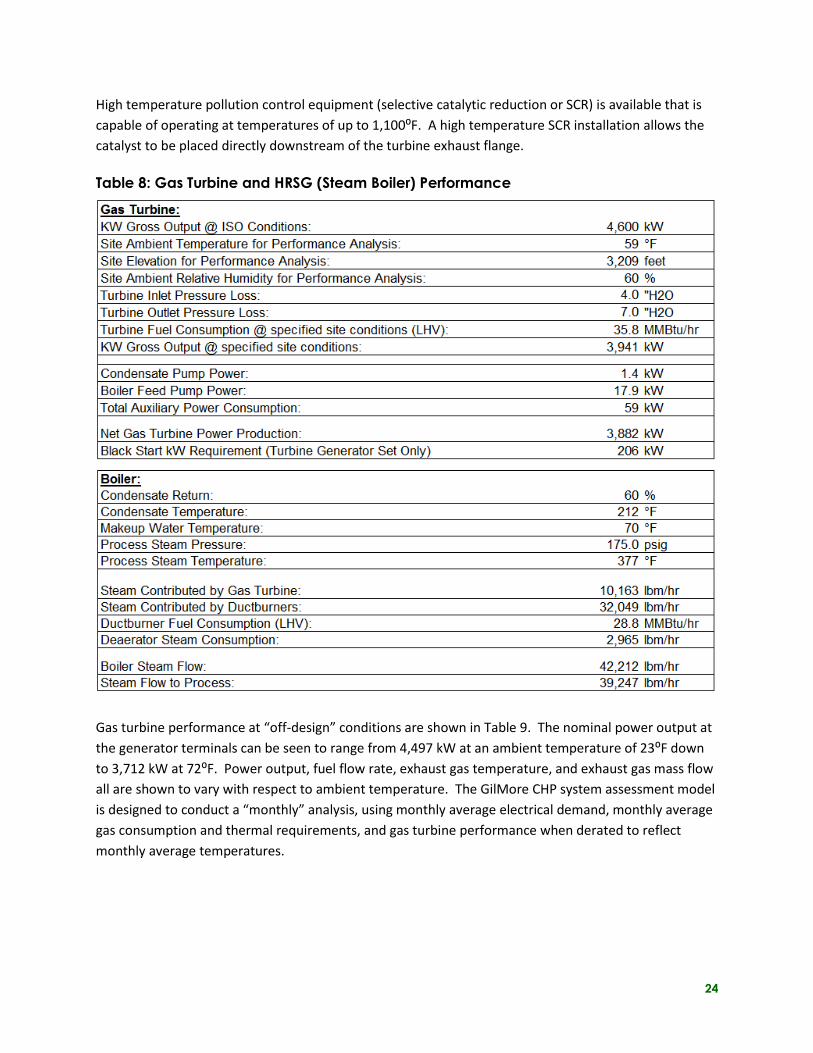
Gas turbine performance at “off-design” conditions are shown in Table 9. The nominal power output at
the generator terminals can be seen to range from 4,497 kW at an ambient temperature of 23⁰F down
to 3,712 kW at 72⁰F. Power output, fuel flow rate, exhaust gas temperature, and exhaust gas mass flow
all are shown to vary with respect to ambient temperature. The GilMore CHP system assessment model
is designed to conduct a “monthly” analysis, using monthly average electrical demand, monthly average
gas consumption and thermal requirements, and gas turbine performance when derated to reflect
monthly average temperatures.
25
Table 9: Solar Mercury Gas Turbine “Off-Design” Performance
4.5 CHP Project Total Installed Cost Estimate
Equipment and installation cost estimates are supplied by vendor cost quotations or extracted from
Section 3 ‘Technology Characterization—Combustion Turbines’ from the March, 2015 U.S. EPA “Catalog
of CHP Technologies”. The catalog indicates equipment, design, installation, permitting, and project
management cost data for gas turbine CHP systems of various generating capacities. Cost estimates for
the 4,600 kW Solar Mercury system were extrapolated from data for a 3,510 kW Solar Centaur 40 unit
and a 7,520 kW Solar Taurus 70. The cost estimates are augmented through obtaining actual cost
quotations for various equipment components such as the Solar Mercury turbine, dual gas compressors
and a Rentech HRSG with outside air firing capability.
Since the EPA Catalog displays costs for an unfired HRSG producing 150-psig steam, a cost quotation was
obtained for an appropriate sized HRSG equipped with a duct burner. This HRSG is designed to produce
up to 42,250 pounds per hour of 175-psig steam and, for equipment redundancy purposes, is equipped
with a forced draft combustion air fan that allows fresh air firing. This option allows the HRSG to
continue to produce steam when the gas turbine goes off-line meaning that the existing boilers do not
have to be maintained in a “hot standby” condition. The scope of supply includes a low-NOx duct
burner, inlet ducting and exhaust diverter valve, finned tube feedwater economizer, outlet ducting, a
main stack with silencer, and controls. It is assumed that the makeup water treatment provided for the
existing boilers is suitable for the HRSG.
26
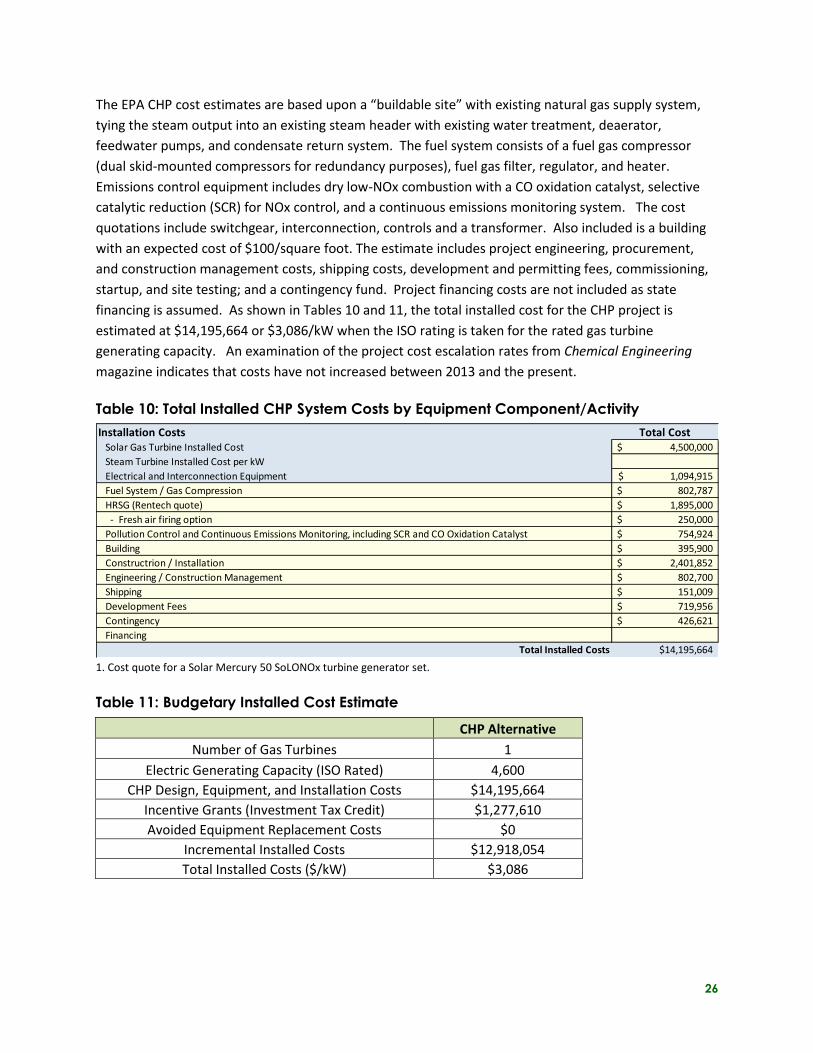
The EPA CHP cost estimates are based upon a “buildable site” with existing natural gas supply system,
tying the steam output into an existing steam header with existing water treatment, deaerator,
feedwater pumps, and condensate return system. The fuel system consists of a fuel gas compressor
(dual skid-mounted compressors for redundancy purposes), fuel gas filter, regulator, and heater.
Emissions control equipment includes dry low-NOx combustion with a CO oxidation catalyst, selective
catalytic reduction (SCR) for NOx control, and a continuous emissions monitoring system. The cost
quotations include switchgear, interconnection, controls and a transformer. Also included is a building
with an expected cost of $100/square foot. The estimate includes project engineering, procurement,
and construction management costs, shipping costs, development and permitting fees, commissioning,
startup, and site testing; and a contingency fund. Project financing costs are not included as state
financing is assumed. As shown in Tables 10 and 11, the total installed cost for the CHP project is
estimated at $14,195,664 or $3,086/kW when the ISO rating is taken for the rated gas turbine
generating capacity. An examination of the project cost escalation rates from Chemical Engineering
magazine indicates that costs have not increased between 2013 and the present.
Table 10: Total Installed CHP System Costs by Equipment Component/Activity
1. Cost quote for a Solar Mercury 50 SoLONOx turbine generator set.
Table 11: Budgetary Installed Cost Estimate
CHP Alternative
Number of Gas Turbines 1
Electric Generating Capacity (ISO Rated) 4,600
CHP Design, Equipment, and Installation Costs $14,195,664
Incentive Grants (Investment Tax Credit) $1,277,610
Avoided Equipment Replacement Costs $0
Incremental Installed Costs $12,918,054
Total Installed Costs ($/kW) $3,086
Installation Costs Total CostSolar Gas Turbine Installed Cost 4,500,000$
Steam Turbine Installed Cost per kW
Electrical and Interconnection Equipment 1,094,915$
Fuel System / Gas Compression 802,787$
HRSG (Rentech quote) 1,895,000$
- Fresh air firing option 250,000$
Pollution Control and Continuous Emissions Monitoring, including SCR and CO Oxidation Catalyst 754,924$
Building 395,900$
Constructrion / Installation 2,401,852$
Engineering / Construction Management 802,700$
Shipping 151,009$
Development Fees 719,956$
Contingency 426,621$
Financing
Total Installed Costs $14,195,664
27
5. Feasibility Analysis
5.1 Technical Analysis Methodology
The Gilmore software tool was used for the initial analysis of the University of Montana CHP project.
The user initiates the tool by entering the average facility electrical and thermal energy consumption
plus electrical energy and fuel use costs by month. This information is extracted from utility billing data.
The software tool then determines the average electrical load (in kW) for each month plus the average
fuel use (in MMBtu/hour). Assuming that all natural gas purchases shown on the meter for the central
plant are used for steam generation, the fuel use is converted into average pounds of steam generation
(pounds/hour) for each month (Note: this assumption will be verified during a future site visit). The tool
then requires that the user enter the boiler efficiency, steam production pressure and the pressure in
the condensate receiver tank. The receiver tank pressure is used with lookup tables to determine the
feedwater temperature and enthalpy (Btu/lb).
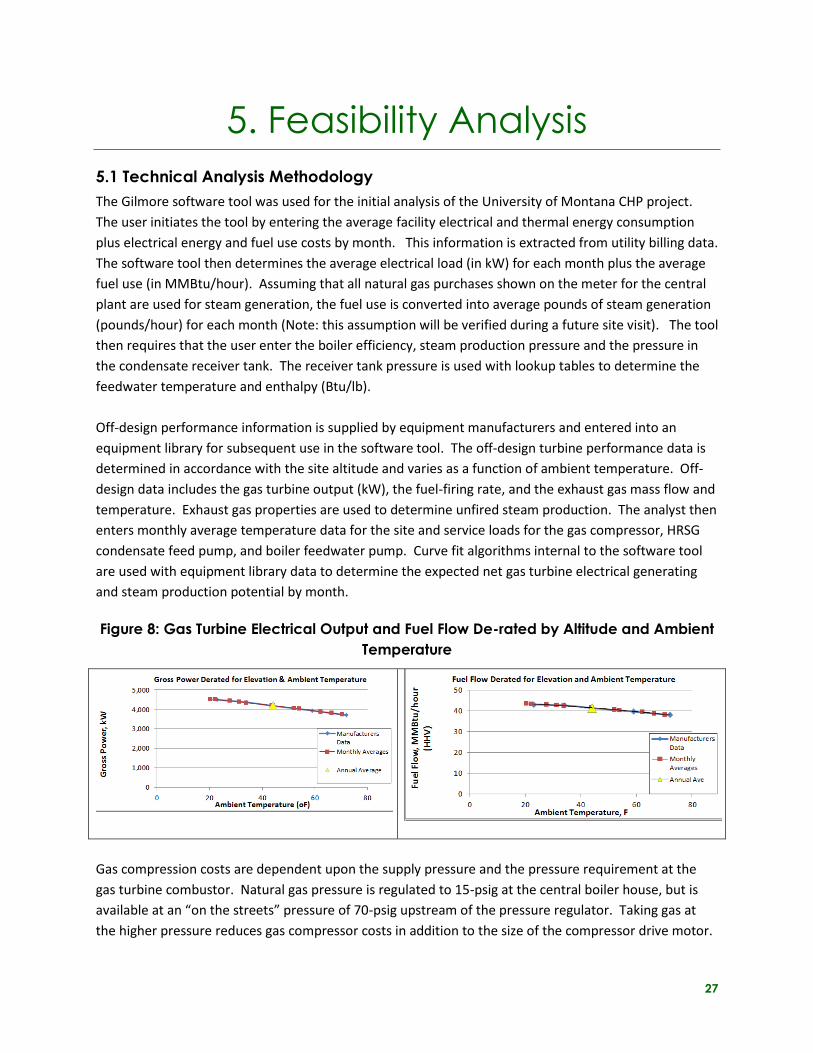
Off-design performance information is supplied by equipment manufacturers and entered into an
equipment library for subsequent use in the software tool. The off-design turbine performance data is
determined in accordance with the site altitude and varies as a function of ambient temperature. Off-
design data includes the gas turbine output (kW), the fuel-firing rate, and the exhaust gas mass flow and
temperature. Exhaust gas properties are used to determine unfired steam production. The analyst then
enters monthly average temperature data for the site and service loads for the gas compressor, HRSG
condensate feed pump, and boiler feedwater pump. Curve fit algorithms internal to the software tool
are used with equipment library data to determine the expected net gas turbine electrical generating
and steam production potential by month.
Figure 8: Gas Turbine Electrical Output and Fuel Flow De-rated by Altitude and Ambient
Temperature
Gas compression costs are dependent upon the supply pressure and the pressure requirement at the
gas turbine combustor. Natural gas pressure is regulated to 15-psig at the central boiler house, but is
available at an “on the streets” pressure of 70-psig upstream of the pressure regulator. Taking gas at
the higher pressure reduces gas compressor costs in addition to the size of the compressor drive motor.
28
The Solar Mercury gas turbine has a peak gas fuel pressure requirement of about 167-psig. Vilter
Manufacturing (a gas compressor supplier) estimates that a 75-hp compressor is required for this
application. Two skid mounted compressors are supplied for equipment redundancy purposes. Each
compressor would have an input power requirement of about 55 kW, although only one would be in
operation at any time. Total auxiliary power and gas compressor load (the service load) is estimated at
114 kW.
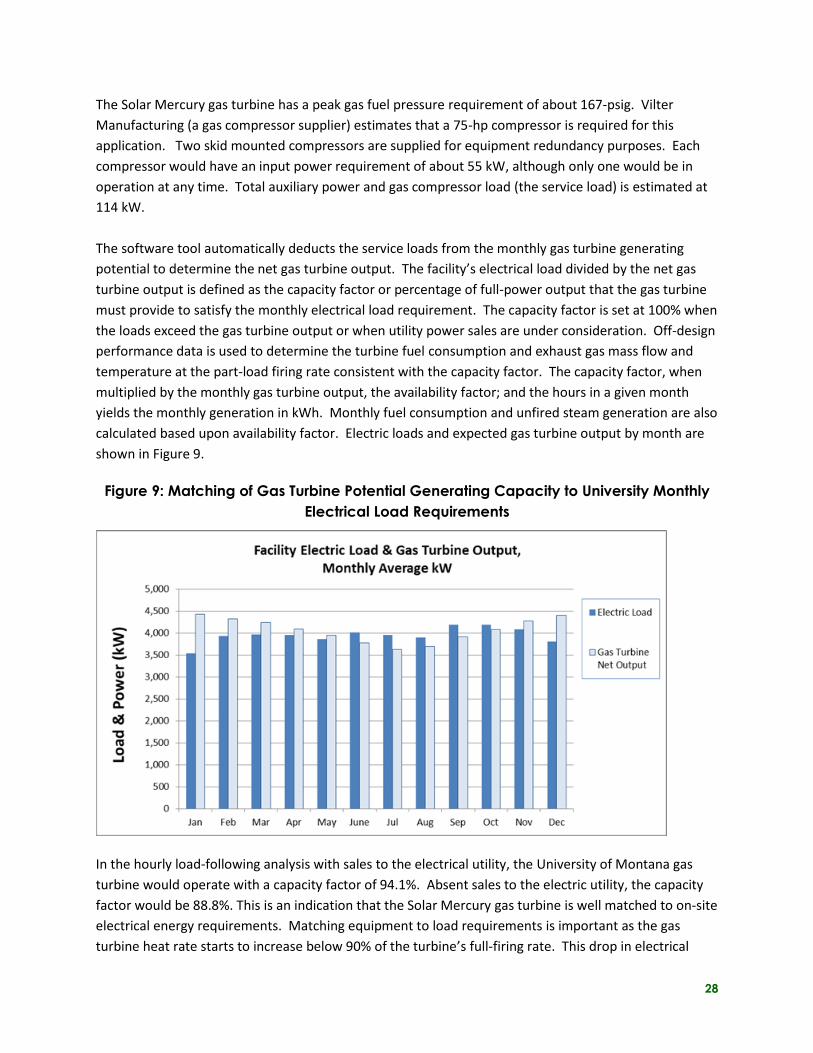
The software tool automatically deducts the service loads from the monthly gas turbine generating
potential to determine the net gas turbine output. The facility’s electrical load divided by the net gas
turbine output is defined as the capacity factor or percentage of full-power output that the gas turbine
must provide to satisfy the monthly electrical load requirement. The capacity factor is set at 100% when
the loads exceed the gas turbine output or when utility power sales are under consideration. Off-design
performance data is used to determine the turbine fuel consumption and exhaust gas mass flow and
temperature at the part-load firing rate consistent with the capacity factor. The capacity factor, when
multiplied by the monthly gas turbine output, the availability factor; and the hours in a given month
yields the monthly generation in kWh. Monthly fuel consumption and unfired steam generation are also
calculated based upon availability factor. Electric loads and expected gas turbine output by month are
shown in Figure 9.
Figure 9: Matching of Gas Turbine Potential Generating Capacity to University Monthly
Electrical Load Requirements
In the hourly load-following analysis with sales to the electrical utility, the University of Montana gas
turbine would operate with a capacity factor of 94.1%. Absent sales to the electric utility, the capacity
factor would be 88.8%. This is an indication that the Solar Mercury gas turbine is well matched to on-site
electrical energy requirements. Matching equipment to load requirements is important as the gas
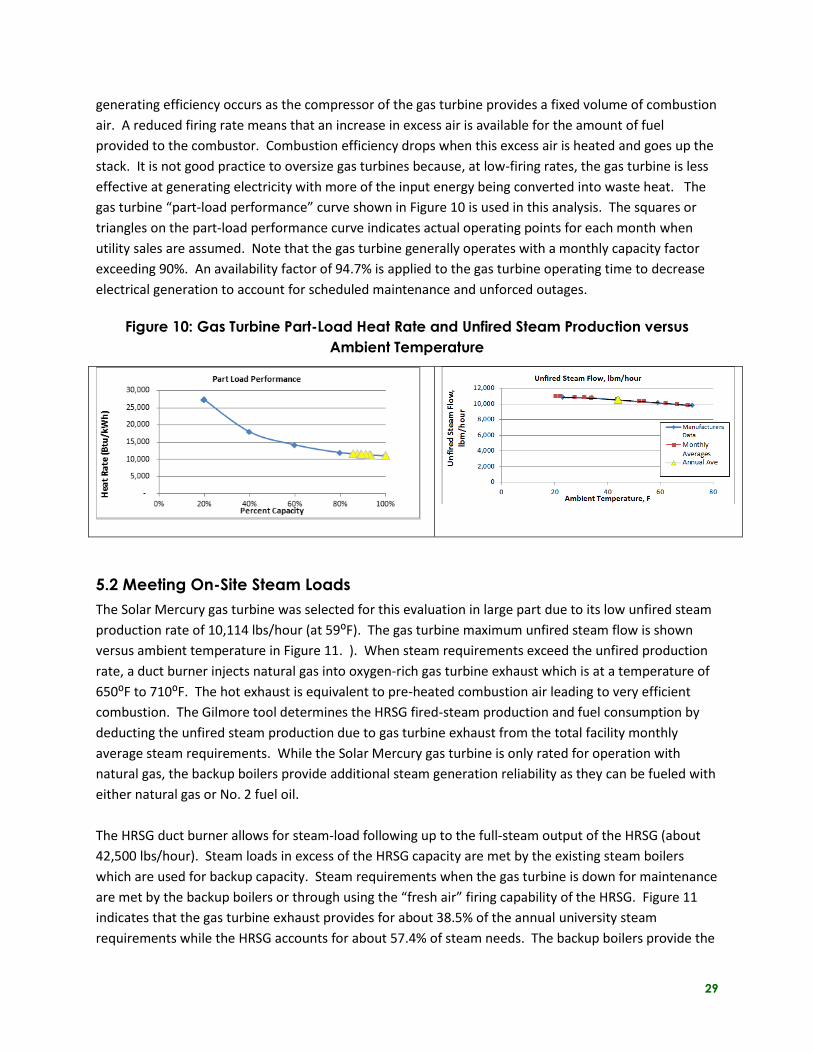
turbine heat rate starts to increase below 90% of the turbine’s full-firing rate. This drop in electrical
29
generating efficiency occurs as the compressor of the gas turbine provides a fixed volume of combustion
air. A reduced firing rate means that an increase in excess air is available for the amount of fuel
provided to the combustor. Combustion efficiency drops when this excess air is heated and goes up the
stack. It is not good practice to oversize gas turbines because, at low-firing rates, the gas turbine is less
effective at generating electricity with more of the input energy being converted into waste heat. The
gas turbine “part-load performance” curve shown in Figure 10 is used in this analysis. The squares or
triangles on the part-load performance curve indicates actual operating points for each month when
utility sales are assumed. Note that the gas turbine generally operates with a monthly capacity factor
exceeding 90%. An availability factor of 94.7% is applied to the gas turbine operating time to decrease
electrical generation to account for scheduled maintenance and unforced outages.
Figure 10: Gas Turbine Part-Load Heat Rate and Unfired Steam Production versus
Ambient Temperature
5.2 Meeting On-Site Steam Loads
The Solar Mercury gas turbine was selected for this evaluation in large part due to its low unfired steam
production rate of 10,114 lbs/hour (at 59⁰F). The gas turbine maximum unfired steam flow is shown
versus ambient temperature in Figure 11. ). When steam requirements exceed the unfired production
rate, a duct burner injects natural gas into oxygen-rich gas turbine exhaust which is at a temperature of
650⁰F to 710⁰F. The hot exhaust is equivalent to pre-heated combustion air leading to very efficient
combustion. The Gilmore tool determines the HRSG fired-steam production and fuel consumption by
deducting the unfired steam production due to gas turbine exhaust from the total facility monthly
average steam requirements. While the Solar Mercury gas turbine is only rated for operation with
natural gas, the backup boilers provide additional steam generation reliability as they can be fueled with
either natural gas or No. 2 fuel oil.
The HRSG duct burner allows for steam-load following up to the full-steam output of the HRSG (about
42,500 lbs/hour). Steam loads in excess of the HRSG capacity are met by the existing steam boilers
which are used for backup capacity. Steam requirements when the gas turbine is down for maintenance
are met by the backup boilers or through using the “fresh air” firing capability of the HRSG. Figure 11
indicates that the gas turbine exhaust provides for about 38.5% of the annual university steam
requirements while the HRSG accounts for about 57.4% of steam needs. The backup boilers provide the
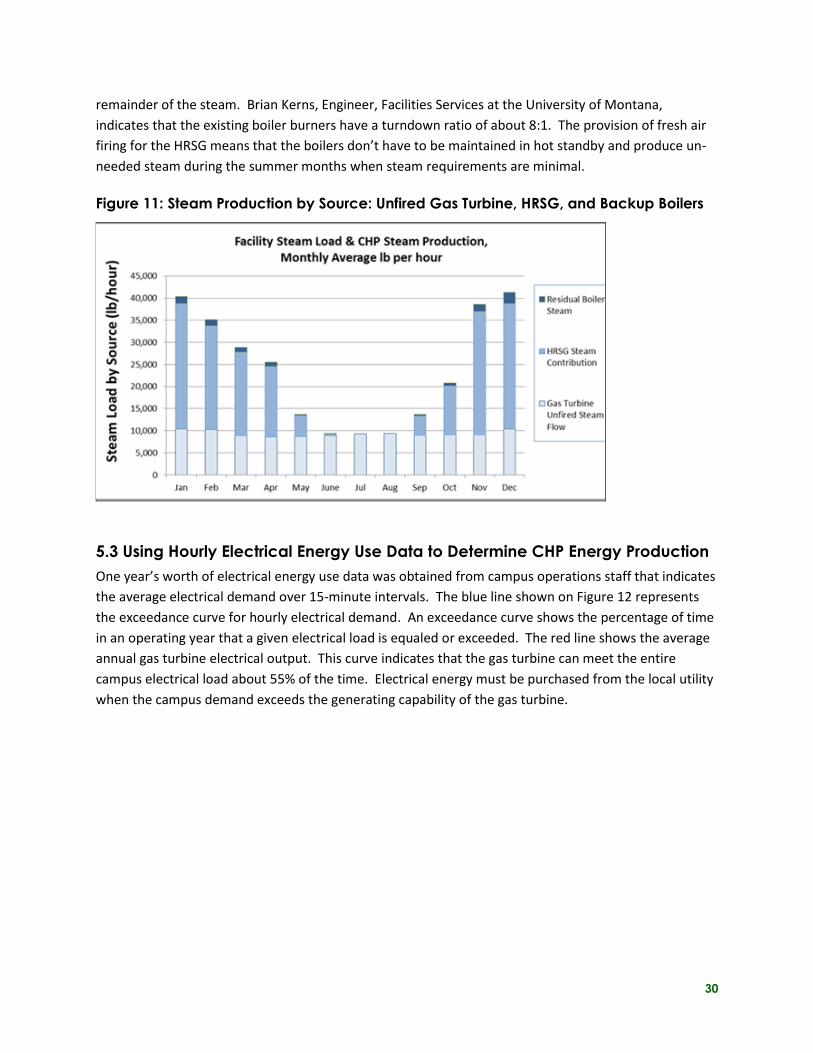
30
remainder of the steam. Brian Kerns, Engineer, Facilities Services at the University of Montana,
indicates that the existing boiler burners have a turndown ratio of about 8:1. The provision of fresh air
firing for the HRSG means that the boilers don’t have to be maintained in hot standby and produce un-
needed steam during the summer months when steam requirements are minimal.
Figure 11: Steam Production by Source: Unfired Gas Turbine, HRSG, and Backup Boilers
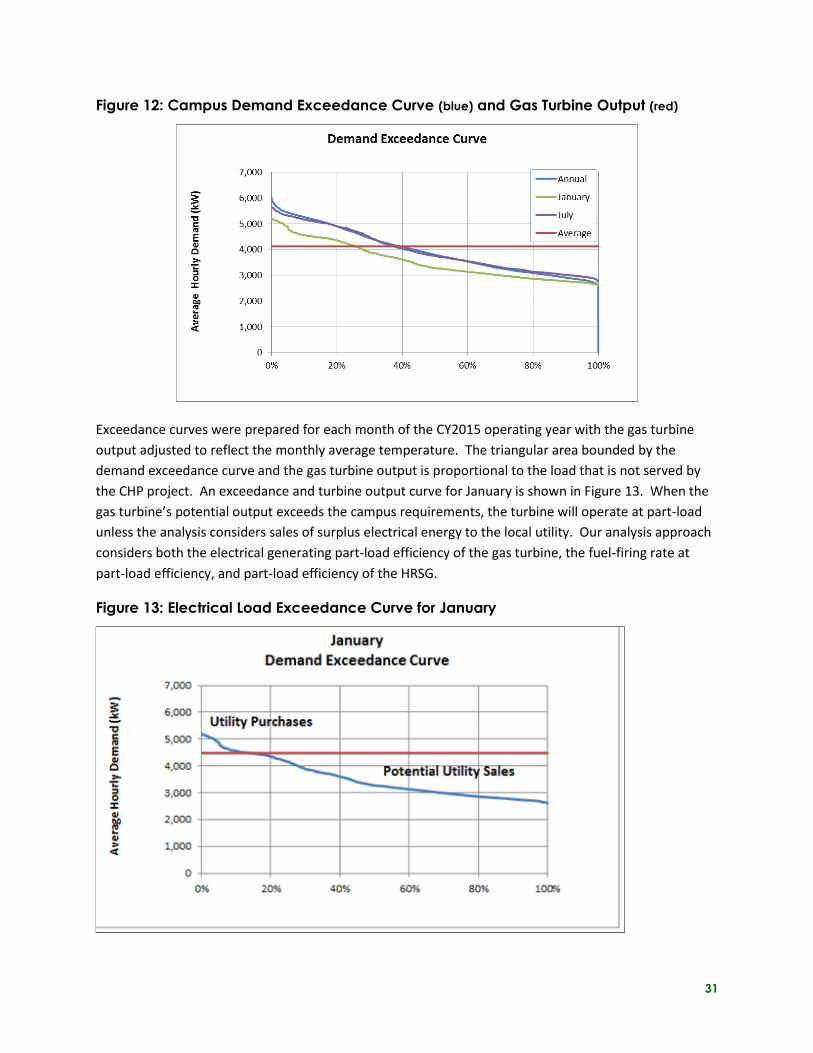
5.3 Using Hourly Electrical Energy Use Data to Determine CHP Energy Production
One year’s worth of electrical energy use data was obtained from campus operations staff that indicates
the average electrical demand over 15-minute intervals. The blue line shown on Figure 12 represents
the exceedance curve for hourly electrical demand. An exceedance curve shows the percentage of time
in an operating year that a given electrical load is equaled or exceeded. The red line shows the average
annual gas turbine electrical output. This curve indicates that the gas turbine can meet the entire
campus electrical load about 55% of the time. Electrical energy must be purchased from the local utility
when the campus demand exceeds the generating capability of the gas turbine.
31
Figure 12: Campus Demand Exceedance Curve (blue) and Gas Turbine Output (red)
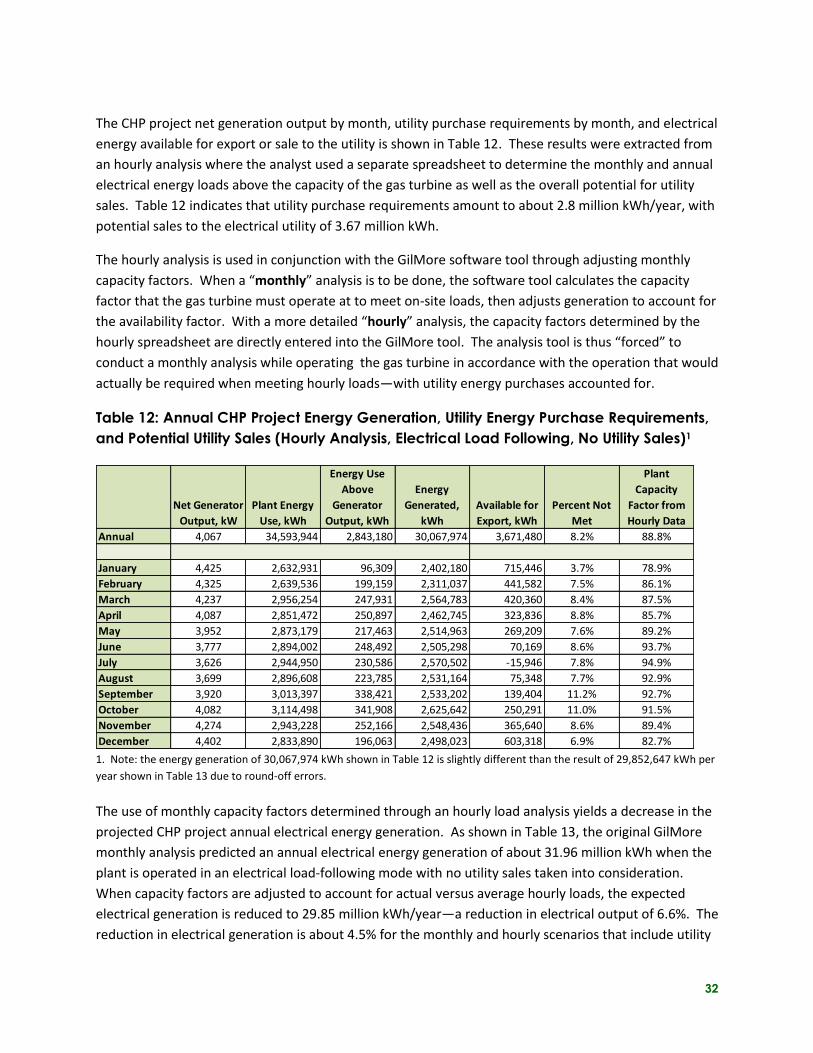
Exceedance curves were prepared for each month of the CY2015 operating year with the gas turbine
output adjusted to reflect the monthly average temperature. The triangular area bounded by the
demand exceedance curve and the gas turbine output is proportional to the load that is not served by
the CHP project. An exceedance and turbine output curve for January is shown in Figure 13. When the
gas turbine’s potential output exceeds the campus requirements, the turbine will operate at part-load
unless the analysis considers sales of surplus electrical energy to the local utility. Our analysis approach
considers both the electrical generating part-load efficiency of the gas turbine, the fuel-firing rate at
part-load efficiency, and part-load efficiency of the HRSG.
Figure 13: Electrical Load Exceedance Curve for January
32
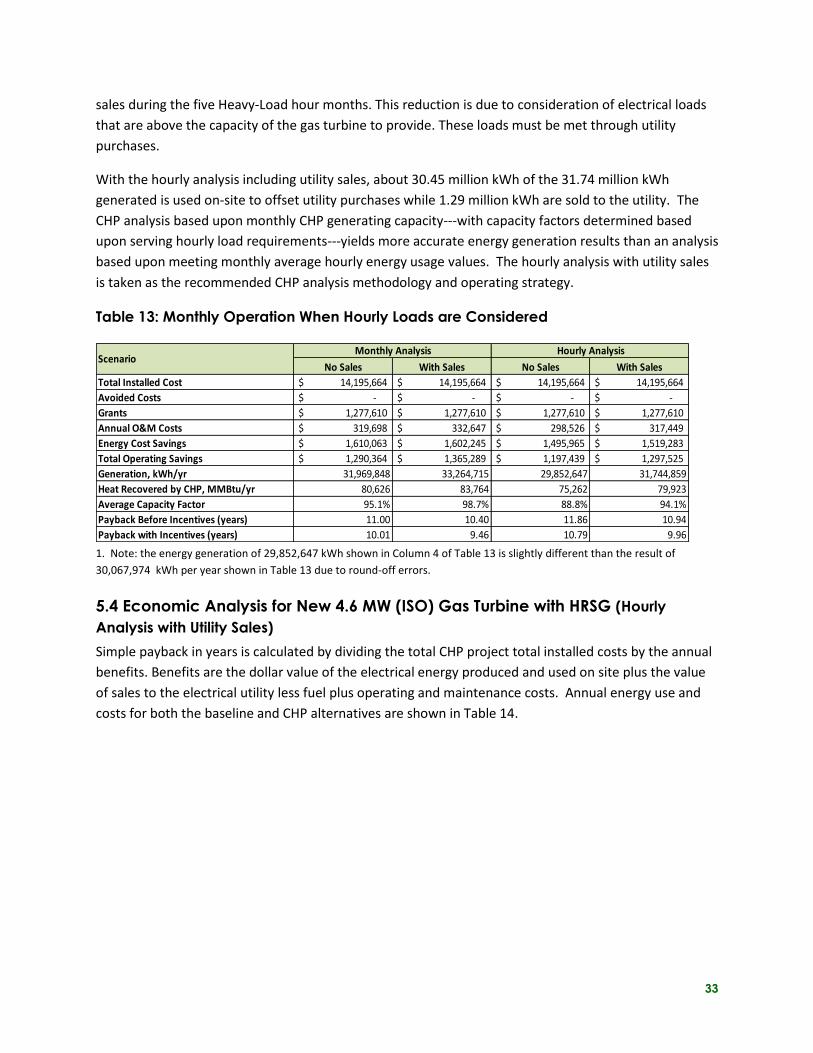
The CHP project net generation output by month, utility purchase requirements by month, and electrical
energy available for export or sale to the utility is shown in Table 12. These results were extracted from
an hourly analysis where the analyst used a separate spreadsheet to determine the monthly and annual
electrical energy loads above the capacity of the gas turbine as well as the overall potential for utility
sales. Table 12 indicates that utility purchase requirements amount to about 2.8 million kWh/year, with
potential sales to the electrical utility of 3.67 million kWh.
The hourly analysis is used in conjunction with the GilMore software tool through adjusting monthly
capacity factors. When a “monthly” analysis is to be done, the software tool calculates the capacity
factor that the gas turbine must operate at to meet on-site loads, then adjusts generation to account for
the availability factor. With a more detailed “hourly” analysis, the capacity factors determined by the
hourly spreadsheet are directly entered into the GilMore tool. The analysis tool is thus “forced” to
conduct a monthly analysis while operating the gas turbine in accordance with the operation that would
actually be required when meeting hourly loads—with utility energy purchases accounted for.
Table 12: Annual CHP Project Energy Generation, Utility Energy Purchase Requirements,
and Potential Utility Sales (Hourly Analysis, Electrical Load Following, No Utility Sales)1
1. Note: the energy generation of 30,067,974 kWh shown in Table 12 is slightly different than the result of 29,852,647 kWh per
year shown in Table 13 due to round-off errors.
The use of monthly capacity factors determined through an hourly load analysis yields a decrease in the
projected CHP project annual electrical energy generation. As shown in Table 13, the original GilMore
monthly analysis predicted an annual electrical energy generation of about 31.96 million kWh when the
plant is operated in an electrical load-following mode with no utility sales taken into consideration.
When capacity factors are adjusted to account for actual versus average hourly loads, the expected
electrical generation is reduced to 29.85 million kWh/year—a reduction in electrical output of 6.6%. The
reduction in electrical generation is about 4.5% for the monthly and hourly scenarios that include utility
Net Generator
Output, kW
Plant Energy
Use, kWh
Energy Use
Above
Generator
Output, kWh
Energy
Generated,
kWh
Available for
Export, kWh
Percent Not
Met
Plant
Capacity
Factor from
Hourly Data
Annual 4,067 34,593,944 2,843,180 30,067,974 3,671,480 8.2% 88.8%
January 4,425 2,632,931 96,309 2,402,180 715,446 3.7% 78.9%
February 4,325 2,639,536 199,159 2,311,037 441,582 7.5% 86.1%
March 4,237 2,956,254 247,931 2,564,783 420,360 8.4% 87.5%
April 4,087 2,851,472 250,897 2,462,745 323,836 8.8% 85.7%
May 3,952 2,873,179 217,463 2,514,963 269,209 7.6% 89.2%
June 3,777 2,894,002 248,492 2,505,298 70,169 8.6% 93.7%
July 3,626 2,944,950 230,586 2,570,502 -15,946 7.8% 94.9%
August 3,699 2,896,608 223,785 2,531,164 75,348 7.7% 92.9%
September 3,920 3,013,397 338,421 2,533,202 139,404 11.2% 92.7%
October 4,082 3,114,498 341,908 2,625,642 250,291 11.0% 91.5%
November 4,274 2,943,228 252,166 2,548,436 365,640 8.6% 89.4%
December 4,402 2,833,890 196,063 2,498,023 603,318 6.9% 82.7%
33
sales during the five Heavy-Load hour months. This reduction is due to consideration of electrical loads
that are above the capacity of the gas turbine to provide. These loads must be met through utility
purchases.
With the hourly analysis including utility sales, about 30.45 million kWh of the 31.74 million kWh
generated is used on-site to offset utility purchases while 1.29 million kWh are sold to the utility. The
CHP analysis based upon monthly CHP generating capacity---with capacity factors determined based
upon serving hourly load requirements---yields more accurate energy generation results than an analysis
based upon meeting monthly average hourly energy usage values. The hourly analysis with utility sales
is taken as the recommended CHP analysis methodology and operating strategy.
Table 13: Monthly Operation When Hourly Loads are Considered
1. Note: the energy generation of 29,852,647 kWh shown in Column 4 of Table 13 is slightly different than the result of
30,067,974 kWh per year shown in Table 13 due to round-off errors.
5.4 Economic Analysis for New 4.6 MW (ISO) Gas Turbine with HRSG (Hourly
Analysis with Utility Sales)
Simple payback in years is calculated by dividing the total CHP project total installed costs by the annual
benefits. Benefits are the dollar value of the electrical energy produced and used on site plus the value
of sales to the electrical utility less fuel plus operating and maintenance costs. Annual energy use and
costs for both the baseline and CHP alternatives are shown in Table 14.
No Sales With Sales No Sales With Sales
Total Installed Cost 14,195,664$ 14,195,664$ 14,195,664$ 14,195,664$
Avoided Costs -$ -$ -$ -$
Grants 1,277,610$ 1,277,610$ 1,277,610$ 1,277,610$
Annual O&M Costs 319,698$ 332,647$ 298,526$ 317,449$
Energy Cost Savings 1,610,063$ 1,602,245$ 1,495,965$ 1,519,283$
Total Operating Savings 1,290,364$ 1,365,289$ 1,197,439$ 1,297,525$
Generation, kWh/yr 31,969,848 33,264,715 29,852,647 31,744,859
Heat Recovered by CHP, MMBtu/yr 80,626 83,764 75,262 79,923
Average Capacity Factor 95.1% 98.7% 88.8% 94.1%
Payback Before Incentives (years) 11.00 10.40 11.86 10.94
Payback with Incentives (years) 10.01 9.46 10.79 9.96
Monthly Analysis Hourly Analysis Scenario
34
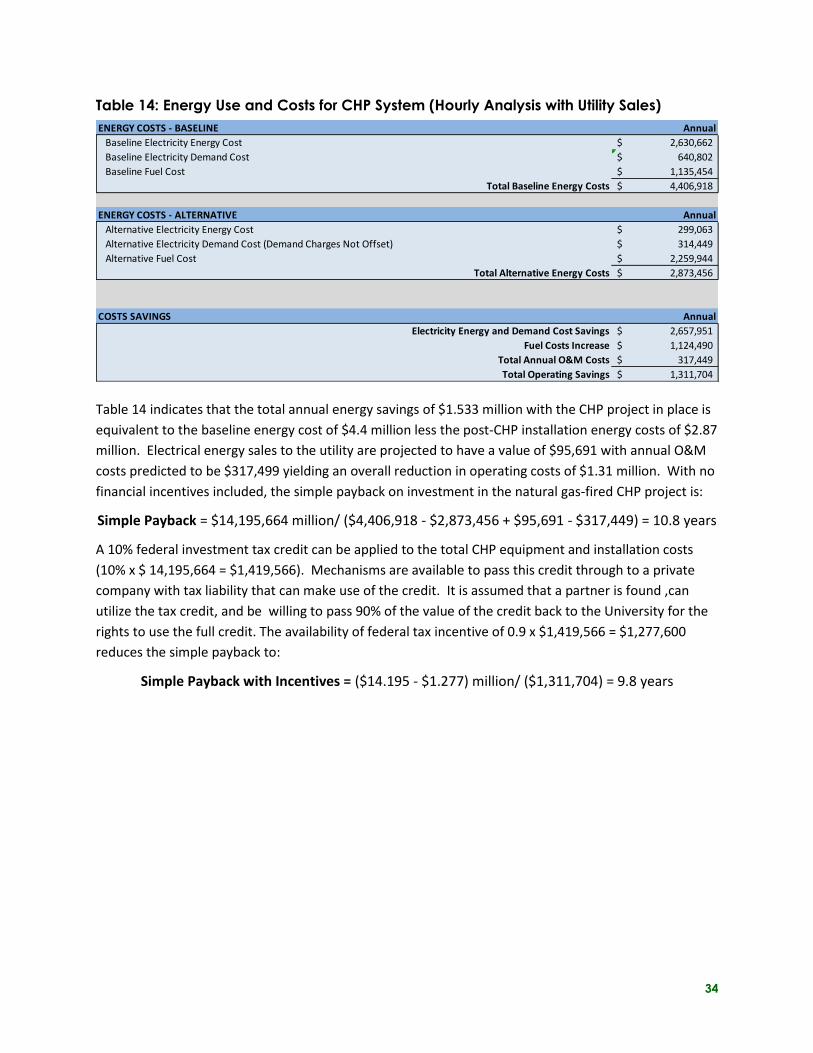
Table 14: Energy Use and Costs for CHP System (Hourly Analysis with Utility Sales)
Table 14 indicates that the total annual energy savings of $1.533 million with the CHP project in place is
equivalent to the baseline energy cost of $4.4 million less the post-CHP installation energy costs of $2.87
million. Electrical energy sales to the utility are projected to have a value of $95,691 with annual O&M
costs predicted to be $317,499 yielding an overall reduction in operating costs of $1.31 million. With no
financial incentives included, the simple payback on investment in the natural gas-fired CHP project is:
Simple Payback = $14,195,664 million/ ($4,406,918 - $2,873,456 + $95,691 - $317,449) = 10.8 years
A 10% federal investment tax credit can be applied to the total CHP equipment and installation costs
(10% x $ 14,195,664 = $1,419,566). Mechanisms are available to pass this credit through to a private
company with tax liability that can make use of the credit. It is assumed that a partner is found ,can
utilize the tax credit, and be willing to pass 90% of the value of the credit back to the University for the
rights to use the full credit. The availability of federal tax incentive of 0.9 x $1,419,566 = $1,277,600
reduces the simple payback to:
Simple Payback with Incentives = ($14.195 - $1.277) million/ ($1,311,704) = 9.8 years
ENERGY COSTS - BASELINE Annual
Baseline Electricity Energy Cost 2,630,662$
Baseline Electricity Demand Cost 640,802$
Baseline Fuel Cost 1,135,454$
Total Baseline Energy Costs 4,406,918$
ENERGY COSTS - ALTERNATIVE Annual
Alternative Electricity Energy Cost 299,063$
Alternative Electricity Demand Cost (Demand Charges Not Offset) 314,449$
Alternative Fuel Cost 2,259,944$
Total Alternative Energy Costs 2,873,456$
COSTS SAVINGS Annual
Electricity Energy and Demand Cost Savings 2,657,951$
Fuel Costs Increase 1,124,490$
Total Annual O&M Costs 317,449$
Total Operating Savings 1,311,704$
35
6. Life Cycle Cost Analysis
6.1 Inputs and Results
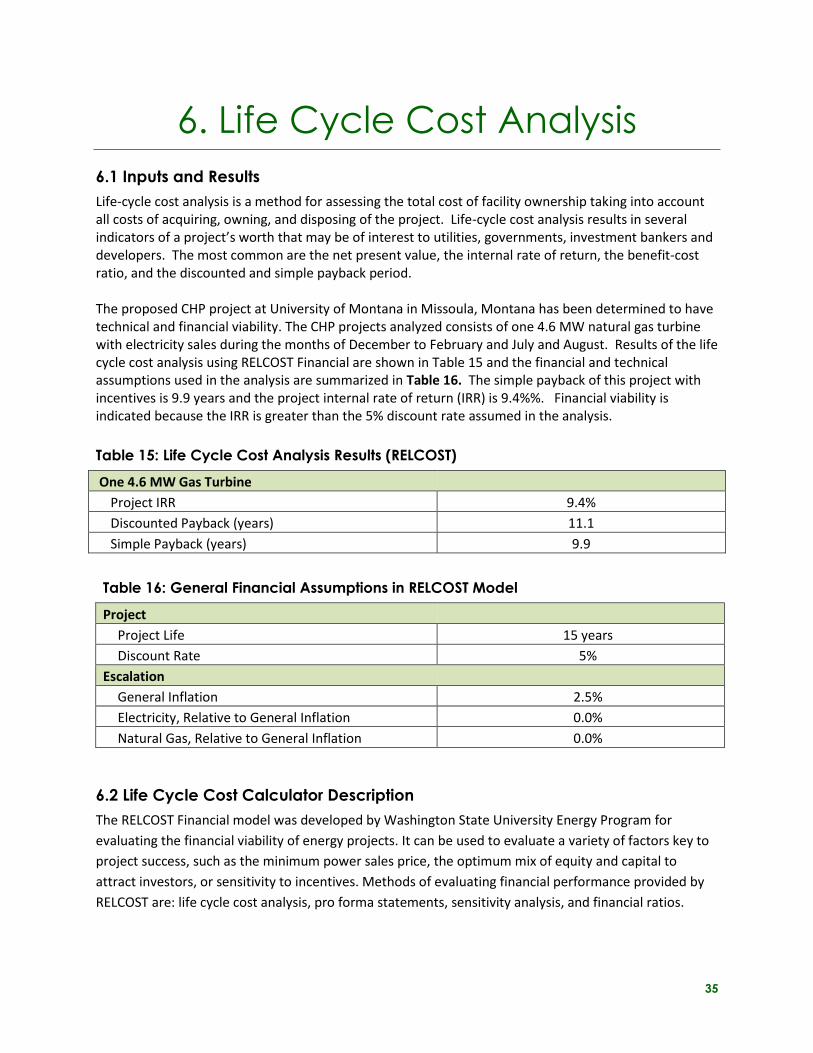
Life-cycle cost analysis is a method for assessing the total cost of facility ownership taking into account all costs of acquiring, owning, and disposing of the project. Life-cycle cost analysis results in several indicators of a project’s worth that may be of interest to utilities, governments, investment bankers and developers. The most common are the net present value, the internal rate of return, the benefit-cost ratio, and the discounted and simple payback period. The proposed CHP project at University of Montana in Missoula, Montana has been determined to have technical and financial viability. The CHP projects analyzed consists of one 4.6 MW natural gas turbine with electricity sales during the months of December to February and July and August. Results of the life cycle cost analysis using RELCOST Financial are shown in Table 15 and the financial and technical assumptions used in the analysis are summarized in Table 16. The simple payback of this project with incentives is 9.9 years and the project internal rate of return (IRR) is 9.4%%. Financial viability is indicated because the IRR is greater than the 5% discount rate assumed in the analysis.
Table 15: Life Cycle Cost Analysis Results (RELCOST)
One 4.6 MW Gas Turbine
Project IRR 9.4%
Discounted Payback (years) 11.1
Simple Payback (years) 9.9
Table 16: General Financial Assumptions in RELCOST Model
Project
Project Life 15 years
Discount Rate 5%
Escalation General Inflation 2.5%
Electricity, Relative to General Inflation 0.0%
Natural Gas, Relative to General Inflation 0.0%
6.2 Life Cycle Cost Calculator Description
The RELCOST Financial model was developed by Washington State University Energy Program for
evaluating the financial viability of energy projects. It can be used to evaluate a variety of factors key to
project success, such as the minimum power sales price, the optimum mix of equity and capital to
attract investors, or sensitivity to incentives. Methods of evaluating financial performance provided by
RELCOST are: life cycle cost analysis, pro forma statements, sensitivity analysis, and financial ratios.
36
Pro forma financial statements provided are the Income Statement, Cash Flow Statement, Balance Sheet, and Sources/Uses of Funds Statement for each project year in the 30-year analysis period. Flexible user inputs include capital costs for construction, funding (equity, grants, and loans), operating costs (purchased fuels, labor, materials/expendables, etc.), taxes and fees (depreciation, tax credits, franchise costs, tax rates, etc.), cost escalation factors, income from energy, power and co-product sales, and income from sales of carbon offsets, renewable energy credits and renewable energy production incentives. RELCOST includes a spider diagram utility, which allows visually assessing project sensitivity to variations in key inputs, such as changes in fuel prices or cost overruns. The ability to rapidly conduct "What If" evaluations enables the user to determine those factors that represent the greatest amount of risk to the project, obtain guidance on key points of negotiation, identify break-even values, and examine alternative scenarios. Up to nine scenarios may be defined for each project. The ability to easily switch between scenarios facilitates selecting alternatives, such as system design options or funding choices.
6.3 Sensitivity Analysis
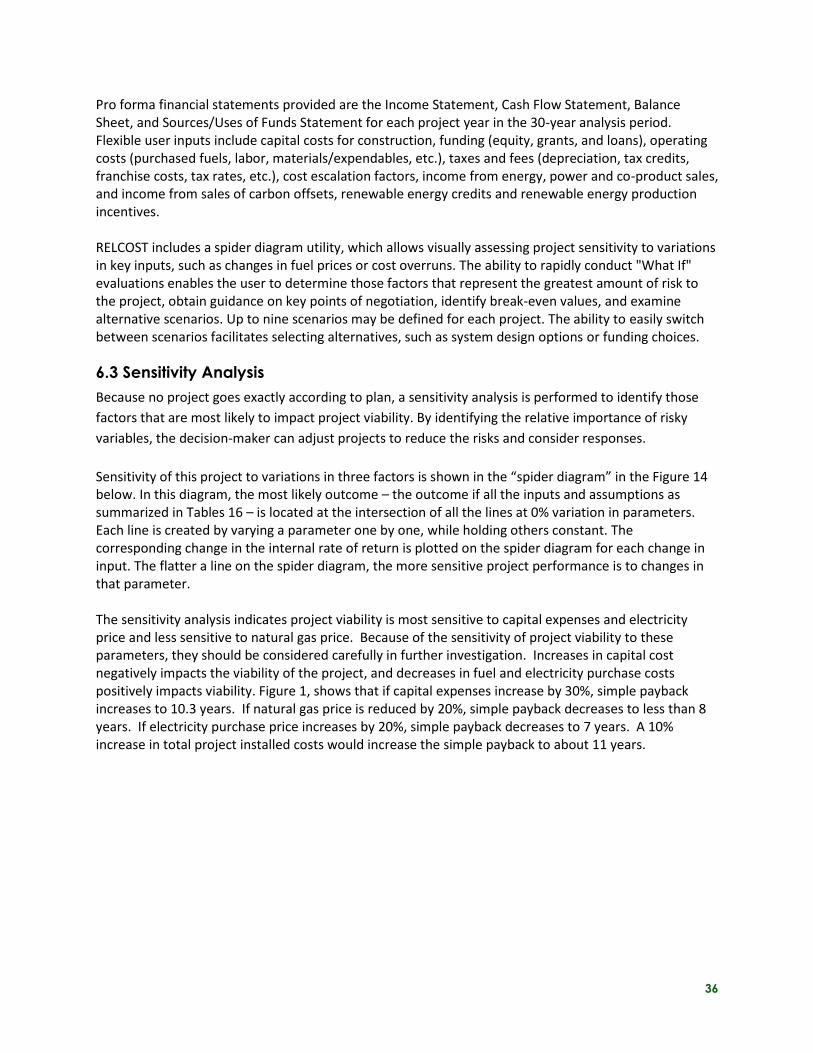
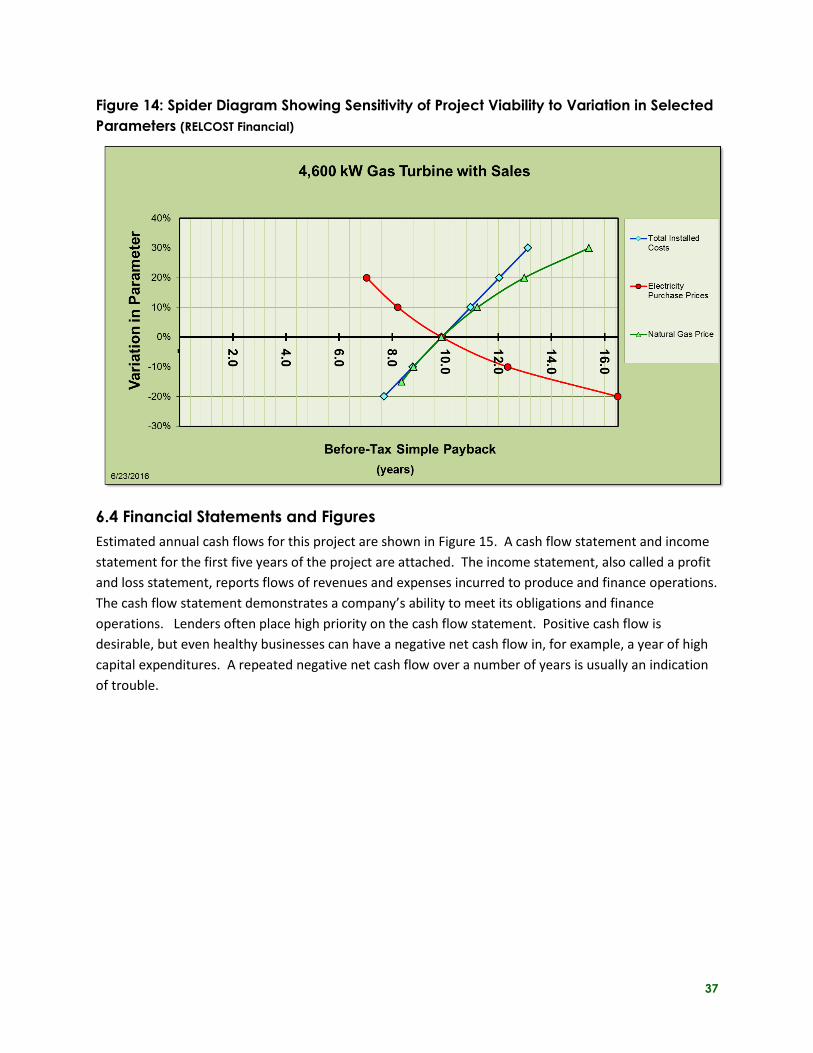
Because no project goes exactly according to plan, a sensitivity analysis is performed to identify those
factors that are most likely to impact project viability. By identifying the relative importance of risky
variables, the decision-maker can adjust projects to reduce the risks and consider responses. Sensitivity of this project to variations in three factors is shown in the “spider diagram” in the Figure 14 below. In this diagram, the most likely outcome – the outcome if all the inputs and assumptions as summarized in Tables 16 – is located at the intersection of all the lines at 0% variation in parameters. Each line is created by varying a parameter one by one, while holding others constant. The corresponding change in the internal rate of return is plotted on the spider diagram for each change in input. The flatter a line on the spider diagram, the more sensitive project performance is to changes in that parameter. The sensitivity analysis indicates project viability is most sensitive to capital expenses and electricity price and less sensitive to natural gas price. Because of the sensitivity of project viability to these parameters, they should be considered carefully in further investigation. Increases in capital cost negatively impacts the viability of the project, and decreases in fuel and electricity purchase costs positively impacts viability. Figure 1, shows that if capital expenses increase by 30%, simple payback increases to 10.3 years. If natural gas price is reduced by 20%, simple payback decreases to less than 8 years. If electricity purchase price increases by 20%, simple payback decreases to 7 years. A 10% increase in total project installed costs would increase the simple payback to about 11 years.
37
Figure 14: Spider Diagram Showing Sensitivity of Project Viability to Variation in Selected
Parameters (RELCOST Financial)
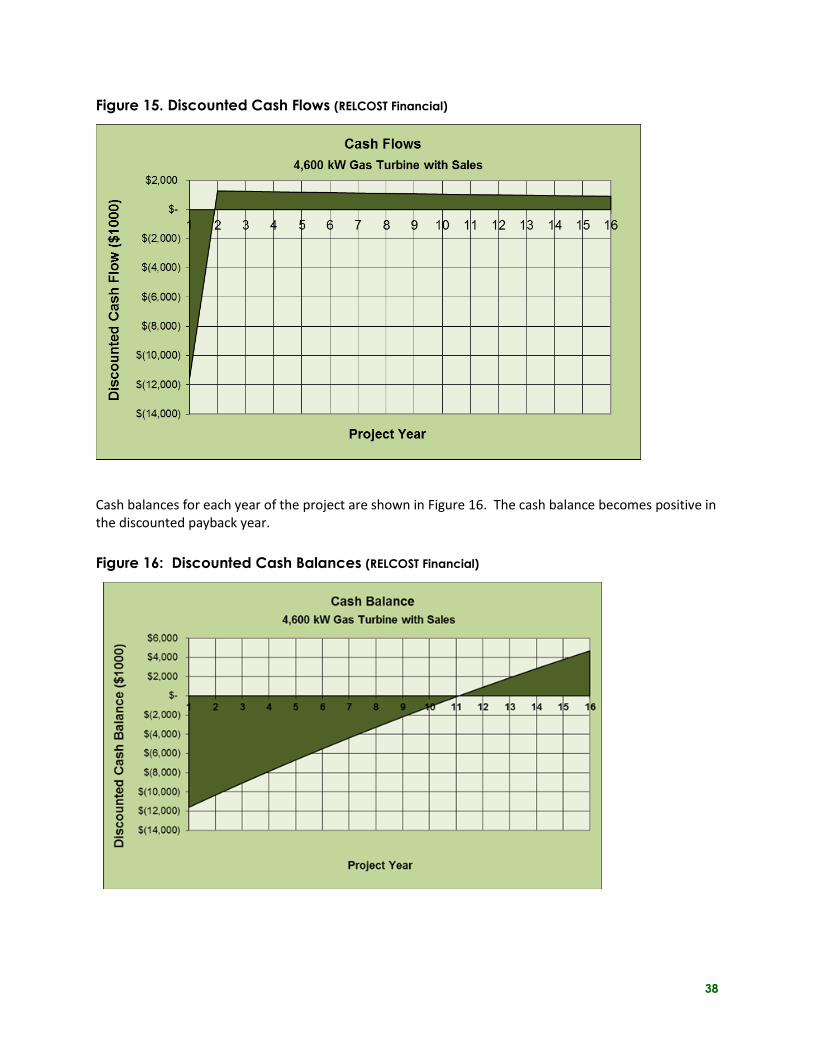
6.4 Financial Statements and Figures
Estimated annual cash flows for this project are shown in Figure 15. A cash flow statement and income
statement for the first five years of the project are attached. The income statement, also called a profit
and loss statement, reports flows of revenues and expenses incurred to produce and finance operations.
The cash flow statement demonstrates a company’s ability to meet its obligations and finance
operations. Lenders often place high priority on the cash flow statement. Positive cash flow is
desirable, but even healthy businesses can have a negative net cash flow in, for example, a year of high
capital expenditures. A repeated negative net cash flow over a number of years is usually an indication
of trouble.
38
Figure 15. Discounted Cash Flows (RELCOST Financial)
Cash balances for each year of the project are shown in Figure 16. The cash balance becomes positive in the discounted payback year.
Figure 16: Discounted Cash Balances (RELCOST Financial)

39
7. Emissions Analysis
7.1 Air Emissions Analysis
An analysis of air emissions reductions was performed for a proposed CHP project at the University of
Montana in Missoula, Montana, using the EPA’s CHP Emissions Calculator
https://www.epa.gov/chp/chp-emissions-calculator with inputs based on Washington State University
Energy Program’s feasibility study for this project. Air emissions considered include greenhouse gas
emissions, which contribute to climate change, and gases referred to as criteria pollutants, as regulated
under the Clean Air Act. The emissions of a CHP system with one 4.6 MW natural gas turbine to meet the site’s electricity and thermal needs were analyzed. The scenario analyzed includes electricity sales in the utility’s high demand months of December to January, and July and August. Results are shown in Table 17 with both baseline (conventional system) and CHP project emissions shown in Figure 17. Assumptions used in the emissions analysis are summarized in Tables 18, 19, and 20. The EPA analysis includes the direct emissions associated with fuel combustion at the site and at the utility power plant. It also includes emissions associated with electricity transmission and distribution (T&D) losses to the site. It does not include pre-combustion emissions associated with extraction, processing, and delivery of fuel either to the site or to the electric utility.
7.2 Greenhouse Gas Emissions
Greenhouse gas emissions contribute to climate change by trapping heat in the atmosphere. The four
most important greenhouse gases are carbon dioxide (CO2), methane (CH4), nitrous oxide (N2O), and
fluorinated gases. The first three of these are considered in this analysis. The total global warming
potential of these three gases is quantified in terms of “carbon dioxide equivalent” (CO2e). The carbon
dioxide equivalent of a gas equals the quantity of carbon dioxide that would have the same global
warming potential as the other gas. For example, the global warming potential of methane is 25
pounds CO2e per pound of methane. The greenhouse gas emissions reduction of the CHP system is 19,691 metric tonnes, which is a 43% reduction in the baseline emissions. This is equivalent to removing 3,746 passenger cars from the road, as shown in Table 17.
7.3 Criteria Pollutants
The Clean Air Act requires the U.S. Environmental Protection Agency to set standards for six common
air pollutants, referred to as “criteria pollutants”. They are particle pollution, ground-level ozone,
carbon monoxide, sulfur oxides (SOx), nitrogen oxides (NOx), and lead. This analysis quantifies NOx
and SOx, which are generally of greatest concern in CHP projects. Emissions of NOx are predicted to
decrease by 39.2 tonnes/year ( 86%). SOx emissions are virtually eliminated (reduced by nearly 100%),
equivalent to by 32.9 metric tonnes annually due to the proposed CHP project, as shown in Table 17.
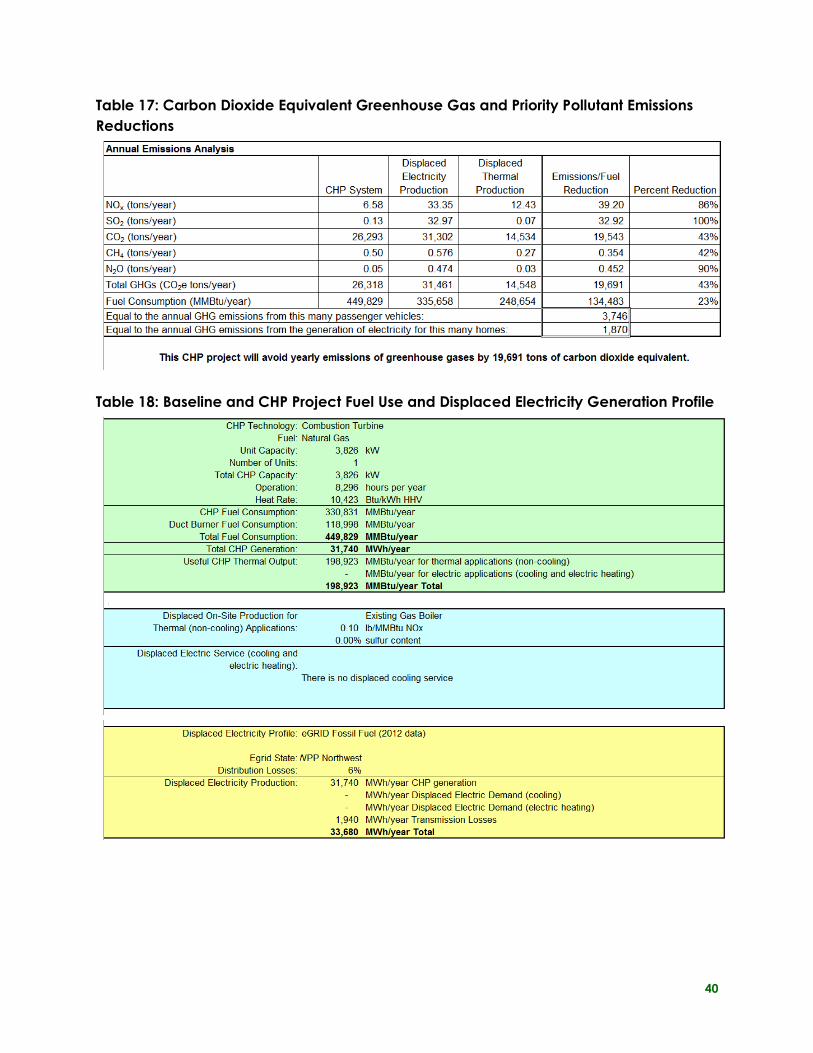
40
Table 17: Carbon Dioxide Equivalent Greenhouse Gas and Priority Pollutant Emissions
Reductions
Table 18: Baseline and CHP Project Fuel Use and Displaced Electricity Generation Profile
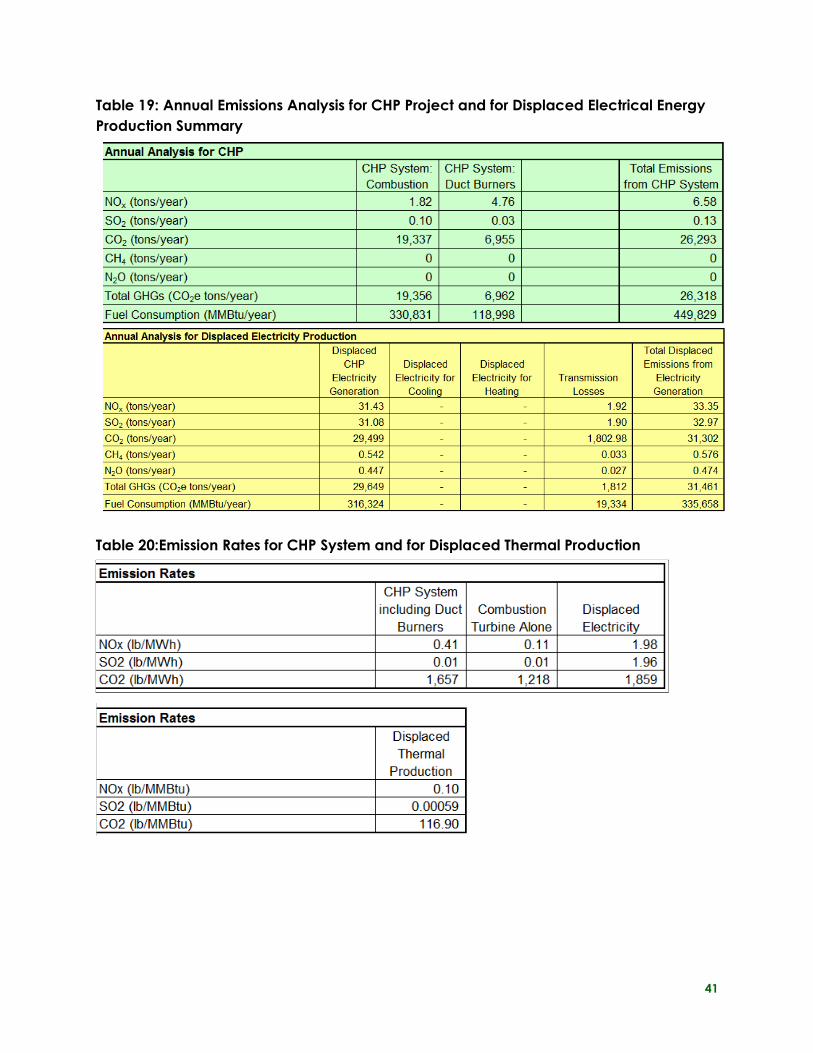
41
Table 19: Annual Emissions Analysis for CHP Project and for Displaced Electrical Energy
Production Summary
Table 20:Emission Rates for CHP System and for Displaced Thermal Production
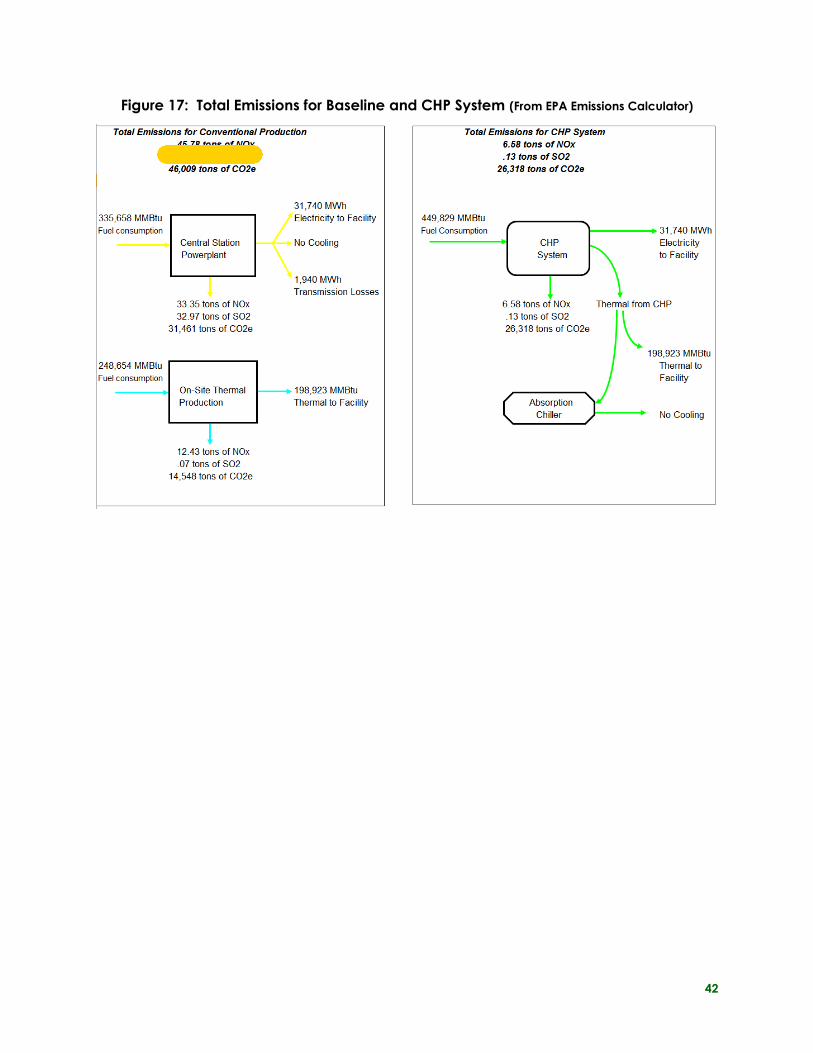
42
Figure 17: Total Emissions for Baseline and CHP System (From EPA Emissions Calculator)
43
8. Summary and Conclusions
The feasibility analysis results suggest that a gas turbine CHP project is cost effective for the University
of Montana. When operating in an electrical load-following mode with limited utility sales, the
recommended gas turbine would produce about 31.74 million kWh of electrical energy annually.
Natural gas consumption at the central plant would increase from about 239,300 MMBtu/year to
475,778 MMBtu per year. An annual operating savings of $1.297 million would provide a simple
payback of 10.9 years on the $14.19 million dollar project. The simple payback is reduced to 9.9 years
when existing financial incentives are taken into consideration. The internal rate-of-return on
investment (ROI) for the proposed project is 9.4%.
The CHP project also reduces greenhouse gas emissions from utility purchases and direct combustion by
43%---from 45,936 metric tonnes per year to 26,293 metric tonnes annually. Regional NOx and SOx
emissions are reduced by 39.2 tonnes per year (86%) and 32.9 tonnes annually (an almost 100%
reduction).
A site visit indicated that ample space exists around the central heating plant to install a CHP project. In
particular, the natural gas pressure regulator, electrical transformer, existing stack, and high pressure
steam pipelines are in close proximity at one corner of the heating plant. A consultant has already been
hired to identify both electrical interconnection requirements and costs as well as make
recommendations regarding interconnection of the HRSG steam production with the existing high
pressure steam piping.
As a next step, it is recommended that the site contract with an engineering firm to move the project
forward. Negotiations with the local electric utility and pre-design studies should be pursued to verify
the technical and economic viability of CHP at the University. Further investigation of CHP viability could
include conducting an investment grade feasibility study, which would further explore the University’s
energy usage and needs, including overall facility planning and/or goals. Detailed actions (some of which
are ongoing) and site information needed for such a study includes:
o Initiation of discussions with NorthWestern Energy to discuss interconnection requirements and
resolve load balancing issues,
o Determining whether “islanding” or providing the ability to operate the CHP project during
utility outages should be incorporated into the project design,
o Investigation of utility policies used to impose electrical demand charges and verification of
demand offset benefits,
o Negotiating power purchase agreement provisions for utility sales during Heavy Load hour
months and/or all months when excess generation is available,
o Continuing to monitor firm and interruptible natural gas pricing and availability,
o Holding discussions with air quality regulatory agencies to resolve pollution control system
requirements,

44
o Identifying a pollution control system that can meet air quality requirements during normal
operation and when gas turbine exhaust bypasses the HRSG during low steam demand summer
months,
o Conducting a steam system assessment to verify boiler combustion and overall efficiency,
condensate return (%) and return temperature; boiler blowdown rate, makeup water flows, and
deaerator steam requirements. The steam system assessment should also result in a list of cost-
effective steam system energy efficiency improvement measures. Implementation of these
measures may require re-evaluating necessary HRSG steam production capability,
o Determining whether cost benefits should be assigned to the CHP project due to offsetting the
need to replace one of the older steam boilers in the near future,
o Investigating potential University energy efficiency actions that could result in reductions in
annual electrical energy usage (such as widespread change outs to LED lighting technologies in
interior and exterior applications),
o Determination of the desirability of being able to operate a gas turbine on No. 2 oil as well as
natural gas,
o Investigation of potential monetary or generating resource diversification benefits due to CO2
and other priority pollutant emission reductions,
o Initiating discussions with the legislature regarding CHP project funding,
Special consideration may also be given to power reliability concerns, fine-tuning of generating
equipment and HRSG selection and estimated total installed costs, and consideration of additional
equipment redundancy factors that may impact CHP system equipment selection or sizing.