missouri childhood lead poisoning prevention...
TRANSCRIPT

Missouri
Childhood Lead
Poisoning Prevention
Program
Annual Report for Fiscal Year 2015 July 1, 2014 – June 30, 2015
Missouri Department of Health and Senior Services http://health.mo.gov/living/environment/lead/index.php
573-751-6102 or 866-628-9891

Missouri Childhood Lead
Poisoning Prevention Program (CLPPP)
Annual Report for Fiscal Year 2015
July 1, 2014 – June 30, 2015
Table of Contents
About Our Program 1
Lead Poisoning in Missouri 2
Statewide Screening Plan 3
Reporting of Blood Lead Testing 4
Housing Risks 5
Testing and Prevalence 6-10
Lead Poisoning Prevention Education 11
Collaborations 11-16
This report meets the statutory mandate for an annual report per 701.343, RSMo.
1
About Our Program
PROGRAM MISSION
The Missouri Department of Health and Senior Services (DHSS) Childhood Lead Poisoning
Prevention Program’s (CLPPP) mission is to assure the children of Missouri a safe and healthy
environment through primary prevention and the identification of lead exposures that may cause
illness or death.
The DHSS’ CLPPP was established in 1993 and continues to assure that health care providers
have current information and tools available to screen patients less than six years of age for lead
and provide primary prevention education.
The CLPPP is staffed by the following positions: a Program Manager, a Surveillance
Coordinator, two Data Entry Personnel, 6.5 Environmental Specialists, and a Case Management
Nurse. State guidelines describe appropriate follow-up of children with elevated blood lead
levels (EBL) of at least 10 micrograms per deciliter (10 µg/dL). The level of concern
recommended by the Centers for Disease Control and Prevention (CDC) previously was > 10
µg/dL. As of January 2012, CDC replaced the term “level of concern” with the term “reference
value”, which is based on the 97.5th
percentile of the blood lead level distribution among children
one to five years old in the United States. The current reference level is set at > 5 µg/dL.
CLPPP has been working to identify ways to implement CDC’s new recommendation. DHSS
staff currently notifies all Local Public Health Agencies (LPHAs) and health plans when a blood
lead level is received regardless of the level. This ensures LPHAs and health plans are aware of
all the children’s blood lead level results and can discuss what actions will follow if any.
Follow-up activities and case management are generally provided for children six years and
younger with an EBL > 10 µg/dL. These activities help the family understand the causes and
health effects of childhood lead poisoning. Environmental risk assessments are also performed
to identify potential sources of lead exposure for children with an EBL > 15 µg/dL. These risk
assessments provide the family with information about where lead hazards exist in and around
their home. A work plan is developed to reduce these hazards and the risks associated with
them. By reducing or eliminating exposures to the environmental sources of lead, the child’s
blood lead level should decrease and repeated elevations should be prevented. CLPPP is
exploring the feasibility of doing these risk assessments for children with an EBL > 10 µg/dL.
Lead poisoning prevention educational materials are developed and provided to Missouri citizens
at various community venues. DHSS works with LPHAs, the medical community, other state
agencies, businesses, schools, and community organizations to prevent childhood lead
poisoning. The Missouri CLPPP created a mascot to promote lead poisoning prevention
messages. The costume may be loaned to any organization in Missouri wanting to increase lead
poisoning prevention education and blood lead testing.
The program currently uses the Missouri Health Strategic Architectures and Information
Cooperative (MOHSAIC) database to collect lead-specific data from medical and lead program
activities. This database is part of an electronic health records system to provide documentation
of medical testing, case management, and environmental risk assessments statewide. The data is
used to provide comprehensive lead case management services and for statistical information.
All child and adult lead test information is tracked in MOHSAIC.

2
Lead Poisoning in Missouri
Lead poisoning is one of the most common and preventable environmental health problems
today. Almost a quarter million children in the United States are estimated to have an EBL level
of at least a 10 μg/dL. According to Missouri blood lead testing data for July 1, 2014, through
June 30, 2015, there were 563 children under the age of six identified with EBL levels of at least
10 μg/dL (0.65 percent of the 86,472 children tested that year).
The primary lead hazard to children in Missouri is deteriorated lead-based paint. Lead-based
paint was banned for residential use nationwide in 1978. Any home built before 1978 may
contain lead-based paint. The highest risk of lead exposure for children is found in homes built
before 1950, when most paint contained a high percentage of lead. More than 21 percent of the
housing stock in Missouri was built before 1950 (see page 5).
Lead mining and smelting are an important part of Missouri’s history. Lead in Missouri was first
discovered along the Meramec River by French explorers in the 1700s while searching for gold
and silver. Missouri became the dominant lead-producing state in the nation in 1907. It has
remained so ever since. Most early lead production came from the Old Lead Belt district of
southeast Missouri in the Park Hills-Bonne Terre area, and in the Tri-State Zinc-Lead district in
southwest Missouri around Joplin. Today, all of the state’s lead production comes from the New
Lead Belt, also known as the Viburnum Trend district. This district is a very narrow, 35-mile-
long ore area extending southward from the small town of Viburnum, Iron County, in southeast
Missouri. Mining waste products in these areas often end up on driveways, in yards, or even in
children’s play areas. Dust, air, and soil around mining activity have consistently shown
elevated levels of lead contamination.
Lead is a shiny, silver-colored metal found naturally in the earth’s crust. Lead has historically
been used in a variety of ways including in paints, gasoline, batteries, bullets, keys, and some
vinyl products such as mini-blinds. Fine particles of processed or recycled lead and/or lead dust
become a health hazard when they are taken into the body through inhalation (breathing) and/or
ingestion (swallowing). Lead affects almost every organ and system in the body. The effects of lead are the same
whether it is inhaled or ingested and can damage the brain, central nervous system, kidneys, and
immune system. Lead in the human body is most harmful to young children under six years of
age, and is especially detrimental to children less than three years of age because their systems
are developing rapidly. A blood test is used to determine lead levels. Lead can be measured in blood drawn from a vein
or capillary (finger stick). Blood lead levels are measured and reported as micrograms of lead
per deciliter of whole blood (µg/dL).

3
Statewide Screening Plan
Legislation passed in 2001 required DHSS to promulgate rules and regulations to establish a
statewide screening plan. The rules and regulations define criteria for establishing geographic
areas in the state considered to be at higher risk for lead poisoning, outline blood lead testing
requirements and protocols, and define lead testing follow-up.
In developing these regulations, CLPPP applied Missouri surveillance and census data to establish
criteria for Universal Testing (high risk) and Targeted Testing (non-high risk) areas in Missouri.
Based upon those criteria, and as required by state statute, the following activities shall occur in
these two areas.
In Universal Testing Areas:
Any child under the age of six living in or visiting for more than 10 hours per week in the
Universal Testing or high risk area will be tested annually for lead.
Childcare facilities located in Universal Testing Areas must record a “proof of lead
testing” signed by the health care provider within 30 days of the child’s enrollment. The
statement must verify that a blood lead test was completed in the previous 12 months. If
the parent/guardian does not provide proof or a written statement explaining why they do
not want the child tested, the childcare facility is to offer the parent assistance in
scheduling a blood lead test.
In Targeted Testing Areas the following activities shall occur:
From six months to six years of age, every child will be screened annually using the
Healthy Children and Youth (HCY) Lead Risk Assessment Guide to determine whether
the child is at risk for lead poisoning. Responses given during the screening with the
Guide may indicate the need for blood lead testing at an earlier age (six months) and/or
more frequently.
*The HCY Lead Risk Assessment Guide can be viewed at:
http://health.mo.gov/living/environment/lead/pdf/HCYLeadRiskAssessmentGuide.pdf.
Every child less than age six found to be at high risk will be blood tested for lead
poisoning.
All MO HealthNet eligible children shall be assessed by the HCY Lead Risk Assessment
Guide and/or be blood lead tested at the ages stipulated by the Federal Program
Guidelines (12 months of age, 24 months of age, or 12 to 72 months of age).
An updated Missouri Annual Childhood Lead Testing Area Requirements map is published
every year and is available at: health.mo.gov/living/environment/lead/maps.php.

4
Reporting of Blood Lead Testing
Missouri’s diseases and conditions reporting rule (19 CSR 20-20.020) requires reporting of all
blood lead tests both elevated and non-elevated and clarifies demographic patient information
required to be submitted with the report. All blood lead test results are required to be reported to
the DHSS regardless of the age of the individual or the reported lead level. The data contributes
to Missouri’s local, regional, and statewide statistics on blood lead poisoning.
The following information is required:
Date test was conducted
Type of specimen (capillary or venous)
Result of the test
Name and address of the attending physician
Name of the disease or condition diagnosed or suspected
Date the test results were obtained
Patient’s complete name and home address with zip code
Patient’s date of birth
Patient’s sex and race
Health care providers should assure that the laboratory they are using is reporting to DHSS.
LeadCare Analyzers LeadCare Analyzers are portable and easy-to-use instruments that give results of capillary blood
lead samples within minutes. These devices allow the patient to receive a result immediately
from the tester. LeadCare Analyzers are very convenient for physicians’ offices and local health
departments. These devices:
Prevent the patient from possibly being referred to an entirely different location to have
the test done.
Save time that would be spent waiting on lab results.
The use of these instruments has increased for both providers and local public health agencies.
Filter Paper Blood Lead Testing Filter Paper techniques are acceptable for blood lead testing if health care providers ensure that,
as with all blood lead test methods, the chosen laboratory is participating satisfactorily in
Clinical Laboratory Improvement Amendments (CLIA) certified proficiency testing (PT)
program. Technical assistance is available by contacting the nurse in the DHSS Childhood Lead
Poisoning Prevention Program at 573-751-6102.
5
Housing Risks
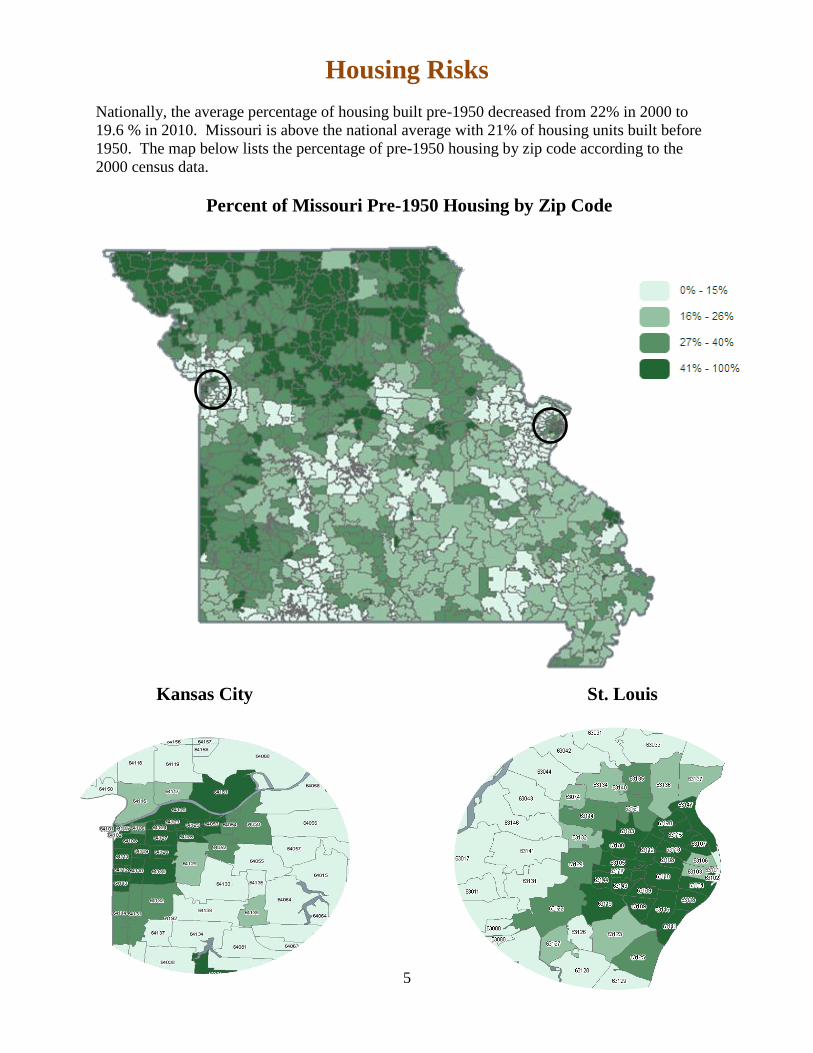
Nationally, the average percentage of housing built pre-1950 decreased from 22% in 2000 to
19.6 % in 2010. Missouri is above the national average with 21% of housing units built before
1950. The map below lists the percentage of pre-1950 housing by zip code according to the
2000 census data.
Percent of Missouri Pre-1950 Housing by Zip Code
Kansas City St. Louis

6
Testing and Prevalence
The number of Missouri’s children less than six years old who have been tested for lead
poisoning has increased from 50,362 in 2000 to 86,472 in Fiscal Year 2015. Of the children
tested, the percentage found to have elevated blood lead levels (10 µg/dL or greater) has declined
from 11.1 percent in 2000 to 0.65 percent in 2015. This decrease mirrors a nationwide decrease
in children’s blood lead levels. In 2015, of the 86,472 children in Missouri who received a blood
lead test, 563 had blood lead levels of 10 µg/dL or greater.
Highlights from the Fiscal Year 2014 testing data
There were 86,472 children tested for lead during Fiscal Year 2015.
Of children tested in Missouri, 563 (0.65 percent) had an elevated blood lead level of at least
10 μg/dL.
The number of children found to have an EBL greater than or equal to 10 μg/dL decreased
from 5,588 in 2000 to 563 in 2015.
Approximately 23 percent of children tested resided in a Universal Testing Area in 2015.
2,746 children tested had blood lead levels between 5 and 9.9 µg/dL.
A summary of county level blood lead testing data for the period July 1, 2014, through
June 30, 2015, is presented on the following pages.

7
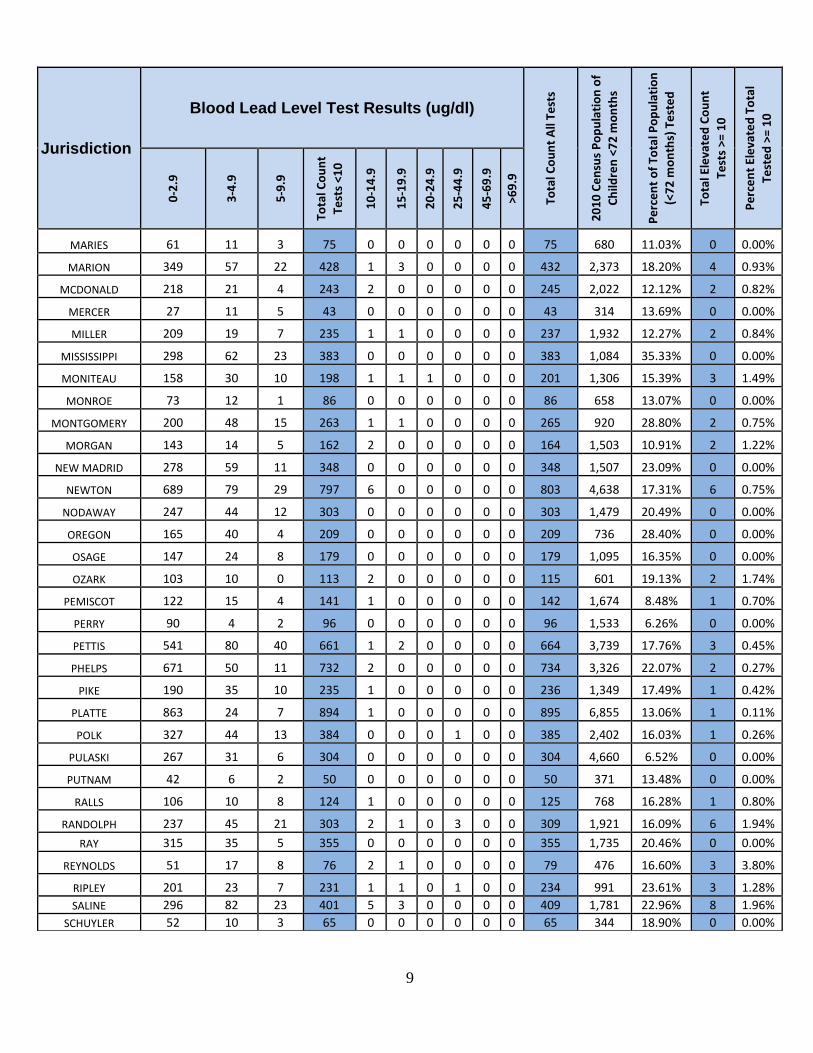
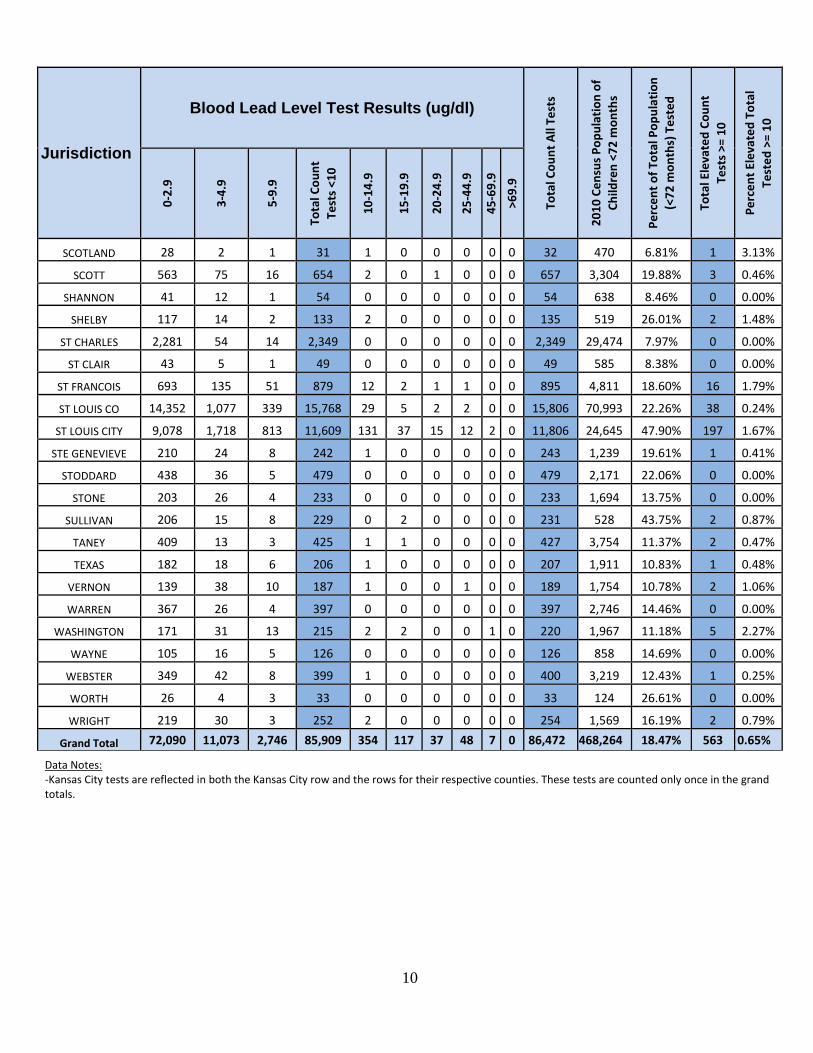
Blood Lead Testing Data by County For the period July 1, 2014, through June 30, 2015, for Children Less Than Six Years of Age
Jurisdiction
Blood Lead Level Test Results (ug/dl)
Tota
l Co
un
t A
ll Te
sts
20
10
Ce
nsu
s P
op
ula
tio
n o
f
Ch
ildre
n <
72
mo
nth
s
Pe
rce
nt
of
Tota
l Po
pu
lati
on
(<7
2 m
on
ths)
Te
ste
d
Tota
l Ele
vate
d C
ou
nt
Test
s >=
10
Pe
rce
nt
Ele
vate
d T
ota
l
Test
ed
>=
10
0-2
.9
3-4
.9
5-9
.9
Tota
l Co
un
t
Test
s <1
0
10
-14
.9
15
-19
.9
20
-24
.9
25
-44
.9
45
-69
.9
>69
.9
ADAIR 235 55 12 302 1 0 0 1 0 0 304 1,715 17.73% 2 0.66%
ANDREW 214 16 11 241 2 1 0 0 0 0 244 1,217 20.05% 3 1.23%
ATCHISON 25 11 9 45 2 0 0 0 0 0 47 362 12.98% 2 4.26%
AUDRAIN 346 28 8 382 2 0 0 0 2 0 386 2,063 18.71% 4 1.04%
BARRY 261 36 10 307 0 0 0 0 0 0 307 2,726 11.26% 0 0.00%
BARTON 93 11 7 111 1 0 0 0 0 0 112 997 11.23% 1 0.89%
BATES 207 24 14 245 1 0 0 0 0 0 246 1,369 17.97% 1 0.41%
BENTON 142 9 3 154 1 1 0 0 0 0 156 1,001 15.58% 2 1.28%
BOLLINGER 133 27 7 167 0 1 0 0 0 0 168 907 18.52% 1 0.60%
BOONE 2,384 89 21 2,494 1 1 0 3 0 0 2,499 12,126 20.61% 5 0.20%
BUCHANAN 1,124 164 105 1,393 15 4 3 2 0 0 1,417 7,321 19.36% 24 1.69%
BUTLER 658 146 26 830 5 0 1 0 0 0 836 3,369 24.81% 6 0.72%
CALDWELL 125 14 5 144 1 0 0 0 0 0 145 722 20.08% 1 0.69%
CALLAWAY 472 48 13 533 3 0 0 0 0 0 536 3,169 16.91% 3 0.56%
CAMDEN 170 21 5 196 1 0 0 0 0 0 197 2,610 7.55% 1 0.51%
CAPE GIRARDEAU 383 46 33 462 4 4 1 3 0 0 474 5,638 8.41% 12 2.53%
CARROLL 173 27 10 210 2 1 0 0 0 0 213 634 33.60% 3 1.41%
CARTER 77 18 5 100 0 1 0 0 0 0 101 515 19.61% 1 0.99%
CASS 1,045 87 17 1,149 1 0 0 0 0 0 1,150 8,174 14.07% 1 0.09%
CEDAR 100 28 4 132 0 0 0 0 0 0 132 1,002 13.17% 0 0.00%
CHARITON 88 12 1 101 0 0 0 1 0 0 102 575 17.74% 1 0.98%
CHRISTIAN 855 58 9 922 2 0 0 0 0 0 924 7,017 13.17% 2 0.22%
CLARK 69 20 3 92 1 1 0 0 0 0 94 577 16.29% 2 2.13%
CLAY 2,516 106 21 2,643 1 1 0 0 0 0 2,645 19,570 13.52% 2 0.08%
CLINTON 192 12 4 208 1 2 0 0 0 0 211 1,569 13.45% 3 1.42%
COLE 756 85 29 870 2 2 0 1 0 0 875 6,099 14.35% 5 0.57%
COOPER 234 27 9 270 0 0 0 0 0 0 270 1,291 20.91% 0 0.00%
CRAWFORD 334 33 9 376 1 0 0 0 0 0 377 2,000 18.85% 1 0.27%
DADE 67 18 6 91 1 0 0 0 0 0 92 494 18.62% 1 1.09%
DALLAS 138 20 5 163 0 0 0 0 0 0 163 1,368 11.92% 0 0.00%

8
Jurisdiction
Blood Lead Level Test Results (ug/dl)
Tota
l Co
un
t A
ll Te
sts
20
10
Ce
nsu
s P
op
ula
tio
n o
f
Ch
ildre
n <
72
mo
nth
s
Pe
rce
nt
of
Tota
l Po
pu
lati
on
(<7
2 m
on
ths)
Te
ste
d
Tota
l Ele
vate
d C
ou
nt
Test
s >=
10
Pe
rce
nt
Ele
vate
d T
ota
l
Test
ed
>=
10
0-2
.9
3-4
.9
5-9
.9
Tota
l Co
un
t
Test
s <1
0
10
-14
.9
15
-19
.9
20
-24
.9
25
-44
.9
45
-69
.9
>69
.9
DAVIESS 126 10 7 143 0 1 0 0 0 0 144 757 19.02% 1 0.69%
DEKALB 127 11 3 141 0 0 0 0 0 0 141 706 19.97% 0 0.00%
DENT 196 37 10 243 0 0 0 0 0 0 243 1,145 21.22% 0 0.00%
DOUGLAS 241 28 5 274 0 1 0 0 0 0 275 983 27.98% 1 0.36%
DUNKLIN 388 65 9 462 0 0 0 0 0 0 462 2,640 17.50% 0 0.00%
FRANKLIN 818 47 22 887 3 2 0 0 0 0 892 7,862 11.35% 5 0.56%
GASCONADE 190 13 7 210 1 0 0 0 0 0 211 1,009 20.91% 1 0.47%
GENTRY 99 15 7 121 1 1 1 0 0 0 124 542 22.88% 3 2.42%
GREENE 2,994 275 67 3,336 7 3 0 0 0 0 3,346 20,451 16.36% 10 0.30%
GRUNDY 136 39 12 187 1 0 0 1 0 0 189 853 22.16% 2 1.06%
HARRISON 104 13 5 122 1 0 0 0 0 0 123 781 15.75% 1 0.81%
HENRY 256 25 8 289 0 2 0 0 0 0 291 1,583 18.38% 2 0.69%
HICKORY 90 19 9 118 0 0 0 0 0 0 118 535 22.06% 0 0.00%
HOLT 71 17 8 96 0 1 1 0 0 0 98 336 29.17% 2 2.04%
HOWARD 150 24 11 185 0 0 0 0 0 0 185 732 25.27% 0 0.00%
HOWELL 293 114 4 411 1 0 0 0 0 0 412 3,389 12.16% 1 0.24%
IRON 170 50 36 256 4 1 1 1 0 0 263 742 35.44% 7 2.66%
JACKSON 7,917 3,627 222 11,766 40 12 6 9 2 0 11,835 57,177 20.70% 69 0.58%
JASPER 1,780 226 92 2,098 8 4 1 3 0 0 2,114 10,727 19.71% 16 0.76%
JEFFERSON 1,644 82 27 1,753 4 1 0 0 0 0 1,758 18,009 9.76% 5 0.28%
JOHNSON 289 55 8 352 5 1 0 1 0 0 359 4,267 8.41% 7 1.95%
KANSAS CITY 7,293 926 202 8,421 35 9 5 8 2 0 8,480 40,849 20.76% 59 0.70%
KNOX 53 9 0 62 1 0 0 0 0 0 63 323 19.50% 1 1.59%
LACLEDE 383 62 8 453 0 0 1 0 0 0 454 3,029 14.99% 1 0.22%
LAFAYETTE 210 228 7 445 1 1 0 0 0 0 447 2,511 17.80% 2 0.45%
LAWRENCE 402 62 23 487 0 0 0 0 0 0 487 3,220 15.12% 0 0.00%
LEWIS 128 36 19 183 2 0 1 1 0 0 187 762 24.54% 4 2.14%
LINCOLN 557 26 2 585 0 0 0 0 0 0 585 4,892 11.96% 0 0.00%
LINN 117 15 9 141 0 0 0 0 0 0 141 1,009 13.97% 0 0.00%
LIVINGSTON 188 27 7 222 0 1 0 0 0 0 223 1,127 19.79% 1 0.45%
MACON 202 27 10 239 0 1 0 0 0 0 240 1,266 18.96% 1 0.42%
MADISON 199 30 14 243 3 1 0 0 0 0 247 956 25.84% 4 1.62%
9
Jurisdiction
Blood Lead Level Test Results (ug/dl)
Tota
l Co
un
t A
ll Te
sts
20
10
Ce
nsu
s P
op
ula
tio
n o
f
Ch
ildre
n <
72
mo
nth
s
Pe
rce
nt
of
Tota
l Po
pu
lati
on
(<7
2 m
on
ths)
Te
ste
d
Tota
l Ele
vate
d C
ou
nt
Test
s >=
10
Pe
rce
nt
Ele
vate
d T
ota
l
Test
ed
>=
10
0-2
.9
3-4
.9
5-9
.9
Tota
l Co
un
t
Test
s <1
0
10
-14
.9
15
-19
.9
20
-24
.9
25
-44
.9
45
-69
.9
>69
.9
MARIES 61 11 3 75 0 0 0 0 0 0 75 680 11.03% 0 0.00%
MARION 349 57 22 428 1 3 0 0 0 0 432 2,373 18.20% 4 0.93%
MCDONALD 218 21 4 243 2 0 0 0 0 0 245 2,022 12.12% 2 0.82%
MERCER 27 11 5 43 0 0 0 0 0 0 43 314 13.69% 0 0.00%
MILLER 209 19 7 235 1 1 0 0 0 0 237 1,932 12.27% 2 0.84%
MISSISSIPPI 298 62 23 383 0 0 0 0 0 0 383 1,084 35.33% 0 0.00%
MONITEAU 158 30 10 198 1 1 1 0 0 0 201 1,306 15.39% 3 1.49%
MONROE 73 12 1 86 0 0 0 0 0 0 86 658 13.07% 0 0.00%
MONTGOMERY 200 48 15 263 1 1 0 0 0 0 265 920 28.80% 2 0.75%
MORGAN 143 14 5 162 2 0 0 0 0 0 164 1,503 10.91% 2 1.22%
NEW MADRID 278 59 11 348 0 0 0 0 0 0 348 1,507 23.09% 0 0.00%
NEWTON 689 79 29 797 6 0 0 0 0 0 803 4,638 17.31% 6 0.75%
NODAWAY 247 44 12 303 0 0 0 0 0 0 303 1,479 20.49% 0 0.00%
OREGON 165 40 4 209 0 0 0 0 0 0 209 736 28.40% 0 0.00%
OSAGE 147 24 8 179 0 0 0 0 0 0 179 1,095 16.35% 0 0.00%
OZARK 103 10 0 113 2 0 0 0 0 0 115 601 19.13% 2 1.74%
PEMISCOT 122 15 4 141 1 0 0 0 0 0 142 1,674 8.48% 1 0.70%
PERRY 90 4 2 96 0 0 0 0 0 0 96 1,533 6.26% 0 0.00%
PETTIS 541 80 40 661 1 2 0 0 0 0 664 3,739 17.76% 3 0.45%
PHELPS 671 50 11 732 2 0 0 0 0 0 734 3,326 22.07% 2 0.27%
PIKE 190 35 10 235 1 0 0 0 0 0 236 1,349 17.49% 1 0.42%
PLATTE 863 24 7 894 1 0 0 0 0 0 895 6,855 13.06% 1 0.11%
POLK 327 44 13 384 0 0 0 1 0 0 385 2,402 16.03% 1 0.26%
PULASKI 267 31 6 304 0 0 0 0 0 0 304 4,660 6.52% 0 0.00%
PUTNAM 42 6 2 50 0 0 0 0 0 0 50 371 13.48% 0 0.00%
RALLS 106 10 8 124 1 0 0 0 0 0 125 768 16.28% 1 0.80%
RANDOLPH 237 45 21 303 2 1 0 3 0 0 309 1,921 16.09% 6 1.94%
RAY 315 35 5 355 0 0 0 0 0 0 355 1,735 20.46% 0 0.00%
REYNOLDS 51 17 8 76 2 1 0 0 0 0 79 476 16.60% 3 3.80%
RIPLEY 201 23 7 231 1 1 0 1 0 0 234 991 23.61% 3 1.28%
SALINE 296 82 23 401 5 3 0 0 0 0 409 1,781 22.96% 8 1.96%
SCHUYLER 52 10 3 65 0 0 0 0 0 0 65 344 18.90% 0 0.00%
10
Jurisdiction
Blood Lead Level Test Results (ug/dl)
Tota
l Co
un
t A
ll Te
sts
20
10
Ce
nsu
s P
op
ula
tio
n o
f
Ch
ildre
n <
72
mo
nth
s
Pe
rce
nt
of
Tota
l Po
pu
lati
on
(<7
2 m
on
ths)
Te
ste
d
Tota
l Ele
vate
d C
ou
nt
Test
s >=
10
Pe
rce
nt
Ele
vate
d T
ota
l
Test
ed
>=
10
0-2
.9
3-4
.9
5-9
.9
Tota
l Co
un
t
Test
s <1
0
10
-14
.9
15
-19
.9
20
-24
.9
25
-44
.9
45
-69
.9
>69
.9
SCOTLAND 28 2 1 31 1 0 0 0 0 0 32 470 6.81% 1 3.13%
SCOTT 563 75 16 654 2 0 1 0 0 0 657 3,304 19.88% 3 0.46%
SHANNON 41 12 1 54 0 0 0 0 0 0 54 638 8.46% 0 0.00%
SHELBY 117 14 2 133 2 0 0 0 0 0 135 519 26.01% 2 1.48%
ST CHARLES 2,281 54 14 2,349 0 0 0 0 0 0 2,349 29,474 7.97% 0 0.00%
ST CLAIR 43 5 1 49 0 0 0 0 0 0 49 585 8.38% 0 0.00%
ST FRANCOIS 693 135 51 879 12 2 1 1 0 0 895 4,811 18.60% 16 1.79%
ST LOUIS CO 14,352 1,077 339 15,768 29 5 2 2 0 0 15,806 70,993 22.26% 38 0.24%
ST LOUIS CITY 9,078 1,718 813 11,609 131 37 15 12 2 0 11,806 24,645 47.90% 197 1.67%
STE GENEVIEVE 210 24 8 242 1 0 0 0 0 0 243 1,239 19.61% 1 0.41%
STODDARD 438 36 5 479 0 0 0 0 0 0 479 2,171 22.06% 0 0.00%
STONE 203 26 4 233 0 0 0 0 0 0 233 1,694 13.75% 0 0.00%
SULLIVAN 206 15 8 229 0 2 0 0 0 0 231 528 43.75% 2 0.87%
TANEY 409 13 3 425 1 1 0 0 0 0 427 3,754 11.37% 2 0.47%
TEXAS 182 18 6 206 1 0 0 0 0 0 207 1,911 10.83% 1 0.48%
VERNON 139 38 10 187 1 0 0 1 0 0 189 1,754 10.78% 2 1.06%
WARREN 367 26 4 397 0 0 0 0 0 0 397 2,746 14.46% 0 0.00%
WASHINGTON 171 31 13 215 2 2 0 0 1 0 220 1,967 11.18% 5 2.27%
WAYNE 105 16 5 126 0 0 0 0 0 0 126 858 14.69% 0 0.00%
WEBSTER 349 42 8 399 1 0 0 0 0 0 400 3,219 12.43% 1 0.25%
WORTH 26 4 3 33 0 0 0 0 0 0 33 124 26.61% 0 0.00%
WRIGHT 219 30 3 252 2 0 0 0 0 0 254 1,569 16.19% 2 0.79%
Grand Total 72,090 11,073 2,746 85,909 354 117 37 48 7 0 86,472 468,264 18.47% 563 0.65%
Data Notes: -Kansas City tests are reflected in both the Kansas City row and the rows for their respective counties. These tests are counted only once in the grand totals.

11
Lead Poisoning Prevention Education
CLPPP develops an educational campaign and distributes materials to advocates statewide each
year. The campaign goal is to provide stakeholders with the tools necessary to promote lead
poisoning prevention. Themes, fact sheets, posters, and public service announcements are examples
of campaign materials. The materials are used during lead poisoning prevention month to intensify
the statewide effort.
Several educational brochures and fact sheets that focus on specific lead related issues such as
Pregnancy and Lead Poisoning and A Health Care Provider’s Guide to Lead Screening and Testing
Requirements are also available and can be ordered for community-wide use.
Educational materials are also available and displayed at health fairs, home shows, blood lead testing
events, and other public events when possible. Display boards provide visitors with lead poisoning
prevention posters, signs, facts, and other educational materials. The display boards are helpful to
capture people’s attention and draw them in to learn about other healthy homes topics such as radon
and mold.
Lead Poisoning Prevention Week (observed in October) campaign information, newsletters, fact
sheets, booklets, and other publications are all available to the public on the CLPPP webpage. The
webpage also features: upcoming events, lead testing guidelines, Missouri Annual Childhood Lead
Testing Area Requirements maps, product recalls, data and statistical reports, laws, regulations, and
manuals.
Collaborations
Case Management Services
Case management of children with EBL levels involves coordinating, providing, and overseeing
the services required to help reduce the child’s blood lead level. During fiscal year 2015, case
managers strived to reduce EBL levels to less than 10 µg/dL. It is based on the efforts of an
organized team and is child, physician, and family centered. Lead case management services may
be provided by the child’s primary care physician, LPHA, or a MO HealthNet Managed Care
health plan. At times, other disciplines, such as behavioral health, are part of the case
management system. In some cases, interpretive services may be indicated and these individuals
will also interact with lead case managers. DHSS Childhood Lead Poisoning Prevention staff,
along with MO HealthNet and LPHA staff, monitors case management for children identified
with a blood lead level greater than or equal to 10 µg/dL. The MOHSAIC system is used to
provide a centralized documented record of communications, results, case management
interventions, and updated demographic information. This promotes the sharing of the findings
and promoting unified support of suggested interventions made by the risk assessors following
environmental investigation results.

12
Environmental Services The Missouri Public Health System provides lead risk assessment services to detect hazardous
sources of lead exposure in children’s homes. This service is provided for children age six and
younger who have a confirmed venous blood lead level of 15 μg/dL or greater.
A risk assessment is conducted by a professional, trained and licensed by the DHSS Lead Licensing
Program. The assessor consults with the child’s family to determine areas of the home where the
child may come into contact with lead. X-ray Fluorescence Analyzers (XRFs) are used to analyze
painted surfaces and household objects. Dust, soil, and water samples are collected to determine if
and where lead hazards exist. Upon completing the assessment and receiving the lab analysis, the
risk assessor provides the property owner and/or occupant (if other than the owner) with
recommendations for reducing lead hazards. The risk assessor revisits the home at an agreed-upon
time to assure lead hazard reduction has been accomplished. The risk assessor collaborates with the
child’s parent or legal guardian, property owner, LPHA or MO HealthNet lead case manager, DHSS
CLPPP staff, and the child’s physician as indicated, as part of their role in case management of the
elevated child. Risk assessment reports are also accessible to team members if the child’s blood lead
level was 15 μg/dL or greater.
Healthy Homes
Since the beginning of the “Is Your Home Healthy?” exhibit in 2007, the exhibit has been adapted
for use at a variety of events throughout the state. The main exhibit focuses on the Healthy
Indoor Environments unit in the Bureau of Environmental Epidemiology. The primary programs
highlighted are the Childhood Lead Poisoning Prevention Program and the Indoor Air/Radon
Program. Information is available on a variety of topics including lead poisoning prevention,
radon and mold remediation, the fish consumption advisory, asbestos-containing vermiculite
insulation, carbon monoxide poisoning prevention, heat and cold illness prevention, mercury
handling and disposal, and other environmental health topics as appropriate for the event and
audience. Coloring and activity books, magnets, and stickers are available to capture the interest
of guardians and children. Employees from various DHSS programs work the exhibit and are
available to answer questions about environmental health concerns from citizens. The exhibit
also features hand washing information from the Bureau of Communicable Disease Control and
Prevention along with tick and mosquito repellant information from the Vector Borne Disease
Program.
Between July 1, 2014, and June 30, 2015, “Is Your Home Healthy?” was displayed at 37 different
venues across the state. These included the new Local Public Health Administrators training; St.
Louis, Kansas City, and Jefferson City Home Builders Association Home Shows; Missouri
School Nurse Conference; Missouri Environmental Educator Conference; and school and
community health fairs.
The “Is Your Home Healthy?” exhibit is an ongoing collaborative effort between the Bureau of
Environmental Epidemiology programs, the Bureau of Communicable Disease Control and
Prevention, the Vector Borne Disease Program, and the local health departments. This outreach
effort continues to help build partnerships with outside organizations such as Parents as Teachers,
child advocates, school nurses, contractors, environmental health professionals, senior citizen
groups, and parents. At the same time, it provides valuable information to and helps educate the
citizens of Missouri about environmental hazards in their homes.
13
Agency for Toxic Substance and Disease Registry (ATSDR)/Environmental
Protection Agency (EPA)/Missouri Department of Natural Resources (MDNR) Lead mining, milling, and smelting have occurred throughout the lower half of Missouri.
Missouri ranks as the top lead-producing state in the nation. Across the state, there are 60
counties that are potentially impacted by lead mining-related activities.
Historical lead mining, milling, and processing have resulted in innumerable tons and acres of
waste products, such as tailings and chat. Over time, tailings and chat have migrated into the
surrounding communities. The migration has been caused by wind or water erosion, as well as
human activities, such as using the lead waste as fill material in yards, driveways, and sandboxes
or using the chat for traction along roads in winter. Because of the lead mine waste and the
resulting contamination into nearby communities, Missouri has many sites placed on the
Environmental Protection Agency (EPA) National Priorities List (NPL) for remediation. In St.
Francois County, six large mine tailings and chat piles from past mining and milling operations
are located near residential areas. Other major lead mining sites that have been placed on the
NPL due to residential contamination include Madison and Jefferson counties; sites in Newton,
Jasper, and Iron counties; and four sites in Washington County. The active lead smelter in
Herculaneum, Missouri, ceased operation on December 31, 2013. The smelter processed lead
concentrate from active mining and milling operations in nearby counties into lead ingots for use
in consumer products like batteries and computers. Lead contamination resulting from the
smelter operations is also being addressed in the community of Herculaneum.
DHSS, along with other state, local and federal agencies (including ATSDR, EPA, and MDNR),
is addressing these sites to protect public health. Multiple actions have been taken to reduce
human exposure and prevent lead poisoning, especially to children less than six years old. Some
of the actions taken by partnering agencies at the various sites to reduce exposure include
monitoring of air, sampling of soil, water, and dust, stabilization of the tailings piles, yard soil
removals, street cleanings, interior home cleaning, reduction in smelter air emissions, and special
blood lead testing events. Additional activities conducted by DHSS include health studies, health
consultations, public health assessments, and ongoing educational activities.
Brownfield Project Vast areas of Missouri may have high levels of lead in soil and/or groundwater due to naturally
occurring lead deposits and from past and present lead mining and production. Given the recent
rapid expansion of urban sprawl, many previously undeveloped properties are now being looked at
by developers for residential housing and other types of increased land use. Development of this
nature on mining-impacted lands potentially exposes new populations to lead and other heavy metal
contaminants.
Under a grant from ATSDR, DHSS acted to increase testing for lead in drinking water by working
with the State Public Health Laboratory to add lead to its list of analytes included in the New Well
Series for private drinking water supplies and by recommending actions that local public health
agencies can take to increase testing. DHSS also developed health education materials to promote
water testing for lead. To assist in responding to homeowner concerns for those identified with lead
impacts to their drinking water system, a lead in drinking water fact sheet was developed that can be
provided along with test results with recommendations for reducing exposure. These health
education materials can be found at the following DHSS web site:
http://health.mo.gov/living/environment/lead/publications.php#gov.
14
DHSS Lead Licensing Program
The Lead Licensing Program is responsible for licensing individuals to conduct lead abatement,
inspections, and risk assessments. Employees of this section may make unannounced site visits to
check that all individuals have the proper current license and that lead abatement is being
conducted correctly and safely. This is to ensure the safety of the residents who may not know
the harmful effects of improper lead abatement work practices. Like CLPPP, the Lead Licensing
Program plays an important role in keeping people healthy and safe from lead poisoning. All risk
assessors that are a part of CLPPP are licensed and overseen by the Lead Licensing Program.
Missouri Department of Social Services (MDSS), MO HealthNet Division (MHD) Poverty is one major risk factor for lead poisoning. DHSS and MHD have had a cooperative
agreement in place since 1998. This agreement outlines the agencies’ mutual objectives
regarding childhood lead poisoning to: 1) assure that MO HealthNet eligible children are
screened/tested according to the Statewide Lead Testing Plan; and 2) assure that medically
necessary services are provided for MO HealthNet eligible children whether by a MO HealthNet
enrolled provider or a MO HealthNet Managed Care health plan for the correction or amelioration
of lead poisoning related conditions identified through a full or partial Early Periodic Screening
Diagnosis and Treatment. During FY2015, MO HealthNet staff assessed the current MO
HealthNet status of all Missouri children with confirmed blood lead levels 10 µg/dL or greater.
MO HealthNet staff generates a health plan specific report of elevated health plan members that is
forwarded to each health plan lead case manager for case management of the elevation. Lead
case management activities for these elevated health plan children are documented by the health
plan lead case managers, directly into the MOHSAIC Lead Case Management Application. This
documentation helps to facilitate greater and timelier communication regarding follow-up of
elevated children among the MO HealthNet Managed Care health plans, MHD, DHSS, and the
LPHAs. DHSS staff representation on the Central Area Headstart Advisory Committee provides
opportunities for education and outreach regarding lead poisoning awareness and prevention
activities in the community.
Women, Infant, and Children (WIC) Program High blood lead levels that affect intelligence, behavior, and the development of children less
than six years of age disproportionately affect minority and poor children. The Special
Supplemental Nutrition Program for WIC is an important partner in efforts to combat the health
risks of lead poisoning. By identifying high-risk children through a screening process during
WIC clinic visits, referring children to their primary care provider for testing, or making blood
lead testing available on-site, the likelihood that more children will be blood lead tested is
improved. This practice also helps to identify elevated children, as well as initiate timely and
appropriate follow-up care.
Missouri Department of Economic Development (DED) The Missouri Department of Economic Development FY 2013-2017 Consolidated Plan produced
by DED includes Targeted and Universal Testing Area maps, blood lead testing data by county,
and percentage of pre-1950 housing data for the state. The document also contains the Missouri
Housing Development Commission’s lead-based paint policies and procedures and the HOME
Repair (HERO) Program’s and HOME Rental Production Program’s lead-based paint reference
guide.

15
Missouri Local Public Health Agencies (LPHAs) Many LPHAs offer blood lead testing within their counties. Some agencies offer free blood lead
testing or referrals to providers that offer testing. Most of these agencies have a nurse that assists
with case management for children who have elevated lead levels; however, this nurse works in
collaboration with the child’s primary care physician, parent or guardian, managed health care
plan, if the child is enrolled, and environmental risk assessors. DHSS’ CLPPP staff collaborates
with LPHA staff on elevated lead cases to provide initial and ongoing technical assistance
regarding lead case management activities, as well as environmental risk assessment. Lead
poisoning education and outreach is often offered at the LPHA level at health fairs, through
physician offices, childcare facilities, and upon request. LPHAs utilize lead poisoning prevention
campaigns to assist in raising community awareness regarding lead poisoning and its health
effects. LPHAs are often a primary contact for parents of children attending childcare facilities
where proof of lead testing is required. This is typically a convenient access point for lead testing
and opportunity for provision of educational lead information to families. The Childhood Lead
Poisoning Prevention Program also provides these agencies with educational materials and
technical assistance for other related issues such as the use of the MOHSAIC application, lead
case management training, and current program and regulatory requirements. The support and
ongoing efforts of the LPHAs regarding childhood lead poisoning and its prevention play a key
role in the primary goal to eliminate childhood lead poisoning.
St. Louis City, St. Louis County, and Kansas City are Missouri’s three largest metropolitan areas.
According to 2015 surveillance data, these three areas combined contain 52 percent of Missouri’s
children with elevated blood lead levels (294 of 563). These three areas along with Jasper County,
Greene County, and Jefferson County have lead poisoning prevention programs that are managed by
the LPHAs. To decrease the prevalence of EBLs in these areas, DHSS collaborates with these
LPHAs, who provide lead poisoning prevention educational activities, assure case management, and
environmental risk assessments.
DHSS collaboration efforts include loaning department-owned XRFs to three LPHAs for lead-
related work activities. Jefferson County and Jasper County each have lead poisoning prevention
programs where the XRFs are utilized. Madison County has an ongoing project using the XRF to
measure lead levels in soil. The department was able to loan an XRF to each of these counties, as
they were not able to purchase their own XRFs for their programs. The loaning of the XRFs to
these lead programs provides a fast, accurate alternative for those programs to identify lead
hazards and promote the remediation of those hazards.

16
For more information on lead poisoning prevention contact:
Missouri Department of Health and Senior Services
Bureau of Environmental Epidemiology
930 Wildwood Drive
Jefferson City, MO 65109
Phone: (573) 751-6102 or (866) 628-9891
Or visit our website at:
http://health.mo.gov/living/environment/lead/index.php