mit and james orlin © 2003 1 chapter 5. sensitivity analysis presented as faqs –points...
TRANSCRIPT
MIT and James Orlin © 2003
1
Chapter 5. Sensitivity Analysis
presented as FAQs– Points illustrated on a running example of
glass manufacturing.– Also the financial example from a previous
lecture

MIT and James Orlin © 2003
2
Glass Example (from AMP)
x1 = # of cases of 6-oz juice glasses (in 100s)
x2 = # of cases of 10-oz cocktail glasses (in 100s)
x3 = # of cases of champagne glasses (in 100s)
max 5 x1 + 4.5 x2 + 6 x3 ($100s)
s.t 6 x1 + 5 x2 + 8 x3 60 (prod. cap. in hrs)
10 x1 + 20 x2 + 10 x3 150 (wareh. cap. in ft2)
x1 8 (6-0z. glass dem.)
x1 0, x2 0, x3 0

MIT and James Orlin © 2003
3
FAQ. Could you please remind me what a shadow price is?
Let us assume that we are maximizing. A shadow price is the increase in the optimum objective value per unit increase in a RHS coefficient, all other data remaining equal.
The shadow price is valid in an interval.
MIT and James Orlin © 2003
4
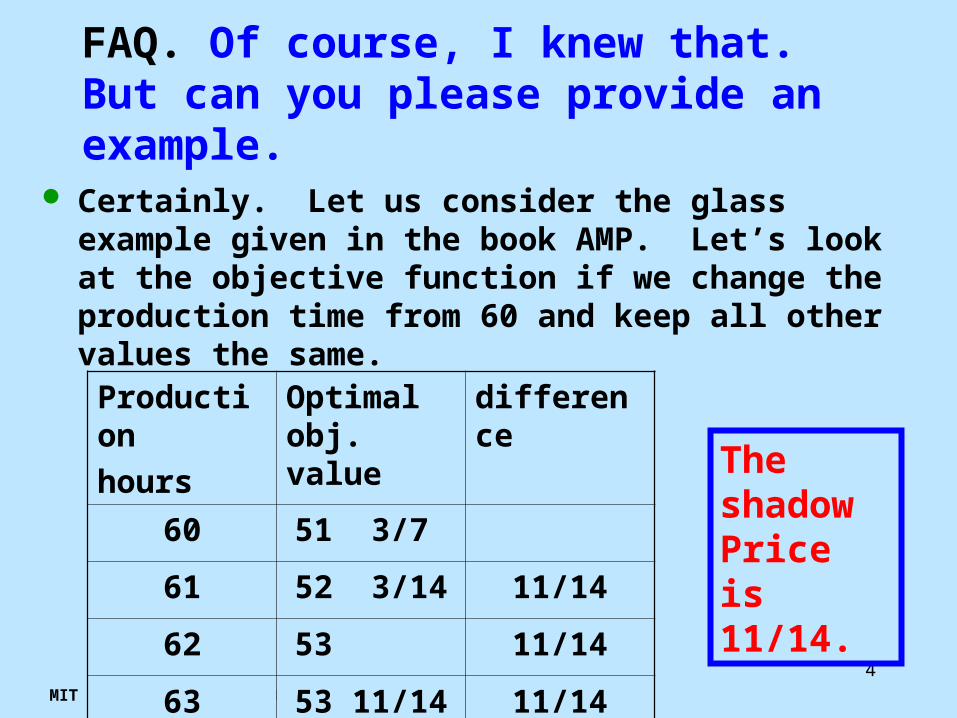
FAQ. Of course, I knew that. But can you please provide an example.
Certainly. Let us consider the glass example given in the book AMP. Let’s look at the objective function if we change the production time from 60 and keep all other values the same.
Production
hours
Optimal obj. value
difference
60 51 3/7
61 52 3/14 11/14
62 53 11/14
63 53 11/14 11/14
The shadow Price is 11/14.

MIT and James Orlin © 2003
5
More changes in the RHS
Production
hours
Optimal obj. value
difference
64 54 4/7 11/14
65 55 5/14 11/14
66 56 1/11 *
67 56 17/22 15/22
The shadow Price is 11/14 until production = 65.5

MIT and James Orlin © 2003
6
FAQ. What is the intuition for the shadow price staying constant, and then changing?
Recall from the simplex method that the simplex method produces a “basic feasible solution.” The basis can often be described easily in terms of a brief verbal description.
Glass Example

MIT and James Orlin © 2003
7
The verbal description for the optimum basis for the glass problem:
1. Produce Juice Glasses and cocktail glasses only
2. Fully utilize production and warehouse capacity
z = 5 x1 + 4.5 x2
6 x1 + 5 x2 = 60
10 x1 + 20 x2 = 150
x1 = 6 3/7
x2 = 4 2/7
z = 51 3/7

MIT and James Orlin © 2003
8
The verbal description for the optimum basis for the glass problem:
1. Produce Juice Glasses and cocktail glasses only
2. Fully utilize production and warehouse capacity
z = 5 x1 + 4.5x2
6 x1 + 5 x2 = 60 +
10 x1 + 20 x2 = 150
x1 = 6 3/7 + 2/7
x2 = 4 2/7 – /7
z = 51 3/7 + 11/14
For = 5.5, x1 = 8, and the constraint x1 8 is binding.

MIT and James Orlin © 2003
9
FAQ. How can shadow prices be used for managerial interpretations?
Let me illustrate with the previous example.
How much should you be willing to pay for an extra hour of production?
Glass Example

MIT and James Orlin © 2003
10
FAQ. Does the shadow price always have an economic interpretation?
The answer is no, unless one wants to really stretch what is meant by an economic interpretation.
Consider ratio constraints

MIT and James Orlin © 2003
11
Apartment Development x1 = number of 1-bedroom apartments built x2 = number of 2-bedroom apartments built x3 = number of 3-bedroom apartments build
x1/(x1 + x2 + x3) .5 x1 .5x1 + .5x2 + .5x3
.5x1 – .5x2 - .5x3 0 The shadow price is the impact of increasing
the 0 to a 1. This has no obvious managerial interpretation.

MIT and James Orlin © 2003
12
FAQ. Right now, I’m new to this. But as I gain experience will interpretations of the shadow prices always be obvious?
No.
But they should become straightforward for examples given in 15.053.

MIT and James Orlin © 2003
13
FAQ. What are the interpretations for the shadow prices for the other two constraints in the glass problem? You can probably answer this one yourself. How much would you be willing to pay for
additional storage capacity? How much would you be willing to pay in order to
increase the demand for 6-oz Juice Glasses?
Glass Example
MIT and James Orlin © 2003
14
FAQ. In the book, they sometimes use “dual price” and we use shadow price. Is there any difference?
No

MIT and James Orlin © 2003
15
FAQ. Excel gives a report known as the Sensitivity report. Does this provide shadow prices?
Yes, plus lots more.
In particular, it gives the range for which the shadow price is valid.
Glass Example

MIT and James Orlin © 2003
16
FAQ. I have heard that Excel occasionally gives incorrect shadow prices. Is this true?
There is the possibility that the interval in which the shadow price is valid is empty.
Excel can also give incorrect Shadow prices under certain circumstances that will not occur in spreadsheets for 15.053.

MIT and James Orlin © 2003
17
FAQ. You have told me that Excel sometimes makes mistakes. Also, I can do sensitivity analysis by solving an LP a large number of times, with varying data. So, what good is the Sensitivity Report?
For large problems it is much more efficient, and for LP models used in practice, it will be accurate.
For large problems it can be used to identify opportunities.
It can identify which coefficients are most sensitive to changes in value (their accuracy is the most important).

MIT and James Orlin © 2003
18
FAQ. How do we interpret the intervals?
If we change one coefficient in the RHS, say production capacity, by the “basis” remains optimal, that is, the same equations remain binding.
So long as the basis remains optimal, the shadow prices are unchanged.
The basic feasible solution varies linearly with. If is big enough or small enough the basis will change.
MIT and James Orlin © 2003
20
FAQ. Would you please summarize what we have learned so far. Of course. Here it is.– The shadow price is the unit change in the
optimal objective value per unit change in the RHS.
– Shadow prices usually but not always have economic interpretations that are managerially useful.
– Shadow prices are valid in an interval, which is provided by the Excel Sensitivity Report.
– Excel provides correct shadow prices for our LPs but can be incorrect in other situations

MIT and James Orlin © 2003
21
Overview of what is to come
Using insight from managerial situations to obtain properties of shadow prices
reduced costs and pricing out

MIT and James Orlin © 2003
23
Illustration with the glass example:
max 5 x1 + 4.5 x2 + 6 x3 ($100s)
s.t 6 x1 + 5 x2 + 8 x3 60 (prod. cap. in hrs)
10 x1 + 20 x2 + 10 x3 150 (wareh. cap. in ft2)
x1 8 (6-0z. glass dem.)
x1 0, x2 0, x3 0The shadow price is the “increase” in the optimal value per unit increase in the RHS. If an increase in RHS coefficient leads to an increase in optimal objective value, then the shadow price is positive. If an increase in RHS coefficient leads to a decrease in optimal objective value, then the shadow price is negative.

MIT and James Orlin © 2003
24
Illustration with the glass example:
max 5 x1 + 4.5 x2 + 6 x3 ($100s)
s.t 6 x1 + 5 x2 + 8 x3 60 (prod. cap. in hrs)
10 x1 + 20 x2 + 10 x3 150 (wareh. cap. in ft2)
x1 8 (6-0z. glass dem.)
x1 0, x2 0, x3 0Claim: the shadow price of the production capacity constraint cannot be negative. Reason: any feasible solution for this problem remains feasible after the production capacity increases. So, the increase in production capacity cannot cause the optimum objective value to go down.

MIT and James Orlin © 2003
25
Illustration with the glass example:
max 5 x1 + 4.5 x2 + 6 x3 ($100s)
s.t 6 x1 + 5 x2 + 8 x3 60 (prod. cap. in hrs)
10 x1 + 20 x2 + 10 x3 150 (wareh. cap. in ft2)
x1 8 (6-0z. glass dem.)
x1 0, x2 0, x3 0Claim: the shadow price of the “x1 0” constraint cannot be positive. Reason: Let x* be the solution if we replace the constraint “x1 0” with the constraint “x1 1”. Then x* is feasible for the original problem, and thus the original problem has at least as high an objective value.
MIT and James Orlin © 2003
26
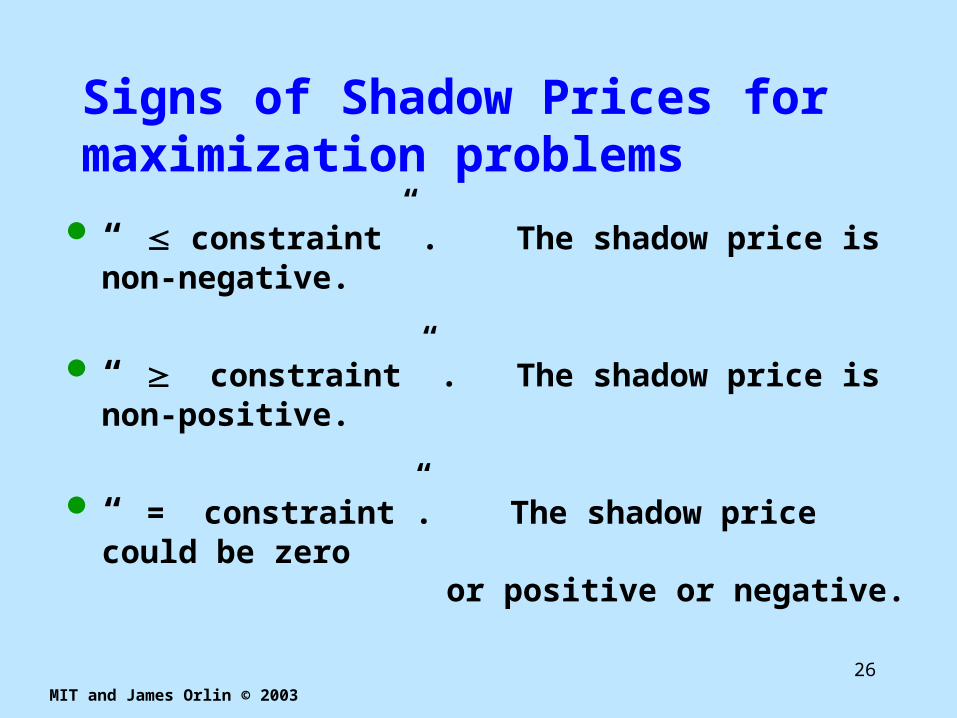
Signs of Shadow Prices for maximization problems
“ constraint” . The shadow price is non-negative.
“ constraint” . The shadow price is non-positive.
“ = constraint”. The shadow price could be zero or positive or negative.

MIT and James Orlin © 2003
27
Signs of Shadow Prices for minimization problems
The shadow price for a minimization problem is the “increase” in the objective function per unit increase in the RHS.
“ constraint” . The shadow price is … ?
“ constraint” . The shadow price is … ?
“ = constraint”. The shadow price could be zero or positive or negative.
Please answer with your partner.

MIT and James Orlin © 2003
28
The shadow price of a non-binding constraint is 0. This is known as “Complementary Slackness.”
max 5 x1 + 4.5 x2 + 6 x3 ($100s)
s.t 6 x1 + 5 x2 + 8 x3 60 (prod. cap. in hrs)
10 x1 + 20 x2 + 10 x3 150 (wareh. cap. in ft2)
x1 8 (6-0z. glass dem.)
x1 0, x2 0, x3 0In the optimum solution, x1 = 6 3/7.
Claim: The shadow price for the constraint “x1 8” is zero.
Intuitive Reason: If your optimum solution has x1 < 8, one does not get a better solution by permitting x1 > 8.

MIT and James Orlin © 2003
30
FAQ. The shadow price is valid if only one right hand side changes. What if multiple right hand side coefficients change?
The shadow prices are valid if multiple RHS coefficients change, but the ranges are no longer valid.
Glass Example
MIT and James Orlin © 2003
31
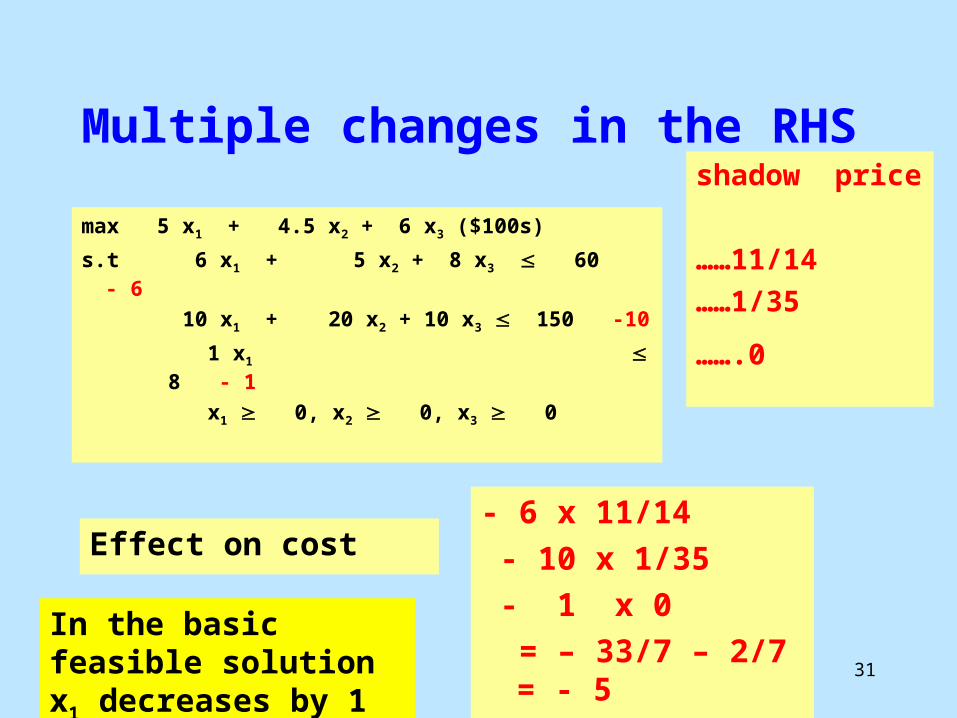
Multiple changes in the RHS
max 5 x1 + 4.5 x2 + 6 x3 ($100s)
s.t 6 x1 + 5 x2 + 8 x3 60 - 6
10 x1 + 20 x2 + 10 x3 150 -10
1 x1 8 - 1
x1 0, x2 0, x3 0
shadow price
……11/14
……1/35
…….0
Effect on cost- 6 x 11/14
- 10 x 1/35
- 1 x 0
= – 33/7 – 2/7 = - 5In the basic feasible solution x1 decreases by 1

MIT and James Orlin © 2003
32
FAQ. Do the non-negativity constraints also have shadow prices?
Yes. They are very special and are called reduced costs?
Look at the reduced costs for – Juice glasses reduced cost = 0– Cocktail glasses reduced cost = 0– Champagne glasses red. cost = -4/7

MIT and James Orlin © 2003
33
FAQ. Does Excel provide information on the reduced costs?
Yes. They are also part of the sensitivity report.
Glass Example
MIT and James Orlin © 2003
34
FAQ. What is the managerial interpretation of a reduced cost? There are two interpretations. Here is one of them. We are currently not producing champagne glasses.
How much would the profit of champagne glasses need to go up for us to produce champagne glasses in an optimum solution?
The reduced cost for champagne classes is –4/7. If we increase the revenue for these glasses by 4/7 (from 6 to 6 4/7), then there will be an alternative optimum in which champagne glasses are produced.

MIT and James Orlin © 2003
35
FAQ. Why are they called the reduced costs? Nothing appears to be “reduced”
That is a very astute question. The reduced costs can be obtained by treating the shadow prices are real costs. This operation is called “pricing out.”

MIT and James Orlin © 2003
36
Pricing Out
max 5 x1 + 4.5 x2 + 6 x3 ($100s)
s.t 6 x1 + 5 x2 + 8 x3 60
10 x1 + 20 x2 + 10 x3 150
1 x1 8
x1 0, x2 0, x3 0
shadow price
……11/14
……1/35
…….0
Pricing out treats shadow prices as though they are real prices. The result is the “reduced costs.”

MIT and James Orlin © 2003
37
Pricing Out of x1
max 5 x1 + 4.5 x2 + 6 x3 ($100s)
s.t 6 x1 + 5 x2 + 8 x3 60
10 x1 + 20 x2 + 10 x3 150
1 x1 8
x1 0, x2 0, x3 0
shadow price
……11/14
……1/35
…….0
Reduced cost of x1 = 5
- 6 x 11/14
- 10 x 1/35
- 1 x 0
= 5 – 33/7 – 2/7 = 0

MIT and James Orlin © 2003
38
Pricing Out of x2
max 5 x1 + 4.5 x2 + 6 x3 ($100s)
s.t 6 x1 + 5 x2 + 8 x3 60
10 x1 + 20 x2 + 10 x3 150
1 x1 8
x1 0, x2 0, x3 0
shadow price
……11/14
……1/35
…….0
Reduced cost of x2 = 4.5
- 5 x 11/14
- 20 x 1/35
- 0 x 0
= 4.5 – 55/14 – 4/7 = 0

MIT and James Orlin © 2003
39
Pricing Out of x3
max 5 x1 + 4.5 x2 + 6 x3 ($100s)
s.t 6 x1 + 5 x2 + 8 x3 60
10 x1 + 20 x2 + 10 x3 150
1 x1 8
x1 0, x2 0, x3 0
shadow price
……11/14
……1/35
…….0
Reduced cost of x3 = 6
- 8 x 11/14
- 10 x 1/35
- 0 x 0
= 6 – 44/7 – 2/7 = -4/7

MIT and James Orlin © 2003
40
FAQ. Can we use pricing out to figure out whether a new type of glass should be produced?max 5 x1 + 4.5 x2 + 7 x4 ($100s)
s.t 6 x1 + 5 x2 + 8 x4 60
10 x1 + 20 x2 + 20 x4 150
1 x1 8
x1 0, x2 0, x4 0
shadow price
……11/14
……1/35
…….0
Reduced cost of x4 = 7
- 8 x 11/14
- 20 x 1/35
- 0 x 0
= 7 – 44/7 – 4/7 = 1/7

MIT and James Orlin © 2003
41
Pricing Out of xj
max 5 x1 + 4.5 x2 + cj xj ($100s)
s.t 6 x1 + 5 x2 + a1j xj 60
10 x1 + 20 x2 + a2j xj 150
………..
………. + amjxj = bm
x1 0, x2 0, x3 0
shadow price
……y1
……y2
………
……ym
Reduced cost of xj = ?
Please complete with your partner.

MIT and James Orlin © 2003
42
Brief summary on reduced costs
The reduced cost of a non-basic variable xj is the “increase” in the objective value of requiring that xj >= 1.
The reduced cost of a basic variable is 0. The reduced cost can be computed by treating
shadow prices as real prices. This operation is known as “pricing out.”
Pricing out can determine if a new variable would be of value (and would enter the basis).

MIT and James Orlin © 2003
43
Would you please summarize what we have learned this lecture?
I’d be happy to.

MIT and James Orlin © 2003
44
Summary The shadow price is the unit change in the optimal
objective value per unit change in the RHS. The shadow price for a “ 0” constraint is called the
reduced cost. Shadow prices usually but not always have
economic interpretations that are managerially useful.
Non-binding constraints have a shadow price of 0. The sign of a shadow price can often be determined
by using the economic interpretation Shadow prices are valid in an interval, which is
provided by the Excel Sensitivity Report. Reduced costs can be determined by pricing out
MIT and James Orlin © 2003
45
The Financial Problem from Lecture 2
Sarah has $1.1 million to invest in five different projects for her firm.
Goal: maximize the amount of money that is available at the beginning of 2005. – (Returns on investments are on the next slide).
At most $500,000 in any investment Can invest in CDs, at 5% per year.
Financial Example

MIT and James Orlin © 2003
46
Return on investments (undiscounted dollars)
A B C D E
Jan. 2002
-1 - -1 -1 -
Jan. 2003
.4 -1 1.2 - -
Jan. 2004
.8 .4 - - -1
Jan. 2005
- .8 - 1.5 1.2

MIT and James Orlin © 2003
47
The LP formulation
-xA – xC – xD – xCD02 = -1.1
.4 xA – xB + 1.2 xD + 1.05 xCD02 – xCD03 = 0
.8 xA + .4 xB - xE + 1.05 xCD03 – xCD04 = 0
.8 xB + 1.5 xD + 1.2 xE + 1.05 xCD04 Max
s.t.
.8 xA + .4 xB - xE + 1.05 xCD03 – xCD04 = 0
0 xj .5 for j = A, B, C, D, E, CD02 CD03, and CD04
Financial Example

MIT and James Orlin © 2003
48
The verbal description of the optimum basis
1. Invest as much as possible in C and D in 2002. Invest the remainder in A.
2. Take the returns in 2003 and invest as much as possible in B. Invest the remainder in CDs
3. Take all returns in 2004 and invest them in E.
Note: if an extra dollar became available in years 2002 or 2003 or 2004, we would invest it in A or 2003CDs or E

MIT and James Orlin © 2003
49
A graph for the financial Problem
2002
2003
2004
2005
A
CD2003
E
$.40
$.80 $1.05
$1.20
•Any additional money in 2002 is invested in A.
•Any additional money in 2003 is invested in CD2003.
•Any additional money in 2004 is invested in E.

MIT and James Orlin © 2003
50
Shadow Price Interpretation
2002
2003
2004
2005
A
CD2003
E
$.40
$.80 $1.05
$1.20
Constraint: cash flow into 2004 is all invested.
Shadow price: -1.2
Interpretation: an extra $1 in 2004 would be worth $1.20 in 2005.
.8 xA + .4 xB - xE + 1.05 xCD03 – xCD04 = 0

MIT and James Orlin © 2003
52
Shadow Price Interpretation
2002
2003
2004
2005
A
CD2003
E
$.40
$.80 $1.05
$1.20
Constraint: cash flow into 2003 is all invested.
Shadow price: -1.26
Interpretation: an extra $1 in 2003 would be worth $1.26 in 2005.

MIT and James Orlin © 2003
53
Shadow Price Interpretation
2002
2003
2004
2005
A
CD2003
E
$.40
$.80 $1.05
$1.20
Constraint: all $1.1 million is invested in 2002.
Shadow price: -1.464
Interpretation: an extra $1 in 2002 would be worth $1.46 in 2005.
.4 x 1.05 x 1.2 + .8 x 1.2 = 1.464