mit energy initiative mit e i 1 towards a clean energy future: fracturing some energy fairy tales...
TRANSCRIPT
MIT Energy InitiativeMIT ei 1
Towards a Clean Energy Future: Fracturing Some Energy Fairy
TalesMelanie Kenderdine MIT Energy Initiative NESCAUM/Endicott House
August 17, 2011
MIT Energy InitiativeMIT ei 2
The Sky Really is Falling: Some Hard Truths

MIT Energy Initiative MIT Energy InitiativeMIT ei
United St
ates EUJapan
Russia
ChinaIndia
Middle East
Africa
C/S Americ
aBrazil
5801
4355
11691803
7222
1366 16861086 1311
437
6414
4519
11571978
11730
21152279
1409 1654
682
EIA forecasts a 30% global increase in CO2 emissions in next two
decades
60% of the CO2 emissions in 2010 will be from 6 countries: the US, Japan, Russia, India, Germany and China
49% of this increase will be from China
alone
68% of this increase will be from China,
India, the US, and the Middle East
Climate Change Challenge: Global CO2 Emissions*, 2010/2030
*million metric tons EIA 2009 IAEO
MIT Energy Initiative MIT Energy InitiativeMIT ei
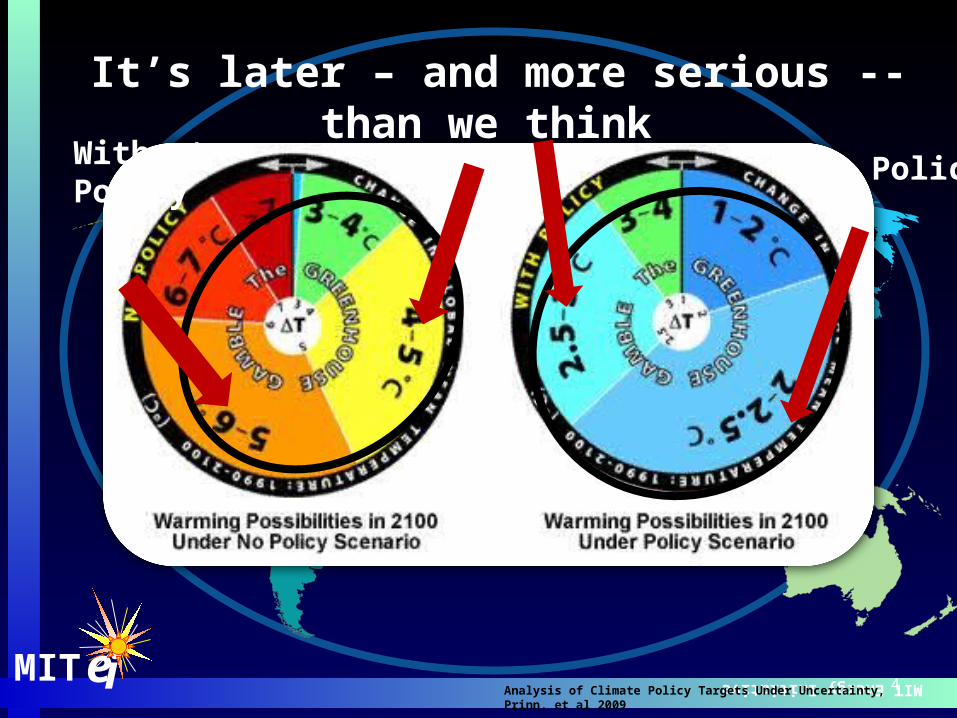
Without Policy With Policy
Analysis of Climate Policy Targets Under Uncertainty, Prinn, et al 2009 4
It’s later – and more serious -- than we think
E.S. Figure 1. America’s electricity comes from old powerplants1930s 1940s 1950s 1960s 1970s 1980s 1990s 2000s
MIT Energy Initiative
MIT ei
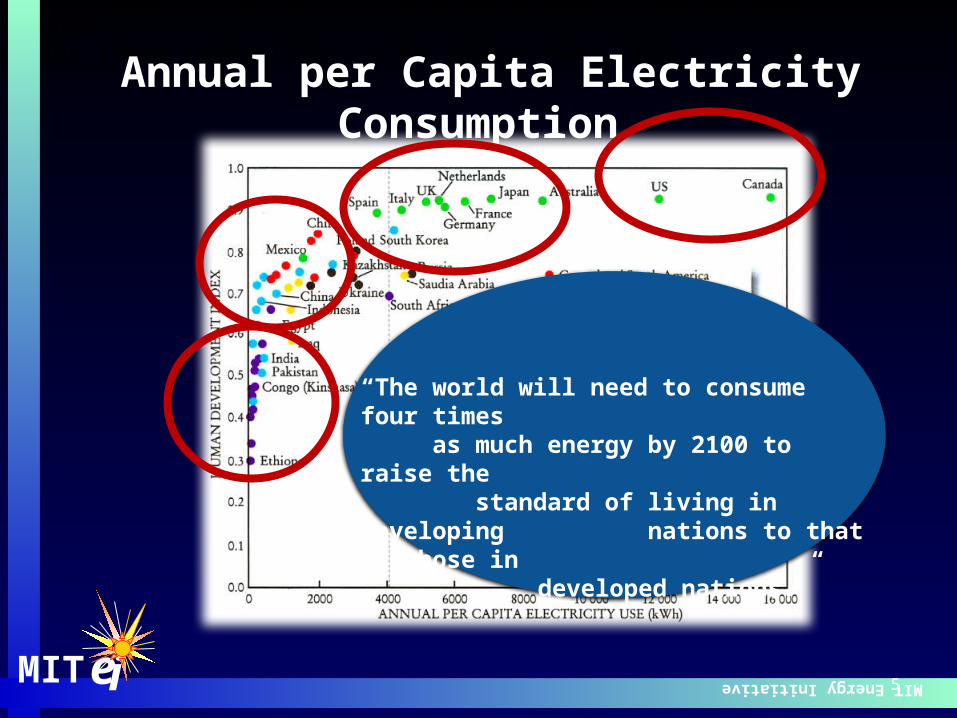
Annual per Capita Electricity Consumption
5
“The world will need to consume four times as much energy by 2100 to raise the standard of living in developing nations to that of those in
developed nations.”
MIT Energy Initiative
6
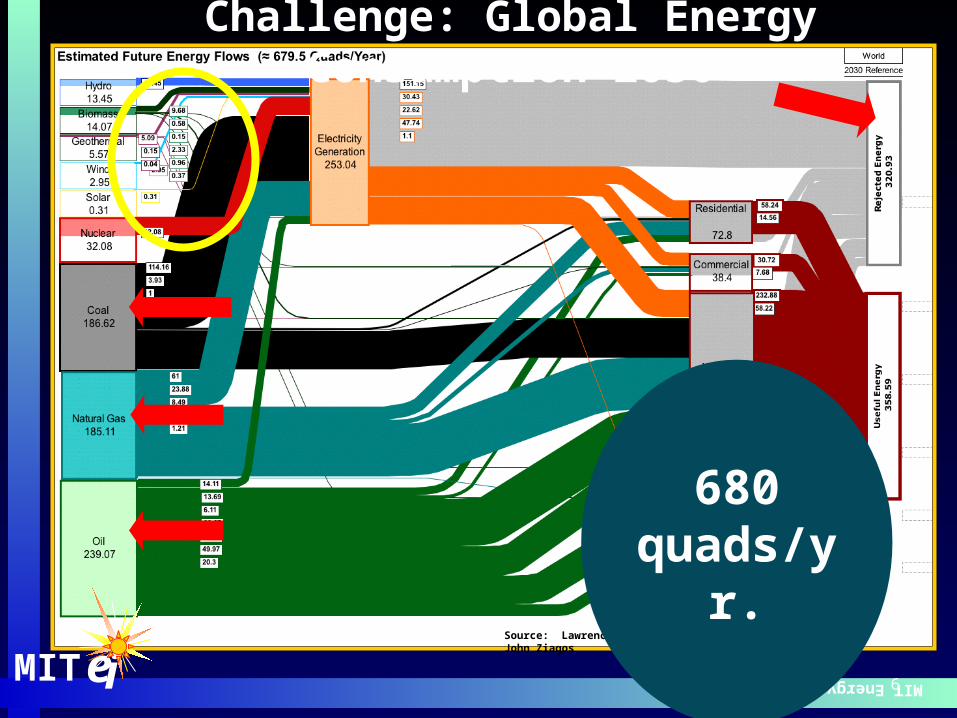
Challenge: Global Energy Consumption 2030
Source: Lawrence Livermore National Laboratory, John Ziagos
680 quads/yr.
MIT ei
MIT Energy InitiativeMIT ei
7
1850
1860
1870
1880
1890
1900
1910
1920
1930
1940
1950
1960
1970
1980
1990
2000
0%
10%
20%
30%
40%
50%
60%
70%
80%
90%
100%
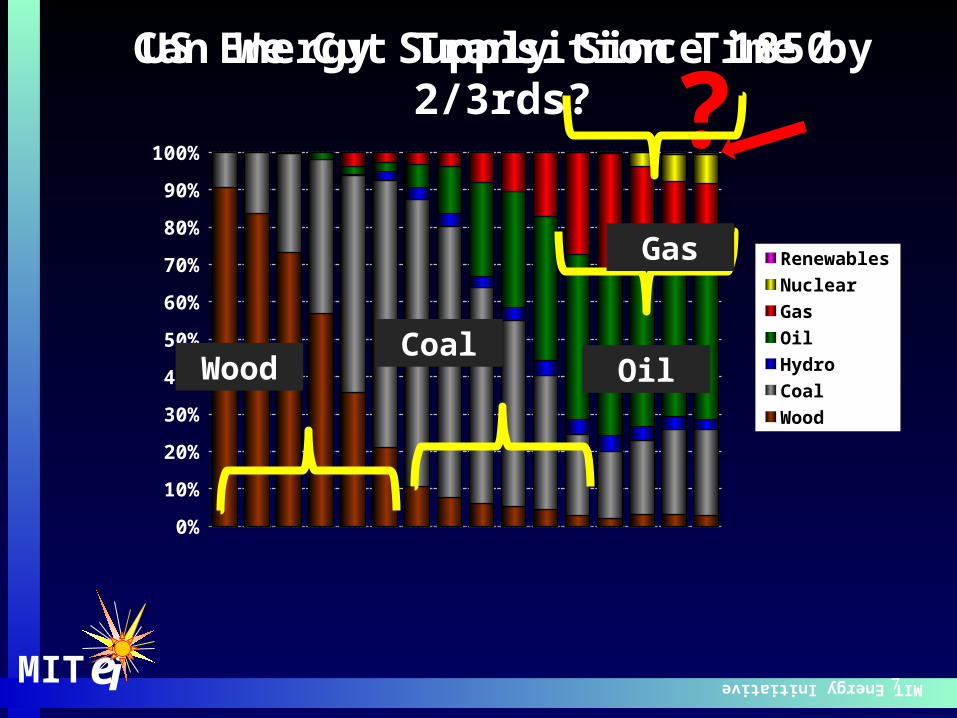
RenewablesNuclearGasOilHydroCoalWood
US Energy Supply Since 1850
?Can We Cut Transition Time by 2/3rds?
WoodCoal
Oil
Gas
MIT Energy InitiativeMIT ei 8
Spinning Straw into Gold (maybe)
9MIT Future of Natural Gas Study
9
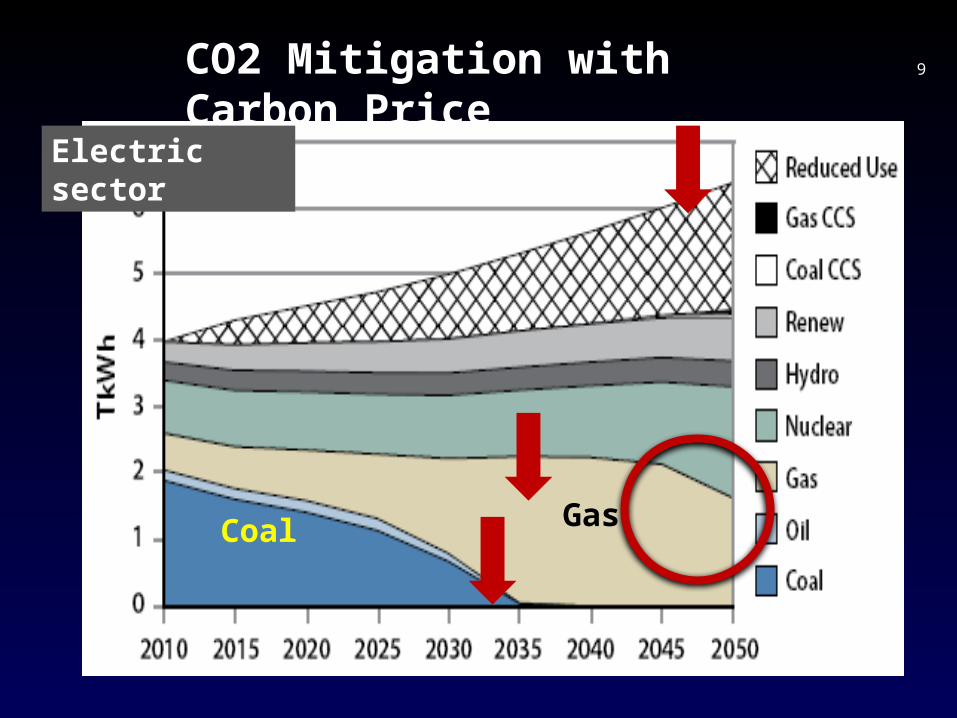
GasCoal
Electric sector
CO2 Mitigation with Carbon Price
MIT Energy InitiativeMIT ei 10
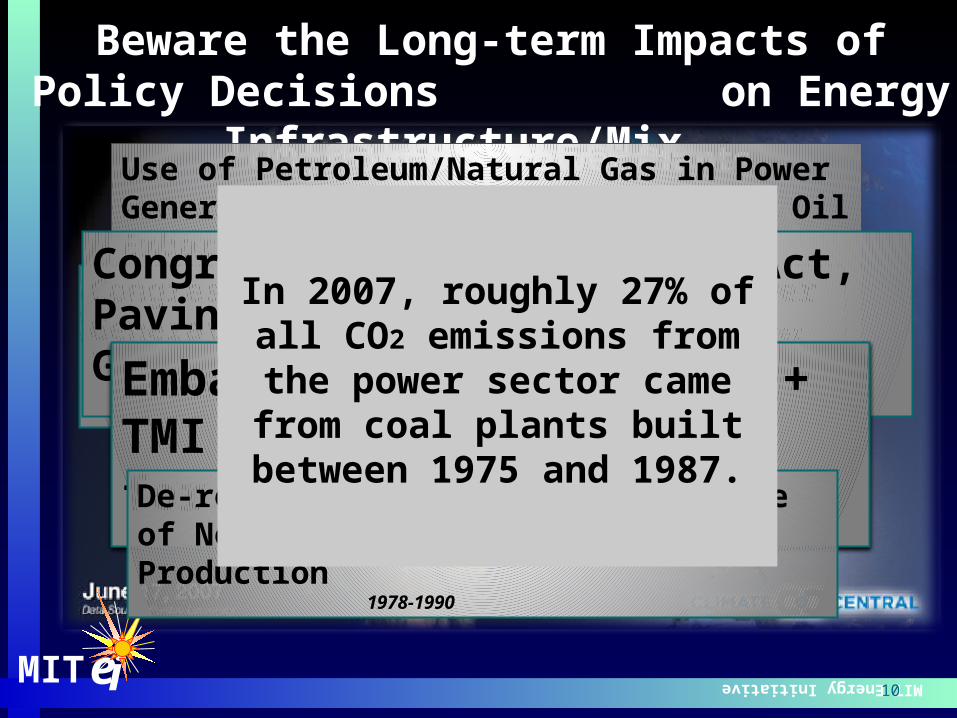
Beware the Long-term Impacts of Policy Decisions on Energy Infrastructure/Mix
Use of Petroleum/Natural Gas in Power Generation Hotly Debated Post-OPEC Oil EmbargoDebate has Chilling Effect on New Gas Plant Construction
US Congress, 1975-1977Congress Outlaws Natural Gas for Power Generation Spurs Construction of Coal-Fired Power Plants
Washington DC, 1978
Congress Repeals Fuel Use Act, Paving Way for New Gas Generation
Washington, DC, 1987
Embargo + Fuel Use Act + TMI = New Market Share for Coal Plants
Kenderdine Market Analysis, 2010
De-regulation of Natural Gas, Wave of New Technologies Spurs US Gas Production
1978-1990
In 2007, roughly 27% of all CO2 emissions from the power sector
came from coal plants built between 1975 and 1987.

Uprising Against the Ethanol Mandate
MIT Energy Initiative11
Federal Reserve Chairman Alan Greenspan Declares Impending Natural Gas Crisis
Fox News, June 23, 2003
ExxonMobil and Qatar Petroleum sign agreement for LNG supply Pipeline & Gas Journal, November 1, 2003
“I strongly support developing new LNG capacity in the United States.”
President Bush, July, 2004 election interview
Exxon to Buy XTO for $31 Billion in Bet on U.S. Gas
Bloomberg, December 14, 2009
Beware of the “Herd Mentality”
MIT ei
Exxon says N. America gas production has peaked Reuters, June 21, 2005
Huge natural gas field 'discovered' in TexasMajor energy firms seeing benefit in developing domestic sources
WorldNetDaily, June 21, 2005Up, Up and Away: Shale Gas Production Takes Off
Oil and Gas Investor, June 15 2008U.S. Shale Gas Plays Affecting Global LNG Market WSJ, November 3, 2009
12MIT Future of Natural Gas Study
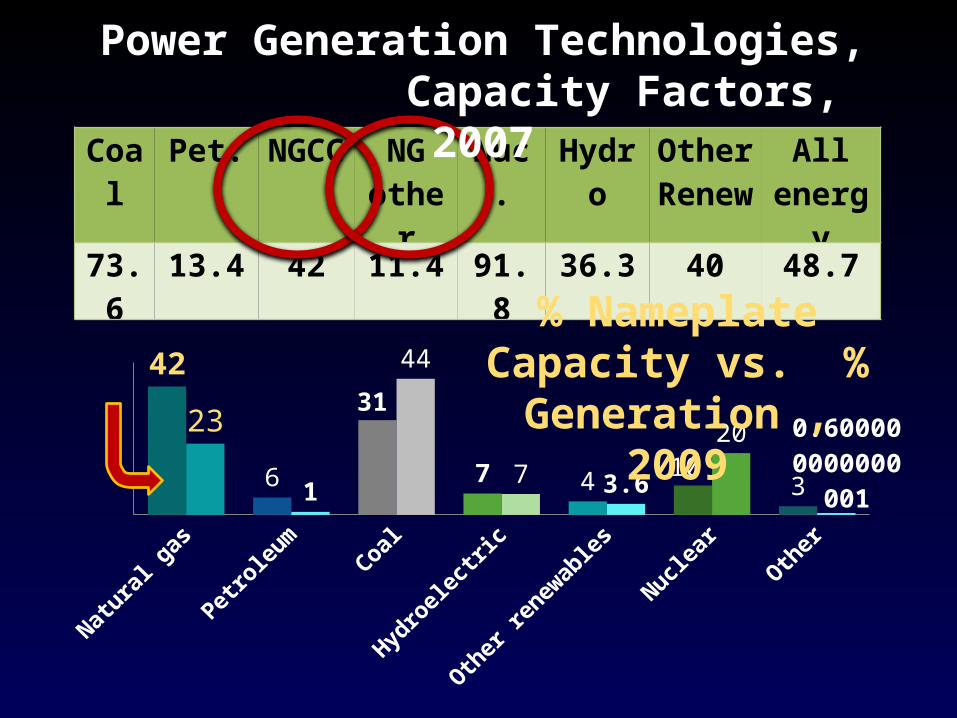
Coal Pet. NGCC NG other
Nuc. Hydro Other Renew
All energy
73.6 13.4 42 11.4 91.8 36.3 40 48.7
42
6
31
7 410
3
23
1
44
7 3.6
20
0.600000000000001
Power Generation Technologies, Capacity Factors, 2007
% Nameplate Capacity vs. % Generation ,
2009
13MIT Future of Natural Gas Study 13
TX LAMS
AROK
NM
AZ
CA
NV
OR
WA
ID
MT
WY
ND
SD
MN
IAWI
IL
MOTN
AL
FL
GA
SC
NC
VA
WV
OH
MI
IN
PA
MD
DE
NJ
NY
CT RI
MA
ME
NH
KY
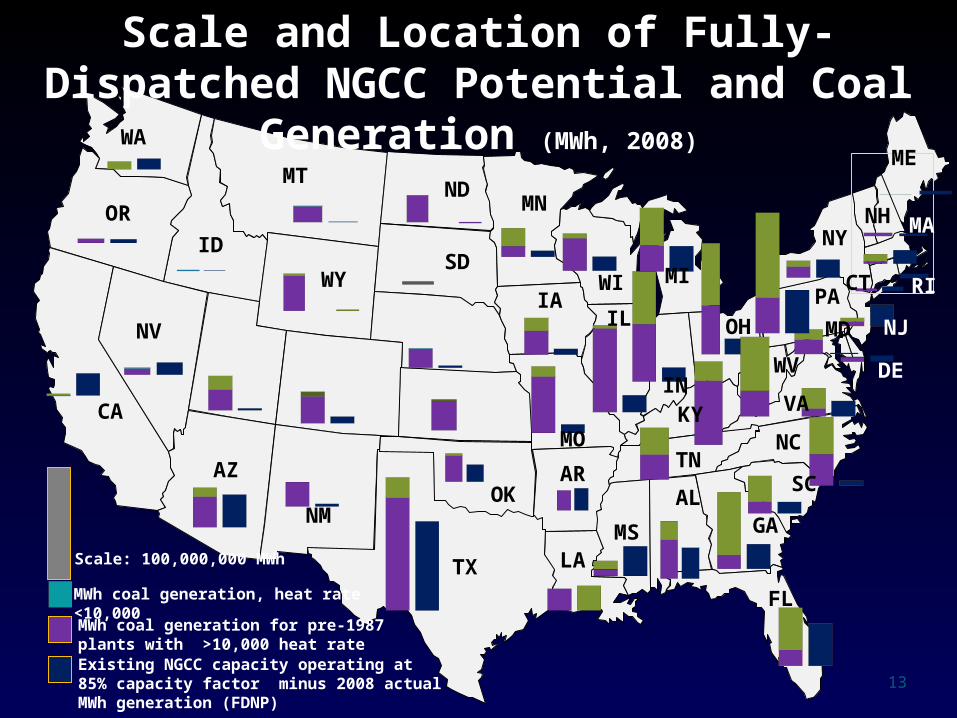
Scale: 100,000,000 MWh
MWh coal generation, heat rate <10,000
MWh coal generation for pre-1987 plants with >10,000 heat rate Existing NGCC capacity operating at 85% capacity factor minus 2008 actual MWh generation (FDNP)
Scale and Location of Fully-Dispatched NGCC Potential and Coal Generation (MWh, 2008)
14MIT Future of Natural Gas Study
14
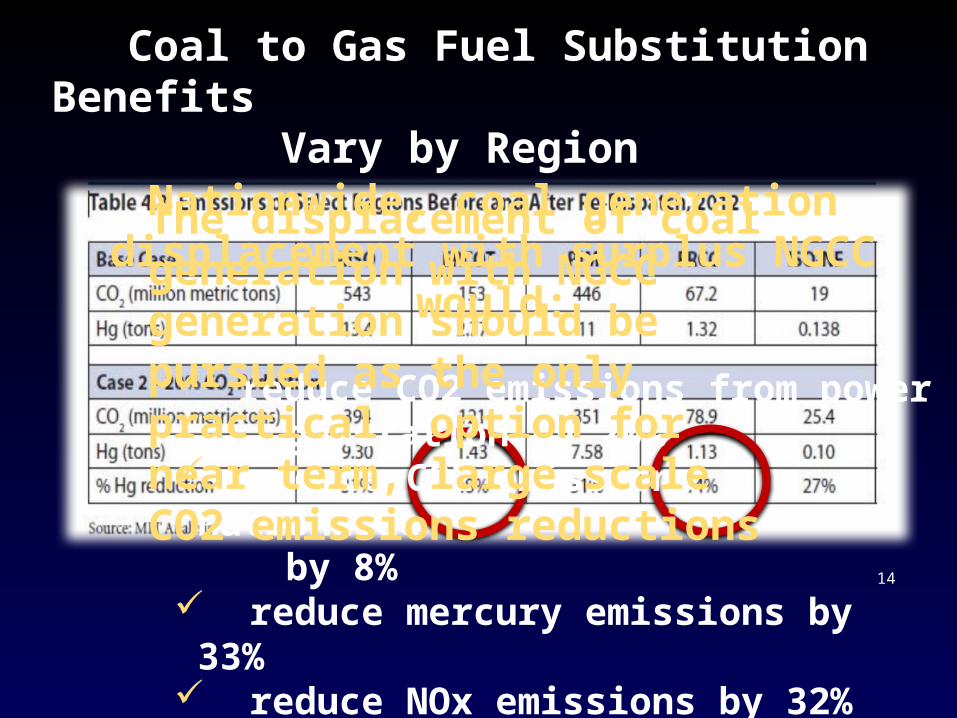
Coal to Gas Fuel Substitution Benefits Vary by Region
Nationwide, coal generation displacement with surplus NGCC would:
reduce CO2 emissions from power generation by 20% reduce CO2 emissions nationwide by 8% reduce mercury emissions by 33% reduce NOx emissions by 32% cost roughly $16 per ton/CO2
The displacement of coal generation with NGCC generation should be pursued as the only practical option for near term, large scale CO2 emissions reductions
MIT Energy InitiativeMIT ei 15
Spinning Gold into Straw: Unintended Consequences
Uprising Against the Ethanol Mandate
Senate Committee Ups Ethanol Mandate to 8 Billion Gallons by 2012
AAHSTO Journal, June 1, 2005
MIT Energy Initiative16
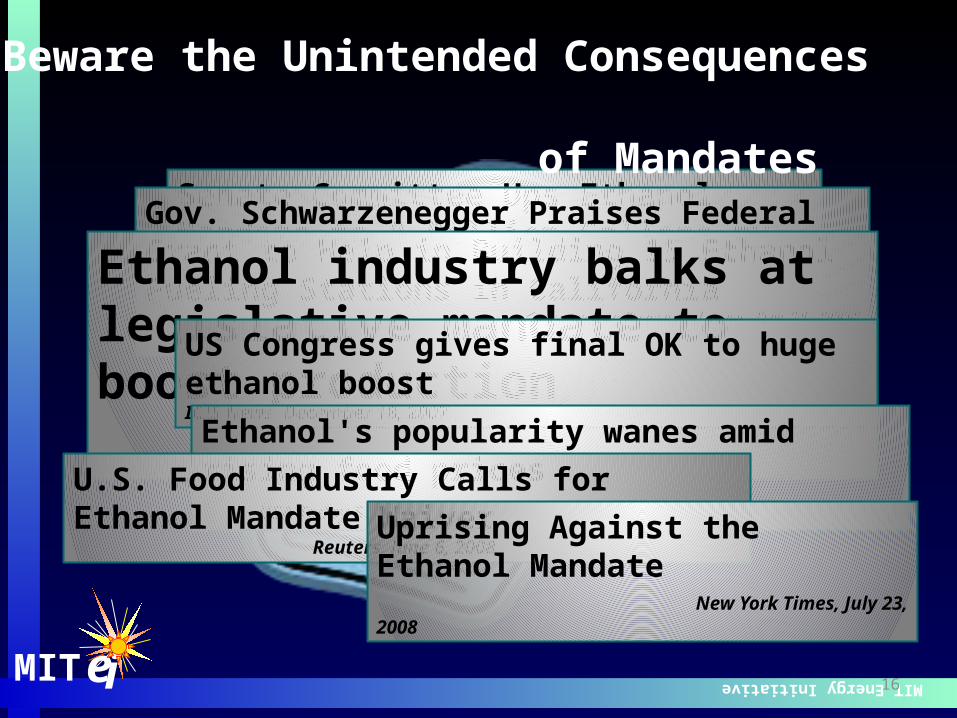
Beware the Unintended Consequences of Mandates
Gov. Schwarzenegger Praises Federal Grant to Help in Building 15 Ethanol Fueling Stations in California
Governor’s Press Release, Oct 31, 2006
Ethanol industry balks at legislative mandate to boost production
Renewable Fuels Assn., Dec 08, 2009US Congress gives final OK to huge ethanol boostICIS News, December 18, 2007
Ethanol's popularity wanes amid rising food prices USA Today 5.22.08U.S. Food Industry Calls for Ethanol Mandate
WaiverReuters, June 6, 2008
Uprising Against the Ethanol Mandate New York Times, July 23, 2008
MIT ei
17MIT Future of Natural Gas Study
17
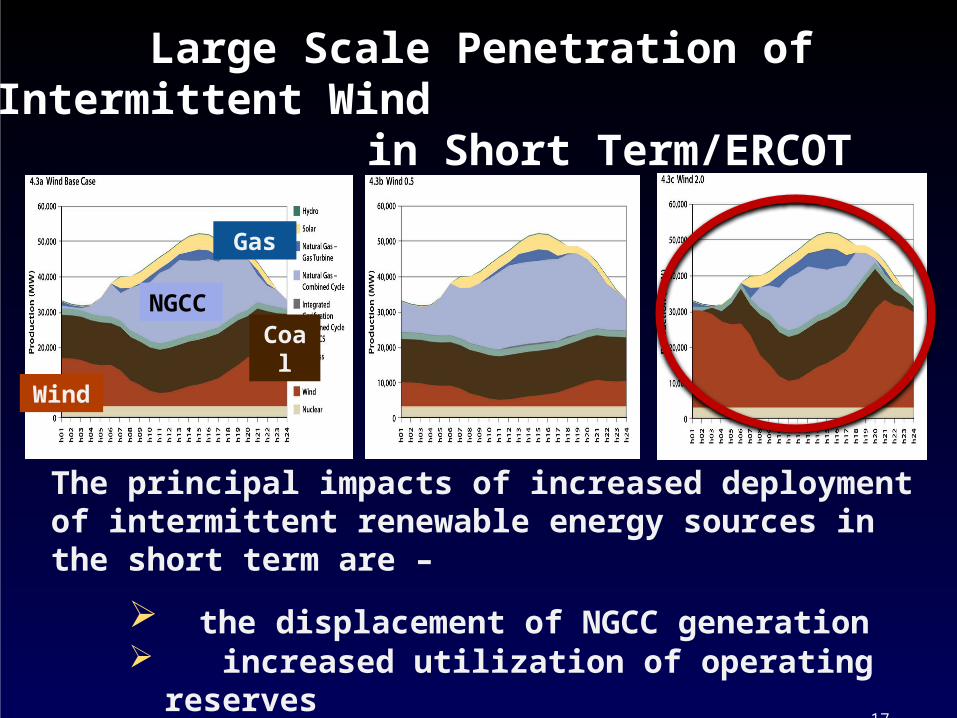
Coal
Wind
The principal impacts of increased deployment of intermittent renewable energy sources in the short term are –
the displacement of NGCC generation increased utilization of operating reserves more frequent cycling of mid-range or even base load plants.
Gas
NGCC
Large Scale Penetration of Intermittent Wind in Short Term/ERCOT
18MIT Future of Natural Gas Study
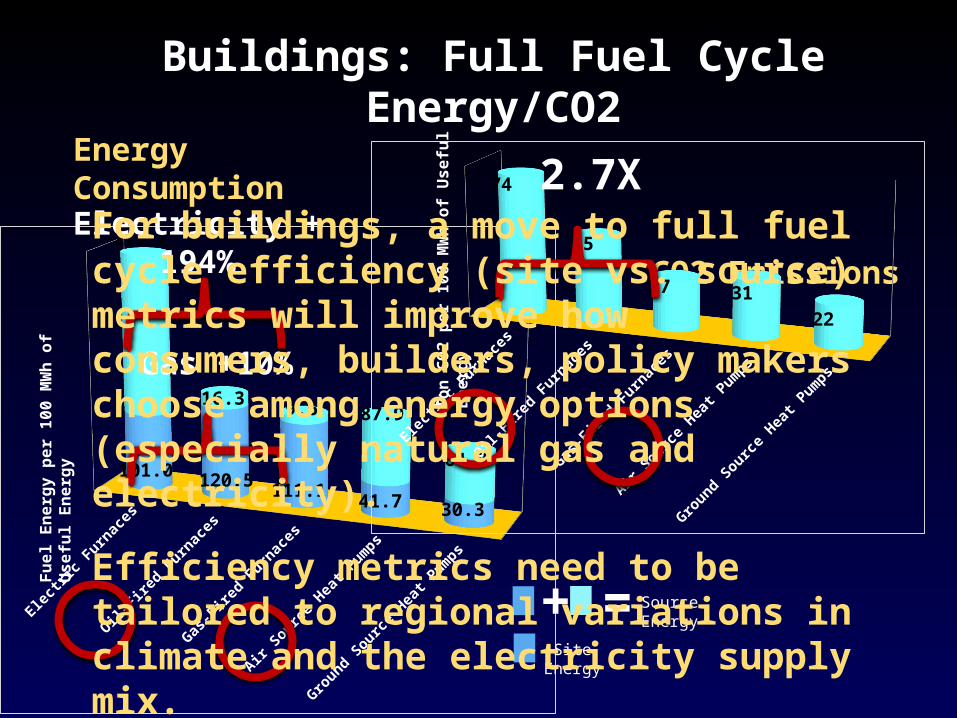
Buildings: Full Fuel Cycle Energy/CO2
Energy Consumption
CO2 Emissions
Electric Furnaces Oil-Fired
Furnaces Gas-Fired Furnaces Air Source
Heat Pumps Ground Source Heat
Pumps
101.0 120.5 111.1
41.7 30.3
213.2
16.3 9.6
87.9
64.0
Fuel
Ene
rgy
per 1
00 M
Wh
of U
sefu
l Ene
rgy
Site Energy
Source Energy
Electric Furnaces Oil-Fired
Furnaces Gas-Fired Furnaces Air Source
Heat Pumps Ground Source Heat
Pumps
74
45
27 31
22 Ton
CO2
per 1
00 M
Wh
of U
sefu
l Ene
rgy
Gas +10%
2.7X
+ =
Electricity + 194%For buildings, a move to full fuel cycle efficiency (site vs. source) metrics will improve how consumers, builders, policy makers choose among energy options (especially natural gas and electricity).
Efficiency metrics need to be tailored to regional variations in climate and the electricity supply mix.
MIT Energy InitiativeMIT ei 19
Forgetting the Moral of the Story
20MIT Future of Natural Gas Study
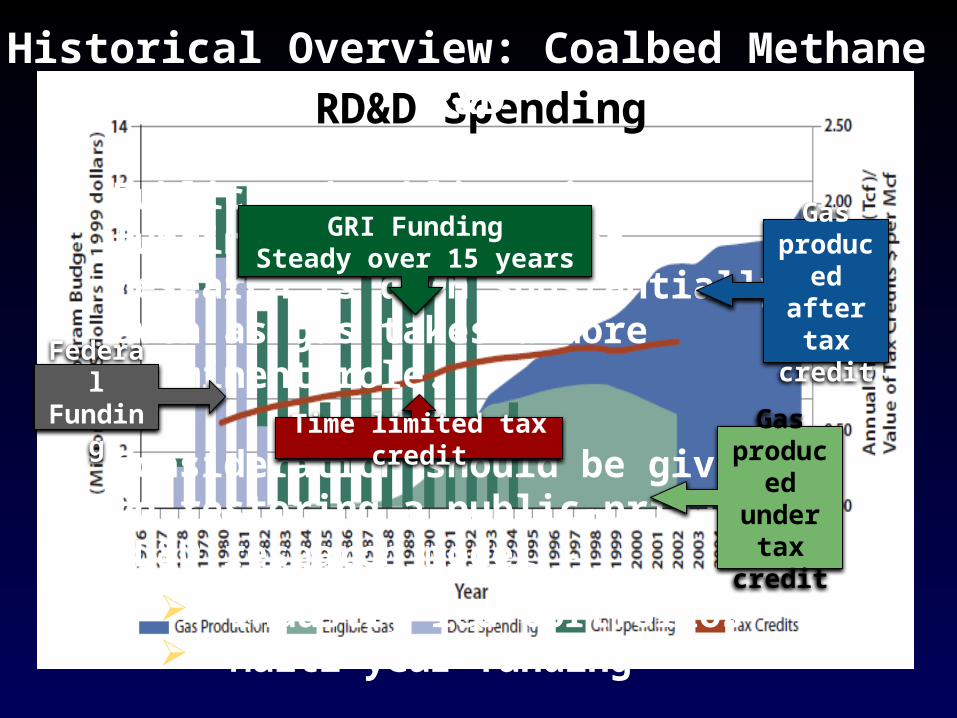
Public and public-private funding for natural gas research is down substantially even as gas takes a more prominent role.
Consideration should be given to restoring a public-private RD&D research model –
Industry-led portfolios Multi-year funding
Federal Funding
GRI FundingSteady over 15 years
Time limited tax credit Gas produced
under tax credit
Gas produced after tax
credit
RD&D SpendingHistorical Overview: Coalbed Methane R&D
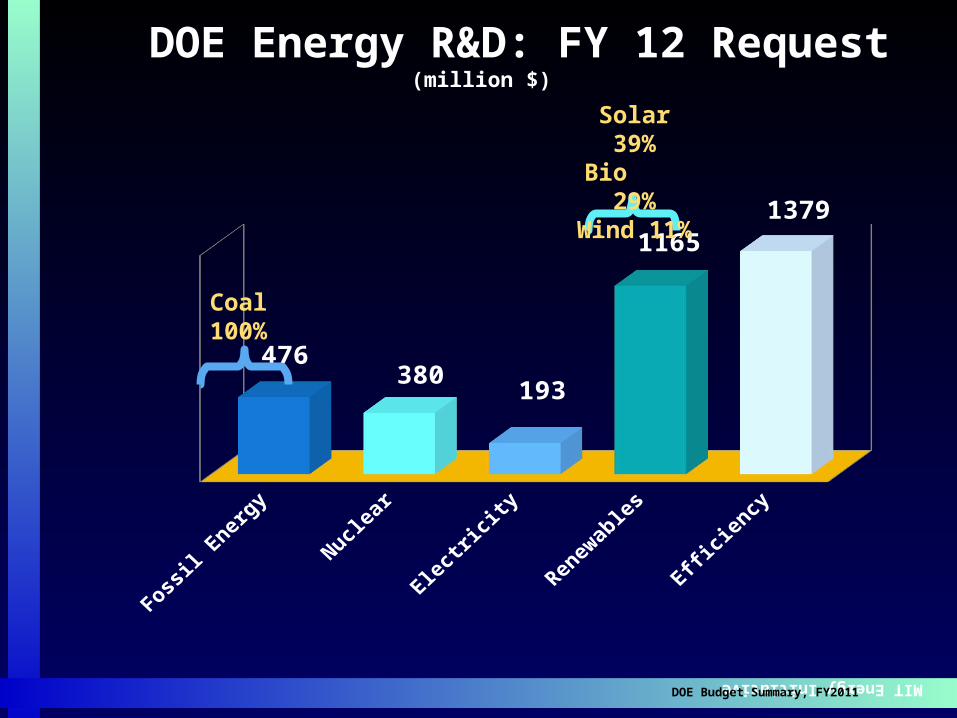
MIT Energy Initiative DOE Budget Summary, FY2011
DOE Energy R&D: FY 12 Request (million $)
Fossil Energy Nuclear Electricity Renewables Efficiency
476380
193
1165
1379
Coal 100%
Solar 39%Bio 29%Wind 11%

MIT Energy InitiativeMIT ei 22
Happily Ever After?
MIT Energy Initiative
MIT ei
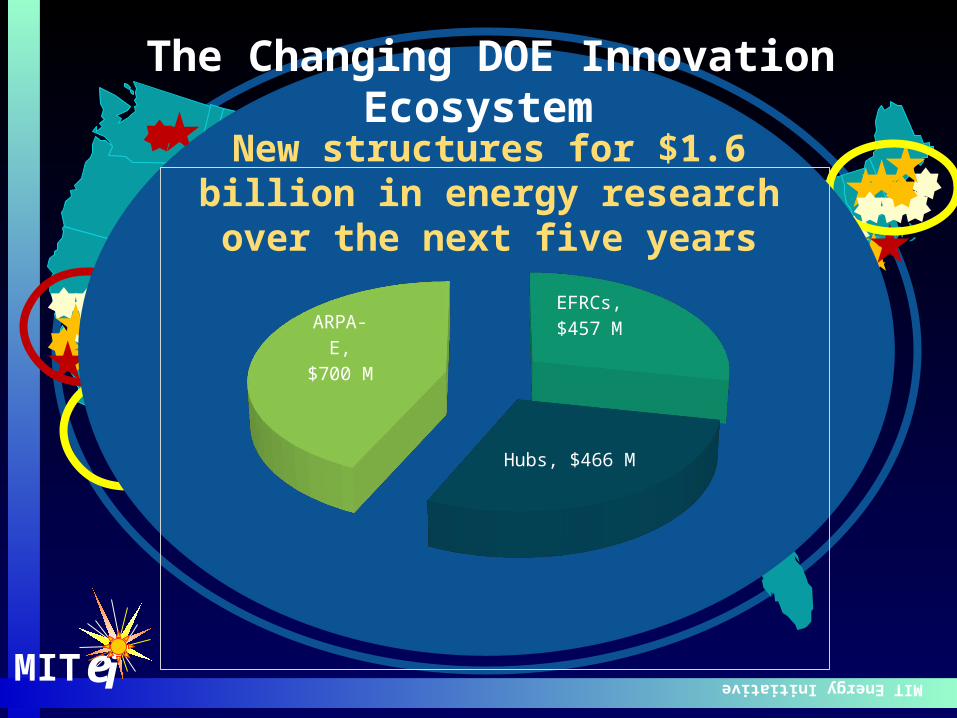
New structures for $1.6 billion in energy research over the next five
years
EFRCs, $457 M
Hubs, $466 M
ARPA-E, $700 M
The Changing DOE Innovation Ecosystem
Uprising Against the Ethanol Mandate
MIT Energy Initiative24
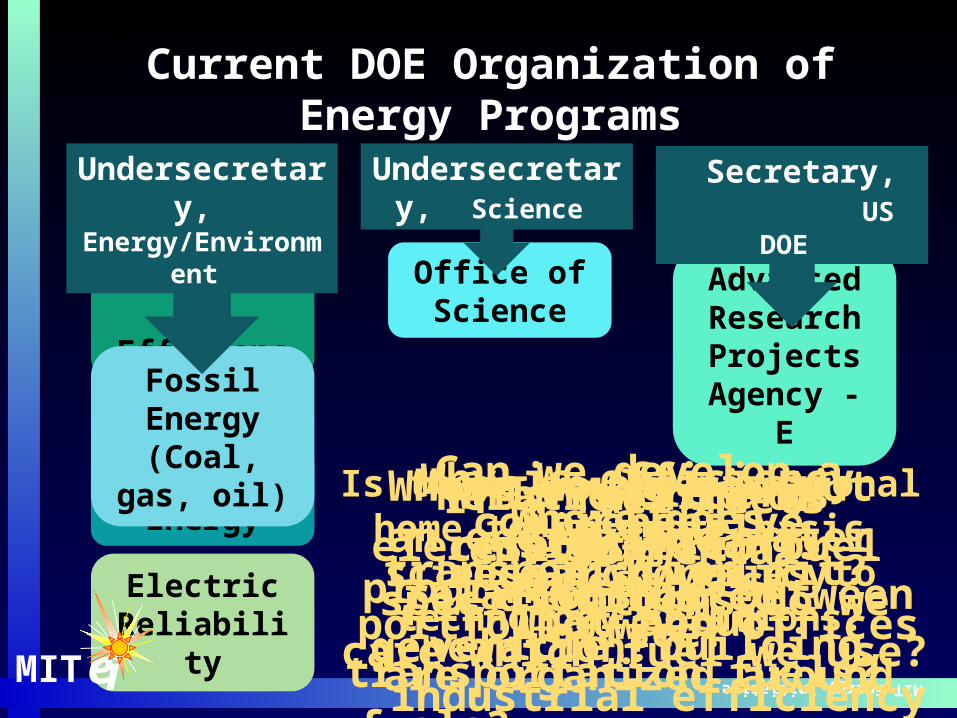
Current DOE Organization of Energy Programs
Renewables/ Efficiency
Nuclear Energy
Electric Reliability
Office of Science
Fossil Energy (Coal, gas, oil)
Undersecretary, Energy/Environment
Undersecretary, Science
Advanced Research Projects
Agency - E
Secretary, US DOE
MIT ei 24
Relationship of electricity to fuel sources?
Is there an organizational home to migrate basic science discoveries to
technology solutions?
Why is efficiency in the renewables office?
Is there any significant relationship between vehicle, building, industrial efficiency
technologies?
Where does transportation fit? What about transportation fuels?
Where would you put an energy and water program?
Which office is responsible for distributed generation?
If a fuel meets environmental specifications do we care which
fuel we use?
Can we develop a comprehensive research/policy
portfolio when offices are organized around fuels?
Uprising Against the Ethanol Mandate
MIT Energy Initiative25
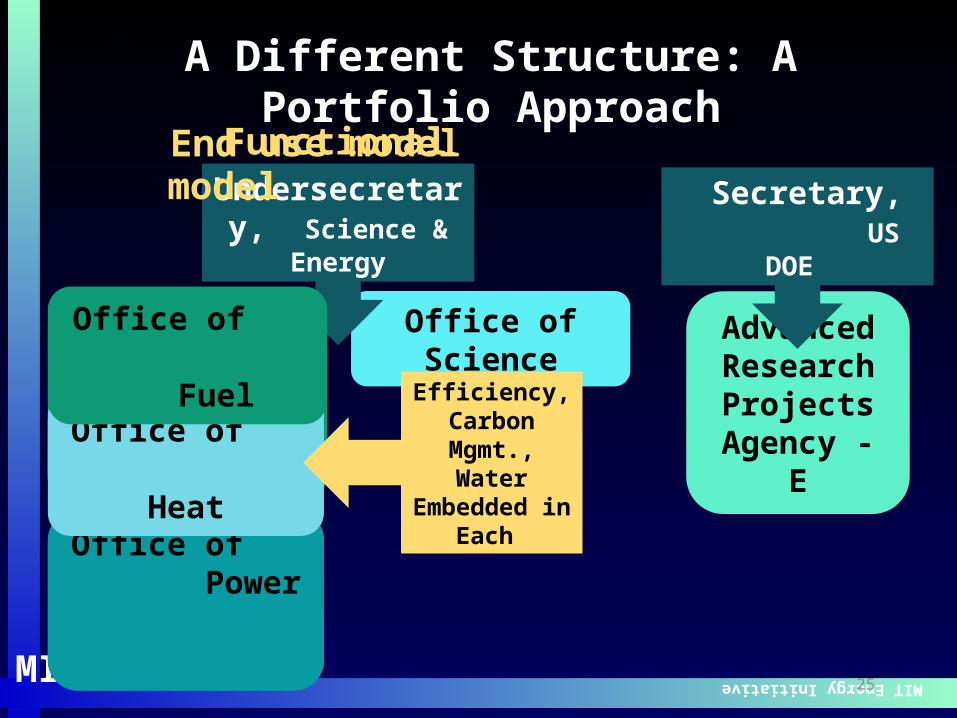
A Different Structure: A Portfolio Approach
Office of Science
Undersecretary, Science & Energy
Advanced Research Projects
Agency - E
Secretary, US DOE
MIT ei
Office of Transportation
Office of Buildings
Office of Industrial Energy
End use model
Functional model
Office of Power
Office of Heat
Office of Fuel
Efficiency, Carbon Mgmt.,
Water Embedded in
Each