mit icat capacity constraints and the dynamics of ... · range restrictions operation type...
TRANSCRIPT

MIT ICATMIT ICAT Capacity Constraints and the
Dynamics of Transition in the US Air Transportation
Prof. R. John Hansman
Alexandra Mozdzanowska, Philippe Bonnefoy
MIT Department of Aeronautics and Astronautics

MIT ICATMIT ICAT
Simple Model of NAS Capability Transition Dynamics
Demand
System Capability
System Behavior
Selected Actions
Stakeholder Awareness
Awareness BuildingProcess
Change Process
Catalytic Event
Public Awareness
Implementation Process
Historically Transition Driven by Catalytic Accidents
What is Capacity Analogue? Source: Alexandra Mozdzanaowska

Passenger Traffic by Region
Data source: ICAO, scheduled services of commercial air carriers (through 2005)
Scheduled Revenue Passenger-Kilometers by Region
0
200
400
600
800
1000
1200
1400
1970 1980 1990 2000 2010
RPK
(bill
ion)
North America
Europe
Asia andPacificLatin America& CaribbeanMiddle East
Africa

Trends in Aircraft Size
Data source: Form 41 Traffic data from Bureau of Transportation Statistics (US carriers)

MIT ICATMIT ICAT
Source: CAA statistical handbook of aviation, FAA statistical handbook of aviation, BTS
WWII NEPA Dereg
U.S. Public Use Airports

Public use airports decreasing at ~ 22 a yearCertificated airports decreasing at ~5 a year
U.S. Public Use & Certificated Airports

US Flight Delays US Flight Delays from 1995 to 2007from 1995 to 2007
Data source: FAA Operational Network (OPSNET)

MIT ICATMIT ICAT
Flight Cancellationsfrom 2000 to 2007 (by month)from 2000 to 2007 (by month)
Source: DOT, Air Travel Consumer Report, http://airconsumer.ost.dot.gov/ & BTS On Time Performance data
(top 11 airlines from 2000 to 2002, top 20 airlines from 2003 to 2007)
2000 2001 2002 2003 2004 2005 2006 2007
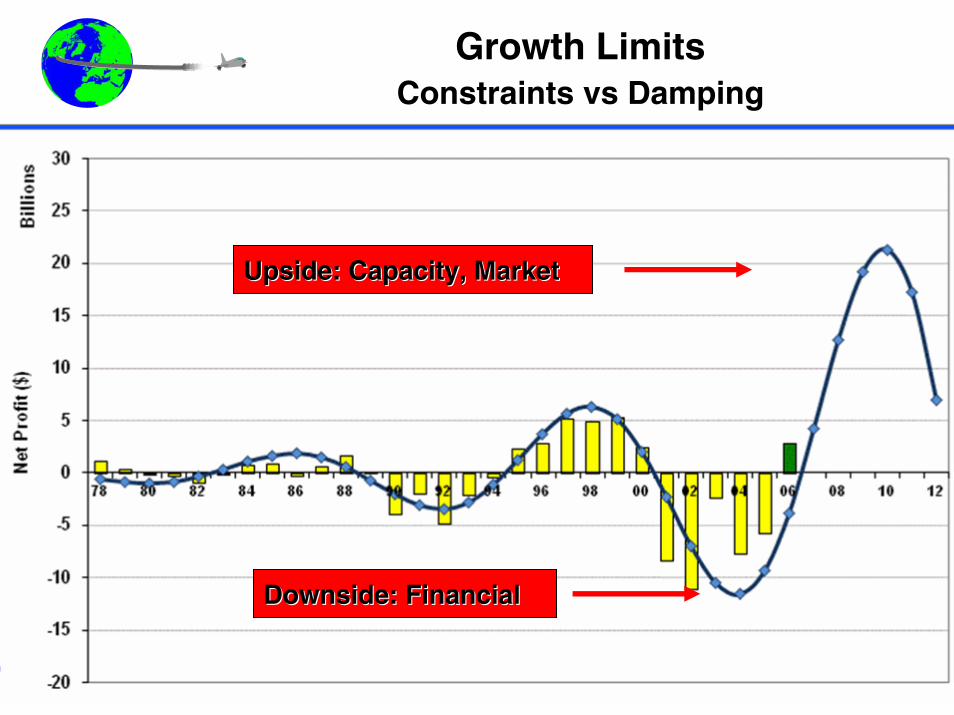
Growth LimitsConstraints vs Damping
Downside: FinancialDownside: Financial
Upside: Capacity, MarketUpside: Capacity, Market
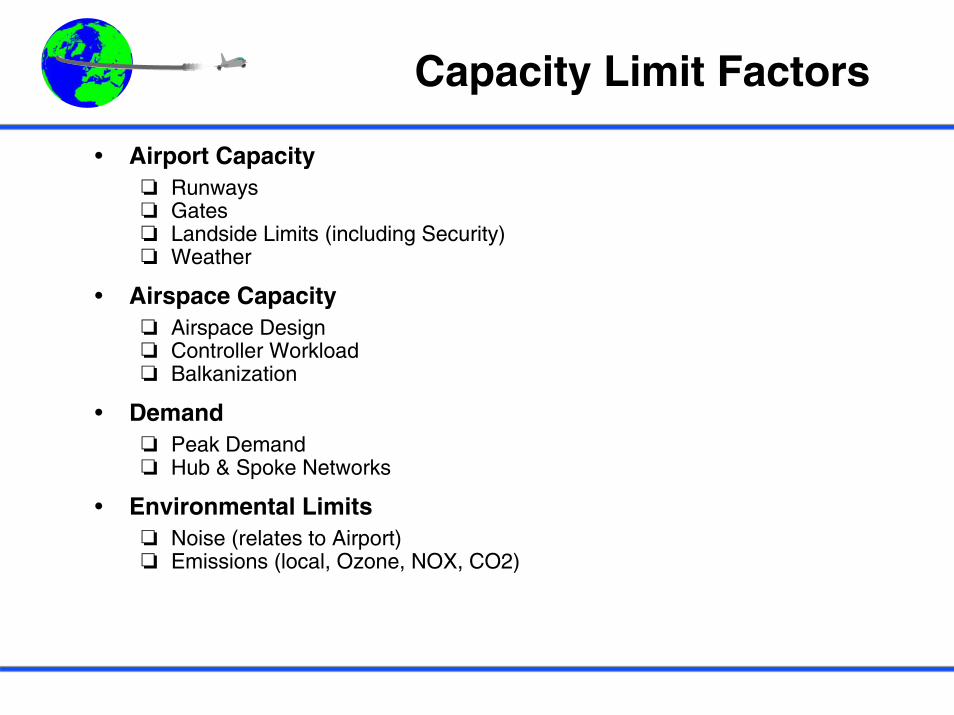
Capacity Limit Factors
Airport CapacityRunwaysGatesLandside Limits (including Security)Weather
Airspace Capacity Airspace DesignController WorkloadBalkanization
DemandPeak DemandHub & Spoke Networks
Environmental Limits Noise (relates to Airport)Emissions (local, Ozone, NOX, CO2)

Airport SystemCapacity Limit Factors
Arrival/Departure Routes
Runways
WeatherCapacity Variability
Gates
Downstream Constraints
Controller Workload
Landside LimitsTerminalsRoad Access
EnvironmentalCommunity NoiseEmissions
Safety
Adaptive System - Impedance Matching

Key Terminal System Flows(adaptive system - impedance matching)
GatesGates
AddAdd’’l Paxl PaxScreenScreen
Ckd BagCkd BagScreenScreen
CheckCheck--InInDropDrop--offoffParkingParking
AirsideAirside LandsideLandside
PassengersPassengers
Bags/CargoBags/Cargo
GroundGroundTransportTransport
PickPick--upupParkingParking
SecuritySecurityCheckCheck
GateGateBoardingBoarding
Bag ClaimBag Claim
SecuritySecurityPointPoint

MIT ICATMIT ICAT
Airport SystemCapacity Limit Factors
Arrival/Departure Routes
Runways
WeatherCapacity Variability
Gates
Downstream Constraints
Controller Workload
Landside LimitsTerminalsRoad Access
EnvironmentalCommunity NoiseEmissions
Safety

Separation Requirements for Arrival (Same Runway)
Wake Turbulence RequirementRadar Separation Requirements
Visual Separation RequirementsPilots Discretion
Preceding arrival must be clear of runway at touchdownRunway Occupancy Time Limit
Leading Aircraft
Heavy Large SmallHeavy 4 5 5B757 4 4 5Large 3(2.5) 3(2.5) 4Small 3(2.5) 3(2.5) 3(2.5)
Trailing Aircraft
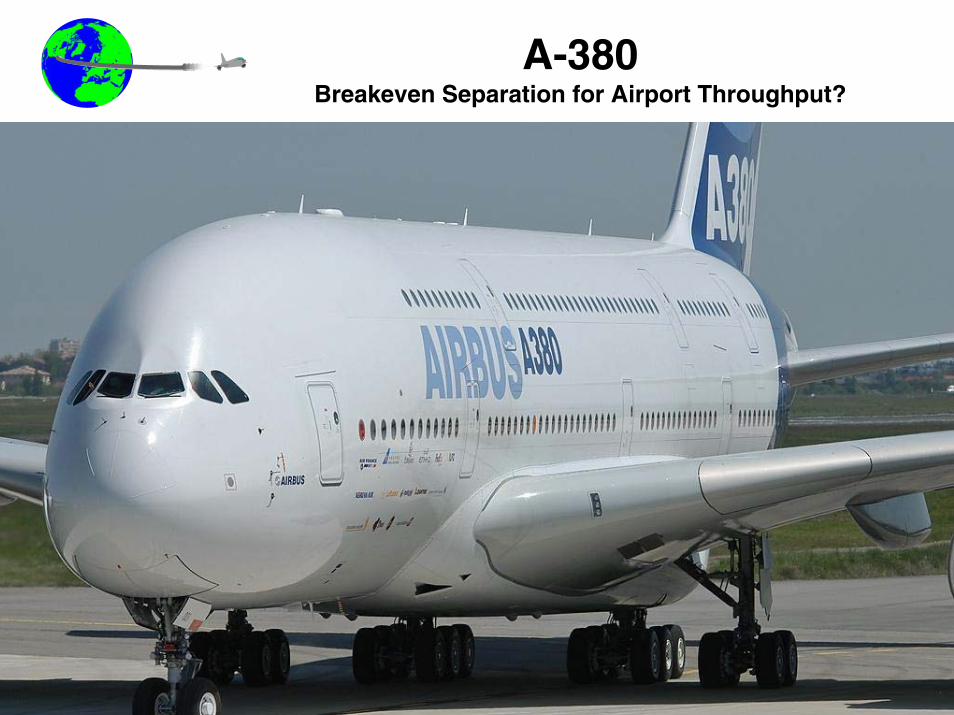
A-380Breakeven Separation for Airport Throughput?

Airport SystemCapacity Limit Factors
Arrival/Departure Routes
Runways
WeatherCapacity Variability
Gates
Downstream Constraints
Controller Workload
Landside LimitsTerminalsRoad Access
EnvironmentalCommunity NoiseEmissions
Safety

0
20
40
60
80
100
120
0 20 40 60 80 100 120
Departures per Hour
Arr
ival
s pe
r Hou
r
ASPM - April 2000 - Instrument Approaches
Calculated IMC Capacity
Reduced Rate (ATL)84,90
ASPM - April 2000 - Visual Approaches
Calculated VMC Capacity
Optimum Rate (ATL)100,100
Each dot represents one hour of actual traffic
during April 2000
Airport Capacity EnvelopesAtlanta (ATL)
VFR
IFR
Source: FAA Benchmark Data

Airport Capacity EnvelopesBoston (BOS)
0
10
20
30
40
50
60
70
80
90
100
0 10 20 30 40 50 60 70 80 90 100
Departures per Hour
Arr
ival
s pe
r Hou
ASPM - Apr 2000 - Visual Approaches
ASPM - Jul/Aug 2000 - VisualApproachesCalculated VMC Capacity
Optimum Rate (BOS)
68,50
0
10
20
30
40
50
60
70
80
90
100
0 10 20 30 40 50 60 70 80 90 100
Departures per Hour
Arr
ival
s pe
r Hou
ASPM - Apr 2000 - Instrument ApproachesASPM - Jul/Aug 2000 - Instrument ApproachesCalculated IMC CapacityReduced Rate (BOS)
44,44
VFR
IFR
Source: FAA Benchmark Data

Variable Capacity Effects
100000080000060000040000020000000
10
20
30
40
50
60
Total Operations (CY95)
SFO
LGA EWR STL
LAX
ORD
DFW
ATLBOS
JFK
PHX
LAS
SJU
HNLPIT DEN
CLT
IAH
MEM
Data from FAA Capacity Office, CY95
1995 Delays vs OperationsFrom John Andrews, MIT Lincoln Lab

QuickTime™ and aMicrosoft Video 1 decompressorare needed to see this picture.

Network Effects and Delay Propagation
Source: ASDI data

Delays at Chicago O’Hare
Source: FAA OPSNET data
ORD: Total Delays
0
2000
4000
6000
8000
10000
12000
14000
16000
Jan Feb Mar Apr May Jun Jul Aug Sep Oct Nov Dec
Month
Tota
l Del
ays 2004
2003
2002
2001
2000

Flight Delays Reemerging
Source: FAA OPSNET data
OPSNET National Delays
0
10000
20000
30000
40000
50000
60000
Jan Feb Mar Apr May Jun Jul Aug Sep Oct Nov Dec
Month
Tota
l Del
ays 2004
2003
2002
2001
2000
24
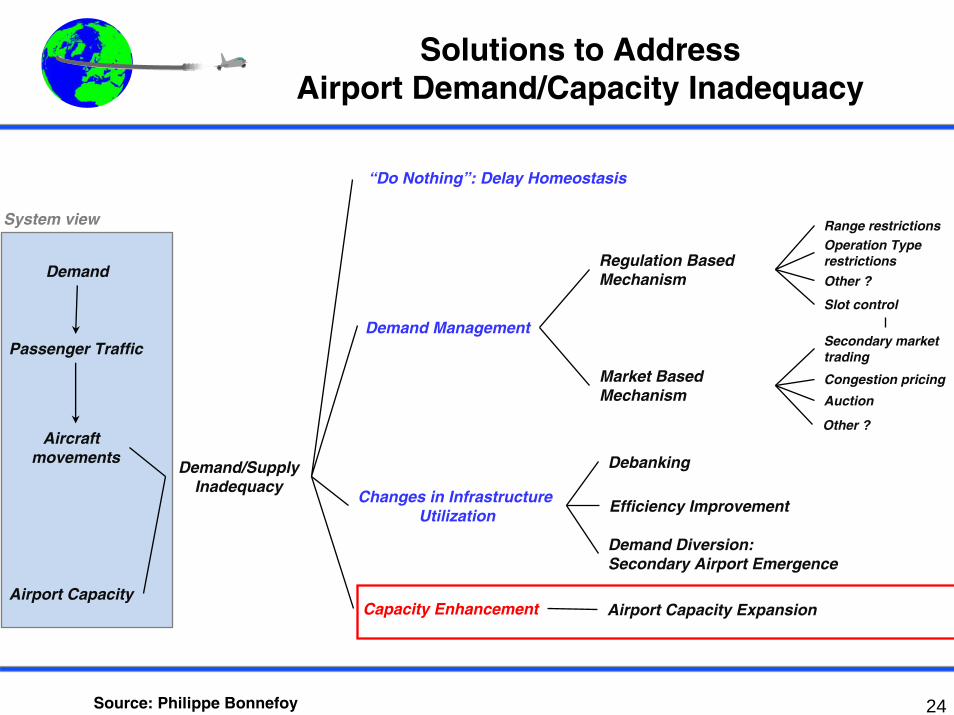
Solutions to Address Airport Demand/Capacity Inadequacy
Demand
Airport Capacity
Demand/Supply Inadequacy
Demand Management
“Do Nothing”: Delay Homeostasis
Changes in Infrastructure Utilization
Capacity Enhancement
Regulation Based Mechanism
Market Based Mechanism
Airport Capacity Expansion
Demand Diversion: Secondary Airport Emergence
Debanking
Passenger Traffic
Aircraft movements
Range restrictionsOperation Type restrictions
Slot control
Secondary market trading
Auction
Congestion pricing
System view
Efficiency Improvement
Other ?
Other ?
Source: Philippe Bonnefoy

Concrete Solution (BOS)

Current Airport Expansion Projects
Top 30 Congested Airports in 2005 Expansion Projects
SEA: 39 years +46% improvement
BOS: 37 years
ATL: ~15 years33% improvement
STL: 8 years48% improvement
IAD: ~10 yearsLAX: ~10 years
PHL: 3 yearsORD: 2 years

Solution Refinement Loop
Multi-Stakeholder Transition Modelwith Implementation Barriers
Demand
System Capability
Decision Making
Collective Decisions
Stakeholder Awareness
ObjectiveFormation
StakeholderValues, Context
Capability Options
Negotiation Loop
Awareness BuildingProcess
Change Process
Catalytic Event
Public Awareness
Safety and Environmental Approval Processes
Implementation Process
Stakeholder Preferences
StakeholderDecisions
Delays
Source: Alexandra Mozdzanaowska

Environmental Limitations
Intergovernmental Panel on Climate Change
Noise Emissions
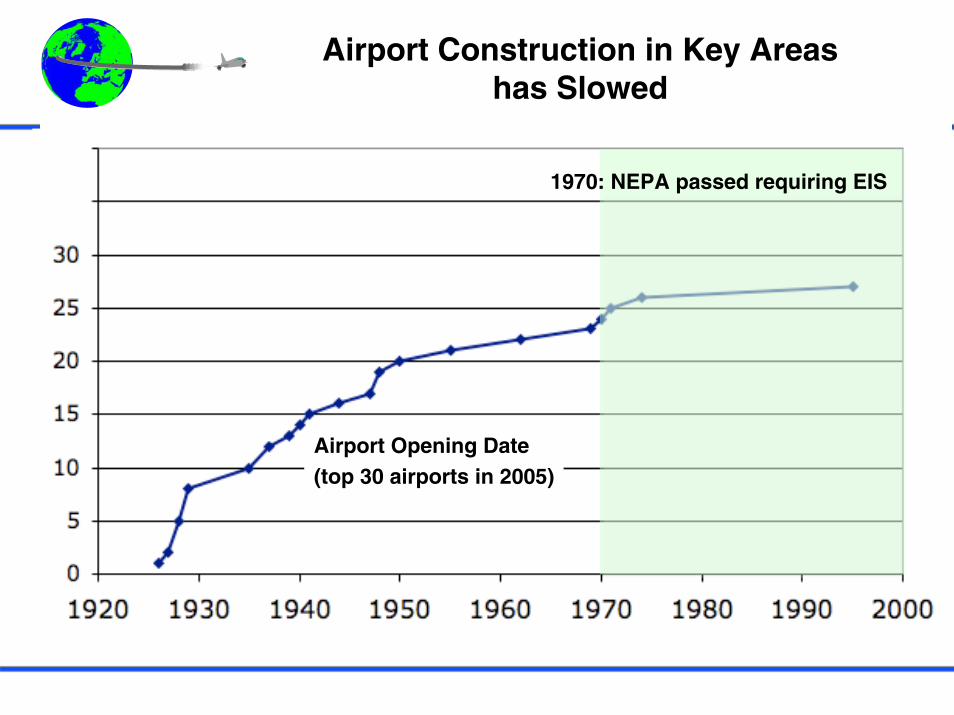
Airport Construction in Key Areas has Slowed
Airport Opening Date (top 30 airports in 2005)
1970: NEPA passed requiring EIS

30
Year: 2000 Year: 2006
Data source: [Delay data: FAA Operational Network, OPSNET], [Capacity improvement: FAA Operational Evolution Plan OEP].
Capacity Improvement at OEP Airports(2000 vs 2006 Delay Rankings)
Airport Airport Percentage of OEP new runway projectcode name operations (date completion/
delayed capacity benefit)LGA LaGuardia 15.6%EWR Newark 8.1%ORD Chicago 6.3%SFO San Francisco 5.7%BOS Boston 4.8% 2006 / +2%PHL Philadelphia 4.5%JFK Kennedy 3.9%ATL Atlanta 3.1% 2006 / +33%IAH Houston 2.8%DFW Dallas/Ft.Worth 2.4%PHX Phoenix 2.2%LAX Los Angeles 2.2%IAD Dulles 2.0%STL St. Louis 1.8% 2006 / +48 %DTW Detroit 1.8%CVG Cincinnati 1.5% 2005 / +12 %MSP Minn./St. Paul 1.3% 2005 / +19 %MIA Miami 1.1%SEA Seattle 1.0% 2008 / +46 %LAS Las Vegas 0.8%DCA Reagan National 0.8%BWI Balt.-Wash. Intl 0.7%MCO Orlando 0.6%CLT Charlotte 0.6% 2008 / +11%PIT Pittsburgh 0.4%SAN San Diego 0.3%DEN Denver 0.2%SLC Salt Lake City 0.2%TPA Tampa 0.2%MEM Memphis 0.0%
Airport Code Airport namePercentage of
operations delayed
OEP new runway project (date completion / capacity benefit)
EWR Newark 12.0%LGA LaGuardia 9.1%ORD Chicago 6.9% TBDJFK Kennedy 6.0%PHL Philadelphia 5.6% 2007 / Delay ReductionATL Atlanta 5.1% 2006 / 33%BOS Boston 2.9% 2006 / Delay ReductionSFO San Francisco 2.9%IAH Houston 2.5%LAS Las Vegas 2.4%CLT Charlotte 1.3%PHX Phoenix 1.1%DFW Dallas/Ft.Wort 0.9%DTW Detroit 0.9%MDW Midway 0.9%IAD Dulles 0.6% 2008 / 12%DCA Reagan Nation 0.6%SLC Salt Lake City 0.4%LAX Los Angeles 0.4% 2007 / NASEA Seattle 0.4% 2008 / 46%MIA Miami 0.4%
MEM Memphis 0.4%MSP Minn./St. Paul 0.3%CVG Cincinnati 0.3%DEN Denver 0.3%BWI Balt.-Wash. Int 0.2%MCO Orlando 0.2%PIT Pittsburgh 0.1%STL St. Louis 0.0% 2006 / 48%

31
Runway, Runway Extensions, Reconfigurations or New Airports with Environmental Impact Statements or Planning
Studies Underway
Data source: [Capacity improvement: FAA Operational Evolution Plan OEP].

MIT ICATMIT ICAT
32
Solutions to Address Airport Demand/Capacity Inadequacy
Demand
Airport Capacity
Demand/Supply Inadequacy
Demand Management
“Do Nothing”: Delay Homeostasis
Changes in Infrastructure Utilization
Capacity Enhancement
Regulation Based Mechanism
Market Based Mechanism
Airport Capacity Expansion
Demand Diversion: Secondary Airport Emergence
Debanking
Passenger Traffic
Aircraft movements
Range restrictionsOperation Type restrictions
Slot control
Secondary market trading
Auction
Congestion pricing
System view
Efficiency Improvement
Other ?
Other ?
Source: Philippe Bonnefoy

MIT ICATMIT ICAT
Emergence of Secondary Airports“Southwest Effect”
SFO
LAX
MSP
DAL
HOU
DTWORD
STL
CVG
ATL
DCA
PHL
LGA / JFK / EWR
BOS
MIA
PHX
Original Core airport
Secondary airport
BUR
OAK/SJC
ONT
SNA
FLL
BWI ISP
MHT
MDWPVD
LGB
Emerged Core airport
DFW
IAH
IAD

New YorkRegional Airport System

”Flow” of departure and arrivals: - morning (dep.>arr., dep. to west coast)- rebalances throughout the day with arrivals from west coast
move back closer to ½ - ½ with departures to Europe in the evening
New York Regional Airport System - Temporal Demand
0
20
40
60
80
100
120
140
160
180
0 20 40 60 80 100 120 140 160 180
Departure Rate (per hour)
Arr
ival
Rat
e (p
er h
our)
00:00 - 06:00
6:00 - 10:00
10:00 - 14:00
14:00 - 18:0018:00 - 22:00
22:00 - 00:00
Regional airport system: Five airports combined
Terminal areas at capacity (closer to capacity) in the 16:00 – 20:00 time window
Philippe Bonnefoy: Analysis of Pareto Frontiers of Multi-Airport Systems

MIT ICATMIT ICAT
New York SDO OperationsWake Implications of Tight RNP Routes ?

MIT ICATMIT ICAT
Airport SystemCapacity Limit Factors
Arrival/Departure Routes
Runways
WeatherCapacity Variability
Gates
Downstream Constraints
Controller Workload
Landside LimitsTerminalsRoad Access
EnvironmentalCommunity NoiseEmissions
Safety

38
Solutions to Address Airport Demand/Capacity Inadequacy
Demand
Airport Capacity
Demand/Supply Inadequacy
Demand Management
“Do Nothing”: Delay Homeostasis
Changes in Infrastructure Utilization
Capacity Enhancement
Regulation Based Mechanism
Market Based Mechanism
Airport Capacity Expansion
Demand Diversion: Secondary Airport Emergence
Debanking
Passenger Traffic
Aircraft movements
Range restrictionsOperation Type restrictions
Slot control
Secondary market trading
Auction
Congestion pricing
System view
Efficiency Improvement
Other ?
Other ?
Source: Philippe Bonnefoy
Solution Refinement Loop
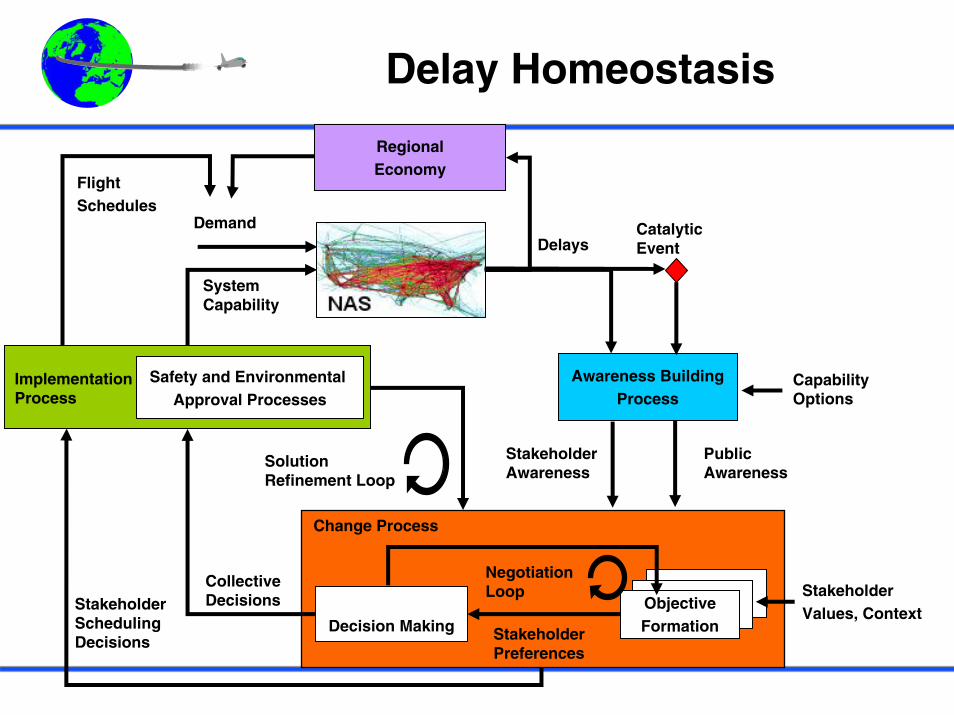
Delay Homeostasis
Demand
System Capability
Decision Making
Collective Decisions
Stakeholder Awareness
ObjectiveFormation
StakeholderValues, Context
Capability Options
Negotiation Loop
Awareness BuildingProcess
Change Process
Catalytic Event
Public Awareness
Stakeholder Preferences
StakeholderSchedulingDecisions
Delays
FlightSchedules
Safety and Environmental Approval Processes
Implementation Process
RegionalEconomy

Crisis Driven TransitionCapacity Crisis Stimulus?
Demand
System Capability
System
Selected Actions
Stakeholder Awareness
Awareness BuildingProcess
Change Process
Catalytic Event
Public Awareness
Implementation Process
Historically Transition Driven by Catalytic Accidents
What is Capacity Analogue?Source: Alexandra Mozdzanaowska

LGA Air 21 Impact
Source: William DeCota, Port Authority of New York
LaGuardia Airport
020406080
100120140160180200
06 07 08 09 10 11 12 13 14 15 16 17 18 19 20 21 22 23
Time of Day
Historic Movements AIR-21 Induced Svc.
Maximum Hourly Operations Based on Current Airspace & ATC Design

Classic Delay vs Demand Curve
DEMAND
DELAY
CapacityLimit
LinearRegion
Non-LinearRegion

LGA
Source: William DeCota, Port Authority of New York
DEMAND
DE
LA
Y
Cap
a cit
yL
i mit
Internalized vs externalized costs

Flight Delays at LGAFlight Delays at LGA
from 2000 to 2006
Source: FAA OPSNET data

MIT ICATMIT ICAT
Solution
Demand ManagementOnly Rapid Public Action
Demand
System Capability
Decision Making
Collective
Stakeholder Awareness
ObjectiveFormation
StakeholderValues, Context
Capability Options
Negotiation Loop
Awareness BuildingProcess
Change Process
Catalytic Event
Public Awareness
Stakeholder Preferences
Delays
DemandManagement
Safety and Environmental Approval Processes
Implementation Process
RegionalEconomy

46
Solutions to Address Airport Demand/Capacity Inadequacy
Demand
Airport Capacity
Demand/Supply Inadequacy
Demand Management
Changes in Infrastructure Utilization
Capacity Enhancement
“Do Nothing”: Delay Homeostasis
Regulation Based Mechanism
Market Based Mechanism
Airport Capacity Expansion
Demand Diversion: Secondary Airport Emergence
Debanking
Passenger Traffic
Aircraft movements
Range restrictionsOperation Type restrictions
Slot control
Secondary market trading
Auction
Congestion pricing
System view
Efficiency Improvement
Other ?
Other ?
Source: Philippe Bonnefoy

MIT ICATMIT ICAT Conclusions
Capacity will not expand to meet demand at key airports“Capacity Crisis”
Delay Adaptation will occur when delay market worksSecondary AirportsScheduling
There will be a capacity crisisUnclear what the public catalytic stimulus will be
Number of demand managed airports will increase
Need good understanding of alternatives
Regional economic impact is not clear
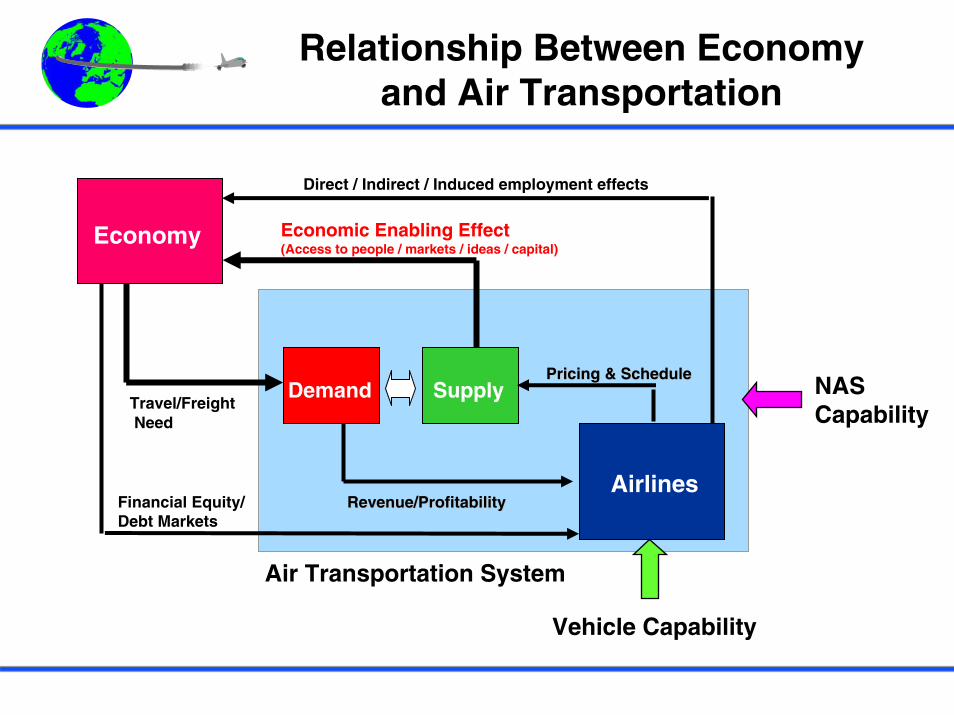
Relationship Between Economy and Air Transportation
Economy
Demand Supply
AirlinesRevenue/ProfitabilityRevenue/Profitability
Pricing & SchedulePricing & Schedule
Financial Equity/Debt Markets
Direct / Indirect / Induced employment effects
Travel/FreightNeed
Economic Enabling Effect(Access to people / markets / ideas / capital)
Air Transportation System
Vehicle Capability
NASCapability


QuickTime™ and aAnimation decompressor
are needed to see this picture.