mixed alcohols report - ou
TRANSCRIPT
1
PRODUCING MIXED ALCOHOLS FROM BIOMASS
Prepared by: Jen Swenton Matt Behring
Submitted to: Dr. Miguel J. Bagajewicz
University of Oklahoma Chemical, Biological and Materials Engineering
March 16, 2007
2
Executive Summary Record CO2 emissions and an ever increasing demand for energy are pushing our environment to the brink. Extensive research is being done to provide clean and sustainable energy sources that can meet the worlds need. Dr. Mark T. Holtzapple has developed a MixAlco process that converts biomass to a mixture of short chain alcohols. These mixed alcohols burn cleaner with less CO2 emissions as compared to petroleum based fuels. Also these mixed alcohols have favorable characteristics for the current fuel industry. Mixed alcohols can be blended to current petroleum based fuels to improve their emissions and efficiency. As an additive, mixed alcohols are more favorable than current additives because of their low vapor pressure, high energy content, and environmentally friendly properties. The MixAlco process is capable of using numerous feedstocks of biomass. The best yields are obtained using a mixture of agricultural foliage and livestock waste. Sorghum and cattle manure are used as the feedstock of this project. For this reason the plant location was selected in western Kansas. Kansas has connections to current petroleum infrastructure that can be used for transport. With a large agricultural community and connections to infrastructure, Kansas is the ideal location. A plant capacity of 40 metric tons of biomass per hour was chosen. This plant size has economic benefits and an initially small impact on local markets. This plant capacity chosen will produce 45 million gallons of mixed alcohol per year. During the economic analysis several capacity options were examined ranging from 2 metric tons of biomass per hour to 800 metric tons of biomass per hour. It was determined that increasing capacities yielded lower product costs on a per gallon basis. However, the two largest options were not considered viable because their complete impact on local markets has not yet been studied. Theoretically, mixed alcohols can be sold at current market prices for gasoline because it can entirely replace them. Thus, 2 dollars per gallon was chosen as the sales price for all plant size options. When considering uncertainty in prices, it was found that this sales price is profitable. For the 40 metric ton of biomass per hour plant, the total capital investment was $23.1 million with a net present worth after ten years of $260 million.
3
Table of Contents Introduction..................................................................................................................................... 6 Objectives ....................................................................................................................................... 6 Future .............................................................................................................................................. 6 Mixed Alcohols............................................................................................................................... 6
Overview................................................................................................................................. 6 Environmental Factors ............................................................................................................ 7 “Neat” Mixed Alcohol Fuel .................................................................................................... 8 Gasoline Blend Stock.............................................................................................................. 9 Jet Fuel Blend Stock ............................................................................................................. 12 Diesel Blend Stock................................................................................................................ 12 Petroleum Coke-Alcohol Fuel .............................................................................................. 13 Blending Techiques .............................................................................................................. 13
Mixed Alcohols vs. Current Fuels ................................................................................................ 14 Gasoline ................................................................................................................................ 14 Ethanol .................................................................................................................................. 14 MMT..................................................................................................................................... 16 Biomass Sources ................................................................................................................... 16
MixAlco Process........................................................................................................................... 17 Pretreatment & Fermentation................................................................................................ 17 Dewatering............................................................................................................................ 21 Acid Springing...................................................................................................................... 21 Hydrogenation....................................................................................................................... 22
Logistics........................................................................................................................................ 23 Sweet Sorghum ............................................................................................................................. 24 Cattle ............................................................................................................................................. 25 A Greener Environment................................................................................................................ 26 Economic Analysis ....................................................................................................................... 26 Conclusion and Recommendations............................................................................................... 30 References..................................................................................................................................... 31
4
Table of Figures Figure 1. Mixed Alcohol Composition .......................................................................................... 7 Figure 2. MixAlco Process Schematic (Holtzapple, 2004).......................................................... 17 Figure 3. Pretreatment Fermentation Pile Schematic (Holtzapple, 2004) ................................... 18 Figure 4. Lime Plants in United States (Miller, 2007)................................................................. 20 Figure 5. Dewatering Process (Holtzapple, 2004) ....................................................................... 21 Figure 6. Acid Springing Process (Holtzapple, 2004) ................................................................. 22 Figure 7. Hydrogenation Process (Holtzapple, 2004).................................................................. 23 Figure 8. U.S. Petroleum Pipeline Map (Petroleum Geographics Corp. 2007)........................... 24 Figure 9. Sorghum Harvest for Grain 2005 (USDA 2007).......................................................... 25 Figure 10. Kansas Cattle Distrubition for a total of 2.2 million cattle (Dhuyvetter, Graff, & Kuhl) ............................................................................................................................................. 26 Figure 11. Uncertainty curve for 2tonne/h unit ............................................................................ 29 Figure 12. Uncertainty curve for 40tonne/h unit .......................................................................... 29 Figure 13. Uncertainty curve for 800tonne/h unit ........................................................................ 30

5
Table of Tables Table 1. Fuel Energy Content ...................................................................................................... 11 Table 2. Total capital investment for different plant capacities.................................................... 27 Table 3. Product cost per gallon for different plant capacities ..................................................... 27 Table 4. Different measures of profitability for the 40tonne/h unit at $2/gal............................... 28
6
Introduction
Scientific results indicate increased carbon emissions into the environment over the past century
have caused a severe increase of Earth’s overall temperature. In addition, the supply of fossil
fuels is limited, and new sources of energy must be found. Increasing environmental concerns
and the need for fuel sources that are sustainable have lead to increased development in biomass
based fuels. Dr. Mark Holtzapple from Texas A&M University has developed a process of
producing mixed alcohols from biomass. This research project consists of an economic plan and
technical analysis of Dr. Mark Holtzapple’s MixAlco Process.
Objectives
Mixed alcohol facilities will be developed in strategic locations to optimize the MixAlco Process
technology. The primary goals of the facility are to reduce the United States dependence on
petroleum oil and decrease green house gas emissions. The facilities will be the first to produce
mixed alcohols from biomass and will take the lead in the biofuels for alternate energy market.
Future
A 40 metric ton of biomass per hour plant will be built in southwest Kansas operating off a
biomass feedstock sweet sorghum foliage and cattle manure. This plant will have the capacity to
meet the fuels demand in Kansas. The capacity was selected because it is large enough to have a
favorable profit yet small enough to not seriously impact local markets. A market analysis will
be performed in order to determine the affect MixAlcs will have on the public eye. MixAlcs will
first be sold as an additive or a blend. This is to ensure that automotive technology is indeed
adapted to the fuel technology. An analysis of other plant locations will be performed in order to
determine the rate of expansion that can occur while considering the agricultural impact.
Mixed Alcohols
Overview Mixed alcohols are single-chained, molecular alcohols which are classified according to the
number of carbon atoms present. Typically, the energy density increases with the increasing
carbon content in the higher alcohols. The higher alcohols C3-C7 (propanol, butanol, pentanol,
7
hexanol, and heptanol) provide more energy density than does the ethanol having two carbon
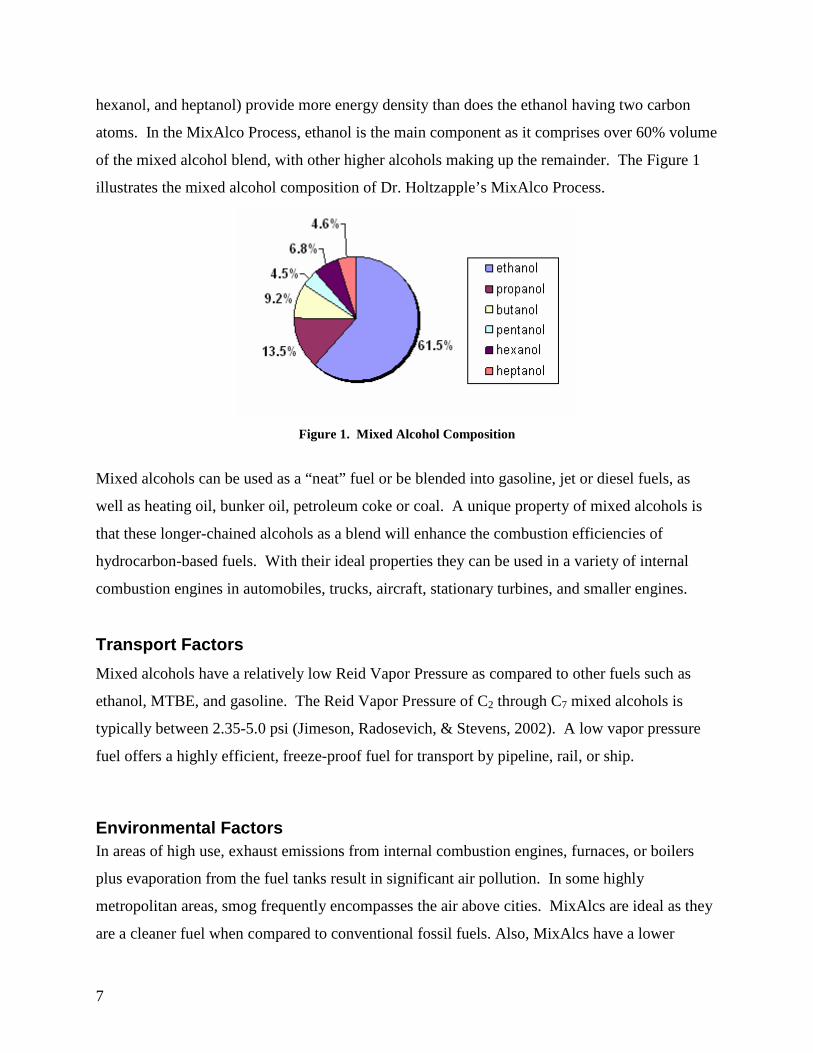
atoms. In the MixAlco Process, ethanol is the main component as it comprises over 60% volume
of the mixed alcohol blend, with other higher alcohols making up the remainder. The Figure 1
illustrates the mixed alcohol composition of Dr. Holtzapple’s MixAlco Process.
Figure 1. Mixed Alcohol Composition
Mixed alcohols can be used as a “neat” fuel or be blended into gasoline, jet or diesel fuels, as
well as heating oil, bunker oil, petroleum coke or coal. A unique property of mixed alcohols is
that these longer-chained alcohols as a blend will enhance the combustion efficiencies of
hydrocarbon-based fuels. With their ideal properties they can be used in a variety of internal
combustion engines in automobiles, trucks, aircraft, stationary turbines, and smaller engines.
Transport Factors
Mixed alcohols have a relatively low Reid Vapor Pressure as compared to other fuels such as
ethanol, MTBE, and gasoline. The Reid Vapor Pressure of C2 through C7 mixed alcohols is
typically between 2.35-5.0 psi (Jimeson, Radosevich, & Stevens, 2002). A low vapor pressure
fuel offers a highly efficient, freeze-proof fuel for transport by pipeline, rail, or ship.
Environmental Factors In areas of high use, exhaust emissions from internal combustion engines, furnaces, or boilers
plus evaporation from the fuel tanks result in significant air pollution. In some highly
metropolitan areas, smog frequently encompasses the air above cities. MixAlcs are ideal as they
are a cleaner fuel when compared to conventional fossil fuels. Also, MixAlcs have a lower
8
tendency to evaporate. Reid Vapor Pressure is a measure of a fuel's tendency to vaporize, the
higher the vapor pressure, the more vaporization. The relatively low Reid Vapor Pressure of
MixAlcs is particularly desired in warm climates where evaporation of volatile organic
compounds of fuel is a source of pollution. Mixed alcohols have higher combustion efficiencies;
therefore, lower environmental impact per unit of energy. Additionally, they provide a higher
energy content fuel with less sulfur, nitrogen, and carbon emissions polluting the environment.
The fuel is water soluble and biodegradable. Consequently, it is non-polluting both to water and
land environments. In addition, the fuel can be synthesized from a variety of renewable and non-
renewable waste materials utilized as process feedstocks.
“Neat” Mixed Alcohol Fuel
Neat mixed alcohol refers the concept that no blending with other fuels is required for the fuel to
combust. The fuel has been tested to determine the octane rating, corrosion effects, energy
content, and drivability index. Neat mixed alcohol has been found to be suitable in flexible fuel
vehicles (FFVs), aviation aircraft, internal combustion engines, furnaces, and boilers.
When the mixed alcohols are used "neat", without gasoline or diesel, the internal combustion
engine has reduced tailpipe emissions.
The octane number is a measure of the resistance of the gasoline to premature detonation in the
engine. Premature detonation wastes the energy in the fuel and can harm the engine. An engine
that knocks or pings during operation is experiencing premature detonation. The octane number
of the neat mixed alcohol fuel is typically between 90 and 138 depending upon its carbon content
formulation (Jimeson, Radosevich, & Stevens, 2002). It was determined that the neat mixed
alcohols would not ping in research engines designed to measure ping or pre-ignition.
Mixed alcohols were found not to corrode metals used in an internal combustion engine. This
indicates neat fuel mixed alcohol is as good as gasoline, diesel, or jet fuel in being compatible
with engine components. Elastomers such as seals, hoses, and gaskets make up the other engine
components. Since the 1970s, internal combustion engines are designed with fluorinated
elastomers in the gaskets, hoses and seals which are better suited for alcohol type fuels than non-
fluorinated elastomers.
9
The use of the higher alcohols, such as hexanol and heptanol, increases the energy content of the
mixed alcohol fuel such that the mixed alcohol fuel has an energy content closer to that of
gasoline. The energy content of gasoline is 125,000 Btu per gallon whereas the energy content
of the MixAlco Process’s mixed alcohols is 104,000 Btu per gallon. This is substantially better
than ethanol’s energy content of 84,300 Btu per gallon.
The drivability index is used to predict cold-start and warm-up performance of the engine with
respect to the type of fuel used. The drivability index of mixed alcohols is measured at 949
using test method ASTM D 86 (Jimeson, Radosevich, & Stevens, 2002). 850 is the minimum
and 1300 is the maximum drivability index. Thus, the neat fuel mixed alcohols drivability index
is in the allowable range for engine performance.
Currently the ethanol based fuel E-85 is used in flexible fuel vehicles (FFV). Mixed alcohol fuels
can be used in such FFV vehicles. Slight adjustments of the engine may provide extra power and
even lower emission profiles.
Mixed alcohol's higher octane is particularly advantageous for aviation fuel. Aviation fuel
requires an octane number from 100 to 120 or greater. An experimental aircraft made a
transatlantic flight using ethanol alone. When compared to ethanol, mixed alcohols have a
higher energy density, increased octane rating, and water-solubilizing characteristics. Thus,
mixed alcohols of the MixAlco Process are predicted to be a better suited fuel for aircraft.
Gasoline Blend Stock A blended fuel of mixed alcohols and gasoline can contain weight percentages of 1-99% mixed
alcohols. Blending mixed alcohols with gasoline will benefit the current gasoline by serving as
an oxygenate in gasoline, minimize water contamination of fuels, and reduce emissions of
regulated pollutants. With these benefits, mixed alcohols will replace current gasoline blend
stocks of grain ethanol, MTBE, and other octane boosters.
10
Using a gasoline with a higher octane number typically lessens or eliminates the knocking or
pinging problem. Conventional commercial gasoline typically has an octane number between 87
and 90, while premium gasoline has an octane number typically greater than 90. The octane
rating of a blended mixture depends solely upon the volume ratio of the mixed alcohol fuel to
gasoline. A 10:90 volume ratio of mixed alcohols to gasoline increases the octane of 87 octane
regular gasoline to an octane number greater than 90 (Jimeson, Radosevich, & Stevens, 2002).
In some volumetric proportions, the blended octane number can be increased to 100 or greater.
These results eliminate the need to blend in carcinogens or other aromatics to boost the octane.
Because mixed alcohols increase the octane number of gasoline they improve combustion
efficiency of gasoline. In flexible fuel vehicles mixed alcohols can be used as a near-neat fuel
with a volumetric blend of 95% mixed alcohols and 5% gasoline. A higher vapor pressure is
preferred in cold seasons to improve cold starts of engines. In this case the 5% gasoline
increases the alcohol's Reid Vapor Pressure for cold temperature starts.
The Reid Vapor Pressure (RVP) of a fuel is the common measure of gasoline volatility, which is
the property that describes its evaporation characteristics. The Environmental Protection Agency
(EPA) regulates the vapor pressure of fuels from June 1st to September 15th (EPA, 2006). The
EPA’s rules reduce fuel emissions of volatile organic compounds, which are a major contributor
to smog. A lower RVP is preferred to prevent vapor lock and reduce evaporative emissions,
such as summertime evaporation of fuel from fuel tanks. A higher RVP is preferred in cold
seasons to improve cold starts of engines. Reformulated gasoline has an RVP between 6.4-10.0
psi. The measured RVP of the mixed alcohol fuel is 2.5 to 5 psi. 10% volumes of higher mixed
alcohols, pentanol through heptanol, may raise the RVP of gasoline upwards by 0.6 to 1 psi.
Thus, the mixed alcohols can raise the oxygen content of the fuel without significantly raising
the RVP. This, together with more energy density than competing oxygenates are two of the
primary commercial strengths of higher mixed alcohols.
Another advantage of using mixed alcohol fuel as a blend in gasoline is that mixed alcohols burn
as a cleaner fuel. Hydrocarbon and carbon monoxide emissions are reduced when the mixed
alcohols-gasoline fuel is combusted in an internal combustion engine. In addition, the use of
mixed alcohols reduces intake valve deposits (IVD), exhaust valve deposits (EVD) and
11
combustion chamber deposits (CCD). The carbon deposits decrease as the concentration of
mixed alcohols increases relative to gasoline. However, engine oil lubricants may need to be
changed to a lubricant which is better adapted to acidic combustions.
In a study of the emission characteristics of a mixed alcohol-gasoline blend in a 3.8L Buick
LeSebre, it was found several of the regulated emissions were reduced when mixed alcohols
were used. The two fuels tested were pure gasoline and a volumetric blend ratio of 15:85 mixed
alcohols to gasoline. No adjustments were made to combust the blended fuel. For gasoline
alone, the total hydrocarbon emissions were 0.058-0.059 grams per mile, while for the blend of
mixed alcohols and gasoline, it was reduced to 0.032-0.070 grams per mile (Jimeson,
Radosevich, & Stevens, 2002). In this study, the use of mixed alcohol was found to significantly
decrease carbon monoxide emissions and hydrocarbon emissions. It is believed that the presence
of esters in the mixed alcohols contributed to a slight increase in formaldehyde and acetaldehyde.
The esters can be removed from the mixed alcohols to reduce these emissions.
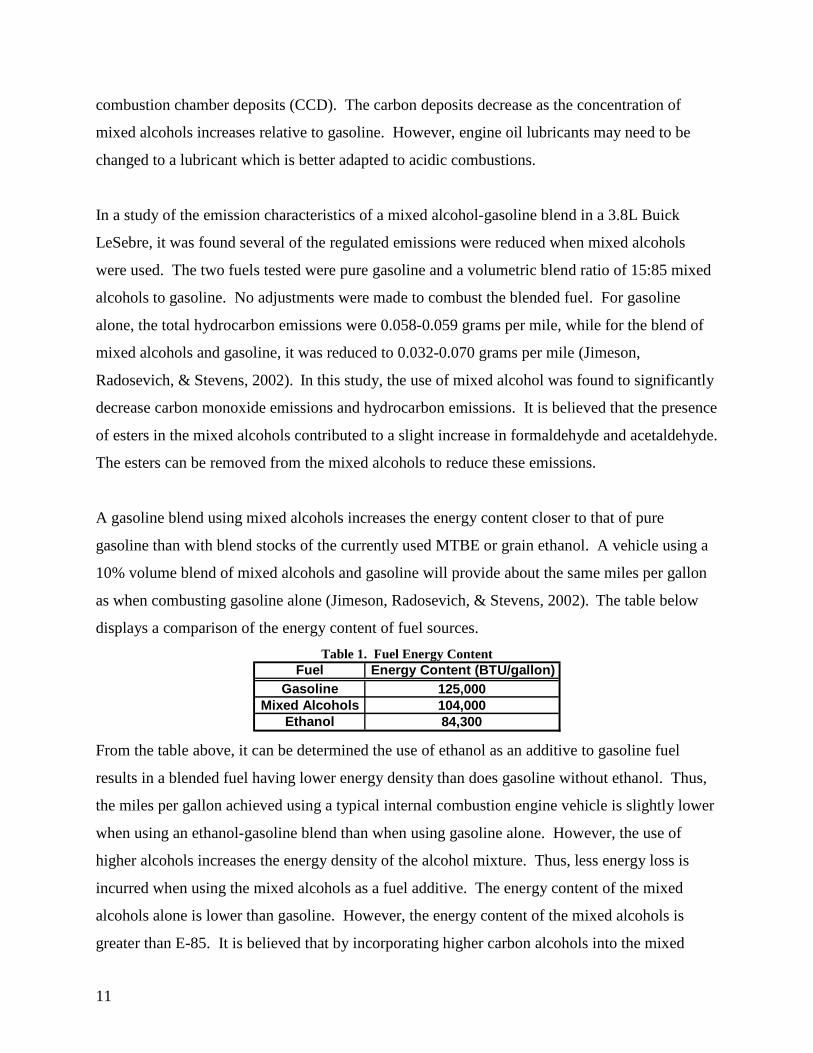
A gasoline blend using mixed alcohols increases the energy content closer to that of pure
gasoline than with blend stocks of the currently used MTBE or grain ethanol. A vehicle using a
10% volume blend of mixed alcohols and gasoline will provide about the same miles per gallon
as when combusting gasoline alone (Jimeson, Radosevich, & Stevens, 2002). The table below
displays a comparison of the energy content of fuel sources.
Table 1. Fuel Energy Content Fuel Energy Content (BTU/gallon)
Gasoline 125,000Mixed Alcohols 104,000
Ethanol 84,300
From the table above, it can be determined the use of ethanol as an additive to gasoline fuel
results in a blended fuel having lower energy density than does gasoline without ethanol. Thus,
the miles per gallon achieved using a typical internal combustion engine vehicle is slightly lower
when using an ethanol-gasoline blend than when using gasoline alone. However, the use of
higher alcohols increases the energy density of the alcohol mixture. Thus, less energy loss is
incurred when using the mixed alcohols as a fuel additive. The energy content of the mixed
alcohols alone is lower than gasoline. However, the energy content of the mixed alcohols is
greater than E-85. It is believed that by incorporating higher carbon alcohols into the mixed
12
alcohols, the energy density will grow even closer to that of gasoline. Thus, the use of mixed
alcohols with the carbon content of C2-C7 with gasoline will produce the desired oxygen content
while avoiding an energy penalty.
Jet Fuel Blend Stock The mixed alcohols can be blended with jet fuel so as to make a blended fuel. Jet fuel is
primarily kerosene with additives. The blended fuel can contain 1-30% by volume of the mixed
alcohols, with the remainder being jet fuel. An attractive aspect of the mixed alcohols is that
mixed alcohols can solubilize condensate water which develops in the head space above jet fuel
while pilots are flying at extra cold high altitudes.
A blend of mixed alcohols with gasoline jet fuel will reduce the need for lead. The mixed
alcohols enhance the octane number of the fuel. This is particularly advantageous for aviation
gasoline. Aviation gasoline is typically gasoline having a higher octane number (100 or greater)
than automotive gasoline. Tetraethyl or tetramethyl lead is added to gasoline in order to produce
the higher octane number required for aviation gasoline. Tetraethyl lead used to be added to
automotive gasoline in order to raise the octane number. However, the use of lead in gasoline has
been all but eliminated in the United States, Canada and several developed countries, with the
common exception of aviation gasoline. Thus, the mixed alcohol-blended gasoline fuel can be
used as aviation gasoline without the need for harmful tetraethyl or tetramethyl lead additives.
Thus, the use of mixed alcohols can enhance the octane number of gasoline in order to produce
aviation gasoline, without the use of harmful, poisonous lead.
Diesel Blend Stock The blended fuel can contain 1-30% by volume of mixed alcohols with the remainder being
diesel. The advantages to this are: the blend produces less soot and has fewer harmful emissions
than unblended diesel when it is combusted. The use of mixed alcohols in diesel will reduce the
particulates produced during combustion. In addition, it is believed that regulated emissions
(hydrocarbons, carbon monoxide and nitrogen oxides) will be reduced.
When diesel is combusted it produces pollutants in the form of hydrocarbons (HC), nitrogen
oxides (NOx), carbon monoxide (CO) and soot (particulates). Nitrogen oxides and volatile
13
organic components react together in sunlight to form ground level ozone, a component of smog.
Diesel has less of a tendency to evaporate than does gasoline.
In order to better blend the water soluble mixed alcohols with diesel, a surfactant binder can be
used. One such commercially available surfactant that is expected to work well is Octimax 4900
available from Octel Starion (Jimeson, Radosevich, & Stevens, 2002).
The mixed alcohols can be volumetrically blended with diesel as follows: 50% mixed alcohols,
50% diesel (Jimeson, Radosevich, & Stevens, 2002). A diesel engine operating on such a fuel
blend would likely need a one-time adjustment of its fuel injectors to achieve the proper air-fuel
mixture. Fleet vehicle applications could benefit in particular from such a fuel blend. When used
as an additive to diesel-based fuels, the mixed alcohols function as an oxygenate.
Petroleum Coke-Alcohol Fuel Mixed alcohols provide a petroleum coke-alcohol fuel used for combustion in furnaces and
boilers or gasifiers, by blending petroleum coke particles and mixed alcohols. The MixAlcs
provide improved transportation and combustion properties of petroleum coke or coal. They
reduce NOx emissions by lowering combustion temperatures of petroleum coke and coal. The
blend also beneficiates petroleum coke and coal by reducing combustion emissions which are
precursors to acid rain.
Blending Techiques
The mixed alcohols can be blended manually by providing the various components in the proper
proportions. The blending of the mixed alcohols into gasoline or diesel can occur in a variety of
manners. The mixed alcohols can be splash blended into tanker trucks or rail cars. The
movement of the tankers during transport will fully blend or mix the mixed alcohols into the
gasoline or diesel. Another way of blending is to add the mixed alcohols to the fuel tank of a
vehicle which is to combust the fuel. Again, the movement of the tank as the vehicle moves is
sufficient to mix the fuel with the mixed alcohols. Still another way is to meter the mixed
alcohols into a tank with the fuel.
14
Mixed Alcohols vs. Current Fuels
Gasoline When gasoline is burned, it produces pollutants in the form of hydrocarbons (HC), nitrogen
oxides (NOx), carbon monoxide (CO) and soot (particulates). In addition, gasoline in warm
climates tends to evaporate due to the presence of volatile organic compounds (VOCs). The
gasoline is preferably unleaded gasoline, which is conventional and commercially available.
Gasoline is a well-known fuel comprising mixtures of aromatics, olefins and paraffins. The
boiling points of these hydrocarbons is typically 77-437 degrees F. Gasoline may also include
additives, such as detergents, anti-icing agents, corrosion inhibitors, dyes, and octane enhancers
(such as tetraethyl lead or MMT).
There are several different blends of unleaded gasoline currently refined and sold throughout the
world. These blends are referred to as conventional gasoline, winter oxygenated gasoline, and
reformulated gasoline. Conventional gasoline is formulated with a lower Reid Vapor Pressure
(RVP) in order to evaporate more slowly in hot weather thereby reducing smog. Winter
oxygenated and reformulated gasolines may contain MTBE or ethanol to produce a cleaner
burning fuel. Winter gasolines typically feature higher Reid Vapor Pressures (up to 12 psi or
higher) to assist with cold starts. Summer gasolines typically feature 8 psi Reid Vapor Pressure
ratings (EPA, 2006).
Both methanol and ethanol have a relatively lower energy content when compared to gasoline.
Methanol contains about 50,000 Btu's/gallon and ethanol contains about 76,300 Btu's/gallon
while gasoline contains about 125,000 Btu's/gal. A motorist notices this when a vehicle running
on gasoline achieves more miles per gallon than does a similar vehicle running on alcohol fuels.
Ethanol Today, the primary alcohol fuel is ethanol, which is typically fermented from grain (corn, wheat,
barley, etc.) in a fermentation process. The ethanol is blended into gasoline in various quantities.
"Premium" gasoline, with a higher octane rating than "regular" gasoline, is primarily gasoline
with 10% ethanol. Another ethanol fuel is E-85, which is 85% ethanol and 15% gasoline.
15
Grain ethanol is expensive to produce. Furthermore, producing sufficient quantities of grain
ethanol to satisfy the needs of the transportation industry is not practical because food crops are
diverted into fuel. Traditionally, grain ethanol has been heavily subsidized by governments.
Droughts and government policy towards farming in general make the supply of grain ethanol
uncertain and expensive. Furthermore, larger quantities of a higher energy content alcohol fuel
are needed than can be produced from grain fermentation for the production of ethanol.
MTBE
For the past twenty years or so, gasoline sold in the United States and many other countries has
been blended with 5-15% volumes of methyl-tertiary-butyl-ether (MTBE), an oxygenate, in
order to raise the octane rating and to reduce environmentally harmful exhaust emissions.
Unfortunately, MTBE is itself a pollutant, having an objectionable odor and taste and having
been classified as a potential human carcinogen. MTBE persists and pollutes land and water
environments. MTBE is highly soluble in water and is low in biodegradability. MTBE features a
tertiary carbon bond in its molecule which is difficult for natural organisms, such as bacteria or
phytoplankton to break down. Consequently, MTBE has polluted the ground water in many
communities. Several U.S. states, including Calif., are phasing out the use of MTBE. This phase
out will likely result in an eventual ban of MTBE in the USA and in other countries.
Mixed alcohols can be used as a direct replacement or substitute for MTBE in gasoline. Thus,
when mixed alcohols are used in gasoline, MTBE need not be added to that gasoline. The
gasoline fuel need not contain MTBE as a source of oxygen. Instead, the mixed alcohols serve as
an oxygenate to provide for increased combustion efficiency thereby reducing emissions.
The presently planned replacement for MTBE is fermented grain ethanol, but as discussed
above, producing the necessary quantities of grain ethanol to replace MTBE will be problematic
in specific regions. Therefore an effective replacement for MTBE in gasoline is needed.
Lead
Some time ago, lead was added to gasoline to boost its octane rating. The octane rating relates to
16
antiknock properties of gasoline. Lead is being eliminated from gasoline for environmental
reasons.
MMT
MMT, Methylcyclopentadienyl Manganese Tricarbonyl, has been a controversial gasoline
additive for many years. MMT was initially used by refiners in the 1970's chiefly to increase
octane but studies have shown that while increasing octane, MMT increases emissions, fouls
spark plugs and emission control systems. MMT like MTBE usage is declining in North America
and in other developed countries. Mixed alcohols can substitute for the octane increase of MMT
while additionally working as an oxygenate to improve combustion efficiency which reduces
exhaust emissions.
Biomass Sources
Biomass describes anything that is capable of degrading. Wood and animal manure are
considered traditional sources of biomass while modern sources are energy crops, agricultural
waste, and municipal solid waste. Biomass is unique as it is the only renewable source of
carbon. With the conservation of mass theorem, the net carbon dioxide in the atmosphere would
remain constant if biomass energy replaced fossil fuels. Biomass is capable of providing a
sustainable supply of energy to the United States. It could play an important role in the socio-
economic development of rural populations. Biomass has several advantages over currently used
fossil fuels:
• Renewable source of energy which has does not contribute as much to global warming.
• Biomass fuels lower sulfur content contributes less to sulfur dioxide emissions.
• Effective use of waste material to be used for energy.
• Not subject to uncertainties in imported fuels.
Dr. Holtzapple’s process uses a biochemical process which converts biomass to liquid fuel
through a fermentation process. Biodiesel and ethanol are also examples of this biochemical
process.
17
MixAlco Process
The MixAlco Process was developed by Dr. Mark Holtzapple at Texas A&M University. Dr.
Holtzapple currently has an operating pilot plant in College Station, Texas of this process. The
process uses feedstocks of biomass to convert the carbohydrates of the biomass into a mixture of
light alcohols to be used as a fuel source.
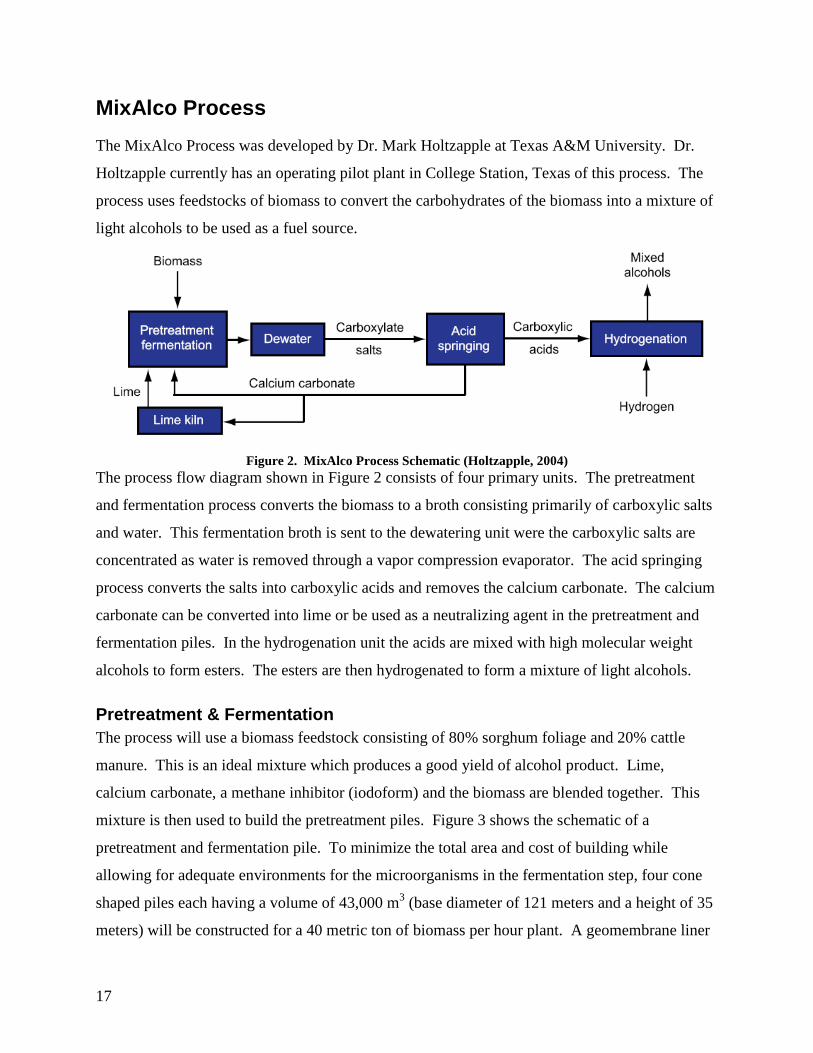
Figure 2. MixAlco Process Schematic (Holtzapple, 2004)
The process flow diagram shown in Figure 2 consists of four primary units. The pretreatment
and fermentation process converts the biomass to a broth consisting primarily of carboxylic salts
and water. This fermentation broth is sent to the dewatering unit were the carboxylic salts are
concentrated as water is removed through a vapor compression evaporator. The acid springing
process converts the salts into carboxylic acids and removes the calcium carbonate. The calcium
carbonate can be converted into lime or be used as a neutralizing agent in the pretreatment and
fermentation piles. In the hydrogenation unit the acids are mixed with high molecular weight
alcohols to form esters. The esters are then hydrogenated to form a mixture of light alcohols.
Pretreatment & Fermentation The process will use a biomass feedstock consisting of 80% sorghum foliage and 20% cattle
manure. This is an ideal mixture which produces a good yield of alcohol product. Lime,
calcium carbonate, a methane inhibitor (iodoform) and the biomass are blended together. This
mixture is then used to build the pretreatment piles. Figure 3 shows the schematic of a
pretreatment and fermentation pile. To minimize the total area and cost of building while
allowing for adequate environments for the microorganisms in the fermentation step, four cone
shaped piles each having a volume of 43,000 m3 (base diameter of 121 meters and a height of 35
meters) will be constructed for a 40 metric ton of biomass per hour plant. A geomembrane liner
18
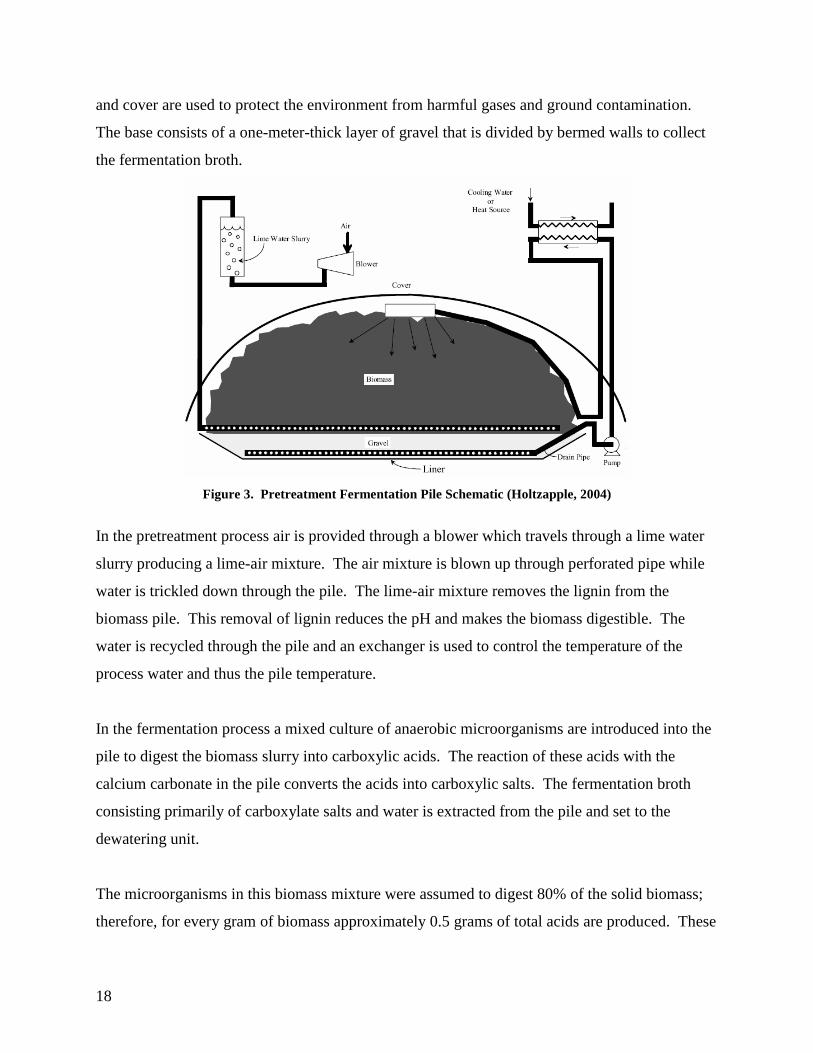
and cover are used to protect the environment from harmful gases and ground contamination.
The base consists of a one-meter-thick layer of gravel that is divided by bermed walls to collect
the fermentation broth.
Figure 3. Pretreatment Fermentation Pile Schematic (Holtzapple, 2004)
In the pretreatment process air is provided through a blower which travels through a lime water
slurry producing a lime-air mixture. The air mixture is blown up through perforated pipe while
water is trickled down through the pile. The lime-air mixture removes the lignin from the
biomass pile. This removal of lignin reduces the pH and makes the biomass digestible. The
water is recycled through the pile and an exchanger is used to control the temperature of the
process water and thus the pile temperature.
In the fermentation process a mixed culture of anaerobic microorganisms are introduced into the
pile to digest the biomass slurry into carboxylic acids. The reaction of these acids with the
calcium carbonate in the pile converts the acids into carboxylic salts. The fermentation broth
consisting primarily of carboxylate salts and water is extracted from the pile and set to the
dewatering unit.
The microorganisms in this biomass mixture were assumed to digest 80% of the solid biomass;
therefore, for every gram of biomass approximately 0.5 grams of total acids are produced. These
19
numbers are based on a study by Dr. Holtzapple using chicken manure and rice straw (Agbogbo
& Holtzapple, 2006).
Microorganism Sources
A mixed culture of marine mesophilic microorganisms are used to digest the biomass and
convert it to carboxylate salts. These organisms can be found in saline environments or in the
rumen of a ruminant. A ruminant is any hooved animal that digests its food by eating the raw
material and regurgitating a semi-digested form known as cud, then eating the cud. Ruminants
include cattle, goats, bison, deer, and etc. The rumen is the primary site for microbial
fermentation of ingested feed.
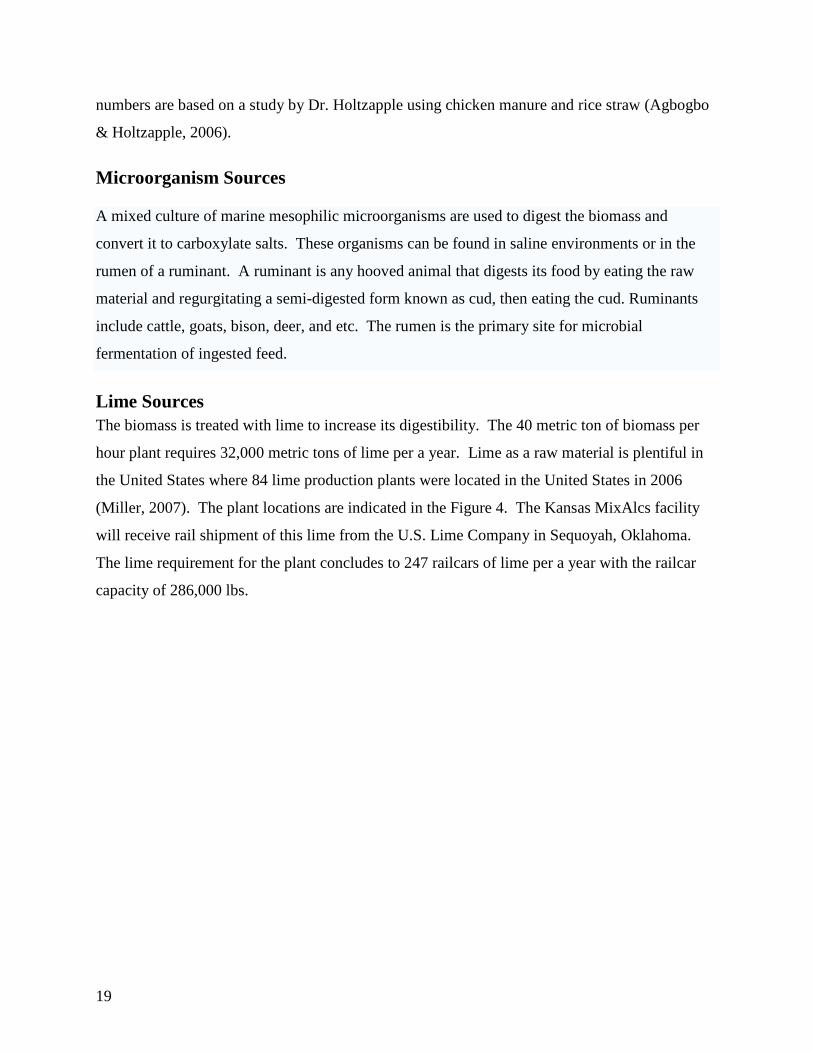
Lime Sources The biomass is treated with lime to increase its digestibility. The 40 metric ton of biomass per
hour plant requires 32,000 metric tons of lime per a year. Lime as a raw material is plentiful in
the United States where 84 lime production plants were located in the United States in 2006
(Miller, 2007). The plant locations are indicated in the Figure 4. The Kansas MixAlcs facility
will receive rail shipment of this lime from the U.S. Lime Company in Sequoyah, Oklahoma.
The lime requirement for the plant concludes to 247 railcars of lime per a year with the railcar
capacity of 286,000 lbs.
20
Figure 4. Lime Plants in United States (Miller, 2007)
Inhibitor Iodoform (CHI3) solution containing 20 g CHI3/L ethanol is used as a methanogen inhibitor in
this process. Iodoform will inhibit the production of methane. Methane is inhibited in the
pretreatment process, because it consists as a gas at standard temperature and pressure. This gas
will then contribute to the harmful emissions of the process.
Pile Design & Planning Sorghum is harvested in the summer months. The pile reconstruction and building will take
place from April to September. Optimizing the air and water flowrates through the pretreatment
piles will allow for continuous product streams. Each pile is estimated to last six months.
Lignin Management The microorganisms digest approximately 80% of the biomass pile leaving 20% of the pile as
un-digestible lignin. This lignin will be removed by truck as a new pile is constructed in its
place. The remaining lignin can be consumed within the facility as to provide process heat or
sold to coal-fired power plants to reduce sulfur emissions.
21
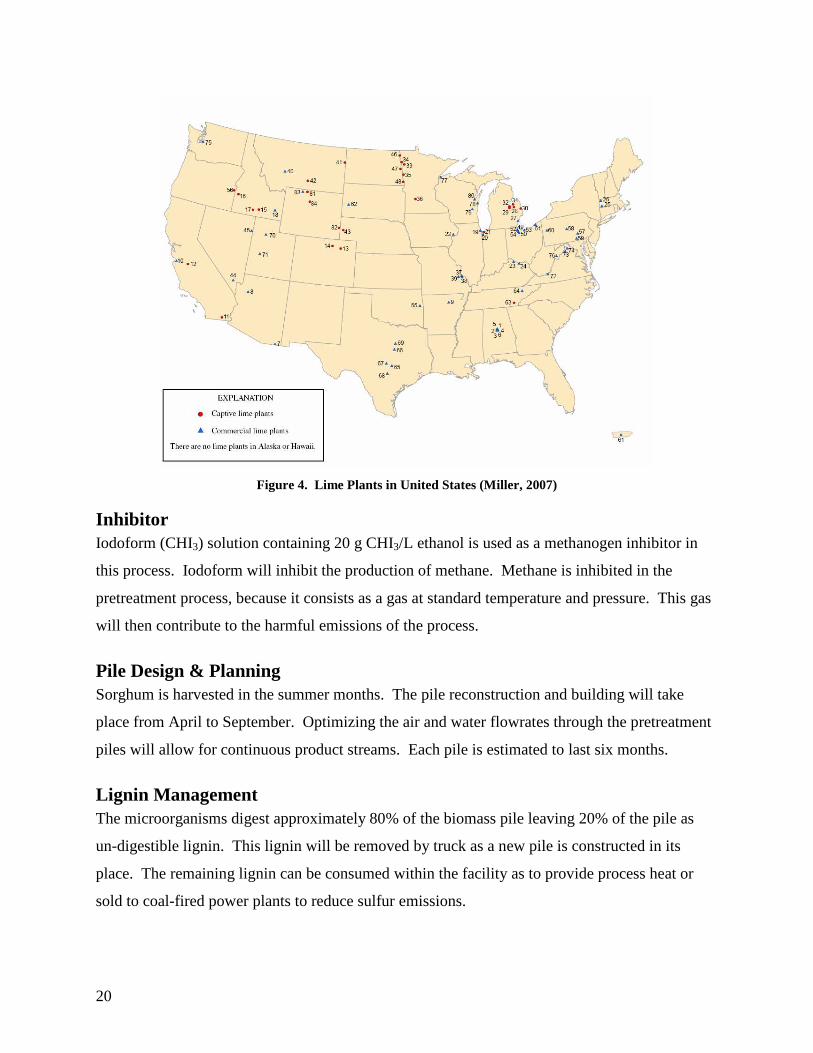
Dewatering The dewatering process uses a stripper column, mixer, and vapor compression evaporator to
process the broth product from the fermentation piles. In a stripper column the fermentation
broth is mixed with high molecular weight acid to acidify the broth, and steam is used to remove
non-condensable gases. Lime is used in a mixer to precipitate scum, which is then removed in a
filter. The treated fermentation broth then enters the vapor compression evaporator where water
is evaporated from the solution concentrating the carboxylate salts. The process flow diagram is
shown below.
Figure 5. Dewatering Process (Holtzapple, 2004)
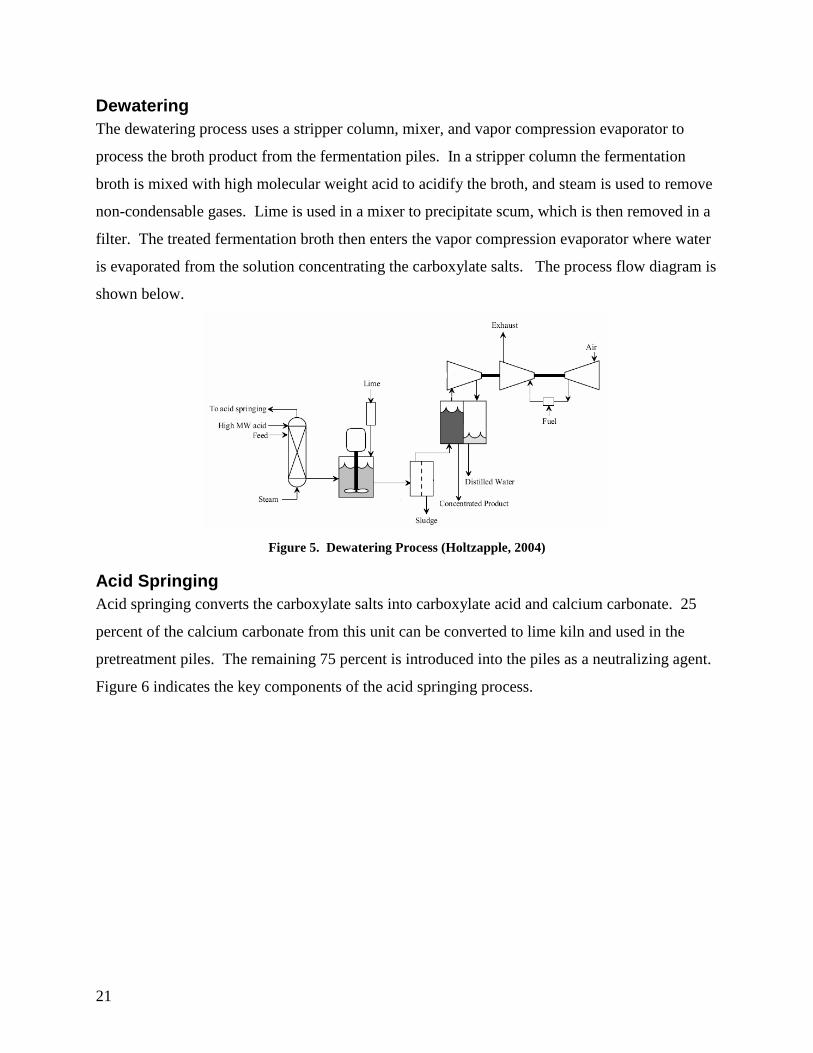
Acid Springing Acid springing converts the carboxylate salts into carboxylate acid and calcium carbonate. 25
percent of the calcium carbonate from this unit can be converted to lime kiln and used in the
pretreatment piles. The remaining 75 percent is introduced into the piles as a neutralizing agent.
Figure 6 indicates the key components of the acid springing process.
22
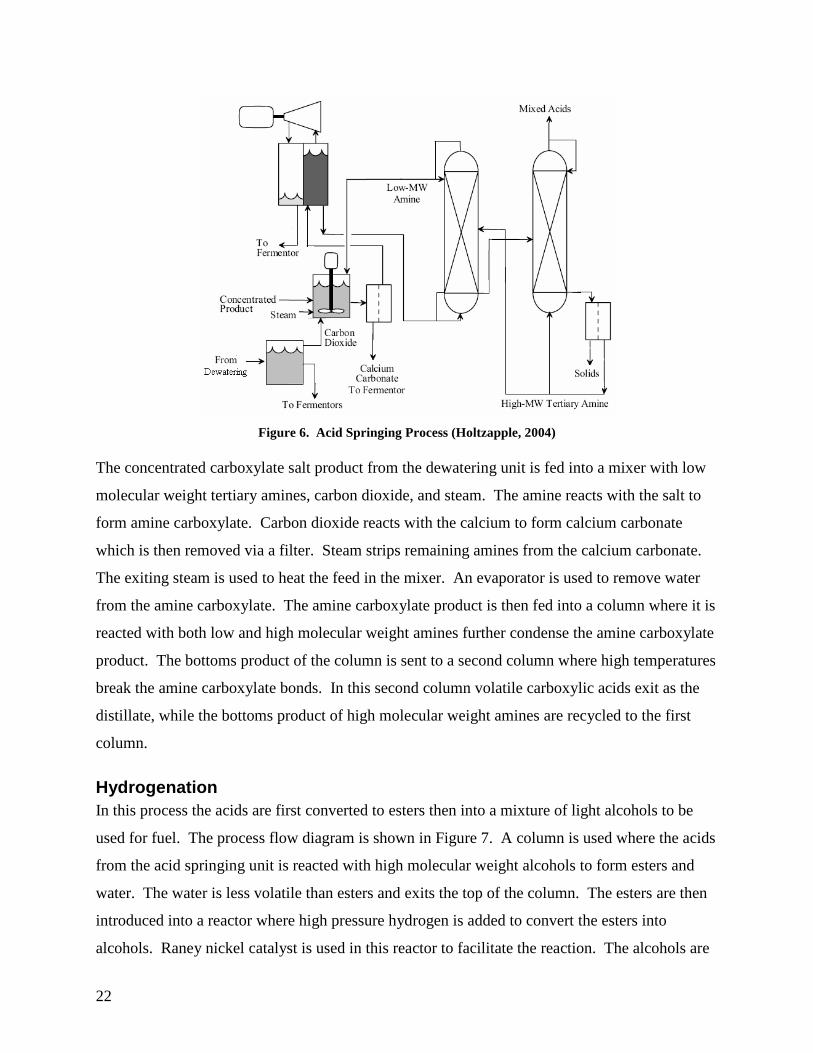
Figure 6. Acid Springing Process (Holtzapple, 2004)
The concentrated carboxylate salt product from the dewatering unit is fed into a mixer with low
molecular weight tertiary amines, carbon dioxide, and steam. The amine reacts with the salt to
form amine carboxylate. Carbon dioxide reacts with the calcium to form calcium carbonate
which is then removed via a filter. Steam strips remaining amines from the calcium carbonate.
The exiting steam is used to heat the feed in the mixer. An evaporator is used to remove water
from the amine carboxylate. The amine carboxylate product is then fed into a column where it is
reacted with both low and high molecular weight amines further condense the amine carboxylate
product. The bottoms product of the column is sent to a second column where high temperatures
break the amine carboxylate bonds. In this second column volatile carboxylic acids exit as the
distillate, while the bottoms product of high molecular weight amines are recycled to the first
column.
Hydrogenation In this process the acids are first converted to esters then into a mixture of light alcohols to be
used for fuel. The process flow diagram is shown in Figure 7. A column is used where the acids
from the acid springing unit is reacted with high molecular weight alcohols to form esters and
water. The water is less volatile than esters and exits the top of the column. The esters are then
introduced into a reactor where high pressure hydrogen is added to convert the esters into
alcohols. Raney nickel catalyst is used in this reactor to facilitate the reaction. The alcohols are
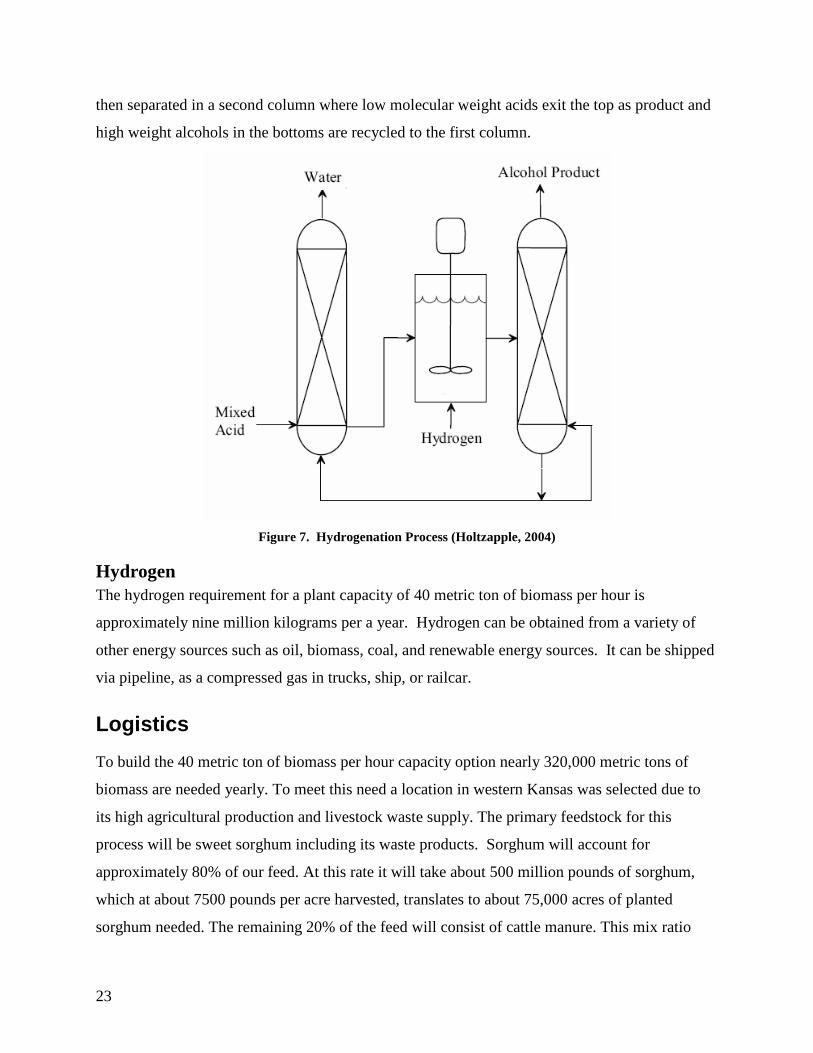
23
then separated in a second column where low molecular weight acids exit the top as product and
high weight alcohols in the bottoms are recycled to the first column.
Figure 7. Hydrogenation Process (Holtzapple, 2004)
Hydrogen The hydrogen requirement for a plant capacity of 40 metric ton of biomass per hour is
approximately nine million kilograms per a year. Hydrogen can be obtained from a variety of
other energy sources such as oil, biomass, coal, and renewable energy sources. It can be shipped
via pipeline, as a compressed gas in trucks, ship, or railcar.
Logistics
To build the 40 metric ton of biomass per hour capacity option nearly 320,000 metric tons of
biomass are needed yearly. To meet this need a location in western Kansas was selected due to
its high agricultural production and livestock waste supply. The primary feedstock for this
process will be sweet sorghum including its waste products. Sorghum will account for
approximately 80% of our feed. At this rate it will take about 500 million pounds of sorghum,
which at about 7500 pounds per acre harvested, translates to about 75,000 acres of planted
sorghum needed. The remaining 20% of the feed will consist of cattle manure. This mix ratio
24
was chosen primarily because of the research done by Agbogbo and Holtzapple about the yield
of bacteria under these conditions (Agbogbo and Holtzapple 2006). The plant itself can exist on a
plot of land about 50-100 acres in size. Because of the cost of land in western Kansas, a plot of
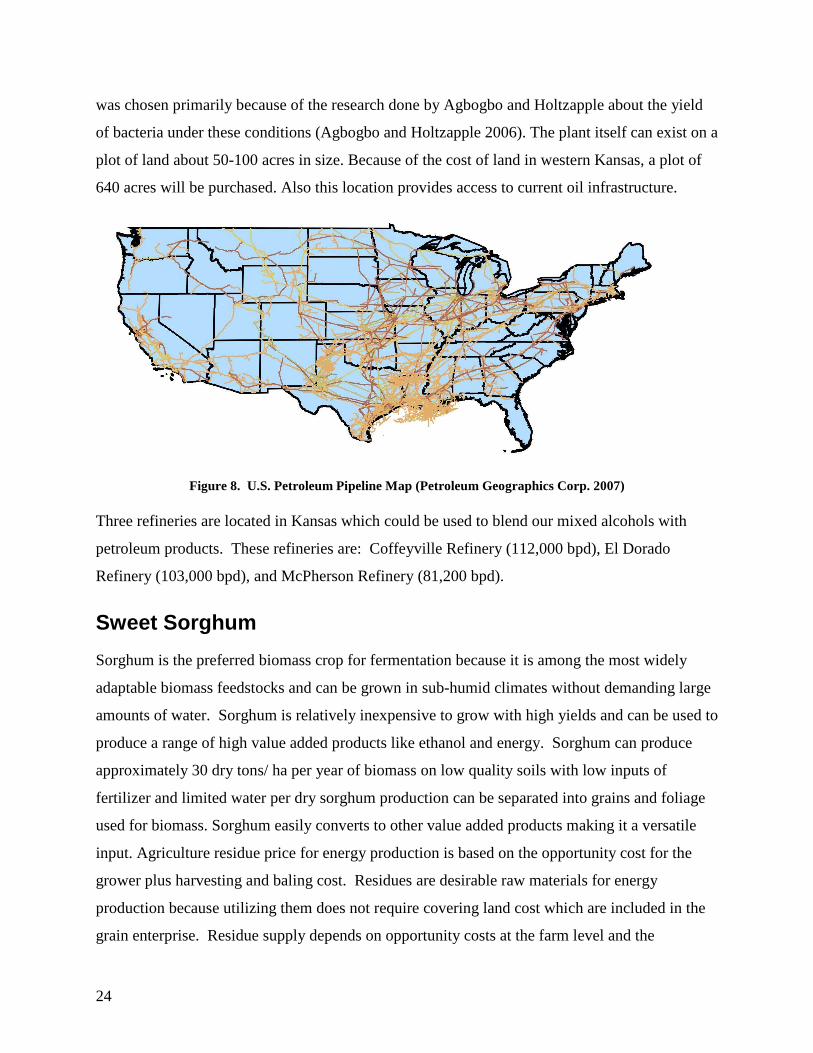
640 acres will be purchased. Also this location provides access to current oil infrastructure.
Figure 8. U.S. Petroleum Pipeline Map (Petroleum Geographics Corp. 2007)
Three refineries are located in Kansas which could be used to blend our mixed alcohols with
petroleum products. These refineries are: Coffeyville Refinery (112,000 bpd), El Dorado
Refinery (103,000 bpd), and McPherson Refinery (81,200 bpd).
Sweet Sorghum
Sorghum is the preferred biomass crop for fermentation because it is among the most widely
adaptable biomass feedstocks and can be grown in sub-humid climates without demanding large
amounts of water. Sorghum is relatively inexpensive to grow with high yields and can be used to
produce a range of high value added products like ethanol and energy. Sorghum can produce
approximately 30 dry tons/ ha per year of biomass on low quality soils with low inputs of
fertilizer and limited water per dry sorghum production can be separated into grains and foliage
used for biomass. Sorghum easily converts to other value added products making it a versatile
input. Agriculture residue price for energy production is based on the opportunity cost for the
grower plus harvesting and baling cost. Residues are desirable raw materials for energy
production because utilizing them does not require covering land cost which are included in the
grain enterprise. Residue supply depends on opportunity costs at the farm level and the
25
assumption that reasonable soil conservation practices will be followed. The amount of residue
supplied is an approximation for acquisition cost by processing facilities. Growth is expected to
occur in crop residue resource due to increase crop yields and declining livestock demand for
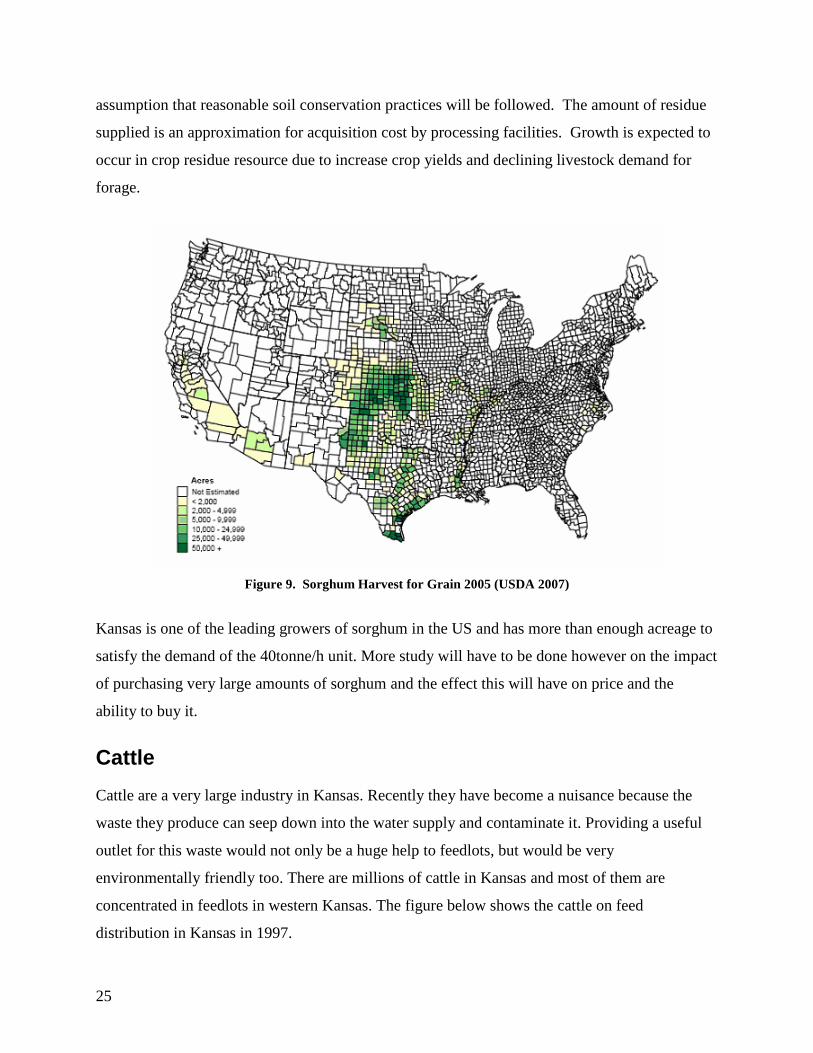
forage.
Figure 9. Sorghum Harvest for Grain 2005 (USDA 2007)
Kansas is one of the leading growers of sorghum in the US and has more than enough acreage to
satisfy the demand of the 40tonne/h unit. More study will have to be done however on the impact
of purchasing very large amounts of sorghum and the effect this will have on price and the
ability to buy it.
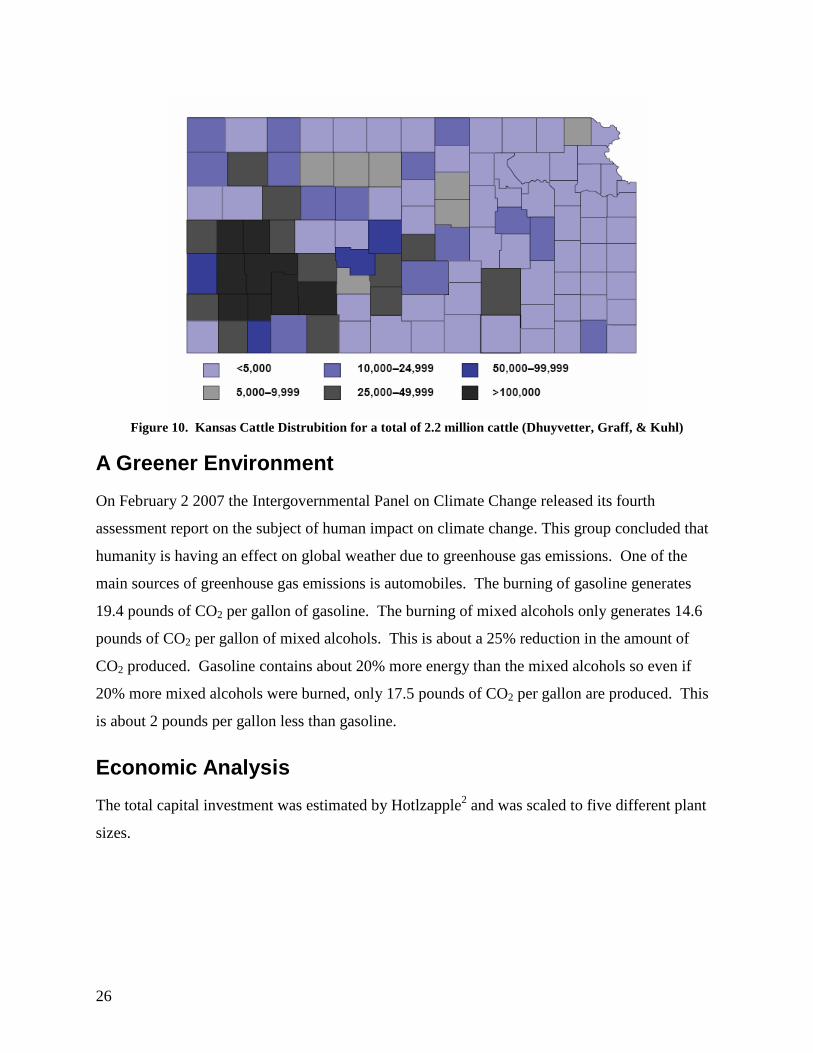
Cattle
Cattle are a very large industry in Kansas. Recently they have become a nuisance because the
waste they produce can seep down into the water supply and contaminate it. Providing a useful
outlet for this waste would not only be a huge help to feedlots, but would be very
environmentally friendly too. There are millions of cattle in Kansas and most of them are
concentrated in feedlots in western Kansas. The figure below shows the cattle on feed
distribution in Kansas in 1997.
26
Figure 10. Kansas Cattle Distrubition for a total of 2.2 million cattle (Dhuyvetter, Graff, & Kuhl)
A Greener Environment
On February 2 2007 the Intergovernmental Panel on Climate Change released its fourth
assessment report on the subject of human impact on climate change. This group concluded that
humanity is having an effect on global weather due to greenhouse gas emissions. One of the
main sources of greenhouse gas emissions is automobiles. The burning of gasoline generates
19.4 pounds of CO2 per gallon of gasoline. The burning of mixed alcohols only generates 14.6
pounds of CO2 per gallon of mixed alcohols. This is about a 25% reduction in the amount of
CO2 produced. Gasoline contains about 20% more energy than the mixed alcohols so even if
20% more mixed alcohols were burned, only 17.5 pounds of CO2 per gallon are produced. This
is about 2 pounds per gallon less than gasoline.
Economic Analysis
The total capital investment was estimated by Hotlzapple2 and was scaled to five different plant
sizes.
27
Biomass Capacity TCIMT/h $
2 3,123,089$ 10 9,057,245$ 40 23,142,670$
160 78,116,150$ 800 340,875,275$
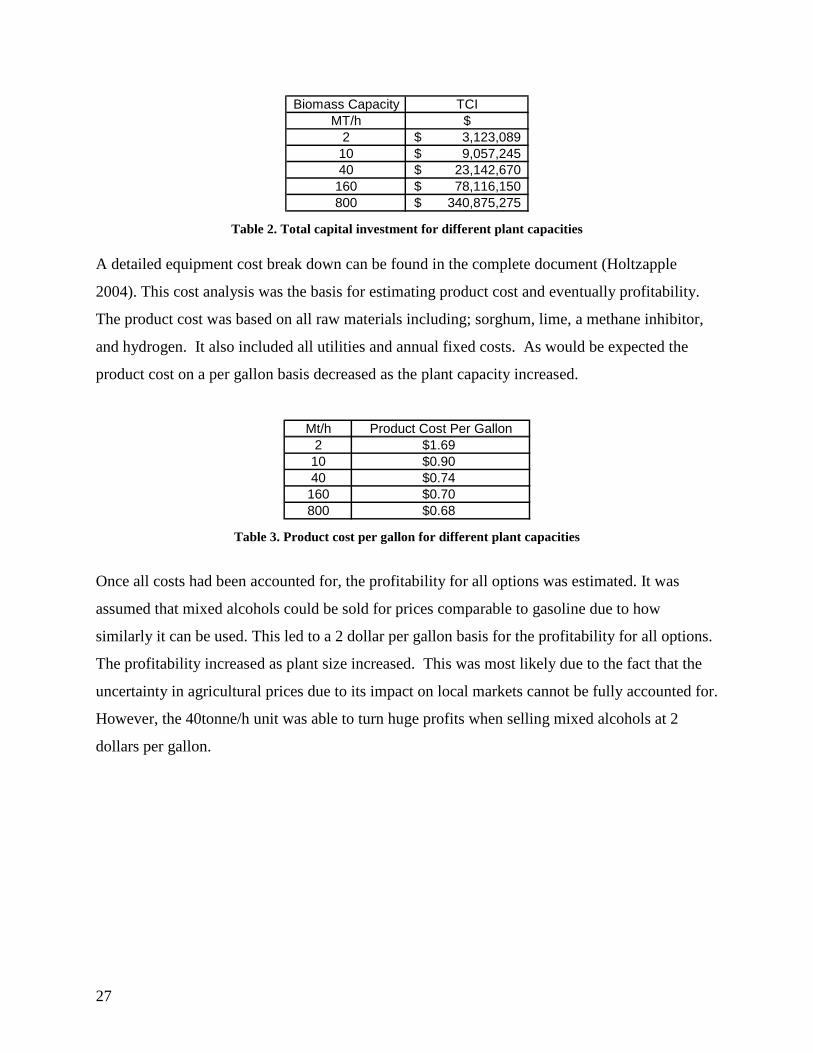
Table 2. Total capital investment for different plant capacities A detailed equipment cost break down can be found in the complete document (Holtzapple
2004). This cost analysis was the basis for estimating product cost and eventually profitability.
The product cost was based on all raw materials including; sorghum, lime, a methane inhibitor,
and hydrogen. It also included all utilities and annual fixed costs. As would be expected the
product cost on a per gallon basis decreased as the plant capacity increased.
Mt/h Product Cost Per Gallon2 $1.69
10 $0.9040 $0.74
160 $0.70800 $0.68
Table 3. Product cost per gallon for different plant capacities
Once all costs had been accounted for, the profitability for all options was estimated. It was
assumed that mixed alcohols could be sold for prices comparable to gasoline due to how
similarly it can be used. This led to a 2 dollar per gallon basis for the profitability for all options.
The profitability increased as plant size increased. This was most likely due to the fact that the
uncertainty in agricultural prices due to its impact on local markets cannot be fully accounted for.
However, the 40tonne/h unit was able to turn huge profits when selling mixed alcohols at 2
dollars per gallon.
28
Return on InvestmentROI = profit/TCI = R-D-(R-dIf)*tROI 19
Rate of Return based on discounted cash flow
function 567,239,693.48$ i 0.08n 10
Net Present Worth
i 0.3NPW $100,736,910
Pay Out Time
Average Cash Flow $43,247,008i 0.08POT 0.814731856
function = sumCF(1+i)^(n-k) + 0.15FCI + (TCI-FCI)-TCI(1+i)^10
NPW = sum(CFk/((1+i)^k)+(CFn+Vs+Iw)/((1+i)^n)-TCI
POT = (FCI-0.15*FCI)+TCI*i*n/average cash flow annually
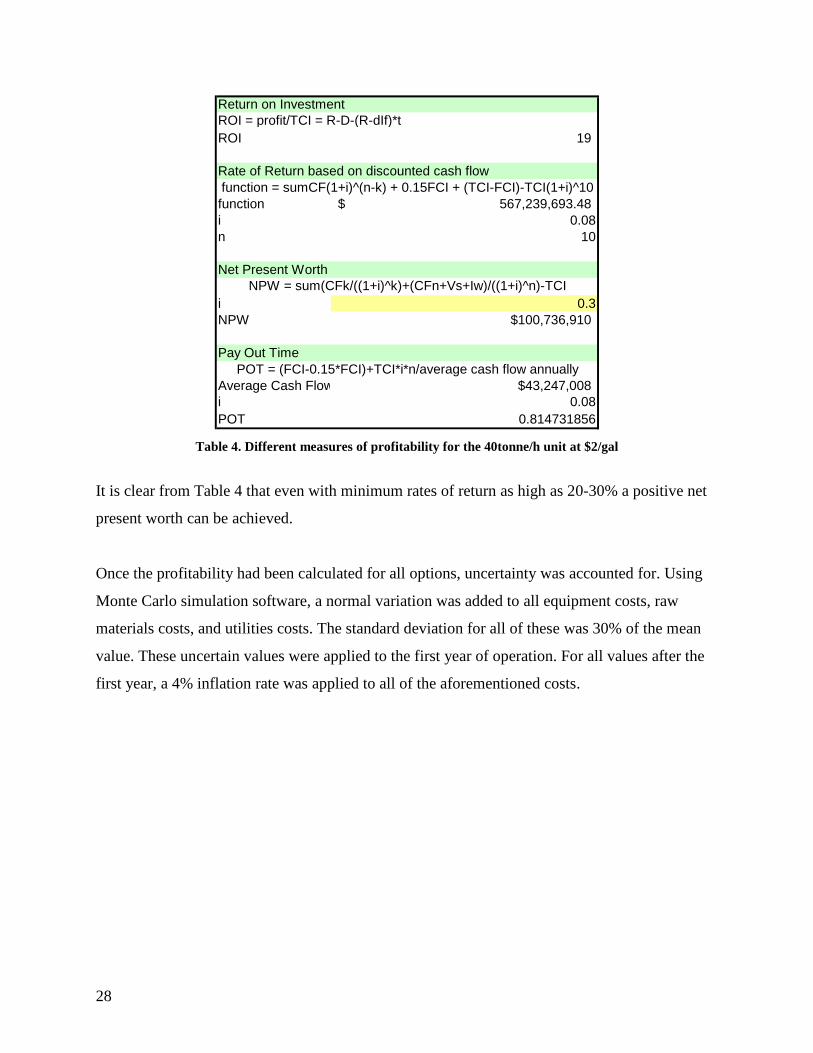
Table 4. Different measures of profitability for the 40tonne/h unit at $2/gal
It is clear from Table 4 that even with minimum rates of return as high as 20-30% a positive net
present worth can be achieved.
Once the profitability had been calculated for all options, uncertainty was accounted for. Using
Monte Carlo simulation software, a normal variation was added to all equipment costs, raw
materials costs, and utilities costs. The standard deviation for all of these was 30% of the mean
value. These uncertain values were applied to the first year of operation. For all values after the
first year, a 4% inflation rate was applied to all of the aforementioned costs.
29
Distribution for 2tonne/h unit
M ean = -182988.3
X <=25000000100%
X <=053.2471%
0
0.2
0.4
0.6
0.8
1
-20 -15 -10 -5 0 5 10 15 20 25
Values in Millions
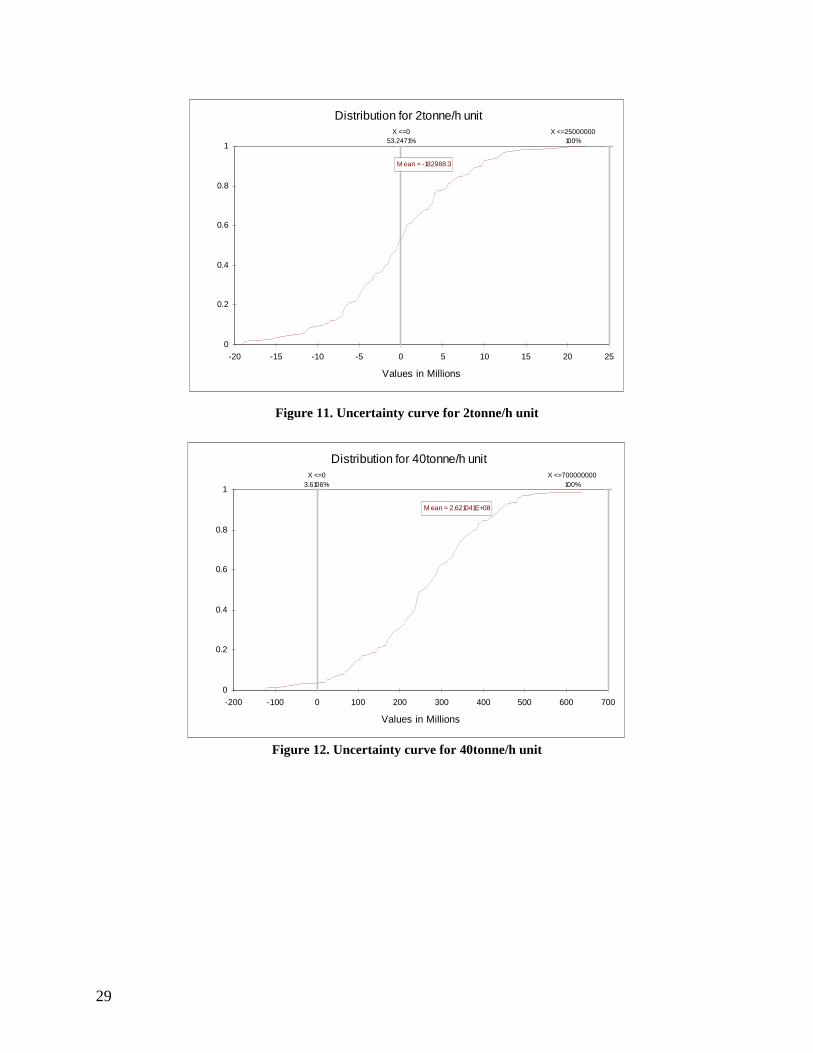
Figure 11. Uncertainty curve for 2tonne/h unit
Distribution for 40tonne/h unit
M ean = 2.621041E+08
X <=03.6106%
X <=700000000100%
0
0.2
0.4
0.6
0.8
1
-200 -100 0 100 200 300 400 500 600 700
Values in Millions
Figure 12. Uncertainty curve for 40tonne/h unit
30
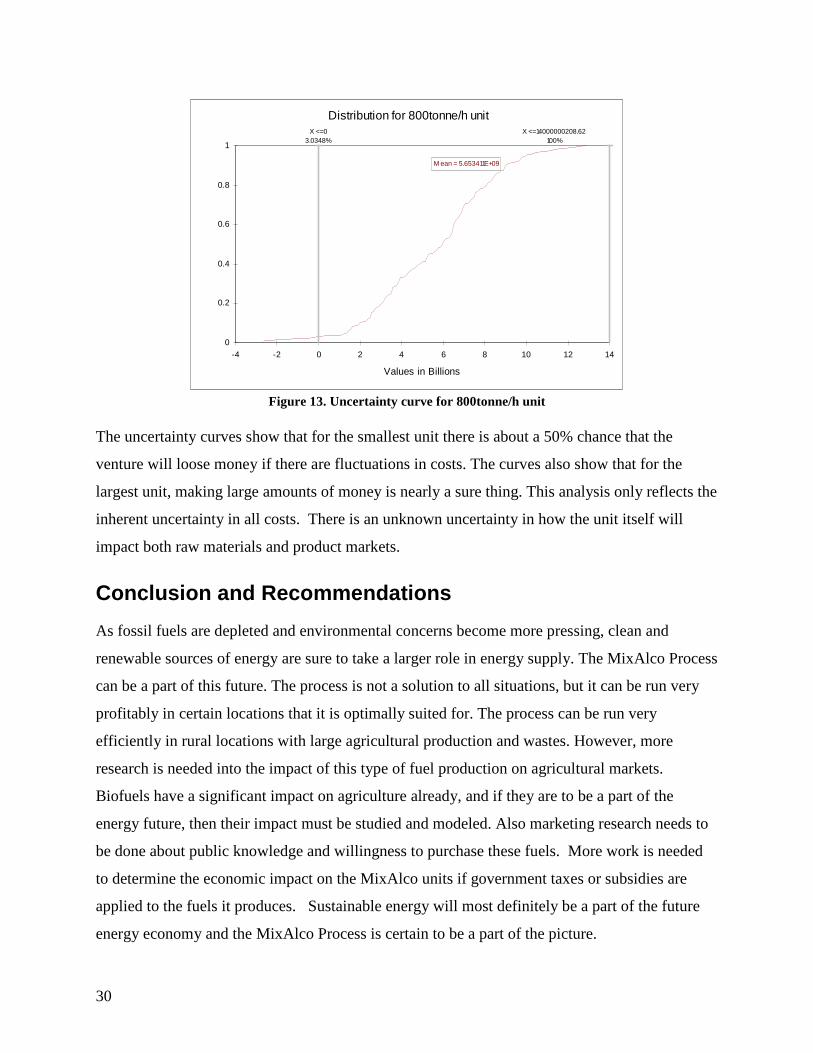
Distribution for 800tonne/h unit
M ean = 5.653411E+09
X <=14000000208.62100%
X <=03.0348%
0
0.2
0.4
0.6
0.8
1
-4 -2 0 2 4 6 8 10 12 14
Values in Billions
Figure 13. Uncertainty curve for 800tonne/h unit
The uncertainty curves show that for the smallest unit there is about a 50% chance that the
venture will loose money if there are fluctuations in costs. The curves also show that for the
largest unit, making large amounts of money is nearly a sure thing. This analysis only reflects the
inherent uncertainty in all costs. There is an unknown uncertainty in how the unit itself will
impact both raw materials and product markets.
Conclusion and Recommendations
As fossil fuels are depleted and environmental concerns become more pressing, clean and
renewable sources of energy are sure to take a larger role in energy supply. The MixAlco Process
can be a part of this future. The process is not a solution to all situations, but it can be run very
profitably in certain locations that it is optimally suited for. The process can be run very
efficiently in rural locations with large agricultural production and wastes. However, more
research is needed into the impact of this type of fuel production on agricultural markets.
Biofuels have a significant impact on agriculture already, and if they are to be a part of the
energy future, then their impact must be studied and modeled. Also marketing research needs to
be done about public knowledge and willingness to purchase these fuels. More work is needed
to determine the economic impact on the MixAlco units if government taxes or subsidies are
applied to the fuels it produces. Sustainable energy will most definitely be a part of the future
energy economy and the MixAlco Process is certain to be a part of the picture.
31
References
1. Agbogbo, Frank K., & Holtzapple, Mark T. (2006). Fixed-bed fermentation of rice straw and chicken manure using a mixed culture of marine mesophilic microorganisms. Bioresource Technology, 98, Retrieved February 16, 2007, from http://www.sciencedirect.com.
2. Holtzapple, Mark T. (2004). MixAlco Process: Biomass to Carboxylic Acids and Alcohols. Unpublished Manuscript. Viewed January 2007
3. (2006, March 7). Gasoline Fuels. Retrieved March 13, 2007, from U.S. Environmental Protection Agency Web site: http://www.epa.gov/otaq/volatility.htm#rvpguide
4. Jimeson, R.M., Radosevich, M.C., & Stevens, R.R. Mixed alcohols for internal combustion engines, furnaces, boilers, kilns, and gasifiers. Retrieved March 3, 2007, from www.freshpatents.com.
5. Miller, Lisa D. (2007 January 31). Mineral Industry Surveys - Directory of Lime Plants in the United States in 2006. Retrieved March 13, 2007, from USGS Web site: http://minerals.usgs.gov/minerals
6. (2007). Digital Data. Retrieved March 9, 2007, from Petroleum Geographics Corporation Web site: http://www.petroleumgeographics.com/digitaldata.shtml
7. (2007). Sorghum. Retrieved March 8, 2007, from USDA, National Agricultural Statistics Service Web site: http://www.nass.usda.gov/QuickStats/index2.jsp
8. Dhuyvetter, K.C., Graff, J., & Kuhl, G.L. Kansas Beef Industry, Economic Trends. AG Manger.Info, Retrieved February 28, 2007, from http://www.agmanager.info/livestock/marketing/bulletins_2/industry/default.asp.