mixed nationalities impact on safety in container ships. nationalities.pdf · mixed nationalities...
TRANSCRIPT
Mixed Nationalities Impact on Safety
in Container Ships
Ahmed Khago, Ashraf EL-Houbi, Brian Craig, Kevin McSweeney, Christine Tomlinson
ABSTRACT
The growing consensus among safety researchers and professionals is that safety culture plays an important role in creating a safe and reliable working environment. In order to evaluate the safety culture of an organization, critical safety factors that influence human behavior, attitude, perception, and performance are identified and studied. This study is an attempt to identify safety factors in the shipping industry, particularly in container ships. Surveys were sent to 250 container ships out of 300. Researchers received 789 shipboard responses from 110 container vessels representing a 44% response rate. A fifty six question survey was developed and for each question the answer ranged along a five point Likert scale: “Disagree”, “Slightly Disagree”, “Neutral”, “Slightly Agree”, and “Agree”. The individual safety factor questionnaire contained items on the organizational safety factors, shipboard, and individual safety factors, as well as items on individual demographic and general information such as nationality, age, gender, and experience (three levels). The Kruskal-Wallis non-parametric statistical test revealed that significant differences between the safety factors were identified. The Mann-Whitney pair-wise comparisons also revealed significant differences based on nationality. The study provides details of statistical analyses of the findings.
Keywords: Safety Culture at Sea; Mixed Nationality Perception; Kruskal-Wallis; Mann-Whitney, Safety Factors, Safety Perception.

LL
45DIAS TECHNOLOGY REVIEW ¡ VOL. 9 NO. 1 ¡ APRIL - SEPTEMBER 2012
INTRODUCTION
Poor safety culture contributed to major failures and disasters such as the 1991 crash of continental Express Flight 2574 that killed fourteen people on board, the King's Cross underground fire in London, and the Piper Alpha oil platform explosion in the North Sea (Meshkati, 1997). Another recent example of management failure is the BP oil spill in the Gulf of Mexico. The Oil Spill Commission Report concluded that “systematic failure in risk management” was the reason for the BP Deep Water Horizon spill by the three drilling companies: BP, Halliburton, and Transocean (National Commission on BP Deepwater Horizon Oil Spill and Offshore Drilling, 2011).These accidents precipitated a turning point in history for researchers and practitioners to attempt to examine safety culture and the impact it has on potentially precluding such accidents.
The maritime shipping industry, especially oil tankers, is rather familiar with major safety failures. The Exxon Valdez oil spill off the coast of Alaska in 1989 is considered to be one of the world's worst environmental disasters, raising concerns and questions about safety. In fact an investigation into the accident revealed serious safety issues on many vessels that were generally considered to be the best in the world (Nadler, 2005).
The shipping industry is an international, multicultural workplace dominated by male workers whose first language is not English (Kahveci & Sampson, 2001). The crew works every day of the week and stays at sea for weeks or months, depending on their contracts with the company. Typically, the officers come from Organization for Economics Co-Operation and Development (OECD) countries (North America, Western Europe, Japan etc), the Far East, and Eastern Europe (BIMCO/ISF, 2005). The ratings usually come from developing countries such as the Far East and South Asia (BIMCO/ISF, 2005). The Philippines, India, and China are the major suppliers of labor in maritime industry. Other suppliers such as Ukraine, Croatia, Latvia, Greece, Japan, Russia, and the United Kingdom are becoming larger suppliers of labor (BIMCO/ISF, 2005). In the last couple of decades, the shipping industry has experienced a shift in the recruitment of crew members. Multinational personnel represent over sixty percent of the world merchant fleet (Kahveci & Sampson, 2001). Cost cutting is suggested as the main reason for recruiting these seafarers from different nationalities (Progoulaki, 2006). The shipping industry has shown a potential for major safety failures that could lead to catastrophic accidents and is considered to be one of the most dangerous industries and the most international (International Maritime Organization, 2002).
Previous research in the shipping industry indicated that mixed nationality and human factors were concerns of safety performance (Kahveci & Sampson, 2001). In this study, the differences between mixed nationalities and their safety culture perception are investigated to determine and address any safety concerns.
ITERATURE REVIEW
The shipping industry is considered to be one of the most dangerous industries in the world. However, there is relatively little known about safety culture onboard ships (Havold, 2005). In
recent years, a few research papers on safety culture have been published; Havold (2005), Soma (2004), Progoulaki (2006), and Ek, Olsson, and Akelson (2000).
Hetherington, Flin, and Mearns (2006) discussed safety culture and nationality in the maritime industry. The authors searched several electronic databases to identify research articles on human factor and safety culture in the shipping industry. The search criteria included those studies published in English that had a sample of seafarers, peer-reviewed journals, empirical data sets, conference papers, and government papers. Twenty studies met the criteria of the literature search. In an attempt to review the literature on safety in the shipping industry, the authors reviewed the twenty studies of seafaring and identified some of the issues that influence safety in the maritime industry. Despite the twenty studies, the shipping industry still lacks the amount of work and research other industries have accomplished (Hetherington et al. 2006). The authors identified the following human factors issues that contribute to maritime performance. These areas are:
• Organizational and management issues: safety culture, safety climate, and safety training…etc.
• Personal issues: stress, health and wellbeing, shiftwork, decision making, situation awareness, communication, fatigue, and training.
• Design issues: automation
The authors mentioned language barriers as one of the major issues in safety onboard due to the lack of communication between the crew members. In the article, the authors acknowledged the lack of comprehensive literature review in the maritime industry.
Havold (2005) investigated differences between nationalities, occupations, and vessels in a Norwegian shipping industry. Havold defines safety orientation as “Results of the cultural, organizational and contextual factors that create attitudes and behavior that in turn influence occupational perception of the importance of health and safety, and by confidence in the efficacy of preventative measures in creating the behavior necessary to avoid/limit accidents and continuously improve health and safety”. The author proposed a safety orientation model that describes how cultural variables and organizational practices interact and provide measures for safety indicators.
In the Havold (2005) study, a 40-item safety culture questionnaire on a 6-point Likert scale was developed and distributed to crew members onboard twenty vessels. Fifteen out of twenty vessels answered the questionnaire with a response rate ranging from 48% to 100%. The author used sixteen safety factors in the study. Principle Component Analysis (PCA) was used to determine the factors that account for most of the variations. Canonical correlation were applied
MIXED NATIONALITIES IMPACT ON SAFETY IN CONTAINER SHIPS
46 DIAS TECHNOLOGY REVIEW ¡ VOL. 9 NO. 1 ¡ APRIL - SEPTEMBER 2012
to these factors with loadings above 0.3 (9% of the variation), and the two derived functions from the canonical correlation analysis with higher correlation were, “employee and management's attitude to safety and quality” and “safety and quality experience”. Canonical correlation is a multiple correlation technique that measures the linear correlation between multidimensional variables.
The author also applied Multiple Discriminant Analysis to determine if there exist differences between nationalities, occupations, and vessels on any of the factors. The result indicates that “employee and management's attitude to safety and quality” and “safety and quality experience” were significantly different among nationalities. The nationalities used in the study were: Filipinos, Croatian, Indian, Polish, and Norwegian. The results show a more positive attitude came from Indians, Croatians, and the Filipinos, and a negative attitude came from the Polish and the Norwegians.
Kahveci and Sampson (2001) conducted a study at the Seafarers International Research Centre (SIRC) on international crews and mixed nationalities as part of an ongoing three year research project. A total of fourteen ships of all sizes were part of the study with a total of 350 responses. Only one-third of the ships were from a single nationality group. Onboard, Filipino was the largest nationality followed by Indian and British. English was the official language for everyone to use onboard. However, for many of the workers, English was the second language, and half of the vessels did not have native English speakers on board. Interviews conducted with crew members onboard indicated that language and communication difficulties were the major concern and drawback of having mixed nationality crews. The study found that communication difficulties among mixed nationalities contributed to the overall safety culture onboard.
The study recommended a high minimum level of fluency in English when recruiting officers and ratings was desirable. Long term stability of the crews, promoting and encouraging social activities onboard, implementing anti-discrimination policies, and management skills training for new Masters were some of the recommendations for better safety culture onboard.
Horck (2005) discussed the behavioral problems such as stereotyping that multicultural crews can have at work or off duty that may affect the safety of the ship. Filipino crew members reported their dissatisfaction with excessive drinking by colleagues and distraction by colleagues' body odor. The article points out the importance of human relationships and interpersonal communication among crews. The minimum level of the English language required is not enough to prepare individuals for social life onboard. Communication and language barriers are some of the problems that must be addressed onboard. According to the author, the crews' command of the English language needed for safety onboard is not enough, causing significant communication issues. All crew members should be competent in the language used by the ship in order to perform their job safely as well as socialize with their crewmates. According to the author, some of the reasons that mixed nationality might be a problem is younger generations are not ready to accept old-fashioned management
(management with hierarchical structure) as still practiced today. The author also argues that flat management (management without hierarchical structure) onboard may not be accepted by some other crew members.
Havold (2007) examined the association between international culture and safety orientation of seafarers working for a Norwegian shipping industry. In the study, questionnaire surveys of 2,558 seafarers from 27 countries, produced in English or Norwegian, were collected with a 67% response rate. Only ten countries had more than ten respondents. The ten countries were Norway, Philippines, India, Poland, United Kingdom, Indonesia, the Netherlands, Latvia, Romania, and Cuba. Almost all of the participants were male (96%) and over 50% were from the Philippines. The safety questionnaire consisted of 97-items organized into a 5-point Likert scale.
Havold used the Hofstede Value Survey Model (VSM) to measure five dimensions of national culture: power distance (PD), individualism (IDV), uncertainty avoidance (UA), and masculinity/femininity (MAS), and long term orientation (LTO) (Hofstede,1997).
According to Hofstede, “Power distance is the extent to which less powerful members of institutions and organizations within a country expect and accept that power is distributed unequally.”(Hofstede,1997). Individual initiatives in low power distance index (PDI) societies are encouraged while individual initiatives in high PDI societies are discouraged. Employees in organizations with high power distance index (PDI) tend to fear to disagree with their supervisors while people in low (PDI) society are not afraid of disagreeing with their supervisors (Havold, 2005; Hofstede, 1980). Individualism (IDV) measures whether people prefer to work alone or in groups. People with high IDV are more likely to encourage group work, and people with low IDV are less likely to encourage team work. Uncertainty avoidance (UA) is the measure of uncertainty and ambiguity in the future. People with high UA will tolerate lack of structure in the workplace, and people with low UA will require structure and rules in the workplace. Masculinity/feminity measures the degree in which the society values male and female traditional roles. People with high MAS have high degree of differentiation between male and female, and people with low MAS have low degree of discrimination between male and female. Long term orientation (LOT) measure the degree in which society values or does not value long term commitment and tradition. People with high LOT value the long term commitment and respect tradition, and people with low LOT are not afraid of change and do not enforce long term commitment. According to the author, power distance (PDI) and Individualism (IDV) have significant impact on safety culture perceptions (Havold, 2007).
The Value Survey Model (VSM) is questionnaire that consists of twenty six items and compares individuals from different countries or regions. Using the average of these answers, the index formula for each dimension was derived. For example, an index value of 0 indicates strong feminine and 100 indicates strong masculine. Previous research showed that people with high PDI and low IDV tend to answer questions to please
MIXED NATIONALITIES IMPACT ON SAFETY IN CONTAINER SHIPS
47DIAS TECHNOLOGY REVIEW ¡ VOL. 9 NO. 1 ¡ APRIL - SEPTEMBER 2012
management while people in low PDI and high IDV do not (Havold, 2005; Hofstede, 1980).
Even though all nations seemed to show positive attitudes to safety and risk issues, there were significant differences between countries in the sample (Havold, 2007). There were also significant correlations between safety factors and the indices for national culture. Countries that have the same safety attitude were grouped into homogenous subsets. Norway and the Netherlands, Poland and Latvia, and Philippines and India were grouped into regional culture groups based on the ecological factor analysis. Another finding from this study suggests that crew members from one or two nations had a better, or more positive, attitude towards safety than crew members that were multinational.
Theotokas, Progoulaki, Tsamourgelis, and Tsagari (2006) discussed South Asian seafarers working in Greek-owned shipping industry. The article discussed the exponential growth and the mobility of South Asian seafarers in the world market and in particular the Greek shipping industry. Culture and background differences between Greek seafarers and South Asian were also discussed in this article. Due to the low cost of nationalities from the Philippines, India, South Asians countries, seafarer recruitment form these countries are increasing in the Greek shipping industry. According to the authors, these changes in recruitment create a competition between crews from South Asia and OECD countries. Greek seafarers reported that they work better with Filipinos because of the compatibility of the two cultures. However, Greek seafarers think that Filipino seafarers lack the training and skills compared to their Greek counterparts. According to the authors, Greek officers consider Filipino seafarers to be the most compatible and cooperative to work with onboard Greek Ships. Stereotype and attitudes towards Asian seafarers were reported onboard Greek Ships, but this attitude starts to disappear as Greeks and Filipinos started to know each other (Progoulaki, 2006). The author concluded that Filipinos and Greeks share similar individualism (IDV) indices of 35 and 32 respectively. According to Hofstede (1997), Filipino and Greek cultures are less individualistic. Filipinos' power distance index is 94, and the Greeks' index is 60. This indicates that Filipinos are more obedient and co-operative in the working environment.
Lamvik and Bye (2004) discussed the differences in occupational accidents between Filipino and Norwegian seafarers. The paper is based on accident reports, interviews
and observations. The Hermeneutic method of interpretative approach was used to explain why accident rates among Filipino seafarers are lower than Norwegian seafarers. The Hermeneutic method, as defined by the author, is an interpretation of how different workers might perceive their work environment.
The Norwegian culture system emphasizes the work performance and the importance of individualism, initiative, and professionalism. Filipino seafarers incorporated family obligation into their daily life at work.
Although some research has been conducted in the shipping industry, more work is needed in the area of mixed nationality. The goal of this research is to explore the safety factors proposed and to see if they are related to safety risk based on Nationality.
ETHODS
Sampling and Respondents
A collaborative study between A.P. Moeller-Maersk (APMM), the American Bureau of
Shipping (ABS), and Lamar University (LU) was conducted to investigate and analyze safety leading indicators and safety culture in the marine industry, in particular, container ships.
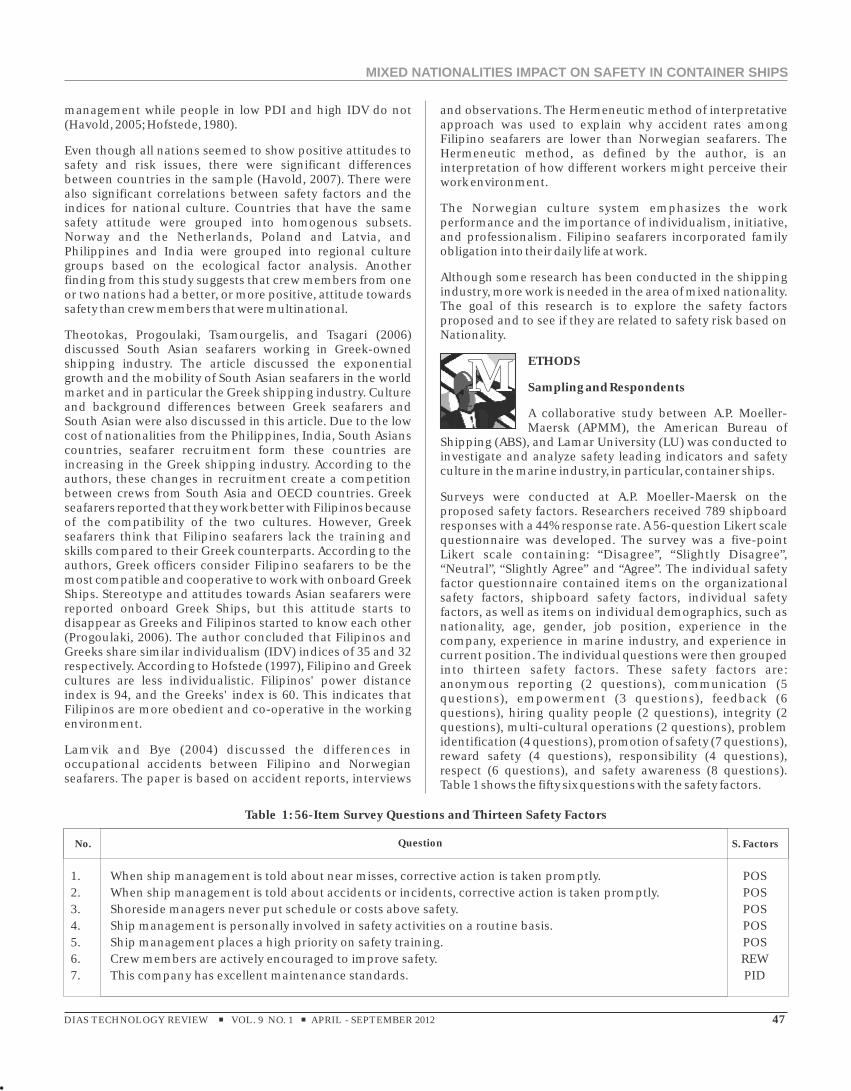
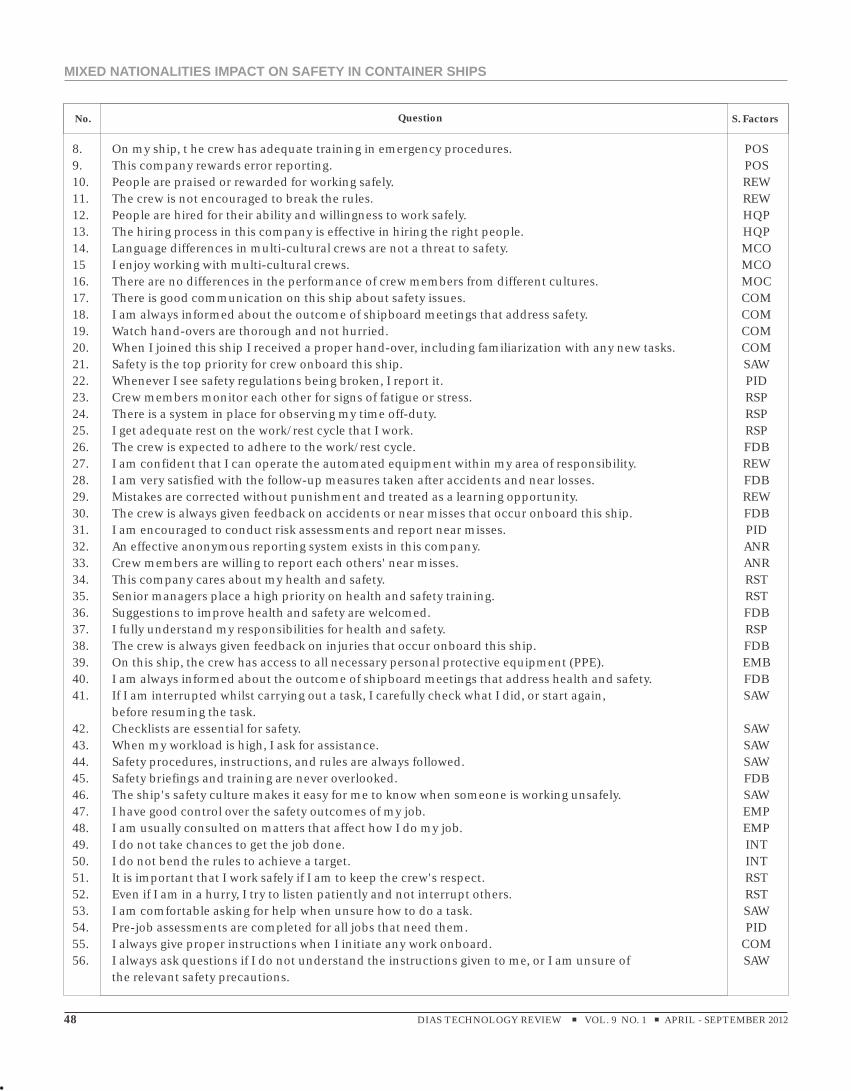
Surveys were conducted at A.P. Moeller-Maersk on the proposed safety factors. Researchers received 789 shipboard responses with a 44% response rate. A 56-question Likert scale questionnaire was developed. The survey was a five-point Likert scale containing: “Disagree”, “Slightly Disagree”, “Neutral”, “Slightly Agree” and “Agree”. The individual safety factor questionnaire contained items on the organizational safety factors, shipboard safety factors, individual safety factors, as well as items on individual demographics, such as nationality, age, gender, job position, experience in the company, experience in marine industry, and experience in current position. The individual questions were then grouped into thirteen safety factors. These safety factors are: anonymous reporting (2 questions), communication (5 questions), empowerment (3 questions), feedback (6 questions), hiring quality people (2 questions), integrity (2 questions), multi-cultural operations (2 questions), problem identification (4 questions), promotion of safety (7 questions), reward safety (4 questions), responsibility (4 questions), respect (6 questions), and safety awareness (8 questions). Table 1 shows the fifty six questions with the safety factors.
MM
Table 1: 56-Item Survey Questions and Thirteen Safety Factors
No. S. FactorsQuestion
1. When ship management is told about near misses, corrective action is taken promptly. POS2. When ship management is told about accidents or incidents, corrective action is taken promptly. POS3. Shoreside managers never put schedule or costs above safety. POS4. Ship management is personally involved in safety activities on a routine basis. POS5. Ship management places a high priority on safety training. POS6. Crew members are actively encouraged to improve safety. REW7. This company has excellent maintenance standards. PID
MIXED NATIONALITIES IMPACT ON SAFETY IN CONTAINER SHIPS
No. S. FactorsQuestion
8. On my ship, t he crew has adequate training in emergency procedures. POS9. This company rewards error reporting. POS10. People are praised or rewarded for working safely. REW11. The crew is not encouraged to break the rules. REW12. People are hired for their ability and willingness to work safely. HQP13. The hiring process in this company is effective in hiring the right people. HQP14. Language differences in multi-cultural crews are not a threat to safety. MCO15 I enjoy working with multi-cultural crews. MCO16. There are no differences in the performance of crew members from different cultures. MOC17. There is good communication on this ship about safety issues. COM18. I am always informed about the outcome of shipboard meetings that address safety. COM19. Watch hand-overs are thorough and not hurried. COM20. When I joined this ship I received a proper hand-over, including familiarization with any new tasks. COM21. Safety is the top priority for crew onboard this ship. SAW22. Whenever I see safety regulations being broken, I report it. PID23. Crew members monitor each other for signs of fatigue or stress. RSP24. There is a system in place for observing my time off-duty. RSP25. I get adequate rest on the work/rest cycle that I work. RSP26. The crew is expected to adhere to the work/rest cycle. FDB27. I am confident that I can operate the automated equipment within my area of responsibility. REW28. I am very satisfied with the follow-up measures taken after accidents and near losses. FDB29. Mistakes are corrected without punishment and treated as a learning opportunity. REW30. The crew is always given feedback on accidents or near misses that occur onboard this ship. FDB31. I am encouraged to conduct risk assessments and report near misses. PID32. An effective anonymous reporting system exists in this company. ANR33. Crew members are willing to report each others' near misses. ANR34. This company cares about my health and safety. RST35. Senior managers place a high priority on health and safety training. RST36. Suggestions to improve health and safety are welcomed. FDB37. I fully understand my responsibilities for health and safety. RSP38. The crew is always given feedback on injuries that occur onboard this ship. FDB39. On this ship, the crew has access to all necessary personal protective equipment (PPE). EMB40. I am always informed about the outcome of shipboard meetings that address health and safety. FDB41. If I am interrupted whilst carrying out a task, I carefully check what I did, or start again, SAW
before resuming the task.42. Checklists are essential for safety. SAW43. When my workload is high, I ask for assistance. SAW44. Safety procedures, instructions, and rules are always followed. SAW45. Safety briefings and training are never overlooked. FDB46. The ship's safety culture makes it easy for me to know when someone is working unsafely. SAW47. I have good control over the safety outcomes of my job. EMP48. I am usually consulted on matters that affect how I do my job. EMP49. I do not take chances to get the job done. INT50. I do not bend the rules to achieve a target. INT51. It is important that I work safely if I am to keep the crew's respect. RST52. Even if I am in a hurry, I try to listen patiently and not interrupt others. RST53. I am comfortable asking for help when unsure how to do a task. SAW54. Pre-job assessments are completed for all jobs that need them. PID55. I always give proper instructions when I initiate any work onboard. COM56. I always ask questions if I do not understand the instructions given to me, or I am unsure of SAW
the relevant safety precautions.
48 DIAS TECHNOLOGY REVIEW ¡ VOL. 9 NO. 1 ¡ APRIL - SEPTEMBER 2012
MIXED NATIONALITIES IMPACT ON SAFETY IN CONTAINER SHIPS
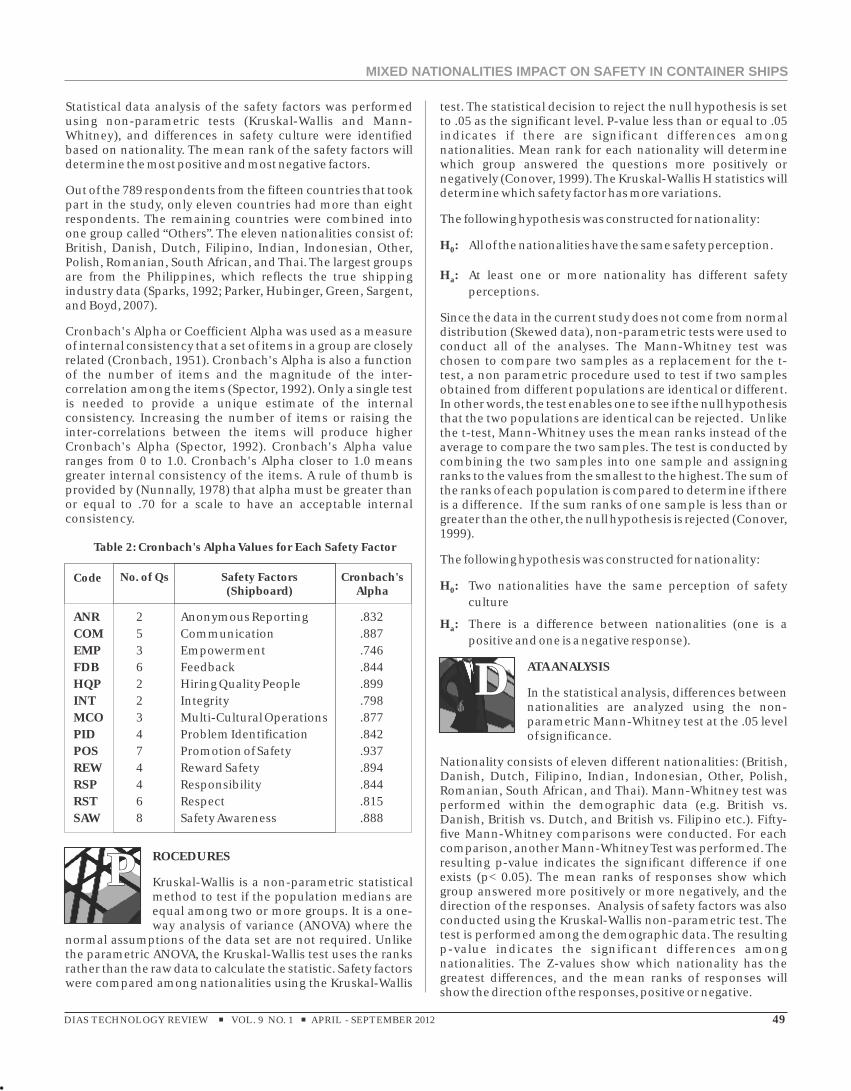
Statistical data analysis of the safety factors was performed using non-parametric tests (Kruskal-Wallis and Mann-Whitney), and differences in safety culture were identified based on nationality. The mean rank of the safety factors will determine the most positive and most negative factors.
Out of the 789 respondents from the fifteen countries that took part in the study, only eleven countries had more than eight respondents. The remaining countries were combined into one group called “Others”. The eleven nationalities consist of: British, Danish, Dutch, Filipino, Indian, Indonesian, Other, Polish, Romanian, South African, and Thai. The largest groups are from the Philippines, which reflects the true shipping industry data (Sparks, 1992; Parker, Hubinger, Green, Sargent, and Boyd, 2007).
Cronbach's Alpha or Coefficient Alpha was used as a measure of internal consistency that a set of items in a group are closely related (Cronbach, 1951). Cronbach's Alpha is also a function of the number of items and the magnitude of the inter-correlation among the items (Spector, 1992). Only a single test is needed to provide a unique estimate of the internal consistency. Increasing the number of items or raising the inter-correlations between the items will produce higher Cronbach's Alpha (Spector, 1992). Cronbach's Alpha value ranges from 0 to 1.0. Cronbach's Alpha closer to 1.0 means greater internal consistency of the items. A rule of thumb is provided by (Nunnally, 1978) that alpha must be greater than or equal to .70 for a scale to have an acceptable internal consistency.
ROCEDURES
Kruskal-Wallis is a non-parametric statistical method to test if the population medians are equal among two or more groups. It is a one-way analysis of variance (ANOVA) where the
normal assumptions of the data set are not required. Unlike the parametric ANOVA, the Kruskal-Wallis test uses the ranks rather than the raw data to calculate the statistic. Safety factors were compared among nationalities using the Kruskal-Wallis
ANR 2 Anonymous Reporting .832COM 5 Communication .887EMP 3 Empowerment .746FDB 6 Feedback .844HQP 2 Hiring Quality People .899INT 2 Integrity .798MCO 3 Multi-Cultural Operations .877PID 4 Problem Identification .842POS 7 Promotion of Safety .937REW 4 Reward Safety .894RSP 4 Responsibility .844RST 6 Respect .815SAW 8 Safety Awareness .888
Code No. of Qs Safety Factors(Shipboard)
Cronbach'sAlpha
Table 2: Cronbach's Alpha Values for Each Safety Factor
test. The statistical decision to reject the null hypothesis is set to .05 as the significant level. P-value less than or equal to .05 indicates if there are significant differences among nationalities. Mean rank for each nationality will determine which group answered the questions more positively or negatively (Conover, 1999). The Kruskal-Wallis H statistics will determine which safety factor has more variations.
The following hypothesis was constructed for nationality:
H : All of the nationalities have the same safety perception.0
H : At least one or more nationality has different safety a
perceptions.
Since the data in the current study does not come from normal distribution (Skewed data), non-parametric tests were used to conduct all of the analyses. The Mann-Whitney test was chosen to compare two samples as a replacement for the t-test, a non parametric procedure used to test if two samples obtained from different populations are identical or different. In other words, the test enables one to see if the null hypothesis that the two populations are identical can be rejected. Unlike the t-test, Mann-Whitney uses the mean ranks instead of the average to compare the two samples. The test is conducted by combining the two samples into one sample and assigning ranks to the values from the smallest to the highest. The sum of the ranks of each population is compared to determine if there is a difference. If the sum ranks of one sample is less than or greater than the other, the null hypothesis is rejected (Conover, 1999).
The following hypothesis was constructed for nationality:
H : Two nationalities have the same perception of safety 0
culture
H : There is a difference between nationalities (one is a a
positive and one is a negative response).
ATA ANALYSIS
In the statistical analysis, differences between nationalities are analyzed using the non-parametric Mann-Whitney test at the .05 level of significance.
Nationality consists of eleven different nationalities: (British, Danish, Dutch, Filipino, Indian, Indonesian, Other, Polish, Romanian, South African, and Thai). Mann-Whitney test was performed within the demographic data (e.g. British vs. Danish, British vs. Dutch, and British vs. Filipino etc.). Fifty-five Mann-Whitney comparisons were conducted. For each comparison, another Mann-Whitney Test was performed. The resulting p-value indicates the significant difference if one exists (p< 0.05). The mean ranks of responses show which group answered more positively or more negatively, and the direction of the responses. Analysis of safety factors was also conducted using the Kruskal-Wallis non-parametric test. The test is performed among the demographic data. The resulting p-value indicates the significant differences among nationalities. The Z-values show which nationality has the greatest differences, and the mean ranks of responses will show the direction of the responses, positive or negative.
PP
DD
49DIAS TECHNOLOGY REVIEW ¡ VOL. 9 NO. 1 ¡ APRIL - SEPTEMBER 2012
MIXED NATIONALITIES IMPACT ON SAFETY IN CONTAINER SHIPS

Filipino 35.07Indian 18.57Other 12.34Danish/Faroese 11.30British 8.05Dutch 4.29South African 3.25Romanian 2.60Indonesian 1.82Thai 1.69Polish 1.04
Nationality Percentage (%)
Table 3: Percentages of Nationalities
ESULTS
Cronbach's alpha reliability test was used to test whether the safety factors were consistent and reliable. It's a statistical test commonly used to measure the internal consistency or
the reliability of a scale. Generally, the Cronbach's alpha will increase if the inter-correlations among the items are high. Another way to increase Cronbach's alpha is by increasing the number of items (Cronbach, 1951).
Cronbach's Alpha values for each safety factors are shown in Table 2. The test value for each factor was well above 0.70 (Sekaran, 1992; Nunnally, 1978; Churchill, 1991).
Descriptive Statistics
Exploratory analysis revealed that the largest nationality, with 35.07% of the crew, came from the Philippines, and the smallest nationality, with 1.04%, were Polish. The older crew members, 40 years old and up, are the British, the Danish, and the Dutch. The younger crew members, less than 30 years old, are the Indians, the Romanians, and the Thai. Some of the respondents did not provide their nationality and hence their responses were not included in this table. Statistical results are provided in Table 3.
Inferential Statistics
The Kruskal-Wallis statistical analysis results of nationality comparisons are shown in Table 4. Negative Z-value indicates
RRthat the mean rank for the safety factor is below the mean rank for all the observations and positive Z-value indicates that the mean response for the nationality is above the mean rank for all the observations. Z-value below -1.96 (p<.05) or above 1.96 (p<.05) indicates significantly different from the mean rank for all the data. Large H statistics value indicates high variability and small H statistic value indicates low variability. Table 4 also represents the safety factor mean rank of each nationality as well as the overall mean rank.
Negative survey responses came from British, Danish, Dutch, and South African and positive responses came from Indian, Indonesian, Romanian, and Thai. Overall, hiring quality people (HQP), multicultural operation (MCO), promotion of safety (POS), and anonymous reporting (ANR) possessed the most negative responses. Empowerment (EMP), safety awareness (SAW), integrity (INT), and Feedback (FDB) possessed the most positive responses.
Crew members from OECD countries responded negatively on almost all of the safety factors. OECD countries possessed the most negative responses on hiring quality people (HQP) and multi-cultural operations (MCO). Crew members from Asia responded positively on almost all of the safety factors.
Crew members from Asia responded more positively than crew members from OECD on almost all of the safety factors. They scored lower on hiring quality people (HQP) than the rest of the factors. Filipino crew members responded positively somewhere between OECD countries and Asian countries. They responded more negatively on promotion of safety (POS) than Asian crew members.
Safety awareness (SAW), hiring quality people (HQP), multicultural operation (MCO), and feedback (FDB) possessed the highest variation between nationalities. Reward Safety (REW), responsibility (RSP), and integrity (INT) possessed the smallest variation between nationalities. Table 5 shows the Z-values comparisons between the safety factors. Large Z-value indicates larger difference between the safety factors. Pair-wise comparisons among the safety factors also were conducted and the results are presented in Table 6.
Overall average rank for all the observations is 22092.5. A mean rank scores above the overall mean rank indicates
Table 4: Kruskal-Wallis Comparison of Z-Values, Mean Ranks, and H Statistics for Nationalities.
50 DIAS TECHNOLOGY REVIEW ¡ VOL. 9 NO. 1 ¡ APRIL - SEPTEMBER 2012
MIXED NATIONALITIES IMPACT ON SAFETY IN CONTAINER SHIPS
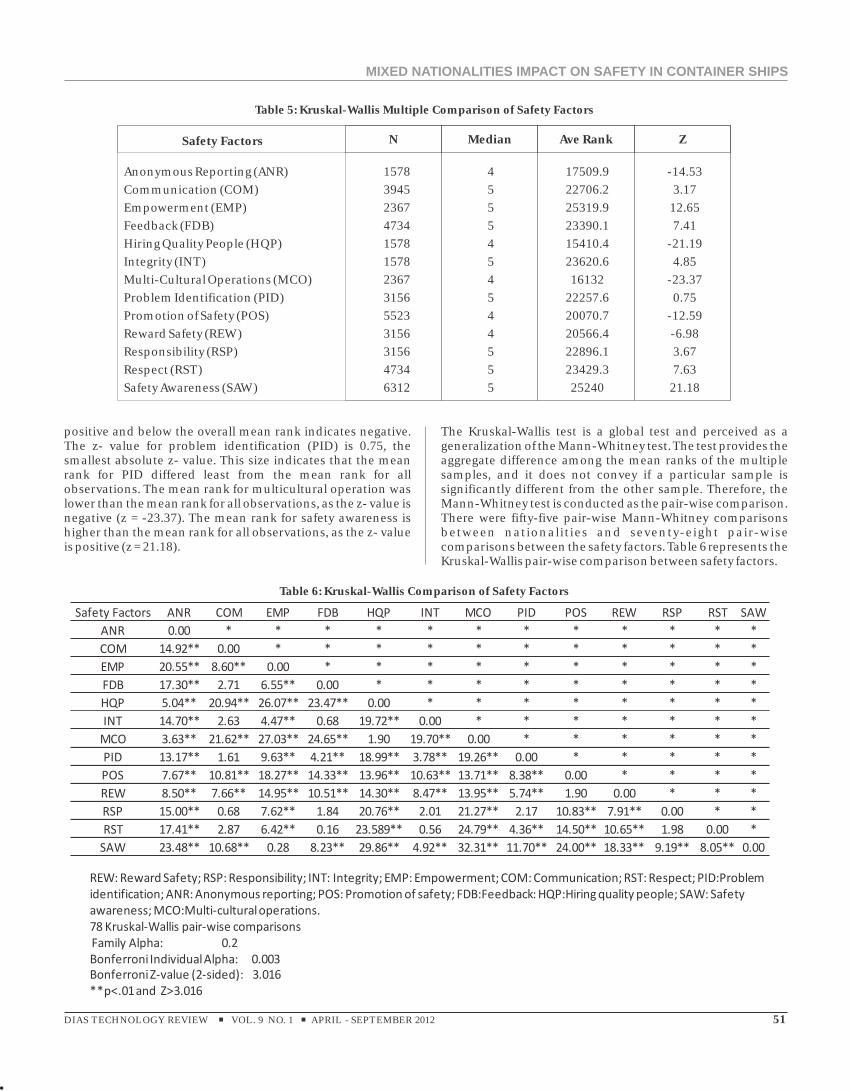
positive and below the overall mean rank indicates negative. The z- value for problem identification (PID) is 0.75, the smallest absolute z- value. This size indicates that the mean rank for PID differed least from the mean rank for all observations. The mean rank for multicultural operation was lower than the mean rank for all observations, as the z- value is negative (z = -23.37). The mean rank for safety awareness is higher than the mean rank for all observations, as the z- value is positive (z = 21.18).
Anonymous Reporting (ANR) 1578 4 17509.9 -14.53Communication (COM) 3945 5 22706.2 3.17Empowerment (EMP) 2367 5 25319.9 12.65Feedback (FDB) 4734 5 23390.1 7.41Hiring Quality People (HQP) 1578 4 15410.4 -21.19Integrity (INT) 1578 5 23620.6 4.85Multi-Cultural Operations (MCO) 2367 4 16132 -23.37Problem Identification (PID) 3156 5 22257.6 0.75Promotion of Safety (POS) 5523 4 20070.7 -12.59Reward Safety (REW) 3156 4 20566.4 -6.98Responsibility (RSP) 3156 5 22896.1 3.67Respect (RST) 4734 5 23429.3 7.63Safety Awareness (SAW) 6312 5 25240 21.18
Safety Factors N Median Ave Rank Z
Table 5: Kruskal-Wallis Multiple Comparison of Safety Factors
The Kruskal-Wallis test is a global test and perceived as a generalization of the Mann-Whitney test. The test provides the aggregate difference among the mean ranks of the multiple samples, and it does not convey if a particular sample is significantly different from the other sample. Therefore, the Mann-Whitney test is conducted as the pair-wise comparison. There were fifty-five pair-wise Mann-Whitney comparisons between nationalities and seventy-eight pair-wise comparisons between the safety factors. Table 6 represents the Kruskal-Wallis pair-wise comparison between safety factors.
Table 6: Kruskal-Wallis Comparison of Safety Factors
51DIAS TECHNOLOGY REVIEW ¡ VOL. 9 NO. 1 ¡ APRIL - SEPTEMBER 2012
MIXED NATIONALITIES IMPACT ON SAFETY IN CONTAINER SHIPS
The Mann-Whitney statistical analysis of the fifty-six shipboard questionnaire responses revealed a number of instances where crew members in different nationalities had a different perception of safety culture. The questions with a relatively small number of significant differences for the fifty-five comparisons were:
Question 4: Ship management is personally involved in safety activities on a routine basis (POS) (three significant p-values).
Question 6: Crew members are actively encouraged to improve safety (REW) (four significant p-values).
Question 20: When I joined this ship I received a proper hand-over, including familiarization with any new tasks (COM) (three significant p-values).
Question 24: There is a system in place for observing my time off-duty (RST) (four significant p-values).
Question 53: I am comfortable asking for help when unsure how to do a task (SAW) (three significant p-values).
Questions with relatively large number of significant p-values are:
Question 9: This Company rewards error reporting (POS) (thirty one significant p-values)
Question 12: People are hired for their ability and willingness to work safely (HQP) (thirty three significant p-values).
Question 14: Language differences in multi-cultural crews are not a threat to safety (MCO) (thirty six significant p-values).
Question 15: I enjoy working with multi-cultural crews (MCO) (thirty three significant p-values).
Question 16: There are no differences in the performance of crew members from different cultures (MCO) (thirty six significant p-values).
Question 21: Safety is the top priority for crew onboard this ship (SAW) (thirty significant p-values).
Some of the Mann-Whitney comparisons that possess the least differences for all the fifty six questions are: British vs. Dutch, British vs. South African, and Polish vs. South African, Indonesian vs. Thai, and Filipino vs. Polish. Some of the Mann-Whitney Comparisons that possess the greatest differences are: Dutch vs. Romanian, Other vs. Polish, British vs. Romanian, Other vs. British, Indian vs. South African, Indonesian vs. Thai, and British vs. Danish.
ISCUSSION
The focusing on safety culture and employees' perception of safety is an important issue in the shipping industry. The result of this study is an attempt to identify some of the
differences in safety culture perceptions in the shipping industry based on nationality. The current study investigated the impact of nationality in the form of a questionnaire of safety culture onboard 110 container ships. Safety perceptions of crewmembers were compared among eleven different nationalities. The study also examined thirteen safety factors presented in this paper with each other.
In the sample, more than one third of the nationalities were from a single country, the Philippines. Filipino crew members represent 35% of the data and Indians represent 19%, which is common in the shipping industry. This result is supported by previous research by the Seafarer International Research Centre (SIRC). A survey of 10,958 seafarers showed that one third of nationalities came from the Philippines (Kahveci and Sampson 2001). Another study of seafarers working for Norwegian shipping companies by Havold (2007) had over 50% respondents from the Philippines (Havold 2007).
British, Danish, Dutch, and South African answers also suggest that language and culture differences may contribute to safety concerns onboard. This result is consistent with a previous study by Kahveci and Sampson (2001). In the study, the authors found that communication difficulties existed between seafarers because of mixed nationality crew. Havold (2005) also pointed out the impact of mixed nationalities on the overall safety culture of the vessel. On the other hand, Indian, Indonesian, Romania, and Thai answers suggest that they have a positive attitude towards safety on almost all of the safety factors.
Hiring quality people (HQP), multicultural operation (MCO), promotion of safety (POS), and anonymous reporting (ANR) possessed the most negative responses. In these categories, crew members feel that the company is not hiring the most qualified people and multicultural operation is a major safety concern. They also feel that an effective anonymous reporting system does not exist in this company. Overall, empowerment (EMP), safety awareness (SAW), integrity (INT), and Feedback (FDB) possessed the most positive responses. Crew members feel that they have control over the safety outcome of their job.
Seven out of eleven nationalities responded positively except for British, Danish, Dutch, and South African. The result suggests big disagreement among nationalities on the company's effective anonymous reporting policy and the willingness of crew members to report near misses.
The most negative responses for OECD countries are in the area of hiring quality people (HQP) and multi-cultural operation (MCO). In these categories, crew members feel that management are not effectively hiring skilled and qualified people and new hires are not fit for the job. More than half of the nationalities perceive that hiring qualified people in the company is a problem. They also feel that company safety policies and procedures are not efficient; therefore, crew members are not following the rules. The crews feel that multicultural working environment is not safe and language is a threat to safety. These results are consistent with previous research (Havold, 2007; Kahveci & Sampson, 2001; Lamvick & Bye, 2004).
While crew members from European countries have the same view of safety, crew members from Asia, except for Filipinos,
DD
52 DIAS TECHNOLOGY REVIEW ¡ VOL. 9 NO. 1 ¡ APRIL - SEPTEMBER 2012
MIXED NATIONALITIES IMPACT ON SAFETY IN CONTAINER SHIPS
view safety differently. Generally, most of the crew members from Asia are positive about safety. Unlike crew members from OECD countries, crew members from Asia answered positively on all the safety factors. These results are consistent with previous studies that suggested crew members from Asia are likely to answer survey questions positively (Havold, 2007).
Havold (2007) discussed Hofstede's method that nationality with high power distance index (PDI) tends to accept that power are distributed unequally and people with low Individualism index (IDV) tend to have strong family or group ties. Those people are more likely to answer questions that would please management (Havold, 2007). In this case, nationalities from Philippines, India, Indonesia, and Thailand are considered to be high PDI and low IDV. British, Dutch, Danish, and South African are low PDI and high IDV.
Havold (2007) found that all nations showed positive attitude towards safety. Nations from European origin tend to answer these questions negatively, and nations from the Far East tend to answer the questions positively. He concluded that the importance of safety issues is not shared across all nationalities.
Filipino crew members responded positively, somewhere between OECD countries and Asian countries. They responded more negatively on promotion of safety (POS) than Asian crew members. The answers suggest that Filipinos feel that managers put schedule or costs above safety and the company does not reward error reporting.
Lamvik and Bye (2004) discussed the differences in occupational accidents between Norwegian and Filipino. He argued that the Filipino accident rate is lower than Norwegian because the Norwegian seafarers culture system emphasizes the work performance and cherishes individualism, professionalism, and initiative, whereas Filipino crew members added and incorporated family obligations into their daily life onboard. In other words, Filipino crew members do not engage in dangerous work situations because they are the sole providers for their family and they think of their safety in order to help their family back home (Lamvik and Bye 2004).
Safety awareness (SAW), hiring quality people (HQP), multicultural operation (MCO), and feedback (FDB) possessed the highest variation between nationalities. The large variation in these safety factors explains the great cultural differences among nationalities, the disagreement between crews of the hiring process of skilled qualified people in the company, the lack of enforcement of the company safety policies and procedures, and the impact of culture differences onboard. Horck (2005) emphasizes the important of human element and argues that lower cost and quality of seafarer might have an impact on safety performance onboard. Horck (2005) claims that through education, awareness, and training, cultural differences can be diminished and globalization can be achieved. The Mann-Whitney test revealed that crew members from OECD countries view multicultural work environment as a threat to safety onboard. They feel that there are differences in the performance of crew members from different cultures. The crew members also feel that language differences in multi-cultural crews are a threat to safety.
ONCLUSION / RECOMMENDATIONS
The shipping industry is a multicultural work environment that has little or no work conducted in relation to mixed nationality safety culture. The present study showed that
significant differences in safety culture perception existed between the safety factors as well as the individual nationalities. The results found that not all nationalities showed a positive attitude toward safety. Nationalities from European origin tend to answer these questions negatively, and nationalities from Asia tend to answer positively.
The study also revealed that hiring quality people (HQP), multicultural operation (MCO), promotion of safety (POS), and anonymous reporting (ANR) possessed the most overall negative responses. It is also demonstrated that safety factors such as hiring quality people (HQP) and multicultural operation (MCO) are negatively related to nationalities from the OECD countries and positively related to nationalities from Asia. On the other hand, nationalities from Asia responded positively on all of the safety factors. It is also shown that OECD nationalities had negative safety perceptions and Asian nationalities had positive safety perceptions. Hiring quality people (HQP) and multicultural operation (MCO) also represent the greatest differences among the OECD nationalities and Asia nationalities. The study also showed that the Filipinos, the largest nationality onboard, were concerned regarding the reporting system of unsafe acts by the company.
In order to improve safety performance and work conditions of seafarers onboard, the industry must improve the quality of crew members through education and training. Hiring skilled and well-trained crews will not only help the company achieve their safety goals but also protect the marine environment from disasters. Management should address not only the technical skill of seafarers but also the communication and language skills. It is apparent from this study that cultural awareness training is essential to safety and cohesion on board. Non-technical skills or cognitive skills such as communication, decision making, culture awareness, teamwork, and social skills may reduce human errors in the shipping industry (Theotokas et al. 2006).
In the case of nationalities from OECD countries, the researchers suggest additional focus be given to the implementations of safety procedures to address the negative responses in the following safety factors:
Multicultural Operation (MCO)
The results suggest that mixed nationality is a major safety concern. In order to address language difficulties onboard and communication among mixed nationalities, these recommendations can potentially help the organization improve their safety record:
• P r ov i d e h i g h e r p e rc e n t a g e o f t r a i n i n g a n d documentation in native language
• Investigate the language differences and provide language training
CC
53DIAS TECHNOLOGY REVIEW ¡ VOL. 9 NO. 1 ¡ APRIL - SEPTEMBER 2012
MIXED NATIONALITIES IMPACT ON SAFETY IN CONTAINER SHIPS
• Implement social activities onboard that would improve the interaction between mixed nationalities onboard
• Require minimum level of English fluency when recruiting
• Provide cultural awareness training program that focuses on educating crew members about different cultural characteristics, beliefs, values, religions, behaviors, and communication.
• Provide specific language training such as frequently used technical phrases and terms onboard and how to pronounce them correctly
• Implement a strict tolerance policy for discrimination and stereotyping onboard.
• Provide accommodations for different faiths and customs.
Hiring Quality People (HQP)
The process of hiring skilled and qualified crew members is crucial to safety onboard. The organization has a plan on how to recruit and retain well-trained employees. The following recommendations are proposed to address the negative responses:
• Review the company hiring policy and procedures and document it.
• Provide quality training for transfer or new employees in leadership, team work, workload management, decision making, personal limitations, and stress management.
• Provide quality training for human resources employees on how to retain employees.
• Provide internship training program to identify potentially qualified crews.
• Involve immediate supervisors directly in the hiring process and interviews.
• Provide attractive employment compensation packages.
Anonymous Reporting (ANR)
Reporting incidents without fear of being blamed is an important factor in an effective safety culture system. It is important that employees feel confident that the reporting system is anonymous, and they should be encouraged to report incidents and near misses without the fear of being punished. A good reporting system should inform the employees that their input is very important and the actions the company has taken to correct. The following recommendations are proposed to address the negative responses:
• Work on improving the anonymous reporting system in the company and remove the obstacles by ensuring the anonymity of the employee.
• Set target for near misses reported by employees.
In the case of Filipinos, the researchers suggest additional focus be given to the implementations of safety procedures to address the negative responses in the following safety factors:
Promotion of Safety (POS)
Promotion of safety is the level of commitment in which upper management is willing to undertake safety promotion. The following recommendations are suggested to improve POS:
• Encourage near miss reporting by offering an appropriate non-monetary reward or recognition.
• Continuously improve new safety goals.
• Set new targets for prompt closure of corrective action reports, the number of safety audit recommendations, the number of safety meetings attended by management, the number of crew members attending safety training, and the number of safety meetings attended by senior management.
• Increase the number of crew members that meet the STCW requirements.
• Establish zero tolerance policy for intentional safety violations.
• Communicate safety expectations clearly to crew members by management through bulletin boards, websites, and supervisors.
• Provide employee training in safety policies and procedures.
In case of variation, the researchers suggest additional focus be given to the implementation of safety procedures to address the largest variations in the following safety factors:
Safety Awareness (SAW)
In order for employees to perform their jobs safely, the organization must provide all the communication tools and training to achieve the highest safety standard. The following recommendations are suggested:
• Provide training in the use of safety checklists onboard
• Provide training in safety procedures and instructions
• Provide management training in safety investigations
• Encourage employees' involvement in safety meetings
• Offer more safety training with incentives
• Set goals and targets for safety meetings attended by crew members
• Implement a training program in safety awareness and safety investigation
• Set targets for safety meetings attended by senior management
• Set targets for near misses reported by crew members
54 DIAS TECHNOLOGY REVIEW ¡ VOL. 9 NO. 1 ¡ APRIL - SEPTEMBER 2012
MIXED NATIONALITIES IMPACT ON SAFETY IN CONTAINER SHIPS
• Communicate the results of near misses and the corrective actions that have been taken by senior management
Hiring Quality People (HQP) was addressed above.
Multicultural Operation (MCO) was addressed above.
TUDY LIMITATIONS
In the current research, two limitations must be addressed. First, the survey questionnaire is written in the English language, and some nationalities might interpret questions
differently. As a result, the score responses from different nationalities might be biased. Future research must address the language barrier by implementing questionnaires in
55DIAS TECHNOLOGY REVIEW ¡ VOL. 9 NO. 1 ¡ APRIL - SEPTEMBER 2012
multiple languages. Second, the survey was conducted in one shipping company, and more research in multiple shipping companies is needed in order to generalize to the industry.
UTURE RESEARCH
The differences observed among nationalities provide a solid foundation for future study of the working conditions, safety perceptions, and attitudes of seafarers in order to improve
safety culture onboard. A more extensive investigation of safety culture would also require a comparison of vessels from different shipping companies. Additional studies are also needed to examine nationalities by gender, age, job position, and maritime experience. The logistic regression techniques can be used for modeling the relationship between the response variables and the set of independent variables.
SSFF
REFERENCES1 Baltic and International Maritime Council and International Shipping Federation (BIMCO/ISF). 2005. BIMCO/ISF 2005 Manpower Update. Retrieved from
http://www2.warwick.ac.uk/fac/soc/ier/publications/2005/bimco-isf_update_2005.pdf2 Churchhill, G. A. (1991). Marketing research: Methodological foundation. New York: The Dryden Press. 3 Conover, W. (1999). Practical nonparametric statistics. New York, New York: Wiley and Sons. 4 Cronbach, L. J. (1951). Coefficient Alpha and the internal structure of tests. Psychometrika, 16 (3), 297-334.5 Ek, A., Olsson, U. M., & Akelson, K. R. (2001). Safety culture onboard ships. International Ergonomics Association/-Human Factors and Ergonomics Society
(p. 320-322). San Diego, CA.6 Havold, J. I. (2005). Safety-culture in a Norwegian Shipping Company. Journal of Safety Research, 36, 441-458.7 Havold, J. I. (2007). Natural culture and safety orientation: A study of seafarers working for Norwegian Shipping Companies. Work & Stress, 21 (2), 173-195.8 Hetherington, C., Flin, R., & Mearns, K. (2006). Safety in shipping: The human element. Journal of Safety Research, 37, 401-411.9 Hofstede, G. (1997). Cultures and organizations. Software of the mind. New York, New York: McGraw-Hill. 10 Hofstede, G. (1980). Culture's consequences: International differences in work-related values. London: Sage Publications. 11 Horck, J. (2005). Getting the best from multi-cultural manning. BIMCO Bulletin, 100 (4), 28-36.12 International Maritime Organization. (2002). International Safety Management Code. Retrieved from IMO website:
http://www5.imo.org/SharePoint/mainframe.asp?topic_id=287 13 Jamieson, S. (2004). Likert Scales: How to (ab)use them. Medical Education, 38, 1212-1218.14 Kahaveci, E. & H. Sampson. (2001, June). Findings from the shipboard based study of mixed nationality crews. Seafarers International Research Centre
Symposium, Cardiff University.15 Lamvik, G. M. & Bye, R. (2004). National Culture and Safe Work Practice-A Comparison between Filipinos and Norwegian seafaring professionals.
International Conference on Probabilistic Safety Assessment and Management (p. 1315-1321). Berlin, Germany.16 Meshkati, N. (1997, April). Human performance, organizational Factors and safety culture. Paper presented at the meeting of Corporate Culture and
Transportation Safety. Washington D.C., U.S. National Transportation Safety Board. 17 Mearns, K., Whitaker, S. & Flin, R. (2003). Safety climate, safety management practice and safety performance in offshore environments. Safety Science, 41,
641-680.18 Nadler, E. (2005, May 22). Safety lapses plague oil tankers. Retrieved from http:///www.pwsrcac.org/docs/d0005201.pdf 19 National Commission on the BP Deepwater Horizon Oil Spill and Offshore Drilling. (2011). National Commission on the BP Deepwater Horizon Oil Spill
and Offshore Drilling. Deep Water: The Gulf Oil Disaster and the Future of Offshore Drilling. Washington, D.C. Retrieved from: http://tinyurl.com/4j5fy8k20 Nunnally, J. C. (1978). Psychometric theory. New York, New York: McGraw-Hill. 21 Orlich, S.. (2000). Kruskal-Wallis Multiple Comparisons with a MINITAB Macro Dunn's Test. Retrieved from
http://www.minitab.com/support/macros/default.aspx22 Parker, A, Hubinger, L., Green, S., Sargent, L., & Boyd, R. (2007). A survey of health, stress, and fatigue of Australian seafarers. Australian Maritime Safety
Authority, 1-185.23 Progoulaki, M. (2006). Dealing with the culture of the maritime manpower in a socially responsible manner. International Conference in Shipping in the
Era of Social Responsibility, Cephalonia, Greece.24 Sekaran, U. (1992). Research Methods for business, 2nd ed. New York, New York: John Wiley and Son. 25 Soma, T. (2005). A data interrogation approach for identification of safety characteristics determining whether shipping organization is BLUE CHIP or SUB-
STANDARD. (Doctoral dissertation, Norwegian University of Science and Technology,). Retrieved from: http://www.ntnu.edu/26 Sparks, P. (1992). Questionnaire survey of masters, mates and pilots of a state ferries system on health, social and performance indices relevant to shift work.
American Journal of Industrial Medicine, 21 507-516.27 Spector, P. (1992). Summated rating scale construction. Thousand Oaks, CA: Sage. 28 Theotokas, I., Progoulaki, M., Tsamourgelis, J., & Tsagari, E. (2006). South- Asian Seafarers on board Greek- owned ships: Organisational, managerial and
Cultural Issues. The 2nd International Conference on EU- East and South- Asia Trade, Investment, Logistics and E- Business, Chios, Greece.29 Wayne, D. (1990). Applied nonparametric statistics. Boston: Houghton Mifflin.
ACKNOWLEDGMENTS
This project was supported by grants from American Bureau of Shipping (ABS) and A.P. Moeller-Maersk (APMM). The authors would like to thank the American Bureau of Shipping and A.P. Moeller-Maersk for their generous support.
MIXED NATIONALITIES IMPACT ON SAFETY IN CONTAINER SHIPS