mixed species volume equation for lowland tropical forests. · mixed species volume equation for...
TRANSCRIPT
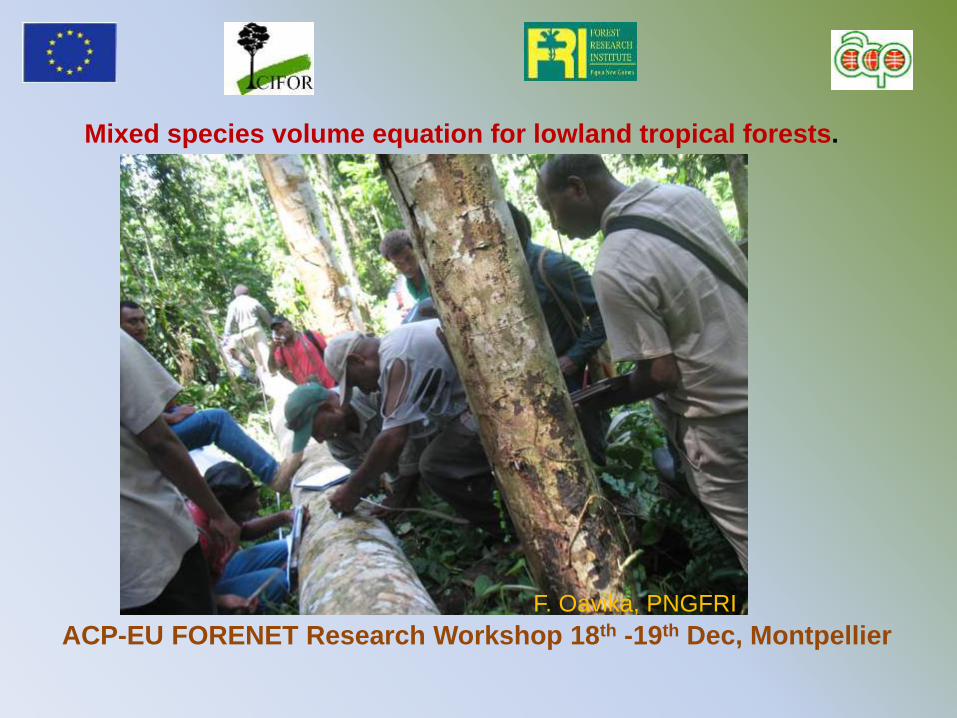
ACP-EU FORENET Research Workshop 18th -19th Dec, Montpellier
Mixed species volume equation for lowland tropical forests.
F. Oavika, PNGFRI

Introduction.
Local tree volume equations as well as biomass allometric equations are
important requirements for MRV under UN REDD guidelines.
The use of volume equation for estimation of forest timber volume is
necessary for MRV (monitoring, reporting & verification) purposes. It is
required to have a basis for a volume calculation based on local
information. It is also useful to have information available for
development of volume tables for use within the country.
Tree volume assessment was also taken as part of the biomass
measurement for the development of allometric equations in the
implementation of the Cross continental project in the ACP countries.
Trees felled for biomass assessment were first assessed for volume.
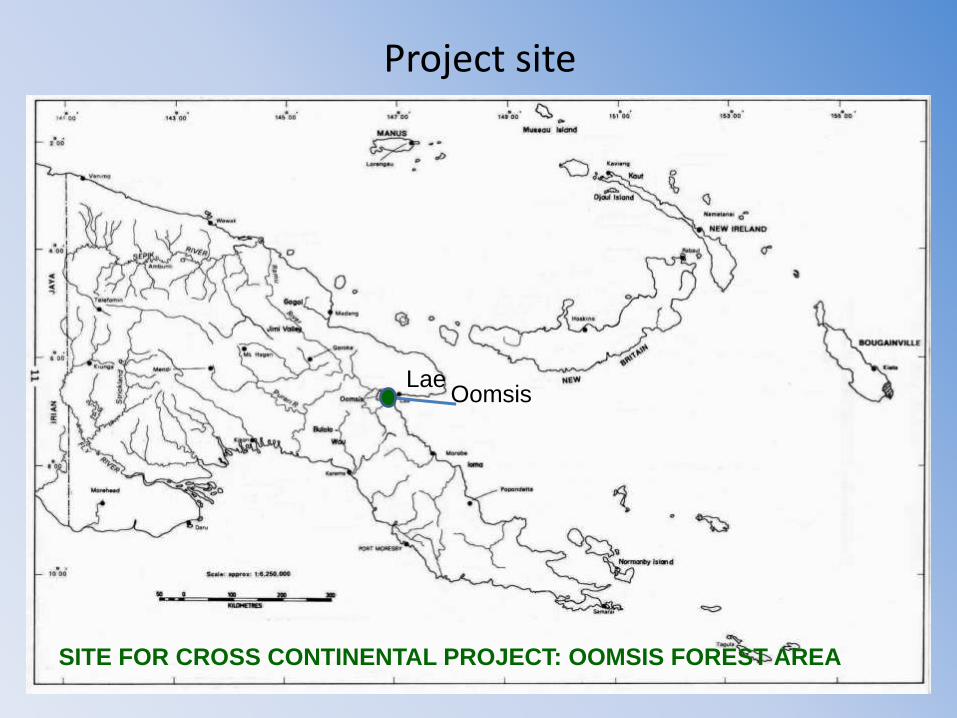
Project site
Oomsis
SITE FOR CROSS CONTINENTAL PROJECT: OOMSIS FOREST AREA
Lae
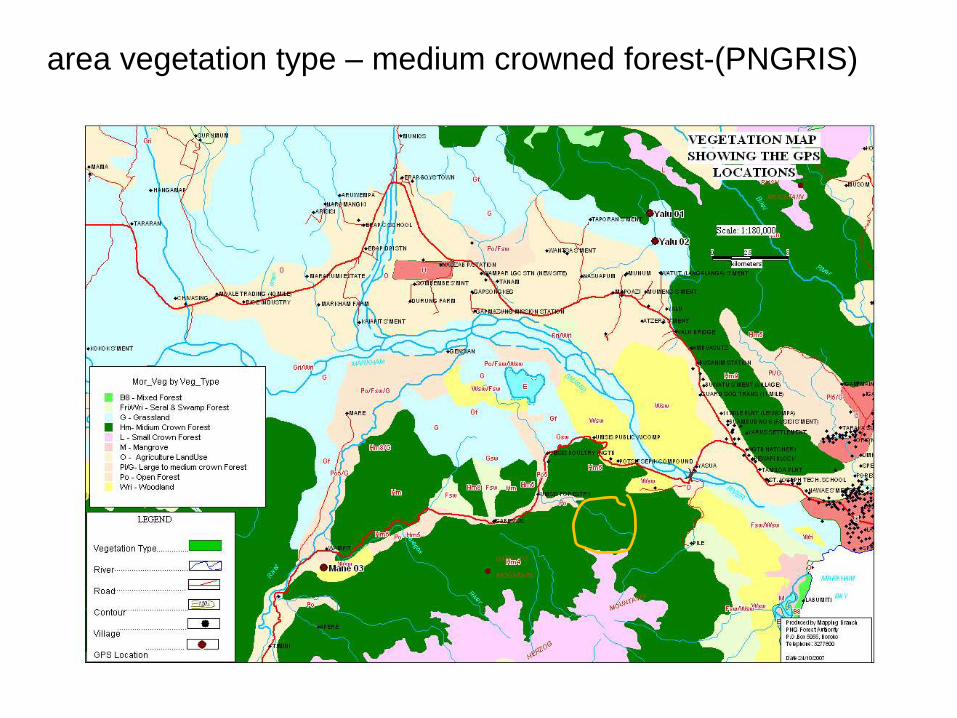
area vegetation type – medium crowned forest-(PNGRIS)
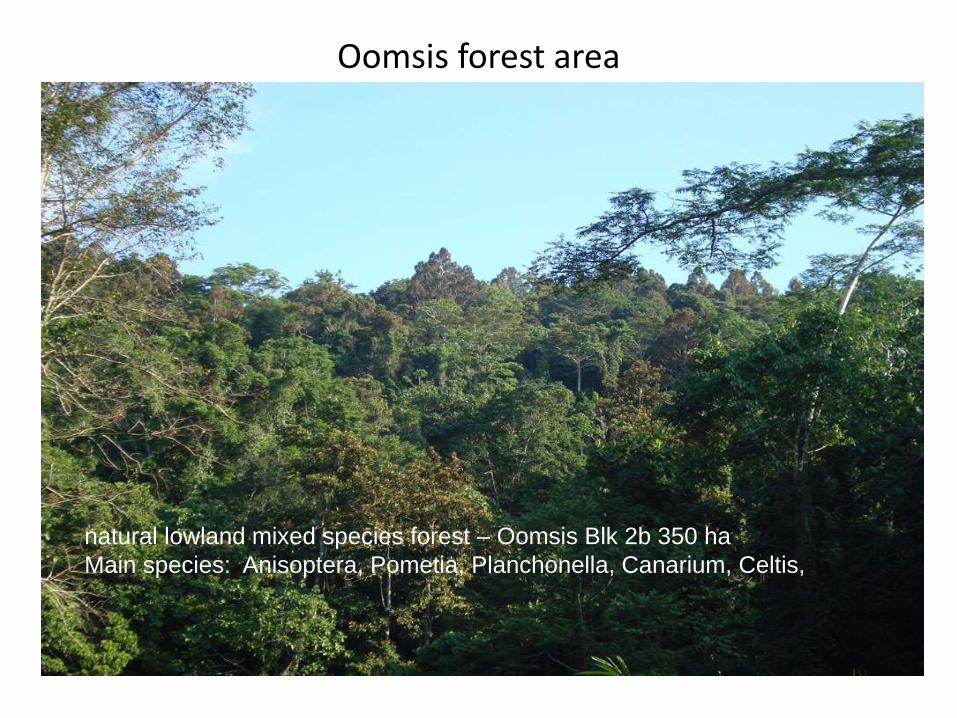
Oomsis forest area
natural lowland mixed species forest – Oomsis Blk 2b 350 ha
Main species: Anisoptera, Pometia, Planchonella, Canarium, Celtis,

Tree volume assessment • Volume assessment was done by destructive sampling of
trees for biomass.
• Using sectional measurements.
– Total stem was divided into 2m sections
– Diameters were taken at midpoints of these sections.
– Volume was calculated using Huber formula for each section. V = π.d2.L d = mid diam, L=section len
– Total volume overbark (vob)was the sum total of the sectional measurements.

spp dbh Vob
4 pom pin 52.8 2.900771
5 pom pin 22.2 0.525306
8 pom pin 41 1.8906
9 pom pin 25.9 0.452498
10 pom pin 37.3 1.03322
4 cry spp 38.2 1.549972
1 cry spp 51.5 2.917149
2 cry spp 30.3 0.898101
7 pom pin 55.7 3.570668
1 Pla spp 15.1 0.161632
2 Hap spp 18.6 0.236541
3 Hap spp 19.6 0.25201
7 Hap spp 40.6 1.332924
5 Lit spp 38.3 1.104621
3 Can spp 18.2 0.235698
6 Can spp 20.6 0.35078
3 Ani thu 44.3 2.768877
9 Ani thu 16.1 0.155903
10 Ani thu 28.7 0.695389
11 Ani thu 73.3 5.59245
13 Ani thu 52.9 3.599671
VOB above buttress for 7 species
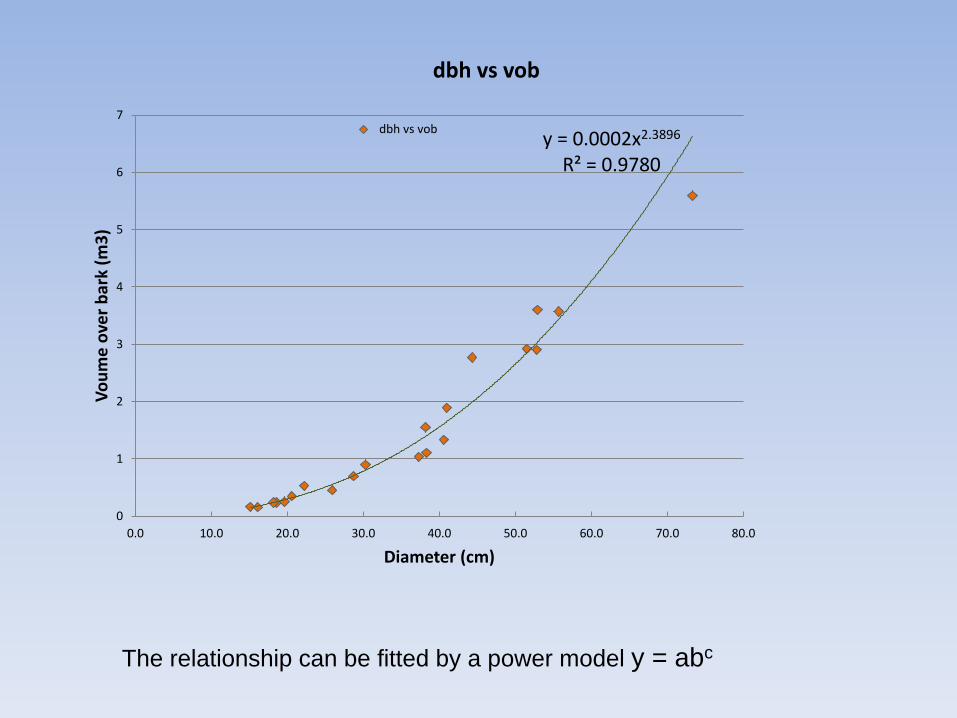
y = 0.0002x2.3896 R² = 0.9780
0
1
2
3
4
5
6
7
0.0 10.0 20.0 30.0 40.0 50.0 60.0 70.0 80.0
Vo
um
e o
ver
bar
k (m
3)
Diameter (cm)
dbh vs vob
dbh vs vob
The relationship can be fitted by a power model y = abc

Over estimation of volume
When there is greater differences between the log ends, the volume may be
overestimated.
Scaling manual – smalian’s formula, ministry of forests, Lands and NRO, 2011
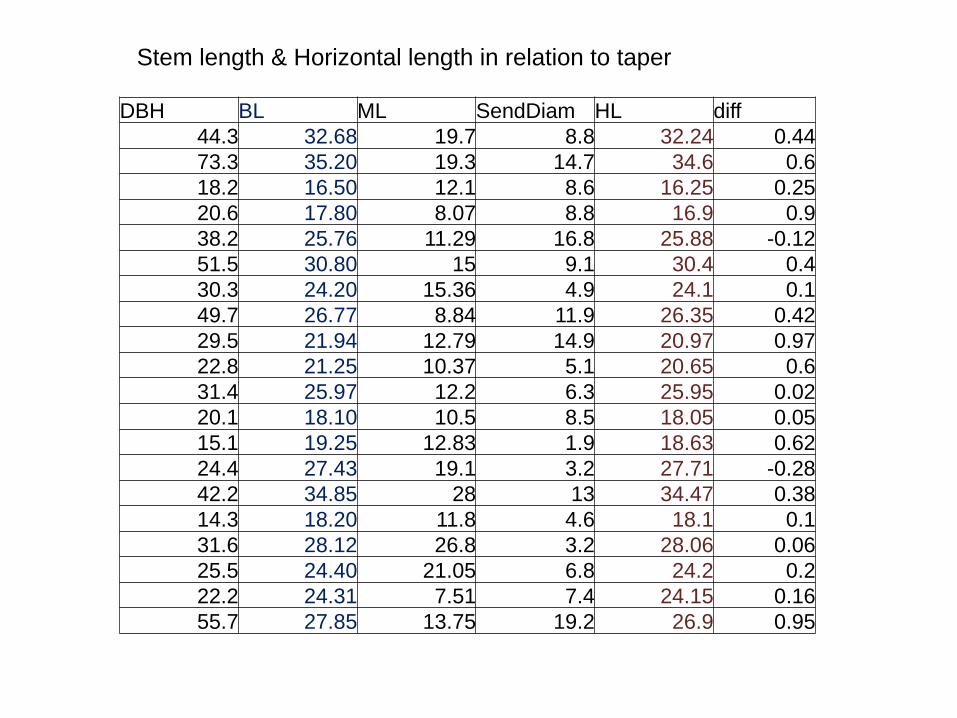
DBH BL ML SendDiam HL diff
44.3 32.68 19.7 8.8 32.24 0.44
73.3 35.20 19.3 14.7 34.6 0.6
18.2 16.50 12.1 8.6 16.25 0.25
20.6 17.80 8.07 8.8 16.9 0.9
38.2 25.76 11.29 16.8 25.88 -0.12
51.5 30.80 15 9.1 30.4 0.4
30.3 24.20 15.36 4.9 24.1 0.1
49.7 26.77 8.84 11.9 26.35 0.42
29.5 21.94 12.79 14.9 20.97 0.97
22.8 21.25 10.37 5.1 20.65 0.6
31.4 25.97 12.2 6.3 25.95 0.02
20.1 18.10 10.5 8.5 18.05 0.05
15.1 19.25 12.83 1.9 18.63 0.62
24.4 27.43 19.1 3.2 27.71 -0.28
42.2 34.85 28 13 34.47 0.38
14.3 18.20 11.8 4.6 18.1 0.1
31.6 28.12 26.8 3.2 28.06 0.06
25.5 24.40 21.05 6.8 24.2 0.2
22.2 24.31 7.51 7.4 24.15 0.16
55.7 27.85 13.75 19.2 26.9 0.95
Stem length & Horizontal length in relation to taper

Concluding remarks
The vob generally has a strong correlation with dbh and is usually explained by a
simple power function. The power model is also allometric in nature and can also
be linearised.
The volume equation should complement the biomass equations for estimating
volume of natural forest stands for REDD purposes.

Thank you
Merci beaucoup