mixing family with business: a study of thai business ...assets.csom.umn.edu/assets/61928.pdf · a...
TRANSCRIPT

Mixing Family With Business:
A Study of Thai Business Groups and the Families Behind Them
Marianne Bertrand
Simon Johnson
Krislert Samphantharak
Antoinette Schoar∗
October 21, 2005
Abstract
A large fraction of business groups around the world are run by families. In this paper,we analyze how the structure of the families behind these business groups affects the groups’organization, governance and performance. To address this question, we constructed a uniquedata set of family trees and business groups for nearly 100 of the largest business families inThailand. We find a strong positive association between family size and family involvement inthe ownership and control of the family business. The sons of the founders play a central rolein both ownership and board membership, especially when the founder of the group is gone.The availability of more sons is also associated with lower firm-level performance, especiallyin private firms and when the founder is gone. We identify a possible governance channel forthis performance effect. Excess control by sons, but not other family members, is associatedwith lower firm performance. In addition, excess control by sons increases with the numberof sons and with the death of the founder. Relatedly, at the group-level, we find that largerfamilies are associated with larger (more firms) and more pyramidal groups, again especiallywhen the founder is gone. One hypothesis that emerges from our analysis is that part of thedecay of family-run groups over time may be due to a dilution of the ownership stakes across aset of equally powerful descendants of the founder, with each possibly trying to tunnel resourcesout before others do. Some preliminary analysis also suggests that such wider involvement offamily members in the family business may also have led to less efficient restructuring after theEast Asian financial crisis, again especially when the founder is no longer involved in the familybusiness.
∗Preliminary and Incomplete. Please do not quote or circulate without authors’ permission. Univer-sity of Chicago Graduate School of Business, NBER and CEPR; MIT Sloan and NBER; University of California atSan Diego; MIT Sloan, NBER and CEPR. We thank Utpal Bhattacharya, Francisco Perez-Gonzales, Andrei Shleiferand seminar participants at Emory University, the Mitsui Life Symposium on Global Financial Markets (Universityof Michigan), the IMF, the MIT Organization Lunch, and the MIT Finance Lunch for many helpful comments.
1

1 Introduction
Family firms have attracted a lot of interest over the last few years. Recent research shows that the
U.S. experience of dispersed ownership, with strong separation of ownership and control, does not
match the typical corporation across countries. Instead, most firms around the world are likely to
be part of a group of companies, linked together through common ownership. Often the ultimate
ownership lies with a single family. La Porta et al. (1999) show that a large fraction of public
and private firms around the world are family-controlled and often follow a pyramidal ownership
structure.1 The use of pyramidal ownership structures allows the family to exert control over a
large network of firms. While family firms appear to be more prevalent in countries with weak
minority shareholder protection, a number of recent studies show that family involvement is quite
widespread, even in the U.S. For example, Anderson and Reeb (2003) find that founding families
are present in one third of S& P 500 firms and hold on average about 18% of equity in these firms.2
The economic literature so far has mostly treated the families behind business groups as mono-
lithic entities. Most models of family businesses in the economic literature focus on the role of
families as second best solutions to imperfections in the financial markets, the market for cor-
porate control or the market for managerial talent.3. These models generally assume that trust
relationships between family members can serve to (partially) solve principal agent problems be-
tween owners and outside managers, if monitoring of managers is difficult. However, families are
constituted of individual members who may have their own personal objectives and claims over
the family businesses. The divergence in objectives might even lead to an erosion of trust within
families, especially once the founder has passed control to the next generation and an increasing
number of family members become involved in the business over time. Our goal in this paper is
to explore how these family dynamics affect the organization, governance and performance of busi-
ness groups. One hypothesis that emerges from the analysis performed below is that the decay of
family-run groups over time may in part reflect in-fighting for group resources as controls become
more diluted among different family members.
To perform this analysis, we created a unique data set that contains detailed information on the1See also Claessens, Djankov, Fan and Lang (2000) for a study of family involvement in East Asian countries, and
the European Corporate Governance Network (2001) for a similar study for European countries.2See also Battacharya and Rabikumar (1999) and Perez-Gonzalez (2002).3See, for example, Burkard, Panunzi and Shleifer (2003) and Caselli and Gennaioli (2003)
2
family trees (starting with the founder and following until the current generation) of about 100 of
the largest business groups in Thailand. There are several motivations for our focus on Thailand.
First, Thailand is one of the only countries we are aware of where such detailed family structure
data could be constructed with reasonable accuracy. Second, the majority of Thai business families
are of Chinese origin. Since Chinese families are very prevalent in business across South-East Asia,
our findings potentially apply beyond the Thai context.
In addition to building these family trees, we have also compiled detailed balance sheet infor-
mation on the businesses that are controlled by these families. For each of these family business
groups, we have obtained information on the number of firms in the group, the financial perfor-
mance of these firms, as well as their board composition and ownership structure. This data was
collected for 1996 and 2001, i.e. a year before the financial crisis and a year after the crisis. For
each of these business groups, we also constructed organizational charts that describe the network
structure of the groups as of 1996.4
Our main findings are as follows. First, we document how control, management and ownership
are allocated across family members. The sons of the founder play a central role in ownership and
control and substantially increase their role in ownership once the founder is gone. Larger families
have more widespread involvement of family members in business, both in the form of ownership
and board membership. In particular, the founders sons involvement in the family business is
elastic to the supply of sons.
The governance of the group is also affected by family structure. More sons imply a larger
discrepancy between control and ownership, especially when the founder is gone. Excess control by
sons especially increases when the founder is gone. This family structure-governance relationship is
also reflected in the group structure. Once the founder is gone, larger families are associated with
larger (more firms) and more pyramidal groups.
We then analyze the implications of these family structure variables for group performance. We
show that larger families, but more precisely families with more sons, are associated with lower
firm-level performance, especially at private firms and when the founder is dead. We identify a
possible governance explanation for this performance finding. Controlling for family ownership,
we find that excess control by sons, but not by other family members, is associated with lower4We are currently constructing such organizational charts for 2001.
3

firm-level performance, especially when the founder is gone. One hypothesis that emerges from
this analysis is that part of the decay of family-run groups over time may be due to a dilution of
the ownership stakes across a set of equally powerful descendants of the founder, with each possibly
trying to tunnel resources out before others do.
Some preliminary analysis in the last section of the paper also suggests that such wider involve-
ment of family members in the family business may also have led to less efficient restructuring after
the East Asian financial crisis, again especially when the founder is no longer involved in the family
business.
Our paper builds on several recent studies which document that founder succession is important
in explaining the relatively poor performance of family firms. Indeed, several papers have shown
that family firms have on average lower stock market valuations and lower rates of return than non-
family firms (see for example Claessens, Djankov, Fan and Lang (2002), or Conqvist and Nilsson
(2003)). More recently, Perez-Gonzales (2002) and Villalonga and Amit (2004) show for U.S. firms
that this negative performance effect is in large part related to the passing of active management
and control from the founder to the descendants. Similarly, Bennedsen, Nielsen, Perez-Gonzalez
and Wolfenzon (2005) show for Danish firms that family succession leads to lower performance
even when instrumenting family successions with the gender of the first born child.5 But not all
papers conclude that family firms perform worse on average. For example, Anderson and Reeb
(2003) find higher performance for family firms in the U.S. Khanna and Palepu (1997) show that
business groups in India (which are for the most part family-controlled) on average perform better
than stand-alone firms in matched industries.
Our results are also closely related to a sociological literature on family groups which tends to
focus more on detailed descriptions of within-family dynamics. For example, a number of socio-
logical studies, relying for the most part on case studies, interviews or anecdotal evidence, have
stressed the importance of cultural factors in explaining the emergence of family firms. For exam-
ple, Redding (1990), Jones and Rose (1993) and Whyte (1996) explore this argument in the context
of Chinese families. These papers suggest that family traditions and inheritance rules might be
central to the evolution of family businesses. They also highlight the possibility of conflicts within5Using Swedish data, Conqvist and Nilsson (2003) also shows that family firms with controlling minority ownership
stakes are 50% less likely to be taken over but have a three times higher bankruptcy probability than non-familyfirms.
4

business families and how those might alter the direction and growth of the businesses. Moreover,
the importance of family structure also plays a prominent role in political models of family firms,
where specific family members present an important source of reputation capital in political mar-
kets. For example, Morck, Stangeland and Yeung (2002) suggest that if the government plays a
central role in the economy, family connections may provide access to resources. This can lead to a
cycle whereby resources become even more concentrated in the hands of a few families, which then
further increase their political influence.6
The rest of this paper is organized as follows. In section 2, we provide background information
on Thai business history, including the evolution of family businesses. Section 3 explains in details
how the data was collected. We provide summary statistics of the data and its limitations. Section
4 describes the involvement of different family members in the group firms. Section 5 focuses on the
relationship between family structure and group structure, governance and performance. Section 6
presents some preliminary analysis on how family structure might have affected restructuring post
financial crisis. Finally, section 6 concludes.
2 Brief Historical Background
The Thai economy was integrated into the world economy in 1855 when the Bowring Treaty was
signed between Britain and Siam. This treaty ended the King’s monopoly power over international
trade and lowered the tariff on exports and imports. This trade expansion induced European
businesses to enter Thailand, mainly through trading-houses, banks, and in the forestry, mining,
and engineering sectors. Over the same period, the number of Chinese immigrants increased.
Almost three million Chinese immigrants arrived in Thailand between 1882 and 1931. By the end
of the 1920s, almost 12% of the total population of Thailand was of Chinese origin (Limlingan,
1986). Most of these immigrants were poor and worked as laborers in the growing export industries
such as rice milling. But a number of these immigrants became entrepreneurs in various industries
such as agriculture, trade, and mining, and started to expand their business extensively. The origin
of some of the most well-known business families can be traced back to this period (Suehiro, 1997).
The revolution of 1932 marked the end of the absolute monarchy. The King’s Privy Purse
Bureau was dissolved and replaced by the Crown Property Bureau – one of the largest business6See Mamon (2002) for a similar description of the emergence of family firms in South Korea and Israel.
5

groups in Thailand today. Other large family groups such as the Wanglee family and the Lamsam
family also expanded during this period due to their oligopoly in agriculture-related business,
especially rice milling and exporting. Despite the government’s nationalistic policies, these families
managed to cooperate with the government in running a number of state-owned enterprises.
After the Second World War, Thailand entered a long period of successive military dictatorships
that lasted until the 1970s. During this period, the government and military leaders became
involved in business through share holdings or board participation in both state-owned enterprises
and private companies. This involvement ranged from agriculture and manufacturing to banking
and other services. These connections allowed the related companies to grow rapidly. Examples
are the Thai Farmers Bank of the Lamsam Family and the Bangkok Bank of the Sophonpanich
family.
The First National Economic Development Plan was introduced in 1961, which marked the
beginning of the industrialization of the country. The Thai economy has moved toward industrial
manufacturing since then. Real GDP grew at an average rate of 7.7% per year between 1960 and
1998. During this time period the economy witnessed the expansion of domestic business groups
as well as the entry of new entrepreneurs and multinational corporations. The Securities Exchange
of Thailand was established in 1975 with nine companies listed. The number of listed companies
increased substantially during the 1990s. Economic growth began to slow down in the mid 1990s
and was negative during the East-Asian crises. There were 454 companies listed on the stock market
prior to the crisis; by the end of 2001 this number had dropped to 382. Almost half of the de-listed
firms were in the financial sector. The financial crisis forced many families to reorganize their
business groups but also led to the bankruptcies of many family firms that had been prominent in
the Thai economy for decades. After 1999, the economy started growing again at an average rate
of 3.6
3 Data Collection
3.1 Firm Data
All registered firms in Thailand have to submit annual financial statements to the Department of
Business Development at the Ministry of Commerce. The data must be audited by an authorized
auditor. On top of this information, all listed firms are required to submit additional balance
6

sheet data to the Security and Exchange Commission. These financial records are available in the
Thailand Company Information database.
The Thailand Company Information database contains financial, ownership and board compo-
sition information at the firm-level. The financial information includes total assets, total liabilities,
total revenues and net profits. Ownership is reported as the percentage of company shares di-
rectly held by separate legal entity (ordinary persons and judicial persons such as other firms).
The database also includes information of the names of all the directors on the firms board. For
publicly traded firms we also know the specific position on the board a particular person holds, al-
lowing us to distinguish between executive and non-executive board positions.7 The database also
provides information on industry classification similar to 1 and 2-digit SIC codes, and founding
year for each firm.
From this database, we construct a two-year (1996 and 2001) firm panel data set. Starting in
1996, we restrict our sample to those firms that have annual revenues of at least 200 million Baht
in that year (approximately eight million US dollars) or are listed on the Stock Market Exchange
of Thailand (SET). Our 1996 sample therefore includes all publicly traded firms and the largest
privately held firms in Thailand, for a total of 2153 firms in 1996. We then track the same set
of firms to 2001. Out of 2153 firms in 1996, 1718 are still in operation in 2001.8 This implies
a cumulative exit rate of 20 percent, which matches aggregate figures obtained from alternative
sources. It is interesting to note, however, that the exit rate for the firms in our family sample is
less than ten percent. For 2001, we supplement the Thailand Company Information database with
the Listed Company Information, provided by the Stock Market Exchange of Thailand, as well as
with data from Business Online Co., Ltd. (BOL).
3.2 Family Data
Our objective is to construct family trees for the family groups in our sample that are as accurate
and comprehensive as possible. For that purpose we rely on a number of sources. We start with
information from a publication by the Brooker Group entitled Thai Business Groups: A Unique7We classify as executive board members CEO’s, presidents, chairpersons, managing directors, executive directors,
and the associated vice, deputy, and assistant positions. Other directors are defined as non-executives (which mayinclude “honorary” positions).
8We are careful to track firms that changed their names between 1996 and 2001 by tracing their registrationnumbers. We also double-check any name changes filed with the Ministry of Commerce.
7

Guide to Who Owns What. This book identifies the 150 leading business families in Thailand,
and covers the history of each of these families since the time the first business was founded until
today. While this source helps us to identify the relevant set of business families, it does not provide
systematic information on the full family tree. We therefore construct more detailed descriptions
of Thai business families from several alternative sources. First, we collect information from the
Funeral Book Collection at the National Library in Bangkok. It is customary in Thailand when a
public person dies that the descendants compile a funeral book that contains information about the
person’s life and his family relationships. Second, Sapphaibul (2001a, b) also provides impressive
information on 55 of the most famous business families. Third, we supplement this information
with articles from various local business magazines and newspapers. And finally, we also conducted
interviews with family members of a few business families to verify the accuracy of our data.
The data we collected starts with the founder of each business group. We then track all direct
descendants of the founder up to the last generation that is currently active in business. We
include information on all direct descendants of the founder, whether or not they are involved in
the family business. The founder generation is coded as generation one, the children of the founder
are generation two, and so on. For each family member, we collect information on their specific
position in the family tree, gender and birth order (defined as the rank order of children within a
specific marriage).
For each family member we also collect information on the name of the spouse, whenever
possible. This information will be especially interesting for the founder, since several of founders
have multiple wives and also children from multiple wives. We do not, however, count spouses
as part of the family when we construct measures of family size. We also collected information
on relationships across families, through marriages, cross-family joint ventures, or directorships.
Finally, we also relied on these sources to identify which specific family members, if any, had been
designated as “heir” of the family business.
As an example, Figure 1 displays one of the family trees we have constructed based on these
sources. The Bhirom Bhakdi family owns and manages a beer business in Thailand under the
brand “Singha.” The family business was started in 1932 by Boonrwad Satrabutr. Boonrwad is
coded as the first generation in our data. He adopted Wit, who is a son of his brother, as his child.
He later had two other sons, Prachuab and Chamnong, from his own wife. Wit, Prachuab and
8

Chamnong are considered as the family’s second generation. There are eleven family members in
the third generation: five males and six females. They are sons and daughters of Wit, Prachuab
and Chamnong.
Each individual in the family tree was then matched to the ownership and board composition
data collected at the firm-level, allowing us to determine whether a specific family member is
involved in the family business, in which capacity (through ownership and/or control) and in which
firms. There are two major data challenges in performing this matching exercise. First, there
are typically many different English spelling for a given Thai name, forcing us to do most of this
matching by hand. Second, special care had to be taken in matching female family members to
the ownership and board information as they may have dropped their maiden name after getting
married.
Since we have to rely on secondary sources to construct the family trees, there is some obvious
concern about the completeness of this information. In particular, one might be concerned that
there is a bias in coverage of family members that are involved in business, while family members
that are more private will not be mentioned in these sources. For that purpose, we have limited our
sample to nearly 100 families for which we can cross check the information using several different
sources. But even for these families, there is still some concern that the information we have
obtained may not be complete. For example, the coverage of female family members seems to be
incomplete. On average across all groups, there are about 40 percent of females in the family trees.
Another limitation of our family data is that we cannot systematically track whether a given family
member in our family tree is still alive or not. We will come back to how we deal with this issue
later in the text. However, we do know whether the founder is still alive or not.
3.3 Description of Family Groups
Table 2 provides a first overview of the business families in our sample. While the average family
has 13 members, there is wide variation in family size, where the largest family has as much as
122 members and the smallest has two.9 There are two main sources of variation in family size:
(1) the average number of children each couple has, and (2) the number of generations that have
passed since the founder started the business. On average, the family groups we cover have been9We directly address the skewness of the family size variable when moving to our empirical tests. We verify the
robustness of all results to dropping the largest families or performing median regressions.
9
around for 2.5 generations, with a minimum of 1 generation (three families), and a maximum of
five generations (only one family). The vast majority of the families in our data have only 2 or 3
generations. We record that the founder is dead is a little more than half of the families in our
sample; in about 60 percent of the families, an heir (almost always a son of the founder) has taken
over as head of the group.
Table 1 describes the business operations that these families run. The average family in our
sample controls seven 6.4 different companies in 1996. Again there is wide variation between
families with one firm and those with 58 firms. On average the groups in our sample have about
2 public firms and 4.5 private firms. To provide a better picture of the structure of the groups in
our sample, we calculate the depth of the groups. “Depth is measured as the number of ownership
links between firms within a group. We set the depth of firms at the top of the group structure as
zero. For example, if firm A owns B and firm B own C, we calculate the maximum depth of the
group as two. Table 2 shows that the maximum depth of the groups in our sample is 1.6, where
the flattest groups have a maximum depth of zero (not pyramidal at all) and the deepest group
has seven levels. The average firm across all groups has a depth of 0.9.
As a whole, the nearly 100 families we cover control more than 40 percent of all the assets in
our 1996 sample of firms.
4 Involvement of Family Members in Family Business
As a first step, we want to describe which family members are involved in the management and
control of the family business. We focus on two types of involvement: (1) board membership and (2)
ownership. Information on board membership and ownership is derived directly from the firm-level
data.
Table 3 shows that on average six family members have ownership in at least one firm within the
family group, while significantly fewer family members have board positions (3.3 family members).
Similarly, about 1.8 sons on average have ownership in at least one of the group firms but only
1.23 sons on average hold a board position. Overall, the fraction of family ownership held by the
sons is 37% (and the fraction of sons that have an ownership stake relative to the number of family
members with ownership stake is 53%). The fraction of board positions held by the sons relative
to the fraction of other family members with board positions is even higher, about 41%.
10

In contrast, the fraction of daughters with ownership stakes is only 35% and the fraction of
daughters with board positions if even lower, only 14%. Finally the fraction of other family members
with ownership stakes or board seats, is only 23% or 12%, respectively. These numbers show that
the sons of the founder hold the majority of the ownership and control positions in the firms.
4.1 Family Size and Involvement
We now analyze how family involvement in business (board membership and ownership) varies with
the size of the family. The idea behind this analysis is to understand whether greater “availability
of family members is associated to more family members taking part in business. Alternatively one
might imagine that a family group that has more family members will select the same number of
family members to run the firms, but can choose from a larger talent pool.
For that purpose, in Table ?? Panel A, we first compute for each family the number of family
members that hold at least some ownership in one of the group firms. As discussed above, we
obtained detailed data on the name of all board members and owners of the firms in our sample. In
column (1) we regress the number of family members that have any ownership in one of the group
firms on the size of the family measured as the number of family members across all generations.10
Theses regressions are estimated at the family level. We also include dummy variables for the
number of generations since the group was founded and a control for the age of the business group,
measured as the year in which the oldest firm in the group was established. 11 We find a strong
positive correlation between the size of the family and the number of family members that are
involved in business. The estimated coefficient of 0.3 is high. However, in column (2) when we
include a dummy for whether the founder is dead we find that the number of family members who
hold an ownership stake decreases once the founder is dead.
We now want to understand in more detail who among the family members shows the highest
sensitivity of family size to involvement. In other words which group of family members are most
likely to hold large ownership stakes and who is more likely to be crowded out by other family
members. For that purpose we now break out the ownership by the fraction of ownership held by10Note that we use here all family members in the family tree. One would optimally like to use only family members
that are alive and of working age. Unfortunately, as we discussed above, we do not have complete information onage in our data. We obtain, however, qualitatively similar results when we focus on number of people in “activegeneration,” i.e. generations where we observe at least one active family member in that generation.
11All results are robust to running median regressions or dropping the largest families from the sample.
11

the sons of the founder, the daughters of the founders and the other family members. In column (2)
we regress the fraction of the overall ownership in the family firms that the sons hold on the number
of sons and the size of the rest of the family (excluding the sons). We see that the fraction of group
ownership is very sensitive to the number of the sons in the group, but the sensitivity to the rest of
the family is negative, but the coefficient is economically very small and not significant. In column
(4) we again add a dummy variable for whether the founder is dead and we see that the fraction of
ownership held by the sons increases significantly once the founder dies, which suggests that most
of his ownership passes to his sons. When we repeat the same regressions for the daughters of the
founder, in column (5) we find that the ownership of daughters is much less sensitive to the death
of the founder and also less sensitive to the number of daughters in the family. Finally, we also
repeat this exercise for the remaining family members in the group in column (6). We show that the
ownership of other family members only marginally increases with the number of family members
in the group. And interestingly the fraction of ownership held by other family members is strongly
negatively correlated with the number of sons in the family. These results suggest that the number
of family members who get involved in business increases with the number of “available people in
the family. However this result is mainly driven by the sons of the founders. If there are more
sons in the family, they appear to increase their ownership stake at the expense of other family
members. Once the founder is dead the ownership stakes of the sons increase very substantially,
while the stakes of other family members do not.
In Panel B of Table 3 we now repeat the same regressions for the number of board positions that
different family members hold. Again we find that involvement of family members on the board of
firms increases with the size of the family, but goes down when the founder is dead. However, for
the sons we find that the fraction of board positions goes up with the number of sons in the family,
but does not increase significantly when the founder is dead (as was the case with ownership). This
might indicate that the sons already assume central board positions before the founder is dead,
however the ownership only passes on when the founder is dead. In column (4) and (5) we again
find that the daughters are much less involved in the family business than the sons. Finally in
column (6) we again see that the sons crowd out board membership by other family members.
12

4.2 Allocation of Control and Ownership to Specific Family Members
We now investigate in more detail how control and ownership are allocated to specific family
members. We start with the allocation of control rights through board membership and executive
positions. As before, we focus on the 1996 data and look at the within family allocation of family
involvement on broads. Ideally, we would like to focus only on family members that are alive and of
working age, but as mentioned before we have only limited information on date of birth and death.
To deal with this issue we control for the number of active generations in each of these families.
We define a generation as active if at least one family member in that generation holds a position
within the family business in 1996.12
The results of this analysis are presented in Table 4. We categorize family members based on
their relationship to the group founder of the group. We also separate between groups where the
founder is dead and those where the founder is still around. For each position in the family tree
(e.g. founder, son, grandson etc.), we determine the number of positions held by family members
in that position. We compute these fractions either based on a simple count of positions, or based
on an asset-weighted count. The asset-weighted count gives more weight to board membership in
larger firms.
As might have been expected, the sons of the founder hold the largest number of positions
among the family members, relative to the daughters and later generation of children. This trend
is especially strong in families where the founder is dead. A comparison between the regressions
for groups where the founder is dead to those where he is alive suggests that the ownership and
positions of the founder passes from the founder to the sons. In contrast the ownership stakes and
number of positions of daughters and other family members decreases once the founder is dead.
5 Family Structure and Firm Performance
We now turn to analyze whether the above documented differences in involvement of family mem-
bers in business are associated with differences in performance. On the one hand, there are several
reasons why we could expect lower performance for groups run by larger families. If family man-
agers are less skilled than outside managers, greater involvement of family members will negatively12Obviously, the notion of active generation could be somewhat endogenous. For example, older family members
may decide to retain control longer in families where less young family members are available.
13

affect performance. Larger family involvement might also lead to more infighting over resources
across family members. On the other hand, one might conjecture that the market for corporate
control and top executive talent is thin in Thailand. If a good governance of professional (outside)
managers is difficult to establish, relying on trust relationship along kinship lines might be pref-
erential since it could serve as a substitute for direct monitoring. Moreover, a larger family offers
a deeper talent pool of potential managers to draw from. These theories would imply that larger
families would be positively related to group performance.
In Table 5 we study the relationship between firm performance and the structure of the families
behind the firms. Panel A presents regressions of all firms in the group, and Panel B separately
breaks out the private and public firms. The unit of observation is a group firm. The dependent
variable is residual ROA, which we construct as follows. We first define firm ROA as the ratio of
net profits in 1996 divided by the firm assets in 1996. We then regress firm-level ROA in 1996 on
two digit industry codes and a control for the measure of the log of total assets of the firm. The
estimation of residual ROAs includes all firms in our sample, not just the group firms. Therefore,
residual ROA 1996 measures the performance of the firms controlling for the industry and size of
a firm. All regressions in that table also include a dummy variable for the number of generations
since the group was started and a control for the age of the firm. Columns (1) through (4) include
all groups in the sample, columns (5) to (7) only include groups where the founder is dead and
columns (8) to (10) only focus on groups where the founder is still around.
In column (1), we regress firm ROA on the size of the family, measured as the number of people
in the family tree. The coefficient on the family size variable is negative and significant (albeit
economically not very large). However, when we include a measure for the number of sons in the
family in column (2) of Table 5 the coefficient on the family size measure becomes zero, but the
coefficient on the number of sons is negative and significant. In columns (3) and (4) we also re-
estimate this relationship using a dummy for families that have more than one son. This allows us
to ensure that our results are not driven by a few families that have a very large number of sons. We
find that the coefficient on multiple sons is negative and economically significant, but statistically
not significant. If we include a separate dummy in column (4) for families that have sons from
multiple wives we again find that the coefficient on this variable is negative but not significant.
But if we break out firms where the founder is still active versus those where the founder is
14

not active we find an interesting discrepancy. In those firms where the founder is not active any
more (column 5 to 7) we see a significant and robust negative relationship between performance
and family size and also a negative relationship between performance and the number of sons. This
relationship becomes even stronger if use our alternative measure of multiple sons. We also find that
those groups where the founder had sons from multiple wives show particularly poor performance
once the founder is gone. In contract for the firms where the founder is still active (columns 8-10)
we find a positive but not significant relationship between performance and number of sons. This
last finding is consistent with previous studies such as Perez Gonzales (2003) and Villalonga and
Amit (2004), who also find that the performance of family is particularly low once the founder is
gone.
In Panel B of Table 5 we separate the family firms into those that are publicly traded and those
that are private. Again we break out groups where the founder is still around and those where the
founder is gone. When we compare the results for private and public firms in Panel B we find that
the negative relationship between the number of sons (or multiple sons) and firm performance is
concentrated in the private firms of the family groups, and again especially for the groups where
the founder is gone. For the public firms the coefficient on the number of sons is positive but
not significant, if the founder is gone. If the founder is still there we show a positive relationship
between the number of sons and performance in the public firms.
These results are interesting on a number of dimensions. First, they suggest that the lower
performance of family firms is not uniformly due to a greater involvement of all family members if
the family is larger. But our results suggest that the sons of the founder may play a particular role,
since the poor performance of family firms is mainly associated the number of sons in the family.
The results are not consistent with the hypothesis that trust relationships among family members
(in particular the sons) and the ability to draw from a deeper talent pool in larger families provides
a source of comparative advantage to these families. These findings are instead more supportive
of theories that suggest efficiency losses through greater family involvement. As mentioned before,
this could either be due to the fact that family firms forgo the opportunity of hiring (high-skilled)
outside managers or because the involvement of several sons in the business creates inefficiencies
in the operations of the family firms. Second, the finding that the result is much stronger for the
private firms and once the founder is gone is a first suggestive indication that the documented lower
15

performance of firms with many sons might be due to governance problems or a fight for resources
among the sons. We investigate this idea in more detail in the following section.
5.1 Firm Performance and Excess Control
One of the important distortions that has been documented in pyramidal business groups is ex-
propriation of minority shareholders by the shareholders of higher-up group firms. See for example
Bertrand at al (2001) or Claessens et al. (2000). These papers show that tunneling between group
firms allows majority shareholders to take out cash from the operations of the firms. Given our find-
ings of lower performance of family groups that have more sons, we now want to analyze whether
the lower performance is a function of the ownership and control structure in these groups with
more sons. One candidate explanation is that the dilution of ownership across equally powerful
sons increases the amount of tunneling of resources out of the lower-down group firms.
To investigate this explanation, we construct several measures of the discrepancy between con-
trol and ownership for each of the firms in the groups covered in our sample. We compute the
standard measures of total family ownership and total family control as calculated in Porta, Lopez-
de-Silanes and Shleifer (1999), and Claessens, Djankov and Lang (2000). However, our data also
allows us to also compute similar measures of individual family member ownership and individual
family member control for each firm.
Individual ownership is defined by summing a given family members direct and indirect own-
ership over a given firm. Direct ownership is simply the percentage of shares that a given family
member owns. When there is a chain shareholding along the pyramid, we also compute the indirect
ownership along the chain by calculating the product of shares held by a given individual along the
chain. The calculation is more complicated if there are more than one chain for each firm. In such
case, the total indirect ownership is the sum of the ownership over all chains that can be traced
back to the given family member. For example, Firm X is 30% owned by Mr. A, and 70% owned
by firm Y. Firm Y is 40% owned by Mr. A. We say that Mr. A directly owns 30% of firm X. He
also indirectly owns 40%*70% = 28% over firm X through firm Y along the pyramid chain. His
ownership in firm X is therefore 30+28 = 58%.
Control is based on the voting rights a given family member has. Due to a one-share-one-vote
rule, direct control right is simply the shares that the family member holds. However, in case of
16

a chain shareholding, control over the voting right of a firm is the weakest link, i.e. the smallest
share along each chain. The total indirect control is defined as a sum of the controls over all chains.
Finally, the ultimate control is the sum of direct and indirect control for each family member. From
previous scenario, Mr. A directly controls 30% voting rights of firm X. He also indirectly controls
min40%, 70% = 40% over firm X. His control in firm X is therefore 30+40 = 70%.
Using this approach, we can define a measure of excess control (control > ownership) at the
individual level. In the example above, Mr. A has excess control over firm X. Given the central
role played by sons in the results above, it will be of most interest to us to contrast excess control
by sons compared to excess control by other family members. The idea is to test whether the lower
performance of family firms in groups with more sons is mostly associated with those situations
where the sons have excess control.
In Table 6, we first regress firm-level (residual) ROA on total family ownership in the firm and
a dummy variable for excess family control (i.e. total family control is larger than total family
ownership). We include family fixed effects in the regression (and all following regressions in this
table) and a control for the year the firm was established. Across all groups, we find that higher
excess control for the family overall is negatively correlated with residual ROA in the full sample,
but the effect is not significant. However when we break out families into those where the founder
is gone (column 4) versus those where the founder is still around (column 6), we find that there is a
significantly negative correlation when the founder is gone. However, if the founder is still around
this relationship is positive but not significant. This result suggests that excess control in the hands
of family members only correlates with negative performance once the founder is gone. In contrast,
while the founder is still around these patterns do not appear. These results are also similar to the
findings in Claessens at al. (2002) where family firms in East Asia show poorer performance if the
families are more pyramidal. Note that we also find also find a strong negative correlation between
total family ownership and firm performance.
We now break down total family control and total family ownership into individual-specific
measures of control and ownership. Specifically, since the results in the previous section suggest
that the number sons seem to be pivotal in understanding the lower performance of family firms,
we contrast the excess control in the hands of the sons with excess control of other family members.
First, we regress the residual ROA at the firm level on the number of sons that have excess control
17

in a given firm and the number of other family members that have excess control in a given firm.
Our regressions still include a control for total family ownership, family fixed effects and the year
in which the firm was established.
Column (2) of Table 6 shows a negative correlation with the number of sons that have excess
control, but no relationship (the coefficient is literally zero) with the number of other family mem-
bers with excess control. But for the full sample the results are not statistically significant. We
then break down the families into those where the founder is still around (column 5) and those
where he is gone (column 7). We find that the negative effect of number of sons with excess control
on performance is somewhat stronger and more significant when the founder is not around any-
more. The number of other family members with excess control does not appear to be related to
performance, even when the founder is gone.
As an alternative specification, we also compute the average difference between control and
ownership among sons and among other family members at a given firm. We find very similar
pattern under this alternative measure. Specifically, a larger average difference between control
and ownership for sons is associated with lower firm performance when the founder gone. We find
relationship between performance and the average difference between control and ownership for
other family members.
Finally, in Table 7 we replicate the regressions above but sort firms into public and private ones.
We find that the negative relationship between performance and excess control by sons is entirely
driven by the private firms among the group firms. For the public firms the relationship is positive
but not (strongly) significant. These findings help reinforce a governance interpretation for our
findings as we expect governance issues to be more likely to transpire into lower performance at
the more opaque private firms.
Overall, these findings suggest that not all family members may have the power or inclination
to take advantage of their excess control position at group firms. Only excess control in the hands
of sons appears to significantly hurt performance (at private firms). In addition, the contrast
between groups with founder and those with founder not gone suggests that the founder may have
a disciplining effect on the sons behavior. In addition, the fact that performance is negatively
related to the number of sons with excess control suggests that the amount of distortion might be
driven by competition between the sons over a given companys resources.
18

5.2 Excess Control and Family structure
In the previous section we documented a negative relationship between the excess control in the
hands of the sons and the average performance of the group firms. As we showed before, this
relationship is predominantly driven by the groups where the founder is gone. In contrast we do
not find that excess control by other family members leads to the same poor performance. This
raises the obvious next question: Is the structure of governance more tilted towards excess control
situations when the founder is gone and/or when there are more sons in the family?
We analyze this question in Table 8. We first excess family control (i.e. a dummy for whether
total family control is larger than total family ownership) on number of sons, controlling for the
number of generations the groups has been around. As before this variable includes the holdings
of all family members. We find a positive, but statistically not significant relationship. In column
(2), we include a dummy for whether the founder is dead. Again we find a positive but only barely
significant estimate of the coefficient on “founder dead”. However, the sensitivity of family excess
control to number of sons does change once the founder is gone. When the founder is dead, there
is a positive relationship between the number of sons and the level of excess control that the family
holds (column 3). However, if the founder is still around, this relationship is negative and significant
(column 4). This means once the founder is dead, more sons imply a larger average discrepancy
between control and ownership at family firms.
As before we can now break out the excess control in the hands of the sons relative to the
rest of the family. We first use a measure of the average difference between control and ownership
among sons at a given firm. We find that more sons are associated with a higher average difference
between control and ownership for sons. In addition, this difference increases when the founder is
gone.
This measure of excess control does not differentiate between a situation where only one son
has a huge amount of excess control and the others do not, versus a situation where each son
individually has some excess control. To account for this, we also use as a dependent variable a
simple count of the number of sons with excess control at a given firm. We find that more sons
are also correlated with a larger number of sons who have excess control. Also, we find that the
number of sons with excess control at a given firm increases significantly once the founder is gone.
Overall, these results suggest that the presence of more sons leads to governance structure that are
19

more tilted towards “expropriation position (for sons), especially when the founder is gone.
This analysis suggests that family structure and genealogical lines may be important in under-
standing the allocation of control rights in business groups. In Table 9, we report complementary
patterns at the group level. In that table, we relate different characteristics of the groups to family
structure variables. First we regress the number of firms in a group on family size and find a strong
positive relationship only when the founder is gone. That suggests that once the founder is dead
the assets of the firms get chopped up into several separate firms within the group. This could be
viewed as suggestive evidence that the different sons in the firm are trying to carve out their own
independent piece of the “family pie. In addition, we find that the depth of the group increases with
family size, again only when the founder is gone. As another take on the pyramidal structure of the
groups, we also find that the average number of firms owned by a given a group firm increases with
family size, again only when the founder is gone. In other words, the above firm-level patterns of a
governance structure that becomes more tilted towards expropriation in larger families (i.e. more
sons) when the founder is gone are confirmed in this analysis of group structure.
6 Restructuring after the Asian Financial Crisis
Finally, we undertake a very preliminary look at the response of family firms to the Asian financial
crises in the late 1990s. The financial crisis was triggered when Thailand was forced to float
its currency in July of 1997. Although some people had anticipated the slowdown of the Thai
economy since 1996, the financial crisis with this enormous magnitude was largely unexpected.
Therefore, the crisis serves as a significant, exogenous shock to the firms in our sample. In this
section, we will explore the responsiveness of family firms to the adverse shock. Specifically, we
would like to ask whether family structure affects the ability of groups to restructure and recover
after the Asian financial crisis. As we have argued, families are not monolithic, but consist of
many different members with possibly diverging objectives. One hypothesis is that larger family
involvement may lead to more difficulty in shutting down underperforming units, as each family
member is trying to protect his or her own personal stake in the family business. In other words,
large family involvement may lead to important coordination issues in the post-crisis restructuring
and therefore potentially less restructuring. In addition, given our results above, we might expect
that any such coordination issues to be more important when the founder is no longer there to
20

exercise disciplining over the various family members. Moreover, given our results above, we might
expect any such coordination issues to be especially important among the sons of the founders, as
each may attempt to protect his own interest in the family business.
In order to take these ideas to the data, we analyze firms response to the crisis and performance
after the crisis. Since the restructuring may take several years, we look at firms survival and
performance at the end of 2001, which was four and a half years after the crisis and five years after
our pre-crisis 1996 data.
We first explore in Table 10 whether the structure of family ownership at a given firm affects the
likelihood of firm exit by 2001 in response to high leverage in 1996 or low ROA in 1996. Specifically,
for each firm in our sample, we compute the number of family members with an ownership stake
on that firm and the number of sons with an ownership stake on that firm. The dependent variable
is a dummy variable that equals 1 if the firm exited between 1996 and 2001. All regressions control
for establishment year (firm age), industry fixed effect, and number of generation fixed effects. We
include as the explanatory variables the number of sons with ownership in the firm, residual ROA
in 1996, leverage in 1996, family ownership in the firm, and a dummy variable that equals one if
family control in the firm is larger than family ownership in the firm.
Our findings in that table indicate that, as the number of sons with an ownership stake on a
given increases, the sensitivity of that firms exit to low performance or high leverage decreases.
Interestingly, we find no similar patterns for ownership by other family members. In other words,
it is a larger number of sons with ownership stakes that lowers the likelihood of firm shut-down in
case low performance or high leverage.
Finally, we analyze how the responsiveness differs between groups with founder dead (columns
5 and 6) and groups with founder alive (columns 7 and 8). Interestingly, the lower sensitivity
of shut-down to bad performance/high leverage as the number of sons with ownership increases
is concentrated in those groups where the founder is gone. While there might be alternative
interpretations that need to be explored in further analysis, these findings are prima facie consistent
with the idea of more sluggish restructuring in response to the financial crisis on those groups where
family involvement is more widely distributed across equally powerful family members (i.e. sons of
the founder).
Table 11 overall confirms the results presented in table 10. In that table, we first regress the exit
21

dummy on 1996 leverage and 1996 residual ROA for all firms, controlling for establishment year,
industry fixed effects, and generation fixed effects (column 1). Next, we stratify our sample into
groups where the founder is gone (column 2) and groups where founders are still alive (column 3).
Again, we find that the sensitivity of exit to high leverage is much weaker when the founder gone.
For firms where the founder is gone, exit did not respond to high pre-crisis leverage. Futhermore,
the point estimates in the last two columns suggest that the weaker sensitivity of exit to high
leverage when the founder is gone is especially pronounced in those families with multiple sons.
The standard errors are too large however to draw any strong inference from these results.
Finally, we explore the performance of surviving firms in 2001. Assuming that the results above
really indicate “too little restructuring, we would expect high leverage in 1996 to be associated with
lower performance in 2001 among surviving firms at those groups where the founder is gone and
family involvement in the business is broader (i.e. more sons). This is exactly the pattern that we
observe in Table 12. Specifically, we regress the residual ROA of a firm in 2001 on its 1996 leverage
and its 1996 residual ROA. We find that 2001 ROA is negatively related to high leverage in 1996
only among the groups where the founder is gone, and especially when the founder had multiple
sons.
Overall, the results in this section suggest that groups whose founder has gone and have wider
family involvement in the business (more sons) may have experienced less efficient restructuring
post-crisis. While alternative explanations will need to be further investigated, these patterns
are consistent with the idea that involvement in the business by several equally powerful family
members may lead to coordination problems as each family member is trying to protect his own
stake in the groups operations. This problem seems much reduced when the founder is still around,
suggesting that the founder may act as the natural coordinating authority for the groups.
7 Conclusion
TO BE COMPLETED
A large fraction of firms around the world are run by families. Families themselves, however,
are not monolithic entities but are composed of individual members, who may have different stakes
and objectives in the family businesses. The current paper takes a first step in going beyond the
case-study evidence to ask whether constraints imposed by family structure affect the corporate
22

structure and ultimate performance of these family-run firms.
We show that inheritance of control within family business groups follows genealogical lines, i.e.
control is passed from the founder to his sons, grand-sons etc. Moreover, the larger the family, in
particular the more sons the founder has,
the more positions within family firms are held by family members instead of outside managers
and board members. We find, however, that the number of the sons of the founder a pivotal. Groups
that are run by larger families (especially more sons) tend to have lower performance and to be
financially less sound. All of these effects are especially pronounced in groups where the founder is
no longer active and ultimate control has been passed on to an heir. Most interestingly, we analyze
how the pyramidal ownership structure of group firms affects the performance of the firms. We
find that an important channel which explains the lower performance of firms with several sons is
the gap in excess control. Firms where many brothers indirectly own a fraction of the ownership
show lower performance. This finding is consistent with an interpretation that having several sons
with excess control, can lead to a race to the bottom, where each sons is trying to tunnel resources
out of the company before the next brother can do it.
Overall, these findings provide novel evidence that wider family involvement in business groups
alters business decisions and the performance of family-run firms. One hypothesis that emerges
from our analysis is that the decay of family-run groups over time may be due in part to increased
incentives between family members to tunnel resources out of the firm as control becomes more
diluted among different family members. A slightly different interpretation is that outright in-
fighting for group resources leads to inefficient decision making. Conflicts between different parts
of the family might lead to distortions in the governance structure and internal operations of these
groups. These conflicts might be especially important once the founder has retired.
One deeper question in this context is why families do not separate the control rights (i.e.
management) more effectively from the ownership structure of the firm by placing management
control in the hand of professionals but retaining ownership control within the family. Arrangements
like this are widely used in many European countries where family firms are still prevalent, such as
Italy or Germany. This would allow family members to fight over the cash flow streams, without
distorting the efficiency of the business decisions within the firms. We conjecture that a potential
answer to this question lies in the limited enforcement of contracts and market for governance
23

in a country like Thailand. It could be that cash flow rights de facto can only be guaranteed in
conjunction with control rights. Therefore, family members may have to stay directly involved
in the operations of the business if they want to protect their cash flow rights. Our analysis
suggests that individual family members may not only have to be concerned about expropriation
by outsiders, but also expropriation by other (more powerful) family members. For example, the
fact that weaker family members, such as daughters of the founder, are less likely to hold positions
in firms where sons of the founder are also on board is quite suggestive in this regard. Similarly, our
findings that larger families and larger family involvement is associated with a break down group
assets into a larger set of (smaller) firms may also indicate that access to cash flow for a given
family member requires control rights for that family member.
24

References
Anderson, Ronald C. and David M. Reeb, 2003, Founding-Family ownership and Firm Performance:Evidence from the S&P 500, The Journal of Finance, Vol 63, 1301-1328.
Bennedsen, M., K. Nielsen, F. Perez-Gonzalez and Dani Wolfenzon, 2005,Inside the family firm:The role of families in succession decisions and performance, Unpublished Working paper.
Bhattacharya, Utpal and B. Ravikumar, 2003, Capital Markets and the Evolution of Family Busi-nesses, Journal of Business, Vol 74, 187-220.
Brooker Group, 2003, Thai Business Groups: A Unique Guide to Who Owns What.
Burkard, Mike, Fausto Panunzi and Andrei Shleifer, 2002, Family firms, NBER Working Paper No.8776.
Caselli, Francisco and Nicola Gennaioli, 2003, Dynastic Management, NBER Working Paper No9442.
Chun, Chi-Nien, 2001, Markets, Culture and Institutions: The Emergence of Large Business Groupsin Taiwan, Journal of Management Studies, Vol 38, 720-745.
Claessens, Stijn, Simeon Djankov, Joseph P. H. Fan and Larry H. P. Lan, 2002, Disentangling theIncentive and Entrenchment Effects of Large Shareholders, The Journal of Finance, Vol 62,2741-2771.
Claessens, Stijn, Simeon Djankov and Larry H. P. Lan, 2000, The separation of ownership andcontrol in East Asian Corporation, The Journal of Financial Economics, Vol 58, 81-112.
Cronqvist, Henrik and Mattias Nilsson, 2003, Agency Costs of Controlling Minority Shareholder,Journal of Financial and Quantitative Analysis, Vol 38, 695-719.
Jones, G. and M. B. Rose, 1993, Family Capitalism, Business History, Vol 35, 1-16.
Khanna, Tarun and Krishna Palepu, 2000, Is Group Affiliation Profitable in Emerging Markets?An Analysis of Diversified Indian Business Groups, The Journal of Finance, Vol 55, 867-891.
La Porta, Rafael, Florencio Lope-de-Silanes and Andrei Shleifer, 1999, Corporate Ownership Aroundthe World, The Journal of Finance, Vol 54, 471-518.
Marman, Daniel, 2002, The Emergence of Business Groups: Israel and South Korea Compared,Organization Studies, Vol 23, 737-758.
Perez-Gonzalez, 2002, Inherited Control and Firm Performance, Working Paper.
Redding, S. G., 1990, The Spirit of Chinese Capitalism. New York: W. de Gryuter.
Villalonga, Belen and Raphael Amit, 2004, How do family ownership, management, and controlaffect firm value?, Working Paper.
Whyte, M. K., 1996, The Chinese family and economic development: obstacle or engine?, EconomicDevelopment and Cultural Change, Vol 45, 1-30.
Wong, Siu-lun, 1997, The Chinese family firm: a model, The British Journal of Sociology, Vol 16,58-72.
25

Table 1Summary Statistics: Business Group Characteristics (1996) a
Characteristic Mean Std. Dev. Min Max
Number of firms 6.4 9.1 1 58
Number of public firms 1.9 2.5 0 19
Number of private firms 4.5 7.7 0 53
Log (group total assets) 16.4 1.8 12.5 21.2(in thousand Baht)Maximum depth 1.6 1.5 0 7
Average number of firms owning 0.8 0.8 0 3.3a given firmAverage number of firms owned 0.4 0.5 0 2.6by a given firmAverage ROA, asset weighted (1996) .024 .046 -.11 .21
Average leverage, asset weighted (1996) 0.69 0.19 0.24 1.10
Minimum establishment year 1964 16.7 1882 1989
aNotes:
1. The unit of observation is a business group (N=97). All group characteristics are computed as of 1996.
2. “Number of firms” is the total number of firms in a group (within our sample). “Maximum depth” is themaximum length of chain ownership in a group. A firm at the top of pyramid, as well as a singleton firm, haslength equal to zero. “Average number of firms owning” is the average number of group firms owning a givengroup firm. “Average number of firms owned” is the average number of group firms owned by a given groupfirm. “Average ROA, asset-weighted” is the asset-weighted average ROA (net profits divided by total assets)across firms in a group. “Average leverage, asset-weighted” is the asset-weighted average leverage (financialliabilities divided by total assets) across firms in a group. “Minimum establishment year” is the year the oldestfirm in a group was established (within our sample).
3. See text for details on data sources and sample construction.
26

Table 2Summary Statistics: Family Characteristics a
Characteristic Mean Std. Dev. Min Max
Family size 12.56 17.16 1 122
Number of generations 2.45 0.72 1 5(founder’s generation = 1)Founder dead? (Y=1) 0.56 0.50 0 1
No heir(s) active? (Y=1) 0.39 0.49 0 1
Number of heirs 0.81 0.77 0 4
Multiple wives? (Y=1) 0.17 0.37 0 1
Number of founder’s sons 3.2 2.5 0 14
Number of founder’s daughters 2.4 2.3 0 12
Multiple sons? (Y=1) 0.71 0.45 0 1
aNotes:
1. The unit of observation is a family (N=97).
2. “Family size” includes the founder and all of his direct descendants. “Number of generations” is the number ofgenerations in the family tree (with founder’s generation equal to 1, the founder’s children’s generation equalto 2, etc). “Founder dead?” is a dummy variable that equals 1 if the founder of the group is dead, 0 otherwise.“No heir(s) active?” is a dummy variable that equals 1 is at least one heir has taken over control of the familybusiness. “Number of heirs” is the total number of heirs that have appointed in the family business. “Multiplewives” is a dummy variable that equals 1 if the founder had multiple wives, 0 otherwise. “Multiple sons” is adummy variable that equals 1 if the founder had multiple sons.
3. See text for details on data sources and sample construction.
27

Table 3Summary Statistics: Family Involvement in Business (1996) a
Characteristic Mean Std. Dev.
N of family members with ownership 5.97 5.95
N of family members with board seats 3.33 3.03
N of sons with ownership 1.79 1.89
N of sons with board seats 1.23 1.51
Frac of family ownership held by sons 0.37 0.34
Frac of family’s board seats held by sons 0.41 0.38
Frac of sons with ownership 0.53 0.44
Frac of sons with board seats 0.37 0.38
Frac of daughters with ownership 0.35 0.42
Frac of daughters with board seats 0.14 0.28
Frac of other family members with ownership 0.23 0.34
Frac of other family members with positions 0.12 0.22
aNotes:
1. The unit of observation is a family (N=97).
2. “Frac of sons with ownership (board seats)” is the fraction of the founder’s sons that have ownership stakes(board seats) in the family group. “Frac of daughters with ownership (board seats) is the fraction of thefounder’s daughters that have ownership stakes (board seats) in the family group. “Frac of other familymembers with ownership (board seats) is the fraction of other family members that have ownership stakes(board seats) in the family group; “other family members” include all family members except the founder,his sons and his daughters. “Frac of family ownership held by sons” is the fraction of total family ownershipheld by the founder’s sons. “Frac of family’s board seats held by sons” is the fraction of total asset-weightedfamily’s board seats held by the founder’s sons.
28
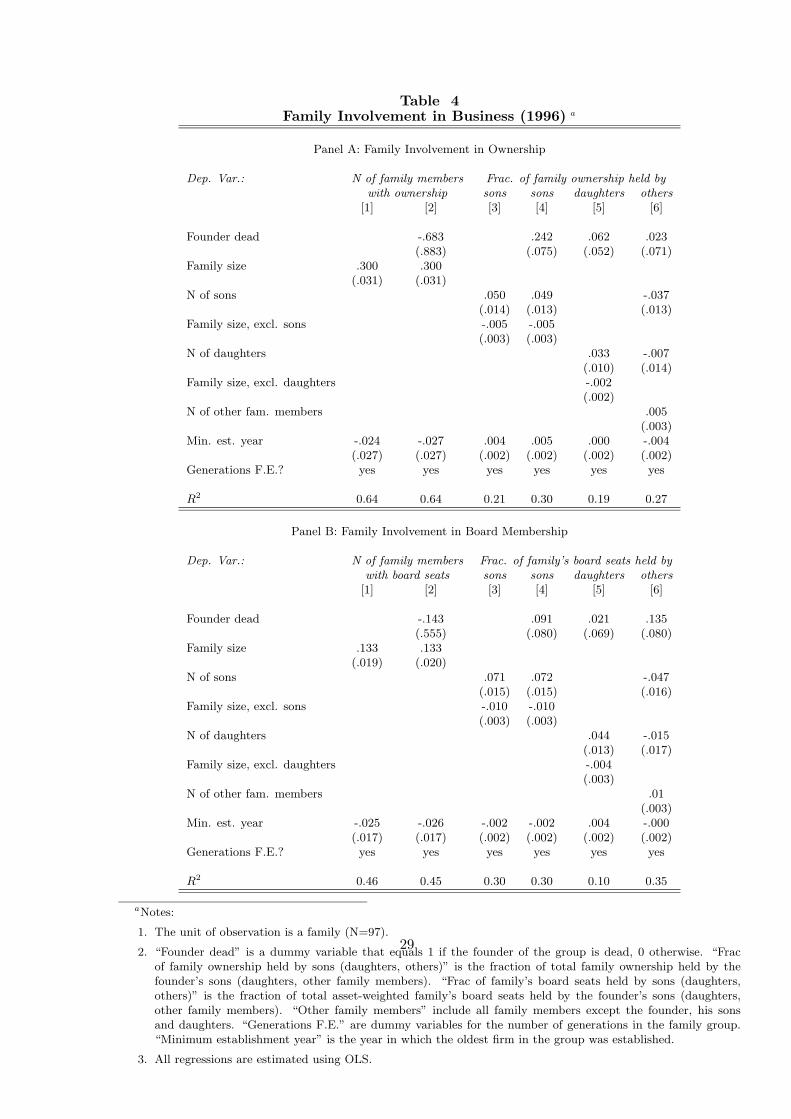
Table 4Family Involvement in Business (1996) a
Panel A: Family Involvement in Ownership
Dep. Var.: N of family members Frac. of family ownership held bywith ownership sons sons daughters others
[1] [2] [3] [4] [5] [6]
Founder dead -.683 .242 .062 .023(.883) (.075) (.052) (.071)
Family size .300 .300(.031) (.031)
N of sons .050 .049 -.037(.014) (.013) (.013)
Family size, excl. sons -.005 -.005(.003) (.003)
N of daughters .033 -.007(.010) (.014)
Family size, excl. daughters -.002(.002)
N of other fam. members .005(.003)
Min. est. year -.024 -.027 .004 .005 .000 -.004(.027) (.027) (.002) (.002) (.002) (.002)
Generations F.E.? yes yes yes yes yes yes
R2 0.64 0.64 0.21 0.30 0.19 0.27
Panel B: Family Involvement in Board Membership
Dep. Var.: N of family members Frac. of family’s board seats held bywith board seats sons sons daughters others
[1] [2] [3] [4] [5] [6]
Founder dead -.143 .091 .021 .135(.555) (.080) (.069) (.080)
Family size .133 .133(.019) (.020)
N of sons .071 .072 -.047(.015) (.015) (.016)
Family size, excl. sons -.010 -.010(.003) (.003)
N of daughters .044 -.015(.013) (.017)
Family size, excl. daughters -.004(.003)
N of other fam. members .01(.003)
Min. est. year -.025 -.026 -.002 -.002 .004 -.000(.017) (.017) (.002) (.002) (.002) (.002)
Generations F.E.? yes yes yes yes yes yes
R2 0.46 0.45 0.30 0.30 0.10 0.35
aNotes:
1. The unit of observation is a family (N=97).
2. “Founder dead” is a dummy variable that equals 1 if the founder of the group is dead, 0 otherwise. “Fracof family ownership held by sons (daughters, others)” is the fraction of total family ownership held by thefounder’s sons (daughters, other family members). “Frac of family’s board seats held by sons (daughters,others)” is the fraction of total asset-weighted family’s board seats held by the founder’s sons (daughters,other family members). “Other family members” include all family members except the founder, his sonsand daughters. “Generations F.E.” are dummy variables for the number of generations in the family group.“Minimum establishment year” is the year in which the oldest firm in the group was established.
3. All regressions are estimated using OLS.
29

30

Table 5Family Characteristics and Firm-Level Performance (1996)a
Panel A: Private and Public Firms
Dependent Variable: Residual ROA 1996
Sample: All Groups [1-4] (N=615) Heir(s) Active [5-7] (N=406) No Heir Active [8-10] (N=209)[1] [2] [3] [4] [5] [6] [7] [8] [9] [10]
Family size -0.0004 0.0000 -0.0004 0.0001(0.0002) (0.0003) (0.0002) (0.0002)
N of sons -0.003 -0.004 0.006(0.001) (0.001) (0.005)
Multiple sons -0.008 -0.010 -0.041 -0.037 0.013 0.004(0.009) (0.009) (0.015) (0.018) (0.012) (0.012)
Sons from diff. wives -0.010 -0.015 0.0034(0.007) (0.008) (0.029)
Est. year Yes Yes Yes Yes Yes Yes Yes Yes Yes YesGenerations F. E.? Yes Yes Yes Yes Yes Yes Yes Yes Yes YesR2 0.02 0.03 0.02 0.02 0.05 0.04 0.03 0.01 0.01 0.01
Panel B: Private versus Public Firms
Dependent Variable: Residual ROA 1996
Sample: Private Firms [1-6] (N=435) Public Firms [7-10] (N=180)
Sample: Heir(s) Active [1-3] No Heir Active [4-6] Heir(s) Active [7-8] No Heir Active [9-10][1] [2] [3] [4] [5] [6] [7] [8] [9] [10]
Family size -0.0002 -.0008 .0006 .0004(0.0004) (.004) (.0004) (.004)
N of sons -0.004 .003 -0.004 0.015(0.002) (0.007) (0.003) (0.008)
Multiple sons -0.058 -0.061 0.004 0.000 -0.012 0.041(0.021) (0.025) (0.017) (0.017) (0.023) (0.015)
Sons from diff. wives -0.011 0.048(0.010) (0.039)
Est. year Yes Yes Yes Yes Yes Yes Yes Yes Yes YesGenerations F. E.? Yes Yes Yes Yes Yes Yes Yes Yes Yes YesR2 0.04 0.05 0.04 0.01 0.00 0.00 0.00 0.00 0.06 0.09
aNotes:
1. The unit of observation is a firm.
2. The dependent variable in all regressions is residual ROA in 1996. Residual ROA is computed as follows.First, we define firm-level ROA as the ratio of firm net profits over firm total assets. For the full sample offirms in our data (i.e. including firms that are not part of the 97 business groups studied here), we then regressfirm-level ROA on 2-digit industry fixed effects and the logarithm of the firm’s total assets. Residual ROA isthe residual from this regression.
3. “Heir(s) active” is the sub-sample of firms belonging to a family where at least one family heir was appointed;“No heir active” is the sub-sample of firms belonging to a family where no heir was yet appointed.
4. “Family size” includes the founder and all of his direct descendants. “Multiple sons” is a dummy variable thatequals 1 if the founder had multiple sons. “Sons from different wives” is a dummy variable that equals 1 if thefounder had sons from different wives. “Generations F.E.” are dummy variables for the number of generationsin a given family. “Establishment year” is the year a given firm was established.
5. All regressions are estimated using OLS. Standard errors are reported in parentheses and clustered at thefamily-level.
31

32

Table 6Firm Performance, Ownership and Control (1996)a
Dependent Variable: Residual ROA 1996
Sample: All Groups [1-3] No Heir Active [4-5] Heir(s) Active [6-7][1] [2] [3] [4] [5] [6] [7]
Family ownership -0.001 -0.001 -0.001 -0.001 -0.001 -0.001 -0.001(0.000) (0.000) (0.000) (0.000) (0.000) (0.000) (0.000)
Family control > -0.010 0.020 -0.022family ownership (0.008) (0.014) (0.011)
N sons with -0.004 -0.005 -0.006control > ownership (0.003) (0.009) (0.003)
N oth. fam. members with 0.000 0.005 0.000control > ownership (0.001) (0.006) (0.002)
Av (control-ownership) -0.001among sons (0.000)
Av (control-ownership) 0.000among oth. fam. members (0.001)
Family F. E.? Yes Yes Yes Yes Yes Yes YesAdj. R2 0.11 0.12 0.12 0.15 0.12 0.12 0.12
aNotes:
1. The unit of observation is a firm.
2. The dependent variable in all regressions is residual ROA in 1996. Residual ROA is computed asfollows. First, we define firm-level ROA as the ratio of firm net profits over firm total assets. Forthe full sample of firms in our data (i.e. including firms that are not part of the 97 business groupsstudied here), we then regress firm-level ROA on 2-digit industry fixed effects and the logarithm ofthe firm’s total assets. Residual ROA is the residual from this regression.
3. “Heir(s) active” is the sub-sample of firms belonging to a family where at least one family heir wasappointed; “No heir active” is the sub-sample of firms belonging to a family where no heir was yetappointed.
4. “Family ownership” is the family ownership in the firm (mean=34). “Family control > family owner-ship” is a dummy variable that equals 1 if family control in the firm is larger than family ownership inthe firm, 0 otherwise (mean=.72). “Number of sons with control > ownership” is the number of sonswhose control stake on the firm exceeds their ownership stake (mean=1.5). “Number of other familymembers with control > ownership” is the number of other family members (i.e. not sons) whosecontrol stake on the firm exceeds their ownership stake (mean=2.7). “Average (control-ownership)among sons” is the average difference between control and ownership among sons (mean=8.7). “Av-erage (control-ownership) among other family members” is the average difference between controland ownership among other (i.e. not sons) family members (mean=12.7). “Family F.E.” are dummyvariables for the different families in our sample.
5. All regressions are estimated using OLS. Standard errors are reported in parentheses.
33
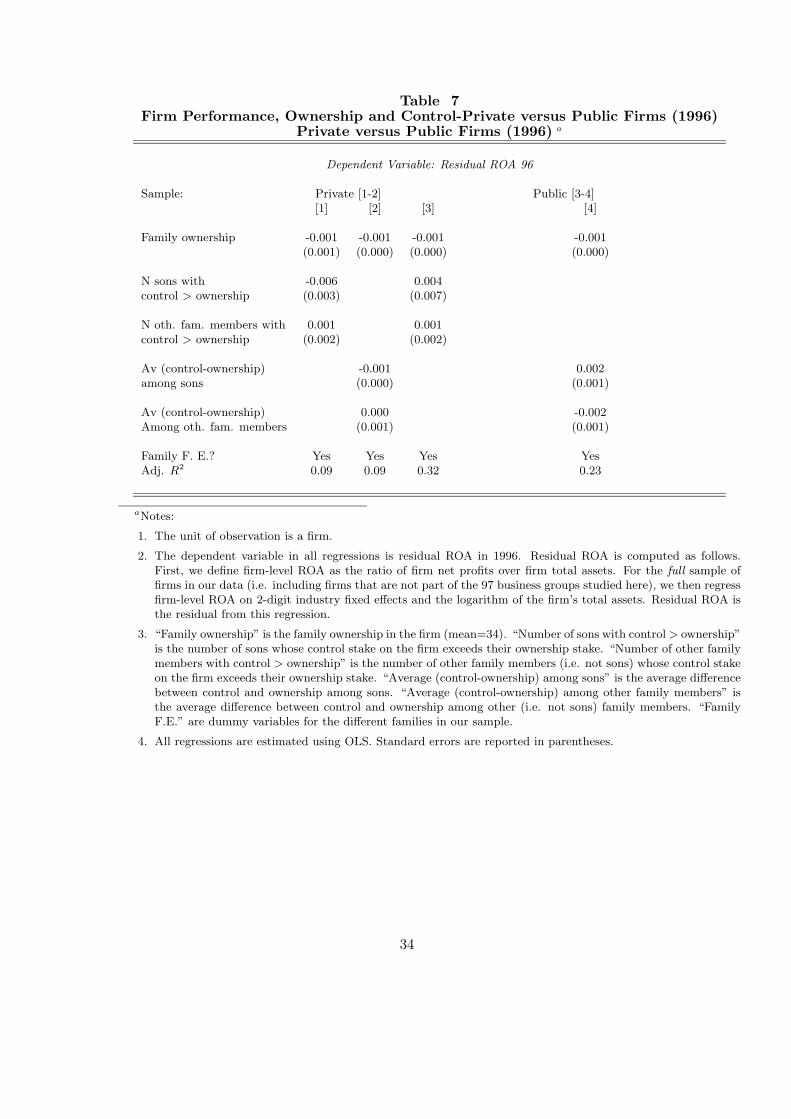
Table 7Firm Performance, Ownership and Control-Private versus Public Firms (1996)
Private versus Public Firms (1996) a
Dependent Variable: Residual ROA 96
Sample: Private [1-2] Public [3-4][1] [2] [3] [4]
Family ownership -0.001 -0.001 -0.001 -0.001(0.001) (0.000) (0.000) (0.000)
N sons with -0.006 0.004control > ownership (0.003) (0.007)
N oth. fam. members with 0.001 0.001control > ownership (0.002) (0.002)
Av (control-ownership) -0.001 0.002among sons (0.000) (0.001)
Av (control-ownership) 0.000 -0.002Among oth. fam. members (0.001) (0.001)
Family F. E.? Yes Yes Yes YesAdj. R2 0.09 0.09 0.32 0.23
aNotes:
1. The unit of observation is a firm.
2. The dependent variable in all regressions is residual ROA in 1996. Residual ROA is computed as follows.First, we define firm-level ROA as the ratio of firm net profits over firm total assets. For the full sample offirms in our data (i.e. including firms that are not part of the 97 business groups studied here), we then regressfirm-level ROA on 2-digit industry fixed effects and the logarithm of the firm’s total assets. Residual ROA isthe residual from this regression.
3. “Family ownership” is the family ownership in the firm (mean=34). “Number of sons with control> ownership”is the number of sons whose control stake on the firm exceeds their ownership stake. “Number of other familymembers with control > ownership” is the number of other family members (i.e. not sons) whose control stakeon the firm exceeds their ownership stake. “Average (control-ownership) among sons” is the average differencebetween control and ownership among sons. “Average (control-ownership) among other family members” isthe average difference between control and ownership among other (i.e. not sons) family members. “FamilyF.E.” are dummy variables for the different families in our sample.
4. All regressions are estimated using OLS. Standard errors are reported in parentheses.
34
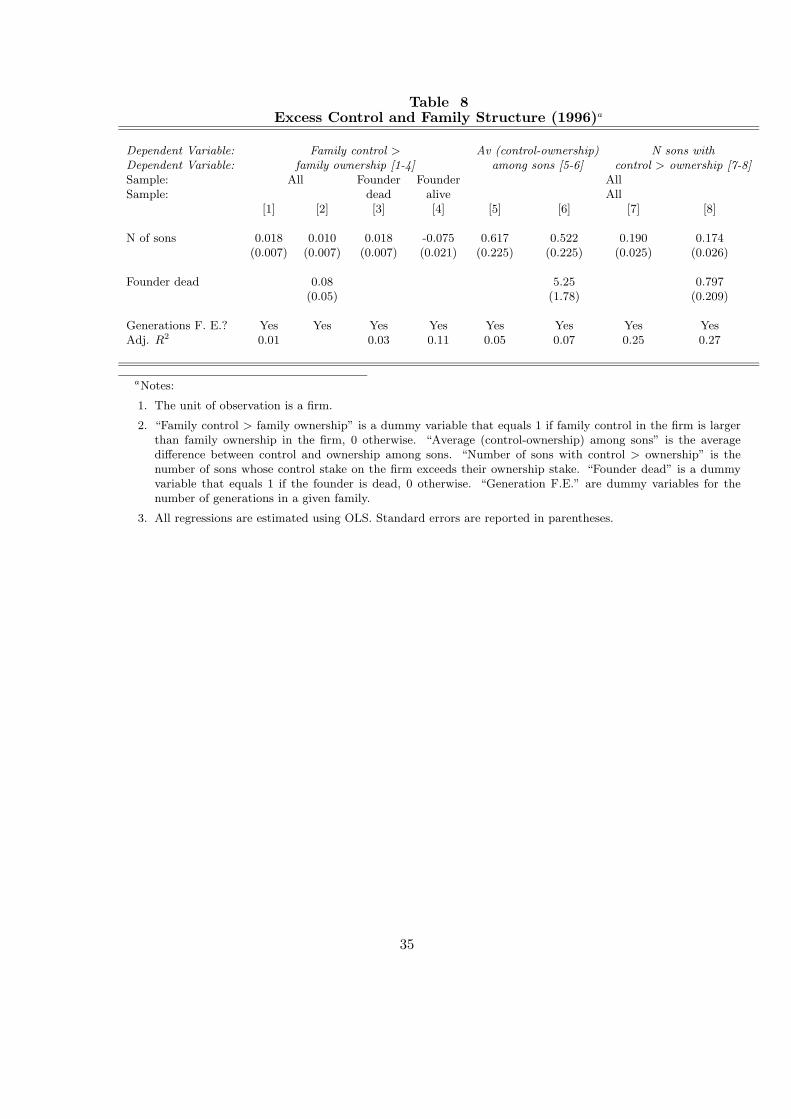
Table 8Excess Control and Family Structure (1996)a
Dependent Variable: Family control > Av (control-ownership) N sons withDependent Variable: family ownership [1-4] among sons [5-6] control > ownership [7-8]Sample: All Founder Founder AllSample: dead alive All
[1] [2] [3] [4] [5] [6] [7] [8]
N of sons 0.018 0.010 0.018 -0.075 0.617 0.522 0.190 0.174(0.007) (0.007) (0.007) (0.021) (0.225) (0.225) (0.025) (0.026)
Founder dead 0.08 5.25 0.797(0.05) (1.78) (0.209)
Generations F. E.? Yes Yes Yes Yes Yes Yes Yes YesAdj. R2 0.01 0.03 0.11 0.05 0.07 0.25 0.27
aNotes:
1. The unit of observation is a firm.
2. “Family control > family ownership” is a dummy variable that equals 1 if family control in the firm is largerthan family ownership in the firm, 0 otherwise. “Average (control-ownership) among sons” is the averagedifference between control and ownership among sons. “Number of sons with control > ownership” is thenumber of sons whose control stake on the firm exceeds their ownership stake. “Founder dead” is a dummyvariable that equals 1 if the founder is dead, 0 otherwise. “Generation F.E.” are dummy variables for thenumber of generations in a given family.
3. All regressions are estimated using OLS. Standard errors are reported in parentheses.
35
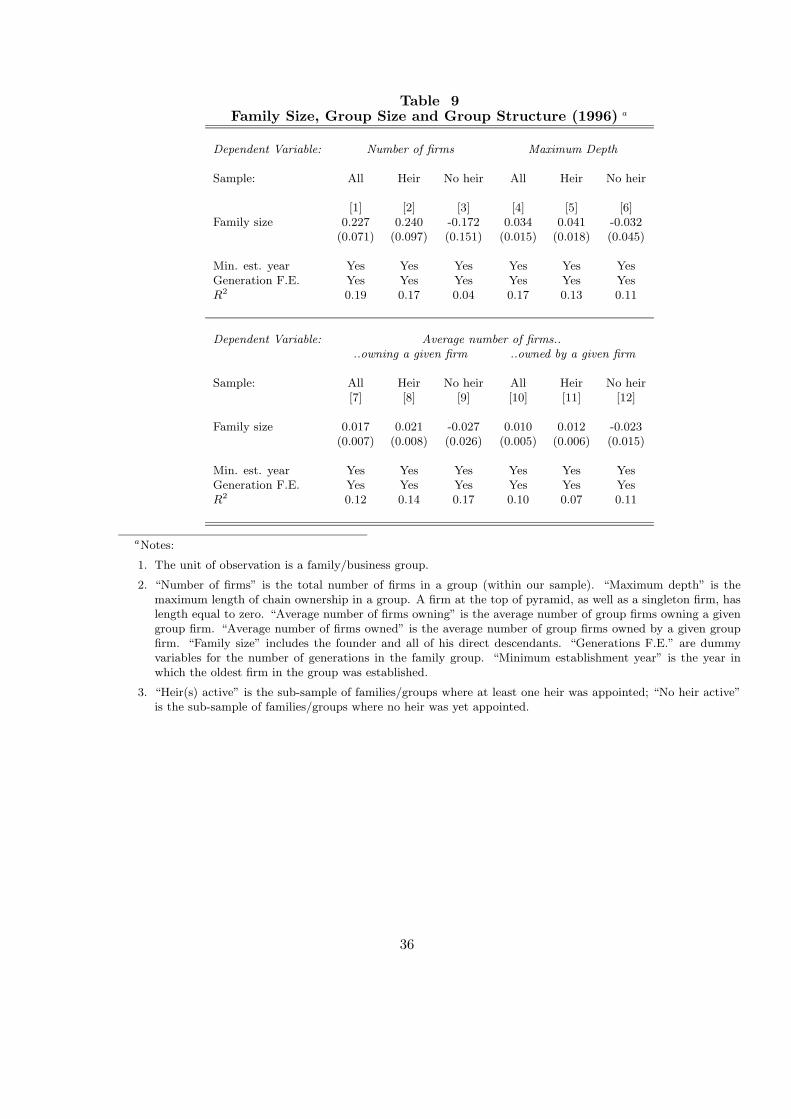
Table 9Family Size, Group Size and Group Structure (1996) a
Dependent Variable: Number of firms Maximum Depth
Sample: All Heir No heir All Heir No heir
[1] [2] [3] [4] [5] [6]Family size 0.227 0.240 -0.172 0.034 0.041 -0.032
(0.071) (0.097) (0.151) (0.015) (0.018) (0.045)
Min. est. year Yes Yes Yes Yes Yes YesGeneration F.E. Yes Yes Yes Yes Yes YesR2 0.19 0.17 0.04 0.17 0.13 0.11
Dependent Variable: Average number of firms....owning a given firm ..owned by a given firm
Sample: All Heir No heir All Heir No heir[7] [8] [9] [10] [11] [12]
Family size 0.017 0.021 -0.027 0.010 0.012 -0.023(0.007) (0.008) (0.026) (0.005) (0.006) (0.015)
Min. est. year Yes Yes Yes Yes Yes YesGeneration F.E. Yes Yes Yes Yes Yes YesR2 0.12 0.14 0.17 0.10 0.07 0.11
aNotes:
1. The unit of observation is a family/business group.
2. “Number of firms” is the total number of firms in a group (within our sample). “Maximum depth” is themaximum length of chain ownership in a group. A firm at the top of pyramid, as well as a singleton firm, haslength equal to zero. “Average number of firms owning” is the average number of group firms owning a givengroup firm. “Average number of firms owned” is the average number of group firms owned by a given groupfirm. “Family size” includes the founder and all of his direct descendants. “Generations F.E.” are dummyvariables for the number of generations in the family group. “Minimum establishment year” is the year inwhich the oldest firm in the group was established.
3. “Heir(s) active” is the sub-sample of families/groups where at least one heir was appointed; “No heir active”is the sub-sample of families/groups where no heir was yet appointed.
36

Table 10Exit (by 2001) and Structure of Family Ownership a
Dependent Variable: Exit
Sample: All Firms [1-4] Founder dead [5-6] Founder alive [7-8][1] [2] [3] [4] [5] [6] [7] [8]
N sons owning -0.007 -0.010 -0.021 -0.010 -0.016 -0.013 -0.013 0.006(0.006) (0.006) (0.014) (0.006) (0.007) (0.007) (0.020) (0.022)
Residual ROA 96 -0.081 -0.313 -0.100 -0.255 -0.518 -0.407 0.067 -0.304(0.159) (0.216) (0.158) (0.246) (0.270) (0.316) (0.312) (0.486)
Leverage 96 0.078 0.082 0.165 0.081 0.014 0.014 0.194 0.182(0.050) (0.050) (0.068) (0.051) (0.060) (0.061) (0.094) (0.096)
N sons owning* 0.105 0.108 0.122 0.119 -0.096 -0.226Res. ROA 96 (0.063) (0.058) (0.074) (0.072) (0.201) (0.257)
N sons owning* -0.041Leverage 96 (0.019)
N fam. members owning* -0.011 -0.013 0.152Res. ROA 96 (0.023) (0.024) (0.136)
Family ownership -0.001 -0.001 -0.001 -0.001 -0.001 -0.001 -0.001 -0.001(0.000) (0.000) (0.000) (0.000) (0.000) (0.000) (0.000) (0.000)
Dummy for family control > Yes Yes Yes Yes Yes Yes Yes Yesfamily ownership?Control for est. year? Yes Yes Yes Yes Yes Yes Yes YesIndustry F. E.? Yes Yes Yes Yes Yes Yes Yes YesGeneration F. E.? Yes Yes Yes Yes Yes Yes Yes YesR2 0.04 0.04 0.04 0.03 0.02 0.02 0.06 0.08
aNotes:
1. The unit of observation is a firm.
2. “Founder alive” is the sub-sample of families where the founder is still alive; “Founder dead” is the sub-sampleof families where the founder is dead. “Multiple sons” is the sub-sample of families where the founder hadmore than one son. “One son or less” is the sub-sample of families where the founder had at most one son.
3. The dependent variable in all regressions is a dummy variable that equals 1 if a firm has exited between 1996and 2001.
4. “Residual ROA 1996” is computed as follows. First, we define firm-level ROA as the ratio of firm net profitsover firm total assets. For the full sample of firms in our data (i.e. including firms that are not part of the97 business groups studied here), we then regress firm-level ROA on 2-digit industry fixed effects and thelogarithm of the firm’s total assets. Residual ROA 1996 is the residual from this regression. “Leverage 1996”is defined as the ratio of a firm’s total liabilities in 1996 to total assets in 1996. “Number of sons owning” isthe number of sons with ownership stakes at the firm. “Number of fam. members owning” is the total numberof family members with ownership stakes at the firm. “Family ownership” is the family ownership in the firm.“Family control > family ownership” is a dummy variable that equals 1 if family control in the firm is largerthan family ownership in the firm, 0 otherwise. “Generations F.E.” are dummy variables for the number ofgenerations in a given family. “Industry F.E. are dummy variables for 1-digit industries. “Establishment year”is the year a given firm was established.
5. All regressions are estimated using OLS.37

Table 11Exit (by 2001) on Leverage (1996) a
Dependent Variable: Exit
Sample: All Firms Founder alive Founder dead [3-5]All Multiple One son
sons or less[1] [2] [3] [4] [5]
Leverage 96 0.119 0.242 0.046 0.031 0.152(0.046) (0.070) (0.055) (0.039) (0.139)
Residual ROA 96 -0.075 0.192 -0.159 -.199 0.015(0.163) (0.286) (0.187) (0.207) (0.401)
Est. year Yes Yes Yes Yes YesGeneration F. E. Yes Yes Yes Yes YesR2 0.01 0.01 0.03 0.00 0.00
aNotes:
1. The unit of observation is a firm (N=622 in column 1).
2. “Founder alive” is the sub-sample of families where the founder is still alive; “Founder dead” is thesub-sample of families where the founder is dead. “Multiple sons” is the sub-sample of families wherethe founder had more than one son. “One son or less” is the sub-sample of families where the founderhad at most one son.
3. The dependent variable in all regressions is a dummy variable that equals 1 if a firm has exitedbetween 1996 and 2001.
4. “Residual ROA 1996” is computed as follows. First, we define firm-level ROA as the ratio of firm netprofits over firm total assets. For the full sample of firms in our data (i.e. including firms that arenot part of the 97 business groups studied here), we then regress firm-level ROA on 2-digit industryfixed effects and the logarithm of the firm’s total assets. Residual ROA 1996 is the residual from thisregression. “Leverage 1996” is defined as the ratio of a firm’s total liabilities in 1996 to total assetsin 1996. “Generations F.E.” are dummy variables for the number of generations in a given family.“Establishment year” is the year a given firm was established.
5. All regressions are estimated using OLS.
38

Table 12Firm Performance (2001) on Leverage (1996) a
Dependent Variable: Residual ROA 2001
Sample: All Firms Founder alive Founder dead [3-5]All Multiple One son
sons or less[1] [2] [3] [4] [5]
Leverage 96 -0.066 -0.042 -0.090 -0.098 0.041(0.025) (0.043) (0.031) (0.034) (0.091)
Residual ROA 96 0.200 0.526 -0.025 -0.070 0.383(0.090) (0.156) (0.109) (0.117) (0.276)
Est. year Yes Yes Yes Yes YesGeneration F. E.? Yes Yes Yes Yes YesR2 0.06 0.11 0.02 0.02 0.00
aNotes:
1. The unit of observation is a firm. Sample is the set of group firms as of 1996 that survived until 2001(N=567 in column 1).
2. “Founder alive” is the sub-sample of families where the founder is still alive; “Founder dead” is thesub-sample of families where the founder is dead. “Multiple sons” is the sub-sample of families wherethe founder had more than one son. “One son or less” is the sub-sample of families where the founderhad at most one son.
3. The dependent variable in all regressions is residual ROA in 2001. Residual ROA (for 1996 or 2001)are computed as follows. First, we define firm-level ROA as the ratio of firm net profits over firmtotal assets. For the full sample of firms in our data (i.e. including firms that are not part of the 97business groups studied here), we then regress firm-level ROA on 2-digit industry fixed effects andthe logarithm of the firm’s total assets. Residual ROA (for 1996 or 2001) is the residual from thisregression.
4. “Leverage in 1996” is defined as the ratio of a firm’s total liabilities in 1996 to total assets in 1996.“Generations F.E.” are dummy variables for the number of generations in a given family. “Establish-ment year” is the year a given firm was established.
5. All regressions are estimated using OLS.
39