mixing: impeller performance in stirred tanks
TRANSCRIPT

Feature Report
CHEMICAL ENGINEERING WWW.CHEMENGONLINE.COM AUGUST 201742
Mixing has been defined as “the application of mechanical mo-tion in order to create fluid dy-namic effects that achieve a de-
sired process result” [1]. The process result is the objective of the vessel operator and will be a transformation of the ingredients fed to the vessel into a product. The goal of the equipment supplier will be to under-stand the role of mixing in promoting the transformation and choosing an impeller that will create the appropriate fluid-dy-namic effects to do this.
Processes carried out in stirred tanks can be generally divided into the following two classes:• Those relying on flow generated by the
impeller creating motion throughout the fluid, such as blending of pigments into a resin or emulsion in paint manufacture where homogeneity of the vessel contents is critical to product quality
• Those relying on “shear” to reduce the size of a second dispersed phase, whether gas bubbles, liquid droplets or particles, such as a hydrogenation reactor where smaller bubbles provide more sur-face area for mass transfer from the gas into the liquid phaseImpellers are often described qualitatively
as, among others, high flow, high shear or high efficiency, and the choice of equip-ment required to achieve the process result most efficiently is made on this vague basis. This article describes how the performance characteristics of impellers commonly used in stirred tanks can be quantified, thereby enabling engineers to make educated deci-sions about which ones to use in order to achieve their desired process results.
TurbulenceTurbulent flow is characterized by the pres-ence of random fluctuations in velocity, so-called eddies, that are superimposed on the mean, time-averaged flow. There will be a
Richard K. Grenville and Jason J. GiacomelliPhiladelphia Mixing Solutions Ltd.Gustavo Padron and David A. R. BrownBHR Group
Characterizing mixer impellers on the basis of power, flow, shear and efficiency
Mixing:
Impeller Performance in Stirred Tanks
IN BRIEFTURBULENCE
IMPELLER GEOMETRIES
HYDRAULIC EFFICIENCY
SHEAR
PROCESS RESULTS
TRAILING VORTEX
APPLICATIONS
CONCLUSIONS
NOMENCLATUREA Constant in Equation (30)ADIS Discharge area for primary flow from impellerD Impeller diameterd32 Sauter mean droplet sizeFl Flow or pumping number (= Q/(ND3))K Ratio (= MAX/)kMAX Maximum kinetic energy in trailing vortexl0 Diameter of trailing vortexN Impeller rotational speedP PowerPo Power number [= P/(N3D5)]Q Flow rate generated by impellerR Impeller radiusr Radial position in impeller discharge for estimating velocity gradientRe Impeller Reynolds number (= ND2/µ)T Vessel diameterU Mean velocity in impeller discharge (= Q/ADIS)VTIP Impeller tip speedvH High velocity in impeller discharge for estimating velocity gradientvL Low velocity in impeller discharge for estimating velocity gradientw Projected blade heightx Ratio of impeller to trailing vortex diameters (= D/l0)y Distance (in definition of shear rate) Constant (= vH/VTIP) Constant (= vL/VTIP) Time-averaged velocity gradient Power input per mass of fluid in vesselMAX Local energy dissipation rate in trialing vortex Efficiency defined as mass of fluid pumped per unit energy input by impeller Shear rate constant Liquid density Efficiency defined as kinetic energy of fluid divided by mechanical energy input by impeller Constant (= rH/R) Constant (= rL/R)
SubscriptsAX AxialHYDFL HydrofoilIMP ImpellerHYDR HydraulicMECH Mechanical
PBT Pitched-blade tur-bineRD RadialRUSH Rushton
.

CHEMICAL ENGINEERING WWW.CHEMENGONLINE.COM AUGUST 2017 43
range of eddy time and length scales associated with a particular flow field. The size of the largest eddies will be on the order of the size of the equipment generat-ing the flow (for example, the blade width of an impel-ler). The size of the smallest eddies is the Kolmogorov length scale. The eddies also have a lifetime, with the larger eddies existing for a longer period than the small ones. Understanding the role turbulence plays in mixing processes is critical to successful design and scaleup [2].
Impeller geometriesThere are four general classes of impellers used in stirred tanks operating in low to medium viscosity fluids in the turbulent regime (Re > 104):1. Axial flow. The primary flow generated by an axial-flow impeller is directed down toward the base of the vessel. Hydrofoils with narrow or wide blades are in this category.
Hydrofoils have profiled blades that may be narrow like an airplane wing (Figure 1a) or wide like a marine propeller (Figure 1b). These impellers were developed to generate the same velocity profile as a propeller, but to be fabricated rather than cast to reduce the impeller’s weight and cost. They are also easier to install since they can be supplied as a hub and blades that are as-sembled inside the vessel [3]. These impellers are gen-erally considered to be “low-shear” [4].
An anti-ragging hydrofoil (Figure 1c) is used in waste-water applications. It has blades that are swept-back preventing build-up of fibrous matter, which is commonly present in municipal wastewater, on the leading edge of the blades.2. Mixed flow. These impellers generate both axial and radial components of velocity and the distribution be-tween the two can be controlled by adjusting the impeller diameter to vessel diameter ratio. Pitched-blade turbines (Figure 1d) are in this category.
Pitched-blade turbines have flat blades that are usu-ally angled at 45 deg, although shallower and steeper angles are sometimes used.3. Radial flow. These impellers generate a strong ra-dial component of velocity directed at the vessel wall. A pitched blade turbine with 90-deg blade angle generates radial flow and is commonly called a flat-blade turbine (Figure 1e).
Impellers used for processes requiring dispersion of gas bubbles also generate a primarily radial flow, but have blades attached to a disk. The Rushton (Figure 1f) and Smith (Figure 1g) turbines are commonly used for these processes. The disk ensures that bubbles fed into the vessel beneath the impeller must flow through the blades where the local “shear” breaks them up, creating high interfacial area for mass transfer. The Rushton tur-bine is generally considered to be “high-shear” [4].4. High-speed dispersers. These impellers look like circular-saw blades with alternating teeth angled up and down (Figure 1h). They operate at high rotational and tip speeds and are used almost exclusively for processes that require significant size reduction, such as dispersion and de-agglomeration of dry powder when preparing a slurry from liquid and a dry powder.
Hydraulic efficiencyImpellers in stirred tanks are machines that move fluid; essentially they are pumps. Like pumps, their efficiency can be defined and calculated. The hydraulic efficiency of a pump is the ratio of the kinetic energy of the flowing fluid to the mechanical energy input by the impeller.
The mechanical power input by an impeller in a stirred vessel is calculated from the following equation (Note: all nomenclature are defined in the box on p. 46):
PMECH = Po N 3 D5 (1)
a. Narrow-blade hydrofoil b. Wide-blade hydrofoil c. Anti-ragging hydrofoil d. Pitched-blade turbine
e. Flat-blade turbine f. Rushton turbine g. Smith turbine h. High-shear disperser blade
FIGURE 1. Four general classes of impellers are used in stirred tanks operating at low to medium viscosities in the turbulent regime. These impellers primarily generate: axial flow (a, b, c); mixed flow (d), radial flow (e, f, g) or dispersion or de-agglomeration (h)
Credit for a–g: PMSL
Credit for h: www.indiamart.com

CHEMICAL ENGINEERING WWW.CHEMENGONLINE.COM AUGUST 201744
Po is the impeller’s power number and it is a drag coef-ficient that is determined by the geometry of the impeller (blade width, blade angle, number of blades and so on.).
The primary flow generated by an impeller is calculated from Equation (2):
Q = Fl N D3 (2)
Fl is the impeller’s flow, or pumping number.Both the power and flow numbers are measured ex-
perimentally and typical values for commonly used im-pellers are given in Table 1.
The average velocity in the impeller discharge can be calculated from Equation (3):
U =QADIS
(3)
ADIS is the area through which the primary flow is pumped. For axial-flow impellers, this is a disk with diameter equal to the impeller diameter and for radial-flow impellers it is the wall of a cylinder with diameter equal to the impeller diameter and height equal to the blade width.For axial-flow impellers:
U =Fl N D3
4( ) D2=4Fl N D
(4)
For radial-flow impellers:
U =Fl N D3
w D=Fl D
wN D (5)
The energy dissipation rate, or power, of the flowing fluid is the product of the flowrate and the head that the pump develops:
PHYDR =Q H (6)
Where:
H =U 2
2 (7)
Combining Equations (2), (4), (6) and (7), for axial flow impellers:
PHYDR = Fl N D3
24Fl N D
2
=8Fl3
2 N 3 D5 (8)
AX =PHYDRPMECH
=82Fl3 N 3 D5
Po N 3 D5 =82Fl3
Po (9)
Similarly, combining Equations (2), (5), (6) and (7), for radial-flow impellers:
PHYDR = Fl N D3
2Fl Dw
N D2
=Fl3
2 2Dw
2
N 3 D5
PHYDR = Fl N D3
2Fl Dw
N D2
=Fl3
2 2Dw
2
N 3 D5
(10)
RD =PHYDRPMECH
=12 2
Dw
2 Fl3 N 3 D5
Po N 3 D5 =12 2
Dw
2 Fl3
Po
RD =PHYDRPMECH
=12 2
Dw
2 Fl3 N 3 D5
Po N 3 D5 =12 2
Dw
2 Fl3
Po
(11)
The hydraulic efficiency, , is plotted against the im-pellers’ power numbers in Figure 2. The circular symbols represent data measured by the FMP (Fluid Mixing Pro-cesses) consortium [5] using laser-Doppler anemometry and the diamonds represent data measured in the PMSL laboratory using particle-image velocimetry. The data are in agreement showing that measurement technique has no effect on the values of hydraulic efficiency calculated.
The hydrofoils are the most efficient impellers followed by the pitched-blade turbines, then the radial flow flat-blade and Rushton turbines. The high-shear disperser impeller is the least efficient, with a hydraulic efficiency of less than 1%. The difference in efficiency within a class of impellers is a result of the impeller to tank diameter ratio. A larger impeller is more efficient and this definition of hydraulic efficiency does not take this into account.
An alternative definition of efficiency has been pro-posed by Fort and others [6]. This is the mass of fluid pumped per unit of energy input by an impeller:
v
FIGURE 2. This graph plots the hydraulic efficiency, HYDR, versus the power number for various impellers
TABLE 1. TYPICAL VALUES OF Po, Fl AND x FOR COMMON IMPELLERS
Impeller Power number Flow number x = D / l0
Narrow-blade hydrofoil 0.30 0.52 17
Wide-blade hydrofoil 0.70 0.66
Pitched-blade turbine 1.50 0.80 16
Flat-blade turbine 3.00 0.80
Rushton turbine 5.00 0.65 12
HSD-Sawtooth 0.10 0.05 12
HY
DR, %
60%
50%
40%
30%
20%
10%
0%0 1 2 3 4 5 6
Po, dimensionless
Pitched-blade turbineNarrow hydrofoilWide hydrofoilFlat-blade turbineRushtonHigh-shear disperser sawtoothWide hydrofoilNarrow hydrofoilPitched-blade turbineAnti-ragging turbine

CHEMICAL ENGINEERING WWW.CHEMENGONLINE.COM AUGUST 2017 45
HYDR =Q
PMECH=
Fl N D3
Po N 3 D5 =Fl
Po N D( )2 (12)
This quantity has units of kilogram of fluid pumped per Joule of energy input by the impeller.
The power input per unit mass of fluid, for a vessel where depth is equal to vessel diameter, can be calcu-lated from:
=Po N 3 D5
4( ) T 3=4 Po N 3 D5
T 3 (13)
Re-arranging for impeller speed:
N =T 3
4Po D5
1 3
(14)
Substituting Equation (14) into Equation (12) gives the following:
HYDR =Fl
Po D24 4Po D5
T 3
2 3
=1.175 FlPo2 3
DT
4 3
T( )2 3
HYDR =Fl
Po D24 4Po D5
T 3
2 3
=1.175 FlPo2 3
DT
4 3
T( )2 3
(15)
The hydraulic efficiency data plotted in Figure 2 are replotted in Figure 3 using the new definition from Equa-tion (15) with a power per mass of 1 W/kg and vessel diameter of 1 m. The effect of impeller diameter is now taken into account and large diameter impellers (D/T ≈ 0.5) are more efficient than smaller ones (D/T ≈ 0.3), pumping approximately twice the mass of fluid per unit of energy input.
ShearIn any flowing system, the shear rate is the time-aver-aged velocity gradient [7].
Oldshue [3] has compared the time-averaged veloc-ity gradients in the discharge of a hydrofoil and pitched-blade and Rushton turbines to show that the Rushton generates higher shear than the pitched-blade, which generates higher shear than the hydrofoil. This has be-come the conventional wisdom in the mixing field.
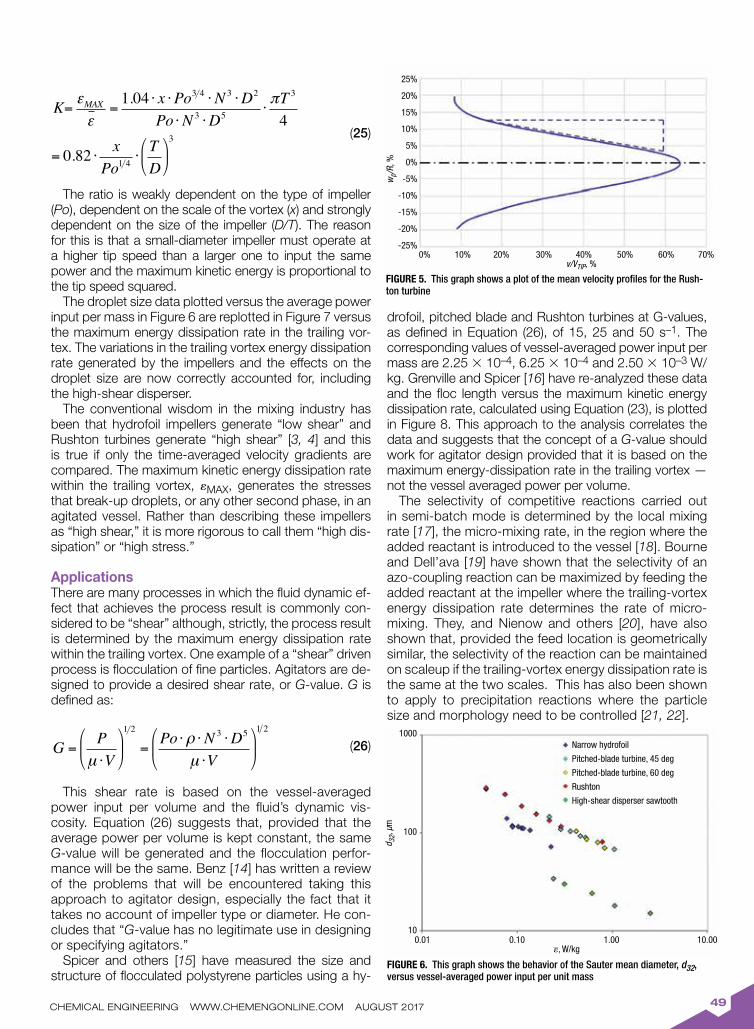
Figure 4 shows the mean velocity profiles for a hydro-foil (in green) and pitched-blade turbine (in red), which were measured using particle-image velocimetry in the PMSL laboratory. The dashed lines show the average velocity gradient in the discharge. Figure 5 shows the mean velocity profile for the Rushton turbine and, again, the dashed lines show the average velocity gradient in the discharge. The shear rate is described by the follow-ing equation:
=vH vLrH rL
(16)
where vH and vL are the high and low velocities in the gradient and rH and rL are the radial positions corre-sponding to the locations where these velocities were measured. Since the velocities are normalized by the impeller tip speed and the radial positions by the impeller radius, Equation (16) can be re-written as follows:
=( ) VTIP( ) R
=VTIPR
(17)
Values of , , , and are given in Table 2. Also the ratio of / HYDFL is shown and, at equal tip speed and impeller diameter the Rushton generates the high-est shear rate followed by the pitched-blade turbine and then the hydrofoil.
Engineers are concerned with the power drawn by the impeller since this determines the size of the agitator needed to achieve the desired process result. Equation (13) can be rearranged to express the power input by the impeller per unit mass of fluid in terms of tip speed:
=44 Po VTIP3
TDT
2
(18)
The π3 term must be introduced because VTIP = πND.Comparing different impellers of equal diameter at the
same scale:
VTIP Po 1 3 (19)
Comparing any impeller with the hydrofoil:
IMP
HYDFL
= IMP
HYDFL
VIMPVHYDFL
(20)
Substituting Equation (19) into Equation (20):
IMP
HYDFL
= IMP
HYDFL
PoHYDFLPoIMP
1 3
(21)
FIGURE 3. Shown here is a plot of the hydraulic efficiency, HYDR, versus impeller-to-vessel-diameter ratio
HY
DR, k
g/J
0.5
0.4
0.3
0.2
0.1
00.2 0.3 0.4 0.5 0.6
D/T, dimensionless
Pitched-blade turbineNarrow hydrofoilWide hydrofoilFlat-blade turbineRushtonHigh-shear disperser sawtoothWide hydrofoilNarrow hydrofoilPitched-blade turbineAnti-ragging turbine

ENDORSING ASSOCIATIONS
MEDIAPARTNERS
OCT 31 - NOV 2 • JAVITS CENTER • NEW YORK
† 300+ EXHIBITING COMPANIES
† 5,000+ CPI PROFESSIONALS
† 30+ FREE SEMINARS
† HUNDREDS OF NEW PRODUCTS
S I N C E 1 9 1 5
E X P E R I E N C E
THE EVENT FOR
PROCESSINGTECHNOLOGY
DESIGNED FOR PROCESS ENGINEERS, PRODUCTION & PLANT PERSONNEL, EXECUTIVES AND R&DFor over 100 years, the Chem Show continues to connect leading manufacturers of equipment, systems and
services for the CPI with tens of thousands of professionals from every segment of the process industries.
FREE REGISTRATION AT CHEMSHOW.COM
TU E S DAY Benefits of IIoT Monitoring of Pumps, Valves, Equipment and Document Management † Flowrox
Optimizing Process Design Using Pneumatic Conveying and Blending † FLSmidth Inc.
Innovative Mechanical Seal Technologies for Industries to Operate More Reliably and Efficiently with Less Downtime and Maintenance Costs † SCENIC PRECISE ELEMENT INC.
Powder Characterization for Process Optimization † Freeman Technology Inc.
Increase Reliability and Reduce Energy Costs with Pump & Piping Analysis Using Flow Modeling Software † Hydraulic Institute
Bulk Storage and Day’s-Use Product Management † Steelcraft
Solutions to Ensure Successful Scale-up for Process Intensification † Fuji Techno Industries Corporation
Troubleshooting Common Bulk Solids Handling Issues † Jenike & Johanson, Inc.
Solving Challenges for Ultra Low Flow Fluid Handling † Bronkhorst USA Inc.
Ultrasonic Processing from Bench-top to Industrial Production: Applications, Process Intensification & Scale-up † Hielscher Ultrasonics GmbH
Minimizing Nozzle Loads and Pipe Stresses to Optimize Chemical Pumping Systems † Hydraulic Institute
Methods to Avoid Caking and Unwanted Agglomeration † Jenike & Johanson, Inc.
2018 Chemical Industry Spending Outlook: USA & Canada † Industrial Information Resources, Inc.
Solutions to Clean Out Your Thermal Oil System † Multitherm
W E D N E S DAY
Methods for Testing Flowmeter Calibration: Multivariable Transmitters † Beamex
Maximize Reliability for Rotary Positive Displacement Pumps in the Chemical Processing Industry † Viking Pump, Inc., A Unit of IDEX Corporation
Advanced-Flow Reactors: Made for Industrial Production † Corning SAS
Solutions for Combustible and Fugitive Dust for Compliance & Safety † SonicAire
The Kirkpatrick Awards - Innovative Chemical Engineering Technologies that Have Been Commercialized in the Past Two Years † Chemical Engineering Magazine
Transitioning to Continuous Pressure and Vacuum Filtration Technologies from Batch Operations † BHS - Sonthofen Inc.
Differential Pressure Flowmeter Calibration: Best-Practices in the Field † Beamex
Problems and Solutions for Concrete Coatings, Linings & Flooring for the Industrial and Chemical Markets † Stonhard
Choosing Appropriate Chemical Splash Protective Clothing † Lac-Mac Limited
Induce and Enhance Phase Transfer Catalysis with Ultrasonics † Hielscher Ultrasonics GmbH
Leveraging Your Expertise to be a Chemical Industry Consultant † Association of Consulting Chemists & Chemical Engineers, Inc.
Methods for Designing Bulk Solids Moving Bed Processing Vessels † Jenike & Johanson, Inc.
Navigating Pitfalls When Choosing Pressure Relief Devices for System Designs † BS&B Safety Systems, L.L.C.
TH U R S DAY
Using an Anti-fouling Membrane Filtration System for Higher Concentration † BKT
Advances in Particle Size Analysis in the Lab and Online † Particle Sizing Systems
Process Industry Best Practices † PIP-Process Industry Practices
Tips to Communicate Effectively with the Petrochemical Industry Today and Tomorrow † Hydrocarbon Processing
Boost the Efficiency of Shift Handovers and Morning Meetings at Your Plant † eschbach GmbH
Industry Trends in Control Valve Automation † Badger Meter
Agitation Selection and Sizing for Viscous Products † Steelcraft
F R E E S E M I N A R P R O G R A MTHERE IS NO COST TO ATTEND A SEMINAR, HOWEVER SEATS FILL FAST AND REGISTRATION IS RECOMMENDED.
YOU CAN RESERVE A SEAT FOR THE SEMINARS YOU WISH TO ATTEND WHEN YOU REGISTER FOR THE SHOW.
TO REGISTER FOR THE SHOW, AND FOR SEMINAR DESCRIPTIONS AND TIMES, GO TO CHEMSHOW.COM .
Circle 05 on p. 62 or go to adlinks.chemengonline.com/66431-05
ENDORSING ASSOCIATIONS
MEDIAPARTNERS
OCT 31 - NOV 2 • JAVITS CENTER • NEW YORK
† 300+ EXHIBITING COMPANIES
† 5,000+ CPI PROFESSIONALS
† 30+ FREE SEMINARS
† HUNDREDS OF NEW PRODUCTS
S I N C E 1 9 1 5
E X P E R I E N C E
THE EVENT FOR
PROCESSINGTECHNOLOGY
DESIGNED FOR PROCESS ENGINEERS, PRODUCTION & PLANT PERSONNEL, EXECUTIVES AND R&DFor over 100 years, the Chem Show continues to connect leading manufacturers of equipment, systems and
services for the CPI with tens of thousands of professionals from every segment of the process industries.
FREE REGISTRATION AT CHEMSHOW.COM
TU E S DAY Benefits of IIoT Monitoring of Pumps, Valves, Equipment and Document Management † Flowrox
Optimizing Process Design Using Pneumatic Conveying and Blending † FLSmidth Inc.
Innovative Mechanical Seal Technologies for Industries to Operate More Reliably and Efficiently with Less Downtime and Maintenance Costs † SCENIC PRECISE ELEMENT INC.
Powder Characterization for Process Optimization † Freeman Technology Inc.
Increase Reliability and Reduce Energy Costs with Pump & Piping Analysis Using Flow Modeling Software † Hydraulic Institute
Bulk Storage and Day’s-Use Product Management † Steelcraft
Solutions to Ensure Successful Scale-up for Process Intensification † Fuji Techno Industries Corporation
Troubleshooting Common Bulk Solids Handling Issues † Jenike & Johanson, Inc.
Solving Challenges for Ultra Low Flow Fluid Handling † Bronkhorst USA Inc.
Ultrasonic Processing from Bench-top to Industrial Production: Applications, Process Intensification & Scale-up † Hielscher Ultrasonics GmbH
Minimizing Nozzle Loads and Pipe Stresses to Optimize Chemical Pumping Systems † Hydraulic Institute
Methods to Avoid Caking and Unwanted Agglomeration † Jenike & Johanson, Inc.
2018 Chemical Industry Spending Outlook: USA & Canada † Industrial Information Resources, Inc.
Solutions to Clean Out Your Thermal Oil System † Multitherm
W E D N E S DAY
Methods for Testing Flowmeter Calibration: Multivariable Transmitters † Beamex
Maximize Reliability for Rotary Positive Displacement Pumps in the Chemical Processing Industry † Viking Pump, Inc., A Unit of IDEX Corporation
Advanced-Flow Reactors: Made for Industrial Production † Corning SAS
Solutions for Combustible and Fugitive Dust for Compliance & Safety † SonicAire
The Kirkpatrick Awards - Innovative Chemical Engineering Technologies that Have Been Commercialized in the Past Two Years † Chemical Engineering Magazine
Transitioning to Continuous Pressure and Vacuum Filtration Technologies from Batch Operations † BHS - Sonthofen Inc.
Differential Pressure Flowmeter Calibration: Best-Practices in the Field † Beamex
Problems and Solutions for Concrete Coatings, Linings & Flooring for the Industrial and Chemical Markets † Stonhard
Choosing Appropriate Chemical Splash Protective Clothing † Lac-Mac Limited
Induce and Enhance Phase Transfer Catalysis with Ultrasonics † Hielscher Ultrasonics GmbH
Leveraging Your Expertise to be a Chemical Industry Consultant † Association of Consulting Chemists & Chemical Engineers, Inc.
Methods for Designing Bulk Solids Moving Bed Processing Vessels † Jenike & Johanson, Inc.
Navigating Pitfalls When Choosing Pressure Relief Devices for System Designs † BS&B Safety Systems, L.L.C.
TH U R S DAY
Using an Anti-fouling Membrane Filtration System for Higher Concentration † BKT
Advances in Particle Size Analysis in the Lab and Online † Particle Sizing Systems
Process Industry Best Practices † PIP-Process Industry Practices
Tips to Communicate Effectively with the Petrochemical Industry Today and Tomorrow † Hydrocarbon Processing
Boost the Efficiency of Shift Handovers and Morning Meetings at Your Plant † eschbach GmbH
Industry Trends in Control Valve Automation † Badger Meter
Agitation Selection and Sizing for Viscous Products † Steelcraft
F R E E S E M I N A R P R O G R A MTHERE IS NO COST TO ATTEND A SEMINAR, HOWEVER SEATS FILL FAST AND REGISTRATION IS RECOMMENDED.
YOU CAN RESERVE A SEAT FOR THE SEMINARS YOU WISH TO ATTEND WHEN YOU REGISTER FOR THE SHOW.
TO REGISTER FOR THE SHOW, AND FOR SEMINAR DESCRIPTIONS AND TIMES, GO TO CHEMSHOW.COM .

CHEMICAL ENGINEERING WWW.CHEMENGONLINE.COM AUGUST 201748
Table 2 also shows the ratio of the shear rates when the impellers operate at equal power input per mass. Taking power numbers from Table 1, the ranking of the impellers does not change. Therefore, whether com-pared at equal tip speed or power input the Rushton turbine generates the highest shear rate followed by the pitched-blade turbine then the hydrofoil. This ranking can be tested against a process result that is dependent on shear, namely the break-up of droplets to create a liquid-liquid dispersion.
Process resultMass transfer between two immiscible liquid phases, with or without reaction, is an important process result. The in-terfacial area available for mass transfer is proportional to the volume fraction of the dispersed phase and inversely proportional to the Sauter mean droplet size [8].
If the dispersion is agitated for a long period of time (several hours), an “equilibrium droplet size” is achieved that is stable in the mixing environment in which the droplets are being formed. This means that there is an equilibrium between the forces breaking-up the droplets and the forces resisting break-up resulting from the inter-facial tension between the two liquids and the viscosity of the dispersed phase liquid.
Figure 6 shows the Sauter mean droplet size plotted versus the average power input per unit mass for Rush-ton, two pitched-blade turbines, with blades angled at 45 and 60 deg, a hydrofoil and a high-shear disperser impeller. The experiments were carried out with low vis-cosity silicone oil as the dispersed phase and at a very low concentration so that the effect of coalescence on the droplet size can be ignored.
If the hydraulic efficiency and shear rate comparison quantify the performance characteristics of the impel-lers, when compared at the same power input per mass,
the Rushton should create the smallest droplets and the hydrofoil, the largest, with the pitched-blade turbines falling somewhere between these two. In fact, the hydrofoil creates smaller droplets than the Rushton and two pitched-blade turbines and the droplets created by the turbines are in-distinguishable experimentally. This result has also been observed by Pacek and others [9].
There is another geometrical property of impellers that determines how they create the “fluid dynamic ef-fect” that achieves this desired “process result.” This is the trailing vortices that form at the tip of the impel-ler blades.
Trailing vortexAs the impeller moves through the fluid, the pressure on the leading face of the blade is higher than on the back. The high- and low-pressure zones meet at the tip of the blade and the fluid moves from the high- to low-pressure region creating the trailing vortex. This phenomenon can often be observed on airplane wings [10, 11].
In a stirred tank, the velocity and size of the vortices can be measured using laser-Doppler or particle-image velocimetry, then the kinetic energy and energy dissipa-tion rate (the local power input per mass) can be cal-culated. The kinetic energy of the trailing vortex is often non-dimensionalized by dividing by the impeller tip speed squared. Grenville and others [12] have shown that for impellers with blades:kMAXVTIP2
= 0.104 Po1 2 (22)
Where VTIP = πN.D.The standard deviation for this correlation is ±10%.
The maximum energy dissipation rate within the vortex is given by the following equation [13]:
MAX = AkMAX3 2
l 0 (23)
l0 is a length scale related to the flow near the impeller and it is a fraction of the impeller diameter. Substituting Equation (22) into Equation (23) and setting l0 = D/x and A = 1:
MAX =1.04 x Po3 4 N 3 D2 (24)
The standard deviation for this correlation is ±15%.Where measurements have been made, typical val-
ues of x are given in Table 1. Generally, the scale of the trailing vortex for the Rushton and pitched-blade turbines is equal to one-half of the projected height of the blade at its tip. For hydrofoils the scale of the trailing vortex is equal to the projected height of the blade at its tip.
Equations (13) and (24) can be combined to show that the ratio of the maximum energy dissipation rate to the average power input per mass, K, is:
TABLE 2: MEAN VELOCITY PROFILE SHEAR RATES
Impeller /HYDFLat equal VTIP
/HYDFLat equal
Narrow-blade hydrofoil 0.25 0.14 0.80 0.16 0.17 1.00 1.00
Pitched-blade turbine 0.35 0.07 0.65 0.12 0.53 3.11 1.91
Rushton turbine 0.60 0.16 0.12 0.04 5.50 24.4 9.55
FIGURE 4. This graph shows a plot of the mean velocity profiles for pitched-blade turbine and hydrofoil impellers
r/R, %0% 20% 40% 60% 80% 100%
0%
5%
10%
15%
20%
25%
30%
35%
40%
v/V T
IP, %
— Hydrofoil— Pitched-blade turbine
CHEMICAL ENGINEERING WWW.CHEMENGONLINE.COM AUGUST 2017 49
K= MAX =1.04 x Po3 4 N 3 D2
Po N 3 D5T 3
4= 0.82 x
Po1 4TD
3
K= MAX =1.04 x Po3 4 N 3 D2
Po N 3 D5T 3
4= 0.82 x
Po1 4TD
3 (25)
The ratio is weakly dependent on the type of impeller (Po), dependent on the scale of the vortex (x) and strongly dependent on the size of the impeller (D/T). The reason for this is that a small-diameter impeller must operate at a higher tip speed than a larger one to input the same power and the maximum kinetic energy is proportional to the tip speed squared.
The droplet size data plotted versus the average power input per mass in Figure 6 are replotted in Figure 7 versus the maximum energy dissipation rate in the trailing vor-tex. The variations in the trailing vortex energy dissipation rate generated by the impellers and the effects on the droplet size are now correctly accounted for, including the high-shear disperser.
The conventional wisdom in the mixing industry has been that hydrofoil impellers generate “low shear” and Rushton turbines generate “high shear” [3, 4] and this is true if only the time-averaged velocity gradients are compared. The maximum kinetic energy dissipation rate within the trailing vortex, MAX, generates the stresses that break-up droplets, or any other second phase, in an agitated vessel. Rather than describing these impellers as “high shear,” it is more rigorous to call them “high dis-sipation” or “high stress.”
ApplicationsThere are many processes in which the fluid dynamic ef-fect that achieves the process result is commonly con-sidered to be “shear” although, strictly, the process result is determined by the maximum energy dissipation rate within the trailing vortex. One example of a “shear” driven process is flocculation of fine particles. Agitators are de-signed to provide a desired shear rate, or G-value. G is defined as:
G =Pμ V
1 2
=Po N 3 D5
μ V
1 2
(26)
This shear rate is based on the vessel-averaged power input per volume and the fluid’s dynamic vis-cosity. Equation (26) suggests that, provided that the average power per volume is kept constant, the same G-value will be generated and the flocculation perfor-mance will be the same. Benz [14] has written a review of the problems that will be encountered taking this approach to agitator design, especially the fact that it takes no account of impeller type or diameter. He con-cludes that “G-value has no legitimate use in designing or specifying agitators.”
Spicer and others [15] have measured the size and structure of flocculated polystyrene particles using a hy-
drofoil, pitched blade and Rushton turbines at G-values, as defined in Equation (26), of 15, 25 and 50 s–1. The corresponding values of vessel-averaged power input per mass are 2.25 10–4, 6.25 10–4 and 2.50 10–3 W/kg. Grenville and Spicer [16] have re-analyzed these data and the floc length versus the maximum kinetic energy dissipation rate, calculated using Equation (23), is plotted in Figure 8. This approach to the analysis correlates the data and suggests that the concept of a G-value should work for agitator design provided that it is based on the maximum energy-dissipation rate in the trailing vortex — not the vessel averaged power per volume.
The selectivity of competitive reactions carried out in semi-batch mode is determined by the local mixing rate [17], the micro-mixing rate, in the region where the added reactant is introduced to the vessel [18]. Bourne and Dell’ava [19] have shown that the selectivity of an azo-coupling reaction can be maximized by feeding the added reactant at the impeller where the trailing-vortex energy dissipation rate determines the rate of micro-mixing. They, and Nienow and others [20], have also shown that, provided the feed location is geometrically similar, the selectivity of the reaction can be maintained on scaleup if the trailing-vortex energy dissipation rate is the same at the two scales. This has also been shown to apply to precipitation reactions where the particle size and morphology need to be controlled [21, 22].
FIGURE 5. This graph shows a plot of the mean velocity profiles for the Rush-ton turbine
FIGURE 6. This graph shows the behavior of the Sauter mean diameter, d32, versus vessel-averaged power input per unit mass
wp/
R, %
25%
20%
15%
10%
5%
0%
-5%
-10%
-15%
-20%
-25%0% 10% 20% 30% 40% 50% 60% 70%
v/VTIP, %
0.01 0.10 1.00 10.00, W/kg
d 32,
µm
Narrow hydrofoil
Pitched-blade turbine, 45 deg
Pitched-blade turbine, 60 deg
Rushton
High-shear disperser sawtooth
1000
100
10

CHEMICAL ENGINEERING WWW.CHEMENGONLINE.COM AUGUST 201750
Finally, mixing in crystallization processes requires both rapid local mixing to minimize primary nucle-ation and high flow to promote homogeneity, favoring secondary nucleation and crystal growth. Also, a balance between crystal growth and crystal damage must be con-sidered in choosing the appropriate impeller [23].
ConclusionsMixing processes can be described in terms of the desired process re-sult. Generally this result will be controlled by the flow and turbu-lence intensity generated by an im-peller. The approach described here
can be used to determine which the best impeller to achieve this re-sult will be. It can also be used to translate laboratory and pilot-scale results taken with one type of impel-ler to a larger scale using a different geometry, provided that the process result and controlling dynamic effect can be identified.
The term high-shear is commonly used to describe an impeller’s ca-pability for dispersion of a second immiscible phase generating sur-face area for mass transfer. Simi-larly, low-shear is used to describe impellers that, in multi-phase pro-cesses, allow the second phase to grow, and flocculation is a good ex-
ample of this.In a turbulent agitated vessel, the
time-averaged velocity gradients are of little use, and potentially mislead-ing, for comparison of impeller perfor-mance and agitator design. While the term “shear” is used qualitatively to describe impellers’ dispersing capa-bilities, it must be recognized that the true mechanism of break-up is deter-mined by the maximum energy dissi-pation rate within the impellers’ trailing vortices. This understanding enables engineers to select the appropriate impellers for their processes. n
Edited by Gerald Ondrey
References1. Etchells III, A. W., Lecture notes, CHEG 615 Special
Topics in Mixing, University of Delaware.
2. Machado, M. B. and Kresta, S. M., “Advances in Indus-trial Mixing,” ch. 2b, pp. 47–84. John Wiley and Sons, New York, N.Y., 2016.
3. Oldshue, J. Y., “Fluid Mixing Technology,” McGraw Hill, New York, N.Y., 1983.
4. Ducoste, J. J., Clark, M.M. and Weetman, R. J., Turbu-lence in Flocculators: Effects of Tank Size and Impeller Type,” AIChE J., 43 (2), pp. 328–338, 1997.
5. Brown, D. A. R., Mixer Performance Characteristics: Impeller and Process Efficiency”, presented at Mixing XXII, Victoria, B.C., Canada, 2010.
6. Fort, I., B. Kysela, B. and Jirout, T., Flow Characteristics of Axial High Speed Impellers,” Chem. Proc. Eng., 31, pp. 661–679, 2010.
7. Pnueli, D. and Gutfinger, C., “Fluid Mechanics,” ch. 1, p. 11, Cambridge University Press, Cambridge, U.K., 1992.
8. Russell, T. W. F., Robinson, A.S. and Wagner, N.J., “Mass and Heat Transfer,” ch. 7, p. 302, Cambridge University Press, Cambridge, U.K., 2008.
9. Pacek A.W.,Chamsart, S., Nienow, A.W. and Bakker, A., The Influence of Impeller Type on Mean Drop Size and Drop Size Distribution in an Agitated Vessel”, Chem. Eng. Sci., 54, pp. 4211–4222, 1999.
10. www.youtube.com/watch?v=ViKYFsN3p24.
11. www.youtube.com/watch?v=zW4PmUE151c.
12. Grenville, R. K., and others, “Flow and Shear in Agitated Vessels,” presented at AIChE Annual Meeting, Philadel-phia, Pa., 2008.
13. Tennekes, H. and Lumley, J. L., “A First Course in Tur-bulence,” ch. 3, p. 68, MIT Press, 1972.
14. Benz, G. T., “The G-value for Agitator Design: Time to Retire it?”, Chem. Eng. Prog., pp. 43–47, March 2007.
15. Spicer, P. T., Keller, W. and Pratsinis, S. E., “The Effect of Impeller Type on Floc Size and Structure During Shear-induced Flocculation,” J. Colloid Interface Sci., 184, pp. 112–122, 1996.
16. Grenville, R. K. and Spicer, P.T., “Mixing and Flocculation of Fine Particles,” presented at Mixing XXV, Quebec City, Que., Canada, 2016.
17. Paul, E. L. and Treybal, R.E., “Mixing and Product Dis-tribution for a Liquid-phase, Second-order Competitive-consecutive Reaction”, AIChE J., 17, pp. 718–724, 1971.
18. Bałdyga, J. and Pohorecki, R., “Turbulent Micromixing in Chemical Reactors — A Review,” Chem. Eng. J., 59, pp. 183–195, 1995.
v
FIGURE 7. Shown here is a plot of the Sauter mean diameter, d32, versus the trailing vortex energy-dissipation rate
FIGURE 8. This plot shows the maximum average floc length versus maximum kinetic-energy-dissipation rate for hydrofoil, pitched blade and Rushton turbines
1 10 100 1000 10000MAX, W/kg
d 32,
µm
1000
100
10
Narrow hydrofoil
Pitched-blade turbine, 45 deg
Pitched-blade turbine, 60 deg
Rushton
High-shear disperser sawtooth
RushtonPitched-blade turbineHydrofoil
0.01 0.1 1 10MAX, W/kg
Max
imum
ave
rage
floc
cula
tion
leng
th, µ
m
1000
100
10

CHEMICAL ENGINEERING WWW.CHEMENGONLINE.COM AUGUST 2017 51
19. Bourne, J. R. and Dell’ava, P., “Micro- and Macro-mix-ing in Stirred Tank Reactors of Different Sizes”, Chem. Eng. Res. Des., 65, pp. 180–186, 1987.
20. Nienow, A. W., Drain, S.M., Boyes, A. P. and Carpenter, K. J., “An Experimental Study to Characterize Imperfect Macromixing in a Stirred Semibatch Reactor,” Ind. Eng. Chem. Res., 36, pp. 2,984–2,989, 1997.
21. Phillips. R., Rohani, S. and Bałdyga, J., “Micromixing in a Single-feed Semi-batch Precipitation Process”, AIChE J., 45, pp. 82–92, 1999.
22. Vicum, L. and Mazzotti, M., “Multi-scale Modeling of a Mixing-precipitation Process in a Semi-batch Stirred Tank,” Chem. Eng. Sci., 62, pp. 3,513–3,527, 2007.
23. Tung, H-H, Paul, E. L., Midler, M. and McCauley, J. A. “Crystallization of Organic Compounds: An Industrial Perspective,” ch. 6, John Wiley and Sons, New York, N.Y., 2009.
AuthorsRichard K. Grenville is director of Mixing Technology at Philadelphia Mixing Solutions Ltd. (1221 East Main Street, Palmyra PA 17078; Phone +1-717-202-7976, Email: [email protected]) and has worked in the field of mixing for over 30 years including 22 years as a consultant for DuPont Engineering. He is an adjunct pro-
fessor at Rowan University and the University of Dela-ware, where he co-teaches courses on mixing and reg-ularly presents seminars to customers and for AIChE Student and Local chapters. Grenville has a B.Sc. in chemical engineering from the University of Nottingham and a Ph.D. from Cranfield Institute of Technology. He is
a Chartered Engineer, Fellow of the IChemE, Member of the AIChE and is currently serving as president of the North American Mixing Forum (NAMF). He has co-au-thored several papers and conference presentations on various aspects of mixing including jet mixing, mixing of non-Newtonian fluids, solids suspension and education.
Jason Giacomelli is a research and development engineer at Philadelphia Mixing Solutions Ltd. (1221 East Main Street, Palmyra PA 17078; Phone +1-717-832-8884, [email protected]) where he is responsible for running pilot-scale experimental programs for both internal product development and process devel-
opment on behalf of customers. He also runs computa-tional fluid dynamic (CFD) models to support these pro-grams. He is a member of AIChE and works with the local chapter to help with community outreach pro-grams, such as the Science Technology Engineering and Math (STEM) Festival in Washington, D.C. Giacomelli has a B.S.Ch.E. from Rowan University and is currently studying for a Ph.D. on the subject of solids suspension in stirred vessels with professor Harry van den Akker at the University of Limerick in Ireland. He has co-authored a number of papers and conference presentations.
Gustavo Padron is a senior technical consultant on indus-trial fluid mixing at BHR Group (The Fluid Engineering Centre, Cranfield, Bedfordshire, U.K., Phone: +44-3301-191-902, Email: [email protected]). He currently manages the Fluid Mixing Processes (FMP)
industrial research consortium at BHR Group, which has been running continuously for more than 30 years, and has 20 years of experience in fluid mixing. He has co-authored several technical publications and has given presentations at international confer-ences on fluid mixing and nanoparticle dispersion. Padron holds a bachelor’s degree from the Universi-dad Metropolitana, Venezuela, a master’s degree and a Ph.D. from the University of Maryland, College Park, all in chemical engineering.
David A. R. Brown is technical director and senior technical con-sultant at BHR Group (The Fluid Engineering Centre, Cranfield, Bedfordshire, MK43 0AJ. Phone: +44-3301-191-775; Email: [email protected]). He has worked in mixing at BHR Group for over 18 years, contrib-uting to the Fluid Mixing Pro-
cesses industrial consortium in both technical and managerial capacities, as well as working on a broad range of consultancy projects relating to mixer trou-bleshooting, design and scaleup. Brown has co-au-thored chapters on Experimental Methods (with Pip N. Jones, and John C. Middleton) in the “Handbook of Industrial Mixing” (2004), and on Solid-liquid Mixing (with Art Etchells III) in “Advances in Industrial Mixing” (2016). Brown has a bachelor’s degree in chemical engineering from Heriot-Watt University.
For additional articles on mixing and other unit operations, go to the Chemical Engineering ar-
chives at www.chemengonline.com.
WHERE THE INDUSTRY TURNSFOR PRECISE CONTROL
The Model 1049 Secure-Gard is a pilot-operated vent valve intended for installation on atmospheric and low-pressure storage tanks, vapor recovery systems, and process systems.
The Model 1078 Vacu-Gard is a pilot-operated valve, specifically designed to reduce blanketing gas losses on low-pressure storage tanks.
The Model 521 is a sliding stem, globe style, bellows sealed, pneumatically actuated control valve designed for maximum corrosion resistance in pure chemical service.
The Model 987 is a pneumatic control valve designed to control moderate to severe corrosive applications but may be applied in general service applications also.
www.cashco comInnovative Solutions
Achieve precise control over every aspect of your chemical operation.
Cashco, Inc.P.O. Box 6, Ellsworth, KS 67439-0006 Ph. (785) 472-4461, Fax: (785) 472-3539 www.cashco com
Innovative Solutions
MODEL 1049MODEL 521
MODEL 987
MODEL 1078
MODEL 3100The Model 3100 is a pressure/vacuum vent designed to vent the tank vapor away to atmosphere and to relieve vacuum pressure within the tank. The 3100 is a weight loaded style.
CAS-236A.indd 1 1/24/17 1:18 PM
Circle 03 on p. 62 or go to adlinks.chemengonline.com/66431-03