mixing state of individual carbonaceous particles during a...
TRANSCRIPT
Me
Ha
Mb
a
ARRA
KHSMSCS
I
iLa12bwW(bc2
h1
Particuology 20 (2015) 16–23
Contents lists available at ScienceDirect
Particuology
j o ur na l ho me page: www.elsev ier .com/ locate /par t ic
ixing state of individual carbonaceous particles during a severe hazepisode in January 2013, Nanjing, China
onglei Wanga, Bin Zhua,∗, Zefeng Zhanga, Junlin Ana, Lijuan Shenb
Collaborative Innovation Center on Forecast and Evaluation of Meteorological Disasters, Key Laboratory for Aerosol-Cloud-Precipitation of Chinaeteorological Administration, Nanjing University of Information Science and Technology, Nanjing 210044, ChinaJiaxing Environmental Monitoring Station, Jiaxing 314000, China
r t i c l e i n f o
rticle history:eceived 28 April 2014eceived in revised form 9 June 2014ccepted 16 June 2014
eywords:azeingle particleixing state
PAMSarbonaceous particleecondary aerosols
a b s t r a c t
Chemical composition, hourly counts, and sizes of atmospheric carbonaceous particles were measuredto investigate their mixing state on clear and hazy days. 623,122 carbonaceous particles with sizes0.2–2.0 �m was analyzed using a single-particle aerosol mass spectrometer from 1st to 17th January2013. Particle types included biomass/biofuel burning particles (biomass), element carbon (EC-dominant)particles that were also mixed with biomass/biofuel burning species (EC-biomass) or secondary species(EC-secondary), organic carbon (OC), internally mixed OC and EC (OCEC), ammonium-containing (ammo-nium) and sodium-containing (sodium) particles. On clear days the top ranked carbonaceous particletypes were biomass (48.2%), EC-biomass (15.7%), OCEC (11.1%), and sodium (9.6%), while on hazy daysthey were biomass (37.3%), EC-biomass (17.6%), EC-secondary (16.6%), and sodium (12.7%). The fractionsof EC-secondary, ammonium (10%), and sodium particle types were elevated on hazy days. Numbers ofEC-secondary particles were more than four times those on clear days (4.1%). Thus, carbonaceous particles
mixed with ammonium, nitrate and sulfate during aging and transport, enhancing their light extinctioneffects and hygroscopic growth under high relative humidity on hazy days, further reducing visibility.Our real-time single-particle data showed that changes to mixing state had a significant impact on lightextinction during haze events in Nanjing.© 2014 Chinese Society of Particuology and Institute of Process Engineering, Chinese Academy ofSciences. Published by Elsevier B.V. All rights reserved.
ntroduction
Atmospheric aerosols play an important role in affecting visibil-ty, human health, and global climate change (Bäumer et al., 2008;angridge et al., 2012; Lohmann & Feichter, 2005). Carbonaceouserosols, as one of the major aerosol components, constitute about0–50% of the total aerosol mass concentration (Schauer et al.,003). They are normally divided into two fractions: organic car-on (OC) with a strong scattering ability, and element carbon (EC)ith a strong absorption ability (Ramanathan & Carmichael, 2008;atson, 2002). OC is mainly emitted as primary organic carbon
POC), but also comprises secondary organic carbon (SOC) formedy photochemical reactions. EC usually originates from incomplete
ombustion of fossil fuel or wood (Cao et al., 2005; Szidat et al.,009).∗ Corresponding author. Tel.: +86 2558699785.E-mail address: [email protected] (B. Zhu).
ttp://dx.doi.org/10.1016/j.partic.2014.06.013674-2001/© 2014 Chinese Society of Particuology and Institute of Process Engineering, C
In urban areas, reduced visibility mostly results from excessparticulate matter in the atmosphere from anthropogenic emis-sion sources and gas-to-particle conversions. It is used as a visualindicator for ambient air quality (Liu et al., 2013; Watson, 2002).The Yangtze River Delta (YRD) is one of the fastest-growing eco-nomic regions in the world; hence, air pollution and haze areimportant environmental and meteorological issues in this region(Wang, Jiang, et al., 2012). Gao et al. (2011) reported that the num-ber of hazy days has increased in last 30 years, while visibility hasdecreased at the rate of 2.41 km/decade. Observations also showedthat carbonaceous aerosols represent a major fraction of the submi-cron aerosol particles (Chan & Yao, 2008; Yang et al., 2012; Zhang,Wang, et al., 2012), and that the attenuation of light caused by car-bonaceous aerosols is extremely important in China (Cheng et al.,2011; Yang et al., 2005; Yu, Wu, Wu, & Yu, 2010). Research on themixing state of carbonaceous particles is a prerequisite to deter-
mine their contribution to this reduced visibility, as well as to gain abetter understanding of their role in regional climate change (Zhanget al., 2013). However, there are few studies on aerosol mixing state,owing to the limitations of observation methods.hinese Academy of Sciences. Published by Elsevier B.V. All rights reserved.

icuolo
hicttsCotbflooSdScCHa
iladfmHca
pcwssvdocp
E
S
(mCoali
srSTFCw
H. Wang et al. / Part
In the recent years, online single-particle mass spectrometersave become effective tools to analyze almost all species of chem-
cal components, and to provide size-resolved information on thehemical composition and mixing state of single particles in realime. Many researchers deployed single-particle aerosol mass spec-rometry to analyze changes in aerosol composition and mixingtate during haze or fog events (Bi et al., 2011; Dall’Osto, Harrison,oe, & Williams, 2009; Li et al., 2014; Yang et al., 2012). Researchesn chemical reaction mechanisms, source profiles of aerosols, andheir interactions with climate have used the aerosol mass spectra,oth in China and abroad. Using single particle aerosol time-of-ight mass spectrometry (ATOFMS), Gard et al. (1998) directlybserved multiphase chemical reactions in haze on the south coastf California, revealing the basic reasons for this haze. Whiteaker,uess, and Prather (2002) studied the effects of meteorological con-itions on aerosol composition and mixing state. Bi et al. (2011) andilva, Liu, Noble, and Prather (1999) obtained the size and chemi-al features of aerosols emitted from biomass burning in southernalifornia. Cahill, Suski, Seinfeld, Zaveri, and Prather (2012) andealy et al. (2012) discussed the source and mixing state of theseerosols.
The mixing state of carbonaceous aerosols is influenced by var-ous factors (e.g., local sources, atmospheric aging processes, andong-range transport). Qin, Pratt, Shields, Toner, and Prather (2012)nd Zhang et al. (2013) reported that carbonaceous particles wereominantly mixed with nitrate and sulfate. Fu et al. (2012) observedour types of carbonaceous aerosols in Shanghai, and showed that
ost of the particles were coated with secondary organic aerosols.owever, direct observations on the size-resolved mixing state ofarbonaceous aerosols in the YRD region or in other parts of Chinare limited.
Serious particle matter (PM) levels resulted in long-term hazeollution in January 2013 in the YRD. The greatest instantaneousoncentration of PM2.5 reached 437 �g/m3; while lowest visibilityas only 0.04 km in Nanjing. In this study, we deployed real-time
ingle-particle aerosol mass spectrometer (SPAMS) to measure andtudy the major types of carbonaceous particles, and to explore theariability of their number fraction as a function of vacuum aero-ynamic diameter (dva), aerosol mixing state, and particle acidityn hazy and clear days in the urban area of the YRD. We also dis-uss the effects of meteorological elements and PM2.5 on thesearameters.
xperimental methods
ampling
Our observation site is located on the meteorology building32.21◦ N, 118.72◦ E) at the campus of Nanjing University of Infor-
ation Science & Technology, 40 m above ground. The Nanjinghemical Industry Area is located approximately 3 km southeastf the observation site. In addition, there are iron and steel plants,s well as cogeneration power plants within 1 km of the site. Thus,ocal contributions to air particles are derived from traffic, urban,ndustry, and croplands sources.
Particle chemistry, PM2.5, and meteorological parameters (wind
peed/direction, temperature, pressure, relative humidity (RH),adiation, visibility and precipitation) were recorded online using aPAMS (Guangzhou Hexin Analytical Instrument Co., Ltd., China), ahermo Scientific FH 62 C14 Continuous Particle Monitor (Thermoisher Scientific Inc., USA), with a CSI-CR1000 Measurement andontrol System (Campbell Scientific, Inc., USA). Measurementsere carried out continuously from January 1st to 17th, 2013.gy 20 (2015) 16–23 17
SPAMS and data analysis
SPAMS provides size and spectral information for single parti-cles with a temporal resolution higher than 30 min. Details of thisinstrument were reported by Li et al. (2011) and Zhang, Bi, et al.(2012). Aerosol particles are introduced into the SPAMS using anaerodynamic lens; particle diameter is calculated using two parallellaser beams at wavelength of 532 nm, while particle chemical com-position is determined by desorption/ionization processes, usinga strong 266 nm ultraviolet laser beam. Both positive and nega-tive ion fragments are recorded with dva (Zhang et al., 2013). Inthis study, approximately 623,122 carbonaceous particles with dva
between 0.2 and 2.0 �m were analyzed. Particle size and mass cal-ibrations for this instrument were carried out every three monthsusing standard polystyrene latex particles (PSL) and metallic solu-tion. Li et al. (2011) and Zhang, Bi, et al. (2012) provide furtherinstrument details. Spectral peaks obtained for each single particlewere subsequently analyzed using YAADA 2.1 (www.yaada.org), aMATLAB-based software tool kit for processing single-particle massspectral data. The peaks identified in this paper correspond withthe most probable assignments for each specific mass-to-chargeratio (m/z). We classified particles using the standards of Bi et al.(2011), Moffet, Foy, Molina, Molina, and Prather (2008), and Yanget al. (2009). An adaptive resonance theory-based neural networkalgorithm (ART-2a) was applied to cluster individual particles intoseparate groups based on the presence and intensity of ion peaksin each single-particle mass spectra (Song, Hopke, Fergenson, &Prather, 1999). We used a vigilance factor of 0.80, learning rate of0.05, and 20 iterations. A total of 4,560,405 particles were observed,of which 1,104,261 had size and spectral information, constituting24.21% of the total number of particles.
Results and discussion
Meteorology, PM2.5, carbon particles, and visibility
Nanjing has a typical north subtropical monsoon climate, con-trolled by the Siberian High in winter, with winds prevailing fromthe northeast. 30-Min-averaged levels of visibility, RH, PM2.5, andthe total carbonaceous particle count for January 1–17 are pre-sented in Fig. 1. A strong cold air mass passed through Nanjing from1st to 3rd January 2013; wind speed was large, with a maximumof 6.3 m/s and a mean of 2.8 m/s, and RH was relatively low, witha mean value of 51.4%, which was conducive to the dispersion ofpollutants. Therefore, the average concentration of PM2.5 was only57.1 �g/m3, which is relative low for east China; visibility was high,with a maximum of 18.5 km and a mean value of 10.2 km. Typi-cally, mean visibility was below 10 km in January for the period1981–2012 in the YRD region (Zhou, Gong, & Shi, 2014). During4–16 January, flat westerlies dominated mid-eastern China, andpressure differences were equalized in the YRD; wind speed waslow, with a mean of 1.7 m/s, while RH was high, with an average of62.9%, which was unfavorable for the dispersion of pollutants. Thus,the PM2.5 level was high, with an average value of 174.2 �g/m3 anda maximum of 437 �g/m3. The visibility was low, with an averagevalue of 3.2 km and a minimum of 0.04 km. Hence, we selected 1–3January to represent clear days, and 4–16 January to represent hazydays in this study.
Visibility had negative correlations with both RH (R2 = 0.47) andPM2.5 (R2 = 0.51) levels, suggesting that high RH and PM2.5 reduce
visibility. Visibility also had negative correlations with both num-bers of carbonaceous particles (R2 = 0.76) and non-carbonaceousparticles (R2 = 0.64). Because the carbonaceous particles accountedfor 56.4% of the total particles (1,104,261), we focused on
18 H. Wang et al. / Particuology 20 (2015) 16–23
F s particle count, and visibility (a), 30-min-averaged visibility and relative humidity (RH)( periment period.
dd
S
fwca(w2w5−−Zm[rsi−d
cwba
Table 1Number count and fraction of carbonaceous particle types on clear and hazy daysin early January 2013.
Particle types Number count Number fraction (%)
Clear days Hazy days Clear days Hazy days
Biomass 24,694 213,311 48.2 37.3EC-biomass 8038 100,605 15.7 17.6OC 1866 4463 3.6 0.8OCEC 5671 29,488 11.1 5.2EC-secondary 2094 94,665 4.1 16.6Ammonium 3864 57,085 7.6 10.0
ig. 1. Correlations between PM2.5, carbonaceous particle count, non-carbonaceoub), and PM2.5 and total carbonaceous particle count (c) during the January 2013 ex
etermining the mixing state of submicron carbonaceous particlesuring haze pollution.
ingle-particle types and mixing states of carbonaceous particles
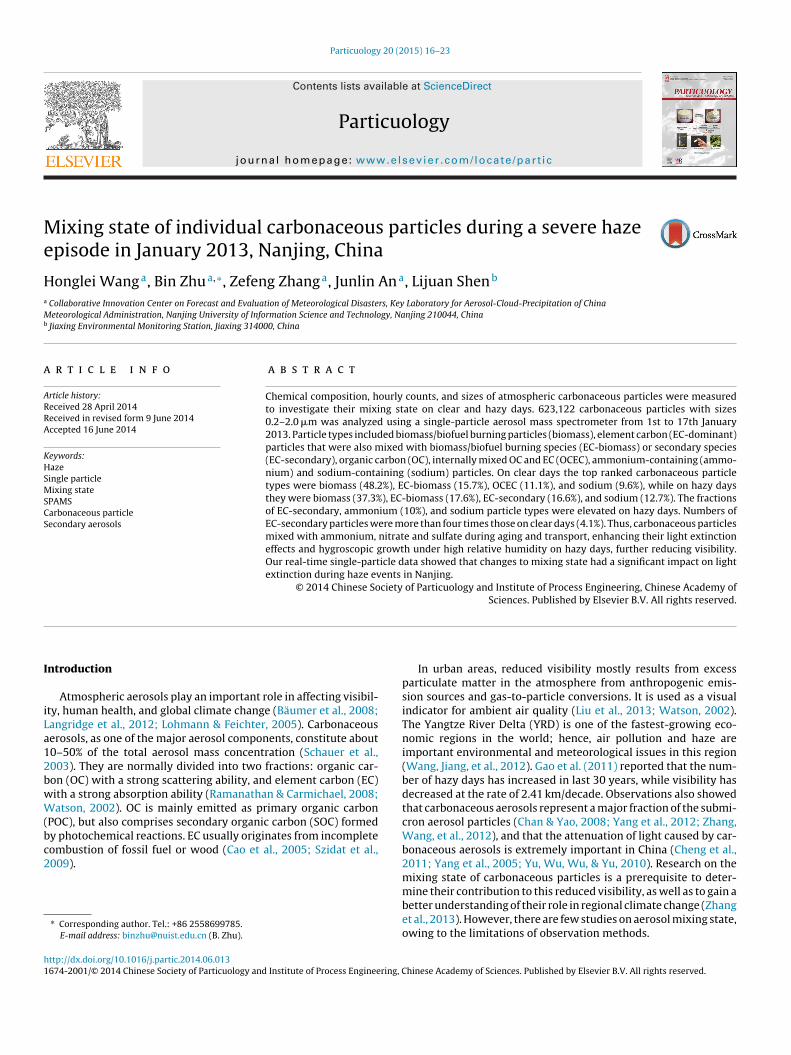
Digitized average ion mass spectra of carbonaceous particlesor the experiment period are shown in Fig. 2. Dominant peaksere ammonium (18[NH4]+), sodium (23[Na]+), dual polarity EC
luster ions (12[C]+/−, 24[C2]+/−, 36[C3]+/−, . . ., [Cn]+/−), as wells fragments from secondary inorganic species such as sulfate−97[HSO4]−), and nitrate (−46[NO2]− and −62[NO3]−). A peakith m/z 39 may be the organic element 39[C3H3]+ (Silva & Prather,
000). There are many typical signals for organic fragments,ith peaks with m/z: 27[C2H3]+, 29[C2H5]+, 37[C3H]+, 43[C2H3O]+,
0[C4H2]+, 51[C4H3]+, 55[C4H7]+, 61[C5H]+, 63[C5H3]+, −25[C2H]−,26[C2H2]−, −37[C3H]−, −49[C4H]−, −50[C4H2]−, −63[C5H3]−,73[C6H]−, −80[C6H8]−, and −81[C6H9]− (Silva & Prather, 2000;hang et al., 2013). Yang et al. (2009) illustrated that a peak with/z −26 could be the ion [CN]−. A peak with m/z 51 may be the ion
V]+ (Zhang et al., 2013). However, Dall’Osto and Harrison (2012)egarded the peak series with m/z 51, 63, 77, and 91, as an aromaticignature. In addition, signals of 56[Fe]+, 63[Cu]+, and 208[Pb]+
n the positive mass spectra, and −1[H]−, −16[O]−, −17[OH]−,35[Cl]−, and −42[CNO]− in the negative mass spectra were alsoetected.
The chemical patterns of the particles were used to classify parti-
les into distinct categories. Seven types of carbonaceous particlesere identified during the experimental period: biomass/biofuelurning particles (Biomass), EC-dominant particles that werelso mixed with biomass/biofuel burning species (EC-biomass) or
Sodium 4917 72,361 9.6 12.7
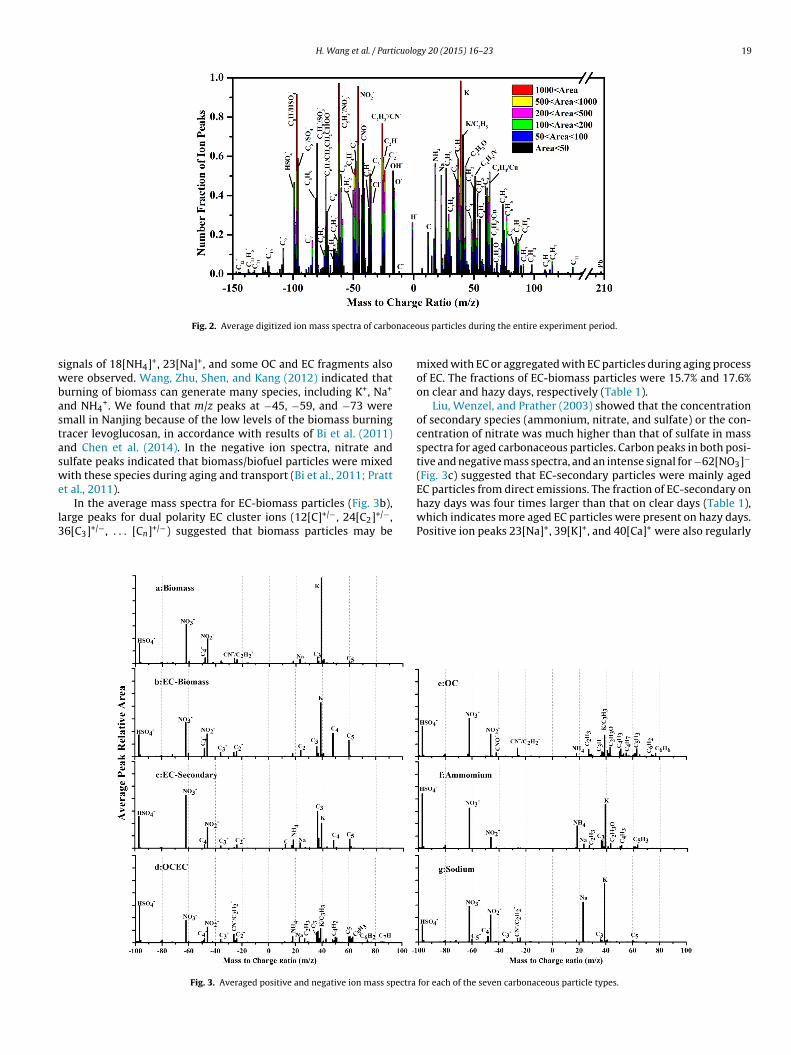
secondary species (EC-secondary), internally mixed OC and EC(OCEC), OC-dominant particles with negligible EC signals (OC),Ammonium and Sodium particles (Fig. 3). Carbonaceous particletypes described here resemble those observed by Moffet et al.(2008) and Zhang et al. (2013).
Table 1 lists the number fraction of each major carbonaceousparticle type collected on clear and hazy days. Biomass par-ticles accounted for 48.2% and 37.3% of the total particles onclear and hazy days, respectively. This reflects contributions fromlocal industry and power plants, which produce large amountsof these particles every day. The fractions of EC-biomass (17.6%)and EC-secondary (16.6%) increased on hazy days. The fraction forEC-secondary was four times larger than that on clear days. High
concentrations of EC-secondary particles may contribute to lowervisibility.SPAMS data indicated that the positive spectra of biomass par-ticles were usually dominated by a peak at 39[K]+ (Fig. 3a); weak
H. Wang et al. / Particuology 20 (2015) 16–23 19
naceo
swbastaswe
l3
Fig. 2. Average digitized ion mass spectra of carbo
ignals of 18[NH4]+, 23[Na]+, and some OC and EC fragments alsoere observed. Wang, Zhu, Shen, and Kang (2012) indicated that
urning of biomass can generate many species, including K+, Na+
nd NH4+. We found that m/z peaks at −45, −59, and −73 were
mall in Nanjing because of the low levels of the biomass burningracer levoglucosan, in accordance with results of Bi et al. (2011)nd Chen et al. (2014). In the negative ion spectra, nitrate andulfate peaks indicated that biomass/biofuel particles were mixedith these species during aging and transport (Bi et al., 2011; Pratt
t al., 2011).
In the average mass spectra for EC-biomass particles (Fig. 3b),arge peaks for dual polarity EC cluster ions (12[C]+/−, 24[C2]+/−,6[C3]+/−, . . . [Cn]+/−) suggested that biomass particles may be
Fig. 3. Averaged positive and negative ion mass spectra
us particles during the entire experiment period.
mixed with EC or aggregated with EC particles during aging processof EC. The fractions of EC-biomass particles were 15.7% and 17.6%on clear and hazy days, respectively (Table 1).
Liu, Wenzel, and Prather (2003) showed that the concentrationof secondary species (ammonium, nitrate, and sulfate) or the con-centration of nitrate was much higher than that of sulfate in massspectra for aged carbonaceous particles. Carbon peaks in both posi-tive and negative mass spectra, and an intense signal for −62[NO3]−
(Fig. 3c) suggested that EC-secondary particles were mainly agedEC particles from direct emissions. The fraction of EC-secondary on
hazy days was four times larger than that on clear days (Table 1),which indicates more aged EC particles were present on hazy days.Positive ion peaks 23[Na]+, 39[K]+, and 40[Ca]+ were also regularlyfor each of the seven carbonaceous particle types.

20 H. Wang et al. / Particuology 20 (2015) 16–23
carbo
ddlTbpa2spwWpsIt0
if(pau&
w(Tn(s
Fig. 4. Unscaled SPAMS size distributions for each of the seven
etected in EC-secondary particles. EC particles containing Ca wereetected in the exhaust of automobiles, derived from combusted
ubricating oil (Dall’Osto et al., 2009; Spencer, Shields, Sodeman,oner, & Prather, 2006), while K-rich particles were mainly fromiomass/biofuel origin (Zhang et al., 2013). Thus, EC-secondaryarticles represented mixed sources. The OCEC particles were char-cterized by strong EC cluster ions and intense OC signals (e.g., m/z7, 37, 50, 51, 63, 74) in the positive mass spectra, with nitrate andulfate signals in the negative mass spectra (Fig. 3d). Since medianeaks at m/z 51 and 63 can be attributed to aromatic compounds,hile m/z 51 can also be vanadium (Tolocka, Lake, Johnston, &exler, 2004), we suggest that these particles were from chemical
lants or vehicle exhausts. In contrast, OC particles had strong OCignals and negligible EC cluster ions in their mass spectra (Fig. 3e).n addition, sulfate signals were present in the negative mass spec-ra. The fraction of OCEC particles was small, with a value of only.8% on hazy days (Table 1).
Ammonium particles had an intense ammonium signal (m/z 18)n the positive mass spectra, and prominent nitrate (m/z 62) and sul-ate (m/z 97) signals in the negative mass spectra (Fig. 3f). Yang et al.2012) also observed a strong signal for 18[NH4]+ in carbonaceousarticles from haze events. This suggests that gas precursors (nitriccid and ammonia) may be transformed into secondary aerosolsnder high RH during hazy days, e.g., ammonium nitrate (Seinfeld
Pandis, 2012).Peaks for 23[Na]+, −46[NO2]−, −62[NO3]−, and −97[HSO4]−
ere normally detected in the mass spectra of sodium particlesFig. 3g). However, signals for −35[Cl]− and −37[Cl]− were weak.
his suggests that chlorides in sea salt particles were replaced byitrate via heterogeneous reaction during atmospheric transportGard et al., 1998). Yang et al. (2009), however, suggested thatodium may also be derived from sodium-rich dust and productsnaceous particle types on clear (dashed) and hazy days (solid).
from biomass burning, which could explain why such a strong sig-nal for 39[K]+ was observed (Fig. 3g).
Size distributions of single particles and variation of particleacidity on clear and hazy days
Size distribution of single particles in clear and hazy daysAlthough the unscaled SPAMS size distributions for all parti-
cle types were unimodal, they showed peak differences betweenclear and hazy days (Fig. 4). Biomass particles exhibited a relativelynarrow size distribution, peaking at about 0.67 �m on clear days;this peak occurred at about 0.73 �m on hazy days (Fig. 4a). Similarchanges in size distribution were seen for ammonium (Fig. 4f) andsodium (Fig. 4g) particles. In contrast, the EC-secondary particlesize peak was smaller on hazy days (Fig. 4c). The size distributionsof OC and OCEC particles were similar on clear and hazy days, bothwith size ranges of 0.3–0.6 �m (Fig. 4d and e).
There were large differences between clear and hazy days forsize-resolved number fractions of different single particle types(Fig. 5). On clear days, fresh biomass particles, with a size range0.4–1.2 �m, accounted for 97.33% of the particles in the total sizerange, consistent with results of Bi et al. (2011) and Wang, Jiang,et al. (2012). In contrast, biomass particles were more uniformlydistributed across the total size range on hazy days, suggestingthat fresh particles grew via mixing and aging processes under sta-ble hazy conditions. Both EC-secondary and ammonium particletypes showed clear differences between clear and hazy days, witha sharp fraction increase in the size range between 0.6 and 1.4 �m
on hazy days. This suggests that EC-secondary particles aggregatedwith soluble secondary species, enhancing the hygroscopic growthof these carbonaceous particles on hazy days, as described inDecesari et al. (2002), Dall’Osto et al. (2009) and Yang et al. (2012).
H. Wang et al. / Particuology 20 (2015) 16–23 21
naceo
Ioidb
bhn
Fig. 5. Size-resolved number fractions of carbo
n addition, the irregular geometry and complex microstructuref EC particles may promote aging. The fraction of EC-secondaryncreased, while the fraction of EC-biomass decreased on hazyays, suggesting that carbonaceous particles preferentially com-ined with secondary aerosols (Fig. 5a and b).
The fraction of sodium particles increased slightly on hazy days
ecause of the presence of 23[Na]+, which would also enhanceygroscopic growth. Zhu, Shang, and Zhao (2011) showed thatitrate and sulfate grow synergistically with gases on hazy days.Fig. 6. Relative acidity ratio for each of the seven carbonaceous
us particle types on clear (a) and hazy days (b).
Variation of particle acidityIn this study, we calculated the relative acidity ratio (Rra) on
clear and hazy days. Rra is defined as the absolute average-peak-areas of nitrate (m/z −62) and sulfate (m/z −97) divided by thatof ammonium (m/z 18), and is used to represent aerosol acid-ity (Denkenberger, Moffet, Holecek, Rebotier, & Prather, 2007).
Although Rra cannot provide quantitative information, it is indica-tive of particle acidity. Rra values for different carbonaceousparticles differed markedly between clear and hazy days. The Rraparticle types as a function of dva on clear and hazy days.

2 icuolo
vna6
ctpoTOlsi
oasDoeaofmwgd
C
iJeETgprarufhe
ncusnd0Owfo
A
r
2 H. Wang et al. / Part
alues of biomass, EC-biomass, EC-secondary, OCEC, OC, ammo-ium, and sodium on clear days were 19.5, 16.3, 5.1, 8.9, 22.9, 5.0,nd 14.0, respectively; while on hazy days, they were 16.4, 12.5,.1, 7.9, 26.4, 5.7, and 17.1, respectively.
In addition, we found that Rra values for carbonaceous parti-les varied as a function of size on clear and hazy days. Fig. 6 showshat Rra values for carbonaceous particles decreased with increasingarticle size, over the size range 0.3–0.6 �m, in accordance with thebservations of Denkenberger et al. (2007) and Zhang et al. (2013).he Rra values of biomass, EC-biomass, EC-secondary, sodium, andC particles with sizes smaller than 0.6 �m on hazy days were
arger than those on clear days. This suggests that the fraction ofecondary aerosols (e.g., nitrate and sulfate) was large on hazy daysn the fine mode fraction.
In other studies of haze particles, Whiteaker et al. (2002)bserved that carbonaceous species were the dominant aerosols,long with their accompanying secondary species ammonium,ulfate and nitrate during two haze events in Bakersfield, CA.all’Osto et al. (2009) recorded elevated droplets of nitrate and sec-ndary organic aerosol (SOA) particles (0.8 �m) in London haze/fogpisodes. Yang et al. (2012) found that higher water content inerosols enhanced the formation of both inorganic and organic sec-ndary species in Shanghai. Zhu et al. (2011) recognized that hazeormation was linked to the synergistic effect and interconnection
echanism among SO2, NO2, sulfate, and nitrate under high RH,hich means that plenty of sulfate and nitrate were produced by
as-particle conversion processes on hazy days. High RH on hazyays (up to 90%) also resulted in large Rra in our study.
onclusions
In our study, we provide size-resolved mixing state character-stics of carbonaceous particles in Nanjing during haze events inanuary 2013 using SPAMS. The carbonaceous particles were cat-gorized into seven single-particle types in this study (biomass,C-biomass, EC-secondary, OCEC, OC, ammonium, and sodium).he fraction of EC-secondary reached 16.6% on hazy days, four timesreater than on clear days; while EC particles mixed with biomassarticles had fractions of 15.7% and 17.6% on clear and hazy days,espectively. The fractions of ammonium and sodium particle typeslso were elevated on hazy days, comprising up to 10.0% and 12.7%,espectively. Thus, during haze events, carbonaceous particles weresually mixed with secondary species (ammonium, nitrate and sul-ate) as a result of aging and transport processes. This promotedygroscopic growth under high RH, enhancing the light extinctionffect associated with these aerosols, and causing reduced visibility.
The size distributions of biomass, EC-secondary and ammo-ium particle types on hazy days were distinct from those onlear days. Typically, carbonaceous particles were distributed moreniformly across the size range 0.2–2.0 �m, and contained manyecondary species on hazy days. On clear days, the fraction of inter-ally mixed particles was small. The Rra of carbonaceous particlesecreased with increasing particle size, with peaks in the range.3–0.6 �m. The Rra values of biomass, EC-biomass, EC-secondary,C, and sodium particles smaller than 0.6 �m in size on hazy daysere larger than those on clear days, confirming that the fine mode
raction of secondary aerosols (e.g., nitrate and sulfate) was large
n hazy days.cknowledgements
This work was supported by grants from the National Natu-al Science Foundation of China (41275143 and 41305135), the
gy 20 (2015) 16–23
Special Fund for Public Welfare Industrial (Meteorology) Researchof China (GYHY201206011), the Natural Science Foundation of theHigher Education Institutions of Jiangsu Province (12KJA170003),the Chinese Academy of Sciences Strategic Priority Research Pro-gram (XDB05020206), the project of Jiangsu provincial “333” andSix Talent Peaks, and the project Funded by the Priority AcademicProgram Development (PAPD) of Jiangsu Higher Education Institu-tions.
References
Bäumer, D., Vogel, B., Versick, S., Rinke, R., Möhler, O., & Schnaiter, M. (2008). Rela-tionship of visibility, aerosol optical thickness and aerosol size distribution inan ageing air mass over South-West Germany. Atmospheric Environment, 42(5),989–998.
Bi, X., Zhang, G., Li, L., Wang, X., Li, M., Sheng, G., et al. (2011). Mixing state of biomassburning particles by single particle aerosol mass spectrometer in the urban areaof PRD, China. Atmospheric Environment, 45(20), 3447–3453.
Cahill, J. F., Suski, K., Seinfeld, J. H., Zaveri, R. A., & Prather, K. A. (2012). The mix-ing state of carbonaceous aerosol particles in northern and southern Californiameasured during CARES and CalNex 2010. Atmospheric Chemistry and Physics,12(22), 10989–11002.
Cao, J. J., Wu, F., Chow, J. C., Lee, S. C., Li, Y., Chen, S. W., et al. (2005). Characterizationand source apportionment of atmospheric organic and elemental carbon duringfall and winter of 2003 in Xi’an, China. Atmospheric Chemistry and Physics, 5(11),3127–3137.
Chan, C. K., & Yao, X. H. (2008). Air pollution in mega cities in China. AtmosphericEnvironment, 42(1), 1–42.
Chen, K., Yin, Y., Kong, S., Xiao, H., Wu, Y., Chen, J., et al. (2014). Size-resolved chem-ical composition of atmospheric particles during a straw burning period at Mt.Huang (the Yellow Mountain) of China. Atmospheric Environment, 84, 380–389.
Cheng, Y., He, K. B., Zheng, M., Duan, F. K., Du, Z. Y., Ma, Y. L., et al. (2011). Massabsorption efficiency of elemental carbon and water-soluble organic carbon inBeijing, China. Atmospheric Chemistry and Physics, 11(22), 11497–11510.
Dall’Osto, M., & Harrison, R. M. (2012). Urban organic aerosols measured by singleparticle mass spectrometry in the megacity of London. Atmospheric Chemistryand Physics, 12(9), 4127–4142.
Dall’Osto, M., Harrison, R. M., Coe, H., & Williams, P. (2009). Real-time secondaryaerosol formation during a fog event in London. Atmospheric Chemistry andPhysics, 9(7), 2459–2469.
Decesari, S., Facchini, M. C., Matta, E., Mircea, M., Fuzzi, S., Chughtai, A. R., et al. (2002).Water soluble organic compounds formed by oxidation of soot. AtmosphericEnvironment, 36(11), 1827–1832.
Denkenberger, K. A., Moffet, R. C., Holecek, J. C., Rebotier, T. P., & Prather, K. A. (2007).Real-time, single-particle measurements of oligomers in aged ambient aerosolparticles. Environmental Science & Technology, 41(15), 5439–5446.
Fu, H., Zhang, M., Li, W., Chen, J., Wang, L., Quan, X., et al. (2012). Morphology, com-position and mixing state of individual carbonaceous aerosol in urban Shanghai.Atmospheric Chemistry and Physics, 12(2), 693–707.
Gao, L., Jia, G., Zhang, R., Che, H., Fu, C., Wang, T., et al. (2011). Visual range trends inthe Yangtze River Delta region of China, 1981–2005. Journal of the Air & WasteManagement Association, 61(8), 843–849.
Gard, E. E., Kleeman, M. J., Gross, D. S., Hughes, L. S., Allen, J. O., Morrical, B. D.,et al. (1998). Direct observation of heterogeneous chemistry in the atmosphere.Science, 279(5354), 1184–1187.
Healy, R. M., Sciare, J., Poulain, L., Kamili, K., Merkel, M., Müller, T., et al.(2012). Sources and mixing state of size-resolved elemental carbon parti-cles in a European megacity: Paris. Atmospheric Chemistry and Physics, 12(4),1681–1700.
Langridge, J. M., Lack, D., Brock, C. A., Bahreini, R., Middlebrook, A. M., Neu-man, J. A., et al. (2012). Evolution of aerosol properties impacting visibilityand direct climate forcing in an ammonia-rich urban environment. Jour-nal of Geophysical Research: Atmospheres, 117(D21) http://dx.doi.org/10.1029/2011JD017116
Li, L., Huang, Z., Dong, J., Li, M., Gao, W., Nian, H., et al. (2011). Real time bipolar time-of-flight mass spectrometer for analyzing single aerosol particles. InternationalJournal of Mass Spectrometry, 303(2), 118–124.
Li, L., Li, M., Huang, Z., Gao, W., Nian, H., Fu, Z., et al. (2014). Ambient particle char-acterization by single particle aerosol mass spectrometry in an urban area ofBeijing. Atmospheric Environment, 94, 323–331.
Liu, D. Y., Wenzel, R. J., & Prather, K. A. (2003). Aerosol time-of-flight massspectrometry during the Atlanta Supersite Experiment: 1. Measurements. Jour-nal of Geophysical Research: Atmospheres, 108(D7) http://dx.doi.org/10.1029/2001JD001562
Liu, X. G., Li, J., Qu, Y., Han, T., Hou, L., Gu, J., et al. (2013). Formation and evolu-tion mechanism of regional haze: A case study in the megacity Beijing, China.Atmospheric Chemistry & Physics, 13(9), 4501–4514.
Lohmann, U., & Feichter, J. (2005). Global indirect aerosol effects: A review. Atmo-spheric Chemistry and Physics, 5(3), 715–737.
Moffet, R. C., Foy, B. D., Molina, L. A., Molina, M. J., & Prather, K. A. (2008). Mea-surement of ambient aerosols in northern Mexico City by single particle massspectrometry. Atmospheric Chemistry and Physics, 8(16), 4499–4516.

icuolo
P
Q
R
S
S
S
S
S
S
S
T
W
H. Wang et al. / Part
ratt, K. A., Murphy, S. M., Subramanian, R., DeMott, P. J., Kok, G. L., Campos, T.,et al. (2011). Flight-based chemical characterization of biomass burning aerosolswithin two prescribed burn smoke plumes. Atmospheric Chemistry and Physics,11(24), 12549–12565.
in, X., Pratt, K. A., Shields, L. G., Toner, S. M., & Prather, K. A. (2012). Seasonal com-parisons of single-particle chemical mixing state in Riverside, CA. AtmosphericEnvironment, 59, 587–596.
amanathan, V., & Carmichael, G. (2008). Global and regional climate changes dueto black carbon. Nature Geoscience, 1(4), 221–227.
chauer, J. J., Mader, B. T., Deminter, J. T., Heidemann, G., Bae, M. S., Seinfeld, J. H.,et al. (2003). ACE-Asia intercomparison of a thermal–optical method for thedetermination of particle-phase organic and elemental carbon. EnvironmentalScience & Technology, 37(5), 993–1001.
einfeld, J. H., & Pandis, S. N. (2012). Atmospheric chemistry and physics: From airpollution to climate change. New York: John Wiley & Sons.
ilva, P. J., & Prather, K. A. (2000). Interpretation of mass spectra from organiccompounds in aerosol time-of-flight mass spectrometry. Analytical Chemistry,72(15), 3553–3562.
ilva, P. J., Liu, D. Y., Noble, C. A., & Prather, K. A. (1999). Size and chemical character-ization of individual particles resulting from biomass burning of local SouthernCalifornia species. Environmental Science & Technology, 33(18), 3068–3076.
ong, X. H., Hopke, P. K., Fergenson, D. P., & Prather, K. A. (1999). Classification ofsingle particles analyzed by ATOFMS using an artificial neural network, ART-2A.Analytical Chemistry, 71(4), 860–865.
pencer, M. T., Shields, L. G., Sodeman, D. A., Toner, S. M., & Prather, K. A. (2006).Comparison of oil and fuel particle chemical signatures with particle emis-sions from heavy and light duty vehicles. Atmospheric Environment, 40(27),5224–5235.
zidat, S., Ruff, M., Perron, N., Wacker, L., Synal, H. A., Hallquist, M., et al.(2009). Fossil and non-fossil sources of organic carbon (OC) and elementalcarbon (EC) in Göteborg, Sweden. Atmospheric Chemistry and Physics, 9(5),1521–1535.
olocka, M. P., Lake, D. A., Johnston, M. V., & Wexler, A. S. (2004). Number concentra-
tions of fine and ultrafine particles containing metals. Atmospheric Environment,38(20), 3263–3273.ang, H., Zhu, B., Shen, L., & Kang, H. (2012). Size distributions of aerosol andwater-soluble ions in Nanjing during a crop residual burning event. Journal ofEnvironmental Sciences, 24(8), 1457–1465.
gy 20 (2015) 16–23 23
Wang, T., Jiang, F., Deng, J., Shen, Y., Fu, Q., Wang, Q., et al. (2012). Urban air qualityand regional haze weather forecast for Yangtze River Delta region. AtmosphericEnvironment, 58, 70–83.
Watson, J. G. (2002). Visibility: Science and regulation. Journal of the Air & WasteManagement Association, 52(6), 628–713.
Whiteaker, J. R., Suess, D. T., & Prather, K. A. (2002). Effects of meteorological condi-tions on aerosol composition and mixing state in Bakersfield, CA. EnvironmentalScience & Technology, 36(11), 2345–2353.
Yang, H., Yu, J. Z., Ho, S. S. H., Xu, J., Wu, W. S., Wan, C. H., et al. (2005). The chemicalcomposition of inorganic and carbonaceous materials in PM2.5 in Nanjing, China.Atmospheric Environment, 39(20), 3735–3749.
Yang, F., Chen, H., Wang, X., Yang, X., Du, J., & Chen, J. (2009). Single particle massspectrometry of oxalic acid in ambient aerosols in Shanghai: Mixing state andformation mechanism. Atmospheric Environment, 43(25), 3876–3882.
Yang, F., Chen, H., Du, J., Yang, X., Gao, S., Chen, J., et al. (2012). Evolution of the mixingstate of fine aerosols during haze events in Shanghai. Atmospheric Research, 104,193–201.
Yu, H., Wu, C., Wu, D., & Yu, J. Z. (2010). Size distributions of elemental carbon andits contribution to light extinction in urban and rural locations in the Pearl Riverdelta region, China. Atmospheric Chemistry and Physics, 10(11), 5107–5119.
Zhang, G., Bi, X., Chan, L. Y., Li, L., Wang, X., Feng, J., et al. (2012). Enhancedtrimethylamine-containing particles during fog events detected by single par-ticle aerosol mass spectrometry in urban Guangzhou, China. AtmosphericEnvironment, 55, 121–126.
Zhang, X. Y., Wang, Y. Q., Niu, T., Zhang, X. C., Gong, S. L., Zhang, Y. M., et al. (2012).Atmospheric aerosol compositions in China: Spatial/temporal variability, chem-ical signature, regional haze distribution and comparisons with global aerosols.Atmospheric Chemistry and Physics, 12(2), 779–799.
Zhang, G., Bi, X., Li, L., Chan, L. Y., Li, M., Wang, X., et al. (2013). Mixing state ofindividual submicron carbon-containing particles during spring and fall seasonsin urban Guangzhou, China: A case study. Atmospheric Chemistry and Physics,13(9), 4723–4735.
Zhou, Y., Gong, S., & Shi, J. (2014). Analysis on the spatial and temporal variations
of visibility in the Yangtze River Delta from 1981 to 2012. Sciencepaper Online.http://www.paper.edu.cn/releasepaper/content/201403-86 (in Chinese)Zhu, T., Shang, J., & Zhao, D. (2011). The roles of heterogeneous chemical processes inthe formation of an air pollution complex and gray haze. Science China Chemistry,54(1), 145–153.