mjeoece&ceefhe ®eejes#³e ve · pdf filenet sales 7040.1 5776.9 6120.9 5320.6...
TRANSCRIPT
mJeOece&ceefHe ®eeJes#³e ve efJekeÀefcHelegcen&efme~Looking at your own duty you ought not to waver.

CUSTOMER SUPPORT OFFICES MANUFACTURING LOCATIONS
#91, West Park Road, 17th Cross, MalleswaramBangalore - 560055, Karnataka.Tel: +91 80 23568979 / 23342873 Fax: +91 80 23342872
LBS Marg, Majiwade, Thane (West) - 400601, Maharashtra. Tel: +91 22 2173 5551 / 2173 5591Fax: +91 22 2173 5599 / 2173 5650
THANEBANGALORE
Premise No. 16, 8th Main Road, Vijaynagar, VelachariChennai - 600042, Tamil NaduTelefax: +91 44 22592461
Survey No. 33/1, At Post Umerkoi, Via SilvassaU.T. of Dadra & Nagar Haveli - 396230.Tel: +91 9725025351 Fax: +91 260 2681003
CHENNAI SILVASSA
139 & 148, Sri Venkateshwara Co-op. Indl. EstateBollarum - 502325, Andhra Pradesh.Tel: +91 8458 279628 / 279616 Fax: +91 8458 279464
139 & 148, Sri Venkateshwara Co-op. Indl. EstateBollarum - 502325, Andhra Pradesh.Tel: +91 8458 279628 / 279616 Fax: +91 8458 279464
HYDERABAD HYDERABAD
5th Floor, Laha Paint House, 7 Chittaranjan AvenueKolkata - 700072, West Bengal.Tel: +91 33 22372812 / 22348241 Fax; +91 33 22255654
Plot No. 70-33, Sector 4, IIE Pantanagar, RudrapurUdhamsingh Nagar - 263153, Uttarakhand.Tel: +91 5944 250183 /84 / 85 Fax: +91 5944 250186
KOLKATA RUDRAPUR
508/510, Ansal Chamber II, 6 Bhikaji Cama PalaceNew Delhi - 110066.Tel: +91 11 26194795 / 26195641 Fax: +91 11 26194389
LBS Marg, Majiwade, Thane (West) - 400601, Maharashtra. Tel: +91 22 21735551 / 21735591Fax: +91 22 21735599 / 21735650
NEW DELHI R&D - THANE

61st Annual Report & Accounts 2010
1
. .

61st Annual Report & Accounts 2010
2

61st Annual Report & Accounts 2010
3

61st Annual Report & Accounts 2010
4
4,647 5,321 6,121 5,777 7,040
16.7 14.5
15.0
-5.6
21.9
-10.0
-5.0
0.0
5.0
10.0
15.0
20.0
25.0
0
1,000
2,000
3,000
4,000
5,000
6,000
7,000
8,000
2006 2007 2008 2009 2010
%
TURNOVER (Rs.Mns)
Turnover Turnover Growth % YOY CAGR 12.07%
431 387 308 495 469
9.3
7.3
5.0
8.6
6.7
0.0
1.0
2.0
3.0
4.0
5.0
6.0
7.0
8.0
9.0
10.0
0
100
200
300
400
500
600
2006 2007 2008 2009 2010
EARNING BEFORE INT & TAX (EBIT) (Rs. Mns)
E B I T EBIT % to sales
797
1091
1369 1334
1196
8
37
26
-2
-10
-20
-10
0
10
20
30
40
0
200
400
600
800
1000
1200
1400
1600
2006 2007 2008 2009 2010
EXPORT TURNOVER (RS.MNS)
Export Turnover Turnover Growth % YOY Last 5 Years CAGR : 10.22%
%
TURNOVER (Rs. Mns)
428 370 298 496 463
9.2
6.9
4.9
8.6
6.6
0.0
1.0
2.0
3.0
4.0
5.0
6.0
7.0
8.0
9.0
10.0
0
100
200
300
400
500
600
2006 2007 2008 2009 2010
%
PROFIT BEFORE TAX,EXCEPTIONAL & EXTRAORDINARY ITEMS(Rs.Mns)
PBT PBT % to Sales
PROFIT BEFORE TAX, EXCEPTIONAL & EXTRAORDINARY ITEMS (Rs. Mns)
EXPORT TURNOVER (Rs. Mns)
399 284 213 374 481
8.6
5.3
3.5
6.56.8
0.0
1.0
2.0
3.0
4.0
5.0
6.0
7.0
8.0
9.0
10.0
0
100
200
300
400
500
600
2006 2007 2008 2009 2010
%
PROFIT AFTER TAX,EXCEPTIONAL & EXTRAORDINARY ITEMS (Rs.Mns)
Profit After Tax Profit After Tax % to sales
PROFIT AFTER TAX, EXCEPTIONAL & EXTRAORDINARY ITEMS (Rs. Mns)
EARNING BEFORE INT & TAX (EBIT) (Rs. Mns)
630
572
499
685
805
13.6
10.8
8.2
11.9 11.4
0.0
2.0
4.0
6.0
8.0
10.0
12.0
14.0
16.0
0
100
200
300
400
500
600
700
800
900
2006 2007 2008 2009 2010
%
CASH PROFIT (Rs. Mns)
Cash Profit Cash Profit as % to Sales
CASH PROFIT (Rs. Mns)

61st Annual Report & Accounts 2010
5
0
500
1000
1500
2000
2500
3000
2006 2007 2008 2009 2010
125 125 125 125 125
2084 2228 2309 2463
2784
NET WORTH GROWTH (Rs. Mns)
Share Capital Reserves(Excluding Revaluation Reserve)
NET WORTH GROWTH (Rs. Mns)
132 132 132
220
161
0
50
100
150
200
250
2006 2007 2008 2009 2010
DIVIDEND PAYOUT (Rs.Mns)
Dividend Payout %
33.1 46.5 62 58.9 33.4
Dividend %
70 90 90 *150 110
* Includes 50% Platinum Jubilee Dividend.
DIVIDEND PAYOUT (Rs. Mns)
337.8671.5
498.1239.3 225.3
2209.1
2353.3
2434.1
2587.4
2909.00.15
0.29
0.20
0.090.08
0.00
0.05
0.10
0.15
0.20
0.25
0.30
0.0
500.0
1000.0
1500.0
2000.0
2500.0
3000.0
3500.0
2006 2007 2008 2009 2010
Rs. Mns
DEBT EQUITY RATIO (Times)
Debt Shareholders funds Debt Equity Ratio
DEBT EQUITY RATIO (Times)
1659.0 2047.0
2019.2 2094.0
2510.0
971.0
1190.8 1265.71515.3
1476.3
0.0
500.0
1000.0
1500.0
2000.0
2500.0
3000.0
3500.0
4000.0
4500.0
2006 2007 2008 2009 2010
Rs.MnsCURRENT RATIO (Times)
Current Liabilities Current Assets
1.71
1.72 1.60
1.38
1.70
Current Ratio
CURRENT RATIO (Times)
2006 2007 2008 2009 2010
Book Value (Excluding Revaluation Reserve) 35.24 37.54 38.83 41.28 46.41EPS 6.37 4.53 3.40 5.96 7.68
35.2437.54
38.8341.28
46.41
6.374.53
3.405.96
7.68
0.00
5.00
10.00
15.00
20.00
25.00
30.00
35.00
40.00
45.00
50.00(Rs.)EPS AND BOOK VALUE PER SHARE
EPS AND BOOK VALUE PER SHARE
0
500
1000
1500
2000
2500
3000
2006 2007 2008 2009 2010
125 125 125 125 125
2084 2228 2309 2463
2784
NET WORTH GROWTH (Rs. Mns)
Share Capital Reserves(Excluding Revaluation Reserve)

61st Annual Report & Accounts 2010
6
2010 2009 2008 2007 2006 2005 2004 2003 2002 2001OPERATING RESULTSNet Sales 7040.1 5776.9 6120.9 5320.6 4646.7 3982.9 3617.8 3525.3 2988.9 2511.6
Other Income 83.2 91.1 117.3 107.4 114.8 96.6 56.6 44.5 34.9 35.4
EBDIT 792.7 818.6 609.0 676.8 665.0 643.7 568.9 615.4 608.6 456.9
Depreciation & Amortisation 324.0 311.5 286.2 288.6 230.7 249.8 224.7 223.5 211.1 201.1
EBIT 468.7 507.1 322.8 388.2 434.3 393.9 344.2 391.9 397.5 255.8
Profit before Tax, Exceptional & Extraordinary Items 462.7 495.8 297.7 369.7 428.1 386.8 336.5 379.1 357.7 194.7
Exceptional & Extraordinary Items- Net of Tax 153.3 – – (31.8) 120.8 (8.0) – – – (3.6)
Provision for Tax 134.8 122.0 84.8 54.1 149.7 102.1 95.4 100.0 106.2 39.4
Net Profit after Tax 481.2 373.8 212.9 283.7 399.2 276.7 241.1 279.1 251.5 151.7
EBDIT to Sales % 11.26% 14.17% 9.95% 12.72% 14.31% 16.16% 15.72% 17.46% 20.36% 18.19%
EBIT to Sales % 6.66% 8.78% 5.27% 7.30% 9.35% 9.89% 9.51% 11.12% 13.30% 10.18%
PBT to Sales % 8.75% 8.58% 4.86% 6.35% 11.81% 9.51% 9.30% 10.75% 11.97% 7.61%
Earning Per Share 7.68 5.96 3.40 4.53 6.37 4.41 3.85 4.45 4.01 2.29
Cash Earning Per Share 12.84 10.93 7.96 9.13 10.05 8.39 7.37 7.89 7.17 5.34
Equity Dividend % 110 **150 90 90 90 70 60 *150 50 35
FINANCIAL POSITION
Equity Share Capital 125.4 125.4 125.4 125.4 125.4 125.4 125.4 125.4 125.4 125.4
Reserves & Surplus 2811.2 2490.1 2336.3 2257.3 2113.1 1842.4 1669.8 1514.2 1499.7 1242.8
Shareholders Funds 2936.6 2615.5 2461.7 2382.7 2238.5 1967.8 1795.2 1639.6 1625.1 1368.2
Loan Funds 225.3 239.3 498.1 671.5 337.8 162.9 130.2 102.6 91.8 284.2
Deferred Tax Liability (Net) 52.6 67.7 69.0 85.2 83.9 60.2 89.9 96.2 75.0 133.5
Net Fixed Assets (Incl.Capital Work in Progress) 1786.9 2033.5 2105.5 2145.1 1967.0 1351.5 1365.0 1142.1 1277.9 1239.4
Investments 394.5 310.3 169.8 138.1 5.2 82.5 98.0 311.0 3.6 2.0
Net Working Capital 1033.2 578.7 753.5 856.2 688.0 757.0 551.8 381.2 482.8 503.8
Miscellaneous Expenditure – – – – – – 0.5 4.2 27.6 40.5
Capital Employed 3214.6 2922.5 3028.8 3139.4 2660.2 2191.0 2015.3 1838.5 1791.9 1785.7
** Includes One Time Dividend @ 50%* Includes One Time Dividend @ 100%
FINANCIAL HIGHLIGHTS
(Rs. in Million)

61st Annual Report & Accounts 2010
7
DIRECTORS’ REPORT
Your Directors have pleasure in presenting the 61st Annual Report along with the Audited Statement of Accounts for the year ended 31st December 2010.
PERFORMANCE DURING THE YEAR
Your company’s performance during the year is summarized below:
(Rupees in Million)
2010 2009
Net Sales 7040.1 5776.9
Profit before Tax & Extraordinary Items 585.5 495.7
Less: Provision for Current Tax 152.8 122.0
Provision for Deferred Tax (18.0) (1.2)
Provision for Fringe Benefits Tax – 1.2
Extraordinary Items (Net of Tax) 30.5 –
Profit after Tax 481.2 373.7
Add: balance of profit for earlier years 966.2 849.9
Excess provision for dividend tax for earlier year 0.8 –
Profit available for appropriation 1448.2 1223.6
Transfer to General Reserve 48.1 37.4
Proposed Dividend on Equity Shares & Dividend Tax thereon 160.8 146.7
One time Platinum Jubilee Dividend on Equity Shares & Dividend tax thereon – 73.3
Balance Carried forward 1239.3 966.2
During the year under review, the net sales were Rs. 7040.1 mn as compared to Rs. 5776.9 mn in the previous year. Profit Before Tax & Extraordinary Items was Rs. 585.5 mn as compared to Rs. 495.7 mn in the previous year.
After providing for Income Tax of Rs. 134.8 mn, Net Profit after Tax & Extraordinary Items was Rs. 481.2 mn. Further after transferring an amount of Rs. 48.1 mn to General Reserve, the amount available for appropriation was Rs. 1400.1 mn including amount brought forward of Rs. 966.2 mn of previous year. The Earning per Equity Share (EPS) including extraordinary items was Rs. 7.68 and the Earning per Equity Share (EPS) excluding extraordinary items was Rs. 7.19.
EXCEPTIONAL ITEMS
During the year, the Company sold the assets of its Nagpur factory which had ceased manufacturing in April 2008. Your Company realized a net gain of Rs. 139.8 mn (tax impact Rs. 28.6 mn) on this sale.
During the year Company offered a Voluntary Retirement Scheme at its Hyderabad plant to rationalize manpower and make operations lean. 30 employees opted for Voluntary Retirement and have been paid aggregate compensation of Rs. 17.0 mn.
EXTRAORDINARY ITEMS
During the year the Company has reversed balance provision amounting to Rs. 28 mn (net of tax) created in earlier year towards repairs of certain machines damaged by flood in 2005, as the same is no longer required.
During the Q1 2010 there was a fire at Thane plant & certain machines were damaged. Insurance Claim was lodged. Pending settlement an advance payment of Rs. 10 mn was received during the year. Surplus of Rs. 2.8 mn net of tax of Rs. 2.9 mn after adjusting the cost of repairs & book value of damaged assets has been included in the operational results of the year.

61st Annual Report & Accounts 2010
8
DIRECTORS’ REPORT (contd.)
CORPORATE GOVERNANCE
A separate report on Corporate Governance forms part of this report.
Certificate from the Statutory Auditors of the Company regarding compliance with the Corporate Governance requirements as stipulated under Clause 49 of the Listing Agreement is attached.
DIVIDEND
Your Directors recommend payment of dividend of Rs. 2.20 per equity share, i.e. @ 110 % on the Equity Capital for the year ended 31st December 2010. The said Equity dividend will absorb a sum of Rs. 160.8 million including the dividend distribution tax & cess thereon.
FIXED DEPOSITS
The Company did not invite or accept deposits from public and/or shareholders during the year under review. As of 31st December 2010 there was no fixed deposit pending with the Company.
STATUTORY DISCLOSURES
The information relating to conservation of energy, technology absorption and foreign exchange earnings and outgo as required under Section 217(1)(e) of the Companies Act, 1956 read with the Companies (Disclosure of Particulars in the Report of Board of Directors) Rule, 1988 forms part of this report as Annexure I.
In terms of the provisions of Section 217 (2A) of the Companies Act, 1956, read with the Companies (particulars of Employees) Rules, 1975 as amended, the names and other particulars of the employees are set out in the annexure to the Directors’ Report. However, as per the provisions of Section 219 (b) (iv) of the said Act read with Clause 32 of the Listing Agreement, the Annual Report excluding the aforesaid information is being sent to all the members of the Company and others entitled thereto. Any member interested in obtaining such particulars may write to the Company at the registered office of the Company.
DIRECTORS
Mr. K. C. Narang and Mr. Arunkumar Gandhi, retire by rotation at this Annual General Meeting and being eligible have offered themselves for re-appointment.
Mr. Suresh Gupta, Managing Director of the Company was re-designated as the Chairman & Managing Director with effect from March 10, 2010. In terms of Clause 49 of the Listing Agreement where the Chairman of the Board is an Executive Director, at least one half of the Board should comprise of Independent Directors and this needs to be complied within 180 days of any change in status. However, the Board was reconstituted only on December 8, 2010, where Mr. C N Murthy, Executive Director & Mr. Johann Sippel, a Director nominated by the parent company, stepped down from the Board to comply with the aforesaid requirement of the Listing Agreement. Consequent upon the stepping down of Mr. Johann Sippel as a Director, Mr. Juha Salonen also ceased to be his Alternate Director forthwith.
Your Directors at their meeting held on March 16, 2011 have appointed Mr. S K Palekar as an Additional Director of the Company. He is also an Independent Director within the meaning of Clause 49 of the Listing Agreement.
Pursuant to section 260 of the Companies Act, 1956 and Article 122 of the Articles of Association of the Company Mr. S K Palekar holds office up to the date of the ensuing Annual General Meeting. The Company has received the requisite notice under Section 257 of the Companies Act, 1956 and accordingly necessary agenda item relating to his appointment forms part of the Notice convening the 61st Annual General Meeting.

61st Annual Report & Accounts 2010
9
DIRECTORS’ REPORT (contd.)
With the appointment of Mr. S. K. Palekar as an Independent Director, the parent Company has renominated Mr. Johann Sippel as a Director of the Company to fill in the vacancy caused by his stepping down as a Director on December 8th 2010. Mr. Johann Sippel has joined the Board with effect from March 16th 2011 and holds office till the ensuing Annual General Meeting. The Company has also received the requisite notice under Section 257 of the Companies Act, 1956 and accordingly necessary agenda item relating to his appointment forms part of the Notice convening the 61st Annual General Meeting.
MANAGEMENT DISCUSSION AND ANALYSIS
The Management Discussion and Analysis forms part of this Annual Report for the year ended 31st December 2010.
DIRECTORS’ RESPONSIBILITY STATEMENT
On behalf of the Directors, I confirm that:
i) In the preparation of the annual accounts for the year ended 31st December, 2010 the applicable Accounting Standards have been followed and there are no material departures.
ii) Accounting policies have been selected and applied consistently and judgments and estimates made are reasonable and prudent so as to give a true and fair view of the state of affairs of the Company at the end of the Financial Year ended 31st December 2010 and of the profit of the Company for that period.
iii) Proper and sufficient care has been taken for the maintenance of adequate accounting records in accordance with the provisions of the Companies Act, 1956, for safeguarding the assets of the Company and for preventing and detecting fraud and other irregularities.
iv) Annual accounts for the year ended 31st December 2010 have been prepared on a going concern basis.
AUDITORS’ REPORT
The Auditors’ Report does not contain any qualification. Notes to Accounts and Auditors remarks in their report are self explanatory and therefore do not call for any further comments.
AUDITORS
The existing Statutory Auditors Messrs S V Ghatalia & Associates hold office until the conclusion of the ensuing Annual General Meeting and have furnished a certificate regarding their eligibility for re-appointment. The Directors recommend that they be re-appointed as Auditors of the Company for the current year.
INDUSTRIAL RELATIONS
Relations with our people at all the units continued to be cordial.
Your Directors wish to express their appreciation for the support and co-operation received from Banks, Government Authorities and Shareholders during the year under review. PPL is a people’s company and your Directors place on record their appreciation for the services rendered by our people.
By Order of the BoardFor THE PAPER PRODUCTS LIMITED
Mumbai SURESH GUPTA16th March, 2011 Chairman & Managing Director

61st Annual Report & Accounts 2010
10
A. CONSERVATION OF ENERGY
Energy Conservation is a necessary and effective key value driver to reduce cost. Company has a well-structured energy management system to initiate, facilitate and sustain energy conservation program throughout the organization. Regular efforts are taken to optimize process parameters, modernize plant & machinery, and upgrade technology and equipment.
The Company has always been conscious of the requirements of conservation of energy and several measures have been implemented in all plants and corporate head office.
1. Autonomous maintenance of air compressor to arrest leakages, modulation of delivery pressure and effective capacity utilization.
2. Maintained power factor to unity throughout the year in all plants
3. Replacement of inefficient air cooled process chiller with energy efficient digital scroll compressor.
4. Optimization of motor loading flow rate control in oil heating system.
5. Installation of lighting energy saver in dedicated feeder in Flexible Conversion Department and for compound wall lighting.
6. Up gradation of machine control panel with energy efficient and new technology by converting existing DC Motor in slitting machine to AC Motor Control System to reduce power consumption and increase efficiency.
7. Replacement of Conventional Aluminum Blades of Cooling Tower Fan with FRP Blades.
8. Replacement of Cooling Water Recirculation Pump with Smaller Capacity Energy Efficient Pump for TFH Cooling Tower.
9. Trimming/Replacement of impeller of Delivery Pump with smaller size impeller for panel cooling.
10. Integration lighting circuit with day light sensors and install Light pipes in Flexible Conversion Department at Hyderabad.
11. Install automatic star delta starter with all FDVs with cellular pads to run it in auto mode as per percentage loading on motor.
12. MCB and contactor combine power circuit provided for high capacity package air conditioner to control load surge at every power on condition.
13. Replacement of all V-belts with Flat belt in FDV motors to improve the efficiency.
14. Use booster pump in series circuit rather than in parallel by modifying the present thermic fluid circuit to save excess oil heating in the pipe.
15. Modulating production planning by scheduling power exhaustive processes in the night shift to utilize the benefical Zone A electricity tariff structure.
16. Retrofitting Variable Frequency Drive (VFD) on Blower Fan Motors in a planned manner in all plants.
17. Retrofitting of Refrigerant Optimization System on Air Cooled Process Chiller, Packaged Air Conditioning System and Ductable Split Air Conditioning System above and Equal to 5 TR Capacity.
18. Follow a stringent machine operation practices and reduce or stop idle operation of critical machines.
B. TECHNOLOGY ABSORPTION, ADAPTION & INNOVATION
The company has its Research and Development Centre at Thane, which is recognized by Department of Science and Technology, Government of India.
Innovations and new product & technology focus has led to several custom made products that have been designed, developed and commercialized with special emphasis on total-cost, aesthetics, convenience, performance and product protection.
The growing domestic consumption ensured that the customers became more demanding on productivity and total-cost
ANNEXURE TO DIRECTORS’ REPORTANNEXURE - 1

61st Annual Report & Accounts 2010
11
solutions. Increasing number of FMCG manufacturers therefore sought better line speeds resulting in our continued focus on providing better laminate design to meet this expectation from conventional structures. New capacity additions with more sophisticated equipments required high performance packaging with stricter material tolerances. Hence, laminates were designed and developed to support this key customer need in an increasingly competitive scenario.
The year was marked with unprecedented and steep spike in prices of one of the key raw materials. This undesirable situation gave us the opportunity to redesign our laminates and provide technical solution to a market event beyond our control. Several solutions were established including development of alternate options, which were appreciated by our customers and helped us to further strengthen our technical leadership in the industry.
Our product decoration technology was enhanced with the introduction of mono-layer holographic wrap around label, a first of its kind product. We also extended the unique random code technology to our shrink sleeves portfolio, thereby providing solution to its customers to communicate one-to-one with their end consumers. The focus of our specialized cartons portfolio was on developing high end packs using metallic and holographic finishes with speciality inks & coatings for premium and niche products. The developments were particularly successful for the festive and promotional cartons requirements.
An active area of interest for some of our key customers this year has been the issue of sustainability and eco-friendly solutions. We have actively kept abreast with these concerns of the industry and have also keenly partnered such initiatives of our customers, like the one of replacing PVC with PET in various packaging applications. Our continued efforts on down gauging structures as well as developments on mono-layer structures, has been helpful in addressing some of these challenges.
In recognition of the innovation efforts, we received 7 PFFCA Stars.
The expenditure on R & D during the year under report is as below:
a. Capital Rs. Nil
b. Recurring Rs. 7.806 Mn
c. Total Rs. 7.806 Mn
Percentage of R & D expenses to total turnover is 0.11% (previous year 0.15%)
C. FOREIGN EXCHANGE EARNINGS & OUTGO
a) Foreign exchange earnings from the exports of the Company’s products & services amounted to Rs.1,112.896 mn.
b) The outflow of foreign exchange during the year is disclosed in the notes to the accounts forming part of the balance sheet.
ANNEXURE TO DIRECTORS’ REPORT ANNEXURE - 1 (contd.)

61st Annual Report & Accounts 2010
12
PPL believes that good Corporate Governance is essential to achieve long term corporate goals and enhance stakeholders’ value. Thus, PPL’s philosophy on Corporate Governance is aimed at the attainment of highest level of transparency, accountability and compliance of laws in all facets of operations, leading to best standards of Corporate Governance.
It is PPL’s belief that good ethics make good business sense and our business practices are in keeping with this spirit of maintaining the highest level of ethical standards. The implementation of PPL’s code for prohibition of Insider Trading exemplifies this spirit of good ethics.
The Company complies with the requirements of Corporate Governance as stipulated under Clause 49 of the Listing Agreement, entered into with the Stock Exchanges where its shares are listed.
COMPANY’S PHILOSOPHY ONCODE OF GOVERNANCE

61st Annual Report & Accounts 2010
13
The Directors present the Company’s Report on Corporate Governance for the year ended December 31, 2010.
BOARD OF DIRECTORS
The Board of Directors of the Company (hereinafter referred as Board) comprises of a combination of executive and non-executive Directors. The Board of Directors, as on December 31, 2010 comprised 8 Directors (excluding Alternate Director) of whom two are Executive and six are Non-Executive Directors with four Directors being Independent. The Chairman of the Board is an Executive Director and half of the Board members (excluding Alternate Director) are Independent. The composition of Board is in line with requirement of Clause 49 of the Listing Agreement.. The Independent Directors do not have any material pecuniary relationship or transactions with the Company, promoters or management, which may affect their judgment in any manner. The Directors are eminently qualified and experienced professionals in business, finance and corporate management.
The policy formulation, evaluation of performance and the control function vest with the Board, while the Board Committees oversee operational issues. The Board meets at least once in a quarter to consider amongst other business, the quarterly performance of the Company and financial results. Directors attending the meetings actively participate in the deliberations at these meetings.
The composition of the Board and attendance at Board Meetings held during the financial year under review and the last Annual General Meeting (AGM) is given below:
S. No. Name of the Director Category
No. of Board Meetings held
during the FY 2010/Tenure
No. of Board Meetings attended
Attendance at Last AGM
1 Mr. Suresh Gupta 1
Chairman & Managing DirectorExecutive 5 4 Yes
2 Mr. M. K. Srinivasan 2
CEO & Executive DirectorExecutive 3 3 Yes
3 Mr. K. C. Narang 3
DirectorNon-Executive, Independent 5 5 Yes
4 Mr. C. N. MurthyExecutive Director & COO upto 8.12.2010
Executive 5 4 Yes
5 Mr. Jukka Moisio* Non-Executive 5 2 No6 Mr. Johann Sippel * 4
upto 8.12.2010Non-Executive 5 2 No
7 Mr. Arunkumar R. Gandhi Non-Executive, Independent 5 5 Yes8 Mr. P.V. Narayanan Non-Executive, Independent 5 5 Yes9 Mr. Ramesh Kumar Dhir Non-Executive, Independent 5 5 Yes
10 Mr. Vibhu Talwar Non-Executive 5 2 Yes11 Mr. Timo Salonen*
(Alternate to Mr. Jukka Moisio)Non-Executive 5 0 No
12 Mr. Juha Salonen* 5
(Alternate to Mr. Johann Sippel)upto 8.12.2010
Non-Executive 5 0 No
13 Mr. Henricus Beek*Upto 27.01.2010
Non-Executive 1 1 No
* Nominated as directors by the foreign promoters1 Re-designated as Chairman & Managing Director w.e.f. March 10, 2010.2 Appointed as an Additional Director w.e.f March 25, 2010 and confirmed as a Director at the 60th AGM held on April 27, 2010.3 Chairman upto March 10, 2010.4 Appointed as a Director in place of Mr. Henricus Beek to fill in the casual vacancy of Mr. Maurice Petitjean5 Ceased to be Alternate to Mr. Henricus Beek w.e.f. January 27, 2010 & appointed as an Alternate Director to Mr. Johann Sippel
w.e.f. Feb 1, 2010.
CORPORATE GOVERNANCE

61st Annual Report & Accounts 2010
14
CORPORATE GOVERNANCE (contd.)
Mr. Suresh Gupta, Managing Director of the Company was re-designated as the Chairman & Managing Director with effect from March 10, 2010. In terms of Clause 49 of the Listing Agreement where the Chairman of the Board is an Executive Director, at least one half of the Board should comprise of Independent Directors and this needs to be complied within 180 days of any change in status. However, the Board was reconstituted only on December 8, 2010, where Mr. C N Murthy, Executive Director & Mr. Johann Sippel, a Director nominated by the parent company, stepped down from the Board to comply with the aforesaid requirement of the Listing Agreement. Consequent upon the stepping down of Mr. Johann Sippel as a Director, Mr. Juha Salonen also ceased to be his Alternate Director forthwith.
During the year 2010, five Board Meetings were held on January 27, 2010, March 10, 2010, April 27, 2010, July 30, 2010 and October 29, 2010 respectively. The gap between two board meetings did not exceed 4 months and the Annual General Meeting was held on April 27, 2010.
Apart from physical meetings, the Board also considered and approved certain matters by circular resolutions, which were taken on record at the subsequent Board Meeting.
Directorships and Committee Memberships / Chairmanships of Directors in other public limited companies are given below:
Name of the Director
As on 31st December, 2010
Other Directorship(s)1Committee positions in other Companies (excluding PPL)2
Member Chairman Total
Mr. Suresh Gupta 1 Nil Nil Nil
Mr. K. C. Narang 1 Nil Nil Nil
Mr. M. K. Srinivasan Nil Nil Nil Nil
Mr. Jukka Moisio Nil Nil Nil Nil
Mr. Arunkumar R. Gandhi 10 4 1 5
Mr. P.V. Narayanan 1 Nil Nil Nil
Mr. Ramesh K. Dhir Nil Nil Nil Nil
Mr. Vibhu Talwar Nil Nil Nil Nil
Mr. Timo Salonen Nil Nil Nil Nil
1The number of directorships excludes directorships of private limited companies, foreign companies, companies licensed under Section 25 of the Companies Act, 1956 and alternate directorships.
2Committee includes only Audit Committee and Shareholders’ Grievance Committee of public limited companies (excluding foreign companies and section 25 companies) in terms of Clause 49 of the Listing agreement.
Information provided to the Board:
The annual calendar of the Board & Committee Meetings is agreed upon at the beginning of the year. The agenda is circulated well in advance to the Board members, along with comprehensive background information on the items in the agenda to enable the Board to deliberate on relevant points and arrive at an informed decision. All relevant information related to the working of the Company, including the information required under Clause 49 I (C) (i) of the Listing Agreement is made available to the Board. In addition to matters which require to be placed before the Board for its noting and / or approval, information is also provided on various other significant matters.
Review of legal compliance reports:
During the year, the Board periodically reviewed reports placed by the management with respect to compliance of various laws applicable to the Company. The Internal Auditors also review compliance status and report to the Audit Committee.

61st Annual Report & Accounts 2010
15
Relationship between Directors inter-se:
Mr. Vibhu Talwar, a Non-Executive Director of the Company is nephew-in-law of Mr. Suresh Gupta, Chairman & Managing Director of the Company. Other than the aforesaid there are no inter-se relationships amongst the Directors.
COMMITTEES OF THE BOARD:
The Board has constituted Committees, viz., the Audit Committee, the Remuneration Committee, the Shareholders’ / Investors’ Grievance Committee and the Share Transfer Committee.
a) Audit Committee:
i) The Audit Committee comprises of three Non-Executive Independent Directors, all of them are financially literate and two of them possess accounting and/or financial management expertise.
During the Year 2010, five Audit Committee meetings were held on January 27, 2010, March 10, 2010, April 27, 2010, July 30, 2010 and October 29, 2010. The time gap between two consecutive meetings of the Audit Committee was not more than four months.
The Audit Committee was reconstituted by the Board at its meeting held on March 10, 2010 by designating Mr. K. C. Narang as the Chairman of the Committee vice Mr. P. V. Narayanan, who continues to be a member of the Committee.
The composition of the Audit Committee and the attendance of Directors at its meetings is given hereunder:
Name of the Director Qualification Meetings attended / held during FY 2010
Mr. K. C. Narang, Chairman B. A., LLB., FCA 5/5Mr. A. R. Gandhi FCA (India) and FCA (England & Wales) 4/5Mr. P. V. Narayanan Post Graduate in Chemistry 5/5
(ii) The terms of reference of the Audit Committee are in line with Clause 49 II (C) and (D) of the Listing Agreement and Section 292A of the Companies Act, 1956.
The terms of reference of the Audit Committee include the following:
• Overseeing Company’s financial reporting process and the disclosure of its financial information.
• Recommending appointment, re-appointment or removal of the statutory auditors, fixing of audit fees and approving payments for any other services.
• Reviewing with the management the quarterly and annual financial statements with primary focus on:
a. Matters required to be included in the Director’s Responsibility Statement
b. Accounting policies and practices
c. Compliances with accounting standards
d. Accounting based on exercise of judgment by Management
e. Qualifications in the draft Audit Report
f. Compliance with the Listing Agreement and legal requirements concerning financial statements
g. Significant adjustments arising out of audit
h. The going concern assumption
i. Related party transactions
• Reviewing with the management, external and internal auditors the adequacy and compliance of internal control systems.
• Reviewing Company’s financial and risk management policies.
CORPORATE GOVERNANCE (contd.)

61st Annual Report & Accounts 2010
16
• Reviewing the internal audit function and reports and major findings of the internal auditors.
• Pre-Audit and Post-Audit discussion with the Statutory Auditors to ascertain any area of concern.
The Chairman of the Committee was present at the Annual General Meeting of the Company held in 2010 for addressing the shareholders queries, if any.
The CMD, CEO, COO, CMO, CFO, the Statutory Auditors and the Internal Auditors are invited by the Committee to attend the meetings. Mr. Parag Vyavahare, Chief Financial Officer is also invited to attend the meetings. Operating managers are also invited to attend as and when it is required.
The minutes of the Audit Committee meetings are placed before the Board. The Company Secretary of the Company acts as Secretary to the Audit Committee. The Company Secretary has resigned w.e.f 30.11.2010 and the Company is in the process of appointing a suitable replacement.
b) Shareholders /Investors Grievance Committee:
The Committee comprises of two Non–Executive Directors. During the Year 2010, one Shareholders/Investors Grievance Committee meeting was held on October 29, 2010 in which both the Committee members were present.
The composition of the Committee is given hereunder:
Name of the Director Designation
Mr. K. C. Narang Chairman
Mr. Johann Sippel Upto 08.12.2010 Member
With stepping down of Mr. Johann Sippel as a Director of the Company, he ceased to be a member of the Committee as well. The Board at its meeting held on January 28, 2011 reconstituted the Committee with the induction of Mr. R K Dhir as a member. The Committee as on January 28, 2011 comprised of Mr. K C Narang as its Chairman and Mr. R K Dhir as its member.
The Company has attended to all the Investor’s grievances / queries / information requests except for the cases where the Company was constrained due to pending legal proceedings or Court / statutory orders. The Company endeavors to reply to all letters/complaints received from shareholders within a week of receipt of the same.
During the year under review, two investor complaints were received and both were resolved to the satisfaction of the investors. There were no investor complaints pending at the beginning and at the end of the year. The status of complaints, if any, is also reported to the Board.
The Compliance Officer and his team along with the Share Transfer Agent of the Company endeavour to resolve the general queries raised by the shareholders to their satisfaction.
c) Remuneration Committee:
With a view to review and recommend to the Board the remuneration payable to working Directors from time to time , a Remuneration Committee of the Board was constituted comprising three Independent Directors. The Members of the Committee are as under:
Name of the Director Designation
Mr. A. R. Gandhi Chairman
Mr. K. C. Narang Member
Mr. Ramesh K Dhir Member
The meetings of the Remuneration Committee were held on March 10, 2010 and April 27, 2010, in which all the Committee Members were present.
CORPORATE GOVERNANCE (contd.)

61st Annual Report & Accounts 2010
17
Remuneration to Executive Directors:
The remuneration of Mr. Suresh Gupta, Chairman & Managing Director, Mr. C. N. Murthy, Executive Director & Chief Operating Officer and Mr. M. K. Srinivasan, Chief Executive Officer & Executive Director, for the year 2010 are as under:
(Amt. Rs.)
Name of the Directors Salary HRA Perquisites Commission Total
Mr. Suresh Gupta 12,780,579 5,352,204 2,618,836 – 20,751,619
Mr. M. K. Srinivasan 3,847,161 1,383,871 719,153 – 5,950,185
Mr. C. N. Murthy * 7,031,660 – 1,783,856 – 8,815,516
*Includes remuneration till December 08, 2010.
Notes:
1. Perquisites include Company’s contribution to provident fund, medical and leave travel allowance etc. as well as monetary value of perquisites as per Income Tax Rules.
2. Salary includes incentive of Rs. 3,860,271/- to Mr. Suresh Gupta and Rs. 2,370,493/- to Mr. C N Murthy under the Management Incentive Program based on company performance and achievement of specific targets.
3. The above does not include gratuity and leave encashment benefits as the provisions for these are determined for the Company as a whole and therefore separate amounts for the directors are not available
4. The Chairman & Managing Director, the CEO & Executive Director and the Executive Director & Chief Operating Officer of the Company (now ceased to be a Director of the Company) are entitled to options under “Option Rights Plan” and shares under the “Share Ownership Plan” of Huhtamaki Oyj (the ultimate Holding company) which entitles the holder of the option rights to subscribe to the shares of the ultimate holding company at a future date, at a price fixed based on the fair market price of the shares during specified period plus certain percentage of market value on the exercise date and the recipient of grants under share ownership plan is entitled to receive shares at nil cost respectively. The schemes detailed above are assessed, managed and administered by the ultimate holding company and there is no cost charged to the Company. The charge taken by Huhtamaki Oyj in its accounts for the year ended December 31, 2010 for these options and shares is Rs. 7,193,393/- (previous year Rs. 11,213,515/-)
5. The above remuneration to the Chairman & Managing Director of the Company does not include Rs. 11,812,969/- for the Year 2010 (Previous Year Rs. 4,196,316), paid by Huhtamaki Oyj, the parent company, for his role as Executive Vice President, Flexibles Global Packaging, Huhtamaki Oyj.
6. Details of service contracts, notice period and severance fees of whole-time directors:
Mr. Suresh Gupta Mr. C. N. Murthy Mr. M. K. Srinivasan
Date of contract 6th July, 1999 (renewed and modified on 22nd June 2001, 24th June 2004, 27th April 2007 & 3rd March 2010)
1st February, 2005 (Modified on 27th April 2007, 28th April 2009 & 3rd March 2010)
25th March, 2010
Notice Period 90 days 90 days 90 days
Severance fees i. Salary and other emoluments for a period of 90 days in lieu of notice.
and
ii. Base salary for a period equal to one month’s base salary for every year of completed service.
Salary and other emoluments for a period of 90 days in lieu of notice.
Salary and other emoluments for a period of 90 days in lieu of notice.
CORPORATE GOVERNANCE (contd.)

61st Annual Report & Accounts 2010
18
Remuneration to Non Executive Directors
Non–Executive Directors are paid sitting fees for attending Board/ Committee Meetings as approved by the Board within the limits prescribed under the Companies Act, 1956.
Details of Sitting Fees paid to the Directors during the year 2010 are as follows:
Amount in Rupees
Names of the Directors Board Meetings Committee Meetings Total
Mr. K C Narang 50,000 70,000 1,20,000
Mr. Arunkumar R Gandhi 50,000 60,000 1,10,000
Mr. P V Narayanan 50,000 50,000 1,00,000
Mr. Ramesh Dhir 50,000 20,000 70,000
Mr. Vibhu Talwar 20,000 0.00 20,000
Total 2,20,000 2,00,000 4,20,000
The Commission due to the Non–Executive Independent Directors for the year 2010 is as follows:
Amount in Rupees
Names of the Directors CommissionMr. K C Narang 10,00,000
Mr. Arunkumar R Gandhi 9,60,000
Mr. P V Narayanan 6,25,000
Mr. Ramesh Dhir 5,00,000
Total 30,85,000
Commission payable to each of the Independent Directors as authorized by the Members at 57th Annual General Meeting held on April 27, 2007, is limited to a fixed amount per year as determined and approved by the Board based on their contribution at the Board and Committee meetings. The total amount of commission to Non-Executive Independent Directors is within the limit of 1% of the net profits of the company for the year, calculated as per the provisions of the Companies Act, 1956.
The total compensation payable to Independent Directors and the method of calculation of the limits as laid down in the Companies Act, are disclosed separately in the financial statements.
None of the Non-Executive Directors (except Mr. K. C. Narang, who holds 148,250 equity shares in his personal capacity) are holding shares in the Company. The Company has not granted any stock options to its Directors.
d) Share Transfer Committee
The Board of Directors has delegated the powers to approve the transfer of shares to a Share Transfer Committee. The Committee comprised of Mr. Suresh Gupta, Chairman & Managing Director, Mr. M. K. Srinivasan, CEO & Executive Director, Mr. C. N. Murthy, Executive Director & COO and Mr. Johann Sippel, Director.
Mr. C. N. Murthy & Mr. Johann Sippel have ceased to be the members of the Committee after stepping down as Directors with effect from December 8, 2010.
The report of the Practising Company Secretary on the Reconciliation of Share Capital of the Company as required by SEBI is obtained every quarter and furnished to the Stock Exchanges. The Report is also placed before the Board and noted by them as required under the applicable laws.
Share Transfer System
Documents for transfer of shares in physical form can be lodged with Sharepro Services (India) Pvt. Ltd., the R&T Agents of the Company. The Board of Directors has delegated the powers to approve the transfer of shares to Share Transfer Committee. The Committee attends to share transfer formalities at least once in fortnight.
CORPORATE GOVERNANCE (contd.)

61st Annual Report & Accounts 2010
19
MANAGEMENT
Management Discussion and Analysis
This Annual Report has a detailed section on Management Discussion and Analysis (MDA).
Disclosures by Management
The particulars of transactions between the Company and its related parties as per the Accounting Standard is set out in Note 5 of Schedule 17 forming part of the accounts. These transactions are not likely to have any conflict with the Company’s interest.
All details relating to financial and commercial transactions where directors may have a potential interest are provided to the Board, and interested Directors neither participate in the discussion, nor do they vote on such matters.
CMD / CEO / CFO Certification
Mr. Suresh Gupta, Chairman & Managing Director, Mr. M. K. Srinivasan, CEO & Executive Director & Mr. Parag Vyavahare, Chief Financial Officer, have issued necessary certification to the Board in terms of Clause 49(V) of the Listing Agreement and the same was taken on record by the Board at its meeting held on January 28, 2011. A copy of this certificate is provided as Annexure A to this report.
Code of Conduct
As required under Clause 49 of the Listing Agreement, the Company has laid down Code of Conduct for Directors and Senior Management Personnel of the Company. The same has been posted on the Company’s website www.pplpack.com. The Company has received affirmation of compliance from Directors & Senior Managerial Personnel of the Company for the financial year ended December 31, 2010. A declaration to this effect signed by the Chairman & Managing Director of the Company is provided as Annexure B to this report.
DISCLOSURES
Disclosures Regarding Appointment or Reappointment of Directors
A. Pursuant to the Articles of Association of the Company, at every Annual General Meeting of the Company, one-third of the directors, whose office is subject to retirement, are liable to retire.
Accordingly, Mr. K. C Narang and Mr. Arunkumar R Gandhi being longest in office shall retire by rotation, and being eligible have offered themselves for re-appointment.
B. The brief resumes of the above mentioned Directors are as follows:
Mr. K. C. Narang, is a B.A., L.L.B and FCA. He is a former partner of M/s. Dalal Desai and Kumana, Chartered Accountants and a past President of Bombay Chartered Accountants Society. He has been a Director of the Company since July 1981.
Mr. Arunkumar R Gandhi is a Fellow Member of both, the Institute of Chartered Accountants of England & Wales and the Institute of Chartered Accountants of India. Besides, he is an associate member of the Chartered Institute of Taxation, London. He joined Tata Sons Ltd. as an Executive Director on August 18, 2003 and continued in that position till August 17, 2008. Prior to joining Tata Sons, he was partner with M/s. N M Raiji & Co., Chartered Accountants. He is on the Board of number of Tata Group Companies in India and abroad. He has been an Independent Director of the Company since March 2002.
Means of Communication
The Company has always promptly reported to all the Stock Exchanges where the securities of the Company are listed, all the material information including declaration of quarterly / half-yearly and annual financial results in the prescribed formats and through press releases etc.
The financial results and other statutory information are communicated to the shareholders by way of advertisement in one English daily and one Marathi language daily newspaper, as per the requirements of the Listing Agreement entered with Stock Exchanges.
CORPORATE GOVERNANCE (contd.)

61st Annual Report & Accounts 2010
20
Financial results are normally published in “Business Standard” in English & “Sakal” in Marathi.
The said results are also made available on the Company’s website: www.pplpack.com. Official press releases, Company information, Annual Reports and the extracts of media coverage are also displayed on the Company’s website.
As the financial results are published in leading newspapers as well as hosted on the Company’s website, the results are not sent to the households of the individual shareholders.
Insider Trading Regulations
The Company has notified and adopted the PPL Code of Conduct for Prohibition of Insider Trading made pursuant to SEBI (Prohibition of Insider Trading) Regulations, 1992.
The Company Secretary of the Company who was the Compliance Officer has resigned w.e.f. November 30, 2010 and Mr. Parag Vyavahare, Chief Financial Officer of the Company has been designated as the Compliance Officer for the purpose of these regulations, w.e.f. December, 12.2010.
Details of capital market related non-compliance, if any
There has been no non-compliance by the Company of any legal requirements during the last three years; nor has there been any penalty, stricture imposed on the company by any stock exchange, SEBI or any statutory authority on any matter related to capital markets pertaining to this period.
Risk Management
The Company has in place mechanism to inform Board Members about the Risk Assessment and Minimization procedures and periodical reviews to ensure that risk is controlled by the Executive Management.
Adoption/Non-adoption of Non-Mandatory Requirements of Clause 49 of the Listing Agreement
• The Company has not provided for tenure of Independent Directors.
• The Company has set up the Remuneration Committee.
• The Company does not send Half-yearly financial performance to each household of shareholders, as it is displayed on Company’s website.
• The Audit qualifications if any are displayed in the financial reports of the Company. There are no audit qualifications for the year under review.
• The Company does not have any formal training program for Board Members.
• There is no mechanism for evaluating the performance of non-executive Board Members.
• The Company does not have a “Whistle Blower Policy” for the time being, however no personnel has been denied access to the Audit Committee.
ANNUAL GENERAL MEETINGS
The details of last three Annual General Meetings held were as under:
Year Date Time Location Special Resolutions passed
2007 07.05.2008 4.00 PM Rama Watumull Auditorium,Kishinchand Chellaram College,Dinshaw Wacha Road,Churchgate, Mumbai – 400 020
NIL
2008 28.04.2009 4.30 PM - Do - NIL
2009 27.04.2010 4.00 PM - Do - NIL
CORPORATE GOVERNANCE (contd.)

61st Annual Report & Accounts 2010
21
Special Resolution passed through Postal Ballot
Approval of the members was sought through Postal Ballot vide Notice dated January 12, 2010 for passing of the Special Resolution under Section 163 of the Companies Act, 1956 for keeping Register of Members, Indices of Members and other related books at the changed address of Company’s Registrar & Share Transfer Agents or at such other place within Mumbai, where the Registrar and Transfer Agents may shift its office from time to time.
The Postal Ballot process was undertaken in accordance with the provisions of Section 192A of the Companies Act, 1956, read with the Companies (Passing of Resolution by Postal Ballot), Rules 2001.
Mr. S. N. Ananthasubramanian, Practising Company Secretary, Thane was appointed as Scrutinizer for conducting the postal ballot voting process for the above resolution.
Results of the Postal Ballot are as under:-
Total Number of Postal Ballot Forms received : 353
Number of Invalid Postal Ballot Forms : 21
Number of Valid Postal Ballot forms : 332
No. of Postal Ballot Forms No. of shares voted PercentageVotes cast – Assent 315 86,60,187 99.54Votes cast – Dissent 17 39,720 0.46Total Votes 332 86,99,907 100.00
GENERAL SHAREHOLDER INFORMATION
Details of ensuing Annual General Meeting
Day & Date Time Venue
Wednesday, April 27, 2011 4.00 pm Rama Watumull Auditorium,Kishinchand Chellaram College,Dinshaw Wacha Road,Churchgate, Mumbai – 400 020
Financial Calendar:
Financial Year: Calendar Year (1st January to 31st December)
Schedule of the Board Meetings for declaration of Financial Results (tentative and subject to change):
Quarter ended Date of Board MeetingsMarch, 2011 April 27,2011 (Wednesday)June, 2011 July 27, 2011 (Wednesday)September, 2011 November 1, 2011 (Tuesday)
Book Closure Date
Pursuant to Section 154 of the Companies Act, 1956, the Register of Members will remain closed from April 20, 2011 to April 27, 2011 (both days inclusive).
Dividend Payment Date
Dividend at the rate of Rs. 2.20 per share has been recommended by the Board and is subject to the approval from the shareholders at the ensuing AGM, the same will be paid on or after Thursday, April 29, 2011:
a) to all those beneficial owners holding shares in electronic form, as per the ownership data made available to the company by National Securities Depository Limited (NSDL) and the Central Depository Services (India) Limited (CDSL) as of the end-of-the-day on Tuesday, April 19, 2011; and
CORPORATE GOVERNANCE (contd.)

61st Annual Report & Accounts 2010
22
b) to all those shareholders holding shares in physical form, after giving effect to all the valid share transfers lodged with the company on or before the closing hours on Tuesday, April 19, 2011.
Dividend History of the Company
Year AGM Date Dividend Rate Rs. (%)
2007
2008
2009
07.05.2008
28.04.2009
27.04.2010
Rs. 1.80/- (90%)
Rs. 1.80/- (90%)
Rs. 3.00/- * (150%)
* Includes one time Platinum Jubilee dividend of Re. 1/- per equity share.
Listing of Shares on Stock Exchanges
The Company’s shares are listed on Bombay Stock Exchange (BSE) and National Stock Exchange (NSE). The details of the same are as follows:
Stock Exchange Stock Code/Symbol
Bombay Stock Exchange Limited (BSE)
The National Stock Exchange of India Limited (NSE)
509820
PAPERPROD
The ISIN of Company’s equity shares is INE275B01026.
Annual Listing fees for 12 months ended March 31, 2010 have been paid to the BSE and NSE.
Company Identification Number (CIN)
All the forms, returns, balance sheets, charges & all other documents, papers etc. filed by the Company with the Registrar of Companies are available for inspection on the official website of MCA www.mca.gov.in, under the Company Identification Number (CIN): L21011MH1950FLC145537.
Shareholders’ Rights
A Shareholder can enjoy the following rights mentioned in the Companies Act, 1956:
• To transfer shares.
• To receive the share certificates upon transfer within the stipulated period prescribed in the Listing Agreement.
• To receive notice of general meetings, balance sheet and profit & loss account and the Auditors’ report.
• To appoint proxy to attend and vote at the general meetings. In case the member is a body corporate, to appoint a representative to attend and vote at general meetings of the company on its behalf.
• To attend and speak in person, at general meetings. Proxy cannot vote on show of hands but can vote on a poll.
• To vote at the general meetings on show of hands wherein every shareholder has one vote. In case of poll, the number of votes of a shareholder depends on the proportion of equity shares held by him with the total paid up equity share capital of the Company.
• To demand poll along with other shareholder(s) who collectively hold 25000 shares or not less than 1/10th of the total voting power in respect of any resolution.
• To requisition an Extra-Ordinary general meeting of Company by shareholders who collectively hold not less than 1/10th of the total paid up capital of the Company.
• To move amendments to resolutions proposed at the meetings.
• To receive dividends and other corporate benefits like rights, bonus shares etc. as and when declared/ announced.
CORPORATE GOVERNANCE (contd.)

61st Annual Report & Accounts 2010
23
• To take inspection of the various statutory registers of the Company, as provided under the Companies Act, 1956.
• To inspect the minutes’ books of general meetings and to receive copies thereof after complying with the procedure prescribed in the Companies Act, 1956.
• To proceed against the company by way of civil or criminal proceedings.
• To proceed against the winding up of the Company.
• To receive the residual proceeds upon winding up of a Company.
THE INVESTORS EDUCATION AND PROTECTION FUND (IEPF)
Pursuant to the provisions of Section 205A and 205C of the Companies Act, 1956, dividends, matured fixed deposits, redeemed debentures and interest thereon, which remained unclaimed upto December 31, 2003 were deposited with Investors’ Education and Protection Fund (IEPF) of the Central Government.
The amount of dividend paid, fixed deposit that have matured, debentures redeemed and interest accrued thereon, after 31st December 2003 will be transferred to the IEPF after the expiry of 7 years from the date on which such payments were due for payment. And once the amount is transferred to the IEPF as mentioned above, no claim shall lie in respect of the same, with the Company and / or Government of India. Therefore, the shareholders are advised to claim such amounts immediately.
AUDITOR’S CERTIFICATE ON CORPORATE GOVERNANCE
As required under Clause 49 of the Listing Agreement, the Auditor’s Certificate regarding the compliance of provisions of the Corporate Governance norms is attached with this report.
STOCK DATA
The table herein below gives the monthly high and low prices and volume of the Company’s shares traded at the Bombay Stock Exchange Limited (BSE) and National Stock Exchange (NSE) during the period from January 2010 to December 2010.
Month & Year BSE NSE
High (Rs./share)
Low (Rs./share)
Volume (No. of Shares)
High (Rs./share)
Low (Rs./share)
Volume (No. of Shares)
January 2010 69.75 56.90 2,416,805 69.80 57.50 2,694,709
February 2010 59.35 56.00 1,304,744 59.35 55.80 1,495,220
March 2010 61.00 56.10 2,082,548 66.70 50.80 2,508,043
April 2010 69.50 57.65 5,902,527 69.65 57.75 6,652,851
May 2010 63.40 55.05 1,007,745 63.25 56.50 1,369,720
June 2010 65.60 57.10 1,376,602 65.60 57.00 1,826,510
July 2010 71.50 61.35 3,256,297 71.35 61.15 3,695,184
August 2010 67.50 59.65 1,413,055 66.70 59.80 1,047,582
September 2010 65.40 57.95 733,943 65.90 57.55 913,840
October 2010 64.75 59.05 1,039,924 64.90 59.10 991,401
November 2010 63.50 52.35 396,463 71.35 52.45 551,841
December 2010 58.40 50.35 281,814 59.90 50.60 442,244
Note:
1 Volume is the total monthly volume of trade (in numbers) in shares of “The Paper Products Limited” on respective exchanges.
CORPORATE GOVERNANCE (contd.)

61st Annual Report & Accounts 2010
24
The chart herein below shows the comparison of the Company’s share price movement vis-à-vis the movement of the BSE Sensex:
CORPORATE GOVERNANCE (contd.)
DISTRIBUTION OF SHAREHOLDING
Following is the distribution pattern of shareholding of the Company as on 31st December 2010:
Distribution of shareholding by ownership:
Sr. No. Category No. of Shareholders* No. of Shares % of Total Holding
1. Indian Promotors 15 3,111,832 4.96
2. Foreign Promotors – Huhtavefa B.V. 1 36,934,100 58.92
3. Foreign Institutional Investors 9 1,083,234 1.73
4. NRI’s & OCB’s 247 612,529 0.98
5. Bodies Corporate 610 4,087,133 6.52
6. Banks/ Financial Institutions 5 39,480 0.06
7. Insurance Companies 2 307,745 0.49
8. Mutual Funds 5 2,692,807 4.30
9. Resident Individuals 13,970 13,807,440 22.02
10. Trust 1 10,890 0.02
Total 14,865 62,687,190 100.00
* No. of shareholders based on number of folios/demat accounts as per register of members.
COMPANY SHARE PRICE AND BSE SENSEX - HIGH
55.00
60.00
65.00
70.00
75.00
80.00
PPL
SHA
RE
PRIC
E
14,000
16,000
18,000
20,000
BSE
SEN
SEX
PPL HIGH 69.75 59.35 61.00 69.50 63.40 65.60 71.50 67.50 65.40 64.75 63.50 58.40
BSE HIGH 17,790 16,669 17,793 18,048 17,537 17,920 18,238 18,475 20,268 20,855 21,109 20,552
Jan-10 Feb-10 Mar-10 Apr-10 May-10 Jun-10 Jul-10 Aug-10 Sep-10 Oct-10 Nov-10 Dec-10

61st Annual Report & Accounts 2010
25
Distribution of shareholding by number of shares held:
No. of Equity Shares Held No. of Shareholders % of Shareholders No. of Shares Held % of Shares
Up to – 500 10,093 67.90 1,784,799 2.85
501 – 1000 2,028 13.64 1,640,835 2.62
1001 – 2000 1,222 8.22 1,862,560 2.97
2001 – 3000 615 4.14 1,548,646 2.47
3001 – 4000 187 1.26 671,612 1.07
4001 – 5000 193 1.30 907,477 1.45
5001 - 10000 281 1.89 2,011,239 3.21
10001 and above 246 1.65 52,260,022 83.36
Total 14,865 100.00 62,687,190 100.00
Following is the List of Top Ten Shareholders (other than Promoters) of the Company as on 31st December 2010:
Sr. No. Name of Shareholder No. of Shares Held % of Total Shareholding
1 HDFC Trustee Company Ltd. A/c HDFC MID 2,688,217 4.29
2 Shree Capital Services Limited 896,147 1.43
3 India Optima Fund 751,591 1.20
4 Kotak Securities Limited 444,410 0.71
5 Bank Muscat (SAOG) A/c Bank Muscat India Fund 263,453 0.42
6 The New India Assurance Company Limited 227,745 0.36
7 Rajan 204,960 0.32
8 NBI Industrial Finance Co. Ltd. 187,850 0.30
9 Newa Investments Pvt. Ltd. 185,605 0.30
10 Ravindar Prakash 172,900 0.28
Total 6,022,932 9.61
PLEDGE OF SHARES
No pledge has been created over the Equity Shares held by the Promoters and/or Promoter Group Shareholders as on 31st December 2010.
DEMATERIALISATION OF SHARES
At present, 97.50% of the Company’s shares are held in electronic form and the Company’s shares can only be traded in compulsory demat segment in the stock exchanges where it is listed.
CORPORATE GOVERNANCE (contd.)

61st Annual Report & Accounts 2010
26
The table herein below gives the break up of shares in physical and demat form as at December 31, 2010:
No. of Shares in physical segment 1,563,788 2.50%
No. of Shares in demat segment 61,123,402 97.50%
Total 62,687,190 100.00%
OUTSTANDING GDRS/WARRANTS/CONVERTIBLE INSTRUMENTS AND THEIR IMPACT ON EQUITY
The Company has not issued any ADR, GDR or Warrants and there are no Convertible instruments outstanding and hence there is no likely impact on equity.
DETAILS OF PUBLIC FUNDING OBTAINED IN THE LAST THREE YEARS
The Company has not obtained any public funding in the last three years.
ELECTRONIC CLEARANCE SCHEME (ECS) FOR DIVIDEND
To avoid risk of loss / interception of dividend warrants in postal transit and / or fraudulent encashment, shareholders are requested to avail of the ECS facility where dividends are directly credited in electronic form to their respective bank accounts. This also ensures faster credit of dividend. Shareholders who desire receipt of their dividend through ECS can obtain the form from the Registrar & Transfer agent of the Company.
Shareholders may also submit their bank details to Registrar and Transfer Agent. This will enable the Company to incorporate this information on dividend warrants to minimize the risk of fraudulent encashment.
ADDRESS FOR CORRESPONDENCE WITH THE COMPANY
All correspondence may please be addressed to the Registrar and Transfer Agent, SHAREPRO SERVICES (INDIA) PRIVATE
LIMITED at the address given below.
In case any shareholder is not satisfied with the response or do not get any response within reasonable period from the Registrar and Transfer Agent, they may approach the Compliance Officer at the Registered Office of the Company or email their queries/grievances to [email protected]
Registered Office: Registrar and Transfer Agent (R&TA)
The Paper Products Limited Sharepro Services (India) Pvt. Ltd.Regent Chambers,13th Floor, UNIT : PPLNariman Point, 13 AB, Samhita Warehousing Complex, 2nd FloorMumbai – 400 021 Sakinaka Telephone Exchange LaneTel: +91 22 2282 0969, +91 22 2283 1889 Off Andheri-Kurla RoadFax: +91 22 2283 2860 Sakinaka, Andheri East Website: www.pplpack.com Mumbai - 400072Email: [email protected] Tel: +91 22, 6772 0300 +91 22, 6772 0351/2/3 Fax: +91 22 2837 5646 Website: www.shareproservices.com Email: [email protected]
CORPORATE GOVERNANCE (contd.)

61st Annual Report & Accounts 2010
27
CORPORATE GOVERNANCE (contd.)
COMPLIANCE OFFICER
Mr. Parag Vyavahare, Chief Financial Officer is the Compliance Officer of the Company.
LOCATIONS
Registered Office: Regent Chambers, 13th Floor, Nariman Point, Mumbai –400021
Corporate Office: L.B.S. Marg, Majiwade, Thane (Maharashtra) – 400601
Plants:Thane L.B.S. Marg, Majiwade, Thane (Maharashtra) - 400601
Silvassa Survey No. 33/1, At Post Umerkoi, Via Silvassa (U. T. of Dadra & Nagar Haveli) - 396230
Hyderabad Plot No.139 & 148, Sri Venkateshwara Co-op. Industrial Estate, Bollarum, Medak District (Andhra Pradesh) - 502325
Rudrapur Plot No. 70-73, Sector 4, IIE Pantnagar, Rudrapur, Udhamsingh Nagar (Uttarakhand) – 263153
Annexure A
CMD/CEO/CFO certification (As per clause 49(v) of the Listing Agreement)
28th January 2011
To
The Board of Directors
The Paper Products Ltd.
We hereby certify that in the preparation of the accounts for the year ended 31st December 2010,
(a) We have reviewed financial statements and the cash flow statement for the year and that to the best of our knowledge and belief:
(i) these statements do not contain any materially untrue statement or omit any material fact or contain statements that might be misleading;
(ii) these statements together present a true and fair view of the company’s affairs and are in compliance with existing accounting standards, applicable laws and regulations.
(b) To the best of our knowledge and belief, there are no transactions entered into by the company during the year, which are fraudulent, illegal or in violation of the Company’s code of conduct.
(c ) We accept responsibility for establishing and maintaining internal controls for financial reporting and that we have evaluated the effectiveness of the internal control systems of the company pertaining to financial reporting and we have disclosed to the auditors and the Audit Committee, and further state that there were no deficiencies in the design or operation of such internal controls.
(d) We have indicated to the auditors and the Audit Committee
a. That there are no significant changes in internal controls over financial reporting during the year.
b. That there are no Significant changes in accounting policies during the year.
c. There have been no instances of significant fraud of which we have become aware and the involvement therein, if any of the management or an employee having a significant role in the company’s internal control system over financial reporting.
Suresh Gupta M. K. Srinivasan Parag Vyavahare(Chairman & Managing Director ) (CEO & Executive Director) (Chief Financial Officer)

61st Annual Report & Accounts 2010
28
CERTIFICATE OF COMPLIANCE WITH THE CORPORATE GOVERNANCE REQUIREMENTS UNDER CLAUSE 49 OF LISTING AGREEMENTTo
The Members of The Paper Products Limited
We have examined the compliance of conditions of corporate governance by The Paper Products Limited, for the year ended on December 31, 2010, as stipulated in clause 49 of the Listing Agreement of the said Company with stock exchanges.
The compliance of conditions of corporate governance is the responsibility of the management. Our examination was limited to procedures and implementation thereof, adopted by the Company for ensuring the compliance of the conditions of the Corporate Governance. It is neither an audit nor an expression of opinion on the financial statements of the Company.
In our opinion and to the best of our information and according to the explanations given to us, we certify that the Company has complied with the conditions of Corporate Governance as stipulated in the above mentioned Listing Agreement, except for the following:
Clause 49 I (A) (ii) of the listing agreement requires at least half of the Board to comprise of Independent Directors where the Chairman of the Board is an Executive Director. In the Board Meeting held on March 10, 2010, the Board re-designated the Managing Director of the Company as Chairman and Managing Director resulting in four independent directors on the Board against required norm of five independent directors. On December 8, 2010, the Board was re-constituted and the Board strength was reduced to eight, thereby meeting the requirement mentioned above.
We further state that such compliance is neither an assurance as to the future viability of the Company nor the efficiency or effectiveness with which the management has conducted the affairs of the Company.
For S.V. GHATALIA & ASSOCIATESFirm registration number: 103162W
Chartered Accountants
per Sudhir SoniMumbai Partner 28th January, 2011 Membership No.: 41870
Annexure B
Certificate of Compliance with the Code of Conduct for Board of Directors and Senior Management Personnel
The Members of
The Paper Products Limited
As required under Clause 49(I)(D) of the Listing Agreement with the Stock Exchanges, I hereby declare that all the Board members and senior management personnel of the Company have complied with the Code of Conduct of the Company for the year ended 31st December 2010.
For The Paper Products Limited
Mumbai Suresh Gupta28th January, 2011 Chairman & Managing Director
CORPORATE GOVERNANCE (contd.)

61st Annual Report & Accounts 2010
29
MANAGEMENT DISCUSSION & ANALYSIS
OVERVIEW
“Maintain calmness and stability With Growth with Profitability Despite Turbulence and Volatility”.
Adaptability and change management were buzzwords of an earlier decade. Unpredictability was the running theme of the first decade of the present millennium -- more so for year 2010.
Emerging from the shadows of the 2008 meltdown, the economy’s journey to the end of the decade was a sprint. The Indian economy was on firmer ground compared to the US, Japanese or European economies. The stimulus package ushered in by the Government of India led to a robust domestic economic performance. While developed economies that shrunk in 2009 marginally recovered in 2010, India registered a robust growth of 7.7%. However, valid concerns on overall inflation triggered by stagflation in food prices and emerging food crisis in the region and the geo-political situation in the Middle East are major dampeners. The overall demand for flexibles in India grew by 15 – 17% with severe competitive pressures. Despite these challenges, your company performed very well.
In 2010, its Platinum Jubilee year, Net External Sales were INR 7040.1 Mn against INR 5776.9 Mn for the previous year, registering a growth of 21.9% in value and 15% in volume terms. Strong domestic demand, gains in operating efficiencies and overall push for growth helped achieve the strong growth in 2010.
Profit from ordinary activities before tax was INR 585.5 Mn (INR 495.7 Mn for 2009), - a growth of 18.1%. Exceptional income for 2010 of INR 122.8 Mn included net gain realized from sale of Nagpur factory assets of INR 139.8 Mn in Q1 -2010 and an expense of INR 17.0 Mn towards the Voluntary Retirement Scheme (VRS) at Hyderabad. Current tax for 2010 includes INR 28.6 Mn relating to the above exceptional income . Other extraordinary income (net of tax) of INR 30.5 Mn pertains to partial settlement of Insurance claim for loss suffered because of fire at Thane and reversal of earlier repairs provision for repairs to machinery at Thane damaged in 2005.
Net profit after extraordinary items and tax for Y-2010 was INR 481.2 Mn (INR 373.8 Mn for Y-2009). The basic and diluted earnings per share including extraordinary and exceptional items rose to INR 7.68 (INR 5.96 for Y-2009) and stood at INR 5.60 excluding extraordinary and exceptional items.
FINANCIAL OVERVIEW
Sales
Gross sales for Y 2010 was INR 7613.3 Mn (INR 6179.6 Mn for Y 2009). As already mentioned, Net sales at INR 7040.1 Mn represented an increase of 21.9% over Y 2009. Volumes grew from 28726 tons in Y 2009 to 33056 tons in Y 2010 - a growth of 15.1%. The Volume growth in 2010 in the core flexibles business was a robust 17% in line with the market growth. During the year, unremunerative products in the Specialised Cartons Business were reduced impacting the overall volume growth.
Other Income
Other income was INR 83.2 Mn against INR 91.1 Mn for Y 2009. It included INR 16.3 Mn of Dividend from Mutual Funds , INR
1.1 Mn from sale of fixed assets, INR 3.2 Mn of sales and purchase tax refunds and the rest from mainly sale of scrap.
Raw Material
Input costs rose sharply from 66.2% to 70.5% in Y 2010. Prices of most of the input materials were volatile but moved in a narrow band except for PET Films and Paper. PET film prices increased by more than 150%. Diversion of thin films to higher value added thick films for electronics industry; postponement of capacity additions in 2009 consequent to the global melt down in 2008 coupled with closure old and unviable plants in Europe resulted in a serious shortage of PET fims. Price of films rose very steeply from April 2010 but the customers were unwilling to adjust laminate prices immediately leading to large, unprecedented cost price lag.

61st Annual Report & Accounts 2010
30
Crude, which remained reasonably stable in the first three quarters started raising sharply due to adverse geo-political developments
and worse than anticipated winter in the major energy consuming markets of US and EU.
Prices of a few other key raw materials – especially dyes and pigments , crude based solvents, waxes and some speciality grades of polymer resins also went up during the second half of 2010, primarily due to strong revival in demand and delay in revival of plants which closed down in 2009. Prices of inks, adhesives and solvents hardened in the third quarter.
While these factors were clear to all our customers, they were most reluctant to recognise the immediate and steep impact of these cost developments. As PET Film prices jumped every month steeply (sometimes every fortnight), several increases were needed in a short period to merely maintain margins. Many of our customers resorted to reverse auctions, hard negotiations with the flexible packaging manufacturers using consultants, open bidding for specific volumes etc. Further, excess capacity in the flexibles packaging industry which has been the bane for many years also contributed to inadequate recovery of input costs.
Judicious use of raw materials, buying forward, hedging and entering into contracts fairly early in the up moving cycle helped to contain the situation to a certain extent.
PROFITABILITY
With a volatile and challenging situation on the raw material front, the management went on a renewed expenditure control drive.
Expenditure
Total operating expense in Y 2010 - aggregate of manufacturing and operating expenses, personnel expenses, administration and selling expenses and depreciation and amortization expenses amounted to INR 1717.2 Mn (INR 1550.8 Mn in Y 2009). Overall expenses dropped from 26.8 % of net sales in Y 2009 to 24 .4 % in Y 2010.
MANAGEMENT DISCUSSION & ANALYSIS (contd.)
Crude Oil (USD/Barrel)
65
70
75
80
85
90
95
Ja
n'1
0
Fe
b'1
0
Ma
r'1
0
Ap
r'1
0
Ma
y'1
0
Ju
ne
'10
Ju
l'1
0
Au
g'1
0
Se
p'1
0
Oc
t'1
0
No
v'1
0
De
c'1
0
Crude Oil (USD/Barrel)

61st Annual Report & Accounts 2010
31
Key expenditure elements are analysed below ---
Manufacturing and operating expenses were at INR 447.8 Mn (INR 416.8 Mn for Y 2009) - maintained at 2.5 as % to net sales, despite increase in energy cost and other inflationary pressures.
Personnel expenses stood at 8.3% of net sales (INR 591.0 Mn) dropped compared to 8.5% in Y 2009 (INR 493.3 Mn).
Administration and Sales expenses were maintained at 5%.
Foreign Exchange Gains
Gains for Y 2010 were INR 28.0 Mn against INR 15.3 Mn for Y 2009.
EBDIT
EBDIT for Y 2010 was INR 792.7 Mn compared to INR 818.6 Mn for Y 2009.
Operating Profit
Operating profit dropped to INR 468.7 Mn from INR 507.1 Mn in Y 2009.
Depreciation and Amortisation
Depreciation and Amortisation for Y 2010 was INR 324.0 Mn against INR 311.5 Mn for the previous year.
Financial Expenses
Expenses dropped from INR 11.4 Mn in Y 2009 to INR 6.0 Mn .
PBT, Tax, PAT
Profit before Tax & Exceptional Income for Y 2010 is INR 462.7 Mn as against INR 495.7 Mn for Y 2009. After considering exceptional items aggregating to INR 122.8 Mn which is net of profit on sale of Nagpur Factory property INR 139.8 Mn & expenses of INR 17.0 Mn pertaining to VRS at Hyderabad Plant, Profit before Tax & after exceptional items for Y 2010 is INR 585.5 Mn, as against INR 495.7 Mn for Y 2009.
Tax liability for Y 2010 was INR 134.8 Mn against INR 120.8 Mn for Y 2009.
Profit after tax before extraordinary income was INR 450.7 Mn against INR 373.8 Mn for Y 2009. Net Profit after Tax was INR 481.2 Mn against INR 373.8 Mn for Y 2009.
Earnings Per Share
Basic and diluted earnings per share was INR 7.68 for Y 2010 against INR 5.96 for Y 2009.
Dividend
For the year under review, Directors have recommended a dividend of INR 2.20 per share. This will absorb INR 160.1 Mn including Dividend Distribution Tax and cess thereon and represents 33 % of distributable profits of the year.
BALANCE SHEET
Shareholders’ Funds
Equity share capital remained unchanged during the year. INR 48.1 Mn was transferred to General reserve leaving INR 1239.3 Mn in the Profit and Loss Account
MANAGEMENT DISCUSSION & ANALYSIS (contd.)

61st Annual Report & Accounts 2010
32
Borrowings
Total borrowings dropped to INR 225.3 Mn. During the year, short term borrowings for working capital amounting to INR 14.1 Mn was brought down to NIL.
Capital Expenditure and Fixed Assets
During Y 2010 Company had a cash inflow of INR 52.7 Mn from fixed assets divestments, primarily due to sale of Nagpur Factory Assets .
Gross Block reduced by INR 148.5 Mn mainly due to write off of certain obsolete assets & sale of Nagpur factory assets. At end 2010, it stood at INR 4397.6 Mn. Capital work in progress stood at INR 33.9 Mn against INR 45.7 Mn at end 2009.
The 2011 Capital Expenditure Budget has been set at INR 422.0 Mn to support the profitable growth in specific geographies/ segments, creating capacity for value added niche products and selective replacement and maintenance capital expenditure.
Inventory
Inventories were at INR 892.1 Mn as at 31st December, 2010 compared to INR 759.3 Mn as at 31st December, 2009 due to higher raw material prices and increase in business volumes.
Debtors
Sundry Debtors, net of provision for bad and doubtful debts, as on 31st December, 2010 were at INR 1188.3 Mn against INR 972.0 Mn as on 31st December, 2009.
Creditors
Sundry Creditors at end 2010 stood at INR 941.0 Mn against INR 814.7 Mn at end 2009.The increase is in line with increase in prices and activity levels.
Loans and Advances
Loans and advances as on 31st December 2010 were INR 197.6 Mn compared to INR 212.1 Mn as on 31st December 2009
Cash and Cash Equivalents
Cash and Cash equivalents comprise current investments , balances in current accounts and deposit accounts with scheduled banks , cash and cheques in hand , unpaid dividend accounts and accrued gain/loss on foreign currency cash and cash equivalents.
As on 31st December, 2010, cash and cash equivalents stood at INR 501.8 Mn compared to INR 350.6 Mn as on 31st December 2009.
Cash Flow from Operating Activities
Cash Flow from Operating Activities was INR 314.1 Mn in 2010 against INR 667.6 Mn in 2009. In the current year with 21% growth in business , working capital expanded substantially.
Trade Investments
Temporary surplus funds were invested judiciously in Mutual Funds during the year, yielding an income of INR 16.3 Mn (previous year INR 12.9 Mn). Value of investments held at the end of the year was INR 394.5 Mn.
Cash and Bank Balances
Balances in current accounts and deposit accounts with scheduled banks aggregated INR 84.5 Mn as on 31st December, 2010 compared to INR 35.5 Mn as on 31st December, 2009.
MANAGEMENT DISCUSSION & ANALYSIS (contd.)

61st Annual Report & Accounts 2010
33
MARKET COMMENTARY
The management of Indian Economy has been repeatedly commented upon for its conservatism, slow response and low pace of economic reforms. However, these very factors helped the economy insulate itself from risky financial engineering and debt defaults. During the global meltdown in 2009 and the implications for 2010, the so-called rigid and conservative Indian banking system stood its ground. Business damage was limited largely to demand compression in overseas markets.
India’s GDP registered a robust 7.7% Growth. On the back of this growth, the demand for flexible packaging also grew strongly. The Union Budget of 2010-11 also unlocked a large quantum of funds to the agriculture and food processing industries as well as improvements in infrastructure in an effort to establish ‘inclusive’ growth. These translated to a reasonably strong rural demand for consumer goods. The consequent growth in flexible packaging was very robust. Expert opinion on the growth rate of the flexible packaging industry converges to around 15 – 17% growth. Capacity additions that were marginally delayed or postponed in 2009 were completed. As demand grew and also with more players and capacities entering the flexibles market, the competition became more intense.
With high inflation in food and primary articles becoming the order of the day, especially in the second half of 2010, FMCG players, especially MNCs, had to go on an overdrive to cut costs across the system to cash in on the growing demand at lower price points in the domestic market. With unprecedented, frequent increases in the price of PET films, Inks and Solvents as well as increase in operating costs due to inflation and energy rates, the customers were hard pressed to accept price increases. As a result, the margins of the flexible packaging industry further eroded.
Going forward, a blend of cautious optimism and rational exuberance are indicated. GDP growth of over 8 % is expected for the coming fiscal. Agriculture, Industry, services and private consumption are expected to perform better in line with the economic outlook. Consumer Products , Processed Foods, Pharma and Engineering Components are expected to do well in the medium to long term. Therefore the medium to long term outlook for flexible packaging is quite attractive.
Opportunities
Processed Foods:
Vision-2015 statement of the Ministry of Food Processing Industries, Government of India sets out the following;
1 Become the Food Factory of the World
2 Triple the growth of the Food Processing Industry
3 Increase the value addition from 20% to 35%.
4 Increase contribution to world agriculture business from 1.5% to 3%.
Hi-tech agriculture, horticulture, organic farming, contract farming and agri retailing are already seen to be receiving a push at various levels. Staples like wheat, maize and pulses are getting a special thrust.
Concerns and Risks
PPL remains committed as a supplier of quality packaging to discerning customers. Admittedly, 2010 has been a challenging year. Input cost pressures hit our suppliers, our customers and our customers’ customers. As mentioned earlier, inflation -- particularly food inflation -- touched all segments of the economy. Selectively increasing unit prices of packs, reducing pack sizes etc can work upto a point in an elastic market. Not surprisingly, demand shifts, particularly downtrading, become a feature leading to uneven demand or even compression. Driven to the wall, buyers of packaging material make vigorous attempts to “commoditize” packaging to rein in costs. Discerning customers seem to be sacrificing quality packaging and are becoming extremely price conscious.
MANAGEMENT DISCUSSION & ANALYSIS (contd.)

61st Annual Report & Accounts 2010
34
Food and fuel inflation is worrying and industry faces higher input costs. Perceived/probable cartelization of our raw materials adds further pressure to our input cost. Recent political developments in the Arab World offer no comfort.
Strategies
In the long run, moving more business to value added segments, Innovation and new products, exploring new markets are seen as critical to profitable growth.
NASP (New Applications, Structures, Products and Processes), the company’s endeavour to renew innovation programme will continue to be the cornerstone of our strategy – a constant product offering and constantly add value to the customers. Innovation and creativity is our constant endeavour. NASP initiatives which contributed to 27.2% of total 2010 sales would get added thrust in the current year and years to come. Organisational measures to further accelerate the NASP efforts are in place with the CEO directly overseeing the company’s innovation programs and strategy.
Operations
During the year, a major re-orientation of the planning and review systems for day to day operations have been put in place. The focus on sweating the assets was enhanced. We have been able to achieve new benchmarks in asset utilisation and unlocking of capacity through de-bottlenecking, closer coordination between the various elements of the supply chain and inventory controls. Focus has been placed on further improving the operating efficiencies and ‘forecasting reliability’. Expanding supplier base for critical items, introduction of alternate materials, improving equipment reliability through major overhauls have been completed in different facets of operations. Two of the major plants – Rudrapur and Hyderabad are getting ready to induct new machines to augment capacities. Technology rationalisation across sites is in progress. These measures are expected to bring in sharper focus on throughputs and efficiencies in the different plants.
People
It is people who face and overcome challenges. Their approach, knowledge, commitment and actions are what finally deliver. An open , hands-on culture, which involves and empowers, which believes in sharing and training, and inculcates pride in knowledge. All this is our philosophy. We need to continuously ensure that it is also our ‘practice’. We believe ‘philosophy’ and ‘practice’ are partners.
In line with the basic tenet that it is the people who deliver the results, major organisational changes, considered relevant to meet the challenges of today and tomorrow have been initiated. Focus is on enhancing the knowledge and competency base. Key resources for various critical areas – plant management, technology management, new business development, innovation and HR management have been identified and are in the process of moving to designated positions across the organisation. Training and development needs, at the individual and team levels have been identified and appropriate actions have been set in motion. Training has been a key focus area in Y2010. ERP related training of users and change management across all locations formed the major part of training. The company plans to accelerate training initiatives aligned to the Business Excellence Program in Y 2011.
These steps are expected to lead to a strong and vibrant organisation that is ready to meet the challenges of profitable growth through share gain in conventional products as well as the new product and NASP initiatives.
However, talent retention still remains one of the key challenges with growth in the economy and shortage of skilled and trained manpower. PPL continues to be seen as a ‘poaching ground’ across industry and service sectors.
SYSTEMS
Key ERP modules stabilized. With the basic system in place, plans are afoot to intensify training and take advantage of the power of ERP.
RISK MANAGEMENT
At PPL, risk management is looked upon as an area of continuous focus . All major decisions are critically evaluated from a risk standpoint. Risks in the areas of selling price management, raw material and energy costs, forex , investment and people are continuously evaluated and periodically reviewed and wherever necessary, corrective actions are initiated to mitigate the risks.
MANAGEMENT DISCUSSION & ANALYSIS (contd.)

61st Annual Report & Accounts 2010
35
INTERNAL CONTROLS
The company’s Internal Control systems are commensurate with the nature and size of its operations. Internal Audit is conducted by an independent firm of internal auditors & every year , new areas of business operations are added to increase the scope or enhance the scope of review.
Review of Internal Control systems covers following aspects:
• Financial propriety of business transactions
• Accurate financial reporting of transactions as per applicable Accounting Standards and policies
• Safeguarding assets of the company
• Compliance with relevant statutes, listing agreement provisions, management authorizations, procedures and policies.
• Review of information technology and other business systems so as to suggest ways and means of cost optimization.
The Audit Committee reviews the internal audit findings. Further, the Audit Committee meets the Internal and Statutory Auditors to be assured of the Operations of the internal controls.
HEALTH, SAFETY AND ENVIRONMENT
‘Health, Safety and Environment is our core value. Simply stated, our goals are: no accidents, no harm to people and no damage to environment. Health, safety and security of everyone who works at PPL, are critical to our business.’
KPI’s instituted on Safety and environment are monitored on an ongoing basis. Continuous engagement with all stakeholders and rigorous training is an integral part of HSE management. Reporting on KPI’s is a part of reports to top management and to the Board and the indices are embedded into the Performance Management systems
FINALLY
The volatility in the environment in recent years has been extremely challenging for packaging business. Your management is hungry for profitable growth. Capacities are being put in place to meet the growth in business in the near term. Focus is being given to acceleration of the business excellence initiative as a key driver of maintaining & improving competitiveness. Your management is committed to remaining proactive to meet challenges arising in a continuously changing environment. The irony is : every customer of our products is conscious of the fact that good packaging not only protects and preserves but also enhances saleability and is yet compromising on quality because of cost constraints.
Strategic plans have been drawn up to build a sustainable high growth profitable business including plans for new product offerings in multiple end user segments.
As we move into 2011, PPL will continue to focus on achieving long term success while continuing to genuinely adopt kindness, understanding, openness, honesty and a strong and dynamic work ethics as core values.
Despite constraints, in the medium to long term, your management maintains a positive outlook.
Cautionary Statement
Statements in the Management Discussion and Analysis describing the Company’s objectives, projections, expectations and estimates regarding future performance may be “forward-looking statements” within the meaning of applicable securities laws and regulations and are based on currently available information. The management believes these to be true to the best of its knowledge at the time of preparation of this report. However, these statements are subject to future events and uncertainties, which could cause actual results to differ materially from those that may be indicated by such statement.
MANAGEMENT DISCUSSION & ANALYSIS (contd.)

61st Annual Report & Accounts 2010
36
To The Members of The Paper Products Limited
1. We have audited the attached Balance Sheet of The Paper Products Limited (“the Company”) as at December 31, 2010 and also the Profit and Loss account and the cash flow statement for the year ended on that date annexed thereto. These financial statements are the responsibility of the Company’s management. Our responsibility is to express an opinion on these financial statements based on our audit.
2. We conducted our audit in accordance with auditing standards generally accepted in India. Those Standards require that we plan and perform the audit to obtain reasonable assurance about whether the financial statements are free of material misstatement. An audit includes examining, on a test basis, evidence supporting the amounts and disclosures in the financial statements. An audit also includes assessing the accounting principles used and significant estimates made by management, as well as evaluating the overall financial statement presentation. We believe that our audit provides a reasonable basis for our opinion.
3. As required by the Companies (Auditor’s Report) Order, 2003 (as amended) (“the Order”) issued by the Central Government of India in terms of sub-section (4A) of Section 227 of the Companies Act, 1956, (“the Act”) we enclose in the Annexure a statement on the matters specified in paragraphs 4 and 5 of the said Order.
4. Further to our comments in the Annexure referred to above, we report that:
i. We have obtained all the information and explanations, which to the best of our knowledge and belief were necessary for the purposes of our audit;
ii. In our opinion, proper books of account as required by law have been kept by the Company so far as appears from our examination of those books;
iii. The balance sheet, profit and loss account and cash flow statement dealt with by this report are in agreement with the books of account;
iv. In our opinion, the balance sheet, profit and loss account and cash flow statement dealt with by this report comply with the accounting standards referred to in sub-section (3C) of section 211 of the Act.
v. On the basis of the written representations received from the directors, as on December 31, 2010, and taken on record by the Board of Directors, we report that none of the directors is disqualified as on December 31, 2010 from being appointed as a director in terms of clause (g) of sub-section (1) of section 274 of the Act.
vi. In our opinion and to the best of our information and according to the explanations given to us, the said accounts give the information required by the Act, in the manner so required and give a true and fair view in conformity with the accounting principles generally accepted in India;
a) in the case of the balance sheet, of the state of affairs of the Company as at December 31, 2010;
b) in the case of the profit and loss account, of the profit for the year ended on that date; and
c) in the case of cash flow statement, of the cash flows for the year ended on that date.
For S.V. GHATALIA & ASSOCIATESFirm registration number: 103162W
Chartered Accountants
per Sudhir SoniMumbai Partner 28th January, 2011 Membership No.: 41870
AUDITORS’ REPORT

61st Annual Report & Accounts 2010
37
referred to in paragraph [3] of our report of even date
Re: The Paper Products Limited (“the Company”)
(i) (a) The Company has maintained proper records showing full particulars, including quantitative details and situation of fixed assets.
(b) Fixed assets have been physically verified by the management during the year and no material discrepancies were identified on such verification.
(c) There was no substantial disposal of fixed assets during the year.
(ii) (a) The management has conducted physical verification of inventory at reasonable intervals during the year.
(b) The procedures of physical verification of inventory followed by the management are reasonable and adequate in relation to the size of the Company and the nature of its business.
(c) The Company is maintaining proper records of inventory and no material discrepancies were noticed on physical verification.
(iii) (a) As informed, the Company has not granted any loans, secured or unsecured to companies, firms or other parties covered in the register maintained under section 301 of the Act. Therefore, the provisions of clause 4 (iii) (b to d) are not applicable to the Company
(b) As informed, the Company has not taken any loans, secured or unsecured from companies, firms or other parties covered in the register maintained under section 301 of the Act. Therefore, the provisions of clause 4(iii) (f and g) are not applicable to the Company.
(iv) In our opinion and according to the information and explanations given to us, there is an adequate internal control system commensurate with the size of the Company and the nature of its business, for the purchase of inventory and fixed assets and for the sale of goods and services. During the course of our audit, no major weakness has been noticed in the internal control system in respect of these areas. During the course of our audit, we have not observed any continuing failure to correct major weakness in internal control system of the Company.
(v) (a) According to the information and explanations provided by the management, we are of the opinion that the particulars of contracts or arrangements referred to in section 301 of the Act that need to be entered into the register maintained under section 301 have been so entered.
(b) In our opinion and according to the information and explanations given to us, the transactions made in pursuance of such contracts or arrangements exceeding value of Rupees five lakhs have been entered into during the financial year at prices which are reasonable having regard to the prevailing market prices at the relevant time.
(vi) The Company has not accepted any deposits from the public.
(vii) In our opinion, the Company has an internal audit system commensurate with the size and nature of its business.
(viii) To the best of our knowledge and as explained, the Central Government has not prescribed maintenance of cost records under clause (d) of sub-section (1) of section 209 of the Act for the products of the Company.
(ix) (a) The Company is generally regular in depositing with appropriate authorities undisputed statutory dues including provident fund, investor education and protection fund, employees’ state insurance, income-tax, sales-tax, wealth-tax, service tax, customs duty, excise duty, cess and other material statutory dues applicable to it.
Further, since the Central Government has till date not prescribed the amount of cess payable under section 441 A of the Act, we are not in a position to comment upon the regularity or otherwise of the company in depositing the same.
ANNEXURE TO THE AUDITORS’ REPORT

61st Annual Report & Accounts 2010
38
ANNEXURE TO THE AUDITORS’ REPORT (contd.)
(b) According to the information and explanations given to us, no undisputed amounts payable in respect of provident fund, investor education and protection fund, employees’ state insurance, income-tax, wealth-tax, service tax, sales-tax, customs duty, excise duty, cess and other undisputed statutory dues were outstanding, at the year end, for a period of more than six months from the date they became payable.
(c) According to records of the Company, the dues outstanding of income tax, sales tax, wealth tax, service tax, customs duty, excise duty and cess on account of any dispute, are as follows:-
Name of Statute Nature of Dues Period to which the amount relates
Forum where dispute is pending Amount Rs. in ‘000
Income Tax Act, 1961
Tax and Interest 2007-08 Commissioner of Income Tax (Appeals) 14,079
State and Central Sales Tax Acts
Tax 2004-05 Commissioner of VAT 14,800
Tax 2002-03 Joint Commissioner – Sales Tax Appeals 2,057
Tax 1997-98, 2001-02 Sales Tax Tribunal 2,915
Tax 1998-2000, 2006-07 Appellate Deputy Commissioner 2,623
Tax 2000-01,2004-05 to 2008-09
Assistant Commissioner of Commercial Tax 12,484
Finance Act, 1994 – Service Tax
Tax and Penalty 2004-2010 Commissioner Appeals 1,231
Tax 2002 Custom, Excise and Service Tax Appellate Tribunal
79
Tax and Penalty 2006-08 Custom, Excise and Service Tax Appellate Tribunal
1,410
Central Excise Act, 1944
Tax 1998-2004 Supreme Court 134,694
Tax 2005-08 Assistant Commissioner of Central Excise 50,483
Tax and Penalty 1996-2004 The Commissioner of Central Excise 1,034
Tax and Penalty 1989-91,1997-2009 Custom, Excise and Service Tax Appellate Tribunal
319,871
(x) The Company has no accumulated losses at the end of the financial year and it has not incurred cash losses in the current and immediately preceding financial year.
(xi) Based on our audit procedures and as per the information and explanations given by the management, we are of the opinion that the Company has not defaulted in repayment of dues to financial institution or debenture holders.
(xii) According to the information and explanations given to us and based on the documents and records produced to us, the Company has not granted loans and advances on the basis of security by way of pledge of shares, debentures and other securities.
(xiii) In our opinion, the Company is not a chit fund or a nidhi / mutual benefit fund / society. Therefore, the provisions of clause 4(xiii) of the Order are not applicable to the Company.
(xiv) In our opinion, the Company is not dealing in or trading in shares, securities, debentures and other investments. Accordingly, the provisions of clause 4(xiv) of the Order are not applicable to the Company.

61st Annual Report & Accounts 2010
39
(xv) According to the information and explanations given to us, the Company has not given any guarantee for loans taken by others from bank or financial institutions.
(xvi) The Company did not have any term loans outstanding during the year.
(xvii) According to the information and explanations given to us and on an overall examination of the balance sheet of the Company, we report that no funds raised on short-term basis have been used for long-term investment.
(xviii) The Company has not made any preferential allotment of shares to parties or companies covered in the register maintained under section 301 of the Act.
(xix) The Company did not have any outstanding debentures during the year.
(xx) The Company has not raised money through public issues during the year.
(xxi) Based upon the audit procedures performed for the purpose of reporting the true and fair view of the financial statements and as per the information and explanations given by the management, we report that no fraud on or by the Company has been noticed or reported during the course of our audit.
For S.V. GHATALIA & ASSOCIATESFirm registration number: 103162W
Chartered Accountants
per Sudhir SoniMumbai Partner 28th January, 2011 Membership No.: 41870

61st Annual Report & Accounts 2010
40
BALANCE SHEETAs at 31st December 2010
(Rs. In Thousands)
Schedule 2010 2009
SOURCES OF FUNDSShareholders’ Funds Share Capital 1 125,383 125,383 Reserves and Surplus 2 2,811,229 2,490,080
2,936,612 2,615,463Loan Funds Secured Loans 3 – 14,042 Unsecured Loans 4 225,309 225,309
225,309 239,351Deferred Tax Liability (Net) 52,639 67,759(Refer Schedule 17 Note 3 b)
3,214,560 2,922,573
APPLICATION OF FUNDSFixed AssetsGross Block 5 4,397,563 4,546,074Less: Accumulated Depreciation 2,644,604 2,558,231
Net Block 1,752,959 1,987,843Capital Work in Progress including 33,920 45,716Capital Advances (Refer Schedule 17 Note 21)
1,786,879 2,033,559Investments 6 394,481 310,359Current Assets, Loans and Advances 7 Inventories 892,068 759,294 Sundry Debtors 1,188,299 971,981 Cash and Bank Balances 108,447 40,774 Other Current Assets 123,166 109,890 Loans and Advances 197,555 212,051
2,509,535 2,093,990Less: Current Liabilities and Provisions 8 Current Liabilities 1,249,112 1,245,242 Provisions 227,223 270,093
1,476,335 1,515,335
Net Current Assets 1,033,200 578,655
3,214,560 2,922,573
Significant Accounting Policies 16
Notes to Accounts 17
The accompanying Schedules referred to above form an integral part of the Accounts.As per our report of even date attached.
For S.V. Ghatalia & Associates Firm Registration No. 103162W Chartered Accountants per Sudhir Soni Suresh Gupta M.K. SrinivasanPartner Chairman & Managing Director Chief Executive Officer & Executive Director Membership No. 41870 Mumbai Parag Vyavahare January 28, 2011 Chief Financial Officer }
Jukka MoisioK.C. NarangP.V. NarayananRamesh K Dhir
Directors

61st Annual Report & Accounts 2010
41
PROFIT AND LOSS ACCOUNTFor the year ended 31st December 2010
(Rs. In Thousands)
Schedule 2010 2009
INCOMEGross Sales 7,613,309 6,179,646Less:Excise Duty 449,945 314,941Less:Sales Tax 123,264 573,209 87,782 402,723Net Sales 9 7,040,100 5,776,923Other Income 10 83,218 91,114 7,123,318 5,868,037EXPENDITUREMaterial Costs 11 4,965,529 3,825,421Manufacturing and Operating Expenses 12 447,841 416,761Personnel Expenses 13 591,007 493,334Administration and Sales Expenses 14 354,345 329,286Depreciation and Amortisation 5 323,967 311,467Foreign Exchange (Gains)/Losses (Net) (28,039) (15,357)OPERATING PROFIT 468,668 507,125Financial Expenses 15 5,970 11,376PROFIT BEFORE TAX, EXCEPTIONAL AND EXTRAORDINARY ITEMS 462,698 495,749Exceptional Income / (Expenses) (Refer Schedule 17 Note 24) 122,809 –PROFIT BEFORE TAX AND EXTRAORDINARY ITEMS 585,507 495,749Provision for Current Taxes- Current year 147,500 132,300- Previous years 5,327 (10,330)Provision for Deferred Taxes (18,033) (1,206)Provision for Fringe Benefits Tax – 1,200PROFIT AFTER TAX BEFORE EXTRAORDINARY ITEMS 450,713 373,785Extraordinary Income / (Expenses) (Net of Tax) (Refer Schedule 17 Note 25) 30,527 –NET PROFIT AFTER TAX AND EXTRAORDINARY ITEMS 481,240 373,785Balance brought forward from last year 966,246 849,862Amount available for appropriation 1,447,486 1,223,647APPROPRIATIONSTransferred to General Reserve 48,124 37,379Proposed Dividend @ Rs.2.20 per Equity Share 137,912 125,374(Previous Year Rs.2/- per Equity Share)Provision for Dividend Tax on above 22,179 21,307(Including write back of Rs.726/- Thousand being dividend tax for previous year)Proposed Special One time Dividend Rs.Nil (Previous Year@ Rs.1/-) per Equity Share – 62,687Provision for Dividend Tax on above – 10,654Balance carried to Balance Sheet 1,239,271 966,246 1,447,486 1,223,647Significant Accounting Policies 16Notes to Accounts 17Earnings Per ShareWeighted average number of shares 62,687,190 62,687,190Face value Rs.2/- (Previous Year Rs.2/-) per equity shareBasic and Diluted Earnings per Share including Extraordinary & Exceptional Items 7.68 5.96Basic and Diluted Earnings per Share excluding Extraordinary Items 7.19 5.96Basic and Diluted Earnings per Share excluding Extraordinary & Exceptional Items 5.60 5.96
The accompanying Schedules referred to above form an integral part of the Accounts.As per our report of even date attached.
For S.V. Ghatalia & Associates Firm Registration No. 103162W Chartered Accountants per Sudhir Soni Suresh Gupta M.K. SrinivasanPartner Chairman & Managing Director Chief Executive Officer & Executive Director Membership No. 41870 Mumbai Parag Vyavahare January 28, 2011 Chief Financial Officer }
Jukka MoisioK.C. NarangP.V. NarayananRamesh K Dhir
Directors

61st Annual Report & Accounts 2010
42
CASH FLOW STATEMENTFor the year ended 31st December 2010
(Rs. in Thousands)
2010 2009
A. Cash Flow from Operating Activities Net Profit before Taxation, Exceptional & Extraordinary Items 462,698 495,749 Adjustments for Depreciation 323,967 311,467 Unrealised Foreign Exchange Loss/(Gain)-Net 4,510 (7,558) Interest Income (1,359) (1,290) Dividend Income (16,245) (12,929) Financial Expenses ( Except Bank Charges) 151 3,168 Provision for Doubtful Debts - Written back – (566) Baddebts written off 1,954 – (Profit)/Loss on Sale of Investments 13 – Fixed Assets Written Off / Provided 15,192 14,561 Other Write Offs/Provisions 379 668 Profit on Sale of Assets (Net) (1,127) (10,589)
Operating Profit before Changes in Working Capital 790,133 792,681
Adjustments for (Increase)/Decrease in
Trade Receivables (217,831) (31,647)
Inventories (132,775) (138,078)
Loans and Advances (3,184) (8,631)
Adjustments for Increase / (Decrease) in
Trade Payables 127,632 195,338
Other Current Liabilities (129,410) (47,349)
Cash Generated from Operations 434,565 762,314
Direct Taxes Paid (Net of Refunds Received) (133,952) (94,721)
Cash Flow before Exceptional & Extraordinary Items 300,613 667,593
Exceptional Item (Refer schedule 17 note 24 b) (17,004) –
Cash Flow after Exceptional, but before Extraordinary Items 283,609 667,593
Extraordinary Items (Refer schedule 17 note 25) 30,527 –
Net Cash from Operating Activities 314,136 667,593
B. Cash Flow from Investing Activities
Purchase of Fixed Assets (102,329) (271,449)
Proceeds from Sale of Fixed Assets (Refer schedule 17 note 24 a) 154,981 10,891
Proceeds from Advance Received Against Sale of Land – 27,500
Purchase of Investments (1,210,807) (1,314,135)
Sale of Investments 1,210,794 1,317,246
Dividend Received 16,244 12,929
Interest Received 1,354 3,928
Net Cash from Investing Activities 70,237 (213,090)

61st Annual Report & Accounts 2010
43
CASH FLOW STATEMENT (Contd.)For the year ended 31st December 2010
Notes:
1) The above cashflow statement has been prepared under indirect method as per Accounting Standard–3 “Cash Flow Statement”
2) Cash and Cash equivalents for the purpose of Cash Flow Statements comprise of Cash at Bank and in Hnad and short term investments with an original maturity of three months or less.
(Rs. in Thousands)
2010 2009
C. Cash Flow from Financing Activities
Repayment of Buyers credit – (269,992)
Repayment of Bank Borrowings (14,042) 11,189
Interest Paid (151) (6,423)
Dividends Paid (Including Dividend Tax thereon) (219,144) (131,607)
Net Cash Used in Financing Activities (233,337) (396,833)
Net Increase in Cash and Cash Equivalents 151,036 57,670
Cash and Cash Equivalents at the Beginning of the Year 350,753 293,083
Cash and Cash Equivalents at the Close of the Year 501,789 350,753
Cash and Cash Equivalents Comprise:
Cash on Hand 2,199 1,573
Cheques on Hand 17,317 150
Balances in Current Accounts with Scheduled Banks 76,968 31,567
Balances in Deposit Accounts with Scheduled Banks 7,550 3,950
Balances in Unpaid Dividend Bank Accounts * 4,413 3,534
Current Investments 394,431 310,309
Unrealised Loss/ (Gain) on Foreign Currency Cash and Cash Equivalents (1,089) (330)
501,789 350,753
* These balances are not available for use by the Company, as they represent corresponding unpaid Liabilities.
As per our report of even date attached.
For S.V. Ghatalia & Associates Firm Registration No. 103162W Chartered Accountants per Sudhir Soni Suresh Gupta M.K. SrinivasanPartner Chairman & Managing Director Chief Executive Officer & Executive Director Membership No. 41870 Mumbai Parag Vyavahare January 28, 2011 Chief Financial Officer }
Jukka MoisioK.C. NarangP.V. NarayananRamesh K Dhir
Directors

61st Annual Report & Accounts 2010
44
SCHEDULES ANNEXED TO AND FORMING PART OF THE ACCOUNTSAs at 31st December 2010
(Rs. In Thousands)
2010 2009
SCHEDULE 1 - SHARE CAPITALAUTHORISED CAPITAL150,000,000 (Previous Year 150,000,000)Equity shares of Rs.2/- each 300,000 300,000700,000 (Previous Year 700,000) 12% RedeemableCumulative Preference Shares of Rs.100/- each 70,000 70,000300,000 (Previous Year 300,000) UnclassifiedShares of Rs.100/- each 30,000 30,000
400,000 400,000
400,000 400,000
ISSUED SUBSCRIBED AND PAID-UP CAPITAL62,687,190 (Previous Year: 62,687,190) EquityShares of Rs.2/- each fully paid-up. 125,374 125,374Add : Amount Received on 1,449 (Previous Year1,449) forfeited Shares. 9 125,383 9 125,383
TOTAL 125,383 125,383
Paid up Share capital includes 7,525,000 (Previous year 7,525,000)Bonus Shares of Rs.2/- each issued by capitalisation of reservesPaid up Share capital includes 36,934,100 (Previous year 36,934,100 )Shares of Rs.2/-each held by holding company Huhtavefa B.V.
SCHEDULE 2 - RESERVES AND SURPLUSSECURITIES PREMIUM ACCOUNT 793,632 793,632REVALUATION RESERVEBalance as per last Balance sheet 27,576 27,576CAPITAL REDEMPTION RESERVE 70,000 70,000GENERAL RESERVEBalance as per last Balance sheet 632,626 595,247Add: Transferred from Profit and Loss Account 48,124 680,750 37,379 632,626PROFIT AND LOSS ACCOUNT 1,239,271 966,246
TOTAL 2,811,229 2,490,080
SCHEDULE 3 - SECURED LOANSLOANS FROM BANKS AND FINANCIAL INSTITUTIONSWorking Capital Loans from Banks (Refer Schedule 17 Note 1)Cash Credit Balances – 14,042
TOTAL – 14,042
SCHEDULE 4 - UNSECURED LOANSSales Tax Deferred Loan (Refer Schedule 17 Note 16) 225,309 225,309(Amount due within one year Rs.3,857/- Thousand Previous year Rs.Nil.)
TOTAL 225,309 225,309

61st Annual Report & Accounts 2010
45
SCHEDULES ANNEXED TO AND FORMING PART OF THE ACCOUNTSAs at 31st December 2010
SCH
EDU
LE 5
– F
IXED
ASS
ETS
(Rs.
in T
hous
ands
) G
ROSS
BLO
CK
AC
CU
MU
LATE
D D
EPRE
CIA
TIO
N /
AM
ORT
ISA
TIO
NN
ET B
LOC
K
Des
crip
tion
Orig
inal
Cos
t As
At
01.0
1.20
10
Add
ition
sD
urin
g Th
eYe
ar
Del
etio
nsD
urin
g th
e ye
ar
Ori
gina
lC
ost A
s A
t31
.12.
2010
Ope
ning
Bala
nce
As
At
01.0
1.20
10
On
Del
etio
nsD
urin
g Th
eYe
ar
Cha
rge
For
The
Year
Clo
sing
Bala
nce
As
At
31.1
2.20
10
Bala
nce
As
At
31.1
2.20
10
Bala
nce
As
At
31.1
2.20
09
TAN
GIB
LE A
SSET
S
Land
– F
reeh
old
(Ref
er N
ote
3)52
,265
––
52,2
65–
––
–52
,265
52,2
65
– L
ease
hold
25,9
45–
–25
,945
1,24
2–
288
1,53
024
,415
24,7
03
Build
ings
(Ref
er n
ote
1)62
3,56
85,
376
22,1
9660
6,74
823
7,76
919
,689
37,8
9025
5,97
035
0,77
838
5,79
9
Mac
hine
ry (R
efer
not
e 2)
3,51
5,13
585
,561
216,
693
3,38
4,00
32,
163,
449
198,
078
241,
003
2,20
6,37
41,
177,
629
1,35
1,68
6
Com
pute
rs79
,998
4,25
48,
382
75,8
7047
,959
8,14
512
,727
52,5
4123
,329
32,0
39
Mot
or V
ehic
les
16,8
709,
597
7,25
119
,216
11,4
506,
485
3,05
88,
023
11,1
935,
420
Furn
iture
,Fix
ture
s,O
ffice
97,7
161,
436
4,82
394
,329
54,6
824,
517
7,40
457
,569
36,7
6043
,034
Equi
pmen
ts &
Tec
hnic
al
Libr
ary
INTA
NG
IBLE
ASS
ETS
Non
com
pete
fees
20,0
00–
–20
,000
20,0
00–
–20
,000
––
Com
pute
r Sof
twar
es11
4,57
787
968
111
4,77
521
,680
680
21,3
7642
,376
72,3
9992
,897
Clu
b M
embe
rshi
p–
4,41
2–
4,41
2–
–22
122
14,
191
–
Gra
nd T
otal
4,54
6,07
411
1,51
526
0,02
64,
397,
563
2,55
8,23
123
7,59
432
3,96
72,
644,
604
1,75
2,95
91,
987,
843
Prev
ious
Yea
r3,
993,
922
673,
122
120,
970
4,54
6,07
42,
357,
332
110,
568
311,
467
2,55
8,23
11,
987,
843
As
At 3
1st D
ecem
ber
2010
As
At 3
1st D
ecem
ber
2009
Ori
gina
l C
ost
Wri
tten
D
own
Val
ue
Ori
gina
l C
ost
Wri
tten
D
own
Val
ue1.
Bu
ildin
gs in
clud
e
a.
Bu
ildin
gs o
n le
aseh
old
land
124
,892
1
29,7
92
b.
O
wne
rshi
p fla
ts in
Co–
oper
ativ
e So
ciet
ies
on fr
eeho
ld la
nd
21,
262
21,
262
c.
O
wne
rshi
p fla
ts in
Co–
oper
ativ
e So
ciet
ies
on le
aseh
old
land
1
3,77
2 1
3,77
2 2
a.
Mac
hine
ry i
nclu
des
Elec
trica
l Fi
tting
s be
ing
expe
nditu
re i
ncur
red
on i
nsta
lling
Hig
h Te
nsio
n Li
ne f
or
draw
ing
pow
er fr
om th
e El
ectri
city
Dep
artm
ent,
Dad
ra a
nd N
agar
Hav
eli G
rid
to th
e Si
lvas
sa P
lant
thou
gh
owne
rshi
p of
the
sam
e ve
sts
with
the
Elec
trici
ty D
epar
tmen
t. 3
0,08
3 6,
880
30,
083
12,
777
b.
M
achi
nery
incl
udes
Ele
ctric
al F
ittin
gs b
eing
exp
endi
ture
incu
rred
on
inst
allin
g ov
erhe
ad li
ne &
met
erin
g ya
rd fo
r lay
ing
high
tens
ion
line
for d
raw
ing
pow
er fr
om C
entra
l Pow
er D
istri
butio
n C
ompa
ny o
f And
hra
Prad
esh
Ltd’
s G
rid t
o th
e H
yder
abad
pla
nt t
houg
h ow
ners
hip
of t
he s
ame
vest
s w
ith C
entra
l Po
wer
D
istri
butio
n C
ompa
ny o
f And
hra
Prad
esh
Ltd
1,3
60
786
1,3
60
926
3.
Free
hold
land
at T
hane
was
reva
lued
on
31.0
7.19
85, b
ased
on
inde
pend
ent v
alua
tion
repo
rt.

61st Annual Report & Accounts 2010
46
SCHEDULES ANNEXED TO AND FORMING PART OF THE ACCOUNTSAs at 31st December 2010
(Rs. In Thousands)
2010 2009
Face Value Rs Nos Nos
SCHEDULE 6 – INVESTMENTS (AT COST)LONG TERM INVESTMENTS – TRADEGOVERNMENT SECURITIES – 6 Year National Savings Certificates –Series VIII 50 50
50 50
CURRENT INVESTMENTS–NON TRADE– UNQUOTED UNITS OF MUTUAL FUNDS:– HDFC Cash Management Fund - Treasury Advantage - Wholesale Daily 10 2,314,971 23,223 4,022,832 40,355 Dividend Reinvest (6,117,490 Units purchased and 7,825,351 Units sold during the year)– ICICI Prudential Flexible Income Premium Plan 100 492,189 52,042 – – (1,154,221 Units purchased and 662,032 Units sold during the year)– Birla Sun Life Savings Fund - Institutional Daily Dividend Reinvest 10 2,511,306 25,130 6,271,688 62,760 (5,733,162 Units purchased and 9,493,544 Units sold during the year)– Reliance Medium Term fund - Daily Dividend Reinvest 10 245,550 4,198 2,489,694 42,563 (4,482,615 Units purchased and 6,726,758 Units sold during the year)– Tata Floater Fund - Daily Dividend (14,123,712 Units purchased and 10 3,607,358 36,202 1,540,237 15,457 12,056,591 Units sold during the year)– IDFC Money Manager Fund Term Plan - Super Institutional Plan C - Daily 10 – – 5,127,010 51,278 Dividend (45,960 Units purchased and 5,172,970 units sold during the year)– ICICI Prudential Ultra Short Term Plan Premium Plus - Daily Dividend 10 – – 6,249,928 62,630 Reinvest (35,835 Units purchased and 6,285,763 units sold during the year)– UTI Treasury Advantage Fund - Institutional Plan - Daily Dividend Reinvest 1,000 20,271 20,276 35,259 35,266 (51,260 Units purchased and 66,248 Units sold during the year)– HDFC Cash Management Fund - Savings Plan - Daily Div Reinvest 10 4,741,225 50,430 – – ( 6,621,729 units purchased and 1,880,504 units sold during the year)– Birla Cash Manager Institutional Premium- Daily Dividend Reinvestment 10 1,001,271 10,016 – – (1,001,271 units purchased during the year)– BSL Quarterly Interval - Series 4 - Dividend payout 10 2,000,000 20,000 – – (2,000,000 Units purchased during the year)

61st Annual Report & Accounts 2010
47
SCHEDULES ANNEXED TO AND FORMING PART OF THE ACCOUNTSAs at 31st December 2010
– ICICI Prudential Interval Fund II Quarterly Interval Plan F Institutional 10 2,054,875 20,549 – – Dividend ( 2,054,875 units purchased during the year)– Tata Fixed Income Portfolio Fund Scheme A3 Institutional Monthly Dividend 10 4,071,213 40,712 – – (4,071,213 units purchased during the year)– UTI Fixed Interval Fund-Series II - Quarterly 10 2,055,307 20,553 – – Intitutional Plan VI - Institutional - Dividend (2,055,307 units purchased during the year)– Reliance Quarterly Interval Fund - 10 2,039,261 20,401 – – Series II - IP - Dividend Plan (3,038,831 units purchased and 999,570 units sold during the year)– Reliance Quarterly Interval Fund - Series III - IP - Dividend Plan 10 2,027,626 20,289 – – ( 2,027,626 units purchased during the year)– Birla Sunlife Short Term FMP Series 3 Dividend payout 10 2,024,935 20,249 – – (2,024,935 units purchased during the year)– UTI Short Term Income Fund Institutional Income Option - 10 997,240 10,161 – – Dividend Reinvest ( 997,240 units purchased during the year)
394,431 310,309
TOTAL 394,481 310,359
Aggregate Value of Unquoted Investments 50 50
Aggregate Value of Mutual Fund Units 394,431 310,309
394,481 310,359
Net Asset Value (NAV) of Mutual fund Units 395,304 310,309
(Rs. In Thousands)
2010 2009
Face Value Rs Nos Nos

61st Annual Report & Accounts 2010
48
UNITS OF MUTUAL FUNDS PURCHASED & SOLDDURING THE YEAR Face Value Total Nos. Total Purchase Total Nos. Total Purchase Rs. Of Units Cost (Rs.) Of Units Cost (Rs.)– Birla Cash Plus Institutional Premium - Daily Dividend Reinvestment 10 5,489,842 55,006 10,982,832 110,042– HDFC Cash Management Fund - Savings Plan - Daily Div Reinvest 10 – – 15,045,385 160,029– ICICI Pru Institutional Liquid Plan - Super Insti Daily Div Reinvest 100 1,299,881 130,017 9,013,833 90,148– IDFC Cash Fund - Inst Plan B - Daily Div Reinvest 10 – – 7,089,274 75,016– Reliance Liquid Fund - Teasury Plan - Inst - Daily Dividend 10 4,252,250 65,006 5,571,730 85,176– Tata Liquid Fund Super High Investment Plan - Daily Div Reinvest 1,000 125,637 140,025 112,235 125,088– UTI Liquid Cash Plan Inst - Daily Div Reinvest 1,000 49,052 50,005 49,050 50,005– HDFC FMP 90D Jun 2010 - Div Series XIII - Div Payout 10 2,000,000 20,000 – –– HDFC FMP 100D Aug 2010 (2) - Div Series XIV - Div Payout 10 2,000,000 20,000 – –– Reliance Fixed Horizon Fund - XV Series 1- Div payout 10 2,000,000 20,000 – –– BSL Floating Rate Fund - LT- Inst- Weekly Div Reinvest 10 2,023,842 20,264 – –
520,323 695,504
SCHEDULES ANNEXED TO AND FORMING PART OF THE ACCOUNTSAs at 31st December 2010
(Rs. In Thousands)
2010 2009

61st Annual Report & Accounts 2010
49
SCHEDULES ANNEXED TO AND FORMING PART OF THE ACCOUNTSAs at 31st December 2010
(Rs. In Thousands)
2010 2009
SCHEDULE 7 - CURRENT ASSETS,LOANS AND ADVANCESINVENTORIES Raw Materials 352,510 360,666 Goods in Transit - Raw Materials 124,440 70,571 Stores and Spares 45,046 39,034 Loose Tools 94,465 77,530 Work in Process 215,673 147,051 Finished Goods 59,934 64,442
TOTAL 892,068 759,294
SUNDRY DEBTORS (Unsecured) Debts Outstanding for more than Six Months Considered Good – 2,268 Considered Doubtful 14,299 15,881
14,299 18,149 Other Debts Considered Good 1,188,299 969,713 Considered Doubtful – 245
1,188,299 969,958
1,202,598 988,107Less:Provision for Doubtful Debts 14,299 16,126
TOTAL 1,188,299 971,981(Refer Schedule 17 Note 19 for debts due from Companies under the same management)
CASH AND BANK BALANCES Cash on Hand 2,199 1,573 Cheques on Hand 17,317 150 Balances with Scheduled Banks: Current Accounts 76,968 31,567 Fixed Deposit Accounts 7,550 3,950 Unpaid Dividend Accounts 4,413 3,534
TOTAL 108,447 40,774
OTHER CURRENT ASSETS (Unsecured, Considered Good)Claims Recoverable 96,146 77,768Interest Accrued on Investments and Deposits 41 35Others 26,979 32,087
TOTAL 123,166 109,890
LOANS AND ADVANCES (Unsecured, Considered Good)Advances Recoverable in Cash or in Kind or for Value to be Received 3,548 4,899Loans/ Advances to Staff 5,004 6,214Advances to Suppliers 8,484 17,917Prepaid Expenses 15,987 14,122Balances with Customs, Port Trust, etc 133,784 140,142Deposits 30,748 28,757
TOTAL 197,555 212,051(Refer Schedule 17 Note 20 for amounts due from Companies under the same management)
GRAND TOTAL 2,509,535 2,093,990
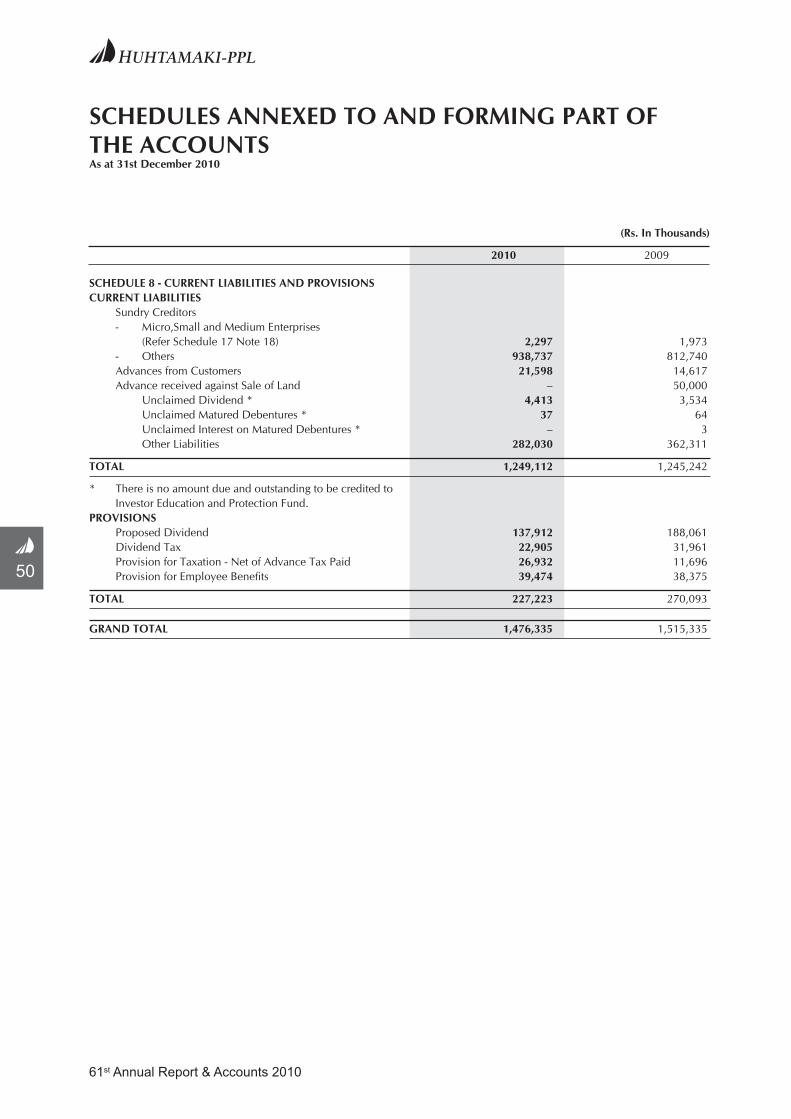
61st Annual Report & Accounts 2010
50
SCHEDULES ANNEXED TO AND FORMING PART OF THE ACCOUNTSAs at 31st December 2010
SCHEDULE 8 - CURRENT LIABILITIES AND PROVISIONSCURRENT LIABILITIES Sundry Creditors - Micro,Small and Medium Enterprises (Refer Schedule 17 Note 18) 2,297 1,973 - Others 938,737 812,740 Advances from Customers 21,598 14,617 Advance received against Sale of Land – 50,000 Unclaimed Dividend * 4,413 3,534 Unclaimed Matured Debentures * 37 64 Unclaimed Interest on Matured Debentures * – 3 Other Liabilities 282,030 362,311
TOTAL 1,249,112 1,245,242
* There is no amount due and outstanding to be credited to Investor Education and Protection Fund.PROVISIONS Proposed Dividend 137,912 188,061 Dividend Tax 22,905 31,961 Provision for Taxation - Net of Advance Tax Paid 26,932 11,696 Provision for Employee Benefits 39,474 38,375
TOTAL 227,223 270,093
GRAND TOTAL 1,476,335 1,515,335
(Rs. In Thousands)
2010 2009

61st Annual Report & Accounts 2010
51
SCHEDULES ANNEXED TO AND FORMING PART OF THE ACCOUNTSFor the year ended 31st December 2010
(Rs. In Thousands)
2010 2009
SCHEDULE 9 - SALESGross Sales 7,703,343 6,262,307Less:Rebates and Discounts 90,034 82,661
7,613,309 6,179,646Less: Excise Duty & Sales Tax 573,209 402,723
Net Sales 7,040,100 5,776,923
SCHEDULE 10 - OTHER INCOMERent 314 408Profit on Sale of Fixed Assets (Net) 1,127 10,589Dividend Income - from Mutual Funds (Non Trade) 16,245 12,929Doubtful Debts Provision Written Back (Net of debts written off) – 566Sales & Purchase Tax 3,148 –Interest Received on Deposits (Includes tax deducted at source- Rs.155/- Thousand , Previous Year Rs.145/- Thousand ) 1,359 1,290Interest Income on Income Tax Refunds – 10,796Miscellaneous Income 61,025 54,536
TOTAL 83,218 91,114
SCHEDULE 11 - MATERIAL COSTSRaw Materials and Packing Materials Consumed 4,972,276 3,804,242Stores, Spares and Other Materials Consumed 57,434 48,832(Increase)/Decrease in StocksClosing StockFinished Goods 59,934 64,442Work in Process 215,673 147,051
275,607 211,493
Less:Opening StockFinished Goods 64,442 75,336Work in Process 147,051 112,210
211,493 187,546
(64,114) (23,947)Excise Duty on Increase/(Decrease) in Finished Goods StockExcise Duty on Closing Finished Goods Stock 4,291 4,358Less: Excise Duty on Opening Finished Goods Stock 4,358 8,064
(67) (3,706)
TOTAL 4,965,529 3,825,421
SCHEDULE 12 - MANUFACTURING AND OPERATING EXPENSESPower and Fuel 216,241 199,947Repairs - Plant and Machinery 81,607 85,266 - Building 8,270 12,140 - Others 15,784 17,532Other Manufacturing Expenses 125,939 101,876
TOTAL 447,841 416,761

61st Annual Report & Accounts 2010
52
SCHEDULES ANNEXED TO AND FORMING PART OF THE ACCOUNTSFor the year ended 31st December 2010
(Rs. In Thousands)
2010 2009
SCHEDULE 13 - PERSONNEL EXPENSESSalaries, Wages and Bonus 500,092 429,928Contribution to Provident and Other Funds (Refer Schedule 17 Note 23) 34,563 14,584Staff Welfare Expenses 56,352 48,822(For Director’s Remuneration Refer Schedule 17 Note 2)
TOTAL 591,007 493,334
SCHEDULE 14 - ADMINISTRATION AND SALES EXPENSESRent 3,437 3,838Rates and Taxes 9,715 7,762Travelling and Conveyance 36,761 30,894Directors Travelling Expenses 2,581 2,134Legal and Professional Charges 42,288 31,206Communication Costs 13,740 16,127Payment to Auditor - as Auditor- Statutory Audit 2,931 3,367- Reimbursement of Expenses 123 150- Certification work 100 50
3,154 3,567Directors Fees 420 360Insurance 13,349 9,910Donation 227 2,438Printing and Stationery 6,766 8,766Commission on Sales - Others 10,900 14,527Freight and Forwarding Expenses 140,128 110,909Sale/ Purchase Tax – 17,383Doubtful Debts Provided / Written Off 1,954 –Loss on Sale of Investments 13 –Fixed Assets Provided / Written Off 15,192 14,561Other Write Offs / Provisions 379 668Miscellaneous Expenses 53,341 54,236
TOTAL 354,345 329,286
SCHEDULE 15 - FINANCIAL EXPENSESBank Charges/Commission 5,819 8,207Interest- To Banks 40 2,875- To Others 111 294
151 3,169
TOTAL 5,970 11,376

61st Annual Report & Accounts 2010
53
SCHEDULE 16 – SIGNIFICANT ACCOUNTING POLICIES
I. BASIS OF PREPARATION OF FINANCIAL STATEMENTS
The financial statements have been prepared under the historical cost convention (with the exception of freehold land which has been revalued),on the accrual basis of accounting and comply with the Companies (Accounting Standards) Rules 2006 issued by the Central Government and relevant provisions of the Companies Act, 1956 to the extent applicable.The accounting policies have been consistently followed by the company.
Use of Estimates
The financial statements are prepared in accordance with generally accepted accounting principles (GAAP) in India which requires management to make estimates and assumptions that affect the reported amounts of assets, liabilities and disclosure of contingent liabilities.The estimates and assumptions used in the accompanying financial statements are based upon management’s evaluation of the relevant facts and circumstances as of the date of the financial statements which in management’s opinion are prudent and reasonable. Actual results may differ from the estimates and assumptions used in preparing the accompanying financial statements. Any revision to accounting estimates is recognized prospectively in current and future periods.
II. FIXED ASSETS
1 Fixed assets are stated at cost ( or revalued amounts as the case may be) less accumulated depreciation & impairement losses, if any.
Cost of fixed assets comprises of purchase price, duties, levies and any directly attributable cost of bringing each asset to its working condition for the intended use.
2 Financing costs relating to borrowed funds attributable to the acquisition of qualifying fixed assets upto the completion of construction or acquisition of such fixed assets are included in the gross book value of the asset.
3 Cenvat credit availed for excise duty and countervailing duty availed for customs duty payments made on fixed assets is reduced from the cost of fixed assets.
4 Machinery spares which are specific to a particular item of fixed asset and whose use is expected to be irregular are capitalised and depreciated over the residual useful life of the asset.
5 Capital work-in-progress includes the cost of fixed assets that are not ready to use at the balance sheet date and advances paid to acquire fixed assets before the balance sheet date.
III. DEPRECIATION
Tangible Assets
Buildings are depreciated on written down value method at the rates prescribed in Schedule XIV to the Companies Act, 1956 except those specified below.
Other fixed assets are depreciated on straight line method at the rates prescribed in Schedule XIV to the Companies Act, 1956 except those specified below.
Following assets are depreciated at the rates higher than those prescribed in Schedule XIV to the Companies Act, 1956 as in management’s judgement, their estimated useful lives are shorter than those prescribed under Schedule XIV to the Companies Act, 1956.
Asset Method of Depreciation RateComputers Straight Line Method 25.00%
Motor Vehicles Straight Line Method 19.00%
General Furniture Straight Line Method 9.50%
Office and Other Equipments Straight Line Method 19.00%
Cellphones and Photocopiers Straight Line Method 31.67%
Airconditioning Equipment
used in manufacturing process Straight Line Method 10.34%
Administrative Buildings Written Down Value Method 10.00%
Electrical Fittings Straight Line Method 10.34%
SCHEDULES ANNEXED TO AND FORMING PART OF THE ACCOUNTSAs at 31st December 2010

61st Annual Report & Accounts 2010
54
SCHEDULES ANNEXED TO AND FORMING PART OF THE ACCOUNTSAs at 31st December 2010
Depreciation on exchange fluctuations capitalised till 31 December 2006 to fixed assets is provided over the residual useful life of the fixed assets. Depreciation on additions/ deletions to fixed assets is provided prorata from the date of addition / till the date of deletion.
Leasehold Land - Premium paid for acquisition of leasehold land is amortised over the period of lease.
Intangible Assets
ERP Software is amortised over a period of 60 months commencing from the month in which software is put to use.
Specialised Software is amortised over a period of 36 months commencing from the month in which such expenditure is incurred. All upgradations / enhancements are generally charged to profit and loss account, unless they bring significant additional benefits.
Club fees paid are amortised over a period of 10 years.
IV. FOREIGN CURRENCY TRANSACTIONS
1 Transactions denominated in foreign currency are recorded at the exchange rate prevailing on the date of transactions.Exchange differences arising on foreign exchange transactions settled during the year are recognized in the profit and loss account of the year.
2 Monetary assets and liabilities in foreign currency, which are outstanding as at the year-end are translated at the year end at the closing exchange rate and the resultant exchange differences are recognised in the profit and loss account.
3 Non-monetary foreign currency items are carried at cost.
4 The premium or discount on forward exchange contracts covered by AS-11 The Effects of Changes in Foreign Exchange Rates is recognised over the period of the contracts in the profit and loss account. Exchange gain or loss on forward exchange contracts covered by AS-11 The Effects of Changes in Foreign Exchange Rates is recognised in the profit and loss account.
5 In compliance with the Institute of Chartered Accountants of India (ICAI) announcement dated 29th March,2008 on accounting for Derivatives, the mark to market valuation loss on forward contracts entered into, to cover the forecast transactions is charged to profit and loss account.
V. INVENTORIES
1 Inventories are valued at lower of cost and net realisable value.
2 The cost of manufactured inventories is the direct cost of manufacture plus appropriate allocated overheads & excise duty wherever applicable.
3 The cost of bought out inventory is computed using the Weighted Average method .
4 The cost of loose tools is amortised over its estimated useful life.
VI. REVENUE RECOGNITION
1 Revenue is recognised to the extent it is probable that the economic benefits will flow to the Company and revenue can be reliably measured. It is recognised when significant risks and rewards of ownership of goods have passed to the buyer.
2 Gross sales are inclusive of Excise Duty and Sales Tax .
3 Sales returns are accounted for in the year of return.
4 Dividend income is recognised when the right to receive dividend is unconditional at the balance sheet date.
5 Interest on investments is accounted on a time proportion basis taking into account the amounts invested and the rate of interest.
VII. RETIREMENT BENEFITS
1 Defined Contribution Plans
Contributions payable to the recognised provident fund, which is a defined contribution Plan, are charged to the profit and loss account as incurred.

61st Annual Report & Accounts 2010
55
2 Defined Benefit Plans
The Company’s gratuity benefit scheme is a defined benefit plan. The Company’s net obligation in respect of the gratuity benefit scheme is calculated by estimating the amount of future benefit that employees have earned in return for their service in the current and prior periods; that benefit is discounted to determine its present value, and the fair value of any plan assets is deducted.
The present value of the obligation under such defined benefit plans is determined based on actuarial valuation using the Projected Unit Credit Method, which recognises each period of service as giving rise to additional unit of employee benefit entitlement and measures each unit separately to build up the final obligation.
The obligation is measured at the present value of the estimated future cash flows. The discount rates used for determining the present value of the obligation under defined benefit plans are based on the market yields on Government securities as at the balance sheet date.
When the calculation results in a benefit to the Company, the recognized asset is limited to the lower of the net total of the present value of the defined benefit obligation at the balance sheet date minus any past service cost minus fair value of plan assets as at balance sheet date and the present value of any future refunds from the plan or reductions in future contributions to the plan.
Actuarial gains and losses are recognised immediately in the Profit and Loss Account.
Family Pension and Long Term Service Award plan are defined benefit plans and are valued based on actuarial valuation.
3 Other Long term employment benefits
Compensated absences which are not expected to occur within twelve months after the end of the period in which the employee renders the related services are determined on the basis of valuations, as at balance sheet date, carried out by an independent actuary using Projected Unit Credit Method. Actuarial gains and losses comprise experience adjustments and the effects of changes in actuarial assumptions and are recognised immediately in the Profit and Loss Account.
4 Other short term employment benefits
Company provides short term benefit of sick leave to its employees with certain accumulation provisions and same being short term and expected to be utilised within twelve months are provided on undiscounted basis.
VIII. INVESTMENTS
Long term investments are valued at cost and an appropriate provision is made for diminution, which is other than temporary, in their value.
Current investments are valued at cost or market value, whichever is lower.
IX. RESEARCH AND DEVELOPMENT EXPENDITURE
Research and development expenditure of a revenue nature is charged off in the year in which it is incurred and expenditure of a capital nature is capitalised to fixed assets.
X. TAXATION
Income tax expense comprises current income tax (i.e. amount of tax for the period determined in accordance with the income tax law), fringe benefit tax and deferred tax charge or credit (reflecting the tax effects of timing differences between accounting income and taxable income for the period). The deferred tax charge or credit and the corresponding deferred tax liabilities or assets are recognized using the tax rates and tax laws that have been enacted or substantively enacted by the balance sheet date. Deferred tax assets are recognized only to the extent there is reasonable certainty that the assets can be realized in future; however, where there is unabsorbed depreciation or carried forward loss under taxation laws, deferred tax assets are recognized only if there is a virtual certainty of realization of such assets. Deferred tax assets are reviewed at each balance sheet date and written down or written up to reflect the amount that is reasonably/ virtually certain (as the case may be) to be realized.
Provision for fringe benefit tax (FBT) is made on the basis of applicable FBT on the taxable value of eligible expenses of the company as prescribed under the Income Tax Act, 1961.
SCHEDULES ANNEXED TO AND FORMING PART OF THE ACCOUNTSAs at 31st December 2010

61st Annual Report & Accounts 2010
56
XI. LEASES
Operating Leases
Lease payments under operating leases are recognised as an expense in the statement of profit and loss account on
a straight line basis over the lease term.
XII. IMPAIRMENT OF ASSETS
The Company assesses at each balance sheet date whether there is any indication that an asset or a group of assets (cash generating unit) may be impaired. If any such indication exists, the Company estimates the recoverable amount of the asset or the cash generating unit to which the asset belongs. If such recoverable amount of the asset or the recoverable amount of the cash generating unit to which the asset belongs is less than its carrying amount, the carrying amount is reduced to its recoverable amount. The reduction is treated as an impairment loss and is recognized in the profit and loss account. If at the balance sheet date there is an indication that a previously assessed impairment loss no longer exists, the recoverable amount is reassessed and the asset is reflected at the recoverable amount subject to reversal of loss being limited to maximum of historical impairment loss booked.
XIII. PROVISIONS AND CONTINGENT LIABILITIES
The Company creates a provision when there is present obligation as a result of a past event that probably requires an outflow of resources and a reliable estimate can be made of the amount of the obligation. A disclosure for a contingent liability is made when there is a possible obligation or a present obligation that may, but probably will not, require an outflow of resources. When there is a possible obligation or a present obligation in respect of which the likelihood of outflow of resources is remote, no provision or disclosure is made.
Provisions are reviewed at each balance sheet date and adjusted to reflect the current best estimate. If it is no longer probable that an outflow of resources would be required to settle the obligation, the provision is reversed. Contingent assets are not recognized in the financial statements. However, contingent assets are assessed continually and if it is virtually certain that an inflow of economic benefits will arise, the asset and related income are recognized in the period in which the change occurs.
XIV. EARNINGS PER SHARE (EPS)
Basic EPS is computed by dividing the net profit for the period attributable to the equity shareholders by the weighted average number of equity shares outstanding during the period. Diluted EPS is computed using the weighted average number of equity and dilutive equity equivalent shares outstanding during the period, except where the results would be anti dilutive.
SCHEDULES ANNEXED TO AND FORMING PART OF THE ACCOUNTSAs at 31st December 2010

61st Annual Report & Accounts 2010
57
SCHEDULES ANNEXED TO AND FORMING PART OF THE ACCOUNTSAs at 31st December 2010
SCHEDULE 17– NOTES TO THE ACCOUNTS (Rs.in Thousands)
1 SECURED LOANS Working Capital Facility taken from Banks are secured by hypothecation of inventories & book–debts.
2 a) DIRECTORS’ REMUNERATION For The Year For The Year Ended Ended 31 December 2010 31 December 2009
Salary, Allowances and Perquisites 34,019 24,372 Contribution to Provident Fund 1,498 1,200 Commission to Non Executive Directors 3,085 2,520
38,602 28,092 Note: i) The above does not include gratuity and leave encashment benefits as the provisions for these are determined for
the Company as a whole and therefore separate amounts for the directors are not available. ii) Chairman and Managing Director, Chief Executive Officer & Executive Director and Executive Director & Chief
Operating Officer of the Company are entitled to options under “Option Rights Plan” and shares under the “Share Ownership Plan” of Huhtamaki Oyj (the ultimate Holding company) which entitles the holder of the option rights to subscribe to the shares of the ultimate holding company at a future date,at a price fixed based on the fair market price of the shares during specified period plus certain percentage of market value on the exercise date and the recepient of grants under share ownership plan is entitled to receive shares at nil cost respectively.The schemes detailed above are assessed,managed and administered by the ultimate holding company and there is no cost charged to the Company. The charge taken by Huhtamaki Oyj in its accounts for the year ended 31st December 2010 for these options and shares is Rs.7,193/- Thousand (Previous year Rs.11,214/- Thousand)
iii) The above remuneration does not include the remuneration of the Chairman and Managing Director of the Company of Rs.11,812/- Thousand (Previous year Rs.4,196/- Thousand ) which is received from Huhtamaki Oyj, the ultimate parent company,for his role as Executive Vice President (‘EVP’) - Flexibles Packaging Global, Huhtamaki Oyj.
b) Computation of net profit in accordance with Sections 198, 349 and 350 of the Companies Act, 1956 and commission payable to Directors:
For The Year For The Year Ended Ended 31 December 2010 31 December 2009 Profit before Taxation and Extraordinary Items 585,507 495,749 Add : Remuneration to Directors 38,602 28,092 Wealth Tax 365 673
38,967 28,765 624,474 524,514 Less: Capital Profit on sale of fixed assets 135,810 597
135,810 597 Net Profit to be considered for managerial remuneration 488,664 523,917 Maximum Managerial Remuneration payable as per above profit: To Working Directors @ 10% P.A. 48,866 52,392 To Non-Executive Directors @ 1 % P.A. 4,887 5,239
53,753 57,631 Commission provided for Non-Executive Directors 3,085 2,520
3,085 2,520
The Company depreciates its fixed assets as enumerated in Schedule 16 Policy III wherein estimated useful lives for certain assets are lower than implicit estimated useful lives prescribed by Schedule XIV of the Companies Act,1956. Thus, the depreciation charge in the books is higher than the minimum prescribed by the Companies Act,1956.This higher depreciation charge has been considered as deduction for the Computation of Managerial Remuneration above.

61st Annual Report & Accounts 2010
58
3 a) Provision for taxes is based on the results for the year ended 31 December 2010 in accordance with the provisions of the Income Tax Act,1961. The final tax liability will be determined on the basis of the results of the operations for the year 1 April 2010 to 31 March 2011, being the tax year of the Company.
As at 31 As at 31 December 2010 December 2009 b) Break up of Deferred Tax Liability (Net) Deferred Tax Asset arising on account of timing differences in:
- Provision for doubtful debts 4,750 5,481
- Provision for retirement benefits 12,812 12,416
- Effect of expenditure debited to Profit & Loss account but allowed for Tax purposes in following years 13,127 10,433
30,689 28,330
Deferred Tax Liability arising on account of timing differences in: - Depreciation 83,328 96,089
Deferred Tax Liability (Net) 52,639 67,759
4 SEGMENT REPORTING
The Company’s sole business segment is consumer packaging and all activities of the Company are incidental to this sole business segment. Given this fact and that the Company services its domestic and export markets from India only, the financial statements reflect the information required by AS-17 Segment Reporting for the sole business segment of consumer packaging.
Total Capital employed in the business and as such in the segment. 3,214,560 2,922,573
Secondary segments for the Company are geographic, namely domestic and exports.
The entire business assets of the Company are situated in India.
Revenue from geographic segments is based on the domicile of customers.
For The Year For The Year Ended Ended 31 December 2010 31 December 2009 Net Sales to External Domestic Customers 5,844,225 4,442,710 Net Sales to External Export Customers 1,195,875 1,334,213
Total Net Sales to External Customers 7,040,100 5,776,923 Debtors outstanding in respect of export segment as at the year end 198,273 217,704
5 RELATED PARTY TRANSACTIONS
a) Related party where control exists : Ultimate Parent Company Huhtamaki Oyj., Finland Holding Company Huhtavefa B.V., Netherlands
b) Other Related Parties with whom transactions have taken place during the year :
Fellow Subsidiaries Huhtamaki New Zealand Ltd., New Zealand. Huhtamaki Vietnam Ltd, Vietnam Huhtamaki Australia Ltd., Australia Huhtamaki Deutschland Gmbh and Co.KG., Germany Huhtamki South Africa Ltd., South Africa Huhtamaki (Thailand) Ltd., Thailand
SCHEDULES ANNEXED TO AND FORMING PART OF THE ACCOUNTSAs at 31st December 2010

61st Annual Report & Accounts 2010
59
SCHEDULES ANNEXED TO AND FORMING PART OF THE ACCOUNTSAs at 31st December 2010
c) Key Managerial Personnel Mr. Suresh Gupta Chairman and Managing Director
Mr. M. K. Srinivasan Chief Executrive Officer and Executive Director
(w.e.f. 25th March 2010) Mr. C. N. Murthy
Executive Director and Chief Operating Officer (Till 8th December 2010)
d) Relatives of Key Managerial Personnel Mr. Suresh Gupta Mrs. Kumkum Gupta–Wife, Ms. Ratna Gupta–Daughter,
Ms. Shivani Gupta–Daughter, Mr. C.N. Murthy Mrs. Jayanthi Murthy–Wife
e) Details of transactions with related parties that have taken place during the year :
31 December 2010 31 December 2009
1) Ultimate Parent Company a) Software and Expense Reimbursements Charge 1,951 3,324 b) Remuneration paid by Huhtamaki Oyj to Mr. Suresh Gupta as EVP - Flexibles Packaging Global, Huhtamaki Oyj. 16,009 – (Including Rs.4,196/- Thousand pertaining to 2009 received in 2010) 2) Holding Company Dividend Paid - Huhtavefa B.V., Netherlands 110,802 66,481 3) Fellow Subsidiaries Purchase of Goods - Huhtamaki Deutschland Gmbh and Co.KG., Germany 326 – - Huhtamaki New Zealand Ltd., New Zealand. 70 – - Huhtamaki (Thailand) Limited., Thailand – 1,191 Sale of Goods - Huhtamaki New Zealand Ltd., New Zealand. 2,833 10,825 - Huhtamaki South Africa Ltd., South Africa 1,949 1,202 - Huhtamaki Australia Ltd., Australia 25,868 22,949 Commission Expenses on Sales - Huhtamaki South Africa Ltd., South Africa 1,529 1,305 Expense Reimbursements - Charge - Huhtamaki (Thailannd) Ltd., Thailand. – 191 - Huhtamaki (Vietnam) Ltd., Vietnam. – 912 - Huhtamaki Deutschland Gmbh and Co. KG., Germany – 30 Expense Reimbursements - Recovery - Huhtamaki New Zealand Ltd., New Zealand. 325 306 - Huhtamaki Deutschland Gmbh and Co.KG., Germany – 98 - Huhtamaki (Vietnam) Ltd., Vietnam – 30 Balances due to - Huhtamaki Oyj., Finland 463 3,746 - Huhtamaki Deutschland Gmbh and Co.KG., Germany 51 – - Huhtamaki (Vietnam) Ltd., Vietnam. – 880 Balances due from - Huhtamaki New Zealand Ltd., New Zealand. 569 591 - Huhtamaki Australia Ltd., Australia 12,333 5,850

61st Annual Report & Accounts 2010
60
(Rs.in Thousands)
For The Year Ended For The Year Ended 31 December 2010 31 December 2009
SCHEDULES ANNEXED TO AND FORMING PART OF THE ACCOUNTSAs at 31st December 2010
4) Payments to Key Managerial Personnel and their Relatives Remuneration Paid to Key Managerial Personnel Mr. Suresh Gupta, Chairman and Managing Director 20,752 18,877 Mr. M.K.Srinivasan, Chief Executive Officer and Executive Director 5,950 – Mr. C.N.Murthy, Executive Director and Chief Operating Officer 8,815 6,695 35,517 25,572 Dividend Paid to Key Managerial Personnel and Their Relatives Mr. Suresh Gupta 3,543 2,126 Mrs.Kumkum Gupta 753 452 Ms Ratna Gupta 604 362 Ms Shivani Gupta 601 361 Mrs.Jayanthi Murthy 12 7 Mr. M.K.Srinivasan 2 – 5,515 3,308
6 LEASES
For The Year Ended For The Year Ended 31 December 2010 31 December 2009
Assets obtained on lease Company has taken office facilities and residential facilities under cancellable and non cancellable operating lease agreements. Company renews such leases in the normal course of business. Total rental expenses under cancellable operating leases 3,916 5,814 Above includes rent for guest houses classified under miscellaneous expenses 1,146 817 Above includes rent for guest houses capitalised to capital work in progress – 2,104 Total rental expenses under non-cancellable operating leases 675 945 Minimum payments due not later than 1 year – 675
7 CONTINGENT LIABILITIES
For The Year Ended For The Year Ended 31 December 2010 31 December 2009
i) Excise Duty a Matters in Appeal - Duty 498,157 497,382 - Penalties 7,924 7,148 b Show cause notices - Duty 259,674 225,242 - Penalties – 1,179 ii) Service Tax a Show cause notices - Service Tax 9,788 4,065 - Penalties – 88 b Matters in Appeal - Service Tax 3,060 4,143 - Penalties 685 136 iii) Sales Tax demands in appeal 34,742 22,998

61st Annual Report & Accounts 2010
61
SCHEDULES ANNEXED TO AND FORMING PART OF THE ACCOUNTSAs at 31st December 2010
(Rs.in Thousands)
For The Year Ended For The Year Ended 31 December 2010 31 December 2009
iv) Claims against the company not acknowledged as debts 12,144 12,144 Note for (i) to (iv): Future cash outflows / uncertainties, if any, in respect of the above are determinable only on receipt of judgements / decisions pending with various forums / authorities. v) Bank guarantees issued by bankers on behalf of the Company 17,567 17,685 vi) Contracts remaining to be executed on capital account and not provided for (net of advances) 177,764 75,732 vii) Letters of Credit issued by banks on behalf of the company for import of goods 67,831 36,559
8 RESEARCH AND DEVELOPMENT EXPENSES The details of Research and development expenses incurred and included under various heads in Profit and Loss Account as certified by the management are as follows:
For The Year Ended For The Year Ended 31 December 2010 31 December 2009
Operating Expenses Repairs and Stores Consumed 332 515 Personnel Expenses Salaries,Wages and Bonus 4,024 3,934 Contribution to PF and Other funds 219 201 Staff welfare Expenses 418 363 Other Expenditure Product Development Expenses 706 1,758 Conveyance,Electricity,Printing and Stationery, Travelling,Car and Vehicle Expenses,Society Charges etc. 261 221 Miscellaneous Expenses 66 57 Depreciation 1,780 1,786
Total 7,806 8,835
This information is given pursuant to the recognition granted to the Company’s Research and Development Center by the Department of Scientific and Industrial Research,Ministry of Science and Technology,Government of India, vide their letter No.TUD/4D/RD/963/84-84 dt.06.01.1984 and as renewed from time to time.
9 PARTICULARS IN RESPECT OF GOODS MANUFACTURED
31 December 2010 31 December 2009 Description Tonnes Tonnes
1 Installed Capacity* * Licencing has been abolished vide press note 9 dated 2nd August 1991 and notification no.S.C.477 ( E) dated 25th July 1991,issued by the Government of India. 2 Installed Capacity ** a. Laminates and Converted, Coated / Uncoated Paper and Films 35,590.000 37,590.000 b. Cartons 11,000.000 11,000.000 c. Metalised Films 1,000.000 1,000.000 d. Polyethylene Films 5,400.000 5,400.000
** Installed capacities are as certified by the management and have not been verified by the auditors, as this is a technical matter.

61st Annual Report & Accounts 2010
62
SCHEDULES ANNEXED TO AND FORMING PART OF THE ACCOUNTSAs at 31st December 2010
(Rs.in Thousands)
31 December 2010 31 December 2009 Description Tonnes Tonnes
3 Production a. Laminates and Converted,Coated / Uncoated Paper and Films @ 28,052.204 23,982.308 b. Cartons 4,947.906 4,632.438 c. Metalised Films $ 604.784 112.646 d. Jobwork - Metalised Films $ – 1.415 e. Polyethylene Films # 4,802.818 5,041.934
38,407.712 33,770.741
@ Includes captive consumption Nil MT (Previous year 7.229 MT) $ Utilised for captive consumption # Utilised for captive consumption. Production does not include jobwork production.
10 TURNOVER AND STOCKS OF GOODS MANUFACTURED For The Year ended For The Year ended 31 December 2010 31 December 2009
Tonnes Value Tonnes Value
a. Turnover (Net Sales) a. Laminates and Converted,Coated / Uncoated Paper and Films 28,119.776 6,728,131 24,031.929 5,519,371 b. Cartons 4,936.389 385,877 4,693.801 322,595 c. Others – 16,126 – 17,618 33,056.165 7,130,134 28,725.730 5,859,584 Less: Rebates and Discounts 90,034 82,661
33,056.165 7,040,100 28,725.730 5,776,923
As at As at 31 December 2010 31 December 2009 Tonnes Value Tonnes Value
b. Opening Stock a. Laminates and Converted,Coated / Uncoated Paper and Films 304.917 45,805 361.767 62,263 b. Cartons 6.915 507 68.278 3,131 c. Metalised Films 0.125 27 0.422 64 d. Polyethylene Films 195.364 18,103 85.810 9,878
507.321 64,442 516.277 75,336
As at As at 31 December 2010 31 December 2009 Tonnes Value Tonnes Value
c. Closing Stock a. Laminates and Converted,Coated / Uncoated Paper and Films 237.345 44,757 304.917 45,805 b. Cartons 18.432 1,169 6.915 507 c. Metalised Films – – 0.125 27 d. Polyethylene Films 142.856 14,008 195.364 18,103
398.633 59,934 507.321 64,442
Quantitative details for Turnover, Production, Opening Stock and Closing Stock have been converted in Tonnes based on technical estimates by management as products are sold in diverse units of measurement.

61st Annual Report & Accounts 2010
63
SCHEDULES ANNEXED TO AND FORMING PART OF THE ACCOUNTSAs at 31st December 2010
(Rs.in Thousands)11 RAW MATERIALS AND PACKING MATERIALS CONSUMED
For The Year ended For The Year ended 31 December 2010 31 December 2009 Tonnes Value Tonnes Value
a. Paper 3,886.067 193,316 3,575.213 176,042 b. Paper Board 4,908.118 143,887 4,134.959 104,054 c. Films 18,506.750 2,541,808 15,870.259 1,973,301 d. Inks,Adhesives and Solvents 9,440.774 1,041,490 8,183.871 853,494 e. Polyethylene Granules 9,450.995 787,887 7,512.230 583,735 f. Others * – 263,888 – 113,616
46,192.704 4,972,276 39,276.532 3,804,242
* It is not practicable to furnish quantitative information in view of the large number of items which defer in size and nature, each being less than 10% in value of the total.
12 CIF VALUE OF IMPORTS
For TheYear Ended For TheYear Ended 31 December 2010 31 December 2009
a. Raw Materials 984,591 982,165 b. Stores, Spares-Parts and Other Materials 21,187 18,471 c. Capital Goods 27,003 18,825
13 CONSUMPTION OF RAW MATERIALS, PACKING MATERIALS, STORES AND SPARES
For TheYear Ended For TheYear Ended 31 December 2010 31 December 2009 Percentage Value Percentage Value
a. Imported 22.05% 1,108,800 25.93% 999,210 b. Indigenous 77.95% 3,920,910 74.07% 2,853,864 100.00% 5,029,710 100.00% 3,853,074
14 EARNINGS IN FOREIGN CURRENCY ( On accrual basis)
For TheYear Ended For TheYear Ended 31 December 2010 31 December 2009
a. F.O.B. Value of Exports 1,088,748 1,235,785
b. Others 24,148 26,741
15 EXPENDITURE IN FOREIGN CURRENCY (On payment basis)
For TheYear Ended For TheYear Ended 31 December 2010 31 December 2009
a. Travelling Expenses 4,407 3,631 b. Export agency Commission 15,260 10,231 c. Technician Fees - (Commissioning charges of M/c) – 15,673 d. Interest Expenses on Buyers Credit / Loans – 6,097 e. Service charges paid for Technical services availed 5,765 2,722 f. Royalty 1,169 1,134 g. Others 5,334 777
16 The Company has availed of unsecured interest free Sales tax deferred loan from the Government of Andhra Pradesh for its Hyderabad (Bollaram) factory, in accordance with their sales tax deferral scheme. 225,309 225,309
The above amount is repayable after 14 years from the date of availment of the loan. The first due date for repayment is 1 April 2011.

61st Annual Report & Accounts 2010
64
SCHEDULES ANNEXED TO AND FORMING PART OF THE ACCOUNTSAs at 31st December 2010
(Rs.in Thousands)
17 a) The Company has remitted dividend in Foreign Currency (Euro) to its parent Company M/s. Huhtavefa B.V., Netherlands.
The particulars of dividend declared and paid to above shareholder are as under:
31 December 2010 31 December 2009
a. Dividend for the year 2009 2008 b. Number of Non-resident Shareholder 1 1 c. Equity Shares held by Non-resident Shareholder 36,934,100 36,934,100 d. Gross Amount of Dividend Remitted 110,802 66,481
b) Except at point no.17 a) the Company has not directly remitted any amount in foreign currency on account of dividend on equity shares held by Non Resident Indians, Overseas Corporate Bodies and Foreign Institutional Investors. The Company does not have any information if any remittance in foreign exchange has been made by the respective banks and/ or custodians,to whom the payment had been made by Company in rupees.
The particulars of dividend declared during the year and paid to the Non- resident shareholders are as under:-
31 December 2010 31 December 2009 a. Dividend for the year 2009 2008 b. Number of Non-resident Shareholders 210 142 c. Equity Shares held by Non-resident Shareholders 1,234,238 5,548,461 d. Gross Amount of Dividend 3,703 9,987
18 DISCLOSURE OF THE AMOUNTS DUE TO THE THE MICRO, SMALL AND MEDIUM ENTERPRISES (On the basis of the information & records available with the Management.)
31 December 2010 31 December 2009
i) The principal amount and the interest due thereon remaining unpaid to any Micro/ Small supplier - Principal amount 2,297 1,973 - Interest there on 378 284 ii) The interest paid by the buyer as above, along with the amount of payments made beyond the appointed date during each accounting year. – 609 iii) The amount of interest due and payable for the period of delay in making payment (which has been paid but beyond the appointed day during the year) but without adding the interest specified – – under the Micro, Small and Medium Enterprises Development Act 2006 iv) The amount of interest accrued and remaining unpaid at the end of each accounting year. 94 179 v) The amount of further interest remaining due and payable even in the succeeding years, until such date when the interest dues as above are actually paid to the small/ micro enterprise 378 284
19 SUNDRY DEBTORS INCLUDE AMOUNTS DUE FROM COMPANIES UNDER THE SAME MANAGEMENT Huhtamaki Australia Ltd., Australia 12,333 5,850 Huhtamaki New Zealand Ltd. New Zealand 569 591
20 LOANS & ADVANCES INCLUDE AMOUNTS DUE FROM COMPANIES UNDER THE SAME MANAGEMENT 31 December 2010 31 December 2009 Max. Due at Max. Due at any time during any time during Outstanding the year Outstanding the year Huhtamaki Vietnam Ltd, Vietnam – – – 30 Huhtamaki New Zealand Ltd., New Zealand – 325 – 306 Huhtamaki Deutschland Gmbh & Co.KG., Germany – – – 98

61st Annual Report & Accounts 2010
65
SCHEDULES ANNEXED TO AND FORMING PART OF THE ACCOUNTSAs at 31st December 2010
(Rs.in Thousands)21 During the year, revenue expenses incurred for the projects that have been capitalised are Rs Nil (Previous Year Rs. 24,533/-). Out of the same, amount lying in capital work in progress is Rs Nil (Previous year Rs Nil).
22 DISCLOSURE OF DERIVATIVE INSTRUMENTS As at As at 31 December 2010 31 December 2009 Currency Foreign Currency Foreign Currency Amt. in Thousands Amt. in Thousands
(i) Derivative Instruments Outstanding Forward Exchange contracts for the foreign exchange USD 2,100 2,100 exposures of receivables on account of export of EUR 150 125 goods & services.
Forward Exchange contracts for the foreign exchange exposures for payments to be made against imports and repayment of buyers credit. USD – 62
(ii) Foreign Exchange Exposures Foreign Exchange exposures not covered by USD 2,496 2,614 a derivative contract for payments to be EUR 58 123 received on account of Export of Goods GBP 13 7
Foreign Exchange exposures not covered by USD 3,238 3,423 a derivative contract for payments to be made EUR 18 31 against revenue imports & capital imports creditors. SFR 14 – JPY – 832 (iii) Derivatives taken to Cover Forecast Exposures Forward Exchange contracts taken for USD 5,100 8,700 the forecast exports receivables on account EUR 750 1,125 of export of goods & services.
Forward Exchange contracts taken for USD 70 – the forecast revenue imports. EUR 1,507 –
(iv) Foreign Exchange gains/ (losses) include realised and unrealised exchange (losses)/gains and mark to market valuation loss on account of forward exchange contracts entered into to cover the forecast transactions, Rs.in Thousands Rs.in Thousands pursuant to the ICAI announcement of 29th March 2008 on Accounting for Derivatives. (4,477) (71)
23 DISCLOSURE PURSUANT TO ACCOUNTING STANDARD - 15 (REVISED) ‘ EMPLOYEE BENEFITS’
(i) Effective 1 January,2007 the Company has adopted accounting standard 15 (revised 2005) “Employee Benefits” The Company has classified the various benefits provided to employees as under. (ii) Defined Contribution Plans Amount recognised as an expense and included in “Personnel costs” for Provident Fund & ESIC contributions in the Profit and Loss account. 25,942 22,655 (iii) Defined Benefit Plans The Company has classified the various benefit plans provided to employees as under : I Gratuity Plan Gratuity is payable to all eligible employees of the Company on superannuation, death and resignation, in terms of the provisions of the Payment of Gratuity Act or as per the Company’s Scheme whichever is more beneficial. II Leave Plan Eligible employees can carry forward and encash leave on superannuation, death, and resignation subject to
maximum limits as per Company policy. III Long Service Award Long Service Award benefit is payable to eligible employees on completion of 25 years of service. The following
table summarises the components of the net benefit expense recognised in the profit & loss account and the funded status and amount recognised in the Balance sheet for the respective plans
(Rs.in Thousands)

61st Annual Report & Accounts 2010
66
(iii) Defined Benefit Plans (Rs. In Thousands) Gratuity Leave Pension Long Service Encashment Plan Award 2010 2009 2010 2009 2010 2009 2010 2009I. Change in Benefit Obligation Opening defined benefit obligation 92,624 102,677 26,765 31,884 970 1,173 5,123 6,310 Cost of Benefit increase – – – – – Interest cost 7,426 6,367 2,180 1,990 69 71 418 409 Current Service Cost 8,908 8,316 5,637 4,077 – – – – Benefit Paid (7,375) (9,452) (1,321) (2,539) (150) (150) (240) (33) Actuarial (gain)/loss on obligations (1,228) (15,284) (4,468) (8,646) 16 (124) (210) (1,563) Closing defined benefit obligation 100,355 92,624 28,794 26,765 905 970 5,091 5,123II. Fair Value of Plan Assets Fair value of Plan Assets at the beginning of the year 105,763 79,919 – – – – – – Expected Return on Plan Assets 9,423 7,892 – – – – – – Contributions 5,242 24,992 1,321 2,539 150 150 240 33 Benefit Paid (7,375) (9,452) (1,321) (2,539) (150) (150) (240) (33) Actuarial gain/(loss) on Plan Assets (2,736) 2,412 – – – – – – Fair Value of Plan Assets at the end of the year 110,317 105,763 – – – – – –III. Actual Return on Plan Assets Actual Return on Plan Assets 6,686 10,304 – – – – – – Expected Return on Plan Assets 9,423 7,892 – – – – – – Actuarial gain/(loss) on Plan Assets (2,737) 2,412 – – Actuarial gain/(loss) on obligation 1,228 15,284 4,468 8,646 (16) 124 210 1,563IV. Amount Recognised in the Balance Sheet Defined benefit obligation 100,355 92,624 28,794 26,765 905 970 5,091 5,123 Fair Value of Plan Assets 110,317 105,763 – – – – – – Funded Status 9,962 13,139 (28,794) (26,765) (905) (970) (5,091) (5,123) Unrecognised Acturial Gain/(Loss) – – – – – – – – Net Asset/(Liability) Recognised in the Balance Sheet 9,962 13,139 (28,794) (26,765) (905) (970) (5,091) (5,123)V. Expenses Recognised in the Profit & Loss Account Current Service Cost 8,908 8,316 5,637 4,077 – – – – Interest Cost 7,426 6,367 2,180 1,990 69 71 418 409 Expected Return on Plan Assets (9,423) (7,892) – – – – – – Net Actuarial (Gain)/Loss To Be Recognised 1,509 (17,696) (4,468) (8,646) 16 (124) (210) (1,563)
Expense Recognised in P&L 8,420 (10,905) 3,349 (2,579) 85 (52) 207 (1,154)
The Company expects to contribute Rs.11,020/- thousand to gratuity in 2011.
The principal assumptions used in determining benefit obligations for the Company’s plans are shown below. 2010 2009 Discount Rate 8.40% 8.35% Rate of Return on Plan Assets 8.00% 9.00% Salary Escalation 7.25% 7.25% Employee Turnover 12% for the next 2 years, 5% for the next 1 year, 2.5% for the next 4 years and thereafter reducing 1%
Estimates of future salary increases, considered in actuarial valuation, take account of inflation, seniority, promotion and other relevant factors, such as supply and demand in the employment.
The major catagories of plan assets as a percentage of the fair value of total plan assets are as follows.
Particulars GratuityAs on 31st Dec.10 As on 31st Dec.09
Investments in Gratuity Fund Trust 110,317100.00%
105,763100.00%
SCHEDULES ANNEXED TO AND FORMING PART OF THE ACCOUNTSAs at 31st December 2010

61st Annual Report & Accounts 2010
67
SCHEDULES ANNEXED TO AND FORMING PART OF THE ACCOUNTSAs at 31st December 2010
GratuityParticulars 2010 2009 2008 2007Defined benefit obligation 100,355 92,624 102,677 81,894Plan assets 110,317 105,763 79,919 73,088Excess of defined benefit obligation over fair value of plan assets. (9,962) (13,139) 22,759 8,806
Leave EncashmentParticulars 2010 2009 2008 2007
Defined benefit obligation 28,794 26,765 31,884 29,500Plan assets – – – –Excess of defined benefit obligation over fair value of plan assets. 28,794 26,765 31,884 29,500
PensionParticulars 2010 2009 2008 2007Defined benefit obligation 905 970 1,173 1,033Plan assets – – – –Excess of defined benefit obligation over fair value of plan assets. 905 970 1,173 1,033
Long Service AwardParticulars 2010 2009 2008 2007Defined benefit obligation 5,091 5,123 6,310 4,538Plan assets – – – –Excess of defined benefit obligation over fair value of plan assets. 5,091 5,123 6,310 4,538
24 EXCEPTIONAL ITEMS COMPRISE OF :
a. Income of Rs.139,813/- Thousand being net gain realised on sale of Nagpur Factory Assets (Current Tax includes Rs. 28,600/- Thousand related to the said gain).
b. Expenses of Rs. 17,004/- Thousand incurred during the year on Voluntary Retirement Scheme (VRS) at Hyderabad Plant.
25 EXTRAORDINARY ITEMS COMPRISE OF :
a. The Company has reversed balance provision amounting to Rs.27,949/- Thousand (Net of Rs.Nil Tax) created in earlier year towards repairs of certain machineries damaged by flood in 2005, as the same is no longer required.
b. Against an insurance claim for fire at Thane plant during the year an advance payment of Rs. 10,000/- Thousand has been received pending final settlement.
A surplus of Rs. 2,578/- Thousand net of Income Tax of Rs. 2,912/- Thousand, cost of repairs & book value of damaged assets has been recognised in Year 2010.
26 Since the Company Secretary has resigned with effect from 30th November 2010 and the Company is still in the process of appointing a new Company Secretary as required under section 383A of the Companies Act 1956, the financial statements have not been signed by a Company Secretary as required by section 215 of the Companies Act, 1956.
27 The figures of the previous year were audited by a firm of Chartered Accountants other than S.V.Ghatalia & Associates.
28 Previous year’s figures are appropriately reclassified to conform with current year’s classification.
As per our report of even date attached.
For S.V. Ghatalia & Associates Firm Registration No. 103162W Chartered Accountants per Sudhir Soni Suresh Gupta M.K. SrinivasanPartner Chairman & Managing Director Chief Executive Officer & Executive Director Membership No. 41870 Mumbai Parag Vyavahare January 28, 2011 Chief Financial Officer
Amounts for the current & previous periods are as follows: (Rs. In Thousands)
}Jukka MoisioK.C. NarangP.V. NarayananRamesh K Dhir
Directors

61st Annual Report & Accounts 2010
68
BALANCE SHEET ABSTRACT AND COMPANY’S GENERAL BUSINESS PROFILEAs at 31 December 2010
Statement showing particulars as described in the amendment to Schedule VI to the Companies Act, 1956, vide Notification No. G.S.R.388(E) dated May 15, 1995 :
I REGISTRATION DETAILS
Registration No. 145537
State Code 11
Balance Sheet Date 31st December, 2010
(Rs.in Thousands)
II CAPITAL RAISED DURING THE YEAR ENDED 31ST DECEMBER 2010 Public Issue –
Rights Issue –
Bonus Issue –
Private Placement –
Others–Preferential Issue –III POSITION OF MOBILISATION & DEPLOYMENT OF FUNDS AS AT 31ST DECEMBER 2010
Total Liabilities 3,214,560
Total Assets 3,214,560
Sources of Funds Paid–up Capital 125,383 Reserves & Surplus 2,811,229 Unsecured Loans 225,309 Deferred Tax Liability (Net) 52,639
3,214,560
Application of Funds Net Fixed Assets (Incl.Capital Work–in–Progress) 1,786,879 Investments 394,481 Net Current Assets 1,033,200
3,214,560
IV PERFORMANCE OF THE COMPANY FOR THE YEAR ENDED 31ST DECEMBER 2010 i) Turnover (Net Sales & Other Income) 7,123,318 ii) Total Expenditure 6,660,620 iii) Profit before Tax 585,507 iv) Profit after Tax 481,240 v) Earning Per Share (Rs.) 7.68 vi) Dividend Rate % 110%
V GENERIC NAME OF THREE PRINCIPAL PRODUCTS / SERVICES OF THE COMPANY (as per monetary terms ) Item Code No. ITC Code Product Description 3921 90 96 Printed Polyester / Met Pet / Polyethylene Laminates
3921 90 99 Shrink Sleeves
3920 69 12 Printed Polyester / Paper

CUSTOMER SUPPORT OFFICES MANUFACTURING LOCATIONS
#91, West Park Road, 17th Cross, MalleswaramBangalore - 560055, Karnataka.Tel: +91 80 23568979 / 23342873 Fax: +91 80 23342872
LBS Marg, Majiwade, Thane (West) - 400601, Maharashtra. Tel: +91 22 2173 5551 / 2173 5591Fax: +91 22 2173 5599 / 2173 5650
THANEBANGALORE
Premise No. 16, 8th Main Road, Vijaynagar, VelachariChennai - 600042, Tamil NaduTelefax: +91 44 22592461
Survey No. 33/1, At Post Umerkoi, Via SilvassaU.T. of Dadra & Nagar Haveli - 396230.Tel: +91 9725025351 Fax: +91 260 2681003
CHENNAI SILVASSA
139 & 148, Sri Venkateshwara Co-op. Indl. EstateBollarum - 502325, Andhra Pradesh.Tel: +91 8458 279628 / 279616 Fax: +91 8458 279464
139 & 148, Sri Venkateshwara Co-op. Indl. EstateBollarum - 502325, Andhra Pradesh.Tel: +91 8458 279628 / 279616 Fax: +91 8458 279464
HYDERABAD HYDERABAD
5th Floor, Laha Paint House, 7 Chittaranjan AvenueKolkata - 700072, West Bengal.Tel: +91 33 22372812 / 22348241 Fax; +91 33 22255654
Plot No. 70-33, Sector 4, IIE Pantanagar, RudrapurUdhamsingh Nagar - 263153, Uttarakhand.Tel: +91 5944 250183 /84 / 85 Fax: +91 5944 250186
KOLKATA RUDRAPUR
508/510, Ansal Chamber II, 6 Bhikaji Cama PalaceNew Delhi - 110066.Tel: +91 11 26194795 / 26195641 Fax: +91 11 26194389
LBS Marg, Majiwade, Thane (West) - 400601, Maharashtra. Tel: +91 22 21735551 / 21735591Fax: +91 22 21735599 / 21735650
NEW DELHI R&D - THANE

mJeOece&ceefHe ®eeJes#³e ve efJekeÀefcHelegcen&efme~Looking at your own duty you ought not to waver.